ambev technical analysis charts
TRANSCRIPT

April 25, 2016
ABEV: Ambev technical analysis charts
On Friday, compared to Thursday, price action opened lower (5.28, vs Thursday's
close of 5.39), saw a lower high (5.40, vs Thursday's high of 5.45) and lower low
(5.27, vs Thursday's low of 5.31); and closed lower (5.33, vs Thursday's close of
5.39). The day's range was 13 ticks.
On the DAILY BOLLINGER BANDS CHART below, Friday represents the 1st
consecutive entire day above the middle of the Bollinger Band envelope (5.23).
The Bollinger Bands (5.00-5.45) are pointing higher; and widened from a width of
45 ticks on Thursday to a width of 45 ticks on Friday.
The RSI (59.95) below is in neutral mode between the key 20 (oversold) and 80
(overbought) levels.
April 25, 2016
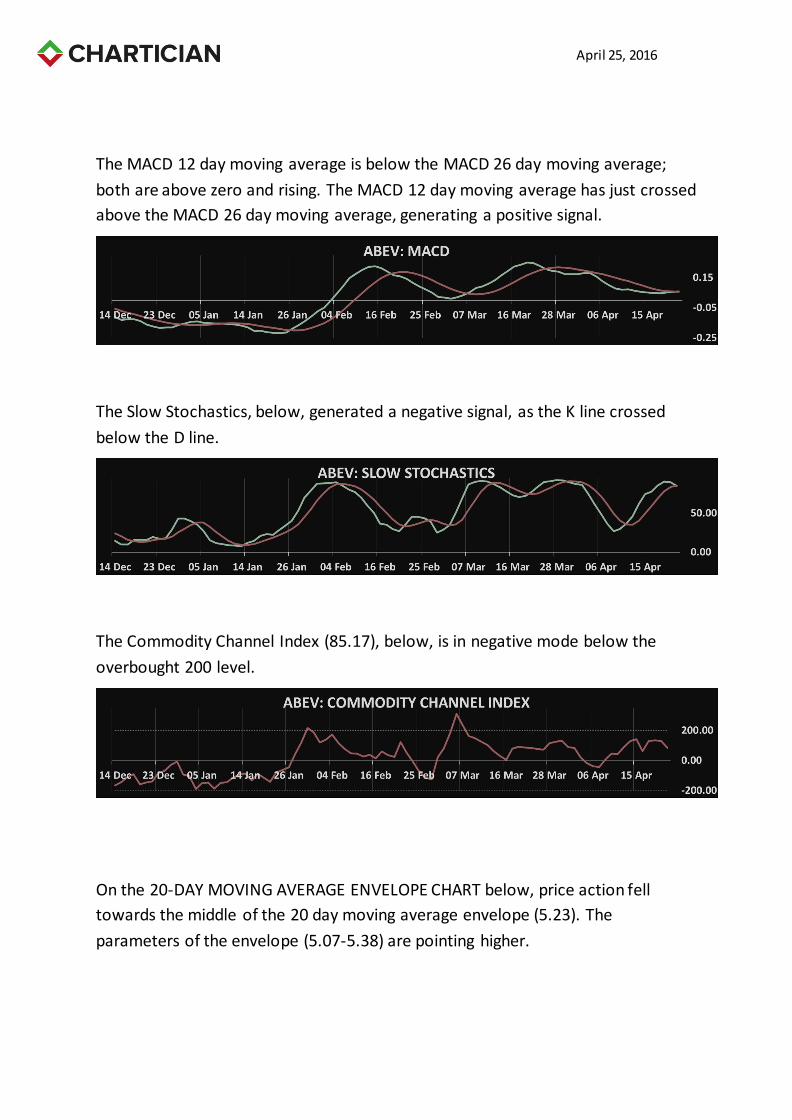
The MACD 12 day moving average is below the MACD 26 day moving average;
both are above zero and rising. The MACD 12 day moving average has just crossed
above the MACD 26 day moving average, generating a positive signal.
The Slow Stochastics, below, generated a negative signal, as the K line crossed
below the D line.
The Commodity Channel Index (85.17), below, is in negative mode below the
overbought 200 level.
On the 20-DAY MOVING AVERAGE ENVELOPE CHART below, price action fell
towards the middle of the 20 day moving average envelope (5.23). The
parameters of the envelope (5.07-5.38) are pointing higher.

April 25, 2016
On the 5 AND 20 DAY MOVING AVERAGES CHART below, the 5 day moving
average (5.34, moving down) is above the 20 day moving average (5.23, moving
up), in positive mode. The 3-50 day strip of moving averages ranges from the 50
day moving average (4.96) at the bottom of the range to the 3 day moving
average (5.37) at the top of the range.
The Parabolic Stop and Reverse (5.13) below is in the 8th day of buy mode.

April 25, 2016
On the WEEKLY BOLLINGER BANDS CHART below, last week represents the 5th
consecutive entire week below the top Bollinger Band (5.52). The Bollinger Bands
(3.92-5.52) are diverging; expanding from a width of 151 ticks on Thursday to a
width of 160 ticks on Friday.