ambient versus forced vibration modal testing of … versus forced vibration modal testing of...
TRANSCRIPT
Ambient versus Forced Vibration Modal Testing of Buildings
Sherif Beskhyroun EQC Research Fellow
UACEER Symposium 28 November 2012
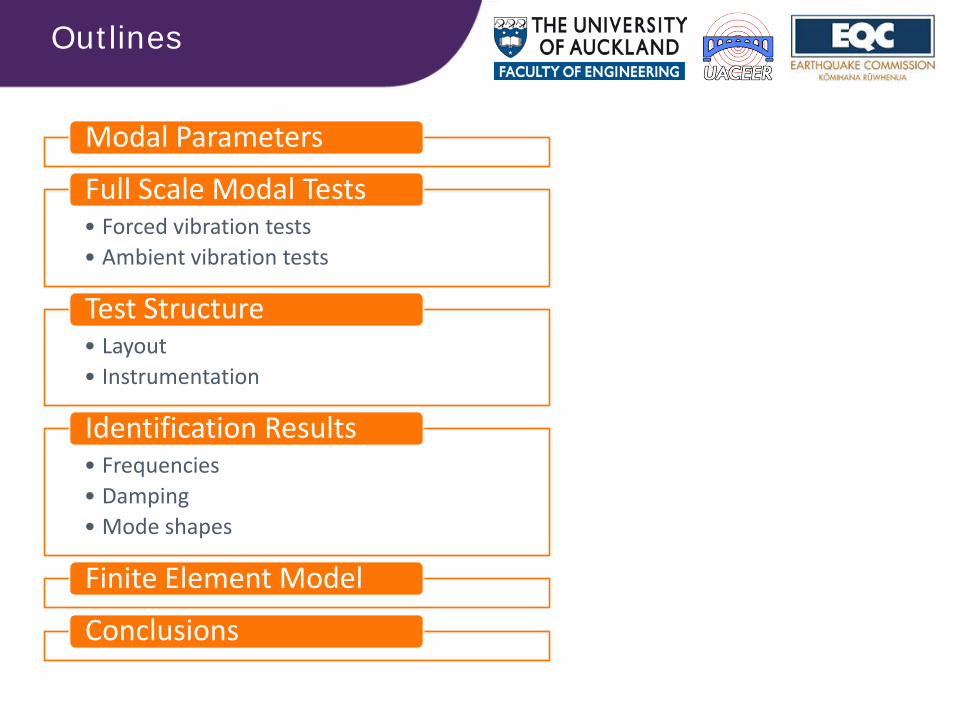
Outlines
Modal Parameters
• Forced vibration tests • Ambient vibration tests
Full Scale Modal Tests
• Layout • Instrumentation
Test Structure
• Frequencies • Damping • Mode shapes
Identification Results
Finite Element Model
Conclusions
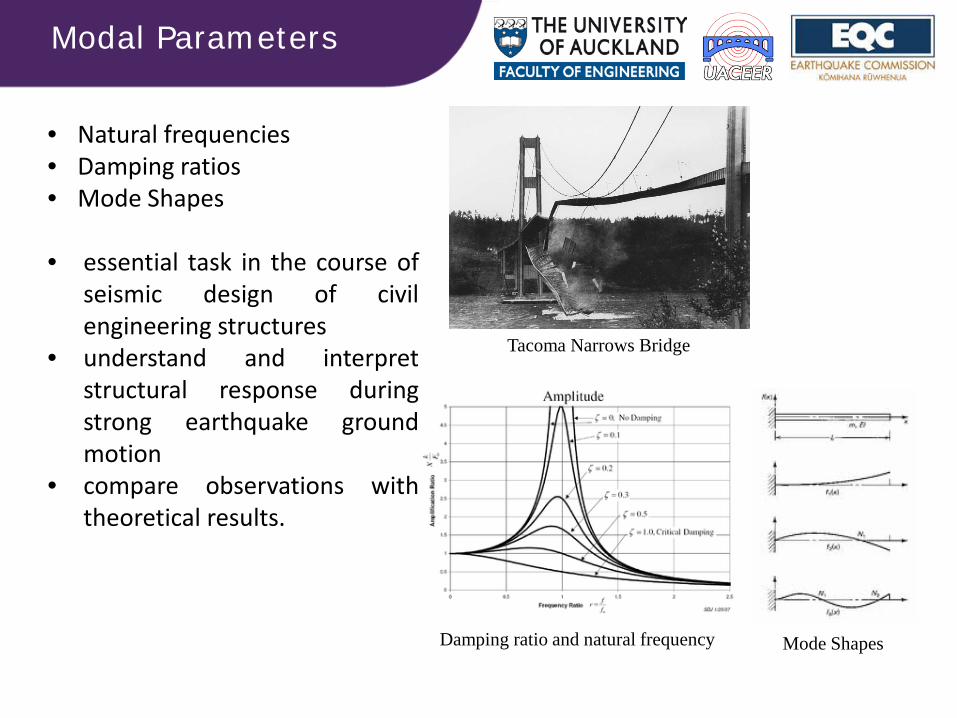
Modal Parameters
• Natural frequencies • Damping ratios • Mode Shapes • essential task in the course of
seismic design of civil engineering structures
• understand and interpret structural response during strong earthquake ground motion
• compare observations with theoretical results.
Tacoma Narrows Bridge
Mode Shapes Damping ratio and natural frequency
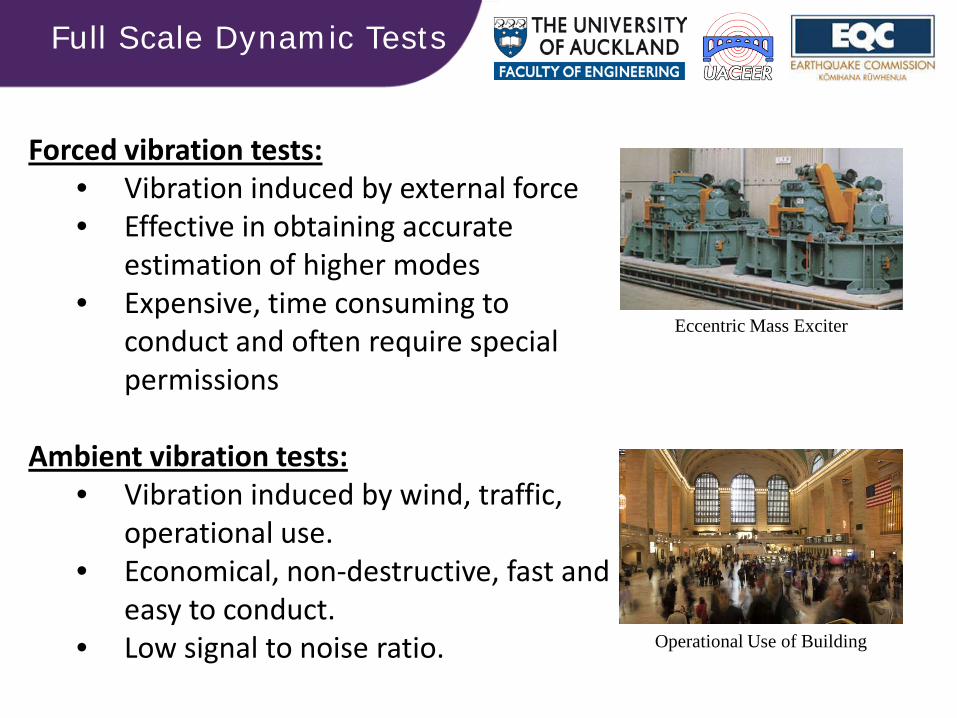
Full Scale Dynamic Tests
Forced vibration tests: • Vibration induced by external force • Effective in obtaining accurate
estimation of higher modes • Expensive, time consuming to
conduct and often require special permissions
Ambient vibration tests: • Vibration induced by wind, traffic,
operational use. • Economical, non-destructive, fast and
easy to conduct. • Low signal to noise ratio. Operational Use of Building
Eccentric Mass Exciter

Objectives
Ambient vs forced
MEMS accelerometers
Computer simulated model
Objectives
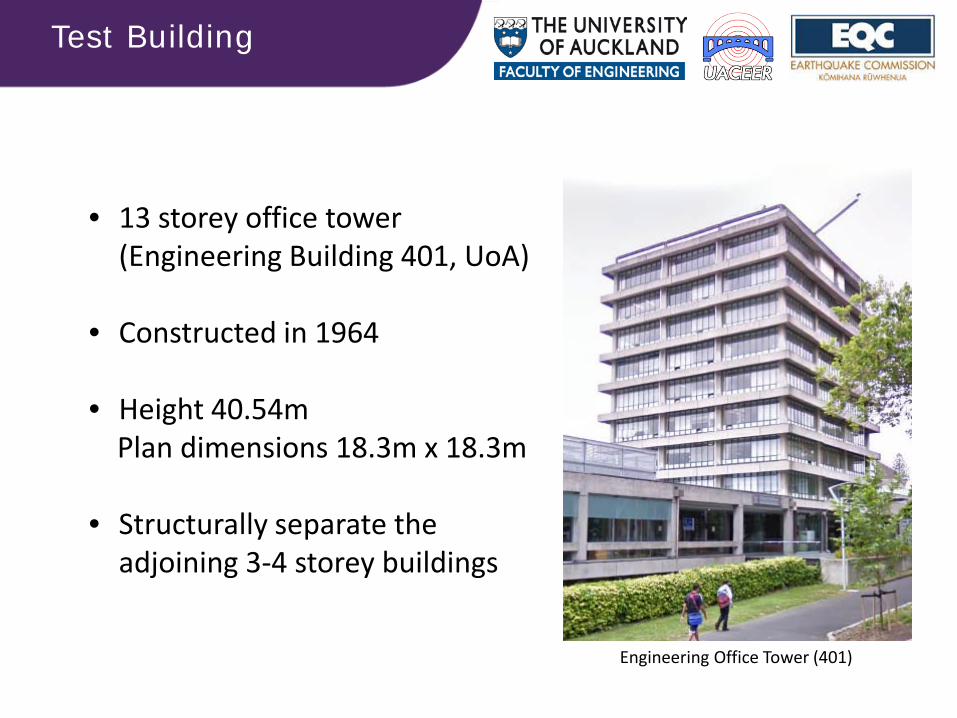
Test Building
• 13 storey office tower (Engineering Building 401, UoA)
• Constructed in 1964
• Height 40.54m Plan dimensions 18.3m x 18.3m
• Structurally separate the
adjoining 3-4 storey buildings
Engineering Office Tower (401)
Instrumentation a) Forced vibration test
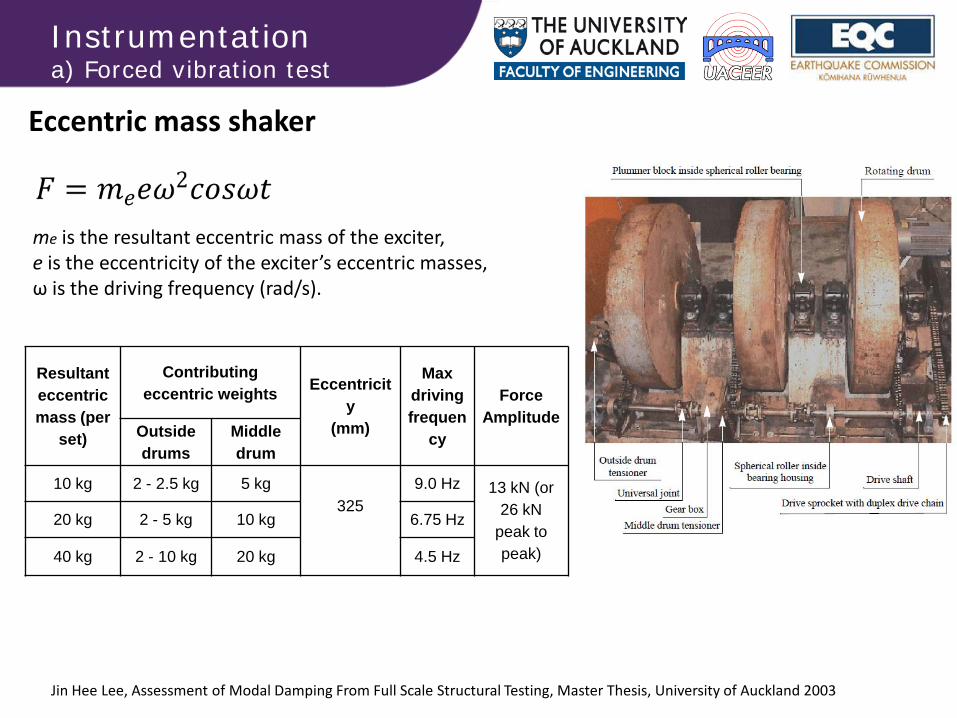
me is the resultant eccentric mass of the exciter, e is the eccentricity of the exciter’s eccentric masses, ω is the driving frequency (rad/s).
Resultant eccentric mass (per
set)
Contributing eccentric weights Eccentricit
y (mm)
Max driving frequen
cy
Force Amplitude
Outside drums
Middle drum
10 kg 2 - 2.5 kg 5 kg 325
9.0 Hz 13 kN (or 26 kN
peak to peak)
20 kg 2 - 5 kg 10 kg 6.75 Hz
40 kg 2 - 10 kg 20 kg 4.5 Hz
Eccentric mass shaker
Jin Hee Lee, Assessment of Modal Damping From Full Scale Structural Testing, Master Thesis, University of Auckland 2003
Instrumentation a) Forced vibration test
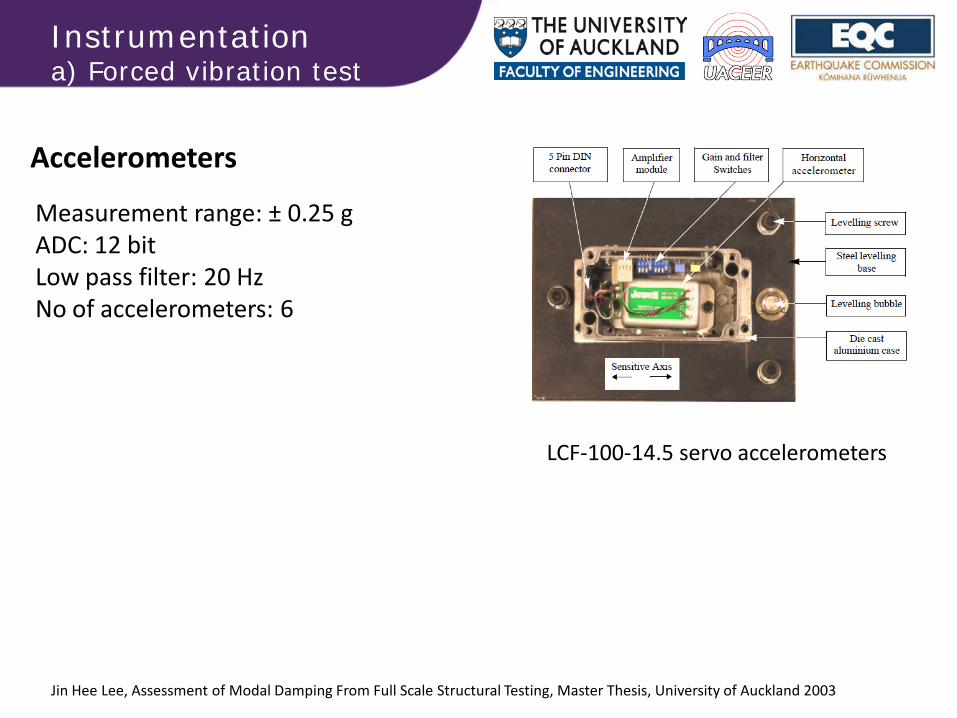
Accelerometers
LCF-100-14.5 servo accelerometers
Measurement range: ± 0.25 g ADC: 12 bit Low pass filter: 20 Hz No of accelerometers: 6
Jin Hee Lee, Assessment of Modal Damping From Full Scale Structural Testing, Master Thesis, University of Auckland 2003
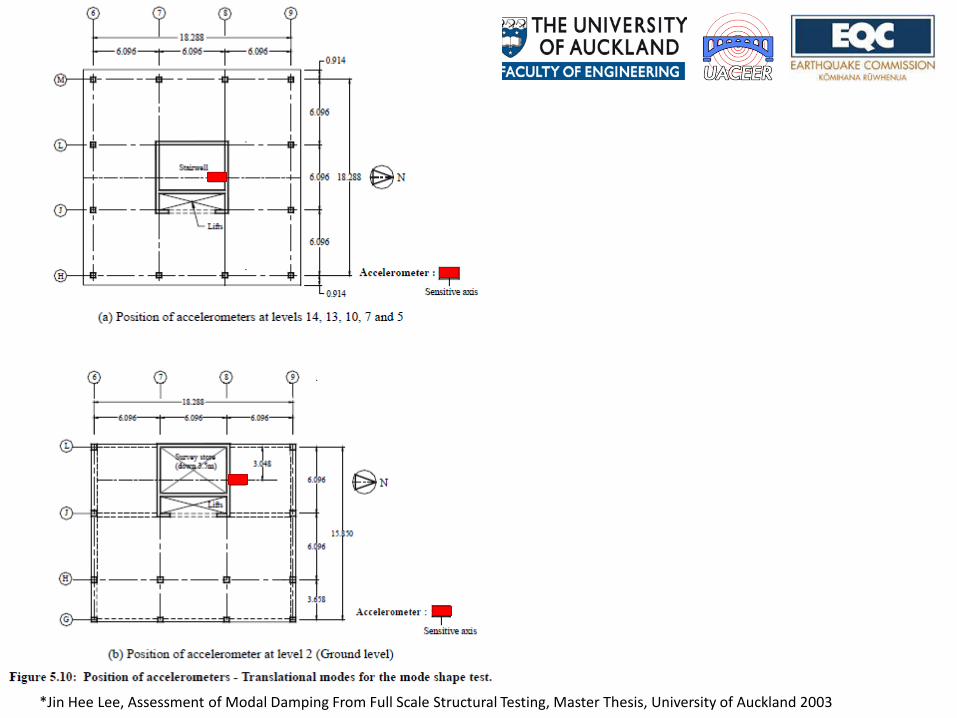
*Jin Hee Lee, Assessment of Modal Damping From Full Scale Structural Testing, Master Thesis, University of Auckland 2003
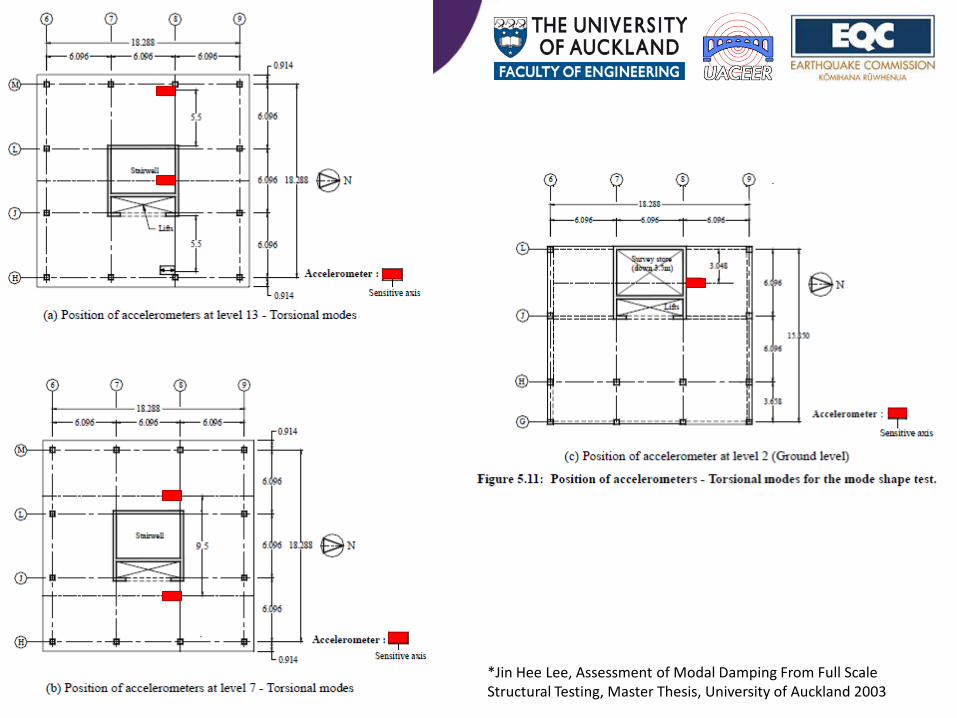
*Jin Hee Lee, Assessment of Modal Damping From Full Scale Structural Testing, Master Thesis, University of Auckland 2003
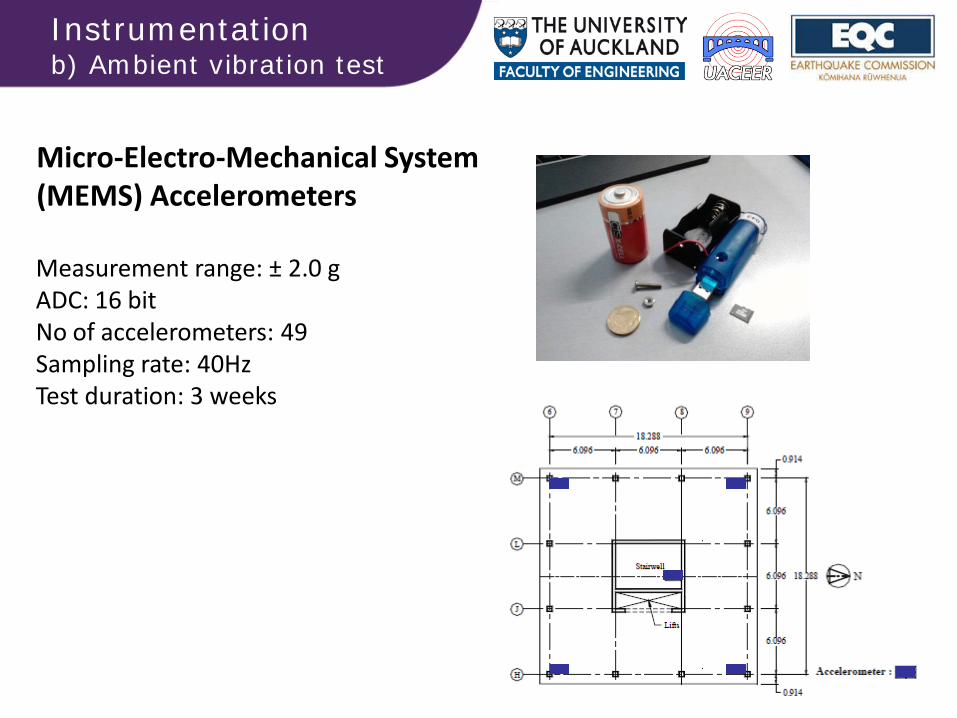
Instrumentation b) Ambient vibration test
Micro-Electro-Mechanical System (MEMS) Accelerometers
Measurement range: ± 2.0 g ADC: 16 bit No of accelerometers: 49 Sampling rate: 40Hz Test duration: 3 weeks
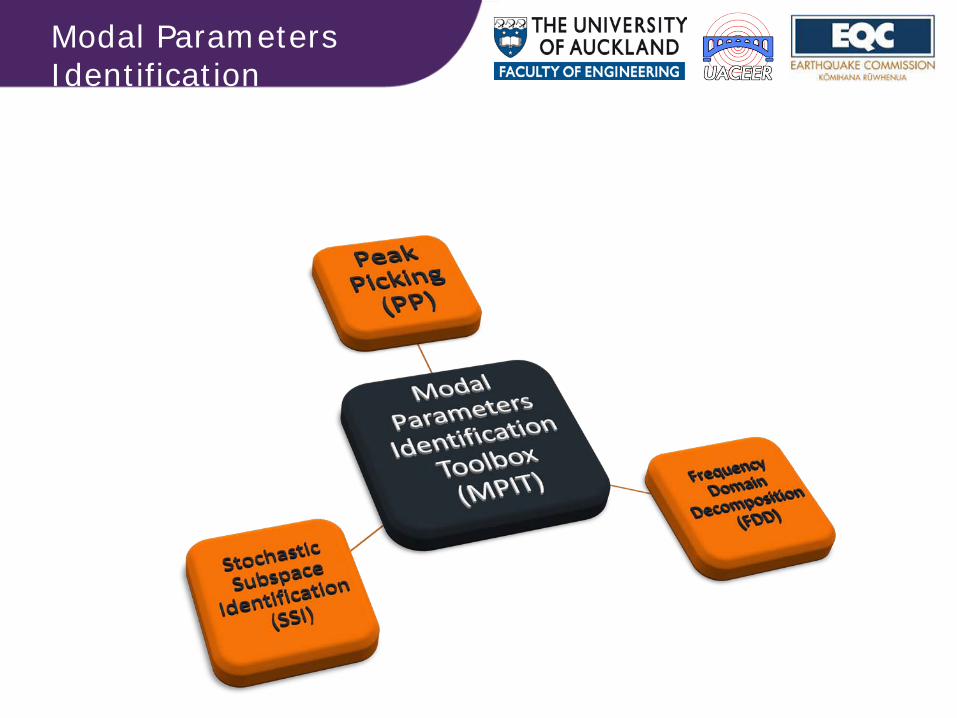
Modal Parameters Identification
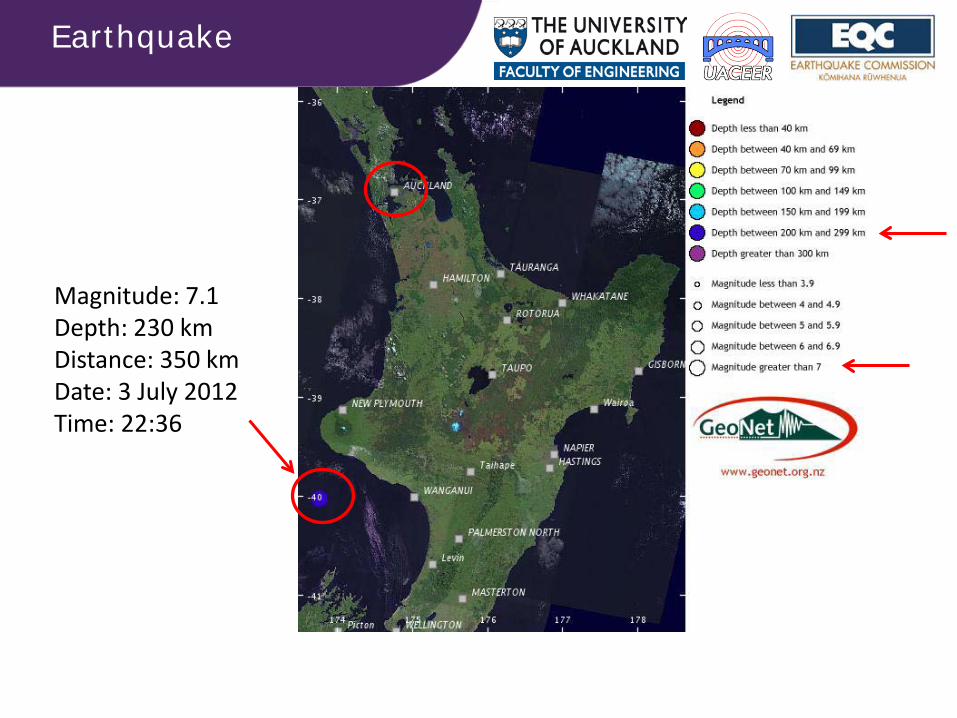
Earthquake
Magnitude: 7.1 Depth: 230 km Distance: 350 km Date: 3 July 2012 Time: 22:36
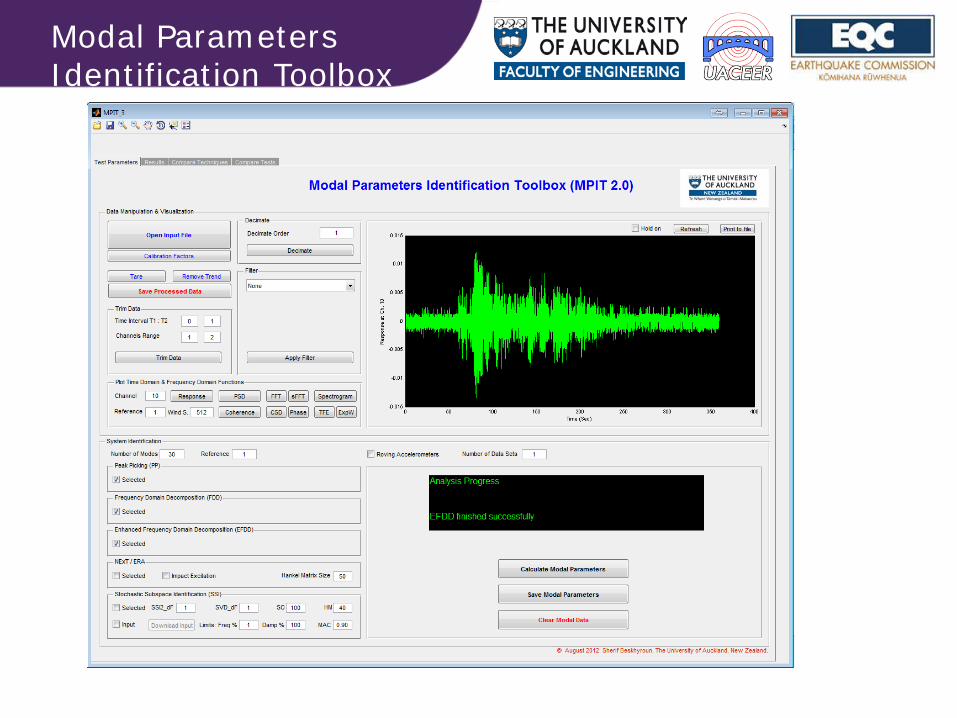
Modal Parameters Identification Toolbox
0 200 400 600 800 1000 1200-5
-4
-3
-2
-1
0
1
2
3
4
5x 10
-3
Time (Sec)
Res
pons
e at
Ch.
10
(m/s
2)
0 2 4 6 8 10 12 14 16 18 200
0.2
0.4
0.6
0.8
1
1.2
1.4
1.6
1.8
2x 10
-6
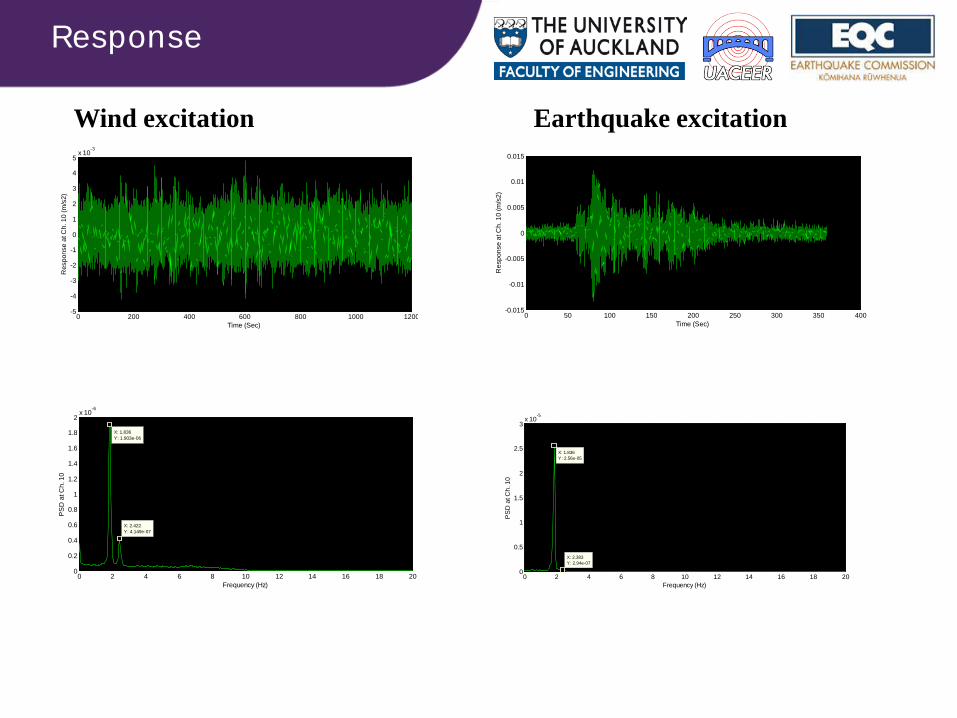
X: 1.836Y: 1.903e-06
Frequency (Hz)
PS
D a
t Ch.
10
X: 2.422Y: 4.149e-07
0 50 100 150 200 250 300 350 400-0.015
-0.01
-0.005
0
0.005
0.01
0.015
Time (Sec)
Res
pons
e at
Ch.
10
(m/s
2)
0 2 4 6 8 10 12 14 16 18 200
0.5
1
1.5
2
2.5
3x 10
-5
X: 1.836Y: 2.56e-05
Frequency (Hz)
PS
D a
t Ch.
10
X: 2.383Y: 2.94e-07
Wind excitation Earthquake excitation
Response

Mode Shape PP FDD SSI1 SSI2
Frequency (Hz) Frequency (Hz) Frequency (Hz) Damping (%) Frequency (Hz) Damping (%) Wind
First Translational (NS) 1.836 1.836 1.848 1.17 1.848 1.17
First Translational (EW) 1.719 1.719 1.730 1.00 1.730 1.00 First Torsional 2.422 2.422 2.446 1.41 2.446 1.4 Operational Use
First Translational (NS) 1.875 1.875 1.87 1.95 1.87 1.95
First Translational (EW) 1.758 1.758 1.749 1.01 1.749 1.02 First Torsional 2.461 2.461 2.444 1.77 2.444 1.77 Earthquake
First Translational (NS) 1.836 1.836 1.842 1.23 1.842 1.22
First Translational (EW) 1.719 1.719 1.725 0.97 1.725 0.97 First Torsional 2.305 2.305 2.412 1.62 2.412 1.62
Ambient vibration test results
Frequencies & Damping
-50
510
1520
25
05
1015
0
5
10
15
20
25
30
X dimension
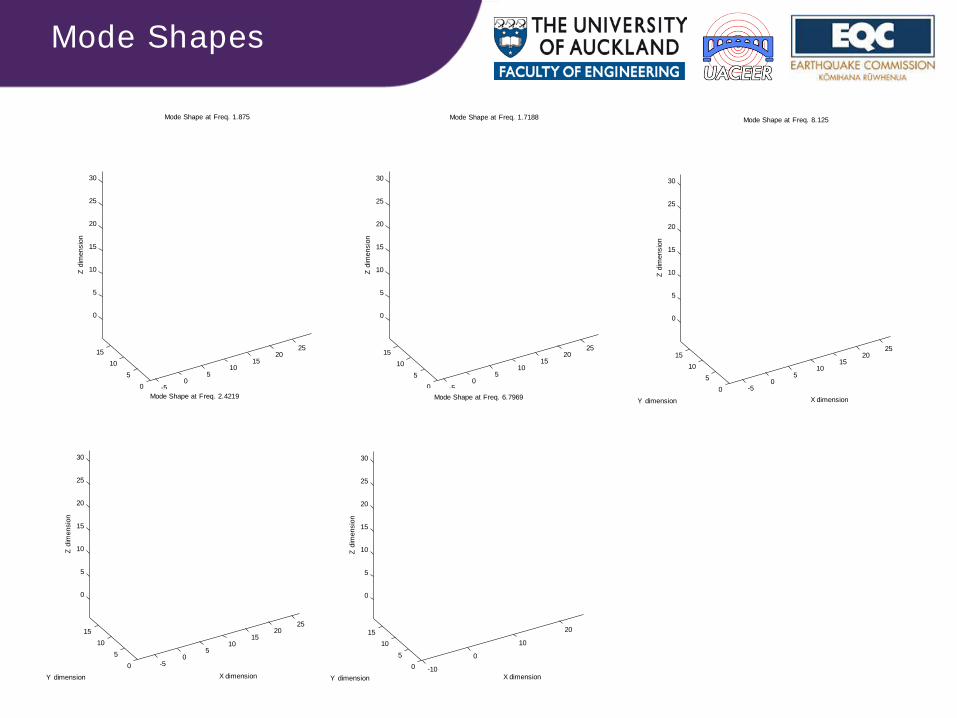
Mode Shape at Freq. 1.875
Y dimension
Z di
men
sion
-50
510
1520
25
05
1015
0
5
10
15
20
25
30
X dimension
Mode Shape at Freq. 1.7188
Y dimension
Z di
men
sion
-50
510
1520
25
05
1015
0
5
10
15
20
25
30
X dimension
Mode Shape at Freq. 8.125
Y dimension
Z di
men
sion
-50
510
1520
25
05
1015
0
5
10
15
20
25
30
X dimension
Mode Shape at Freq. 2.4219
Y dimension
Z di
men
sion
-10
0
10
20
05
1015
0
5
10
15
20
25
30
X dimension
Mode Shape at Freq. 6.7969
Y dimension
Z di
men
sion
Mode Shapes
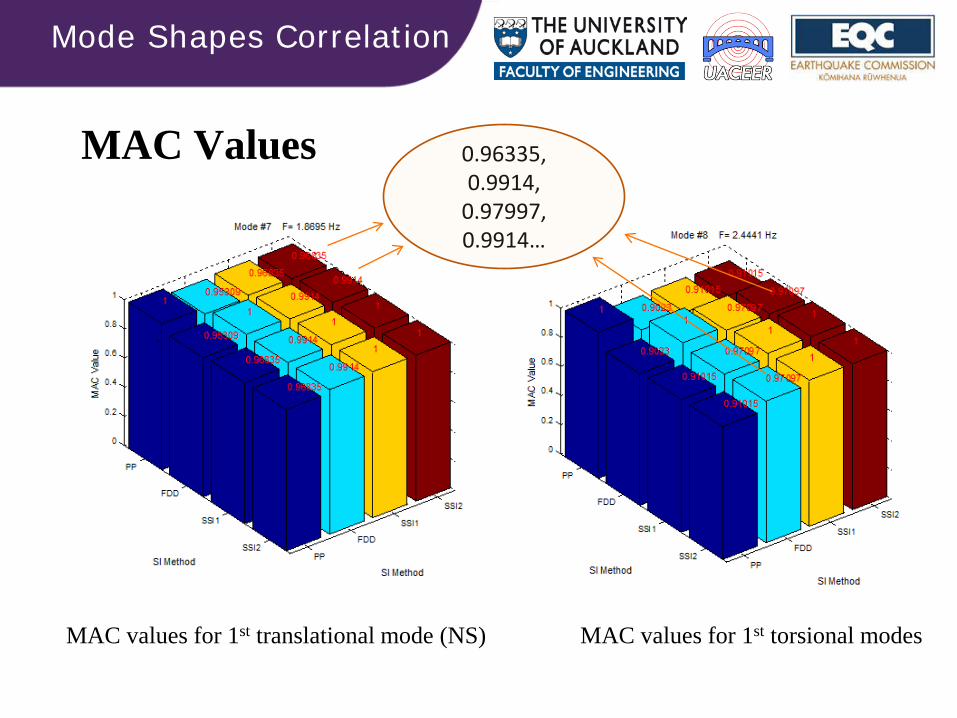
MAC Values
MAC values for 1st translational mode (NS) MAC values for 1st torsional modes
0.96335, 0.9914,
0.97997, 0.9914…
Mode Shapes Correlation
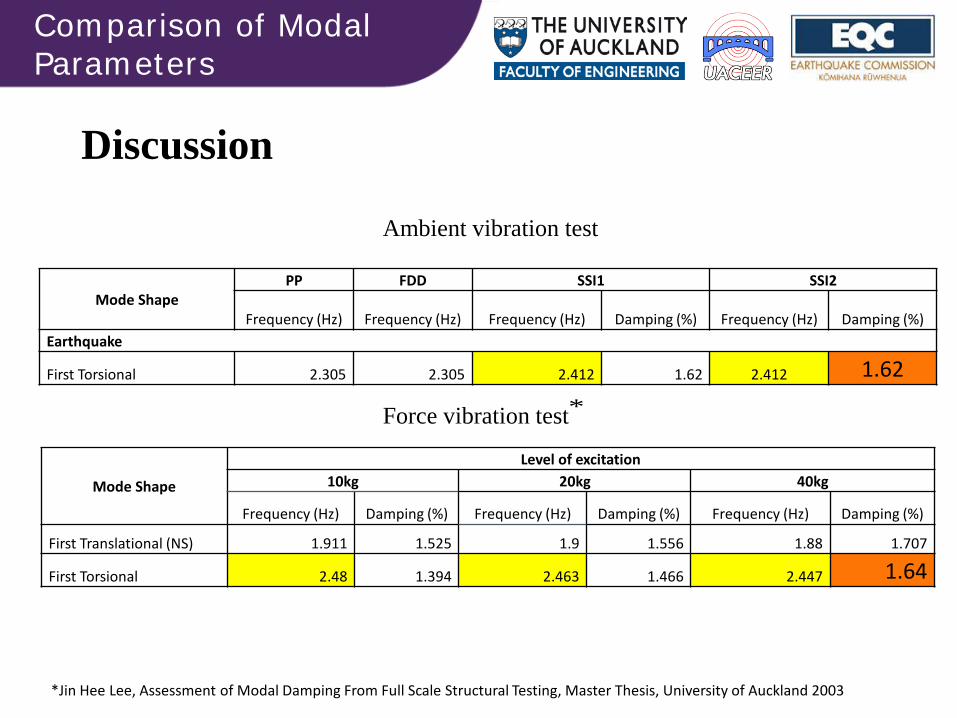
Discussion
Mode Shape
Level of excitation 10kg 20kg 40kg
Frequency (Hz) Damping (%) Frequency (Hz) Damping (%) Frequency (Hz) Damping (%)
First Translational (NS) 1.911 1.525 1.9 1.556 1.88 1.707
First Torsional 2.48 1.394 2.463 1.466 2.447 1.64
Force vibration test
*Jin Hee Lee, Assessment of Modal Damping From Full Scale Structural Testing, Master Thesis, University of Auckland 2003
Mode Shape PP FDD SSI1 SSI2
Frequency (Hz) Frequency (Hz) Frequency (Hz) Damping (%) Frequency (Hz) Damping (%) Earthquake
First Torsional 2.305 2.305 2.412 1.62 2.412 1.62
Ambient vibration test
*
Comparison of Modal Parameters

SAP2000 model
First torsional mode 2.5 Hz (2.461 Hz)
First translational mode (EW) 1.681 Hz (1.719 Hz)
First translational mode (NS) 1.803 Hz (1.836 Hz)
SAP2000 model
FEM Model

Conclusions
• Ambient vibration tests have proved that a small force can be used effectively to get the global modes of vibration.
• Very good correlation was observed between modal parameters from forced and ambient vibrations tests.
• Low cost MEMS accelerometers were successfully utilised to measure very small response amplitudes. The recorded data produced accurate estimates of the modal parameters.

Acknowledgement
• AP John Butterworth • Jin Hee Lee • Bharat Popli • Morgan Wang