ambulatory surgical centers, dialysis centers, non … · web viewthe massachusetts department of...
TRANSCRIPT

1
Commonwealth of MassachusettsCharles D. BakerGovernor
Karyn E. PolitoLieutenant Governor
Executive Office of Health & Human ServicesMarylou Sudders
Secretary
Department of Public HealthMonica Bharel, MD, MPH
Commissioner
BUREAU OF HEALTH CARE SAFETY & QUALITYBUREAU OF INFECTIOUS DISEASE AND LABORATORY SCIENCES
SEPTEMBER 2017
Influenza Vaccination of Health Care Personnel in Massachusetts Ambulatory Surgical Centers, Dialysis Centers, Non-Acute
Hospitals, Clinics, Nursing Homes, Rest Homes and Adult Day Health Centers
2016-2017 Influenza SeasonFinal Report

Table of Contents
BACKGROUND.........................................................................................................................................................3
METHODOLOGY.......................................................................................................................................................4
RESULTS...................................................................................................................................................................5
AMBULATORY SURGICAL CENTER FINDINGS.........................................................................................................6
DIALYSIS CENTER FINDINGS....................................................................................................................................7
NON-ACUTE HOSPITAL FINDINGS...........................................................................................................................8
CLINIC FINDINGS....................................................................................................................................................10
NURSING HOME FINDINGS...................................................................................................................................10
REST HOME FINDINGS...........................................................................................................................................11
ADULT DAY HEALTH FINDINGS.............................................................................................................................11
PUBLIC HEALTH ACTIONS......................................................................................................................................12
APPENDIX..............................................................................................................................................................13
A. AMBULATORY SURGICAL CENTER RESULTS.........................................................................................12
B. DIALYSIS CENTER RESULTS....................................................................................................................16
C. NON-ACUTE HOSPITAL RESULTS...........................................................................................................19
D. CLINIC RESULTS.....................................................................................................................................22
E. NURSING HOME RESULTS.....................................................................................................................34
F. REST HOME RESULTS.............................................................................................................................50
F. ADULT DAY HEALTH CENTER RESULTS..................................................................................................51
2

Background
The Massachusetts Department of Public Health (DPH) requires licensed health care facilities, including ambulatory surgical centers, dialysis centers, clinics, rest homes, nursing homes, adult day health centers, and non-acute hospitals to report influenza vaccine coverage among employees.1 2 Health care personnel (HCP) are at high risk for influenza exposure and may be a source of influenza virus transmission in health care settings. Annual immunization is the most effective method of preventing influenza and potentially serious complications.3
In 2008, DPH mandated that all licensed health care facilities offer personnel free, annual influenza vaccine. Facilities must document and report receipt of vaccine by personnel, whether administered within or outside the facility, and all declination of immunization. This report presents data on influenza vaccine coverage of non-acute health care facility personnel for 2016-17. Health care facilities included in this report are ambulatory surgical centers, dialysis facilities, and non-acute hospitals. These facility types are required to report health care personnel influenza data through the National Healthcare Safety Network (NHSN) of the Centers for Disease Control and Prevention (CDC).
This report also presents data on influenza vaccine coverage of health care facility personnel working in clinics, nursing homes, rest homes, and adult day health centers. These facilities do not report through NHSN, but rather directly to DPH.
Data describing influenza vaccination of health care personnel in acute care hospitals during the 2016-2017 influenza season has been incorporated in the hospital specific health care associated infection data summaries available at the following link:http://www.mass.gov/eohhs/gov/departments/dph/programs/hcq/healthcare-quality/health-care-facilities/flu-vac-hc-personnel/flu-vaccination-reports.html
While the CDC’s Advisory Committee on Immunization Practices recommends annual influenza vaccination for all health care personnel, Massachusetts is one of only a handful of states that mandates reporting of health care personnel influenza vaccination data in order to understand coverage rates and use this information to promote vaccination. The CDC conducted a national online survey of health care personnel in the spring of 2016 to promote coverage. In a sample of 2,258 respondents, 79.0% of all health care personnel reported receiving the influenza vaccination during the 2015-2016 season.4 Figure 1 illustrates reported vaccination coverage by care setting.
1 See 105 CMR 140.150 for the influenza vaccination reporting requirements for clinics and dialysis centers; 105 CMR 130.325 for the reporting requirements for non-acute hospitals and 105 CMR 158.030(L)(*) for reporting requirements for Adult Day Health Centers. Note that the requirements under 105 CMR 140.150 apply to dialysis centers licensed under 105 CMR 145.000 pursuant to 105 CMR 145.900.2 https://malegislature.gov/Laws/GeneralLaws/PartI/TitleXVI/Chapter111/Section51H3 https://www.cdc.gov/flu/protect/keyfacts.htm4 Black CL, Yue X, Ball SW, et al. Influenza Vaccination Coverage Among Health Care Personnel — United States, 2015–16 Influenza Season. MMWR Morb Mortal Wkly Rep 2016;65:1026–1031. DOI: http://dx.doi.org/10.15585/mmwr.mm6538a2
3

FIGURE 1. CDC’s SURVEY OF NATIONAL HEALTH CARE PERSONNEL INFLUENZA VACCINATION RATES FOR 2015-16 SEASON
Hospital Ambulatory Long Term Care Overall0.0%
20.0%
40.0%
60.0%
80.0%
100.0% 91.2%79.8%
69.2%79.0%
N=2,258 online respondents
Vaccination Rate
Care Setting
Methodology: Ambulatory Surgical Centers, Dialysis Centers, and Non-Acute Hospitals
NHSN is a secure, web-based system managed by the CDC that enables DPH and health care facilities to track and analyze data on health care associated infection and prevention practices to determine their incidence, identify trends and guide improvement. Participating health care facilities are required to report data according to the NHSN definitions and protocols to ensure uniform reporting, consistent over time within a healthcare facility and comparable across facilities.
Consistent with NHSN protocols, DPH required Ambulatory Surgical Centers, Dialysis Centers and Non-Acute Hospitals to offer employees influenza vaccines, and collect data for HCP working in the facility for at least one day between October 1 through March 31 of the influenza season, regardless of clinical responsibility or patient contact. Data is reported separately for three categories of health care personnel (HCP): employees on payroll, licensed independent practitioners (i.e. physicians, advanced practice nurses, physician assistants and other therapists affiliated with the facility but not on payroll), and adult students/trainees and volunteers aged 18 or older. For each HCP group in each facility, the total numbers of HCP vaccinated in and outside the facility, HCP who declined vaccine, HCP with a documented medical contraindication to the vaccine, and HCP with unknown vaccine status was to be compiled and submitted to NHSN.
Methodology: Clinics, Nursing Homes, Rest Homes, and Adult Day Health Centers
The DPH Healthcare Associated Infection (HAI) Prevention Program provided a Microsoft Excel spreadsheet to licensed non-acute health care facilities, for the purpose of capturing HCP influenza vaccination data. The required data elements included the total number of employees as of December 31, 2016; the total number of employees receiving seasonal influenza vaccination provided by the health care facility or administered outside the health care facility between August 1, 2016, and March 31, 2017; and the total number of HCPs who declined vaccination. Facilities were required to complete and submit this spreadsheet via electronic mail by April 15, 2017. DPH distributed guidance to all facilities at the beginning of the influenza season. Facilities that did not report data by the deadline were contacted via electronic mail to request data submission.
4

The facility vaccination rate was calculated by dividing the number of facility personnel vaccinated by the total number of facility HCPs. The overall mean percentage of HCPs vaccinated by facility type was calculated as the mean of all facility vaccination rates.
Health care personnel are defined as “individuals, both full-time and part-time employees, who are on the health care facility payroll as of December 31, 2016.” This includes, but is not limited to: physicians; nurses; interns/residents; fellows; physician assistants; physical, occupational, respiratory, and speech therapists; laboratory and operating room technicians; central supply staff; pharmacists; maintenance/environmental services staff; dietary staff; attendants/orderlies; secretarial and administrative staff; and contract staff. Due to the fluctuation in number of staff on payroll over the course of the fall and winter, it is possible for the number of immunizations and declinations documented to exceed 100% of the employees identified as of December 31, 2016.
DPH has utilized this definition of health care personnel since the 2010-11 influenza season, making comparison of data from the 2010-2011 through the 2016-2017 influenza seasons appropriate.
Results: Ambulatory Surgical Centers, Dialysis Centers, and Non-Acute Hospitals
Figure 2 depicts trends in influenza vaccination rates in ambulatory surgical centers, dialysis centers, and non-acute hospitals in Massachusetts over the most recent five flu seasons: from the 2012-13 flu season through the 2016-17 season. Overall, facilities reported similar or slightly improved mean vaccine coverage rates in 2016-17 when compared to 2015-16. No facility type reached the United States Department of Health and Human Services Healthy People 2020 90% coverage goal; however, dialysis centers reported 88% coverage and were very close with 88% coverage. Facilities that achieved this goal or had greater than 90% coverage are indicated in the appendix with an asterisk.
FIGURE 2. MEAN PERCENT OF HCP RECEIVING AND DECLINING INFLUENZA VACCINATION: 2012-2017
*
ASC Dialysis Non Acute Hospital
5

Ambulatory Surgical Centers
Forty-eight ambulatory surgical centers provided information on influenza vaccine coverage for 2016-17. On average, 85% of HCP at 48 ambulatory surgical centers were vaccinated against influenza and 11% declined vaccination (Table 1). This was an improvement from the 82% influenza vaccine coverage and 14% declination reported in 2015-16 (Figure 2). Twenty-three Massachusetts ambulatory surgical centers, representing 48% of reporting facilities, achieved a vaccination rate of 90% or greater in 2016-17. Forty-four percent of employees received their vaccinations at their place of employment, and 41% were vaccinated elsewhere.
TABLE 1. MEAN PERCENT OF HCP AT AMBULATORY SURGICAL CENTERS VACCINATED AGAINST INFLUENZA DURING 2016-2017 (N=48)
MEAN % VACCINATED
RANGE
Total Vaccinated 85% (43-100%)Vaccination Declination Rate 11% (0-57%)HCP With Unknown Status 2% (0- 30%)HCP With Medical Contraindication 2% (0-12%)Location VaccinatedAt Place of Employment 44% (0-90%)Outside Place of Employment 41% (3-100%)
In addition to influenza vaccination and declination, data on medical contraindications and unknown vaccine status were also collected, with specifics for salaried employees, licensed independent practitioners, and students and volunteers. Overall, 86% of all HCPs at Ambulatory Surgical Centers (ASC) received the vaccine and 10% declined (Figure 3). Vaccine coverage ranged from 83% to 100%, and salaried employees had the highest declination rate at 15%. Medical contraindications were rare, and unknown vaccine status ranged from 0% to 5%, with licensed independent practitioners reported with unknown status most frequently.
6

FIGURE 3. OVERALL AMBULATORY SURGICAL CENTER VACCINATION OF HCP BY TYPE 2016-2017
All HCP Salaried Employee Licensed Independent Practitioner Student or Volunteer0%
10%
20%
30%
40%
50%
60%
70%
80%
90%
100%
86% 83% 88%100%
10% 15% 5%
0%1% 1%
2% 0%3% 1% 5% 0%
HCP Vaccinated HCP Declined HCP with Medical Contraindication HCP with Status Unknown
Dialysis Centers
Among 73 reporting dialysis centers, the mean influenza vaccine coverage was 88% and declination rate was 8% in 2016-17 (Table 2). In 2016-17, 43 Massachusetts dialysis centers, 59% of reporting facilities, achieved an overall vaccination rate of 90% or greater. On average, 57% of employees were vaccinated at their place of employment and 30% were vaccinated elsewhere. Dialysis centers that are located within acute care hospitals are included in the acute care hospital report.
TABLE 2. MEAN PERCENT OF DIALYSIS CENTER HCP VACCINATED AGAINST INFLUENZA DURING 2016-2017 (N=73)
MEAN % VACCINATED
RANGE
Total Vaccinated 88% (50-100%)Vaccination Declination Rate 8% (0-50%)HCP With Unknown Status 3% (0-24%)HCP With Medical Contraindication 1% (0-11%)Location VaccinatedAt Place of Employment 57% (20-97%)Outside Place of Employment 30% (3-59%)
In addition to influenza vaccination and declination, data on medical contraindications and unknown vaccine status were also collected, with specific data for salaried employees, licensed independent practitioners, and students and volunteers. Eighty-seven percent of all HCPs at dialysis centers received the vaccine and 8% declined (Figure 4). Medical contraindications were rare.
7

FIGURE 4. OVERALL DIALYSIS CENTER VACCINATION OF HCP BY TYPE 2016-2017
Non-Acute Care Hospitals
Thirty-nine non-acute care hospitals provided information on influenza vaccine coverage. Seventy-nine percent of HCP at non-acute care hospitals, on average, were vaccinated against influenza, and 12% declined vaccination in 2016-17 (Table 3). There was a small increase in mean vaccine coverage in 2016-2017, compared to mean coverage of 78% in 2015-2016. Only 12% of HCP declined vaccination, compared to 13% in 2015-16 (Figure 2). Thirteen non-acute care hospitals in Massachusetts reported vaccine coverage greater than 90% during the 2016-17 influenza season. Most personnel received vaccination from the facility that employed them: on average 56% . Twenty-four percent of HCP at non-acute care hospitals were vaccinated elsewhere.
TABLE 3. MEAN PERCENT OF NON-ACUTE CARE HOSPITAL HCP VACCINATED AGAINST INFLUENZA DURING 2016-2017 (N=39)
Mean % Vaccinated
Range
Total Vaccinated 79% (35-98%)Vaccination Declination Rate 12% (0-52%)HCP With Unknown Status 8% (0-43%)HCP With Medical Contraindication 1% (0-4%)Location VaccinatedAt Place of Employment 56% (23-77%)Outside Place of Employment 24% (3-45%)
8

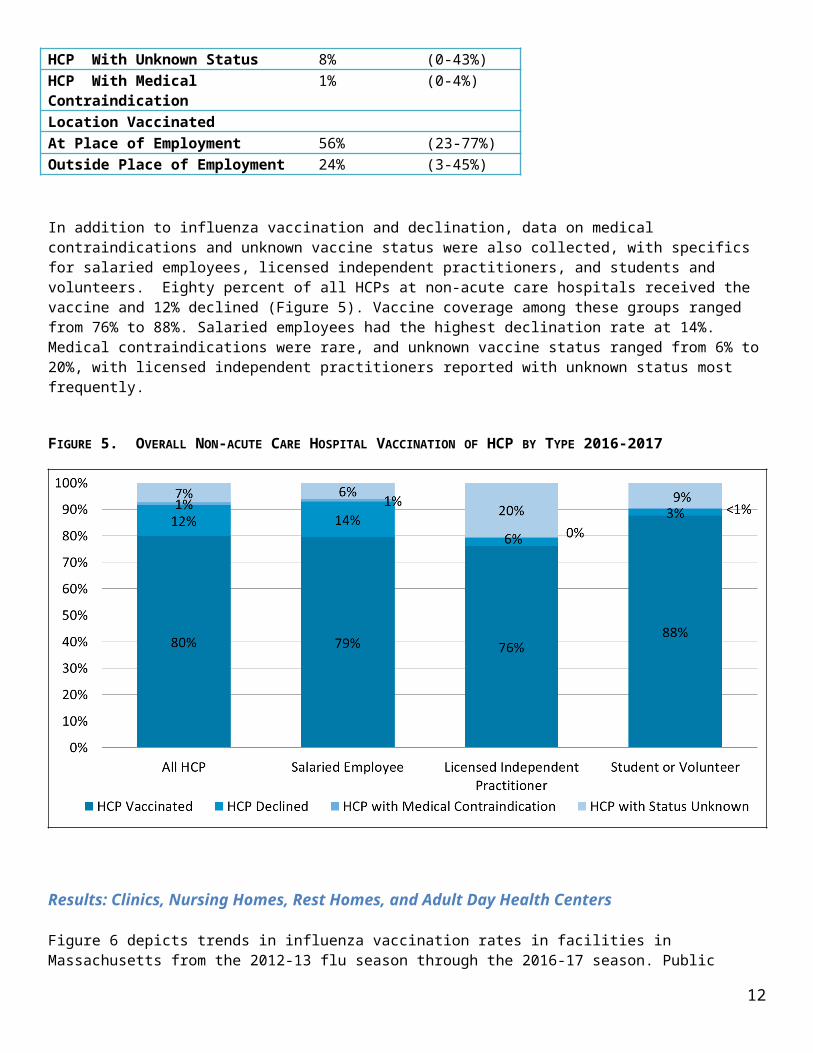
In addition to influenza vaccination and declination, data on medical contraindications and unknown vaccine status were also collected, with specifics for salaried employees, licensed independent practitioners, and students and volunteers. Eighty percent of all HCPs at non-acute care hospitals received the vaccine and 12% declined (Figure 5). Vaccine coverage among these groups ranged from 76% to 88%. Salaried employees had the highest declination rate at 14%. Medical contraindications were rare, and unknown vaccine status ranged from 6% to 20%, with licensed independent practitioners reported with unknown status most frequently.
FIGURE 5. OVERALL NON-ACUTE CARE HOSPITAL VACCINATION OF HCP BY TYPE 2016-2017
Results: Clinics, Nursing Homes, Rest Homes, and Adult Day Health Centers
Figure 6 depicts trends in influenza vaccination rates in facilities in Massachusetts from the 2012-13 flu season through the 2016-17 season. Public reporting of influenza vaccine status for adult day health centers began in the 2015-16 season. Nursing homes and rest homes reported a slightly improved mean vaccine coverage rate in 2016-17 when compared to 2015-16. Clinic and adult day health centers had a slight decrease in vaccine coverage when compared to the previous season. Overall, no facility type reached the United States Department of Health and Human Services Healthy People 2020 90% coverage goal, though many individual sites did achieve this goal. Sites with greater than 90% coverage are indicated in the appendix with an asterisk.
9

FIGURE 6. MEAN PERCENT OF HCP RECEIVING AND DECLINING INFLUENZA VACCINATION: 2012-2017
Clinics
During the 2016-17 influenza season, 164 licensed clinics submitted HCP influenza vaccination data. The average influenza vaccine coverage at clinics was 65%, with a mean of 27% declining the vaccine (Table 4, Figure 6). Forty-six clinics, representing 27% of reporting facilities in 2016-17, had an overall vaccination rate of 90% or greater. Personnel most frequently received vaccination outside their place of employment: a mean of 36% were vaccinated outside their workplace, and 29% were vaccinated at their place of employment.
TABLE 4. MEAN PERCENT OF CLINIC HCP VACCINATED AGAINST INFLUENZA DURING 2016-2017 (N=164)
Mean % Vaccinated
Range
Total Vaccinated 65% (0-100%)Vaccine Declination Rate 27% (0-100%)
Location VaccinatedAt Place of Employment 29% (0-100%)
Outside Place of Employment 36% (0-100%)
Nursing Homes
In nursing homes, 358 licensed facilities reported data for the 2016-2017 flu season. On average in 2016-17, 75% of HCP at nursing homes were vaccinated against influenza and 23% declined to be vaccinated (Table 5). The vaccine coverage rate increased from 73% in the 2015-16 season to 75% this season, though the declination rate has stayed the same for three seasons at 23%. (Figure 6). In 2016-17, 94 nursing homes in Massachusetts, representing 26% of reporting facilities, reported an overall vaccination rate of 90% or greater. Fifty-five percent of employees received vaccination at their place of employment and 21% were vaccinated elsewhere.
10

TABLE 5. MEAN PERCENT OF NURSING HOME HCP VACCINATED AGAINST INFLUENZA DURING 2016-2015 (N=358)
Mean % Vaccinated
Range
Total Vaccinated 75% (15-100%)Vaccine Declination Rate 23% (0-78%)
Location VaccinatedAt Place of Employment 54% (0-100%)
Outside Place of Employment 21% (0-83%)
Rest Homes
Twenty licensed rest homes reported data for the 2016-2017 flu season. On average, 75% of HCP were vaccinated against influenza during 2016-17, and 30% declined (Table 6). Vaccine coverage remained stable at 76% between 2015-16 and 2016-17, while six rest homes (30%) reported an overall vaccination rate of 90% or greater. More rest home employees received vaccine outside their place of employment (40%) rather than at their place of employment (35%).
TABLE 6. MEAN PERCENT OF REST HOME HCP VACCINATED AGAINST INFLUENZA DURING 2016-2017 (N=20)
Mean % Vaccinated
Range
Total Vaccinated 75% (47-100%)Vaccination Declination Rate 30% (0-70%)
Location VaccinatedAt Place of Employment 35% (0-76%)
Outside Place of Employment 40% (6-87%)
Adult Day Health Centers
One hundred and thirty-two adult day health centers reported flu data for the 2016-17 flu season. On average, 60% of HCP were vaccinated against influenza during 2016-17, and 40% declined (Table 7). Twenty-seven adult day health centers (20%) reported an overall vaccination rate of 90% or greater. More adult day health center employees received vaccine at their place of employment rather than elsewhere, 32% and 28%, respectively.
TABLE 7. MEAN PERCENT OF ADULT DAY HEALTH HCP VACCINATED AGAINST INFLUENZA DURING 2016-2017 (N=132)
Mean % Vaccinated
Range
Total Vaccinated 60% (0-100%)Vaccination Declination Rate 40% (0-100%)
Location VaccinatedAt Place of Employment 32% (0-100%)
Outside Place of Employment 28% (0-100%)
11
Public Health Actions
DPH is planning a two-part webinar series targeting Adult Day Health Centers, Clinics, Nursing Homes, and Rest Homes. Program content will include: influenza disease burden; key facts about the current season; surveillance and reporting; and strategies for increasing HCP coverage.
DPH will continue to reinforce the reporting requirement and statewide performance goal during dialysis trainings, and on-site Infection Control Assessment and Response (ICAR) visits in nursing homes.
DPH will continue to monitor trends and report annual compliance with the HCP influenza vaccination requirements.
DPH will promote continuous quality improvement, and recommend licensed facilities share vaccination rates with all staff, including administrators, boards of directors, practice managers, ombudsperson, and patient/family councils.
DPH encourages facilities to review reported data and current HCP influenza policies, and as necessary implement processes to maximize vaccination coverage.
DPH will continue to promote a continuous, comprehensive influenza prevention program in all licensed health care settings.
DPH will promote the DPH and Healthy People 2020 target to vaccinate 90% or greater of eligible HCP in all licensed health care settings.
DPH will collaborate with public health partners to intensify efforts to improve immunization rates among HCP especially among low outliers.
12

Appendix. Vaccination Rates by Facility Type and Name
Asterisk* indicates site achieved greater than 90% flu vaccine coverage in 2016-17. “n/a” indicates data not reported by facility to DPH or available through NHSN. DPH distributed guidance to all facilities at the beginning of the influenza season.
The data was extracted from NHSN on 7/13/17.
TABLE 8. 2014-2015 TO 2016-2017 HCP INFLUENZA VACCINATION AND DECLINATION AT MASSACHUSETTS AMBULATORY SURGICAL CENTERS (ASCS)
ASC Facility Name # HCPs
Vaccine Coverage 2016-17
Vaccine Declined 2016-17
HCP w/ Medical Contra-
indication 2016-17
HCP w/ Unknown Vaccine Status
2016-17
Vaccine Coverage 2015-16
Vaccine Declined 2015-16
HCP w/ Medical Contra-
indication 2015-16
HCP w/ Unknown Vaccine Status
2015-16
Vaccine Coverage 2014-15
Vaccine Declined 2014-15
Adams Cataract and Laser Center Associates P.C.
20 59% 34% 6% 0% 74% 20% 6% 0% 67% 27%
Advanced Eye Surgery Center, LLC
14 71% 29% 0% 0% 78% 22% 0% 0% 65% 35%
ASC of Cape Cod* 37 97% 3% 0% 0% 92% 8% 0% 0% 94% 6%Berkshire Cosmetic Surgery* 19 100% 0% 0% 0% 94% 6% 0% 0% 100% 0%Berkshire Endoscopy Center, LLC
20 75% 25% 0% 0% 53% 47% 0% 0% 22% 78%
Boston Center for Ambulatory Surgery, Inc.
7 81% 19% 0% 0% 71% 29% 0% 0% 89% 11%
Boston Endoscopy Center* 41 93% 7% 0% 0% 86% 13% 1% 0% 82% 18%Boston Eye Surgery & Laser Center Boston
27 79% 9% 5% 8% 89% 5% 5% 0% 72% 11%
Boston Eye Surgery & Laser Center West
24 78% 9% 5% 8% 82% 14% 4% 0% 74% 14%
Boston IVF* 89 90% 10% 0% 0% 91% 9% 0% 0% 85% 8%Boston Outpatient Surgical Suites*
40 94% 6% 0% 0% 90% 10% 0% 0% 40% 60%
Boston Surgery Center, LLC* 12 100% 0% 0% 0% 100% 0% 0% 0% 94% 6%Boston University Eye Surgery and Laser Center*
15 97% 0% 3% 0% 89% 7% 4% 0% 90% 7%
Cape & Islands Endoscopy Center LLC
37 76% 24% 0% 0% 78% 14% 8% 0% 78% 18%
Cape Cod Eye Surgery & Laser Center
21 84% 16% 0% 0% 92% 8% 0% 0% 85% 8%
Cape Cod Surgery Center Inc.
n/a n/a n/a n/a n/a 90% 10% 0% 0% 92% 0%
13

ASC Facility Name # HCPs
Vaccine Coverage 2016-17
Vaccine Declined 2016-17
HCP w/ Medical Contra-
indication 2016-17
HCP w/ Unknown Vaccine Status
2016-17
Vaccine Coverage 2015-16
Vaccine Declined 2015-16
HCP w/ Medical Contra-
indication 2015-16
HCP w/ Unknown Vaccine Status
2015-16
Vaccine Coverage 2014-15
Vaccine Declined 2014-15
Cataract & Laser Center Central LLC, The
26 78% 20% 2% 0% 87% 13% 0% 0% 87% 13%
Cataract & Laser Center, West*
30 93% 7% 0% 0% 88% 9% 0% 4% 83% 17%
Cataract and Laser Center 27 73% 24% 2% 0% 74% 22% 4% 0% 93% 7%Cataract and Laser Center, The
31 86% 14% 0% 0% 88% 12% 0% 0% 77% 7%
Cataract Surgery Center of Milford
14 89% 11% 0% 0% 75% 19% 6% 0% 95% 5%
Central MA Ambulatory Endoscopy Center
19 76% 12% 12% 0% 84% 13% 3% 0% 72% 23%
Charles River Endoscopy, LLC.
12 88% 13% 0% 0% 93% 7% 0% 0% 89% 11%
Commonwealth Endoscopy Center
13 87% 6% 6% 0% 91% 9% 0% 0% 95% 5%
DHA Endoscopy LLC 28 82% 3% 5% 11% 94% 0% 6% 0% 94% 6%East Bay Surgery Center* 45 91% 8% 1% 0% 93% 6% 1% 0% 90% 9%East Pond Enterprises Inc. 12 43% 57% 0% 0% 48% 52% 0% 0% 64% 36%Eastern Massachusetts Surgery Center
22 54% 15% 2% 30% 44% 19% 2% 35% 69% 8%
Endoscopy Center of Southeastern Massachusetts
n/a n/a n/a n/a n/a n/a n/a n/a n/a n/a n/a
Four Women n/a n/a n/a n/a n/a n/a n/a n/a n/a 88% 12%
Greater New Bedford Surgicenter
27 59% 41% 0% 0% 61% 39% 0% 0% 36% 64%
Greater Springfield Surgery Center
25 72% 13% 2% 13% 70% 16% 0% 14% 57% 17%
Hyannis Ear Nose and Throat Associates
n/a n/a n/a n/a n/a 75% 19% 6% 0% 75% 19%
Hyde Park Pain Management, LLC
n/a n/a n/a n/a n/a 72% 22% 6% 0% 83% 17%
Merrimack Valley Endoscopy Center*
36 93% 7% 0% 0% 93% 7% 0% 0% 89% 11%
Middlesex Endoscopy Center 12 81% 19% 0% 0% 84% 16% 0% 0% 88% 8%New England Ambulatory SurgiCenter*
14 93% 0% 7% 0% 100% 0% 0% 0% 57% 29%
New England Eye Surgical Center, Inc.*
20 90% 8% 2% 0% 90% 10% 0% 0% 97% 3%
New England Pain Care, Inc. 28 79% 21% 0% 0% 69% 26% 0% 6% 65% 35%
14

ASC Facility Name # HCPs
Vaccine Coverage 2016-17
Vaccine Declined 2016-17
HCP w/ Medical Contra-
indication 2016-17
HCP w/ Unknown Vaccine Status
2016-17
Vaccine Coverage 2015-16
Vaccine Declined 2015-16
HCP w/ Medical Contra-
indication 2015-16
HCP w/ Unknown Vaccine Status
2015-16
Vaccine Coverage 2014-15
Vaccine Declined 2014-15
New England SCOPE* 36 100% 0% 0% 0% 100% 0% 0% 0% 100% 0%
New England Surgery Center 32 86% 14% 0% 0% 88% 12% 0% 0% 70% 26%North Shore Cataract & Laser Center*
27 91% 0% 9% 0% 87% 6% 6% 0% 92% 4%
Northeast Ambulatory Center n/a n/a n/a n/a n/a 36% 45% 9% 9% 64% 29%Northeast Endoscopy LLC* 36 92% 8% 0% 0% 96% 4% 0% 0% 90% 10%Orthopedic Surgical Center of the North Shore*
64 90% 10% 0% 1% 90% 7% 0% 3% 91% 7%
Peabody Surgery Center LLC
n/a n/a n/a n/a n/a n/a n/a n/a n/a 100% 0%
Pioneer Valley Surgicenter* 34 96% 4% 0% 0% 94% 6% 0% 0% 95% 5%Plymouth Laser and Surgical Center*
21 100% 0% 0% 0% 97% 0% 3% 0% 98% 0%
Same Day SurgiCare of N.E. n/a n/a n/a n/a n/a 78% 21% 0% 1% 79% 15%SEE New England* 14 100% 0% 0% 0% 100% 0% 0% 0% 100% 0%South Shore Endoscopy Center*
18 97% 0% 3% 0% 85% 12% 0% 3% 88% 13%
Surgery Center of New England
15 82% 18% 0% 0% 87% 9% 4% 0% 77% 19%
Valley Medical Group* 17 100% 0% 0% 0% 95% 5% 0% 0% 86% 14%West Suburban Eye Surgery Center*
37 93% 7% 0% 0% 94% 6% 0% 0% 89% 6%
Weymouth Endoscopy, LLC* 13 100% 0% 0% 0% 87% 13% 0% 0% 86% 14%
Women’s Health Services n/a n/a n/a n/a n/a n/a n/a n/a n/a n/a n/aWorcester Surgical Center 45 78% 12% 4% 7% 73% 10% 2% 16% 82% 18%
* Vaccination rate greater than 90% in 2016-17
15

TABLE 9. 2014-2015 TO 2016-2017 HCP INFLUENZA VACCINATION AND DECLINATION AT MASSACHUSETTS DIALYSIS CENTERS
Dialysis Facility Name # HCPs
Vaccine Coverage 2016-17
Vaccine Declined 2016-17
HCP w/ Medical Contra-
indication 2016-17
HCP w/ Unknown Vaccine Status
2016-17
Vaccine Coverage 2015-16
Vaccine Declined 2015-16
HCP w/ Medical Contra-
indication 2015-16
HCP w/ Unknown Vaccine Status
2015-16
Vaccine Coverage 2014-15
Vaccine Declined 2014-15
ARA - Springfield Dialysis LLC
37 63% 32% 0% 5% 81% 19% 0% 0% 70% 30%
ARA-Ludlow Dialysis, LLC 33 81% 16% 0% 3% 74% 21% 3% 3% 63% 38%Blackstone Valley Dialysis* 36 100% 0% 0% 0% 93% 0% 2% 5% 100% 0%BMC South County 16 88% 13% 0% 0% 87% 13% 0% 0% n/a n/aBoston Dialysis* 55 95% 0% 0% 5% 100% 0% 0% 0% 100% 0%
Boston Dialysis Center (Carney)*
25 100% 0% 0% 0% 100% 0% 0% 0% 100% 0%
Brockton Dialysis Center LLC*
34 82% 13% 0% 5% 92% 6% 0% 3% 89% 11%Brockton Healthcare Clinic LLC
33 52% 24% 0% 24% 65% 9% 0% 26% 54% 46%
Brookline Dialysis* 39 96% 2% 2% 0% n/a n/a n/a n/a 85% 15%Burlington Regional Dialysis*
27 97% 0% 3% 0% n/a n/a n/a n/a 100% 0%
Cape Cod Artificial Kidney Center*
33 91% 6% 0% 3% 93% 5% 0% 3% 96% 4%
Chicopee Dialysis Center* 22 97% 0% 3% 0% 90% 5% 5% 0% 88% 12%DCI Boston* 42 98% 2% 0% 0% 100% 0% 0% 0% 98% 2%DCI Brigham/Faulkner 48 79% 19% 2% 0% 75% 18% 2% 5% 79% 21%DCI Somerville* 35 96% 2% 2% 0% 96% 2% 2% 0% 97% 3%DCI Walden Pond* 13 100% 0% 0% 0% 100% 0% 0% 0% 100% 0%Dialysis Center of Attleboro LLC
32 84% 6% 3% 6% 68% 26% 5% 0% n/a n/a
Dialysis Center of Waltham n/a n/a n/a n/a n/a n/a n/a n/a n/a n/a n/aDialysis Center of Western Massachusetts, LLC
42 50% 50% 0% 0% 61% 37% 0% 3% n/a n/a
East Springfield Dialysis Center*
24 94% 0% 0% 6% 98% 2% 0% 0% 94% 6%
Fall River Kidney Center 49 71% 22% 2% 4% 80% 18% 2% 0% 66% 34%Framingham Dialysis Center*
38 100% 0% 0% 0% 96% 4% 0% 0% n/a n/a
Freedom Center Worcester* 8 95% 0% 0% 5% n/a n/a n/a n/a n/a n/aFresenius Medical Care Attleboro*
23 93% 0% 0% 7% 100% 0% 0% 0% 100% 0%
16

Dialysis Facility Name # HCPs
Vaccine Coverage 2016-17
Vaccine Declined 2016-17
HCP w/ Medical Contra-
indication 2016-17
HCP w/ Unknown Vaccine Status
2016-17
Vaccine Coverage 2015-16
Vaccine Declined 2015-16
HCP w/ Medical Contra-
indication 2015-16
HCP w/ Unknown Vaccine Status
2015-16
Vaccine Coverage 2014-15
Vaccine Declined 2014-15
Fresenius Medical Care Chelmsford*
10 100% 0% 0% 0% 100% 0% 0% 0% n/a n/a
Fresenius Medical Care Danvers*
14 90% 5% 0% 5% n/a n/a n/a n/a n/a n/a
Fresenius Medical Care Fairhaven
15 82% 14% 0% 5% n/a n/a n/a n/a n/a n/a
Fresenius Medical Care Falmouth*
28 94% 6% 0% 0% 91% 9% 0% 0% 89% 11%
Fresenius Medical Care Lowell
50 66% 30% 4% 0% 84% 12% 3% 0% 86% 14%
Fresenius Medical Care Marlborough*
25 91% 3% 0% 6% 57% 13% 0% 30% n/a n/a
Fresenius Medical Care Merrimack Valley
26 89% 11% 0% 0% 86% 7% 2% 5% n/a n/a
Fresenius Medical Care Methuen
26 72% 17% 11% 0% 94% 2% 4% 0% 86% 14%
Fresenius Medical Care Newburyport*
39 94% 4% 0% 2% 98% 2% 0% 0% 90% 10%
Fresenius Medical Care Plymouth-Cordage*
37 92% 5% 0% 3% 89% 8% 0% 3% 95% 5%
Fresenius Medical Care Stoneham*
25 91% 3% 0% 6% 93% 5% 0% 3% n/a n/a
Fresenius Medical Care Wareham
25 81% 17% 0% 3% 87% 13% 0% 0% 50% 50%
Hampshire County Dialysis Center*
24 100% 0% 0% 0% 100% 0% 0% 0% 100% 0%
Hawthorn Kidney Center LLC Dartmouth Wareham
34 76% 21% 3% 0% 64% 33% 3% 0% n/a n/a
Hawthorn Kidney Center- Wareham, LLC
11 71% 29% 0% 0% 67% 33% 0% 0% 50% 50%
Heritage Dialysis, LLC 28 76% 24% 0% 0% 73% 27% 0% 0% 70% 40%Mary Eliza Mahoney Dialysis
39 77% 8% 0% 15% 79% 11% 0% 11% 85% 0%
Medford Dialysis Center 51 72% 8% 0% 20% 62% 10% 0% 29% 96% 4%New Bedford Dialysis* 29 100% 0% 0% 0% n/a n/a n/a n/a n/a n/aNorth Adams Dialysis Suite of BMC*
39 100% 0% 0% 0% n/a n/a n/a n/a n/a n/a
17

Dialysis Facility Name # HCPs
Vaccine Coverage 2016-17
Vaccine Declined 2016-17
HCP w/ Medical Contra-
indication 2016-17
HCP w/ Unknown Vaccine Status
2016-17
Vaccine Coverage 2015-16
Vaccine Declined 2015-16
HCP w/ Medical Contra-
indication 2015-16
HCP w/ Unknown Vaccine Status
2015-16
Vaccine Coverage 2014-15
Vaccine Declined 2014-15
North Andover Renal Center*
38 91% 5% 5% 0% 92% 8% 0% 0% 87% 13%
North Suburban Dialysis Center*
55 94% 6% 0% 0% 94% 0% 0% 6% 100% 0%
Northeast Cambridge Dialysis
30 74% 3% 0% 23% n/a n/a n/a n/a 89% 11%
Northshore Regional Dialysis Center*
36 97% 3% 0% 0% 98% 2% 0% 0% 100% 0%
Norwood Dialysis Center 15 81% 19% 0% 0% n/a n/a n/a n/a n/a n/a
Nxstage Kidney Care Boston North*
10 94% 6% 0% 0% 80% 13% 0% 7% n/a n/a
Nxstage Kidney Care Boston South*
7 92% 8% 0% 0% 20% 50% 0% 30% n/a n/a
Palmer Dialysis Center* 13 100% 0% 0% 0% 100% 0% 0% 0% 90% 10%
PDI Fitchburg* 30 100% 0% 0% 0% n/a n/a n/a n/a n/a n/aPDI Worcester* 39 96% 0% 0% 4% n/a n/a n/a n/a 100% 0%Peabody Dialysis Center 41 76% 9% 0% 15% 89% 11% 0% 0% 94% 6%Physician’s Dialysis Fitchburg
n/a n/a n/a n/a n/a n/a n/a n/a n/a 100% 0%Pioneer Valley Dialysis* Center*
69 100% 0% 0% 0% 100% 0% 0% 0% 97% 3%Pure Life Renal of Stoughton
n/a n/a n/a n/a n/a n/a n/a n/a n/a n/a n/a
Quality Care Dialysis Weymouth
42 87% 13% 0% 0% 81% 19% 0% 0% 85% 15%
Salem Northeast Dialysis* 36 92% 0% 3% 5% n/a n/a n/a n/a n/a n/aSouth County Dialysis* 37 90% 3% 0% 7% 98% 2% 0% 0% 96% 4%
South Suburban Dialysis Center*
21 96% 4% 0% 0% 95% 5% 0% 0% 95% 5%
Taunton Healthcare Clinic, LLC*
34 95% 5% 0% 0% 87% 13% 0% 0% 67% 33%
The Dialysis Center at Waltham
n/a n/a n/a n/a n/a 91% 8.6% 4.3% n/a n/a n/a
The Kidney Center* 29 92% 8% 0% 0% 94% 6% 0% 0% 92% 8%
University Dialysis Center 48 85% 2% 0% 12% 77% 3% 0% 20% 100% 0%
18

Dialysis Facility Name # HCPs
Vaccine Coverage 2016-17
Vaccine Declined 2016-17
HCP w/ Medical Contra-
indication 2016-17
HCP w/ Unknown Vaccine Status
2016-17
Vaccine Coverage 2015-16
Vaccine Declined 2015-16
HCP w/ Medical Contra-
indication 2015-16
HCP w/ Unknown Vaccine Status
2015-16
Vaccine Coverage 2014-15
Vaccine Declined 2014-15
USRC Foxborough Dialysis 20 74% 9% 4% 13% n/a n/a n/a n/a n/a n/a
USRC Quincy Dialysis 40 73% 22% 4% 0% 78% 19% 3% 0% 93% 7%
USRC Weymouth Dialysis 16 70% 25% 5% 0% n/a n/a n/a n/a n/a n/a
Waltham Dialysis, LLC 17 85% 10% 5% 0% 87% 9% 4% 0% n/a n/a
Wellesley Dialysis LLC* 26 91% 9% 0% 0% 84% 16% 0% 0% 84% 16%
Wellington Circle Dialysis Center*
29 92% 8% 0% 0% n/a n/a n/a n/a n/a n/a
Western Mass Kidney Center - Springfield*
43 100% 0% 0% 0% 97% 3% 0% 0% 100% 0%
Westwood Dialysis 31 81% 2% 0% 17% 100% 0% 0% 0% 95% 5%Weymouth Dialysis 28 82% 6% 6% 6% n/a n/a n/a n/a n/a n/a
Woburn Dialysis* 17 100% 0% 0% 0% 100% 0% 0% 0% 100% 0%Yankee Family Dialysis* Center*
25 100% 0% 0% 0% 100% 0% 0% 0% 71% 29%
* Vaccination rate greater than 90% in 2016-17
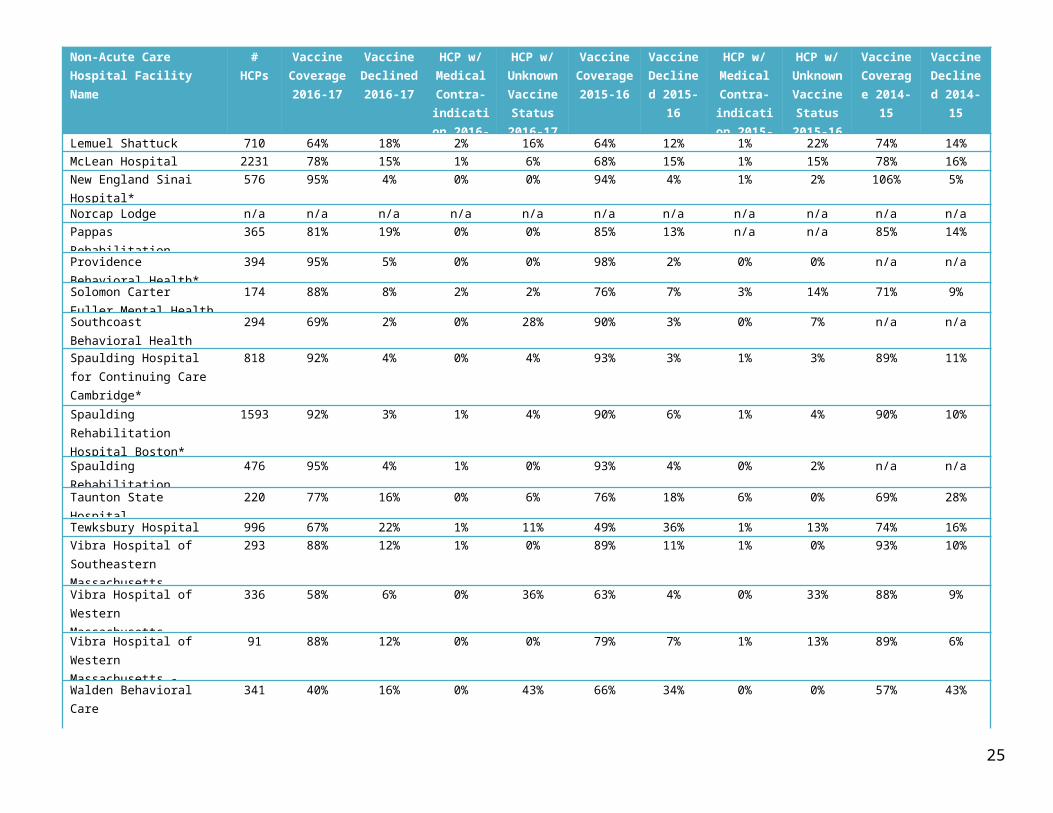
TABLE 10. 2014-2015 TO 2016-2017 HCP INFLUENZA VACCINATION AND DECLINATION AT MASSACHUSETTS NON-ACUTE CARE HOSPITALS
Non-Acute Care Hospital Facility Name
# HCPs
Vaccine Coverage 2016-17
Vaccine Declined 2016-17
HCP w/ Medical Contra-
indication 2016-17
HCP w/ Unknown Vaccine Status
2016-17
Vaccine Coverage 2015-16
Vaccine Declined 2015-16
HCP w/ Medical Contra-
indication 2015-16
HCP w/ Unknown Vaccine Status
2015-16
Vaccine Coverage 2014-15
Vaccine Declined 2014-15
Adcare Hospital of Worcester, Inc.*
511 91% 4% 1% 5% 88% 2% 3% 7% 112% 3%
Amesbury Health Center°° n/a n/a n/a n/a n/a n/a n/a n/a n/a n/a n/aArbour - HRI Hospital 182 88% 5% 4% 3% 49% 38% 5% 8% n/a n/aArbour Fuller Hospital 499 56% 24% 2% 18% 57% 19% 1% 23% 51% 23%Arbour Hospital 490 35% 52% 1% 11% 52% 35% 2% 11% n/a n/aBaldpate Hospital 90 86% 0% 1% 13% 94% 5% 1% 1% 41% 17%
19

Non-Acute Care Hospital Facility Name
# HCPs
Vaccine Coverage 2016-17
Vaccine Declined 2016-17
HCP w/ Medical Contra-
indication 2016-17
HCP w/ Unknown Vaccine Status
2016-17
Vaccine Coverage 2015-16
Vaccine Declined 2015-16
HCP w/ Medical Contra-
indication 2015-16
HCP w/ Unknown Vaccine Status
2015-16
Vaccine Coverage 2014-15
Vaccine Declined 2014-15
Bay Ridge Hospital 178 78% 22% 0% 0% 79% 19% 2% 0% n/a n/aBournewood Hospital 339 53% 45% 1% 0% 61% 38% 1% 0% 65% 32%Cape Cod & Islands Community Mental Health
127 69% 19% 1% 11% 73% 13% 5% 9% 78% 22%
Cura Boston* 170 93% 2% 0% 4% n/a n/a n/a n/a n/a n/a
Cura Peabody 128 80% 12% 0% 8% n/a n/a n/a n/a n/a n/a
Dr. John C. Corrigan Mental Health Center
153 68% 29% 0% 2% 65% 24% 0% 10% 54% 46%
Fairlawn Rehabilitation Hospital
410 87% 7% 2% 4% 85% 8% 3% 4% 82% 18%
Franciscan Children’s Hospital
n/a n/a n/a n/a n/a n/a n/a n/a n/a 96% 4%
HealthSouth Rehabilitation Hospital of Braintree*
484 92% 2% 1% 5% 87% 3% 1% 9% 104% 4%
HealthSouth Rehabilitation Hospital of New England*
474 95% 3% 0% 1% 91% 4% 0% 4% 85% 15%
HealthSouth Rehabilitation Hospital of Western Massachusetts*
242 97% 3% 0% 0% 82% 16% 0% 1% 83% 17%
Hebrew Rehabilitation Center at Dedham
n/a n/a n/a n/a n/a n/a n/a n/a n/a 89% 0%
Hebrew Rehabilitation Center at Roslindale*
1149 96% 2% 0% 2% 91% 0% 0% 8% 95% 1%
Highpoint Treatment Center n/a n/a n/a n/a n/a n/a n/a n/a n/a n/a n/aKindred Stoughton 267 77% 4% 1% 18% 69% 6% 0% 25% 85% 10%Lemuel Shattuck Hospital 710 64% 18% 2% 16% 64% 12% 1% 22% 74% 14%McLean Hospital 2231 78% 15% 1% 6% 68% 15% 1% 15% 78% 16%New England Sinai Hospital*
576 95% 4% 0% 0% 94% 4% 1% 2% 106% 5%
Norcap Lodge n/a n/a n/a n/a n/a n/a n/a n/a n/a n/a n/aPappas Rehabilitation Hospital for Children
365 81% 19% 0% 0% 85% 13% n/a n/a 85% 14%
20

Non-Acute Care Hospital Facility Name
# HCPs
Vaccine Coverage 2016-17
Vaccine Declined 2016-17
HCP w/ Medical Contra-
indication 2016-17
HCP w/ Unknown Vaccine Status
2016-17
Vaccine Coverage 2015-16
Vaccine Declined 2015-16
HCP w/ Medical Contra-
indication 2015-16
HCP w/ Unknown Vaccine Status
2015-16
Vaccine Coverage 2014-15
Vaccine Declined 2014-15
Providence Behavioral Health*
394 95% 5% 0% 0% 98% 2% 0% 0% n/a n/a
Solomon Carter Fuller Mental Health Center
174 88% 8% 2% 2% 76% 7% 3% 14% 71% 9%
Southcoast Behavioral Health
294 69% 2% 0% 28% 90% 3% 0% 7% n/a n/a
Spaulding Hospital for Continuing Care Cambridge*
818 92% 4% 0% 4% 93% 3% 1% 3% 89% 11%
Spaulding Rehabilitation Hospital Boston*
1593 92% 3% 1% 4% 90% 6% 1% 4% 90% 10%
Spaulding Rehabilitation Hospital Cape Cod*
476 95% 4% 1% 0% 93% 4% 0% 2% n/a n/a
Taunton State Hospital 220 77% 16% 0% 6% 76% 18% 6% 0% 69% 28%
Tewksbury Hospital 996 67% 22% 1% 11% 49% 36% 1% 13% 74% 16%Vibra Hospital of Southeastern Massachusetts
293 88% 12% 1% 0% 89% 11% 1% 0% 93% 10%
Vibra Hospital of Western Massachusetts
336 58% 6% 0% 36% 63% 4% 0% 33% 88% 9%
Vibra Hospital of Western Massachusetts - Central Campus
91 88% 12% 0% 0% 79% 7% 1% 13% 89% 6%
Walden Behavioral Care341 40% 16% 0% 43% 66% 34% 0% 0% 57% 43%
Western Massachusetts Hospital
291 75% 20% 2% 3% 65% 18% 5% 12% 76% 24%
Westwood Lodge Hospital 795 60% 24% 2% 14% 70% 24% 3% 3% 75% 25%
Whittier Pavilion* 277 96% 2% 0% 2% 95% 1% 0% 3% 91% 9%Whittier Rehabilitation Hospital
407 84% 8% 0% 8% 87% 6% 0% 7% 87% 10%
21

Non-Acute Care Hospital Facility Name
# HCPs
Vaccine Coverage 2016-17
Vaccine Declined 2016-17
HCP w/ Medical Contra-
indication 2016-17
HCP w/ Unknown Vaccine Status
2016-17
Vaccine Coverage 2015-16
Vaccine Declined 2015-16
HCP w/ Medical Contra-
indication 2015-16
HCP w/ Unknown Vaccine Status
2015-16
Vaccine Coverage 2014-15
Vaccine Declined 2014-15
Whittier Rehabilitation Hospital Bradford*
359 98% 1% 0% 1% 98% 1% 1% 0% 98% 2%
Worcester Recovery Center and Hospital
935 73% 19% 3% 5% 66% 17% 4% 12% 81% 19%
* Vaccination rate greater than 90% in 2016-17°° Data included in Anna Jaques acute care hospital report
TABLE 11. 2012-2013 TO 2016-2017 HCP INFLUENZA VACCINATION AND DECLINATION AT MASSACHUSETTS CLINICS
INCLUDES DATA SUBMITTED BY 6/14/17.
Clinic Facility Name
# HCPs (reported as of 12/31/16)
Vaccine Coverage 2016-17
Vaccine Declined 2016-17
Vaccine Coverage 2015-16
Vaccine Declined 2015-16
Vaccine Coverage 2014-15
Vaccine Declined 2014-15
Vaccine Coverage 2013-14
Vaccine Declined 2013-14
Vaccine Coverage 2012-13
Vaccine Declined 2012-13
"No Tooth Left Behind" Dental Clinic n/a n/a n/a 100% 0% n/a n/a n/a n/a n/a n/aA Dental Group LLC n/a n/a n/a 0% 100% n/a n/a n/a n/a n/a n/aActon BHC/Trauma Center 79 46% 49% n/a n/a n/a n/a n/a n/a n/a n/aAdvanced Eye Centers n/a n/a n/a n/a n/a n/a n/a 64% 36% n/a n/aAFC Doctors Express Urgent Care n/a n/a n/a 95% 5% n/a n/a n/a n/a n/a n/aAFC Urgent Care Bedford* 52 96% 4% n/a n/a n/a n/a n/a n/a n/a n/aAFC Urgent Care Burlington* 52 96% 4% n/a n/a n/a n/a n/a n/a n/a n/aAFC Urgent Care Stoneham* 52 96% 4% n/a n/a n/a n/a n/a n/a n/a n/aAFC Urgent Care Waltham* 52 96% 4% n/a n/a n/a n/a n/a n/a n/a n/aAgawam Counseling Center 10 20% 0% n/a n/a 50% 0% n/a n/a n/a n/aAlbert and Jessie Danielsen Institute at Boston University, The
33 70% 30% 79% 21% 54% 46% 66% 34% n/a n/a
Analgesic Solutions n/a n/a n/a n/a n/a n/a n/a 20% 80% 40% 60%Arbour HRI Hospital (dba Arbour Counseling Services Brookline)
n/a n/a n/a 40% 50% n/a n/a n/a n/a n/a n/a
Arlington Youth Counseling Center n/a n/a n/a n/a n/a 54% 46% 52% 48% 63% 37%Aurora Breast MRI of Beverly Hospital LLC
n/a n/a n/a n/a n/a n/a n/a 100% 0% 100% 0%
Aurora Breast MRI of Central MA, LLC n/a n/a n/a 50% 50% 50% 50% n/a 50% n/a n/aAurora Imaging Corp. 5 60% 40% 40% 60% 50% 50% n/a 50% 80% 20%
22

Clinic Facility Name
# HCPs (reported as of 12/31/16)
Vaccine Coverage 2016-17
Vaccine Declined 2016-17
Vaccine Coverage 2015-16
Vaccine Declined 2015-16
Vaccine Coverage 2014-15
Vaccine Declined 2014-15
Vaccine Coverage 2013-14
Vaccine Declined 2013-14
Vaccine Coverage 2012-13
Vaccine Declined 2012-13
BAMSI Adult Day Treatment Center n/a n/a n/a n/a n/a 100% 0% 100% 0% 50% 50%BAMSI Whitman Counseling Center n/a n/a n/a n/a n/a 42% 35% 55% 45% 50% 50%Bay Cove Human Services - Gill Clinic 6 83% 17% n/a n/a 89% 11% 71% 29% 73% 27%Bay Cove Human Services - Center House Day Treatment Program
6 50% 50% 33% 67% 50% 50% 67% 33% n/a n/a
Bay State Community Services n/a n/a n/a 18% 0% 20% 11% 58% 42% n/a n/aBay State Community Services - Norwood
2 0% 100% n/a n/a n/a n/a n/a n/a n/a n/a
Bay State Community Services - Plymouth
5 60% 40% n/a n/a n/a n/a n/a n/a n/a n/a
Bay State Community Services – Quincy
42 38% 62% n/a n/a n/a n/a n/a n/a n/a n/a
Baystate Franklin MRI Center* 9 100% 0% 100% 0% n/a n/a n/a n/a n/a n/aBaystate MRI & Imaging Center LLC 17 65% 35% 67% 33% n/a n/a n/a n/a n/a n/aBehavioral Nutrition, Inc. n/a n/a n/a 0% 100% n/a n/a n/a n/a n/a n/aBeverly Health Dept. Dental Clinic n/a n/a n/a 100% 0% n/a n/a n/a n/a n/a n/aBoston Breast Diagnostic Center, LLC. 7 57% 43% 67% 33% 71% 29% n/a 29% 50% 50%Boston Healthcare for the Homeless Program
504 83% 4% 84% 16% 93% 7% 79% 21% 70% 30%
Boston Institute for Psychotherapy, Inc.
n/a n/a n/a n/a n/a n/a n/a 29% 71% 36% 64%
Boston University Center for Anxiety and Related Disorders
83 69% 31% n/a n/a n/a n/a n/a n/a n/a n/a
Boston University Henry M. Goldman School of Dental Medicine
522 72% 24% 58% 14% 59% 10% 64% 15% 45% 14%
Boston University Occupational Health Center
n/a n/a n/a 75% 50% 100% 0% 100% 0% 85% 15%
Boston University Rehabilitation Services
50 48% 52% 59% 41% 56% 44% 56% 44% 70% 30%
Bridgewell Counseling Services - Chelmsford
24 63% 38% 36% 64% 60% 40% 90% 10% n/a n/a
Bridgewell Counseling Services – Lowell
32 38% 63% 56% 44% 75% 25% 50% 50% 73% 27%
Brien Center, The 136 55% 45% 50% 50% 54% 46% 53% 47% n/a n/aBrightside 47 74% 26% 78% 22% n/a n/a n/a n/a n/a n/aBrockton Area Multi-Services, Inc. n/a n/a n/a 63% 37% n/a n/a n/a n/a n/a n/a
23

Clinic Facility Name
# HCPs (reported as of 12/31/16)
Vaccine Coverage 2016-17
Vaccine Declined 2016-17
Vaccine Coverage 2015-16
Vaccine Declined 2015-16
Vaccine Coverage 2014-15
Vaccine Declined 2014-15
Vaccine Coverage 2013-14
Vaccine Declined 2013-14
Vaccine Coverage 2012-13
Vaccine Declined 2012-13
Brockton Neighborhood Health Center*
467 99% 8% 91% 9% 89% 11% 82% 18% 85% 15%
Brookline Community Mental Health Center
n/a n/a n/a 82% 18% n/a n/a n/a n/a n/a n/a
Cambridge Regional MRI Center 5 80% 20% 75% 25% n/a n/a n/a n/a n/a n/aCape Cod Hand Therapy 9 44% 56%Cape Cod PET-CT Services LLC* 7 100% 0% 80% 20% n/a n/a n/a n/a n/a n/aCare Net Pregnancy Resource Center of North Central MA, Inc.*
2 100% 0% 50% 50% 50% 50% 50% 50% 50% 50%
Carewell Urgent Care n/a n/a n/a 69% 31% n/a n/a n/a n/a n/a n/aCarewell Urgent Care - Cambridge Fresh Pond
7 86% 14% n/a n/a n/a n/a n/a n/a n/a n/a
Carewell Urgent Care - Cambridge Inman
14 79% 21% n/a n/a n/a n/a n/a n/a n/a n/a
Carewell Urgent Care - Framingham 9 89% 11% n/a n/a n/a n/a n/a n/a n/a n/aCarewell Urgent Care - Marlborough 8 88% 13% n/a n/a n/a n/a n/a n/a n/a n/aCarewell Urgent Care - Northborough 16 88% 13% n/a n/a n/a n/a n/a n/a n/a n/aCarewell Urgent Care - Peabody 14 86% 14% n/a n/a n/a n/a n/a n/a n/a n/aCarewell Urgent Care - Somerville* 10 100% 0% n/a n/a n/a n/a n/a n/a n/a n/aCarewell Urgent Care - Tewksbury 13 77% 23% n/a n/a n/a n/a n/a n/a n/a n/aCarewell Urgent Care - Worcester Greenwood*
11 91% 9% n/a n/a n/a n/a n/a n/a n/a n/a
Carewell Urgent Care - Worcester Lincoln
15 87% 13% n/a n/a n/a n/a n/a n/a n/a n/a
Carlson Recovery Center n/a n/a n/a n/a n/a 13% 0% n/a n/a n/a n/aCarson Center for Development - Springfield
15 20% 53% n/a n/a n/a n/a n/a n/a n/a n/a
Carson Center for Human Services Inc., Westfield
59 41% 8% n/a n/a n/a n/a 29% 24% 44% 31%
Casa Esperanza, Inc. n/a n/a n/a 81% 19% n/a n/a 9% 91% n/a n/aCatholic Charities/Fam C&G Ctr Danv n/a n/a n/a 72% 28% n/a n/a n/a n/a n/a n/aCenter for Anxiety and Related Disorders. Boston University
n/a n/a n/a 68% 32% n/a n/a 72% 28% n/a n/a
Center for Community Counseling & ED - Walpole
8 25% 50% n/a n/a n/a n/a n/a n/a n/a n/a
Center for Human Development 148 21% 41% 22% 40% 30% 43% 21% 21% n/a n/a
24
Clinic Facility Name
# HCPs (reported as of 12/31/16)
Vaccine Coverage 2016-17
Vaccine Declined 2016-17
Vaccine Coverage 2015-16
Vaccine Declined 2015-16
Vaccine Coverage 2014-15
Vaccine Declined 2014-15
Vaccine Coverage 2013-14
Vaccine Declined 2013-14
Vaccine Coverage 2012-13
Vaccine Declined 2012-13
Center for Psychological and Family Services, INC.
28 29% 71% 27% 73% 32% 68% 29% 71% 17% 83%
Central Massachusetts Comprehensive Cancer Center
n/a n/a n/a 60% 40% 67% 33% 65% 35% n/a n/a
Central Massachusetts Magnetic Imaging Center, Inc.
n/a n/a n/a n/a n/a n/a n/a 88% 12% 86% 14%
Charles River Community Health n/a n/a n/a 75% 25% n/a n/a n/a n/a n/a n/aChelmsford MRI, PC dba Center for Diagnostic Imaging Dedham
16 63% 38% 45% 55% 60% 40% 87% 13% 88% 12%
Chelmsford MRI, PC dba Center for Diagnostic Imaging Haverhill
3 67% 33% 100% 0% 50% 50% 67% 33% n/a n/a
Chelmsford MRI, PC dba Center for Diagnostic Imaging Peabody
n/a n/a n/a n/a n/a 58% 42% 40% 60% n/a n/a
Chelmsford MRI, PC dba Center for Diagnostic Imaging Springfield
21 38% 62% 35% 65% 52% 48% 42% 58% n/a n/a
Chelmsford MRI, PC dba Center for Diagnostic Imaging Woburn*
5 100% 0% 0% 100% 40% 60% 63% 38% n/a n/a
Child & Family Services of New Bedford
n/a n/a n/a n/a n/a n/a n/a 39% 61% 41% 51%
Child & Family Services, Inc. 448 23% 52% 32% 68% n/a n/a n/a n/a n/a n/aChild Guidance Clinic 142 23% 1% n/a n/a 25% 7% n/a n/a n/a n/aChildren's Friend and Family Services, Inc.
n/a n/a n/a n/a n/a 47% 49% 34% 64% 40% 60%
City Clinic 26 19% 0% n/a n/a 22% 11% n/a n/a n/a n/aCity Clinic at Holyoke Health Center 9 11% 0% n/a n/a n/a n/a n/a n/a n/a n/aClearWay Clinic 9 33% 67% 22% 78% 27% 73% 40% 60% n/a n/aClinical & Support Options, Inc. 322 26% 74% n/a n/a n/a n/a n/a n/a n/a n/aCommonwealth Newburyport Cancer Center
n/a n/a n/a 86% 14% n/a n/a n/a n/a n/a n/a
Community & Family Counseling Center
n/a n/a n/a n/a n/a n/a n/a 78% 22% 74% 26%
Community Counseling of Bristol County, Inc.
373 47% 53% n/a n/a n/a n/a 100% 0% 90% 10%
Community Counseling of Bristol County, Inc.
n/a n/a n/a n/a n/a 55% 45% 58% 42% 54% 46%
Community Counseling of Bristol County, Inc.
n/a n/a n/a n/a n/a 37% 63% 45% 55% 40% 60%
25

Clinic Facility Name
# HCPs (reported as of 12/31/16)
Vaccine Coverage 2016-17
Vaccine Declined 2016-17
Vaccine Coverage 2015-16
Vaccine Declined 2015-16
Vaccine Coverage 2014-15
Vaccine Declined 2014-15
Vaccine Coverage 2013-14
Vaccine Declined 2013-14
Vaccine Coverage 2012-13
Vaccine Declined 2012-13
Community Health Center of Cape Cod
167 62% 26% 69% 13% n/a n/a 62% 24% 52% 21%
Community Health Center of Franklin County
n/a n/a n/a n/a n/a 95% 5% 84% 16% 92% 8%
Community Health Connections, Inc. n/a n/a n/a 82% 19% n/a n/a n/a n/a n/a n/aCommunity Health Programs Inc. n/a n/a n/a 60% 40% 72% 28% 73% 27% 73% 27%Community Healthlink 1165 44% 56% 45% 55% 76% 24% 56% 44% 51% 28%Community Rehab Care 28 68% 0% 74% 26% 75% 25% 61% 39% 67% 33%Community Services Institute n/a n/a n/a n/a n/a 9% 91% 15% 85% 16% 83%Counseling & Assessment Clinic of Worcester, LLC.
n/a n/a n/a 46% 54% n/a n/a n/a n/a n/a n/a
Crossroads Agency n/a n/a n/a 46% 54% n/a n/a n/a n/a n/a n/aCutchins Programs for Children and Families
13 46% 38% n/a n/a n/a n/a n/a n/a n/a n/a
CVS Health Minute Clinic n/a n/a n/a n/a n/a 90% 10% 81% 13% n/a n/aDeerfield Academy 28 86% 14% 88% 12% 56% 44% 77% 19% 78% 22%DentaQuest Oral Health Center n/a n/a n/a 19% 81% n/a n/a n/a n/a n/a n/aDoctors Express Methuen n/a n/a n/a 100% 0% n/a n/a n/a n/a n/a n/aDoctors Express New Bedford n/a n/a n/a 64% 55% n/a n/a n/a n/a n/a n/aEasyCare Pharmacy n/a n/a n/a n/a n/a n/a n/a 97% 3% n/a n/aEdinburg Center Inc., The 31 77% 23% 67% 33% n/a n/a 48% 52% n/a n/aEdward M. Kennedy Community Health Center
n/a n/a n/a 94% 6% 86% 5% n/a n/a n/a n/a
Eliot Community Human Services 165 53% 47% n/a n/a n/a n/a n/a n/a n/a n/aEllsworth Child and Family Counseling Center
36 47% 53% n/a n/a n/a n/a 54% 46% n/a n/a
Endoscopy Center, The* 39 97% 3% n/a n/a n/a n/a n/a n/a n/a n/aFamily & Children's Service of Nantucket, Inc.
n/a n/a n/a 32% 68% n/a n/a n/a n/a n/a n/a
Family and Community Resources, Inc.
50 40% 44% 59% 41% 50% 50% 35% 65% 38% 41%
Family Continuity, Lawrence n/a n/a n/a 17% 100% n/a n/a n/a n/a n/a n/aFamily Health Center of Worcester n/a n/a n/a n/a n/a n/a n/a 63% 37% 83% 17%Family Health Services: Behavioral Health Clinic
36 42% 58% n/a n/a n/a n/a n/a n/a n/a n/a
Family Service Association/Behavioral Health Center
n/a n/a n/a 49% 51% n/a n/a n/a n/a n/a n/a
26

Clinic Facility Name
# HCPs (reported as of 12/31/16)
Vaccine Coverage 2016-17
Vaccine Declined 2016-17
Vaccine Coverage 2015-16
Vaccine Declined 2015-16
Vaccine Coverage 2014-15
Vaccine Declined 2014-15
Vaccine Coverage 2013-14
Vaccine Declined 2013-14
Vaccine Coverage 2012-13
Vaccine Declined 2012-13
Family Services of the Merrimack Valley
n/a n/a n/a n/a n/a n/a n/a 30% 70% n/a n/a
Forsyth Institute, Forsyth Faculty Associates Dental Clinic, The*
36 100% 0% 100% 0% 95% 5% 100% 0% 98% 2%
Gloucester Behavioral Health Satellite 31 45% 55% n/a n/a n/a n/a n/a n/a n/a n/aGosnold, Inc. 407 37% 42% 45% 55% n/a n/a n/a n/a n/a n/aGreater Lawrence Family Health Center*
626 96% 4% n/a n/a n/a n/a n/a n/a n/a n/a
Greater New Bedford Community Health Center, Inc.
n/a n/a n/a 97% 3% n/a n/a n/a n/a n/a n/a
Harbor Counseling Center n/a n/a n/a 0% 0% n/a n/a n/a n/a n/a n/aHarvard Dental Center 74 82% 18% 73% 27% 73% 27% 68% 32% 63% 33%Harvard University Health Services 340 83% 7% 75% 10% 71% 10% n/a n/a n/a n/aHarvard Vanguard Medical Associates (Atrius Health)
n/a n/a n/a n/a n/a n/a n/a 100% 0% n/a n/a
Harvard Vanguard Medical Associates (Atrius Health)
n/a n/a n/a n/a n/a n/a n/a 100% 0% n/a n/a
Harvard Vanguard Medical Associates (Atrius Health)
n/a n/a n/a n/a n/a n/a n/a 0% 100% n/a n/a
Harvard Vanguard Medical Associates (Atrius Health)
n/a n/a n/a n/a n/a n/a n/a 100% 0% n/a n/a
Harvard Vanguard Medical Associates (Atrius Health)
n/a n/a n/a n/a n/a n/a n/a 98% 2% n/a n/a
Harvard Vanguard Medical Associates (Atrius Health)
n/a n/a n/a n/a n/a n/a n/a 96% 4% n/a n/a
Harvard Vanguard Medical Associates (Atrius Health)
n/a n/a n/a n/a n/a n/a n/a 98% 2% n/a n/a
Harvard Vanguard Medical Associates B&W Hosp (Atrius Health)
n/a n/a n/a n/a n/a n/a n/a 100% 0% n/a n/a
Harvard Vanguard Medical Associates Beverly (Atrius Health)
n/a n/a n/a n/a n/a n/a n/a 100% 0% n/a n/a
Harvard Vanguard Medical Associates Braintree (Atrius Health)
n/a n/a n/a n/a n/a n/a n/a 98% 2% 98% 2%
Harvard Vanguard Medical Associates Burlington (Atrius Health)
n/a n/a n/a n/a n/a n/a n/a 99% 1% 97% 3%
Harvard Vanguard Medical Associates Cambridge (Atrius Health)
n/a n/a n/a n/a n/a n/a n/a 99% 1% 99% 1%
27

Clinic Facility Name
# HCPs (reported as of 12/31/16)
Vaccine Coverage 2016-17
Vaccine Declined 2016-17
Vaccine Coverage 2015-16
Vaccine Declined 2015-16
Vaccine Coverage 2014-15
Vaccine Declined 2014-15
Vaccine Coverage 2013-14
Vaccine Declined 2013-14
Vaccine Coverage 2012-13
Vaccine Declined 2012-13
Harvard Vanguard Medical Associates Chelmsford (Atrius Health)
n/a n/a n/a n/a n/a n/a n/a 99% 1% 97% 3%
Harvard Vanguard Medical Associates Children's Hosp(Atrius Health)
n/a n/a n/a n/a n/a n/a n/a 100% 0% n/a n/a
Harvard Vanguard Medical Associates Concord - Harvard (Atrius Health)
n/a n/a n/a n/a n/a n/a n/a 100% 0% 100% 0%
Harvard Vanguard Medical Associates Concord - Hillside (Atrius Health)
n/a n/a n/a n/a n/a n/a n/a 99% 1% 98% 2%
Harvard Vanguard Medical Associates Copley (Atrius Health)
n/a n/a n/a n/a n/a n/a n/a 100% 0% 99% 1%
Harvard Vanguard Medical Associates Kenmore(Atrius Health)
n/a n/a n/a n/a n/a n/a n/a 98% 2% 96% 4%
Harvard Vanguard Medical Associates Medford (Atrius Health)
n/a n/a n/a n/a n/a n/a n/a 98% 2% 99% 1%
Harvard Vanguard Medical Associates Peabody (Atrius Health)
n/a n/a n/a n/a n/a n/a n/a 98% 2% 98% 2%
Harvard Vanguard Medical Associates Post Office Square (Atrius Health)
n/a n/a n/a n/a n/a n/a n/a 100% 0% 100% 0%
Harvard Vanguard Medical Associates Quincy (Atrius Health)
n/a n/a n/a n/a n/a n/a n/a 99% 1% 98% 2%
Harvard Vanguard Medical Associates Somerville (Atrius Health)
n/a n/a n/a n/a n/a n/a n/a 99% 1% 100% 0%
Harvard Vanguard Medical Associates Watertown (Atrius Health)
n/a n/a n/a n/a n/a n/a n/a 97% 3% 97% 3%
Harvard Vanguard Medical Associates Wellesley(Atrius Health)
n/a n/a n/a n/a n/a n/a n/a 99% 1% 99% 1%
Harvard Vanguard Medical Associates West Roxbury (Atrius Health)
n/a n/a n/a n/a n/a n/a n/a 98% 2% 98% 2%
HealthFirst Family Care Center 122 62% 38% 59% 36% 55% 20% 74% 26% 71% 25%Healthquarters, Inc* 21 95% 5%Hillcrest Dental Care Inc. 29 41% 59% n/a n/a 25% 75% 25% 75% 61% 39%Hilltown Community Health Centers n/a n/a n/a 65% 35% n/a n/a n/a n/a n/a n/aHMR Program for Weight Management - HVMA Kenmore, The*
5 100% 0% 100% 0% n/a n/a n/a n/a n/a n/a
Holyoke Health Center 318 81% 19% 82% 18% 84% 16% 82% 22% 77% 23%Hope Center, The n/a n/a n/a n/a n/a 16% 0% n/a n/a n/a n/aInstitute for Health and Recovery n/a n/a n/a 46% 54% n/a n/a n/a n/a n/a n/a
28

Clinic Facility Name
# HCPs (reported as of 12/31/16)
Vaccine Coverage 2016-17
Vaccine Declined 2016-17
Vaccine Coverage 2015-16
Vaccine Declined 2015-16
Vaccine Coverage 2014-15
Vaccine Declined 2014-15
Vaccine Coverage 2013-14
Vaccine Declined 2013-14
Vaccine Coverage 2012-13
Vaccine Declined 2012-13
Joseph M. Smith Community Health Center
n/a n/a n/a n/a n/a 58% 42% 80% 20% 80% 9%
Joslin Diabetes Center n/a n/a n/a 59% 10% 81% 19% 84% 16% 84% 16%Key Program, Inc. 97 18% 82% 18% 82% 28% 72% 35% 65% 19% 75%Lawrence Behavioral Health Satellite 61 25% 77% n/a n/a n/a n/a n/a n/a n/a n/aLBD Counseling & Consulting Clinic n/a n/a n/a n/a n/a n/a n/a n/a n/a n/a n/aLiberty St. Mental Health Clinic 39 26% 5% n/a n/a 26% 2% n/a n/a n/a n/aLife Line Screening n/a n/a n/a n/a n/a 55% 45% n/a n/a n/a n/aLiving Water Counseling Center n/a n/a n/a 58% 42% n/a n/a n/a n/a n/a n/aLowell Community Health Center* 392 90% 10% n/a n/a 92% 8% n/a 18% 77% 23%LUK Behavioral Health Clinic 77 18% 44% n/a n/a 29% 71% 28% 61% 22% 33%Luminosity Behavioral Health n/a n/a n/a n/a n/a n/a n/a 83% 17% 52% 48%Lynn Behavioral Health Satellite 67 45% 55% n/a n/a n/a n/a n/a n/a n/a n/aLynn Community Health Center 600 49% 3% 96% 4% 81% 7% 91% 4% 80% 11%Manet Community Health Center n/a n/a n/a n/a n/a n/a n/a 68% 39% n/a n/aMarblehead Counseling Center 17 65% 35% 56% 44% n/a n/a n/a n/a n/a n/aMarino Center for Integrative Health* 43 98% 2% 78% 15% n/a n/a n/a n/a n/a n/aMay Behavioral Health Walpole n/a n/a n/a n/a n/a n/a n/a 50% 50% 82% 18%May Behavioral Health West Roxbury n/a n/a n/a n/a n/a n/a n/a 84% 16% 82% 18%MCPHS University (Massachusetts College of Pharmacy & Health Sciences) Esther M. Wilkins Dental Hygiene Clinic*
192 90% 10% 93% 7% 93% 7% 89% 11% n/a n/a
MedExpress Chicopee, MA 16 81% 19% n/a n/a n/a n/a n/a n/a n/a n/aMedExpress Pittsfield, MA Satellite* 11 100% 0% n/a n/a n/a n/a n/a n/a n/a n/aMedExpress Springfield - Cooley St., MA
14 71% 29% n/a n/a n/a n/a n/a n/a n/a n/a
MedExpress Springfield-Boston Rd Satellite
12 75% 25% n/a n/a n/a n/a n/a n/a n/a n/a
Medexpress urgent care 13 69% 31% n/a n/a n/a n/a n/a n/a n/a n/aMedExpress Westfield, MA Satellite 13 62% 38% n/a n/a n/a n/a n/a n/a n/a n/aMedical Diagnostics and Rehabilitation, LLC
n/a n/a n/a 23% 68% n/a n/a n/a n/a n/a n/a
Mental Health Association of Greater Lowell, Inc.
n/a n/a n/a 76% 24% n/a n/a n/a n/a n/a n/a
Metro West MRI n/a n/a n/a 100% 0% n/a n/a n/a n/a n/a n/a
29

Clinic Facility Name
# HCPs (reported as of 12/31/16)
Vaccine Coverage 2016-17
Vaccine Declined 2016-17
Vaccine Coverage 2015-16
Vaccine Declined 2015-16
Vaccine Coverage 2014-15
Vaccine Declined 2014-15
Vaccine Coverage 2013-14
Vaccine Declined 2013-14
Vaccine Coverage 2012-13
Vaccine Declined 2012-13
MIT Medical 344 87% 10% 88% 11% 91% 7% 88% 9% n/a n/aMount Ida College 14 79% 21% 80% 20% 87% 13% n/a 21% 77% 23%Mount Tom Mental Health Clinic 40 30% 8% n/a n/a 28% 0% n/a n/a n/a n/aMulticultural Wellness Center 62 24% 76% n/a n/a n/a n/a n/a n/a n/a n/aMVCS Island Counseling Center 42 43% 57% n/a n/a n/a n/a n/a n/a n/a n/aNE Clinics of Reproductive Medicine 67 66% 34% n/a n/a 70% 30% n/a n/a n/a n/aNew Beginnings Wellness Center n/a n/a n/a 29% 71% n/a n/a n/a n/a n/a n/aNFI MA, Inc. 30 17% 83% 46% 54% n/a n/a n/a n/a n/a n/aNorth Shore P.E.T. Imaging Center, LLC
n/a n/a n/a n/a n/a n/a n/a 71% 29% 67% 33%
North Suffolk Mental Health Association
1001 32% 32% 24% 22% 40% 36% 34% 32% n/a n/a
Northeast Behavioral Associates n/a n/a n/a 75% 25% n/a n/a n/a n/a n/a n/aNortheast Rehab Hospital- Lawrence I n/a n/a n/a n/a n/a n/a n/a 82% 18% 86% 14%Northeast Rehab Hospital Outpatient CT-Riverwalk*
14 100% 0% 100% 0% 100% 0% 71% 29% 75% 25%
Northeast Rehab Hospital- Stoneham n/a n/a n/a n/a n/a n/a n/a 100% 0% 100% 0%Northeast Rehab Hospital: North Andover Hand Clinic*
2 100% 0% n/a n/a n/a n/a 50% 50% 50% 50%
Northeast Rehab Outpatient Center-Andover*
7 100% 0% 100% 0% 100% 0% 89% 11% 64% 36%
Northeast Rehab Outpatient Center-Billerica*
6 100% 0% 100% 0% 120% 0% 100% 0% 50% 50%
Northeast Rehab Outpatient Center-Cedarvale*
15 100% 0% 100% 0% 90% 0% 100% 15% 53% 47%
Northeast Rehab Outpatient Center-Chelmsford*
8 100% 0% 93% 7% 111% 0% 67% 33% 38% 63%
Northeast Rehab Outpatient Center-Chestnut Green*
9 100% 0% 100% 0% 88% 0% 100% 0% 88% 13%
Northeast Rehab Outpatient Center-Gloucester*
1 100% 0% 100% 0% 100% 0% 100% 50% 0% 100%
Northeast Rehab Outpatient Center-Lawrence Amesbury*
21 100% 0% 100% 0% 100% 0% 75% 31% 46% 54%
Northeast Rehab Outpatient Center-Lowell Bridge*
20 100% 5% 100% 0% 107% 0% 88% 31% 39% 61%
Northeast Rehab Outpatient Center-Lowell George*
15 100% 7% 100% 0% 106% 0% 100% 6% 47% 53%
30

Clinic Facility Name
# HCPs (reported as of 12/31/16)
Vaccine Coverage 2016-17
Vaccine Declined 2016-17
Vaccine Coverage 2015-16
Vaccine Declined 2015-16
Vaccine Coverage 2014-15
Vaccine Declined 2014-15
Vaccine Coverage 2013-14
Vaccine Declined 2013-14
Vaccine Coverage 2012-13
Vaccine Declined 2012-13
Northeast Rehab Outpatient Center-Methuen*
15 100% 0% 100% 0% 100% 0% 100% 0% n/a n/a
Northeast Rehab Outpatient Center-Newburyport*
5 100% 0% 100% 0% 100% 0% 80% 20% 80% 20%
Northeast Rehab Outpatient Center-North Andover
25 80% 4% 100% 0% 100% 0% 100% 0% 60% 40%
Northeast Rehab Outpatient Center-PMB*
10 100% 10% 100% 0% 114% 0% 100% 13% 20% 80%
Northeast Rehab Outpatient Center-Tewksbury*
8 100% 0% 100% 0% 100% 0% n/a n/a n/a n/a
Osiris Family Institute n/a n/a n/a 40% 60% n/a n/a n/a n/a n/a n/aOuter Cape Health Services n/a n/a n/a n/a n/a 100% 18% 79% 21% n/a n/aPartners Urgent Care - Brookline n/a n/a n/a 100% 0% n/a n/a n/a n/a n/a n/aPeabody Imaging 11 55% 45% 57% 43% n/a n/a n/a n/a n/a n/aPeople Care Clinic n/a n/a n/a 63% 38% n/a n/a n/a n/a n/a n/aPET/CT Services by Tufts MC & SHIELDS*
10 100% 0% 92% 8% n/a n/a n/a n/a n/a n/a
Planned Parenthood League of Massachusetts
225 56% 24% 62% 18% 64% 21% 72% 23% 61% 18%
Priority Professional Care n/a n/a n/a n/a n/a n/a n/a 52% 48% 87% 13%Programs For People, Inc. n/a n/a n/a 55% 45% n/a n/a n/a n/a n/a n/aProject COPE 9 22% 78% 30% 70% 57% 43% n/a n/a n/a n/aRadiation Therapy Services at Central Massachusetts Cancer Center
14 64% 36% n/a n/a n/a n/a n/a n/a n/a n/a
Reliant Medical Group n/a n/a n/a n/a n/a 93% 7% 92% 8% 91% 9%Riverside Community Care 343 36% 25% 34% 23% 36% 17% 61% 32% n/a n/aRobert and Susan smith Family Foundation Dental Clinic
n/a n/a n/a 100% 0% n/a n/a n/a n/a n/a n/a
Rokous Clinic* 2 100% 0% 100% 0% n/a n/a n/a n/a n/a n/aSalem Behavioral Health Satellite 63 5% 62% n/a n/a n/a n/a n/a n/a n/a n/aSE Behavioral Health Satellite 14 57% 43% n/a n/a n/a n/a n/a n/a n/a n/aSEMT/PACT n/a n/a n/a 83% 58% n/a n/a n/a n/a n/a n/aSHIELDS MRI @UMASS MEM-MEMORIAL CMP
10 60% 40% n/a n/a n/a n/a n/a n/a n/a n/a
SHIELD MRI @UMASS MEM-UNIVERSITY CM*
28 96% 4% n/a n/a n/a n/a n/a n/a n/a n/a
SHIELDS MRI AT ST. LUKES'S* 12 100% 0% n/a n/a n/a n/a n/a n/a n/a n/a
31

Clinic Facility Name
# HCPs (reported as of 12/31/16)
Vaccine Coverage 2016-17
Vaccine Declined 2016-17
Vaccine Coverage 2015-16
Vaccine Declined 2015-16
Vaccine Coverage 2014-15
Vaccine Declined 2014-15
Vaccine Coverage 2013-14
Vaccine Declined 2013-14
Vaccine Coverage 2012-13
Vaccine Declined 2012-13
SHIELDS Fall River - N Bedford Rgn MRI
15 73% 27% 88% 13% n/a n/a n/a n/a n/a n/a
Shields Health Care Group n/a n/a n/a 93% 7% n/a n/a n/a n/a n/a n/aSHIELDS IMAGING DEDHAM 6 83% 17%SHIELDS Imaging of Eastern Mass LLC 9 89% 11% 88% 13% n/a n/a n/a n/a n/a n/aSHIELDS Imaging of Lowell Gen Hospital*
3 100% 0% 100% 0% n/a n/a n/a n/a n/a n/a
SHIELDS Imaging of Lowell Gen Hospital*
32 100% 0% n/a n/a n/a n/a n/a n/a n/a n/a
SHIELDS MRI & Imaging Ctr-Cape Cod*
10 100% 10% 82% 18% n/a n/a n/a n/a n/a n/a
SHIELDS MRI Boston 5 60% 40% 86% 14% n/a n/a n/a n/a n/a n/aSHIELDS MRI of Brockton 19 68% 32% 78% 22% n/a n/a n/a n/a n/a n/aSHIELDS MRI of Framingham* 11 91% 9% 118% 18% n/a n/a n/a n/a n/a n/aSHIELDS MRI Weymouth 14 71% 29% 69% 31% n/a n/a n/a n/a n/a n/aSloan Clinic n/a n/a n/a n/a n/a 50% 0% n/a n/a n/a n/aSmoc Behavioral Healthcare Framingham
63 48% 52% 50% 50% 41% 59% 48% 52% 76% 24%
Smoc Behavioral Healthcare Marlborough
21 10% 90% 36% 64% 22% 78% 29% 71% 26% 74%
SNE Behavioral Health Satellite 22 77% 32% n/a n/a n/a n/a n/a n/a n/a n/aSouth Cove Community Health Center n/a n/a n/a 81% 19% n/a n/a n/a n/a n/a n/aSouth Shore Mental Health 189 60% 31% n/a n/a n/a n/a n/a n/a n/a n/aSovner Center 30 37% 63% 41% 59% 20% 80% 46% 54% 47% 53%SSTAR Family Health Center 395 54% 46% n/a n/a n/a n/a n/a n/a n/a n/aSSTAR's Southend Services (satellite site) Stanley Street
n/a n/a n/a 36% 64% 85% 15% n/a n/a n/a n/a
St. Ann's Home Mental Health Clinic 28 57% 43% 44% 56% n/a n/a n/a n/a n/a n/aSt. Vincent's Home 17 41% 59% 32% 68% 44% 56% 53% 47% 85% 15%Stanley Street Treatment & Resources n/a n/a n/a 38% 62% 52% 48% 63% 37% 62% 38%Steppingstone, Inc. n/a n/a n/a 14% 86% n/a n/a n/a n/a n/a n/aStrattus TILL's Mental Health Center 20 70% 30% n/a n/a n/a n/a n/a n/a n/a n/aTapestry Health n/a n/a n/a 70% 30% n/a n/a n/a n/a n/a n/aTranscare Mobile Health Services n/a n/a n/a n/a n/a 75% 25% n/a n/a n/a n/aTrauma to Wellness n/a n/a n/a 67% 33% n/a n/a n/a n/a n/a n/a
32

Clinic Facility Name
# HCPs (reported as of 12/31/16)
Vaccine Coverage 2016-17
Vaccine Declined 2016-17
Vaccine Coverage 2015-16
Vaccine Declined 2015-16
Vaccine Coverage 2014-15
Vaccine Declined 2014-15
Vaccine Coverage 2013-14
Vaccine Declined 2013-14
Vaccine Coverage 2012-13
Vaccine Declined 2012-13
UMASS MEM HLTH ALLIANCE MRI CENTER
6 50% 50% 33% 67% n/a n/a n/a n/a n/a n/a
UMASS Memorial MRI & Imaging Ctr LLC
26 69% 31% 81% 19% n/a n/a n/a n/a n/a n/a
UMASS Memorial MRI-Marlborough LLC*
11 100% 0% 82% 18% n/a n/a n/a n/a n/a n/a
Upham's Corner Health Center 221 64% 36% 70% 30% 68% 29% 70% 24% 76% 20%Valley Human Services – Ware 38 34% 8% n/a n/a n/a n/a n/a n/a n/a n/aWalden Behavioral Care n/a n/a n/a 52% 48% n/a n/a n/a n/a n/a n/aWalden Behavioral Care-Amherst 13 23% 8% n/a n/a n/a n/a n/a n/a n/a n/aWalden Behavioral Care-Braintree 10 40% 20% n/a n/a 90% 10% n/a n/a n/a n/aWalden Behavioral Care-Northam n/a n/a n/a n/a n/a 44% 56% n/a n/a n/a n/aWalden Behavioral Care-Peabody 15 33% 20% n/a n/a 82% 18% n/a n/a n/a n/aWalden Behavioral Care-Waltham 262 42% 12% n/a n/a n/a n/a n/a n/a n/a n/aWalden Behavioral Care-Worcester 12 50% 33% n/a n/a 58% 42% n/a n/a n/a n/aWest Central Family and Counseling, LTD
n/a n/a n/a n/a n/a 53% 47% 42% 58% 50% 50%
Whitman Counseling Center 44 48% 52% n/a n/a n/a n/a n/a n/a n/a n/aWinchester Hosp Radiation Oncology Center*
10 100% 0% 91% 9% n/a n/a n/a n/a n/a n/a
Winchester Hospital/SHIELDS MRI* 22 100% 5% 100% 0% n/a n/a n/a n/a n/a n/aY.O.U. Inc. Family Center - Southbridge
8 25% 75% n/a n/a n/a n/a n/a n/a n/a n/a
Y.O.U. Inc. Family Center - Worcester 45 51% 49% n/a n/a n/a n/a n/a n/a n/a n/aY.O.U. Inc. Family Center Gardner 20 55% 45% n/a n/a n/a n/a n/a n/a n/a n/a
*Vaccination rate greater than 90% in 2016-17
TABLE 12. 2012-2013 TO 2016-2017 HCP INFLUENZA VACCINATION AND DECLINATION AT MASSACHUSETTS NURSING HOMES
INCLUDES DATA SUBMITTED BY 6/14/17.
33

Nursing Home Facility Name
# HCPs (reported as of 12/31/16)
Vaccine Coverage 2016-17
Vaccine Declined 2016-17
Vaccine Coverage 2015-16
Vaccine Declined 2015-16
Vaccine Coverage 2014-15
Vaccine Declined 2014-15
Vaccine Coverage 2013-14
Vaccine Declined 2013-14
Vaccine Coverage 2012-13
Vaccine Declined 2012-13
Abbott House* 101 93% 7% 90% 10% 88% 12% 84% 16% 81% 19%Aberjona Nursing Center* 228 98% 2% 98% 2% 91% 9% 71% 29% 68% 32%Academy Manor Nursing Home* 189 94% 6% 86% 7% 89% 8% 33% 24% 32% 50%Adams House, Home for Aged People 74 54% 46% 59% 41% 54% 46% n/a n/a n/a n/aAlden Court Nursing Care and Rehabilitation Center 255 48% 52% 41% 59% 49% 39% n/a n/a n/a n/a
Alliance Healthcare Center at Braintree* 143 95% 5% 87% 13% 89% 11% 91% 9% 92% 8%Apple Valley Center n/a n/a n/a 97% 8% 88% 7% n/a n/a n/a n/aArmenian Nursing and Rehabilitation Center, Inc.* 119 100% 0% 99% 1% 100% 0% 102% 2% 125% 3%
Arnold House Nursing Home* 44 100% 0% 98% 2% 92% 8% 72% 28% 64% 36%Baker-Katz Skilled Nursing and Rehabilitation Center 97 62% 45% 89% 11% 92% 9% 70% 30% 46% 60%
Baldwinville Skilled Nursing and Rehabilitation Center 140 73% 12% 94% 15% 86% 14% 93% 7% 90% 10%
Bay Path Nursing and Rehabilitation 167 73% 37% 66% 34% 64% 36% 61% 39% 61% 46%Baypointe Rehabilitation and Skilled Care Center* 237 92% 8% n/a n/a 91% 9% 100% 5% 94% 9%
Bear Hill Rehab and Nursing Center* 220 98% 2% 97% 3% 97% 3% 99% 1% 82% 18%Beaumont Rehab. & Skilled Nursing Center 290 77% 23% 82% 18% n/a n/a n/a n/a n/a n/aBeaumont Rehabilitation and Skilled Care Center, University Campus of Worcester 200 75% 5% n/a n/a 83% 17% 87% 8% n/a n/a
Beaumont Rehabilitation and Skilled Nursing Center Natick 103 74% 26% 79% 26% 73% 27% 79% 21% 75% 23%
Beaumont Skilled Rehab and Nursing Northborough 151 71% 29% 62% 20% n/a n/a n/a n/a n/a n/a
Bedford Gardens Care and Rehab Center 122 71% 19% n/a n/a n/a n/a n/a n/a n/a n/aBedford Village Nursing Home 75 32% 68% 58% 42% 33% 67% n/a n/a n/a n/aBelmont Manor Nursing Center 191 83% 17% 81% 19% 84% 16% 75% 19% 73% 27%Benjamin Healthcare 207 72% 28% 62% 38% 66% 34% 69% 31% 62% 31%Berkeley Nursing and Retirement Center 62 56% 21% 74% 26% 78% 22% 76% 24% 76% 24%Berkshire Healthcare Center 80 76% 24% 70% 30% 50% 50% 76% 24% 81% 19%Berkshire Place 98 54% 46% 51% 49% 25% 75% 65% 35% 17% 83%Bethany Healthcare* 212 98% 2% 97% 3% 95% 2% 94% 9% 97% 7%
34

Nursing Home Facility Name
# HCPs (reported as of 12/31/16)
Vaccine Coverage 2016-17
Vaccine Declined 2016-17
Vaccine Coverage 2015-16
Vaccine Declined 2015-16
Vaccine Coverage 2014-15
Vaccine Declined 2014-15
Vaccine Coverage 2013-14
Vaccine Declined 2013-14
Vaccine Coverage 2012-13
Vaccine Declined 2012-13
Birch Manor Rehabilitation and Skilled Nursing Center n/a n/a n/a 39% 16% 39% 13% 40% 56% 55% 45%
Blackstone Nursing and Rehabilitation 32 66% 31% 54% 46% 67% 33% n/a n/a n/a n/aBlaire House Milford* 82 91% 9% 94% 6% 100% 0% 98% 3% 99% 1%Blaire House of Tewksbury* 137 92% 8% 91% 9% 90% 10% 84% 16% n/a n/aBlaire House of Worcester* 108 134% 6% 95% 5% 99% 1% 100% 0% n/a n/aBlue Hills Health and Rehabilitation Center 98 63% 37% 54% 23% 78% 22% 77% 23% 26% 74%Blueberry Hill Rehabilitation 88 66% 34% 37% 63% 69% 31% n/a n/a n/a n/aBoston Home, The* 220 96% 4% 97% 3% 96% 4% 97% 3% 97% 3%Bostonian Nursing Care and Rehabilitation Center, The 148 68% 32% 43% 57% 77% 23% 78% 22% 67% 33%
Bourne Manor Extended Care Facility 132 75% 35% n/a n/a 61% 40% 67% 31% 71% 29%Braemoor Health Center 107 65% 35% 32% 8% 59% 41% n/a n/a n/a n/aBrandon Woods of Dartmouth* 201 121% 3% 97% 3% 94% 6% 99% 1% 96% 17%Brandon Woods of New Bedford 109 47% 53% n/a n/a 97% 3% 97% 3% 97% 3%Brentwood Rehab and Healthcare Ctre.* 156 100% 0% 57% 43% 51% 49% 49% 51% n/a n/aBriarwood Healthcare 166 87% 15% 97% 9% 55% 45% 87% 13% 89% 16%Bridgewater Nursing and Skilled Rehabilitation Center* 39 100% 0% 95% 5% 80% 17% 73% 27% 61% 39%
Brigham Health and Rehabilitation* 83 99% 1% 97% 3% 103% 12% n/a n/a n/a n/aBrighton House Rehabilitation and Nursing Center 112 54% 46% 71% 29% 81% 19% 69% 31% 65% 35%
Brockton Health Center 109 30% 43% 51% 49% 68% 32% 62% 38% 52% 48%Brookhaven at Lexington 53 64% 36% 84% 16% 96% 4% 93% 7% n/a n/aBrookline Health Care n/a n/a n/a n/a n/a 76% 30% 46% 54% 59% 41%Brooksby Village 306 60% 40% 74% 26% 65% 35% 51% 49% n/a n/aBrookside Rehabilitation and Healthcare Center 83 47% 53% 73% 27% 79% 20% n/a n/a n/a n/a
Brudnick Centers for Living - Jewish Rehab Ctr for the Aged of the North Shore 316 54% 46% 64% 23% n/a n/a n/a n/a n/a n/a
Buckley Healthcare 145 88% 32% 78% 29% 84% 28% 93% 31% n/a n/aCalvin Coolidge Nursing and Rehabilitation Center for Northampton n/a n/a n/a n/a n/a 54% 45% n/a n/a n/a n/a
Cambridge Rehab and Nursing Center 88 58% 42% n/a n/a n/a n/a n/a n/a n/a n/a
35

Nursing Home Facility Name
# HCPs (reported as of 12/31/16)
Vaccine Coverage 2016-17
Vaccine Declined 2016-17
Vaccine Coverage 2015-16
Vaccine Declined 2015-16
Vaccine Coverage 2014-15
Vaccine Declined 2014-15
Vaccine Coverage 2013-14
Vaccine Declined 2013-14
Vaccine Coverage 2012-13
Vaccine Declined 2012-13
Campion Health Center* 108 96% 4% 98% 2% 100% 0% 99% 1% 96% 4%Cape Heritage Rehabilitation and Healthcare Center 143 52% 42% 53% 36% 63% 37% 61% 39% 69% 31%
Cape Regency 143 72% 28% 73% 41% 88% 41% 52% 42% 37% 28%Cardigan Nursing and Rehabilitation Center 83 82% 18% 64% 36% 64% 36% 78% 22% 60% 40%
Care One at Millbury 198 84% 12% 75% 25% n/a n/a n/a n/a n/a n/aCare One at Northampton n/a n/a n/a 44% 56% n/a n/a n/a n/a n/a n/aCare One at Peabody n/a n/a n/a 72% 34% n/a n/a n/a n/a n/a n/aCare One at Redstone 271 32% 68% 47% 53% n/a n/a n/a n/a n/a n/aCare One at Weymouth* 151 91% 9% 22% 79% n/a n/a n/a n/a n/a n/aCare One at Wilmington 180 44% 56% 77% 23% n/a n/a n/a n/a n/a n/aCare One- Brookline* 128 104% 53% 42% 58% n/a n/a n/a n/a n/a n/aCare One@ Holyoke 344 54% 46% 64% 36% n/a n/a n/a n/a n/a n/aCareOne at Essex Park 205 17% 17% 48% 50% n/a n/a n/a n/a n/a n/aCareOne at Lexington 176 70% 30% 69% 31% n/a n/a n/a n/a n/a n/aCareOne at New Bedford 178 58% 42% n/a n/a n/a n/a n/a n/a n/a n/aCareOne at Newton 120 72% 28% n/a n/a n/a n/a n/a n/a n/a n/aCareOne at Randolph 201 33% 37% 59% 40% n/a n/a n/a n/a n/a n/aCarleton-Willard Village 350 55% 22% 58% 22% 60% 21% 55% 20% n/a n/aCarlyle House 86 50% 50% 63% 38% 49% 51% 57% 43% 61% 45%Catholic Memorial Home 368 80% 20% 80% 20% 60% 40% 71% 29% 64% 36%Cedar View Rehab 102 88% 12% n/a n/a n/a n/a n/a n/a n/a n/aCenter for Extended Care at Amherst 168 58% 36% 64% 24% 66% 32% 57% 40% 66% 32%Champion Health Care 109 30% 43%Chapin Center 121 36% 0% n/a n/a 40% 17% 33% 14% n/a n/aCharlene Manor ECF* 146 91% 9% 92% 8% 85% 17% 84% 17% 95% 1%Charlwell House Nursing and Rehabilitation 128 38% 62% 61% 39% 100% 0% 76% 24% 67% 33%
Chelsea Jewish Nursing Home 158 74% 26% 66% 34% 65% 24% n/a n/a n/a n/aChelsea Skilled Soldiers’ Nursing Center 359 65% 35% n/a n/a 116% 3% 55% 11% 19% 3%Chestnut Woods Rehab 103 77% 23% 76% 24% 41% 59% n/a n/a n/a n/aChicopee Gardens 99 52% 47% n/a n/a n/a n/a n/a n/a n/a n/a
36

Nursing Home Facility Name
# HCPs (reported as of 12/31/16)
Vaccine Coverage 2016-17
Vaccine Declined 2016-17
Vaccine Coverage 2015-16
Vaccine Declined 2015-16
Vaccine Coverage 2014-15
Vaccine Declined 2014-15
Vaccine Coverage 2013-14
Vaccine Declined 2013-14
Vaccine Coverage 2012-13
Vaccine Declined 2012-13
Christopher House of Worcester 160 74% 26% 73% 27% 52% 48% 37% 63% 54% 46%Clark House at Foxhill Village 120 57% 43% 82% 18% 72% 28% 94% 6% 94% 8%Clifton Rehabilitative Nursing Center 213 76% 24% 69% 31% 70% 30% 70% 30% 74% 26%Coleman House 62 89% 24% n/a n/a 75% 28% 93% 22% 85% 27%Colonial Rehabilitation and Nursing Center 266 71% 29% 59% 0% 92% 8% 82% 18% 77% 23%Colony Center for Health and Rehabilitation* 87 97% 3% 92% 2% 94% 6% 96% 4% 68% 32%
Commons Residence* 74 97% 3% 96% 4% 97% 3% n/a n/a n/a n/aConcord Health Care Center n/a n/a n/a n/a n/a 75% 25% 80% 20% n/a n/aContinuing Care Linden Ponds n/a n/a n/a n/a n/a 62% 38% 64% 27% 72% 26%Copley at Stoughton 170 70% 30% 78% 22% 78% 22% 101% 24% 57% 23%Corey Hill Nursing Home* 53 91% 9% 91% 9% 81% 0% n/a n/a n/a n/aCountry Center for Health* 86 119% 1% 88% 12% 98% 2% 103% 5% n/a n/aCountry Gardens Health and Rehabilitation Center* 76 105% 53% 89% 11% 67% 33% 74% 26% 24% 76%
Countryside Health Care of Milford 200 64% 16% 70% 18% 77% 17% 75% 15% 76% 24%Countryside Nursing Home, Inc.* 47 98% 11% 94% 6% 117% 10% 104% 11% 89% 11%Courtyard Nursing Care Center* 282 94% 6% 94% 6% 92% 8% 78% 22% 78% 22%Craneville Place of Dalton n/a n/a n/a 88% 26% 47% 39% 71% 55% 81% 48%Crawford Health & Rehab Center 122 67% 48% 53% 38% 53% 26% n/a n/a n/a n/aDaniels House Nursing Home 56 75% 25% 84% 16% 100% 0% 94% 6% 94% 6%Den Mar Health and Rehabilitation 65 77% 23% 33% 67% 52% 33% n/a n/a n/a n/aDeutsches Altenheim Inc., dba German Centre for Extended Care 306 87% 9% 89% 12% 89% 13% 84% 16% 81% 19%
Devereaux House n/a n/a n/a 37% 10% 72% 15% 69% 31% 83% 17%Dighton Nursing Center 50 78% 22% 77% 23% 64% 44% 52% 48% 74% 26%Don Orione Home 186 68% 32% 28% 72% 67% 27% n/a n/a n/a n/aDoolittle Home 44 61% 39% n/a n/a 62% 38% 73% 27% n/a n/aD'Youville Life and Wellness Community 475 72% 44% 69% 41% 68% 23% 62% 38% 61% 33%East Longmeadow Skilled Nursing Center n/a n/a n/a n/a n/a 87% 13% 90% 28% 86% 28%Eastpointe Rehabilitation and Skilled Care Center 301 69% 23% 71% 23% 72% 25% 64% 28% 79% 22%
Elaine Center at Hadley n/a n/a n/a 118% 6% 125% 5% 59% 41% 43% 31%
37

Nursing Home Facility Name
# HCPs (reported as of 12/31/16)
Vaccine Coverage 2016-17
Vaccine Declined 2016-17
Vaccine Coverage 2015-16
Vaccine Declined 2015-16
Vaccine Coverage 2014-15
Vaccine Declined 2014-15
Vaccine Coverage 2013-14
Vaccine Declined 2013-14
Vaccine Coverage 2012-13
Vaccine Declined 2012-13
Eliot Center for Health and Rehabilitation* 92 99% 1% n/a n/a 89% 11% 61% 39% 53% 47%Elizabeth Seton Residence* 144 93% 7% 75% 25% 76% 24% 93% 23% 87% 12%Ellis Nursing and Rehab, The 250 73 20% 47% 4% 67% 4% 71% 1% n/a n/aEmerson Rehabilitation and TCU* 42 95% 5% 95% 5% 96% 4% 95% 5% 94% 6%Epoch Senior Healthcare Chestnut Hill n/a n/a n/a 77% 23% 76% 11% 95% 12% n/a n/aEPOCH Senior Healthcare of Brewster n/a n/a n/a 74% 21% 78% 22% 79% 21% 77% 23%Epoch Senior Healthcare of Melrose n/a n/a n/a 100% 0% 99% 1% 123% 4% 91% 9%Epoch Senior Healthcare of Norton n/a n/a n/a 128% 3% 139% 2% 117% 7% 117% 7%Epoch Senior Healthcare of Sharon n/a n/a n/a n/a n/a 82% 18% 88% 12% 89% 11%Epoch Senior Healthcare of Weston n/a n/a n/a 94% 17% 98% 12% 97% 12% 88% 12%Epoch Senior Living of Harwich n/a n/a n/a 84% 16% 84% 16% 75% 25% 84% 20%Essex Park Health Care Center n/a n/a n/a n/a n/a 48% 52% 86% 14% n/a n/aExcel Center for Nursing and Rehabilitation* 141 91% 9% 84% 24% 55% 45% n/a n/a n/a n/a
Fairhaven Healthcare Center n/a n/a n/a 73% 27% 65% 35% 66% 34% 52% 48%Fairview Commons* 138 90% 10% 92% 21% 136% 23% 64% 41% 64% 47%Fall River Jewish Home 84 58% 39% 62% 38% 55% 45% 71% 31% 83% 17%Farren Care Center* 175 91% 4% 90% 8% 97% 3% 66% 34% 60% 40%Fitchburg Gardens 115 81% 4% n/a n/a n/a n/a n/a n/a n/a n/aForestview n/a n/a n/a n/a n/a 33% 4% n/a n/a n/a n/aFranklin Health and Rehabilitation Center n/a n/a n/a 75% 25% 81% 16% 86% 14% 66% 34%Gardner Rehabilitation and Nursing Center 158 66% 34% 76% 24% 71% 29% 64% 36% 52% 48%Genesis Health Care at Westfield Center* 82 99% 1% 97% 3% 99% 1% 64% 36% n/a n/aGenesis Milford Center* 88 108% 6% n/a n/a 95% 10% 76% 51% n/a n/aGenesis of Wakefield Center* 113 101% 3% 99% 1% n/a n/a n/a n/a n/a n/aGenesis Spring Valley Center n/a n/a n/a 96% 4% n/a n/a n/a n/a n/a n/aGenesis Westford House 136 87% 13% 112% 1% n/a n/a n/a n/a n/a n/aGLC_Dexter House 97 75% 22% n/a n/a n/a n/a n/a n/a n/a n/aGlen Ridge Nursing Center 186 63% 37% 29% 71% 33% 67% 22% 78% 61% 39%Golden Living Center Attleboro 119 23% 77% n/a n/a 27% 73% n/a n/a n/a n/aGolden Living Center Dexter House n/a n/a n/a 78% 22% 74% 26% 81% 23% 79% 19%Golden Living Center- Fitchburg n/a n/a n/a n/a n/a 36% 64% 61% 20% 41% 14%
38

Nursing Home Facility Name
# HCPs (reported as of 12/31/16)
Vaccine Coverage 2016-17
Vaccine Declined 2016-17
Vaccine Coverage 2015-16
Vaccine Declined 2015-16
Vaccine Coverage 2014-15
Vaccine Declined 2014-15
Vaccine Coverage 2013-14
Vaccine Declined 2013-14
Vaccine Coverage 2012-13
Vaccine Declined 2012-13
Golden Living Center Garden Place n/a n/a n/a 62% 38% 58% 42% 63% 37% 65% 35%Golden Living Center Heathwood 79 50% 10% n/a n/a 77% 23% 94% 6% n/a n/aGolden Living Center Norwood 93 69% 31% 82% 18% 79% 15% 63% 16% 64% 17%Golden Living Center of Gloucester 85 74% 24% 69% 28% 48% 33% 51% 49% 85% 15%Golden Living Oak Hill 119 30% 2% 31% 69% n/a n/a n/a n/a n/a n/aGolden Living Center Plymouth 114 73% 27% 67% 33% 71% 29% n/a n/a n/a n/aGolden Living Center Wedgemere n/a n/a n/a n/a n/a 44% 56% n/a n/a n/a n/aGolden Living Center West Newton 106 58% 42% 36% 64% 53% 48% 54% 46% n/a n/aGolden Living Chetwynde 62 60% 40% 53% 48% 69% 31% 82% 18% 80% 20%Golden Living Melrose n/a n/a n/a 30% 70% 67% 33% 29% 71% n/a n/aGolden Living Oak Hill Nursing and Rehabilitation n/a n/a n/a n/a n/a 30% 70% 34% 66% 25% 75%
Governor Center 127 55% 45% n/a n/a n/a n/a n/a n/a n/a n/aGreenwood Nursing and Rehabilitation Center n/a n/a n/a 80% 20% 60% 30% 75% 25% 53% 47%
Grosvenor Park Nursing Center 220 33% 15% 33% 14% 79% 21% 70% 30% 70% 30%Guardian Center, The* 133 91% 8% 85% 15% 65% 3% 29% 25% 38% 5%Hancock Park Rehabilitation and Nursing Center 247 79% 21% 76% 24% 77% 23% 85% 22% 77% 23%
Hannah B.G. Shaw Home for the Aged, The 184 67% 22% n/a n/a 89% 11% 55% 45% 61% 30%Hannah Duston Healthcare 195 66% 8% 92% 8% 101% 11% 101% 14% 88% 23%Harbor House Nursing and Rehabilitation Center 180 79% 21% 83% 17% 82% 18% 78% 22% 78% 22%
Harborlights Nursing and Rehabilitation 96 61% 39% 74% 26% 91% 9% 76% 24% 97% 12%Harborview Center for Nursing and Rehabilitation 69 51% 49% 82% 18% 67% 17% 81% 19% n/a n/a
Harrington House n/a n/a n/a n/a n/a 86% 14% 97% 3% 91% 9%Hathaway Manor 175 80% 31% n/a n/a 40% 60% 28% 18% 59% 41%Hathorne Hill Danvers, MA 124 75% 2% 97% 3% 85% 15% 36% 64% n/a n/aHellenic Nursing and Rehabilitation 189 51% 49% 64% 36% 62% 38% 53% 47% 60% 40%Henry C Nevins, Inc. n/a n/a n/a n/a n/a 71% 29% 79% 37% n/a n/aHeritage Hall East n/a n/a n/a 92% 8% 95% 5% 64% 36% 68% 32%Heritage Hall North n/a n/a n/a n/a n/a 100% 7% 43% 37% 71% 54%
39

Nursing Home Facility Name
# HCPs (reported as of 12/31/16)
Vaccine Coverage 2016-17
Vaccine Declined 2016-17
Vaccine Coverage 2015-16
Vaccine Declined 2015-16
Vaccine Coverage 2014-15
Vaccine Declined 2014-15
Vaccine Coverage 2013-14
Vaccine Declined 2013-14
Vaccine Coverage 2012-13
Vaccine Declined 2012-13
Heritage Hall South n/a n/a n/a 78% 21% 78% 21% 74% 26% n/a n/aHeritage Hall West* 216 98% 2% 92% 8% 81% 19% 78% 35% 60% 40%Heritage Nursing Center* 168 95% 5% 93% 7% 98% 4% 56% 44% 60% 40%Hermitage Golden Living, The n/a n/a n/a n/a n/a 50% 1% n/a n/a n/a n/aHighland Manor Nursing Home 34 56% 44% 53% 47% 50% 59% 44% 56% 52% 48%Highlands, The 262 68% 15% 37% 5% 83% 20% 65% 35% 49% 51%Highview of Northampton 136 51% 26% 48% 21% 55% 45% 66% 34% n/a n/aHillcrest Commons* 237 90% 10% 92% 26% 94% 30% 74% 26% 64% 36%Holden Rehabilitation and Skilled Nursing Center* 224 93% 4% 98% 2% 98% 2% 96% 4% 105% 9%
Holy Trinity Nursing and Rehabilitation Center 153 73% 19% 68% 35% 75% 25% 67% 33% 58% 42%
Holyoke Health Center n/a n/a n/a n/a n/a 84% 16% n/a n/a n/a n/aHolyoke Healthcare Center 130 42% 62% 105% 18% 57% 33% n/a n/a n/a n/aHolyoke Rehabilitation Center n/a n/a n/a n/a n/a 57% 43% 50% 28% 54% 36%Hunt Nursing and Rehabilitation* 144 91% 9% n/a n/a 90% 10% 80% 20% 69% 31%Island Terrace Nursing Home 125 31% 69% 35% 24% 42% 45% 42% 39% 44% 33%Jeanne Jugan Residence* 110 91% 9% 92% 8% 104% 7% 80% 21% 68% 32%Jesmond Nursing 51 65% 8% n/a n/a 61% 39% 31% 11% 49% 51%Jewish Health Care Center 422 79% 21% 82% 18% 81% 19% 82% 18% 60% 40%Jewish Nursing Home of Western 278 78% 2% 94% 5% 65% 10% 76% 24% 67% 33%JML Care Center 261 261 80% 15% 86% 14% 90% 9% n/a n/a n/a n/aJohn Adams Healthcare Center 98 88% 12% n/a n/a 79% 18% 87% 13% n/a n/aJohn Scott House Rehabilitation and Nursing Center 179 88% 12% 84% 16% 82% 15% 81% 19% 56% 44%
Kathleen Daniels* 140 98% 2% n/a n/a 96% 4% n/a n/a n/a n/aKeystone Center* 90 98% 2% 98% 2% n/a n/a n/a n/a n/a n/aKimball Farms Nursing Care Center 99 70% 30% 80% 33% 85% 26% 94% 24% 90% 26%Kimwell Nursing and Rehabilitation* 129 97% 3% 95% 5% 97% 9% 39% 61% 50% 50%Kindred Forestview 140 54% 64% 28% 9% 33% 4% n/a n/a n/a n/aKindred Nursing & Rehabilitation Hallmark n/a n/a n/a n/a n/a 22% 78% 34% 66% 47% 53%Kindred Transitional Care and Rehabilitation-Harrington 153 75% 25% 61% 22% n/a n/a n/a n/a n/a n/a
40
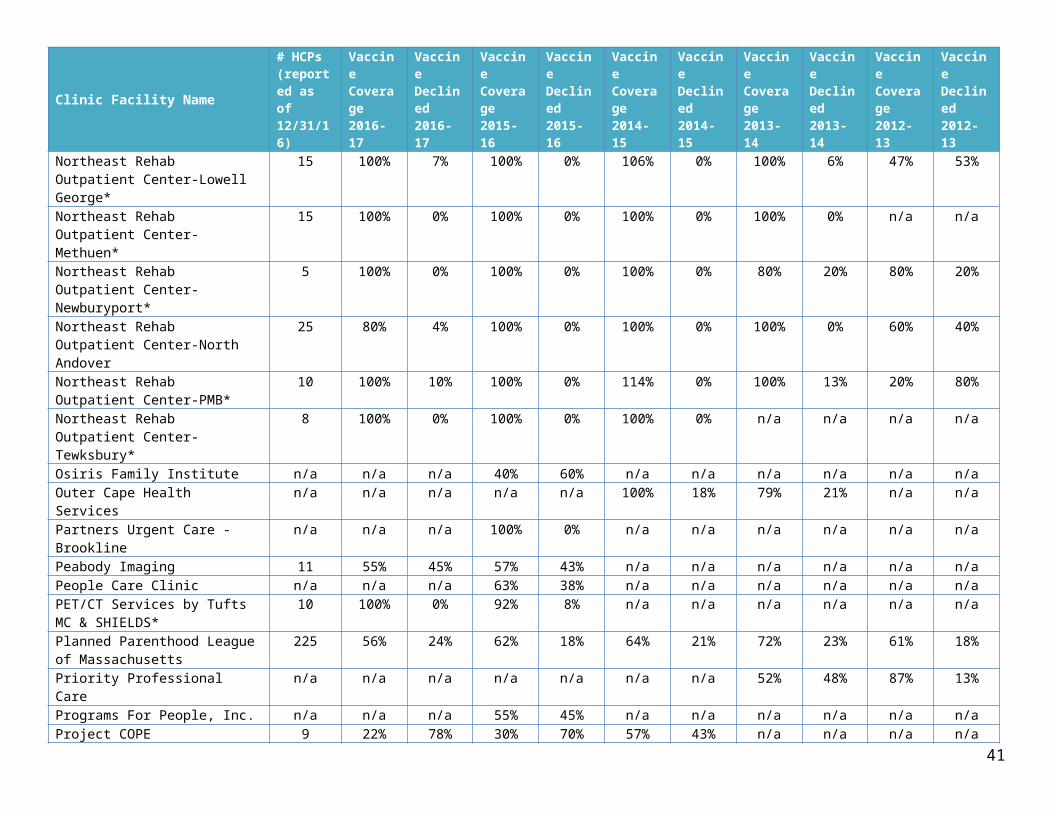
Nursing Home Facility Name
# HCPs (reported as of 12/31/16)
Vaccine Coverage 2016-17
Vaccine Declined 2016-17
Vaccine Coverage 2015-16
Vaccine Declined 2015-16
Vaccine Coverage 2014-15
Vaccine Declined 2014-15
Vaccine Coverage 2013-14
Vaccine Declined 2013-14
Vaccine Coverage 2012-13
Vaccine Declined 2012-13
Kindred Nursing & Rehabilitation Tower Hill Canton 156 76% 9% 89% 11% 87% 13% 87% 13% 86% 14%
Kindred Nursing and Rehabilitation Braintree 196 31% 69% 32% 68% 39% 55% 27% 73% 24% 76%
Kindred Nursing and Rehabilitation Laurel Lake - Lee n/a n/a n/a 41% 59% 78% 27% n/a n/a n/a n/a
Kindred Transitional Care and Rehabilitation Agawam n/a n/a n/a 47% 0% 33% 67% n/a n/a n/a n/a
Kindred Transitional Care and Rehabilitation at Eagle Pond 142 88% 12% 90% 18% 88% 18% 85% 15% n/a n/a
Kindred Transitional Care and Rehabilitation Avery Needham 132 86% 14% 84% 16% 56% 51% n/a n/a n/a n/a
Kindred Transitional Care and Rehabilitation The Highlander 186 44% 3% 54% 46% 42% 12% n/a n/a n/a n/a
Kindred Healthcare – Westborough 105 73% 15% n/a n/a n/a n/a n/a n/a n/a n/aKnollwood Nursing Center* 106 92% 8% 93% 7% 91% 9% 91% 9% 76% 11%KTCR Westborough n/a n/a n/a 95% 5% 100% 0% 87% 13% 88% 13%Lafayette Skilled Rehab and Nursing 90 87% 13% 84% 16% 88% 12% 90% 10% n/a n/aLakeview House Nursing Home 78 87% 19% 82% 29% 73% 34% 64% 39% 54% 51%Lanessa Extended Care 121 71% 29% 72% 28% 29% 71% n/a n/a n/a n/aLasell House n/a n/a n/a 87% 13% 88% 9% 94% 6% 59% 41%Laurel Ridge Rehabilitation and Skilled Care Center 149 89% 12% 93% 10% 98% 18% n/a n/a n/a n/a
Laurel Lake 109 29% 71% n/a n/a n/a n/a n/a n/a n/a n/aLCC South Shore 161 40% 39% n/a n/a n/a n/a n/a n/a n/a n/aLedgewood Rehabilitation and Nursing Center 175 61% 39% 47% 53% 89% 11% 62% 38% n/a n/a
Leland Home, The n/a n/a n/a n/a n/a 48% 16% n/a n/a n/a n/aLeonard Florence Center 229 33% 13% 24% 2% n/a n/a n/a n/a n/a n/aLexington Health Care Center n/a n/a n/a n/a n/a 71% 29% n/a n/a n/a n/aLiberty Commons 199 75% 25% 77% 23% 82% 18% n/a n/a n/a n/aLife Care Center of Acton 190 69% 9% n/a n/a 63% 8% 69% 31% 61% 39%Life Care Center of Attleboro n/a n/a n/a 87% 13% 81% 19% 70% 30% 50% 18%Life Care Center of Auburn 230 46% 27% 53% 4% 45% 13% 37% 15% 48% 13%Life Care Center of Leominster 232 88% 12% n/a n/a 72% 28% 72% 28% 67% 33%
41

Nursing Home Facility Name
# HCPs (reported as of 12/31/16)
Vaccine Coverage 2016-17
Vaccine Declined 2016-17
Vaccine Coverage 2015-16
Vaccine Declined 2015-16
Vaccine Coverage 2014-15
Vaccine Declined 2014-15
Vaccine Coverage 2013-14
Vaccine Declined 2013-14
Vaccine Coverage 2012-13
Vaccine Declined 2012-13
Life Care Center of Merrimack Valley n/a n/a n/a n/a n/a 17% 12% 62% 38% 62% 38%Life Care Center of Nashoba Valley 205 85% 3% 99% 1% 76% 24% 59% 21% 69% 31%Life Care Center of Stoneham 218 72% 28% 46% 54% 63% 37% 27% 81% 78% 38%Life Care Center of the North Shore 188 80% 20% 87% 13% 50% 50% n/a n/a n/a n/aLife Care Center of the South Shore n/a n/a n/a 38% 62% 29% 6% 60% 40% 62% 38%Life Care Center of West Bridgewater 291 86% 14% 68% 32% 71% 29% 63% 21% 59% 30%Life Care Center of Wilbraham 218 88% 12% 93% 14% 75% 25% 64% 36% 55% 45%Life Care Center Plymouth* 253 96% 4% 94% 6% 88% 13% 31% 5% 40% 7%Life Care Center Raynham 231 77% 23% 83% 17% 74% 26% 63% 33% 59% 43%Lighthouse Nursing Care Center* 146 92% 8% 32% 1% 62% 38% 69% 31% n/a n/aLinda Manor Extended Care Facility* 154 90% 10% n/a n/a 110% 11% 88% 12% 95% 5%Linden Ponds 230 56% 44% 56% 33% n/a n/a n/a n/a n/a n/aLongmeadow of Taunton 113 68% 32% 66% 34% 66% 34% 66% 34% 78% 29%Loomis Communities, The 194 62% 38% n/a n/a 17% 7% 39% 8% 49% 10%Loomis Lakeside at Reeds Landing 142 51% 49% n/a n/a 52% 46% 43% 49% n/a n/aLowell Healthcare Center n/a n/a n/a n/a n/a 29% 71% 35% 65% 43% 37%Lutheran Rehabilitation and Skilled Care Center* 148 100% 0% 96% 10% 111% 14% 88% 24% n/a n/a
Lydia Taft House 77 74% 26% 79% 21% 68% 33% 55% 45% 134% 50%Madonna Manor* 225 93% 7% 91% 9% 90% 10% 78% 22% n/a n/aMaples Rehabilitation and Nursing Center * 183 90% 3% 94% 5% 92% 6% 88% 17% 96% 16%
Maplewood Center n/a n/a n/a 98% 2% 99% 1% 57% 43% 52% 48%Marian Manor for the Aged and Infirm, Inc. 471 50% 11% 100% 6% 104% 7% 88% 12% 86% 14%
Marian Manor Taunton 157 86% 14% 87% 13% 73% 27% 73% 27% 73% 27%Marie Esther Health Center 72 76% 24% 77% 23% 79% 21% 70% 28% 71% 25%Marina Bay Skilled Nursing and Rehabilitation* 238 101% 1% 100% 3% 95% 6% 83% 10% 90% 12%
Maristhill Nursing and Rehabilitation 111 81% 19% 91% 9% 85% 15% 79% 21% 82% 18%Marlborough Hills Rehabilitation Center 228 85% 15% 68% 32% 75% 25% 63% 37% 53% 47%Marquardt Nursing Center* 59 97% 3% 97% 3% 95% 5% 95% 5% 95% 5%Mary Ann Morse Health Care Center 192 67% 11% 68% 32% 66% 20% 71% 29% 85% 12%
42

Nursing Home Facility Name
# HCPs (reported as of 12/31/16)
Vaccine Coverage 2016-17
Vaccine Declined 2016-17
Vaccine Coverage 2015-16
Vaccine Declined 2015-16
Vaccine Coverage 2014-15
Vaccine Declined 2014-15
Vaccine Coverage 2013-14
Vaccine Declined 2013-14
Vaccine Coverage 2012-13
Vaccine Declined 2012-13
Mary Immaculate Nursing Restorative Center 307 86% 7% 66% 24% 87% 13% 31% 37% 46% 10%
Mary's Meadow* 85 96% 4% 97% 3% 97% 3% 66% 34% 63% 37%Mascon met Health Care Center 194 69% 31% 79% 14% 116% n/a 61% 18% 73% 27%Mayflower Place Nursing and Rehabilitation Center n/a n/a n/a 75% 24% 64% 42% 64% 36% 71% 28%
Meadow Green Nursing Home 162 85% 15% 87% 13% 92% 8% 96% 4% 77% 23%The Meadows of Rockdale (of Central Mass) n/a n/a n/a 38% 62% n/a n/a n/a n/a n/a n/a
Meadow View Center n/a n/a n/a 88% 12% 92% 7% 57% 18% n/a n/aMeadows Health Center at Edgewood, The* 113 91% 9% 92% 8% 97% 3% 80% 20% 72% 28%
Medford Rehabilitation and Nursing Center n/a n/a n/a n/a n/a 59% 41% 74% 26% n/a n/a
Medway Country Manor Skilled Nursing Facility and Rehabilitation n/a n/a n/a n/a n/a 79% 21% 87% 27% 82% 24%
Mercy Home Care* 137 95% 5% 93% 7% 94% 6% n/a n/a n/a n/aMercy Hospice 18 78% 22% 69% 31% n/a n/a n/a n/a n/a n/aMerrimack Valley Health Center* 135 90% 10% 92% 8% 57% 43% n/a n/a n/a n/aMethuen Health and Rehab n/a n/a n/a n/a n/a 46% 54% 56% 44% 46% 54%Millbury Health Care Center n/a n/a n/a n/a n/a 66% 34% 66% 34% 66% 34%Milford Center n/a n/a n/a 91% 9% n/a n/a n/a n/a n/a n/aMilton Health Care n/a n/a n/a 100% 3% 78% 7% 38% 62% 50% 50%Mont Marie Rehabilitation and Healthcare Center* 97 95% 5% 61% 20% 90% 27% 65% 35% 42% 58%
Mount Carmel Care Center 85 65% 38% n/a n/a n/a n/a n/a n/a n/a n/aMt. Greylock Extended Care Facility* 121 96% 4% n/a n/a 85% 18% 91% 16% n/a n/aMt. St. Vincent Care Center 162 85% 15% 90% 10% 92% 8% 78% 22% 77% 23%Nemasket Healthcare* 144 93% 7% 96% 4% 95% 5% 86% 14% 76% 24%Neville Center at Fresh Pond* 292 99% 1% 94% 6% 96% 4% 89% 11% n/a n/aNevins Nursing & Rehabilitation Center 256 40% 40% 54% 23% n/a n/a n/a n/a n/a n/aNew Bedford Health Care Center n/a n/a n/a n/a n/a 61% 39% 55% 62% 46% 42%New Bedford Jewish Convalescent Home 125 87% 13% 96% 4% 98% 2% 99% 1% 89% 11%New Bedford Medical Investors, DBA The 198 52% 45% n/a n/a 50% 36% 26% 74% 52% 40%
43

Nursing Home Facility Name
# HCPs (reported as of 12/31/16)
Vaccine Coverage 2016-17
Vaccine Declined 2016-17
Vaccine Coverage 2015-16
Vaccine Declined 2015-16
Vaccine Coverage 2014-15
Vaccine Declined 2014-15
Vaccine Coverage 2013-14
Vaccine Declined 2013-14
Vaccine Coverage 2012-13
Vaccine Declined 2012-13
OaksNew Bridge on the Charles Skilled n/a n/a n/a 87% 13% 84% 3% 88% 5% 62% 9%New England Health Center 61 67% 33% 75% 25% 73% 27% 67% 33% 71% 20%New England Homes for the Deaf* 98 97% 3% 66% 34% 66% 34% 30% 70% 29% 71%New England Pediatric Care* 194 105% 2% 36% 3% n/a n/a n/a n/a n/a n/aNewfield House 103 63% 27% 87% 13% 80% 20% 86% 14% 91% 9%Newton Health Care Center n/a n/a n/a n/a n/a 88% 14% 98% 20% n/a n/aNewton Wellesley Center for Alzheimer's Care n/a n/a n/a 97% 3% 95% 5% 94% 6% 72% 28%
North Adams Commons* 103 95% 5% n/a n/a 98% 8% 104% 9% 105% 13%North Hill 110 75% 25% 75% 25% 82% 18% 96% 33% n/a n/aNorthwood Rehabilitation HealthCare Center 162 52% 48% 68% 32% 57% 43% 52% 48% 42% 58%
Notre Dame Long Term Care Center 220 80% 20% 75% 25% 89% 17% 104% 17% 76% 32%Oak Knoll Health Care Center n/a n/a n/a n/a n/a 82% 18% 86% 14% 58% 42%Oakdale Rehabilitation Center 142 56% 17% 93% 7% 96% 4% 102% 7% 68% 32%Odd Fellows Home of Massachusetts 133 81% 19% 70% 15% n/a n/a n/a n/a n/a n/aOur Island Home 68 71% 29% 80% 20% 73% 27% 82% 18% 83% 17%Our Lady's Haven 173 79% 21% 84% 16% 50% 48% 57% 43% 82% 32%Overlook Masonic Health Center* 327 96% 4% n/a n/a 76% 24% 56% 44% n/a n/aOxford, The 120 15% 25% 40% 11% 45% 24% n/a n/a n/a n/aPalm Center n/a n/a n/a 99% 1% 98% 2% n/a n/a n/a n/aPalmer Healthcare Center 66 56% 44% 79% 21% 70% 30% 49% 51% 66% 34%Park Avenue Nursing Care 104 86% 14% 82% 18% 92% 8% 96% 4% 98% 2%Park Place Rehabilitation and Skilled Care Center* 74 93% 7% 84% 16% 70% 30% 46% 14% 71% 29%
Parkwell n/a n/a n/a n/a n/a 83% 17% 37% 27% 47% 53%Parsons Hill Rehabilitation and Nursing Center 169 52% 48% 60% 14% 63% 37% 96% 4% 92% 8%
Pavilion, The 128 78% 22% 61% 39% 66% 34% 61% 39% 44% 56%Peabody Glen Health Care Center n/a n/a n/a n/a n/a 94% 6% 72% 28% n/a n/aPenacook Place n/a n/a n/a 89% 11% 94% 6% 68% 26% n/a n/aPhillips Manor Nursing Home 41 85% 15% 92% 8% 89% 11% 85% 15% n/a n/a
44

Nursing Home Facility Name
# HCPs (reported as of 12/31/16)
Vaccine Coverage 2016-17
Vaccine Declined 2016-17
Vaccine Coverage 2015-16
Vaccine Declined 2015-16
Vaccine Coverage 2014-15
Vaccine Declined 2014-15
Vaccine Coverage 2013-14
Vaccine Declined 2013-14
Vaccine Coverage 2012-13
Vaccine Declined 2012-13
Pilgrim Rehabilitation and Skilled Nursing 164 76% 28% 87% 30% 90% 31% 72% 30% 71% 38%Pine Knoll Nursing Center 110 28% 72% 10% 90% 31% 69% 41% 59% 38% 63%Pleasant Bay Nursing and Rehabilitation Center 185 62% 38% 72% 28% 68% 32% 63% 37% 54% 46%
Plymouth Rehabilitation Health Care Center 197 49% 51% 64% 36% 54% 3% 55% 21% 56% 18%
Poet Seat Health Care Center n/a n/a n/a n/a n/a 105% 2% 91% 9% 76% 24%Pond Home 77 79% 21% n/a n/a 80% 20% 79% 21% 86% 14%Pope Nursing Home n/a n/a n/a 87% 13% 85% 15% 79% 21% 74% 26%Port Healthcare Center 97 87% 5% 70% 30% 83% 17% 84% 16% 81% 19%Prescott House* 145 99% 1% 99% 1% 98% 2% 69% 31% 82% 18%Presentation Health Care Center 19 84% 16% 83% 29% 41% 19% n/a n/a n/a n/aQuabbin Valley Healthcare 197 46% 39% 53% 47% 69% 40% 73% 40% 67% 39%Quaboag Rehabilitation and Skilled Care Facility 178 54% 46% 67% 33% 77% 23% 59% 41% 74% 24%
Queen Anne Nursing Home* 160 91% 18% 103% 28% 103% 21% 81% 19% n/a n/aQuincy Health and Rehabilitation Center 92 48% 52% 63% 32% n/a n/a n/a n/a n/a n/aRandolph Health Care Center n/a n/a n/a n/a n/a 30% 32% 27% 52% n/a n/aRecuperative Services Unit n/a n/a n/a 95% 5% 94% 2% 97% 0% 74% 14%Redstone Rehabilitation Nursing Center n/a n/a n/a n/a n/a 57% 43% 60% 40% 53% 47%Rehabilitation and Nursing Center at Everett 191 83% 17% 83% 17% 85% 15% 66% 34% 67% 33%
Renaissance Manor Cabot n/a n/a n/a 72% 28% 70% 30% 71% 29% 71% 29%Renaissance Manor Westfield n/a n/a n/a 50% 50% 78% 22% n/a n/a n/a n/aReservoir Center, The* 139 100% 0% 78% 22% 93% 7% 90% 20% n/a n/aResident Care Rehabilitation and Nursing Center n/a n/a n/a 66% 34% 75% 25% n/a n/a n/a n/a
River Terrace Rehabilitation and Nursing 92 84% 16% 68% 32% 73% 3% n/a n/a n/a n/aRiverbend of South Natick* 55 96% 4% 73% 27% 88% 12% 83% 17% 64% 36%Rivercrest Long Term Care n/a n/a n/a n/a n/a 90% 10% 71% 29% 83% 17%Rockdale Care and Rehab 97 24% 76% n/a n/a n/a n/a n/a n/a n/a n/aRosewood Nursing and Rehabilitation Center 240 85% 15% 84% 16% 82% 18% 68% 32% 80% 20%
Royal Braintree Nursing and Rehabilitation n/a n/a n/a 37% 31% 44% 56% 16% 84% n/a n/a
45

Nursing Home Facility Name
# HCPs (reported as of 12/31/16)
Vaccine Coverage 2016-17
Vaccine Declined 2016-17
Vaccine Coverage 2015-16
Vaccine Declined 2015-16
Vaccine Coverage 2014-15
Vaccine Declined 2014-15
Vaccine Coverage 2013-14
Vaccine Declined 2013-14
Vaccine Coverage 2012-13
Vaccine Declined 2012-13
Royal Cape Cod Nursing and Rehabilitation Center* 142 90% 10% 96% 4% 97% 3% 93% 7% 79% 21%
Royal Megansett Nursing and Retirement Home* 97 95% 5% 82% 17% 73% 27% 93% 7% n/a n/a
Royal Nursing Center – Braintree 242 57% 43% n/a n/a 66% 36% 48% 52% 103% 21%Royal of Cotuit 87 87% 14% 66% 34% 40% 27% n/a n/a n/a n/aRoyal of Fairhaven 120 46% 25% 48% 52% 48% 52% 21% 79% 75% 25%Royal Nursing Center Falmouth 142 77% 23% 82% 27% n/a n/a n/a n/a n/a n/aRoyal of Norwell Nursing and Rehabilitation 82 74% 15% 49% 51% 82% 30% n/a n/a n/a n/a
Royal Taber Street 65 78% 14% 30% 68% 36% 37% 34% 66% 89% 11%Sachem Center for Health and Rehabilitation 129 83% 17% 98% 2% 97% 3% 91% 9% 76% 24%
Sacred Heart Home 295 86% 14% 77% 23% 44% 56% 49% 51% 50% 50%Saint Joseph Rehabilitation and Nursing Care Center* 155 100% 17 94% 6% 92% 8% n/a n/a n/a n/a
Samuel Marcus Nursing Home 28 71% 29% 81% 19% n/a n/a n/a n/a n/a n/aSancta Maria Nursing Facility 214 50% 17% 51% 10% 78% 21% 69% 22% 70% 30%Sandalwood Center n/a n/a n/a 98% 3% 100% 0% 39% 61% 59% 41%Sarah Brayton Skilled Nursing Center* 225 99% 1% 96% 4% 89% 11% 78% 11% 5% 22%Saugus Center Genesis Health Care n/a n/a n/a 80% 2% 93% 5% 69% 31% 72% 28%Savoy Nursing and Rehabilitation 55 20% 78% 17% 58% 25% 58% 25% 72% 35% 69%Sea View Retreat 81 86% 14% 86% 14% 84% 16% 81% 19% 83% 17%Seacoast Nursing and Rehabilitation Center 155 33% 67% 81% 19% 68% 32% 96% 2% 50% 50%
Seashore Point n/a n/a n/a 46% 0% 65% 16% 87% 13% 75% 25%Serenity Hill Nursing and Rehabilitation 61 74% 26% 66% 34% 73% 27% 63% 43% 56% 44%Seth Mann 2nd Home n/a n/a n/a 36% 64% n/a n/a n/a n/a n/a n/aSeven Hills Pediatric Center* 209 99% 1% 98% 2% 98% 2% 106% 1% n/a n/aSherrill House, Inc. 292 71% 29% 80% 20% 82% 18% 81% 19% 76% 24%Shrewsbury Nursing and Rehabilitation Center 146 85% 15% 57% 43% 55% 45% 45% 55% 59% 41%
Sippican Health Care Center 185 84% 16% 93% 7% 91% 9% 94% 6% 87% 13%Somerset Ridge Center* 163 111% 3% 96% 2% 118% 2% 42% 58% 49% 51%
46

Nursing Home Facility Name
# HCPs (reported as of 12/31/16)
Vaccine Coverage 2016-17
Vaccine Declined 2016-17
Vaccine Coverage 2015-16
Vaccine Declined 2015-16
Vaccine Coverage 2014-15
Vaccine Declined 2014-15
Vaccine Coverage 2013-14
Vaccine Declined 2013-14
Vaccine Coverage 2012-13
Vaccine Declined 2012-13
South Cove Manor Nursing and Rehabilitation Center 227 52% 48% 67% 33% 58% 42% 67% 33% 71% 29%
South Shore Rehabilitation and Skilled Care 145 75% 25% 68% 32% 61% 39% n/a n/a n/a n/a
Southbridge Rehabilitation and Health Care Center 126 64% 36% 59% 41% 61% 39% n/a n/a n/a n/a
Southeast Healthcare Center n/a n/a n/a 45% 9% 36% 24% 77% 33% 78% 26%Southeast Rehab Easton 231 57% 43% n/a n/a n/a n/a n/a n/a n/a n/aSoutheastern Mass Health and Rehabilitation Center n/a n/a n/a n/a n/a 60% n/a 80% 13% 36% 61%
Southpointe Rehabilitation and Skilled Care Center 181 61% 39% 25% 75% 65% 35% 70% 30% 39% 61%
Southwood at Norwell* 172 94% 6% 90% 10% 81% 19% 88% 13% 78% 22%Spaulding Nursing and Therapy Center North End* 229 93% 5% 100% 8% 93% 4% n/a n/a n/a n/a
Spaulding Nursing and Therapy Center West Roxbury* 157 95% 2% n/a n/a 98% 2% 94% 2% 88% 15%
Spring Valley Center n/a n/a n/a n/a n/a 96% 1% 87% 13% 35% 65%Springside Rehabilitation and Healthcare Center 135 67% 33% 63% 37% 55% 45% 48% 52% 42% 58%
St. Camillus Health Center 178 83% 23% 85% 22% 87% 19% 84% 16% 81% 19%
St. Francis Rehabilitation & Nursing Center n/a n/a n/a 78% 31% n/a n/a n/a n/a n/a n/aSt. Joseph Manor 112 69% 31% 70% 30% 100% 0% 82% 18% 93% 7%St. Mary Healthcare 152 84% 1% n/a n/a 93% 7% 94% 6% 93% 7%St. Patrick's Manor 378 50% 43% 48% 42% 81% 19% 60% 18% 77% 26%Stone Rehabilitation and Senior Living n/a n/a n/a 84% 16% n/a n/a n/a n/a n/a n/aSterling Village 200 83% 18% n/a n/a 88% 12% 59% 41% 50% 50%Stone Institute, The n/a n/a n/a n/a n/a 93% 7% 93% 7% 80% 14%Stonehedge Rehabilitation and Skilled Care Center n/a n/a n/a 54% 46% 69% 31% 62% 38% 63% 38%
Sudbury Pines Extended Care Facility, INC 103 86% 14% n/a n/a n/a n/a n/a n/a n/a n/aSunny Acres Nursing Home 137 71% 29% 77% 23% 73% 26% 55% 40% 49% 49%Sutton Hill* 144 98% 2% 98% 2% n/a n/a n/a n/a n/a n/aSweetbrook Rehabilitation and Nursing Center n/a n/a n/a n/a n/a 93% 23% 66% 34% 68% 32%
47

Nursing Home Facility Name
# HCPs (reported as of 12/31/16)
Vaccine Coverage 2016-17
Vaccine Declined 2016-17
Vaccine Coverage 2015-16
Vaccine Declined 2015-16
Vaccine Coverage 2014-15
Vaccine Declined 2014-15
Vaccine Coverage 2013-14
Vaccine Declined 2013-14
Vaccine Coverage 2012-13
Vaccine Declined 2012-13
Taunton Nursing Home 94 38% 62% 66% 34% 71% 29% n/a n/a n/a n/aTCU at Webster 49 35% 10% 51% 14% 59% 41% n/a n/a n/a n/aTerraces, The 61 84% 16% 68% 32% 83% 17% 63% 37% 51% 49%Thomas Upham House 62 60% 40% 73% 27% 74% 26% 52% 48% 56% 44%Timberlyn Heights Nursing and Rehabilitation 64 48% 52% n/a n/a 28% 71% 41% 59% n/a n/a
Timothy Daniels House* 47 96% 4% 94% 6% 73% 27% 61% 39% 67% 33%Town and Country Healthcare Center n/a n/a n/a 41% 59% 37% 31% n/a n/a n/a n/aTremont Rehabilitation and Skilled Care Center 107 64% 36% 40% 60% 42% 58% 52% 61% 68% 32%
Twin Oaks* 94 105% 3% 94% 0% 93% 3% 85% 15% 84% 16%Valley Stream Rehabilitation and Nursing n/a n/a n/a 47% 34% 47% 53% n/a n/a n/a n/aVero Health and Rehabilitation Parkway 137 70% 30% 69% 31% 96% 4% 35% 65% 71% 29%Vero Health and Rehabilitation of Mattapan 101 61% 39% 45% 55% 48% 52% 54% 46% 66% 34%
Vero Health and Rehabilitation of West Roxbury 95 82% 8% n/a n/a 86% 14% 33% 12% n/a n/a
Vibra Transitional Care The Meadows 117 79% 21% n/a n/a 83% 17% 80% 20% n/a n/aVictoria Haven Nursing Facility n/a n/a n/a 59% 20% 46% 42% n/a n/a n/a n/aWaban Health Center* 93 94% 6% 96% 4% 89% 11% 90% 10% 86% 14%Wachusett Manor* 142 97% 3% 96% 4% 106% 4% 77% 41% 77% 37%Wakefield Care and Rehabilitation n/a n/a n/a n/a n/a 99% 1% 69% 31% 54% 46%Walden Health and Rehabilitation Center 82 84% 16% 70% 30% 83% 8% 120% 13% n/a n/aWatertown Health Center 172 83% 17% 84% 16% 85% 15% 70% 30% 25% 75%Waterview Lodge LLC, Rehab and Healthcare 98 68% 32% n/a n/a n/a n/a n/a n/a n/a n/a
Wayland Nursing and Rehabilitation Center n/a n/a n/a 58% 32% 129% 9% 142% 31% 109% 11%
Webster Manor Rehabilitation and Health Care Center 167 71% 26% 73% 27% 78% 34% 44% 16% 60% 40%
Webster Park Rehabilitation and Healthcare Center 152 73% 16% 69% 38% 98% 24% n/a n/a n/a n/a
West Acres Nursing Home Brockton 189 54% 29% 45% 10% 77% 23% 87% 13% 78% 22%West Revere Health Center 129 45% 55% 27% 56% 44% 19% 38% 20% 43% 21%
48

Nursing Home Facility Name
# HCPs (reported as of 12/31/16)
Vaccine Coverage 2016-17
Vaccine Declined 2016-17
Vaccine Coverage 2015-16
Vaccine Declined 2015-16
Vaccine Coverage 2014-15
Vaccine Declined 2014-15
Vaccine Coverage 2013-14
Vaccine Declined 2013-14
Vaccine Coverage 2012-13
Vaccine Declined 2012-13
Westfield Gardens and Nursing and Rehab 130 57% 43% n/a n/a n/a n/a n/a n/a n/a n/aWestford House n/a n/a n/a n/a n/a 82% 18% 96% 33% 62% 38%Weymouth Health Care n/a n/a n/a n/a n/a 62% 38% 67% 33% n/a n/aWest Side House LTC Facility n/a n/a n/a 99% 1% n/a n/a n/a n/a n/a n/aWhittier Rehabilitation Hospital 38 71% 29% 79% 21% 81% 19% 78% 0% n/a n/aWilliam B. Rice Eventide Home n/a n/a n/a 117% 15% 83% 18% 85% 39% 93% 36%Williamstown Commons* 170 108% 14% n/a n/a 93% 12% 13% 14% 86% 0%Willimansett Center East 106 58% 42% 76% 24% n/a n/a n/a n/a n/a n/aWillimansett West Nursing Center 103 87% 13% 95% 5% 86% 14% 92% 8% 85% 15%Willow Manor 103 69% 1% 78% 22% n/a n/a n/a n/a n/a n/aWilmington Health Care Center n/a n/a n/a n/a n/a 73% 27% 80% 20% 54% 43%Winchester Rehabilitation and Nursing Center* 199 101% 2% 100% 0% 96% 4% 62% 38% 64% 36%
Windemere Nursing and Rehabilitation Center 80 65% 35% 73% 27% 65% 35% 41% 59% 49% 51%
Windsor Skilled Nursing and Rehabilitation 114 83% 17% 57% 52% 108% 8% 75% 25% 52% 48%Wingate at Andover n/a n/a n/a 58% 7% 89% 4% 97% 3% 50% 50%Wingate at Belvidere 134 87% 10% 87% 11% 86% 14% 72% 22% 54% 34%Wingate at Boston n/a n/a n/a n/a n/a 68% 32% 37% 10% 66% 34%Wingate at Brewster 185 79% 12% n/a n/a n/a n/a n/a n/a n/a n/aWingate at East Longmeadow 117 81% 19% 72% 28% 74% 26% 48% 52% 50% 50%Wingate at Hampden 112 75% 25% 81% 19% 85% 15% 77% 23% 62% 38%Wingate at Harwich 127 76% 24% n/a n/a n/a n/a n/a n/a n/a n/aWingate at Haverhill 101 64% 36% 47% 8% 46% 14% 35% 65% 42% 34%Wingate at Needham 176 68% 32% 91% 9% 91% 9% n/a 56% 48% 22%Wingate at Norton* 124 138% 4% n/a n/a n/a n/a n/a n/a n/a n/aWingate at Reading 109 88% 12% n/a n/a n/a n/a n/a n/a n/a n/aWingate at Sharon 87 82% 18% n/a n/a n/a n/a n/a n/a n/a n/aWingate at Silver Lake 236 75% 31% 53% 28% 52% 48% 59% 36% 50% 55%Wingate at South Hadley 109 32% 68% n/a n/a n/a n/a n/a n/a n/a n/aWingate at Springfield 126 80% 20% 77% 11% 77% 15% 80% 20% 61% 39%Wingate at Sudbury 140 59% 8% 72% 14% 73% 27% 81% 19% 84% 16%Wingate at Weston* 116 91% 16% n/a n/a n/a n/a n/a n/a n/a n/a
49
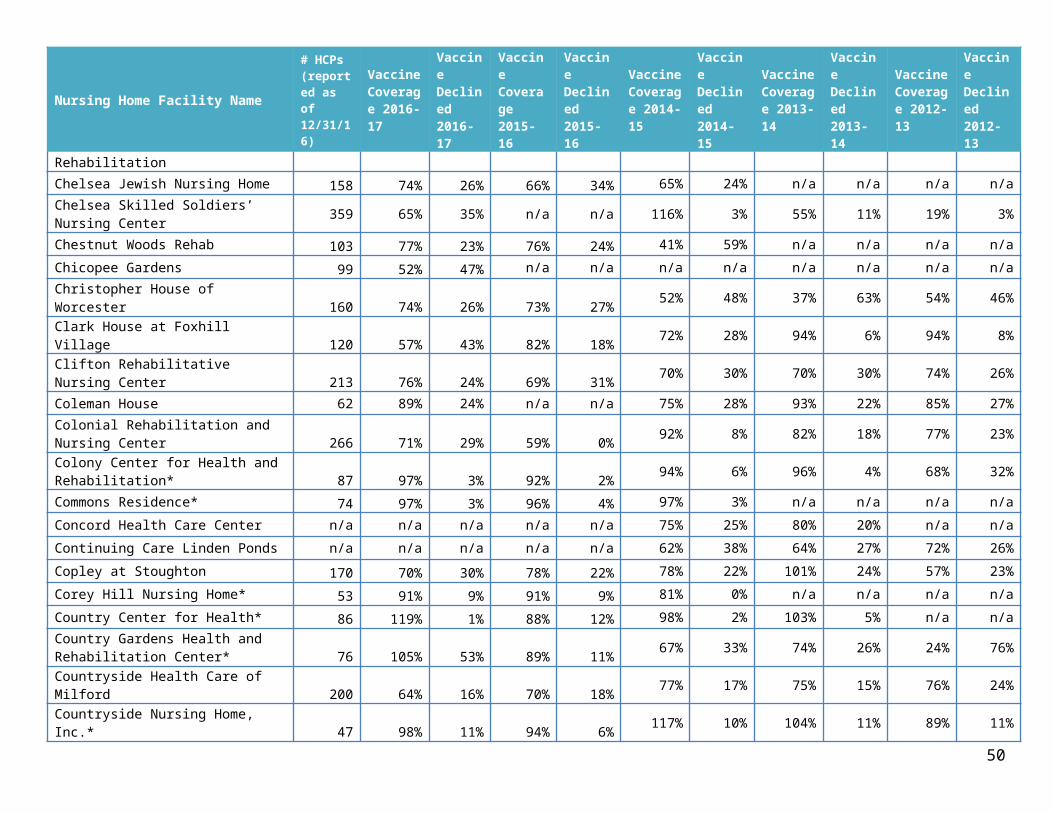
Nursing Home Facility Name
# HCPs (reported as of 12/31/16)
Vaccine Coverage 2016-17
Vaccine Declined 2016-17
Vaccine Coverage 2015-16
Vaccine Declined 2015-16
Vaccine Coverage 2014-15
Vaccine Declined 2014-15
Vaccine Coverage 2013-14
Vaccine Declined 2013-14
Vaccine Coverage 2012-13
Vaccine Declined 2012-13
Wingate at Wilbraham 152 86% 14% 85% 15% 85% 15% 63% 37% 64% 36%Wingate at Worcester 211 86% 14% 87% 13% 91% 9% 65% 35% 52% 48%Wingate West Springfield 84 79% 21% 85% 15% 79% 21% 58% 42% 47% 50%Woburn Rehab and Nursing Center 243 81% 19% n/a n/a n/a n/a n/a n/a n/a n/aWood Mill n/a n/a n/a n/a n/a 94% 6% 62% 38% n/a n/aWoodbriar Health Center 143 69% 31% 46% 10% 81% 19% n/a n/a n/a n/aWorcester Health Center 167 63% 37% 75% 25% 72% 28% 89% 19% 85% 23%Worcester Rehabilitation & Healthcare Center 119 41% 20% 62% 24% 61% 39% 52% 48% 57% 43%
*Vaccination rate greater than 90% in 2016-17
TABLE 13 . 2015-2016 TO 2016-2017 HCP INFLUENZA VACCINATION AND DECLINATION AT MASSACHUSETTS REST HOMES
INCLUDES DATA SUBMITTED BY 6/14/17.
Rest Homes Facility Name
# HCPs (reported as of 12/31/16)
Vaccine Coverage 2016-17
Vaccine Declined 2016-17
Vaccine Coverage 2015-16
Vaccine Declined 2015-16
Applewood - A Home for Elders 15 47% 53% 76% 24%Beaven Kelly Home* 29 97% 3% 96% 4%Burncoat Plains n/a n/a n/a 54% 46%Charlton Manor Rest Home* 13 100% 38% 63% 38%Crescent Manor Rest Home 25 48% 52% 80% 20%Dalton Rest Home n/a n/a n/a 42% 58%Dodge Park Rest Home 78 82% 18% 96% 11%Elizabeth Catherine Rest Home 11 73% 27% 82% 18%Fairmount Rest Home 10 50% 50% 58% 42%Fuller House Stoneham 17 82% 18% 75% 25%Good Shepherd Center* 15 93% 7% 93% 7%Halcyon House n/a n/a n/a 53% 47%Hale House 37 84% 16% 97% 3%Havenwood Rest Home 19 58% 42% 68% 32%
50

Rest Homes Facility Name
# HCPs (reported as of 12/31/16)
Vaccine Coverage 2016-17
Vaccine Declined 2016-17
Vaccine Coverage 2015-16
Vaccine Declined 2015-16
Hillside Rest Home 13 62% 38% 64% 36%Lathrop Home* 51 90% 10% n/a n/aLynn Home for Elderly Persons 33 55% 45% 45% 55%Marillac Residence 43 63% 37% 49% 51%Mill Pond Rest Home* 15 100% 0% 100% 0%Pond Home n/a n/a n/a 71% 29%Presentation Health Care Center n/a n/a n/a 88% 13%Rosewood Manor Rest Home 38 87% 34% 87% 34%Sophia Snow Place n/a n/a n/a 96% 4%Somerville Home, Inc. 20 65% 70% n/a n/aSrs of Divine Providence - Providence House n/a n/a n/a 73% 27%St. Joseph's Abbey Resident Care Facility n/a n/a n/a 90% 10%St. Julie Billiart Residential Care Center n/a n/a n/a 55% 45%St. Luke's Home* 42 95% 5% 95% 5%Stevens-Bennett Home n/a n/a n/a 91% 9%The Brookhouse Home n/a n/a n/a 80% 20%The Fitch Home, Inc. 26 58% 42% 59% 41%The German Home n/a n/a n/a 80% 20%Willowbrook Manor Rest Home* n/a n/a n/a 93% 7%Winter Hill Rest Home n/a n/a n/a 60% 40%
*Vaccination rate greater than 90% in 2016-17
TABLE 14. 2015-2016 TO 2016-2017 HCP INFLUENZA VACCINATION AND DECLINATION AT MASSACHUSETTS ADULT DAY HEALTH CENTERS
INCLUDES DATA SUBMITTED BY 6/14/17.
Adult Day Health Facility Name
# HCPs (reported as of 12/31/16)
Vaccine Coverage 2016-17
Vaccine Declined 2016-17
Vaccine Coverage 2015-16
Vaccine Declined 2015-16
"Best Choice" ADH 35 14% 85% 17% 83%41 Capital Adult Care, LLC 13 54% 46% 33% 67%A Joyful Adult Health Care Center 11 82% 18% n/a n/a
51

Adult Day Health Facility Name
# HCPs (reported as of 12/31/16)
Vaccine Coverage 2016-17
Vaccine Declined 2016-17
Vaccine Coverage 2015-16
Vaccine Declined 2015-16
Accord Adult Day Center n/a n/a n/a 100% 0%Active Day of Hingham 19 89% 11% 67% 44%Active Day of Lowell 33 21% 79% n/a n/aActive Day of New Bedford 29 14% 86% 19% 81%Active Day, Fairhaven n/a n/a n/a 7% 93%Active Life Adult Day Care* 24 96% 4% n/a n/aAdult Day Health Center at Manor On the Hill 10 40% 60% 73% 27%Adult Day Treatment 5 40% 60% n/a n/aAgingWell Adult Day Health Center 49 29% 31% 31% 64%Akshar Seva Inc. dba Fun life Adult Day Care 25 4% 96% n/a n/aAll Care Adult Day Health Center Inc. n/a n/a n/a 80% 20%Associates for Human Services, Inc. Wise Adult Day Health Program 21 57% 38% 65% 35%Bay Cove Human Services d/a/a Kit Clark Senior Services Adult Day Health Program at Codman Square 23
83% 17%94% 6%
Bay Cove Human Services d/a/a Kit Clark Senior Services Adult Day Health Program at Fields Corner* 22
95% 5%100% 7%
Bethany House Adult Day* 8 100% 0% n/a n/aBlaire House of Tewksbury Adult Day Health n/a n/a n/a 89% 11%BMC/Margaret M. Shea RN Adult Day Health* 10 100% 0 n/a n/aBoston Adult Daycare dba Sarah Care 20 45% 30% n/a n/aBrockton Adult Day Health, ADH Inc. 55 25% 75% 45% 55%Brockton Adult Medical Day Care Center, Inc. 33 36% 64% 12% 88%Brockton Adult Medical Day Care Center II, Inc. 13 54% 46% n/a n/aBrockton Area Multi-Services, Inc. n/a n/a n/a 86% 14%Brookfield Adult Day Health n/a n/a n/a 100% 0%Buttonwoods Place Adult Day Health Center 9 56% 44% 80% 20%Cambridge Windsor House 8 63% 38% 56% 44%Cape Verdean Adult Day Health 48 8% 92% 36% 64%Capeway Adult Day Health Center, Inc. 32 50% 50% 32% 68%CarePro Adult Day Health 7 57% 43% 29% 71%Castle Hill Adult Day Health Center* 14 100% 0% 100% 17%CESI Burlington 14 71% 21% n/a n/aCESI Milton 5 80% 20% n/a n/aCHD/Hawthorn Elder Care- West Springfield Site 14 64% 36% 30% 70%
52

Adult Day Health Facility Name
# HCPs (reported as of 12/31/16)
Vaccine Coverage 2016-17
Vaccine Declined 2016-17
Vaccine Coverage 2015-16
Vaccine Declined 2015-16
CHD/Hawthorn Elder Care-Chicopee site 10 60% 40% 36% 73%CHD/Hawthorn Elder Care-Springfield site 10 60% 40% 45% 82%Cheshire Adult Day Health* 24 100% 0% 100% 0%Colonial Adult Day Health Center* 12 92% 8% 77% 23%Cooperative Elder Services, Inc. 16 75% 25% n/a n/aCooperative Elder Services, Inc. Groton 10 70% 30% n/a n/aCooperative Elder Services, Inc. of Concord* 12 92% n/a n/a n/aCornerstone Adult Day Health 12 33% 67% n/a n/aCountryside Adult Day Health 7 71% 29% n/a n/aCozy Corner ADHC INC n/a n/a n/a 113% 50%Day By Day Adult Care Inc.* 22 91% 9% 86% 14%Deutsches Altenheim Inc. dba German Centre for Extended Care* 9 100% 11% n/a n/aDeutsches Altenheim Inc. dba Senior Place 9 89% 11% n/a n/aDon Orione Adult Day Health Center 4 75% 25% n/a n/aD'Youville Adult Day Health Ctr 6 83% 17% 100% 0%Element Care-Nevins n/a n/a n/a 94% 6%Ellis Adult Day Health 6 50% 50% 67% 33%Fairview Commons n/a n/a n/a 100% 0%Family Service Association/ Cornerstone Adult Day Health n/a n/a n/a 40% 60%Family Service Association/Countryside Adult Day Health n/a n/a n/a 70% 30%Family Service Association/GenCenter Adult Day Health n/a n/a n/a 54% 46%Fuente De Vida Adult Day Health Services, LLC 34 53% 47% 57% 41%Gateway Adult Center n/a n/a n/a 100% 0%Greater Boston Adult Day Health, ADH Inc. 32 25% 75% 91% 9%Greater Boston Chinese Golden Age Center-Brighton House ADH 13 38% 62% 36% 71%Greater Boston Chinese Golden Age Center-Hong Lok House ADH 20 70% 30% 67% 33%Greater Boston Chinese Golden Age Center-Quincy Tower ADH 18 61% 39% 42% 58%GenCenter Adult Day Health 10 50% 50% n/a n/aGreat Days for Seniors at Hebrew Rehabilitation Center 8 75% 25% n/a n/aGreat Days for Seniors at Wallingford Road* 10 90% 10% n/a n/aGreater New Bedford Adult Day Health dba Project Independence 18 22% 78% n/a n/aGuardian Adult Day Care, Inc. d/b/a/ Blaire House of* 16 100% 0% n/a n/aGVNA HealthCare: Athol Adult Day Health 9 78% 22% n/a n/aGVNA HealthCare: Fitchburg Adult Day Health* 13 92% 8% 86% 14%
53

Adult Day Health Facility Name
# HCPs (reported as of 12/31/16)
Vaccine Coverage 2016-17
Vaccine Declined 2016-17
Vaccine Coverage 2015-16
Vaccine Declined 2015-16
GVNA HealthCare: Gardner Adult Day Health* 13 100% 9% 100% 0%GVNA HealthCare: Greenfield Adult Day Health* 7 100% 0% 100% 0%GVNA HealthCare: North Quabbin Adult Day Health n/a n/a n/a 88% 13%Haitian Adult Day Health 41 17% 83% 80% 20%Hancock Park Adult Day Health Center 10 80% 20% 77% 23%Happy Days ADH Program, Inc. n/a n/a n/a 33% 67%Harbor House Adult Day Health Center 9 89% 11% 83% 17%Harborside Adult Day Health Center 9 89% 11% 78% 22%Harmony Adult Day Health Center 21 76% 24% 69% 31%Highland Adult Day Health 20 35% 65% 28% 72%Hillside ADHC 14 50% 50% 53% 47%Home Away From Home 22 32% 68% 52% 48%International Health Solutions, Inc. n/a n/a n/a 9% 91%JML Care Center* 13 100% 0% n/a n/aJoyful Living Adult Day Health 12 25% 75% 57% 43%Kernwood ADC Inc. DBA Pondview Lodge ADH* 20 100% 0% 100% 0%La Bella Vida Adult Day Health Services, LLC 27 37% 70% 52% 57%La Casa de Maria Inmaculada 33 76% 24% 82% 18%La Casita Adult Day Health 33 76% 24% 82% 18%Liberty Adult Day Health* 14 93% 7% n/a n/aLiving Well Adult Day Health Ctr. 43 19% 81% 13% 87%Lowell Elder Care n/a n/a n/a 19% 81%Lynn Zabota ADHC 40 15% 85% 25% 75%Mansfield Adult Day Health 21 62% 38% 81% 19%Mary Immaculate Adult Day Health Program 33 76% 24% 82% 18%Mater Dei Adult Day Health* 13 100% 0% 80% 20%Medford Adult Day Health Center 10 10% 90% n/a n/aNevins ADH* 48 96% 4% n/a n/aNew England Community Care Adult Day Health NECC 25 44% 52% 91% 18%New England Sinai Hospital -Adult Day Health Center* 8 100% 0% 100% 0%North Shore Adult Day Health Care Center 34 71% 29% 67% 24%Norwood Adult Day Health Center 27 52% 48% 82% 18%Oasis Adult Day Health 47 47% 23% 88% 12%Otrada Adult Day Health Care Center 36 25% 75% n/a n/a
54

Adult Day Health Facility Name
# HCPs (reported as of 12/31/16)
Vaccine Coverage 2016-17
Vaccine Declined 2016-17
Vaccine Coverage 2015-16
Vaccine Declined 2015-16
Our Family Circle, Inc. DBA-CANAS 16 0% 100% 8% 92%Project Independence Greater New Bedford ADH n/a n/a n/a 29% 71%Rainbow ADHC of Quincy 15 13% 87% n/a n/aRainbow ADHC of Waltham 36 53% 47% 26% 74%Rainbow Adult Day Center 28 57% 43% 72% 28%Renaissance Adult Day Health Center, ADH, Inc. 21 57% 43% n/a n/aRevere ADHC 39 59% 41% 71% 29%Riverview Adult Day Health 8 25% 75% 14% 86%Roger B. Trask 11 73% 27% n/a n/aRogerson Egleston Adult Day Health Program n/a n/a n/a 10% 90%Rogerson Roslindale Adult Health and Dementia Day Program 43 30% 70% 31% 69%Saint Camillus Adult Day Health Center n/a n/a n/a 71% 29%Saint Francis Adult Day Health 11 64% 36% 80% 20%SALMON Adult Day Health Natick* 16 94% 6% 71% 41%Salmon Adult Day Health Northbridge 15 87% 13% 75% 25%Sanborn Adult Day Health 19 79% 21% 83% 17%Sancta Maria's Windsor House n/a n/a n/a 67% 33%Sarah Care Boston n/a n/a n/a 68% 16%Sarah's Place - Original 20 70% 30% 74% 26%Sarah's Place Too ADHC 20 80% 20% 84% 16%Second Home ADHC 19 11% 89% n/a n/aSecond Home Arevik ADHC LLC 15 20% 80% n/a n/aSeniority Social & Adult Day Care, Inc. 7 14% 86% 38% 63%Serenity Care Adult Day Health 24 29% 71% n/a n/aSeven Hills Foundation n/a n/a n/a 21% 79%Shapiro Rudolph Adult Day Health Center 14 79% 21% 92% 8%SMEC Adult Day Health 13 23% 77% 42% 58%South Street Adult Day Health 16 0% 100% n/a n/aSpectrum Adult Day Health North Andover 14 79% 21% 100% 0%Spectrum Adult Day Health 12 67% 33% 95% 5%St. Camillus Adult Day Health Center 18 72% 28% n/a n/aStay Well Adult Health Day Center, Inc. 21 19% 81% 18% 100%Sterling Adult Day Health* 29 93% 7% 86% 14%Stoughton Adult Medical Day Care Center, Inc. 19 37% 63% 19% 81%
55

Adult Day Health Facility Name
# HCPs (reported as of 12/31/16)
Vaccine Coverage 2016-17
Vaccine Declined 2016-17
Vaccine Coverage 2015-16
Vaccine Declined 2015-16
Thayercare, Inc. 19 37% 63% 57% 43%The Brien Center 17 41% 59% 33% 67%The Community Family Everett Center 23 78% 22% 76% 24%The Community Family Lowell Center 16 69% 31% 43% 57%The Community Family Medford Center 16 75% 25% 74% 26%VNA Compass Adult Day Health* 5 100% 0% 88% 13%VNA Tradewinds Adult Day Health* 12 100% 0% 100% 0%Wernick Adult Day Health* 8 100% 0% 100% 0%West Springfield Adult Care, LLC DBA-Quality Life Adult Day Services #1 14 21% 79% 39% 61%Westfield Adult Day Health* 8 100% 0% 100% 0%Windsor Adult Day Health 4 75% 25% n/a n/aWinter Garden Adult Day Health, ADH, Inc. 22 32% 68% n/a n/aWorcester Adult Day Care Center 22 23% 77% 16% 84%Worcester Adult Day Care Sarah Care 21 38% 62% 30% 70%Zabota Adult Day Health 28 25% 75% 29% 82%Zdorovie Adult Day Health Center 21 38% 62% 77% 23%Zdorovie Senior Services, LLC 30 43% 57% 68% 32%
*Vaccination rate greater than 90% in 2016-17
56