amended & restated prefeasibility study - ni 43-101...
TRANSCRIPT

EFFECTIVE DATE: 13 January 2015 Document No: 0465-RPT-014 Rev 1
ISSUE DATE: 10 July 2015
Page i
Norra Kärr Project PFS
Gränna, Sweden
Amended & Restated Prefeasibility Study - NI 43-101 - Technical report for
the Norra Kärr Rare Earth Element Deposit
Prepared For:
Tasman Metals Ltd
QUALIFIED PERSONS: Michael Short, BE (Civil), CEng FIMMM, FAusIMM(CP), FIEAust CPEng Thomas Apelt, BEng, PhD (Chem Eng), CEng MIChemE, MAusIMM(CP) – Process Greg Moseley, BSc, MSc, CEng, MIMM, FRGS, Associate – Geology and Mineral Resources Mark Mounde, BEng, CEng, MIMMM, Technical Director – Mining and Mineral Reserves Gareth Digges La Touche (BSc, MSc, FGS, CGeol, EurGeol)
CONTRIBUTING CONSULTANTS: GBM Minerals Engineering Consultants Limited Wardell Armstrong International Limited Golder Associates Limited
Compiled By:
GBM Project Number: 0465

NI 43-101 - Technical report Norra Kärr REE - 0465-RPT-014 Rev 1
Page ii
Document Approval
Role Name
Prepared by Project Engineer Tom Davidson
Checked by Project Controls Manager Jo Thompson
Approved by Qualified Person Michael Short
Approved by Qualified Person Thomas Apelt
Approved by Qualified Person Greg Moseley
Approved by Qualified Person Mark Mounde
Approved by Qualified Person Gareth Digges La Touche
Revision History
Date Rev Reason Prepared Checked Approved
16/12/2014 A Initial Draft TD JFT TD
20/02/2015 0 Issued as Final TD JFT MS / GM / MM / GDLT
10/07/2015 1 Issued as Final – Amended and Restated
TD JFT MS / GM / MM / TA / GDLT
IMPORTANT NOTE:
This report was prepared as a National Instrument 43-101 Technical Report, in accordance with Form 43-101F1, for Tasman
Metals Ltd by GBM Minerals Engineering Consultants Limited. The quality of information, conclusions, and estimates contained
herein is consistent with the level of effort involved in GBM’s services, based on: i) information available at the time of
preparation, ii) data supplied by outside sources, and iii) the assumptions, conditions, and qualifications set forth in this report.
This report is intended to be filed as a Technical Report with Canadian securities regulatory authorities pursuant to National
Instrument 43-101, Standards of Disclosure for Mineral Projects. Except for the purposes legislated under provincial securities
law, any other use of this report by any third party is at that party’s sole risk.

NI 43-101 - Technical report Norra Kärr REE - 0465-RPT-014 Rev 1
Page 1
TABLE OF CONTENTS
SECTION 1 SUMMARY.............................................................................................................. 20
1.1 Introduction ........................................................................................................... 20
1.2 Background ........................................................................................................... 20
1.3 Norra Kärr Geology .............................................................................................. 20
1.4 Metallurgical Testwork and Process Design ...................................................... 21
1.5 Mineral Resource Estimates ................................................................................ 21
1.6 Mineral Reserve Estimates .................................................................................. 25
1.7 Mineral Extraction Methods ................................................................................. 25
1.8 Tailings storage Facility ....................................................................................... 25
1.9 Environmental Studies, Permitting and Social or Community Impact ............. 26
1.10 Conclusions and Recommendations .................................................................. 28
SECTION 2 INTRODUCTION ..................................................................................................... 31
2.1 General .................................................................................................................. 31
2.2 Financial Interest Disclaimer ............................................................................... 31
2.3 Sources of Information ......................................................................................... 31
2.4 Qualified Persons ................................................................................................. 31
2.5 Qualified Person Site Visit ................................................................................... 32
2.6 Qualified Person Sectional Responsibility ......................................................... 32
2.7 Units and Currency ............................................................................................... 33
SECTION 3 RELIANCE ON OTHER EXPERTS ........................................................................ 34
SECTION 4 PROPERTY DESCRIPTION AND LOCATION ....................................................... 35
4.1 Location ................................................................................................................. 35
4.2 Mineral Title ........................................................................................................... 36
4.3 Environmental Liabilities ..................................................................................... 37
4.4 Permits .................................................................................................................. 38
SECTION 5 ACCESSIBILITY, CLIMATE, LOCAL RESOURCES, INFRASTRUCTURE AND
PHYSIOGRAPHY ................................................................................................... 39

NI 43-101 - Technical report Norra Kärr REE - 0465-RPT-014 Rev 1
Page 2
5.1 Access ................................................................................................................... 39
5.2 Climate and Length of Operating Season ........................................................... 39
5.3 Proximity to Population Centre and Transport................................................... 40
5.4 Surface Rights, Land Availability, Infrastructure, and Local Resources .......... 41
5.5 Topography, Elevation, and Vegetation .............................................................. 42
SECTION 6 HISTORY ................................................................................................................ 44
6.1 Summary of Regional Exploration and Mining History...................................... 44
6.2 Historical Resource Estimates ............................................................................ 46
SECTION 7 GEOLOGICAL SETTING AND MINERALISATION ............................................... 47
7.1 Regional Geology ................................................................................................. 47
7.2 District Geology .................................................................................................... 50
7.3 Property Geology .................................................................................................. 50
7.4 Norra Kärr Geology and Mineralisation .............................................................. 51
SECTION 8 DEPOSIT TYPES .................................................................................................... 61
8.1 General .................................................................................................................. 61
8.2 REE Deposits – Discussion ................................................................................. 64
SECTION 9 EXPLORATION ...................................................................................................... 67
9.1 Initial Works .......................................................................................................... 67
9.2 Topographic Mapping .......................................................................................... 68
9.3 Geological Mapping .............................................................................................. 71
SECTION 10 DRILLING ............................................................................................................... 83
SECTION 11 SAMPLE PREPARATION, ANALYSES, AND SECURITY .................................... 86
11.1 Core Cutting .......................................................................................................... 86
11.2 Sample Preparation .............................................................................................. 86
11.3 Analyses ................................................................................................................ 87
11.4 QA/QC .................................................................................................................... 89
11.5 Density Determination ........................................................................................ 110
SECTION 12 DATA VERIFICATION .......................................................................................... 111

NI 43-101 - Technical report Norra Kärr REE - 0465-RPT-014 Rev 1
Page 3
12.1 Field Verification ................................................................................................. 111
12.2 Sampling Verification ......................................................................................... 117
SECTION 13 MINERAL PROCESSING AND METALLURGICAL TESTING............................. 118
13.1 Historical Testing ................................................................................................ 118
13.2 Current Testing ................................................................................................... 118
13.3 Material Issues and Deleterious Elements ........................................................ 134
13.4 Summary ............................................................................................................. 135
SECTION 14 MINERAL RESOURCE ESTIMATES ................................................................... 136
14.1 Current Estimate WAI (2014) .............................................................................. 136
14.2 Topography ......................................................................................................... 136
14.3 Database Compilation ........................................................................................ 137
14.4 Geological Interpretation-Wireframe Modelling ............................................... 138
14.5 Sample Data Processing .................................................................................... 142
14.6 Variography ......................................................................................................... 148
14.7 Volumetric Modelling ......................................................................................... 157
14.8 Density................................................................................................................. 160
14.9 Grade Estimation ................................................................................................ 160
14.10 Validation ............................................................................................................ 166
14.11 Depletion ............................................................................................................. 177
14.12 Mineral Resource Classification ........................................................................ 177
SECTION 15 MINERAL RESERVE ESTIMATES ...................................................................... 183
15.1 Current Estimate ................................................................................................. 183
15.2 Open Pit Mine Planning ...................................................................................... 183
15.3 Economic Cut-Off Grades .................................................................................. 188
15.4 Pit Shell Selection ............................................................................................... 188
SECTION 16 MINING METHODS .............................................................................................. 191
16.1 Mining Operations and Equipment .................................................................... 191
16.2 Equipment Fleet Summary ................................................................................. 195

NI 43-101 - Technical report Norra Kärr REE - 0465-RPT-014 Rev 1
Page 4
16.3 Mining Operations .............................................................................................. 196
16.4 Mine Manpower Requirements .......................................................................... 198
16.5 Mine Production Schedule ................................................................................. 200
16.6 Geotechnical Parameters ................................................................................... 205
16.7 Open Pit Pumping Requirements ...................................................................... 210
16.8 Waste Rock Dumps ............................................................................................ 211
SECTION 17 RECOVERY METHODS ....................................................................................... 213
17.1 PROCESS DESCRIPTION ................................................................................... 213
17.2 Process Plant Infrastructure and Reagents ...................................................... 217
SECTION 18 PROJECT INFRASTRUCTURE ........................................................................... 219
18.1 Facility Layout..................................................................................................... 219
18.2 Access ................................................................................................................. 219
18.3 Buildings and Structure ..................................................................................... 219
18.4 Transportation of Goods and Services ............................................................. 223
18.5 Power ................................................................................................................... 223
18.6 Water ................................................................................................................... 224
18.7 Tailings Facility ................................................................................................... 224
SECTION 19 MARKET STUDIES AND CONTRACTS .............................................................. 237
19.1 Overview of Rare Earth Elements and Products .............................................. 237
19.2 Rare Earth ELEMENT Production and Supply Forecast .................................. 237
19.3 Rare Earth ELEMENT Consumption and Demand Forecast ............................ 240
19.4 REE Supply/Demand Balance ............................................................................ 245
19.5 REE Pricing and Forecast .................................................................................. 245
19.6 Potential Customers ........................................................................................... 248
19.7 Potential Upside From Co-Products ................................................................. 250
SECTION 20 ENVIRONMENTAL STUDIES, PERMITTING, AND SOCIAL OR COMMUNITY
IMPACT ................................................................................................................ 251
20.1 Environmental Summary .................................................................................... 251

NI 43-101 - Technical report Norra Kärr REE - 0465-RPT-014 Rev 1
Page 5
20.2 Expected Material Environmental Issues .......................................................... 276
20.3 Waste and Tailings Disposal ............................................................................. 290
20.4 Site Monitoring.................................................................................................... 292
20.5 Water Management ............................................................................................. 293
20.6 Permitting ............................................................................................................ 306
20.7 Social and Community Requirements .............................................................. 318
20.8 Project Closure ................................................................................................... 323
20.9 Health and Safety Issues .................................................................................... 326
SECTION 21 CAPITAL AND OPERATING COSTS .................................................................. 328
21.1 Capital Cost Estimates ....................................................................................... 328
21.2 Operating Cost Estimates .................................................................................. 333
SECTION 22 ECONOMIC ANALYSIS ....................................................................................... 338
SECTION 23 ADJACENT PROPERTIES ................................................................................... 342
SECTION 24 OTHER RELEVANT DATA AND INFORMATION ................................................ 343
24.1 Discounted Cash Flow Model ............................................................................ 343
24.2 Project Execution Plan ....................................................................................... 345
SECTION 25 INTERPRETATION AND CONCLUSIONS ........................................................... 346
25.1 Mineral Resources .............................................................................................. 346
25.2 Mineral Reserves ................................................................................................ 347
25.3 Environmental and Community ......................................................................... 348
SECTION 26 RECOMMENDATIONS ......................................................................................... 350
26.1 Mineral Reserves ................................................................................................ 350
26.2 Tailings Storage Facility ..................................................................................... 351
26.3 Metallurgy and Process ...................................................................................... 352
26.4 Environmental and Community ......................................................................... 352
26.5 Estimated costs for recommendations ............................................................. 357
SECTION 27 REFERENCES ...................................................................................................... 358
APPENDIX A. QUALIFIED PERSONS CERTIFICATES .............................................................. 363

NI 43-101 - Technical report Norra Kärr REE - 0465-RPT-014 Rev 1
Page 6
APPENDIX B. WAI TAILINGS DRAWINGS ................................................................................. 369
B.1 ZL611067-101-Layout .......................................................................................... 369
B.2 ZL611067-102-Layout .......................................................................................... 369
B.3 ZL611067-108-Layout .......................................................................................... 369
APPENDIX C. GBM LAYOUT DRAWINGS ................................................................................. 373
C.1 0465-000-G-001_Rev0 ......................................................................................... 373
C.2 0465-000-G-003_Rev0 ......................................................................................... 373
C.3 0465-000-G-004_Rev0 ......................................................................................... 373

NI 43-101 - Technical report Norra Kärr REE - 0465-RPT-014 Rev 1
Page 7
LIST OF TABLES
Table 1-1: Norra Kärr Mineral Resource Estimate (4) ......................................................................... 24
Table 1-2: Total Project Initial Capital Expenditure ............................................................................. 28
Table 1-3 Operating Expenditure over Life of Mine ............................................................................ 28
Table 2-1: Responsible Qualified Persons .......................................................................................... 33
Table 4-1: Tasman Norra Kärr Licence Details ................................................................................... 37
Table 6-1: Boliden 1974 North Trench Results (PAH, 2012) .............................................................. 46
Table 6-2: Boliden 1974 South Trench Results (PAH, 2012) .............................................................. 46
Table 8-1: Primary REE Deposit Types (14) ...................................................................................... 61
Table 9-1: Comparison of Tasman Grab Samples vs. Boliden Composite Trench Samples .............. 67
Table 9-2: Example of Detailed Drill Hole Log (Hole NKA10014) ....................................................... 78
Table 10-1: Summary of Tasman Exploration Drilling Activity ........................................................... 83
Table 11-1: ALS Chemex ME-MS81 Detection Limits ....................................................................... 88
Table 11-2: CRM Sample Summary ................................................................................................... 99
Table 11-3: WAI 2014 Duplicate Sample Summary .......................................................................... 106
Table 11-4: Risk Matrix: QA/QC Sample Auditing ............................................................................ 107
Table 13-1: RESCOMP Modal Mineralogy ....................................................................................... 122
Table 13-2: Crushing Work Index ..................................................................................................... 123
Table 13-3: Bond Mill Work Index ..................................................................................................... 123
Table 13-4: Abrasion Index .............................................................................................................. 123
Table 13-5: Selected Results for Batch ............................................................................................ 129
Table 13-6: Batch 1 Size-By-Size Yttrium Recovery ......................................................................... 129
Table 13-7 REE oxalate concentrate chemical analyses .................................................................. 134
Table 14-1: Sample Data Summary ................................................................................................. 137
Table 14-2: Selected Sample Summary by LTYPE .......................................................................... 142
Table 14-3: Decile Analysis – Sm LTYPE 4 ...................................................................................... 146
Table 14-4: Norra Kärr Top-Cut Summary ........................................................................................ 147
Table 14-5: Summary of Variogram Models ..................................................................................... 152

NI 43-101 - Technical report Norra Kärr REE - 0465-RPT-014 Rev 1
Page 8
Table 14-6: Summary of Block Model Parameters ........................................................................... 157
Table 14-7: Estimation Parameters for Dip and Dip Direction .......................................................... 158
Table 14-8: Density Values Applied by Zone .................................................................................... 160
Table 14-9: Grade Estimation Parameters ....................................................................................... 165
Table 14-10: Initial Search Ellipse Sizes for Grade Estimation ......................................................... 165
Table 14-11: Validation Stats - Composite Grades vs. Block Grades ............................................... 169
Table 14-12: Norra Kärr Mineral Resource Estimate Pit Optimisation Parameters (WAI, 2014) ....... 180
Table 14-13: Rare Earth Oxide Conversion Factors (PAH, 2011) (4) ............................................... 181
Table 14-14: Norra Kärr Mineral Resource Estimate (WAI, 2014) .................................................... 182
Table 15-1: Norra Kärr Pit Optimisation Parameters ........................................................................ 186
Table 15-2: Economic Cut-Off Grades (PGT & GTM) ....................................................................... 188
Table 15-3: Norra Kärr Mineral Reserve Estimate (WAI, November 2014) ....................................... 190
Table 16-1: Loading Parameters ...................................................................................................... 194
Table 16-2: Truck Loading and Dumping Parameters ...................................................................... 194
Table 16-3: Mining Equipment Fleet ................................................................................................. 195
Table 16-4: Haul Road Design Parameters ...................................................................................... 197
Table 16-5: Salary Structure ............................................................................................................. 198
Table 16-6: Mining Personnel Requirements .................................................................................... 198
Table 16-7: Mining Production Schedule .......................................................................................... 201
Table 16-8: Sector Stereographic Analysis ....................................................................................... 205
Table 16-9: Sector Slope Angles ...................................................................................................... 206
Table 16-10: Predicted inflow rates .................................................................................................. 210
Table 16-11: Pump Specifications .................................................................................................... 211
Table 17-1 Process design criteria ................................................................................................... 213
Table 17-2 REE Overall Recovery .................................................................................................... 214
Table 18-1 Building and Structure Details of Nora Kärr process plant .............................................. 220
Table 18-2: Assumed Waste Stream Parameters............................................................................. 231
Table 18-3: Approximate earthworks quantities for TSF construction ............................................... 232
NI 43-101 - Technical report Norra Kärr REE - 0465-RPT-014 Rev 1
Page 9
Table 18-4: Principal TSF dimensions .............................................................................................. 234
Table 19-1: Global Rare Earth Production by Country (t) ................................................................. 238
Table 19-2: 2013 REE Production .................................................................................................... 238
Table 19-3: Demand Summary ........................................................................................................ 242
Table 19-4 REO Price Deck ............................................................................................................. 247
Table 19-5 Estimated REO Demand ................................................................................................ 249
Table 20-1: Baseline studies prepared by other experts ................................................................... 252
Table 20-2: Key source documents .................................................................................................. 253
Table 20-3: Baseline Studies Relating to Surface Water .................................................................. 260
Table 20-4: Ecology baseline studies ............................................................................................... 267
Table 20-5: Archaeological baseline study ....................................................................................... 270
Table 20-6: Cultural heritage objects ................................................................................................ 270
Table 20-7: Input Meteorological Data and WAI snowmelt adjustment ............................................. 296
Table 20-8: Percentile Annual Precipitation Depths .......................................................................... 296
Table 20-9: Haul and Access road areas ......................................................................................... 299
Table 20-10: Objectives and area of application of the Environmental Code .................................... 306
Table 20-11: Required permits ......................................................................................................... 316
Table 20-12: Activities Subject to the Permitting Process of Environmental Code ............................ 317
Table 20-13: Responses, September 2014 telephone survey (Skop / Kristdemokraterna) ............... 321
Table 20-14: Responses, August 2014 web panel survey (Novus / P4 radio) .................................. 322
Table 20-15: Most Relevant Swedish H&S Regulations ................................................................... 327
Table 21-1 Total capital cost estimate .............................................................................................. 330
Table 21-2: Mining CAPEX Summary .............................................................................................. 331
Table 21-3 Process Capital estimate summary ................................................................................ 332
Table 21-4: TSF Budget Cost Summary ........................................................................................... 333
Table 21-5 Operating Summary ....................................................................................................... 333
Table 21-6: Mining Operating Costs ................................................................................................. 336
Table 21-7: Bill of Rates – Labour .................................................................................................... 337

NI 43-101 - Technical report Norra Kärr REE - 0465-RPT-014 Rev 1
Page 10
Table 22-1 Key input parameters ..................................................................................................... 338
Table 22-2 REO Prices used in Financial model .............................................................................. 339
Table 22-3 DCF results for Norra Kärr in USD ................................................................................. 340
Table 26-1 Estimated Costs for development ................................................................................... 357
LIST OF FIGURES
Figure 4-1: Location of the Norra Kärr Project, Sweden .................................................................... 35
Figure 4-2: Relative Position of the Norra Kärr Licences (s.l.) ............................................................ 36
Figure 6-1: Location of the Boliden 1974 Trenches ............................................................................ 45
Figure 7-1: Litho-Tectonic and Shear Zone Map of the Sveco-Norwegian Orogen, South-Western
Scandinavia ........................................................................................................................................ 47
Figure 7-2: Generalised Geological Map of the Fennoscandian Shield Showing the TIB .................. 48
Figure 7-3: Aeromagnetic Anomaly Map of Southern Sweden .......................................................... 49
Figure 7-4: Simplified Geological Outline of the Svecconorwegian Orogeny ..................................... 50
Figure 7-5: Possible Shearing Movement for the Norra Kärr Intrusive ............................................... 52
Figure 7-6 Geological Map of the Norra Kärr Intrusive ....................................................................... 54
Figure 7-7: Norra Kärr Intrusive Body Litho Types.............................................................................. 55
Figure 7-8: Foliated Kaxtorpite .......................................................................................................... 56
Figure 7-9: GTM - “Migmatitic” Grennaite Medium Grained ............................................................... 56
Figure 7-10: PGT-Pegmatitic Schlieren/Veining in Grennaite, with Elongated Crystals of Catapleiite
and Crystals of Eudyalite .................................................................................................................... 57
Figure 7-11: GTC-Fine Grained Grennaite with Bluish-White Elongated Catapleiite Crystals ............ 58
Figure 7-12: Norra Kärr REE Distribution .......................................................................................... 59
Figure 7-13: Norra Kärr REO Distribution by Major Ore Types ........................................................... 59
Figure 7-14: Norra Kärr REO Distribution by Rock Domain (Chondrite Normalised) ......................... 60
Figure 8-1: Periodic Table Showing LREO/HERO “Split” .................................................................. 63
Figure 8-2: REE Criticality Matrices (14) ............................................................................................ 63
Figure 8-3: Selection of REE-bearing Mineral (14) ............................................................................. 64

NI 43-101 - Technical report Norra Kärr REE - 0465-RPT-014 Rev 1
Page 11
Figure 8-4: Possible Mode of Formation of the IIimaussaq Intrusion ................................................. 66
Figure 9-1: Swedish Survey 1:50 000 Topographic Sheet (56375 DinKarta) ..................................... 69
Figure 9-2: Orthophoto of the Norra Kärr Licence .............................................................................. 69
Figure 9-3: Colour Coded DEM of Norra Kärr .................................................................................... 70
Figure 9-4: Contour Plan of Norra Kärr at 1 m Intervals .................................................................... 70
Figure 9-5: Geological Plan Showing Observation Points and the Old Boliden Pits .......................... 72
Figure 9-6 Geological Map of the Norra Kärr Intrusive Showing Drill Hole Traces .............................. 74
Figure 9-7: Geological Plan of Norra Kärr Showing Foliation Trends ................................................. 76
Figure 9-8: “Typical” Geological Section of Norra Kärr Showing Foliation Trends ............................. 76
Figure 9-9: Core Photography and Corresponding Strip Log ............................................................. 77
Figure 9-10: Legend for Geological Sections (Section A ................................................................... 79
Figure 9-11: Section A, Geological Cross Section ............................................................................. 79
Figure 9-12: Section B, Geological Cross Section ............................................................................. 80
Figure 9-13: Section C, Geological Cross Section ............................................................................. 81
Figure 9-14: Section D, Geological Cross Section ............................................................................. 82
Figure 10-1: Core Logging Facility ..................................................................................................... 85
Figure 11-1: ALS Chemex Sample Preparation Facility Piteå ............................................................ 87
Figure 11-2: Dy Field Duplicate QA/QC Results ................................................................................ 90
Figure 11-3: Y Field Duplicate QA/QC Results .................................................................................. 91
Figure 11-4: Nd Field Duplicate QA/QC Results ................................................................................ 92
Figure 11-5: Dy Laboratory Duplicate QA/QC Results .................................................................. 94
Figure 11-6: Y Laboratory Duplicate QA/QC Results ......................................................................... 95
Figure 11-7: Nd Laboratory Duplicate QA/QC Results ...................................................................... 96
Figure 11-8: Dy Blank Sample Results .............................................................................................. 97
Figure 11-9: Y Blank Sample Results ................................................................................................ 98
Figure 11-10: Nd Blank Sample Results ............................................................................................ 98
Figure 11-11: CRM OREAS 100a Dy Results ................................................................................. 102
Figure 11-12: CRM OREAS 100a Nd Results ................................................................................. 102

NI 43-101 - Technical report Norra Kärr REE - 0465-RPT-014 Rev 1
Page 12
Figure 11-13: CRM OREAS 104 Eu Results ................................................................................... 103
Figure 11-14: CRM OREAS 45p Y Results ..................................................................................... 103
Figure 11-15: CRM OREAS 45c Dy Results .................................................................................... 104
Figure 11-16: CRM NKA01 Dy Results ........................................................................................... 104
Figure 11-17: CRM NKA02 Gd Results ........................................................................................... 105
Figure 11-18: Dy ACTLABS External Duplicates .............................................................................. 109
Figure 12-1: Tasman Geologists at a Typical Norra Kärr Outcrop ................................................... 112
Figure 12-2: Site of Former Boliden Excavation .............................................................................. 112
Figure 12-3: Pegmatitic Grennaite (PGT Domain) ........................................................................... 113
Figure 12-4: The “Discovery” Outcrop Showing Pink Eudyalite ....................................................... 113
Figure 12-5: Plan Showing Drill Hole Collar Positions and the WAI Site Visit Trajectory ................. 115
Figure 12-6: Enlarged Image Showing Drill Hole Sites and WAI Site Visit Trajectory ...................... 116
Figure 12-7: Drill Hole Collar Marked by Casing .............................................................................. 116
Figure 13-1: ANZAPLAN composite locations .................................................................................. 120
Figure 13-2: Norra Kärr Surface Resource Map with Borehole Locations ........................................ 121
Figure 13-3: ANZAPLAN Modal Mineralogy ..................................................................................... 124
Figure 13-4: Comparison of mineral liberation for samples GTM, PGT, SPGT, CPGT, NPGT and GTC
in fraction 0.1 mm to 0.5 mm ............................................................................................................ 125
Figure 13-5: Comparison of mineral liberation for samples GTM, PGT, SPGT, CPGT, NPGT and GTC
in fraction 0.02 mm to 0.1 mm .......................................................................................................... 125
Figure 13-6: Comparison of mineral liberation for samples GTM, PGT, SPGT, CPGT, NPGT and GTC
in fraction <0 02 mm ......................................................................................................................... 126
Figure 13-7: Aluminium Grade and Recovery Versus Magnetic Mass Fraction ................................ 127
Figure 13-8: Yttrium Grade and Recovery Versus Magnetic Mass Fraction ..................................... 128
Figure 13-9 Acid consumption .......................................................................................................... 131
Figure 13-10 Acid consumption ........................................................................................................ 131
Figure 13-11 Cerium equilibrium loading isotherm ........................................................................... 133
Figure 13-12 Yttrium equilibrium loading isotherm ............................................................................ 133
Figure 14-1: Drill Hole Layout and Topographic Plan (WAI, 2014) .................................................. 136
NI 43-101 - Technical report Norra Kärr REE - 0465-RPT-014 Rev 1
Page 13
Figure 14-2: Long Section of Norra Kärr Drill Holes, Easting Line 474398.65 ................................. 138
Figure 14-3: Tasman Geological Interpretation Cross Section – Northing 6440409.46 ................... 140
Figure 14-4: WAI Mineralised Wireframe Cross Section – Northing 6440409.46 (SWEREF99TM) . 141
Figure 14-5: WAI Mineralisation Wireframes Longsection – Looking West ...................................... 142
Figure 14-6: Dy Histogram Plots for LTYPES 2 to 5 ........................................................................ 144
Figure 14-7: Y Histogram Plots for LTYPES 2 to 5 .......................................................................... 145
Figure 14-8: Average Sample Length Histogram ............................................................................. 148
Figure 14-9: Continuity Maps of Dy for the Porphyritic Grennaite (LTYPE=4). Horizontal Continuity
(Top) and Dip Plane Continuity (Bottom) .......................................................................................... 150
Figure 14-10: Variogram Models for Dy – Porphyritic Grennaite (LTYPE=4) ................................... 151
Figure 14-11: Ellipse Representing Variogram Ranges and GTM Wireframe .................................. 156
Figure 14-12: Ellipse Representing Variogram Ranges and Grennaite with Pegmatitic Zones
Wireframe ......................................................................................................................................... 156
Figure 14-13: Ellipse Representing Variogram Ranges with Porphyritic Grennaite Wireframe ......... 157
Figure 14-14: Vertical Section Showing Estimated Dip and Dip Direction at Y=6,440,015 .............. 159
Figure 14-15: Vertical Section Showing Estimated Dip and Dip Direction at Y=6,440,115 .............. 159
Figure 14-16: KNA Results for Block Size Using Dy in Grennaite with Pegamatitic Zones .............. 161
Figure 14-17: KNA Results for Varying Number of Samples Used During Estimation Using Dy in
Grennaite with Pegmatitic Zones ...................................................................................................... 162
Figure 14-18: KNA Results for Varying Search Ellipse Sizes Using Dy in Grennaite with Pegmatitic
Zones ............................................................................................................................................... 163
Figure 14-19: KNA Results for Varying Block Discretisation Using Dy in Grennaite with Pegmatitic
Zones ............................................................................................................................................... 164
Figure 14-20: Example East-West Vertical Section Showing Composite and Estimated Grades at
Northing=6439915 ............................................................................................................................ 167
Figure 14-21: Example East-West Vertical Section Showing Composite and Estimated Grades at
Northing=6440115 ............................................................................................................................ 167
Figure 14-22: Example East-West Vertical Section Showing Composite and Estimated Grades at
Northing=6440215 ............................................................................................................................ 168

NI 43-101 - Technical report Norra Kärr REE - 0465-RPT-014 Rev 1
Page 14
Figure 14-23: Example East-West Vertical Section Showing Composite and Estimated Grades at
Northing=6440315 ............................................................................................................................ 168
Figure 14-24: Grade Profile Plots for Dy .......................................................................................... 174
Figure 14-25: Grade Profile Plots for Dy in Grennaite with Pegmatitic Zones .................................. 175
Figure 14-26: Grade Profile Plots for Dy in Porphyritic Grennaite .................................................... 176
Figure 15-1: Norra Kärr – Cut away view – Pit Design and Block Model ......................................... 185
Figure 15-2: Norra Kärr – Optimised Ultimate Pit and Design Pit Shell ........................................... 185
Figure 15-3 Norra Kärr – Plan of Final Pit Design............................................................................. 189
Figure 16-1: Example Blast Pattern .................................................................................................. 192
Figure 16-2: LOM Equipment Profile ................................................................................................ 195
Figure 16-3: Site Plan, Main Haul Roads.......................................................................................... 196
Figure 16-4: Typical Haul Road Construction (CAT Publication) (14) ............................................... 197
Figure 16-5: Mining Schedule Summary .......................................................................................... 200
Figure 16-6 Norra Kärr – Pushbacks and Final Designs ................................................................... 203
Figure 16-7 Norra Kärr – Final Design with Topography and E4 Highway ........................................ 204
Figure 16-8: Phase2 Models of Total Displacement of South East Fault Design 1 and 2 ................. 208
Figure 16-9: Phase2 Models of Maximum Shear Strain of SE Fault Design 1 and 2, ....................... 208
Figure 16-10: Optimised Pit Shell with Interpolated RQD on Shell Surface ...................................... 209
Figure 16-11: Proposed Mine Waste Dump Site .............................................................................. 212
Figure 17-1 Comminution and Beneficiation Block Flow Diagram .................................................... 215
Figure 17-2: Hydrometallurgical Extraction and Recovery Block Flow Diagram ............................... 217
Figure 18-1 Plant and Infrastructure layout ....................................................................................... 219
Figure 18-2: Localisation Study TSF option sites ............................................................................. 225
Figure 18-3: Proposed Layout of TSF .............................................................................................. 227
Figure 18-4: Geology of TSF site ...................................................................................................... 228
Figure 19-1: Estimated Global REO Supply (by Element) ................................................................ 240
Figure 19-2: Breakdown of Rare Earth Usage by Element 2013 ...................................................... 241
Figure 19-3: Identification of Critical Rare Earth Elements - Percentage Over/Under Supply ........... 245

NI 43-101 - Technical report Norra Kärr REE - 0465-RPT-014 Rev 1
Page 15
Figure 20-1: Environmental context .................................................................................................. 255
Figure 20-2: Environment within and near the Project site is characterised by an interaction of human
and natural factors. Typical landscape includes agricultural land and deciduous trees .................... 256
Figure 20-3: Lush vegetation at Natura 2000 site Narbäck ............................................................... 257
Figure 20-4: Adelövån stream at Häggebäcken (between Gransjön and Hultsjön) ........................... 262
Figure 20-5: Lake Gyllingesjön ......................................................................................................... 264
Figure 20-6: A mosaic of environments typical of the project area and environs .............................. 266
Figure 20-7: Great ash trees in the exploitation concession area, near the outcrop ......................... 269
Figure 20-8: Areas covered by terrestrial baseline studies ............................................................... 272
Figure 20-9: Sampling Point Locations ............................................................................................. 274
Figure 20-10: This pond within the concession area is home to great crested newt ......................... 285
Figure 20-11: Conceptual Water Balance flow diagram .................................................................... 300
Figure 20-12: Indicated required additional storage volumes (all climatic scenarios) ....................... 302
Figure 20-13: Total discharge to Adelövån (Extreme Wet scenario) ................................................. 303
Figure 20-14: Swedish mining permitting process. Permits needed to open a mine in Sweden ....... 310
Figure 20-15: Permitting process according to Environmental Code ................................................ 311
Figure 21-1 Total project operating costs breakdown ....................................................................... 334
Figure 21-2 Reagent cost breakdown ............................................................................................... 335
Figure 22-1 Percent of Design Capacity versus Months since Commissioning ................................ 339
Figure 22-2 Norra Kärr at 10 % discount rate ................................................................................... 340
Figure 22-3 Norra Kärr Project at 10 % discount rate ....................................................................... 341
Figure 22-4 Norra Kärr Project at 10 % discount rate ....................................................................... 341
Figure 24-1 Norra Kärr Implementation schedule ............................................................................. 345

NI 43-101 - Technical report Norra Kärr REE - 0465-RPT-014 Rev 1
Page 16
STANDARD TERMS AND NOMENCLATURE
The following abbreviations are used throughout this report:
Abbreviation Description
5DP Studio 5D Planner®
AMSL Above mean sea level
BFA Bench Face Angle
BGS British Geological Survey
CAPEX Capital Expenditure
CRM Certified Reference Materials
DCF Discounted Cash Flow
EIA Environmental Impact Assessment
EPCM Engineering Procurement Construction Management
EQS Environmental Quality Standards
EU European Union
Ga Gigaannum (one billion years)
GBM GBM Minerals Engineering Consultants Limited
Golder Golder Associates
HGMS High Grade Material Separation
HREE Heavy Rare Earth Elements
HREO Heavy Rare Earth Oxides
ICP Inductively Coupled Plasma
ICP-AES Inductively Coupled Plasma – Atomic Emission Spectrometry
ICP-MS Inductively Coupled Plasma – Mass Spectrometry
IDW2 Inverse Power of Distance Squared
IRA Inter-ramp Angle
IRR Internal Rate of Return
IUCN International Union for Conservation of Nature and Natural Resources
KNA Kriging Neighbourhood Analysis
LOM Life of Mine
LREE Light Rare Earth Elements
LREO Light Rare Earth Oxides
MLA Mineral Liberation Analysis
MMCRM Matrix-matched Certified Reference Material
MREE Medium Rare Earth Elements
n/a Not applicable
NN Nearest Neighbour
NPV Net Present Value
NI 43-101 - Technical report Norra Kärr REE - 0465-RPT-014 Rev 1
Page 17
Abbreviation Description
NPVS NPV Scheduler®
NSD North Scandinavian Drilling
OEM Original Equipment Manufacturers
OK Ordinary Kriging
Olstam BT Olstam Borrteknik AB
OPEX Operating Expenditure
OREAS Ore Research and Exploration Pty Ltd
PEA Preliminary Economic Assessment
PFS Pre-Feasibility Study
PLS Pregnant Leach Solution
QA/QC Quality Assurance/Quality Control
REE Rare Earth Elements
REO Rare Earth Oxides
RL Relative Level
RO Reverse Osmosis
ROM Run of Mine
RPM Runge Pincock Minarco
RQD Rock Quality Designation
SGU Swedish Geological Survey
SWWB Site Wide Water Balance
TIB Trans Scandinavian Igneous Belt
TREE Total Rare Earth Elements
TREO Total Rare Earth Element Oxides
USA United States of America
USD United States Dollar
WAI Wardell Armstrong International
SRF (FoS) Strength Reduction Factor (Factor of Safety)
The following terms and definitions are used throughout this report:
Term Description
Effective Date (1) The date of the most recent scientific or technical information, included in the Technical Report.

NI 43-101 - Technical report Norra Kärr REE - 0465-RPT-014 Rev 1
Page 18
Term Description
Feasibility Study (FS) (2) A Feasibility Study is a comprehensive technical and economic study of the selected development option for a mineral project, that includes appropriately detailed assessments of realistically assumed mining, processing, metallurgical, economic, marketing, legal, environmental, social and governmental considerations, together with any other relevant operational factors and detailed financial analysis, that are necessary to demonstrate at the time of reporting that extraction is reasonably justified (economically mineable). The results of the study may reasonably serve as the basis for a final decision by a proponent or financial institution to proceed with, or finance, the development of the project. The confidence level of the study will be higher than that of a Pre-Feasibility Study.
Inferred Mineral Resources (2) An Inferred Mineral Resource is that part of a Mineral Resource for which quantity and grade or quality can be estimated on the basis of geological evidence and limited sampling and reasonably assumed, but not verified, geological and grade continuity. The estimate is based on limited information and sampling gathered through appropriate techniques from locations such as outcrops, trenches, pits, workings and drillholes.
Indicated Mineral Resources (2)
An Indicated Mineral Resource is that part of a Mineral Resource for which quantity, grade or quality, densities, shape and physical characteristics, can be estimated with a level of confidence sufficient to allow the appropriate application of technical and economic parameters, to support mine planning and evaluation of the economic viability of the deposit. The estimate is based on detailed and reliable exploration and testing information gathered through appropriate techniques from locations such as outcrops, trenches, pits, workings and drillholes that are spaced closely enough for geological and grade continuity to be reasonably assumed.
Measured Mineral Resources (2)
A Measured Mineral Resource is that part of a Mineral Resource for which quantity, grade or quality, densities, shape, and physical characteristics are so well established that they can be estimated with confidence sufficient to allow the appropriate application of technical and economic parameters, to support production planning and evaluation of the economic viability of the deposit. The estimate is based on detailed and reliable exploration, sampling and testing information gathered through appropriate techniques from locations such as outcrops, trenches, pits, workings and drillholes that are spaced closely enough to confirm both geological and grade continuity.
Mineral Reserves (2) A Mineral Reserve is the economically mineable part of a Measured or Indicated Mineral Resource demonstrated by at least a Preliminary Feasibility Study. This Study must include adequate information on mining, processing, metallurgical, economic, and other relevant factors that demonstrate, at the time of reporting, that economic extraction can be justified. A Mineral Reserve includes diluting materials and allowances for losses that may occur when the material is mined.
Mineral Resources (2) A Mineral Resource is a concentration or occurrence of diamonds, natural solid inorganic material, or natural solid fossilised organic material including base or precious metals, coal and industrial minerals in or on the Earth’s crust in such form and quantity and of such a grade or quality that it has reasonable prospects for economic extraction. The location, quantity, grade, geological characteristics and continuity of a Mineral Resource are known, estimated or interpreted from specific geological evidence and knowledge.
Ore A naturally occurring solid material from which a metal or valuable mineral can be extracted profitably. Ore implies technical feasibility and economic viability that should only be attributed to Mineral Reserves.

NI 43-101 - Technical report Norra Kärr REE - 0465-RPT-014 Rev 1
Page 19
Term Description
Preliminary Feasibility Study or Pre-Feasibility Study (PFS) (2)
A Preliminary Feasibility Study is a comprehensive study of a range of options for the technical and economic viability of a mineral project that has advanced to a stage where a preferred mining method, in the case of underground mining, or the pit configuration, in the case of an open pit, is established and an effective method of mineral processing is determined. It includes a financial analysis based on reasonable assumptions on mining, processing, metallurgical, economic, marketing, legal, environmental, social and governmental considerations and the evaluation of any other relevant factors which are sufficient for a Qualified Person, acting reasonably, to determine if all or part of the Mineral Resource may be classified as a Mineral Reserve.
Preliminary Economic Assessment (PEA) (2)
Means a study, other than a Pre-Feasibility Study or Feasibility Study that includes economic analysis of the potential viability of mineral resources.
Probable Mineral Reserve (2) A Probable Mineral Reserve is the economically mineable part of an Indicated and, in some circumstances, a Measured Mineral Resource demonstrated by at least a Preliminary Feasibility Study. This Study must include adequate information on mining, processing, metallurgical, economic, and other relevant factors that demonstrate, at the time of reporting, that economic extraction can be justified.
Proven Mineral Reserve (2) A Proven Mineral Reserve is the economically mineable part of a Measured Mineral Resource demonstrated by at least a Preliminary Feasibility Study. This Study must include adequate information on mining, processing, metallurgical, economic, and other relevant factors that demonstrate, at the time of reporting, that economic extraction is justified.
Qualified Person (2) A Qualified Person means an individual who is an engineer or geoscientist with at least five years of experience in mineral exploration, mine development or operation or mineral project assessment, or any combination of these; has experience relevant to the subject matter of the mineral project and the Technical Report; and is a member or licensee in good standing of an approved professional association.
Technical Report (2) Means a report prepared and filed in accordance with National Instrument 43-101 and includes, in summary form, all material scientific and technical information in respect of the subject property as of the effective date of the technical report.

NI 43-101 - Technical report Norra Kärr REE - 0465-RPT-014 Rev 1
Page 20
SECTION 1 SUMMARY
1.1 INTRODUCTION
This technical report has been prepared by GBM Minerals Engineering Consultants Limited (GBM),
Wardell Armstrong International Limited (WAI) and Golder Associates (Golder) on behalf of Tasman
Metals Limited (Tasman), who engaged them to prepare a Technical Report in compliance with
Canadian Securities Administrators’ National Instrument 43-101 on the Preliminary Feasibility of the
Norra Kärr Alkaline Complex Rare Earth Element Deposit (the Norra Kärr project), which is located in
Gränna, Sweden.
1.2 BACKGROUND
Located in south-central Sweden, approximately 300 km south-west of Stockholm the project is
positioned approximately 15 km north-east of the small town of Gränna in a rural agrarian setting. The
Norra Kärr project consists of four claims, Norra Kärr No. 1, Norra Kärr No. 2, Norra Kärr No. 3 and
Norra Kärr No. 4, comprising approximately 5 079 hectares.
The project occurs along the border of two counties (Län), the Jönköpings Län in the south and the
Östergötlans Läns in the north. The Norra Kärr property is an intermediate stage exploration project
whose surface has been disturbed only by exploration drilling, trenching and sampling.
Tasman holds its mineral properties indirectly through its 100 percent owned subsidiary, Tasman
Metals AB. holds a 100 percent interest in the four exploration claims, with Claim 1 holding an
exploitation concession, that together form the Norra Kärr project.
1.3 NORRA KÄRR GEOLOGY
The Norra Kärr complex is a zoned agpaitic, peralkaline, nepheline syenite - similar in many respects
to other well-known peralkaline complexes, e.g. Ilimaussaq in Greenland and Lovozero on the Kola
Peninsula of Russia. Norra Kärr has been emplaced in a rift setting (Lake Vättern, 2 km to the west of
Norra Kärr) within the Trans Scandinavian Igneous Belt (TIB). The TIB comprises a giant elongated
array of batholiths extending c. 1 400 km across the Scandinavian Peninsula from south eastern most
Sweden to north western Norway. The Norra Kärr complex is intruded into rocks of the TIB –
specifically the Växjö Granite of the Småland-Värmland belt and is developed as an ovoid mass with
an areal extent of some 1.3 km by 450 m.
The Norra Kärr intrusive exhibits a clear concentric layering. It is not clear if this is primary igneous
layering or not and in this respect there are again similarities with the type localities of Ilimaussaq and
Lovozero. By analogy, it is probable that there is at least a degree of igneous differentiation but the

NI 43-101 - Technical report Norra Kärr REE - 0465-RPT-014 Rev 1
Page 21
mechanics of this are not yet understood. Layering at Norra Kärr from the centre to the flanks
comprises:
A central (but off-set) core of kaxtorpite (KAX) surrounded by;
A migmatitic grennaite zone (GTM);
A “pegmatitic” grennatite (GPG or PGT) ± lakarpite (LAK);
Fine-grained grennaite containing catapleiite (GTC); and
Various other relatively minor alkaline rocks and mafic intrusives.
Approximately 75 % of the intrusive consists of varieties of “grennaite” (the name is taken from the
nearby town of Gränna), an aegirine-rich nepheline syenite carrying the rare, zircono-silicate minerals,
eudialyte and catapleiite. Nearly all of the rare earth element (REE) mineralisation is to be found in
the complex zircono-silicate mineral eudialyte with lesser amounts of REE occuring as Ca-LREE-F-
silicate (britholite) and trace mosandrite. The eudialyte at Norra Kärr is, relatively rich in REE
compared to most other similar deposits and also contains a very high proportion of heavy rare earth
oxides (HREO).
1.4 METALLURGICAL TESTWORK AND PROCESS DESIGN
The mineral processing and hydrometallurgical plant design was prepared based on information
generated by the testwork conducted by WAI, JKTech, Geological Survey of Finland, Dorfner
ANZAPLAN and ANSTO Minerals as well as design experience provided by GBM. The process
design is preliminary in nature and subject to change based on ongoing and future testwork
programmes. The design philosophy for the process plant is a zero liquid discharge policy which
ensures the risk to the environment by means of water contamination is mitigated.
The process plant and associated infrastructure have been designed to Swedish and International
standards and for the full duration of the project. The process plant where possible will be inside of
buildings where dust and noise can be contained.
The reagents consumed at the process plant will be received from both international and domestic
suppliers, and will be received at the Tränas rail siding and directly by truck to the plant site.
1.5 MINERAL RESOURCE ESTIMATES
The Mineral Resource estimate for the Nora Kärr project has been carried out following the guidelines
of the CIM Code (3). The Mineral Resource estimation was completed using a 3D block modelling
approach utilising CAE Mining Studio 3® software. Mineral Resource estimate is dated 30 June
2014.
WAI was supplied with a geological database in Microsoft Access® format dated 06 May 2014 which
comprised geological and geotechnical logging as well as assay results. The database comprises

NI 43-101 - Technical report Norra Kärr REE - 0465-RPT-014 Rev 1
Page 22
sample data from surface diamond drilling containing a total of 119 holes (20 420.33 m) from which
9 986 samples have been assayed.
Wireframes to represent the Norra Kärr alkaline igneous intrusive body and associated REE
mineralisation have been constructed based on the geological logging carried out by Tasman. WAI
was provided with geological cross sections and plans by Tasman showing the interpreted structure
based on the detailed lithology logs, geochemical assay results and the foliation measurements. In
total six key lithologies were modelled:
LTYPE 1 (KAX) – Kaxtorpite (Microcline-Pectolite-Amphibole-Aegirine-Nepheline Syenite);
LTYPE 2 (GTM) – Grennaite (Recrystallised to in part migmatitic);
LTYPE 3 (PGT/GT) – Grennaite with pegmatitic zones and Grennaite (Fine grained aegirine
rich nepheline syenite);
LTYPE 4 (GTC) – Grennaite (Catapleiite porphyritic – low grade TREO);
LTYPE 5 (ELAK) – Lakarpite with eudialyte; and
LTYPE 6 (MAF) – Mafic dyke material.
Based on the mineralisation wireframes sample data was selected and coded according to the host
lithology and reviewed statistically. Very few outlier grades were identified that could present an issue
during the variography or grade estimation stages, those that presented a problem have been top-cut.
To ensure all samples in the variography and grade estimation stages have equal support the sample
data was composited to 2 m corresponding to the median sample length. Semi-variogram analysis
was undertaken for 20 elements in each of the six mineralised domains using the 2 m composited
samples contained within the mineralised domain wireframes.
Based on the semi-variograms produced by WAI, Qualitative Kriging Neighbourhood Analysis (QKNA)
was undertaken to ascertain the optimum block sizes, minimum and maximum numbers of samples,
optimum search ellipse size and optimum block discretisation.
A non-rotated block model with a parent cell size of 25 m x 25 m x 5 m (northing x easting x vertical)
was selected for the Mineral Resource estimation. Key fields were established within the block model
to identify and separate the individual mineralised zones for control on grade estimation. A minimum
sub cell size of 5 m x 5 m x 1 m was allowed to get a close fit to the wireframe surfaces.
To enable the grade estimation search ellipse to honour the mineralisation WAI utilised dynamic
anisotropy whereby each block in the model contained dip and dip orientation angles. Dip and dip
directions were estimated in to the volumetric block model using Inverse Power of Distance Cubed
(IDW3) and the foliation information supplied by Tasman which was converted to point sample
locations with consistent lengths of 0.02 m.
A total of 1 692 bulk density tests have been carried out by Tasman with the resultant database
supplied to WAI. WAI has coded the density samples according to their corresponding lithological

NI 43-101 - Technical report Norra Kärr REE - 0465-RPT-014 Rev 1
Page 23
unit and applied the mean density value for each of the six modelled lithologies to the relevant block
model lithology.
Grade estimation has been carried out using Ordinary Kriging (OK) as the principle interpolation
method with Inverse Power of Distance Squared (IDW2) and Nearest Neighbour (NN) also used for
comparative purposes for each element. Following the grade estimation process, statistical and
visual model validation assessments were undertaken. Globally no indications of significant over or
under estimation are apparent in the model nor were any obvious interpolation issues identified. In
terms of conformance to the drill hole composite data, WAI considers the OK interpolation method to
most closely represent the drill hole data.
The Mineral Resource classification for the Norra Kärr REE deposit is in accordance with the
guidelines of the CIM Definition Standards for Mineral Resources and Mineral Reserves [CIM (2010)
(3)]. Criteria for defining Mineral Resource categories are based on geostatistical studies, QA/QC
data review and the overall degree of confidence in the geological and grade continuity exhibited at
the deposit.
WAI has classified the Norra Kärr deposit as Indicated.
In order to report a Mineral Resource in accordance with CIM for disclosure in an NI 43-101 report,
there needs to be the reasonable prospect for eventual economic extraction. To ensure that the Norra
Kärr Mineral Resource reported by WAI has reasonable prospects of economic extraction the mineral
inventory has been constrained by a pit optimisation and only mineralisation falling within the open pit
has been disclosed as a Mineral Resource as shown in Table 1-1.

NI 43-101 - Technical report Norra Kärr REE - 0465-RPT-014 Rev 1
Page 24
Table 1-1: Norra Kärr Mineral Resource Estimate (4)
Cla
ssif
icat
ion
TR
EO
% C
ut-
Off
Gra
de
To
nn
es (
kt)
Den
sity
(t/
m3 )
TR
EO
(%
)
% H
RE
O in
T
RE
O
Dy 2
O3
(%)
Y2O
3 (%
)
Eu
2O3 (%
)
La 2
O3
(%)
Nd
2O3
(%)
Ce 2
O3
(%)
Gd
2O3 (%
)
Tb
2O3 (%
)
Pr 2
O3 (%
)
Sm
2O3
(%)
Lu
2O3
(%)
Indicated 0.2 36 821.60 2.71 0.55 53.18 0.02532 0.20053 0.00203 0.05190 0.06025 0.11560 0.01825 0.00371 0.01504 0.01647 0.00227
0.4 31 109.16 2.70 0.61 52.60 0.02729 0.21775 0.00222 0.05729 0.06680 0.12823 0.01997 0.00403 0.01668 0.01815 0.00238
0.6 17 124.71 2.72 0.68 52.23 0.02994 0.24290 0.00253 0.06214 0.07686 0.14413 0.02260 0.00447 0.01896 0.02083 0.00251
Notes:
1. Mineral Resources that are not Mineral Reserves do not have demonstrated economic viability.
2. Mineral Resources are reported inclusive of any Mineral Reserves
3. The Mineral Resources reported have been constrained on the basis of a 20 year pit.
4. Mineral Resources are reported for the combined GTM, PGT, GTC and ELAK mineralisation only.
5. The Mineral Resources reported represent estimated contained metal in the ground and has not been adjusted for metallurgical recovery.
6. Total Rare Earth Oxides (TREO) includes: La2O3, Ce2O3, Pr2O3, Nd2O3, Sm2O3, Eu2O3, Gd2O3, Tb2O3, Dy2O3, Ho2O3, Er2O3, Tm2O3, Yb2O3, Lu2O3, Y2O3.
7. Heavy Rare Earth Oxides (HREO) includes: Eu2O3, Gd2O3, Tb2O3, Dy2O3, Ho2O3, Er2O3, Tm2O3, Yb2O3, Lu2O3, Y2O3.
8. Preferred Base Case Mineral Resources are reported at a TREO % cut-off grade of 0.4 % TREO.

NI 43-101 - Technical report Norra Kärr REE - 0465-RPT-014 Rev 1
Page 25
1.6 MINERAL RESERVE ESTIMATES
WAI has undertaken an open pit design based on the Mineral Resource block model of Norra Kärr.
Datamine NPV Scheduler software was used to generate an optimised design; economic parameters
have been supplied from Tasman, GBM, and WAI calculations. Taking account of modifying factors
(loss/dilution, geotechnics) an open pit mine design was based on the optimised design to provide an
estimate of Mineral Reserves. Only Probable Mineral Reserves are reported at this stage due to the
confidence of Mineral Resources.
Probable Mineral Reserves total over 23.5 Mt of ore material at 0.59 % TREO. Mined waste totals
17.3 Mt for total rock movement of 40.8 Mt and LOM stripping ratio (tw:to) of 0.73. Mineral Reserve
estimates have been based on a targeted 20 year mine life. Mineral Reserve estimates have been
based on GTM and PGT ore types only.
1.7 MINERAL EXTRACTION METHODS
Mineral extraction methods have taken account of two constraints, blasting fragmentation and a
nearby highway. Fragmentation has been required to meet a maximum size of 600 mm and in
conjunction planned blasting has been designed within a safety envelope for a nearby highway to the
west of the project site.
Open pit mining operations consist of conventional hydraulic shovel and rigid body trucks, a support
loader for clean-ups, oversize transport, and muck pile construction. Open pit mine design has
targeted the pit ramp entrance on the southern end of the pit, directly towards the processing facilities.
Ore will be hauled from within the pit directly to the ROM, where a wheel loader will load material into
a primary jaw crusher and into the processing circuit.
1.8 TAILINGS STORAGE FACILITY
The tailings comprise waste from the beneficiation and leach residue processing stages, combined
with gypsum sludge waste generated by the neutralisation process following solvent extraction. Brine
(sodium sulfate) produced by water treatment will be sent off site for disposal at an appropriate
landfill. The combined tailings waste stream will be stored as a thickened slurry in a single cell located
about 3 km to the north-east of the process plant in an area identified as suitable for tailings storage
by a preliminary localisation study.
The storage facility has been designed to accommodate tailings generated during the 20 year mine
life. The tailings throughput is 155 tpd, resulting in about 24.8 Mt tailings. In calculating volumetric
storage requirements, an allowance has been made for parameter uncertainty at this preliminary
stage. The facility is designed to store about 22 Mm3 of tailings, and the design could be extended if
needed to accommodate additional tonnages.

NI 43-101 - Technical report Norra Kärr REE - 0465-RPT-014 Rev 1
Page 26
The storage facility comprises a main containment embankment designed to allow tailings discharge
to take place from multiple spigots located around the northern part of the embankment crest. The
embankment will be constructed initially from an internal borrow pit, and then be raised in stages
during the operational life using mine waste. A downstream raise strategy has been adopted for this
stage of design.
The facility is designed to accept thickened slurry deposited in a sub-aerial manner so that the pond
water is kept largely separate to the tailings solids. Sub-aerial deposition offers the advantage of
minimising the water contained in the facility, which reduces the seepage risk and the risk of leaching
elements from the tailings mass. It is desirable from a dam safety and operational perspective to
minimise the amount of water held within the storage basin. Water in the impoundment area will be
directed southwards from the points of discharge and stored in a series of ponds before being
decanted to the environment.
The facility is designed so that all water discharged from the system is decanted into the Baltic rather
than the Lake Vättern catchment via a series of ponds designed to allow water clarification and to
accommodate high flows due to flood events. This is not so much a technical consideration, but more
a recommendation to reduce local concerns over potential pollution of the waters at Lake Vättern.
A dry closure strategy will be adopted, using mine waste, as well as till and topsoil sourced at the TSF
from site clearance operations to cover the tailings and to generate the closure landform. The water
dams will be removed at closure, and water courses rehabilitated to accept flows off the rehabilitated
landform.
1.9 ENVIRONMENTAL STUDIES, PERMITTING AND SOCIAL OR COMMUNITY IMPACT
In addition to the exploitation concession, an environmental permit must be granted to the project
pursuant to the provisions of the Swedish Environmental Code (1998:808). The permit application
must include an Environmental Impact Assessment.
Baseline studies have been undertaken encompassing the area around the exploitation concession.
However further studies are expected to be needed for environmental permitting. The entire Project
area as well as the surrounding area are considered to represent an anthropogenic environment.
Certain nature values have been identified on site, however these are not expected to present major
obstacles to project development. Furthermore it is considered unlikely that nature values of such
character or magnitude as to stop project from progressing would be found in any further studies.
However various mitigation measures may be required to be undertaken in order to secure the
required permits.
A preliminary water management strategy has been developed and a Site Wide Water Balance
modeling undertaken. The plan is to collect all water coming into contact with any activities of the
mining operation, including surface runoff on site roads, roof areas etc. into the TSF pond system.

NI 43-101 - Technical report Norra Kärr REE - 0465-RPT-014 Rev 1
Page 27
Water will be discharged into the environment only from the TSF ponds. Current process design
incorporates a water recycling plant, resulting in a considerable reduction of both make up water
intake and the discharge water flow rate. No discharge of liquid water from the process is planned;
water leaves the process only as the moisture content of the tailings
All discharge will be directed away from the catchment area of the nearby Lake Vättern. The receiving
watercourse, a smallish stream named Adelövån, flows southward of the site area towards smaller
lakes and eventually into the Baltic Sea. The predicted discharge from the mine is very high
compared to natural flow rates in the stream and would represent a significant portion of the entire
streamflow. This is expected to result in strict control of discharge water quality. A detailed water
management plan should be developed in later stages of project development. The water
management plan should be based on further information about quality as well as quantity of the
water discharge. Potential need for treatment of the discharge will be investigated in the detailed
water management plan.
A conceptual level closure plan has been prepared for the project. The closure plan should be further
defined in the design stage and during operations. The environmental permit will set conditions
related to closure planning. Initially the closure targets are set so as to ensure safety and no
significant off-site impact.
Biodiversity values likely to be affected by the project include the great crested newt as well as
features related to long agricultural land use in the area. It is expected that a compensation
programme for the great crested newt is likely to be required. It could also be possible to preserve
and/or compensate some of the values related to the agricultural environment for a very minor cost, if
the issue was taken into consideration from early on in the project design. There are also some
cultural heritage targets within the area warranting closer study before works disturbing the remains
are started.
Social and community issues relevant to the project have been identified to include employment and
economic benefits, resettlement and stakeholders. Some houses will need to be purchased by
Tasman Metals or the owners compensated as per Swedish practice. There has been some vocal
opposition towards the project in the local area. The opposition is being led by a small number of anti-
mining activists. Based on experience from many other projects, and supported by surveys
undertaken in the area, it is expected that the general public’s attitudes towards the project are much
more positive than the activist-led discussion would at first glance indicate. The support of the state of
Sweden was demonstrated by the fact that Tasman Metals was granted the exploitation concession in
January 2014.

NI 43-101 - Technical report Norra Kärr REE - 0465-RPT-014 Rev 1
Page 28
1.10 CONCLUSIONS AND RECOMMENDATIONS
1.10.1 CAPITAL AND OPERATING ESTIMATE
The total capital expenditure for the Norra Kärr project is USD 423 M, a summary of initial capital
investment which is to be spent over a two year design and construction phase is shown in Table 1-2.
All estimates have been reported in US dollars.
Table 1-2: Total Project Initial Capital Expenditure
Initial Capital Expenditure Value (USD)
Total Capital Investment 378 276 359
FIXED CAPITAL TOTAL 352 963 553
DIRECT TOTAL 231 319 303
General 7 563 513
Mining 21 894 872
Process 169 467 528
Waste Management 14 300 000
Product Handling -
Infrastructure and Utilities 18 093 388
INDIRECT TOTAL 121 644 250
EPCM 36 165 294
Field Indirect 45 295 295
Contingency 40 183 660
WORKING CAPITAL TOTAL 25 312 805
The operating costs over the 20 year life of mine are summarised in Table 1-3.
Table 1-3 Operating Expenditure over Life of Mine
Area
Total Cost per annum
USD/t ROM Ave
USD/kg REO Ave %
000 GENERAL General and Admin 5 079 832.07 4.53 1.04 5.04
- - - 0.0
100 Mining Ore mining cost 3 849 852.58 3.43 0.79 3.82
100 Mining Waste mining cost 2 724 248.43 2.43 0.56 2.7
100 Mining Overhead mining cost - - - 0.0
100 Mining - - - 0.0
Plant $ 89,215,224.82
$ 79.49
$ 18.30 46.1%
200 PROCESSING Maintenance & Operating Spares 6 233 849.12 5.55 1.28 6.18
200 PROCESSING Consumable - Grinding media and liners
1 660 921.74 1.48 0.34 1.65

NI 43-101 - Technical report Norra Kärr REE - 0465-RPT-014 Rev 1
Page 29
Area
Total Cost per annum
USD/t ROM Ave
USD/kg REO Ave %
200 PROCESSING Labour 8 347 749.52 7.44 1.71 8.28
200 PROCESSING Reagents 35 699 032.18 31.81 7.32 35.39
200 PROCESSING Utilities - Diesel 6 427 982.83 5.73 1.32 6.37
200 PROCESSING Consumable – Electricity 6 449 553.24 5.75 1.32 6.39
280WATER TREATMENT Water treatment 21 311 567.24 18.99 4.37 21.13
300 WASTE MANAGEMENT Waste Management 3 084 568.94 2.75 0.63 3.06
Grand Total 100 870 000er annum
89.97 ROM Ave
20.69 REO Ave
11100%
1.10.2 FINANCIAL ANALYSIS
The economic analysis conducted for the Norra Kärr project was undertaken utilising the discounted
cash flow methodology (DCF) at various discount rates. A 10 % discount rate yielded a post-tax net
present value of USD 312.7 M and an internal rate of return of 20 %.
The Norra Kärr project has accounted for a conservative ramp up period. The process plant has been
scheduled to reach full production by Year 4, and this has been reflected in the DCF model.
The REO prices are applied individually per kilogram of REO recovered, rather than applying a
discounted basket price. The overall basket price of saleable REOs is 64.46 USD/kg which excludes
Ho, Er, Tm and Yb.
1.10.3 RARE EARTH PRICING AND FORECASTING
Rare earth pricing is more complex than for commodities and is definitely more opaque. Historically,
there has been no open market for rare earths (which are primarily ‘traded’ individually – all 17 of
them) and most of the sales up to this point have been in the form of long term supply agreements,
which are subject to a number of variables including volume discounts, cost structure of the buyer,
potential cost subsidies, and effect of co-products at the producing mine. Furthermore, there is a
range of rare earth products sold, which has an impact on price. In this report the focus is on REOs
(typically 99.9 %), which is the common product reported.
There are a few agencies/companies reporting rare earth pricing (Metal Pages, Asian Metal, Industrial
Minerals) although not all contracts are reported and volumes are unclear. As a result, there is
typically a variance around pricing although directional movements are believed accurate.
Rare earth pricing is impacted by more than just supply and demand. Prices have been volatile for
the last decade as China introduced export quotas in 2005 and significantly reduced them in 2010,
which sent some rare earth prices up over ten times. Prices in 2011 were at unprecedented highs,

NI 43-101 - Technical report Norra Kärr REE - 0465-RPT-014 Rev 1
Page 30
which resulted in stockpiling, recycling and ‘thrifting’ in applications. Currently, prices are depressed
as demand growth has slowed and inventory (including illegal product) continues to work through the
system.
The long term price forecast is lower than the trailing 3-year average for all elements (except Pr) but
above current prices for some elements today (Nd, Tb, Dy and Y). Higher prices are primarily
supported by demand growth for permanent magnets and the slower ramp up of heavy rare earth
mines outside of China.
1.10.4 SUMMARY
GBM considers that the Norra Kärr project to have fulfilled its purpose of demonstrating to a
satisfactory degree of confidence, the potential to cost effectively and profitably mine and process the
REE deposit.
The metallurgical testwork conducted to-date has identified a processing route which enables the
extraction and recovery of REE from the Norra Kärr deposit to an average efficiency of 76.4 %. On
the basis of the commissioned testwork a process flowsheet was developed with associated mass
and energy balances. The process flowsheet employs equipment routinely available from equipment
manufacturers and operates at both low temperatures and pressures, reducing the technological risk
of the project. These were then used to prepare capital and operating expenditure estimates.
No fatal flaws at this stage of project development have been identified, in terms of mineral resource,
process, waste management, logistics and environmental impact, however further testwork is required
to confirm the projects full feasibility.
The DCF model yielded economic indicators including, a post-tax NPV of USD 312.7 M (10 %
discount rate) and an IRR of 20 % which demonstrate the project to be both technically and
economically feasible. On this basis it is recommended Tasman pursue a programme of further
investment and development to confirm the preliminary results presented.

NI 43-101 - Technical report Norra Kärr REE - 0465-RPT-014 Rev 1
Page 31
SECTION 2 INTRODUCTION
2.1 GENERAL
GBM Minerals Engineering Consultants Limited (GBM) is an independent firm of engineering
consultants specialising in the development, design and construction of mining projects. GBM was
commissioned by Tasman Metals Limited (Tasman) to carry out a Pre-Feasibility Study (PFS) to
determine the REE recovery process and to design and cost a process facility to produce a saleable
concentrate for the Norra Kärr project. This included the development of the process flowsheet, the
processing and infrastructure engineering design, the capital and operating cost estimates to an
accuracy of +25 % to -25 %, and the compilation of this PFS report.
Wardell Armstrong International (WAI) is a leading multidisciplinary consultancy who’s Mining,
Quarrying and Minerals Division has derived a Mineral Reserve and cost estimates for the mining for
the project.
Golder Associates (Golder) are a leading multidisciplinary consultancy whose Environmental Division
has been responsible for environmental studies and social impact assessment on the project. Golder
has also provided information in regards to undertaking the permitting process.
2.2 FINANCIAL INTEREST DISCLAIMER
Neither GBM, WAI, Golder nor any of their consultants employed in the preparation of this report,
have any beneficial interest in the assets of Tasman.
GBM, WAI and Golder have been paid fees and will continue to be paid fees for this work in
accordance with normal professional consulting practices.
2.3 SOURCES OF INFORMATION
Information used to support this PFS was provided by GBM, WAI, Golder and Tasman internal
experts, previous reports on the property and from the reports listed in the references section of this
technical report.
2.4 QUALIFIED PERSONS
2.4.1 GBM
The GBM Qualified Persons are:
- Michael Short, BE (Civil), CEng FIMMM, FAusIMM(CP), FIEAust CPEng
- Thomas Apelt, BEng, PhD (Chem Eng), CEng MIChemE, MAusIMM(CP) - Process

NI 43-101 - Technical report Norra Kärr REE - 0465-RPT-014 Rev 1
Page 32
2.4.2 WAI
The WAI Qualified Persons are:
- Greg Moseley, BSc, MSc, CEng, MIMM, FRGS, Associate, Qualified Person – Geology and
Mineral Resources
- Mark Mounde, BEng, CEng, MIMMM, Technical Director, Qualified Person – Mining and
Mineral Reserves
2.4.3 GOLDER
The Golder Qualified Person is Gareth Digges La Touche (BSc, MSc, FGS, CGeol, EurGeol).
2.5 QUALIFIED PERSON SITE VISIT
A number of visits by various Qualified Persons and other parties have been carried out to inspect the
project site and verify its characteristics. The following site visits directly applicable to this PFS have
been carried out by GBM, WAI and Golder representatives:
Greg Moseley (WAI) visited the site in April 2014;
Janna Riikonen (Golder), Marion Thomas (Golder) and Erik Karlsson (Golder) visited the
site in May 2014;
Michael Bateson (GBM), Thomas Davidson (GBM), Kurt Forrester (GBM), Mark Mounde
(WAI) and Nick Watson (WAI) visited the site in June 2014; and
Janna Riikonen (Golder) and Gareth Digges La Touche (Golder) visited the site in
September 2014.
The following Tasman personnel were available during the site visits:
Jim Powell – Vice President (Tasman AB);
Johan Berg – Geologist (Tasman AB);
Magnus Leijd – Senior Geologist (Tasman AB);
Henning Holmström - Managing Director (Tasman AB); and
Olof Ekstrand – Senior Advisor (Tasman AB).
2.6 QUALIFIED PERSON SECTIONAL RESPONSIBILITY
This PFS was prepared by or under the supervision of the Qualified Person(s) identified in Table 2-1
against the respective sections of this report.
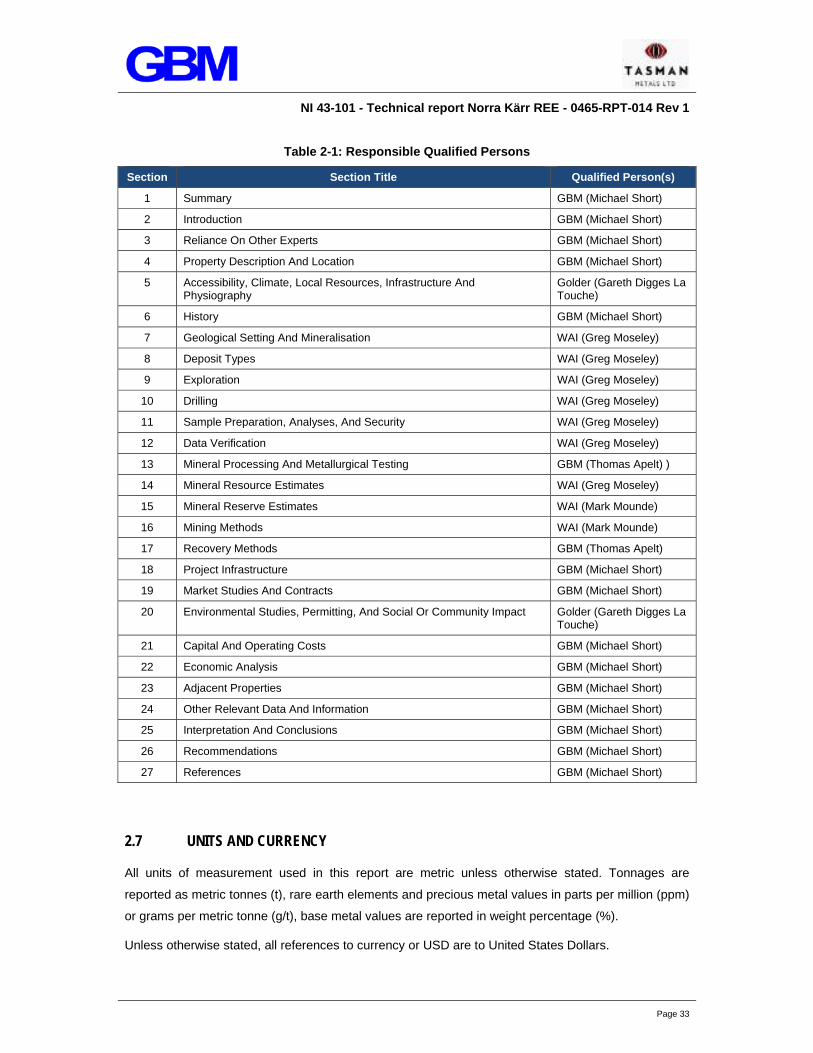
NI 43-101 - Technical report Norra Kärr REE - 0465-RPT-014 Rev 1
Page 33
Table 2-1: Responsible Qualified Persons
Section Section Title Qualified Person(s)
1 Summary GBM (Michael Short)
2 Introduction GBM (Michael Short)
3 Reliance On Other Experts GBM (Michael Short)
4 Property Description And Location GBM (Michael Short)
5 Accessibility, Climate, Local Resources, Infrastructure And Physiography
Golder (Gareth Digges La Touche)
6 History GBM (Michael Short)
7 Geological Setting And Mineralisation WAI (Greg Moseley)
8 Deposit Types WAI (Greg Moseley)
9 Exploration WAI (Greg Moseley)
10 Drilling WAI (Greg Moseley)
11 Sample Preparation, Analyses, And Security WAI (Greg Moseley)
12 Data Verification WAI (Greg Moseley)
13 Mineral Processing And Metallurgical Testing GBM (Thomas Apelt) )
14 Mineral Resource Estimates WAI (Greg Moseley)
15 Mineral Reserve Estimates WAI (Mark Mounde)
16 Mining Methods WAI (Mark Mounde)
17 Recovery Methods GBM (Thomas Apelt)
18 Project Infrastructure GBM (Michael Short)
19 Market Studies And Contracts GBM (Michael Short)
20 Environmental Studies, Permitting, And Social Or Community Impact Golder (Gareth Digges La Touche)
21 Capital And Operating Costs GBM (Michael Short)
22 Economic Analysis GBM (Michael Short)
23 Adjacent Properties GBM (Michael Short)
24 Other Relevant Data And Information GBM (Michael Short)
25 Interpretation And Conclusions GBM (Michael Short)
26 Recommendations GBM (Michael Short)
27 References GBM (Michael Short)
2.7 UNITS AND CURRENCY
All units of measurement used in this report are metric unless otherwise stated. Tonnages are
reported as metric tonnes (t), rare earth elements and precious metal values in parts per million (ppm)
or grams per metric tonne (g/t), base metal values are reported in weight percentage (%).
Unless otherwise stated, all references to currency or USD are to United States Dollars.

NI 43-101 - Technical report Norra Kärr REE - 0465-RPT-014 Rev 1
Page 34
SECTION 3 RELIANCE ON OTHER EXPERTS
The Qualified Persons have relied on expert opinions and information provided by Tasman pertaining
to environmental considerations, taxation matters and legal matters including mineral tenure, surface
rights and material contracts.
For the purposes of Section 4 (Property Description and Location) and Section 23 (Adjacent
Properties) of this report the Qualified Person has relied on property ownership data provided by
Tasman and other sources as referenced within the sections. This information is believed to be
essentially complete and correct to the best of the Qualified Person’s knowledge and no information
has been intentionally withheld that would affect the conclusions made herein. The Qualified Person
has not researched the property title or mineral rights for the project and expresses no legal opinion
as to the ownership status of the property.
For the purposes of Section 20 (Environmental) in conducting this assessment, Golder has relied on
information provided by other experts as well as Tasman. The baselines and other documents used
have been prepared by consultants specialising in their respective fields. Any statements and
opinions expressed in this document are given in good faith and in the belief that such statements and
opinions are not false and misleading as of the effective date of this report.
For the purposes of Section 22 (Economic Analysis) of this report the Qualified Person has relied on
information provided by Tasman and other sources as referenced within the section, pertaining to
taxation. The Qualified Person has reviewed the taxation information provided and believes it to be
correct and adequate for use in this report.

NI 43-101 - Technical report Norra Kärr REE - 0465-RPT-014 Rev 1
Page 35
SECTION 4 PROPERTY DESCRIPTION AND LOCATION
4.1 LOCATION
The Norra Kärr project is located close to the eastern shore of Lake Vättern - one of the largest lakes
in Sweden - some 45 km to the north-north-east of the city of Jonkoping. The project site is
approximately 240 km south-east of Stockholm and 160 km east-north-east of Goteborg. Figure 4-1
below shows the Norra Kärr location.
Figure 4-1: Location of the Norra Kärr Project, Sweden
The project is located approximately 10 km north-east of the small town of Gränna and is centred at
coordinate 474428 E by 6440268 N (approximately) by the SWEREF99TM coordinate system. This
approximates to 58° 6’10’’ north and 14° 33’ 58’’ east based on the WGS 84 datum.

NI 43-101 - Technical report Norra Kärr REE - 0465-RPT-014 Rev 1
Page 36
4.2 MINERAL TITLE
The Norra Kärr project consists of four claims, Norra Kärr No. 1, Norra Kärr No. 2, Norra Kärr No. 3
and Norra Kärr No. 4, together covering just in excess of 5 079 hectares (50.79 km2). A map of the
four exploration claims is shown in Figure 4-2 whilst the coordinates of the respective claim vertices
are summarized in Table 4-1.
Norra Kärr No. 1 (see Figure 4-2) is the area of interest as it contains the REE mineral resource that
is the subject of this report. A 25 year exploitation concession for Norra Kärr was granted to Tasman
in 2013.
Figure 4-2: Relative Position of the Norra Kärr Licences (s.l.)

NI 43-101 - Technical report Norra Kärr REE - 0465-RPT-014 Rev 1
Page 37
Table 4-1: Tasman Norra Kärr Licence Details
Point No
SWEREF99TM Licence Number
Area Licence Issue Date
Licence Renewal
Date
Licence Expiry Date
Northing Easting
1 6442166.16 474689.99 Norra Kärr No.1
550 ha 31/08/2009 31/08/2012 31/08/2015
2 6441236.00 476235.51
3 6438628.27 474667.29
4 6439557.43 473121.79
1 6439557.43 473121.79
Norra Kärr No.2 315 ha 11/01/2011 11/01/2015 11/01/2017
2 6438628.27 474667.29
3 6437610 474527
4 6437610 472166.24
1 6443397.87 474539.33
Norra Kärr No.3 753 ha 07/03/2011 07/03/2014 07/03/2017
2 6443434.75 477624.68
3 6441144.02 476903.35
4 6437607.05 474531.55
5 6438628.27 474667.29
6 6441236.00 476235.51
7 6442166.16 474689.99
8 6440606.48 473746.01
9 6441806.46 474201.49
10 6442823.42 474399.25
1 6445060.00 475015.00
Norra Kärr No.4
389 ha 28/01/2011 28/01/2014 28/01/2017
2 6444265.00 477885.00
3 6443434.75 477624.68
4 6443397.87 474539.33
5 6444407.42 474785.16
4.3 ENVIRONMENTAL LIABILITIES
No significant environmental liabilities or legacy environmental contamination has been identified
within the exploitation concession area. The site has historically been in agricultural (grazing land)
and forestry use.

NI 43-101 - Technical report Norra Kärr REE - 0465-RPT-014 Rev 1
Page 38
4.4 PERMITS
Tasman holds an exploitation concession for the area around the Norra Kärr deposit. The concession
became valid in 2013 and, following an initial appeal during which the Government ruled in Tasman
Metals AB favour, is in force until 2038. To operate the mine the company will also need to acquire an
environmental permit, and construction permits for buildings etc.
The exploitation concession grants the right to exploit the mineral deposit and relates to the specific
area marked in the concession decision. The initial validity period of 25 years may be extended by the
mining authority. The concession as well as exploration permits pay be transferred to another holder,
after approval from the Mining Inspector.
The exploitation concession also the grants right to use land within the concession. For the activities
outside of the concession area, the company will need to secure access to the required land areas.
This can be done by a land designation, granted by the Chief Mining Inspector. The company will
seek to purchase the land or otherwise secure access (e.g. land lease) but it is possible to get a
designation of land also for such land that is not owned by the company. In that case the designation
will be accompanied by a security for compensation. The designation of land procedure is normally
undertaken after the environmental permit has been granted.
It should be noted that Tasman also has a permit for test mining in order to conduct pilot beneficiation
studies, which was granted in March 2014.

NI 43-101 - Technical report Norra Kärr REE - 0465-RPT-014 Rev 1
Page 39
SECTION 5 ACCESSIBILITY, CLIMATE, LOCAL RESOURCES,
INFRASTRUCTURE AND PHYSIOGRAPHY
5.1 ACCESS
The Norra Kärr site is located in Southern Sweden, approximately 10 km north-east of the town of
Gränna and approximately 300 km southwest of the capital Stockholm. The property is accessible by
road from Stockholm on highway E4 to the town of Gränna which lies on the eastern shore of Lake
Vättern. From Gränna a secondary road heads north and then east under the E4, linking it with a
gravel road that accesses the centre of the property. A new access road to the project site will be
required when the project progresses.
Current site access is from the smaller roads (Gränna – Tränas highway); the nearest interchanges
from the E4 are at Stava to the north (approximately 4 km) and Gränna to the south-west
(approximately 11 km). A gravel road leads from the highway to the Norra Kärr property. The road is
narrow but in good to moderate condition. There are also other gravel roads that lead to various parts
of the property.
5.2 CLIMATE AND LENGTH OF OPERATING SEASON
The region has a cold temperate continental climate with warm summers. Winters are variable in
southern Sweden with the amount of snowfall varying each year.
Scandinavia, like the rest of north-western Europe, is influenced by the Gulf Stream which moderates
the climate so that the winters in central and southern Sweden are milder than in many parts of
Canada at similar latitude. The work at the project site could be carried out on a year-round basis.
The mean wind speed measured at the 8405-Visingsö A station, located approximately 9 km west of
Norra Kärr, during the years 1961-1990 (the standard normal period) was 5.4 m/s. The measuring
station is located lower than the site on the island of Visingsö in the Lake Vättern. The area around
the site and south of it has high wind speeds and has been determined an area potentially suitable for
wind energy production.
The maximum precipitation is in April and July with an average of 517 mm per year (measuring
station Högemålen 1961-2014).
Temperature measurements in the area have been carried out at Tränas, Visingsö A and Visingsö
measuring stations. The mean annual recorded temperature for the three stations varied between
6.2 °C and 6.6 °C during the years 1961-1990.

NI 43-101 - Technical report Norra Kärr REE - 0465-RPT-014 Rev 1
Page 40
5.3 PROXIMITY TO POPULATION CENTRE AND TRANSPORT
Norra Kärr is located in the Municipality of Jönköping just south of the border between the County of
Jönköping and the County of Östergötland. The nearest town is Gränna, approximately 10 km south-
west from the project site. Gränna and the surrounding countryside villages have approximately 4 000
residents. Tourism has a significant economic importance in Gränna during the summer months.
The city of Jönköping lies about 30 km south of Gränna and has a population in excess of 84 000.
The city is accessible by either highway, rail or through the local airport. The Municipality of Jönköping
has a population of over 131 000 and it is expansive with an increasing number of residents. The
County of Jönköping (Jönköpings län) has a population of 341 000. A number of stately offices and
departments are based in the urban area of Jönköping and it has a university for 11 000 students.
The neighbouring municipalities Ödeshög (immediately to the north) and Tränas (about 25 km to the
east) are smallish, largely rural communities. Tränas municipality has about 18 000 inhabitants, most
of whom (14 000) live in the central town, also called Tränas. The municipality’s population has
stayed fairly steady at a little under 20 000 people since the 1970s. The population of Ödeshög
municipality is only about 5 300 and has been steadily declining since 1980. About 2 500 people live
in the central town Ödeshög. Tränas is part of the County of Jönköping while Ödeshög is part of the
County of Östergötland (Östergötlands län).
Northeast of Gränna, about 90 km along highway E4, lies the city of Linköping with a population of
around 148 000. This city dates back 700 years and is known for its university and high-technology
industries, including the SAAB aircraft plant. Both Jönköping and Linköping have hospitals.
The project site is located some 300 m (minimum distance) east of the highway E4 which runs
between Helsingborg in the south of Sweden and Torneå in Finland. It is the mainline road used by
most vehicle traffic, both personal cars and freight trailers, and it passes in the vicinity of the largest
cities in Sweden and through the capital Stockholm. The E4 is a primary road selection for dangerous
goods transportation through or within the county of Jönköping.
Approximately 20 km east of Norra Kärr runs the southern major railroad through Sweden connecting
Stockholm and Malmö. The closest railway stations to the site are located 20-25 km east in Tränas
and Boxholm. A minor road going in an east-westerly direction connects Norra Kärr and Tränas. The
southern railway line is used for the transport of goods, regional trains and long distance trains and it
is considered to be the most important railway line in Sweden. The railway line is heavily used since it
connects the two major cities in Sweden and the northern Scandinavia with the European continent.

NI 43-101 - Technical report Norra Kärr REE - 0465-RPT-014 Rev 1
Page 41
5.4 SURFACE RIGHTS, LAND AVAILABILITY, INFRASTRUCTURE, AND LOCAL
RESOURCES
Tasman Metals holds the exploitation concession that grants the rights to the mineral deposit. The
exploitation concession grants the right to exploit the mineral deposit to the concession holder. In
addition to the mineral rights, the company must acquire an environmental permit before mine
construction or operations can be initiated. Further information about permitting requirements is given
in Section 20.
During the PFS preparation, investigations and localization studies were undertaken to identify
suitable locations for the process plant, waste rock and tailings management facilities. Potential
locations corresponding to anticipated space requirements for the planned 20 year mine life have
been established. These facilities are described in more detail in the following sections.
Currently the land around the deposit and the areas for the facilities are held by a number of
landowners. Surface rights and rights of access to the property and other required land must be
purchased or leased. The company intends to purchase required land by means of negotiating with
the landowners. All purchases of land need to be registered with the Swedish Land Survey authority
to register the title to the property.
Alternatively it is possible to get a designation of land decision from the Chief Mining Inspector
granting access to land needed for outside of the exploitation concession area. If landowners refuse
to sell the land, the designation may still be granted and the landowners must be compensated as per
Swedish practice.
Prior to submission of the application for the Environmental Permit, the water rights necessary to
supply the mining operation and water rights in areas impacted by the drawdown of surface or ground
waters as a result of the operation must be obtained.
The make-up water for the process will be extracted from Lake Vättern and a pipeline for the purpose
will be constructed. The required quantities are available in the Lake, but a permit for the extraction
activity will need to be acquired as part of the overall environmental permit for the operation.
There is no municipal water or sewer system within the area of Norra Kärr. All residential properties
and buildings in the nearby area have private septic tanks and dug or drilled wells for drinking water.
The nearest municipal water and sewerage network is located in Uppgränna approximately 6 km
southeast of Norra Kärr. Some of the dwellings also have geothermal wells.
There are both above and below ground cables for 10 kV electricity in the immediate vicinity of Norra
Kärr, according to Jönköping Energi AB. New high voltage connection to the site will be developed by
the state owned power company Vattenfall, if the Norra Kärr project proceeds. Discussions with the
power company have been initiated. As part of the PFS design, on-site generation of steam and heat
for the process plant has been studied.

NI 43-101 - Technical report Norra Kärr REE - 0465-RPT-014 Rev 1
Page 42
The availability of skilled workforce around the project area is good thanks to proximity to major cities
and universities. Sweden has a long mining history and required expertise is expected to be available
in-country. However as the mining industry in Sweden is mostly concentrated in the northern part of
the country, experts with certain specific skills may need to be hired from elsewhere in Sweden or
abroad. The central location in Southern Sweden makes the project area attractive as a living
environment and problems with recruiting personnel are not anticipated.
5.5 TOPOGRAPHY, ELEVATION, AND VEGETATION
Norra Kärr is located in an undulating terrain with small hills and an average elevation of
approximately 200 m above sea level. The hills are mainly covered by forest (clear-cut in places) on
glacial moraine soils, with agricultural land (fields, grazing land and hay meadows) among the forests.
In Norra Kärr thin till cover is mixed with varied rock outcrops with elements of peat and the depth of
the soil cover varies between 0 – 11 m. The countryside around Norra Kärr is characterized by narrow
fault controlled valleys which cut through the landscape east of Lake Vättern with faults parallel to the
Lake Vättern basin.
The area is located in the boreo-nemoral zone, with elements of habitats reflecting the southern
deciduous broadleaf forest region and the northern coniferous forest region. Vegetation consists of a
mixture of conifers (dominantly spruce) and deciduous trees like ash, elm, birch, alder and oak. Many
of the old ash trees in the area are pollarded and provide habitat for varied species of lichens. The
sparse outcroppings are partly covered by rich moss flora.
The main feature of the area is Lake Vättern, located approximately 1.5 km west from Norra Kärr, and
the plain on its eastern shore. Lake Vättern is the second largest lake in Sweden with an area of
1 940 km². Steep slopes mark the transition from the lake to the higher ground where the project site
is located. Lake Vättern is an important source for drinking water for over 250 000 people in the
region and it is considered that its role as a water source will increase in the future. The escarpment
area between the lower-lying Lake Vättern (elevation about 88 m AMSL) and the site is considered to
have a high biodiversity value.
The project area is characterized by an alternating agricultural landscape comprising of increasingly
overgrown grass meadows, broadleaved trees, and forest in forestry use (predominantly spruce). The
rural area around Norra Kärr is used for active farming with grazing animals. Much of the farming land
which was used for grazing has been planted with spruce intended for forestry use. Some of the
forested areas have recently been clear-cut (some during 2014) while many are seeding stands and
young growth but there are also more mature areas. A large proportion of the PFS nominated project
footprint is seasonally used for recreational hunting. There are small watercourses located partially
within the project footprint: small lake named Gyllingesjön is located approximately 600 m east from
the concession area, and two small streams that flow into Lake Vättern. The easternmost part of the

NI 43-101 - Technical report Norra Kärr REE - 0465-RPT-014 Rev 1
Page 43
Project area drains naturally away from the Vättern via the stream Adelövån which flows towards the
south.
Current land use in the area of the Norra Kärr property is mixed forestry and recreational hunting.
There are old agricultural lands, spruce plantations and some wetland areas and small ponds, which
have been dug to attract waterfowl for hunters. A species-rich meadow flora still exists in some old
pasture lands despite being un-cultivated.
There are several protected areas with high natural value in the vicinity of the project site.
These areas include:
National Interest for nature value;
UNESCO East Vättern Scarp landscape - biosphere reserve (not to be confused with a nature
reserve as not a restrictive protection area);
Natura 2000-areas and nature reserves (not overlapping with the Project area); and
Lake Vättern water protection area.
Further information about the project area environment is included in Section 20.

NI 43-101 - Technical report Norra Kärr REE - 0465-RPT-014 Rev 1
Page 44
SECTION 6 HISTORY
6.1 SUMMARY OF REGIONAL EXPLORATION AND MINING HISTORY
Norra Kärr was initially discovered in 1906 by the Swedish Geological Survey (SGU) who identified
the Norra Kärr alkaline igneous complex during regional geological mapping. Following the geological
mapping, mineralogical studies were carried out by Professor A Törnebohm on a green fine grained
rock obtained from Norra Kärr. The principal constituents of this rock were ascertained to be
nepheline with lesser amounts of zirconosilicates, eudialyte, and catapleiite. Professor Törnebohm
named the rock type as “catapleiite-syenite”; however, the name was revised by later workers to
“grennaite” in reference to the nearby town of Gränna.
In the 1940s extensive scientific investigations of the Norra Kärr complex were undertaken by O.J.
Adamsson with works including detailed petrographical descriptions of the various rock types as well
as additional geochemical data.
In the mid to latter parts of the 1940s during and post-World War II the Norra Kärr complex was
investigated by the Swedish company Boliden AB. Prior to Boliden the Norra Kärr complex had little in
the way of intrusive investigations through trenching or drilling. In 1948 an agreement regarding
mining rights between Boliden and the landowners was secured and in 1949 Boliden commenced
some bulk sampling and concentration testwork. Boliden reported difficulties in separating the
nepheline and feldspar from the pyroxene aegirine resulting in elevated iron levels in the final
concentrate. The works carried out by Boliden ceased as prices for zirconium dropped due to
increased global supply from placer mineral sand deposits.
Exploration activity at Norra Kärr resumed in 1974 with Boliden carrying out two large east-west
trenches (as shown in Error! Reference source not found.) with the aim of delineating nepheline
mineralisation for potential economic extraction. The northern most trench was split into eight
geological intervals with between 4-30 samples taken in each interval with a total of 151 samples
taken with a combined total length of 398 m. The southern trench was also split into eight intervals
with the number of samples per interval between 8-34, and totalling 169 samples with a combined
length of 382 m.

NI 43-101 - Technical report Norra Kärr REE - 0465-RPT-014 Rev 1
Page 45
Figure 6-1: Location of the Boliden 1974 Trenches
Green track – outline of Norra Kärr intrusive complex
Red tracks – Boliden (1947) trenches. [Heavier tracks are the higher grade REE zones.]
A calculation of the composited Boliden samples (3) yielded the following weighted averages:
North Trench: 244 m @ 1.92 % zirconium oxide, 0.37 % Total Rare Earth Element Oxides
(TREO); and
South Trench: 149 m @ 1.51 % zirconium oxide, 0.50 % TREO, and 52 m @ 1.47 %
zirconium oxide, 0.44 % TREO.
Whilst Boliden reported TREO grades, six of the Heavy Rare Earth Element Oxides (HREO) were not
assayed. Error! Reference source not found. and Error! Reference source not found. below
summarise the results of the Boliden trenching testwork.

NI 43-101 - Technical report Norra Kärr REE - 0465-RPT-014 Rev 1
Page 46
Table 6-1: Boliden 1974 North Trench Results (PAH, 2012)
Interval IB II III IV V VI VII VIII
No. Samples 4 8 16 30 30 30 28 5
Length (m) 47 22 53 67.5 60.5 60 56 32
ZrO2 (%) 0.17 0.59 0.48 2.15 2.00 1.94 1.52 0.55
Hf (%) 0.004 0.014 0.010 0.040 0.043 0.049 0.031 0.009
TREO (%) 0.06 0.13 0.16 0.35 0.40 0.45 0.28 0.10
Table 6-2: Boliden 1974 South Trench Results (PAH, 2012)
Interval IX X XI XII XIII XIV XV XVI
No. Samples 11 10 29 28 33 34 8 16
Length (m) 25.0 21.5 63.5 64.0 66.0 90.0 17.0 35.0
ZrO2 (%) 0.90 1.40 1.66 1.40 0.47 0.35 1.47 1.47
Hf (%) 0.017 0.026 0.028 0.020 0.008 0.006 0.020 0.027
TREO (%) 0.07 0.22 0.42 0.67 0.38 0.24 0.71 0.31
More recently, several interesting academic studies have been undertaken by various workers –
mainly at the University of Gothenburg (6) (7) (8). These studies have addressed various facets of
the Norra Kärr complex including:
Mineralogy – mainly of the three eudialyte types present;
Geochronology;
Fenitisation of the contact zone; and
Various geological excursion guides.
6.2 HISTORICAL RESOURCE ESTIMATES
The Qualified Person is not aware of any historical Mineral Resource or Mineral Reserve estimate for
the Norra Karr property prior to the acquisition of the project by Tasman.

NI 43-101 - Technical report Norra Kärr REE - 0465-RPT-014 Rev 1
Page 47
SECTION 7 GEOLOGICAL SETTING AND MINERALISATION
7.1 REGIONAL GEOLOGY
While the regional setting within Scandinavia is not a critical factor in the exploration process, it is
considered that there several significant features that are worth considering.
The Sveconorwegian orogen in southern Scandinavia is the result of a collision between
Fennoscandia (the south-western continental segment of Baltica) and another continent in late
Mesoproterozoic time (see Figure 7-1). The orogenic province is composed of five distinct Proterozoic
gneiss segments that were displaced and reworked during a succession of compressional (and
extensional) orogenic phases at between 1.14-0.96 Ga.
Figure 7-1: Litho-Tectonic and Shear Zone Map of the Sveco-Norwegian Orogen, South-Western Scandinavia
The Norra Kärr complex has been emplaced in a rift setting (Lake Vättern) within the Trans
Scandinavian Igneous Belt (TIB) (Figure 7-2).
The TIB comprises a giant elongated array of batholiths extending c. 1 400 km across the
Scandinavian Peninsula from south-easternmost Sweden to north-western Norway. The TIB is
traditionally divided into four main units based on tectonic and lithological criteria:

NI 43-101 - Technical report Norra Kärr REE - 0465-RPT-014 Rev 1
Page 48
i. The Småland-Värmland belt in the south and west (the host region of the Norra Kärr
complex);
ii. The Dala Province;
iii. The Rätan Batholith in the centre; and
iv. The Revsundgranitoid suite in the north.
The rocks of the TIB dominantly consist of coarse (porphyritic) monzodiorites to granites of alkali-
calcic chemistry, with transitions to calc-alkaline or alkaline rocks.
Figure 7-2: Generalised Geological Map of the Fennoscandian Shield Showing the TIB
(Norra Kärr indicated by the red star)
It is apparent that the positioning of the Norra Kärr complex is at least partially controlled by the
shearing separating the Fennoscandia Foreland from the eastern segment of the Proterozoic gneiss
sequences to the east. This shearing known variously as the Sveconorwegian Frontal Deformation
Zone to the north of Lake Vättern and the Protogine Zone to the south has been intensively studied
over the years (5) . This is also well shown in the regional aeromagnetics (see Figure 7-3 below).
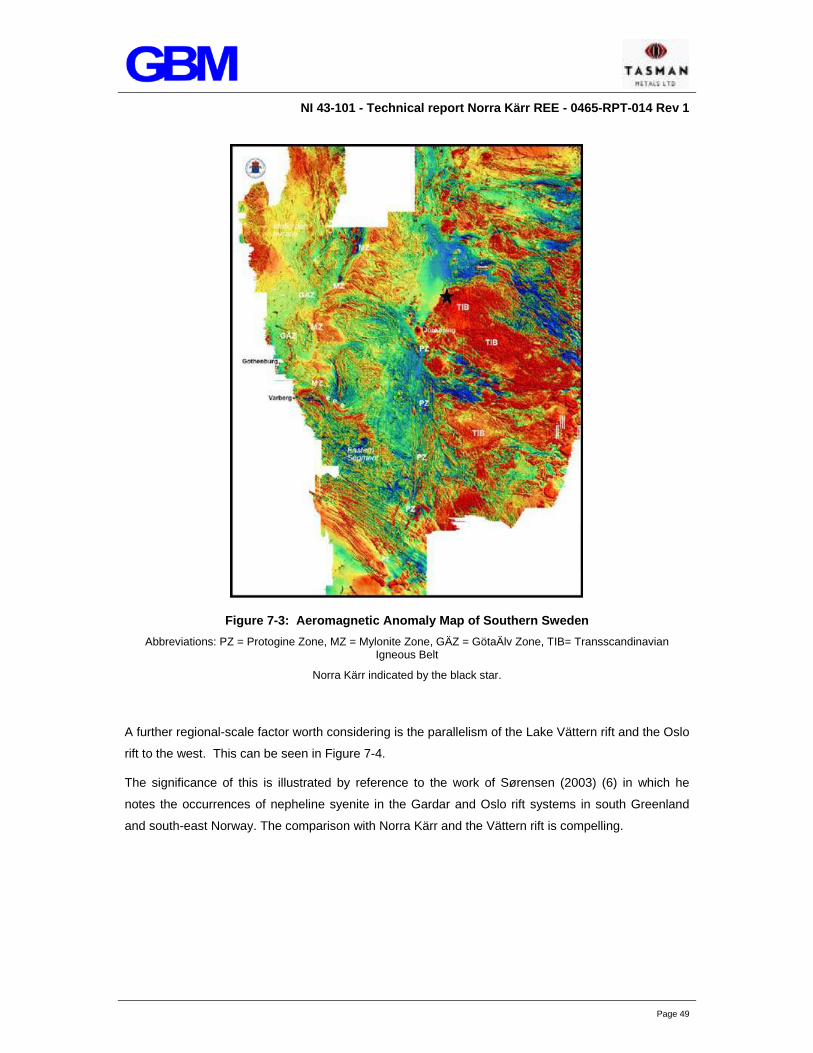
NI 43-101 - Technical report Norra Kärr REE - 0465-RPT-014 Rev 1
Page 49
Figure 7-3: Aeromagnetic Anomaly Map of Southern Sweden
Abbreviations: PZ = Protogine Zone, MZ = Mylonite Zone, GÄZ = GötaÄlv Zone, TIB= Transscandinavian Igneous Belt
Norra Kärr indicated by the black star.
A further regional-scale factor worth considering is the parallelism of the Lake Vättern rift and the Oslo
rift to the west. This can be seen in Figure 7-4.
The significance of this is illustrated by reference to the work of Sørensen (2003) (6) in which he
notes the occurrences of nepheline syenite in the Gardar and Oslo rift systems in south Greenland
and south-east Norway. The comparison with Norra Kärr and the Vättern rift is compelling.

NI 43-101 - Technical report Norra Kärr REE - 0465-RPT-014 Rev 1
Page 50
Figure 7-4: Simplified Geological Outline of the Svecconorwegian Orogeny
Norra Kärr indicated by the red star
7.2 DISTRICT GEOLOGY
The Norra Kärr intrusive is located close (2 km) to the eastern shore of Lake Vättern, a large rift-
controlled lake. Following the Tasman exploration efforts, the Norra Kärr complex is known to be an
ovoid mass with an areal extent of some 1.3 km by 450 m.
The Norra Kärr complex is intruded into rocks of the TIB – specifically the Växjö Granite of the
Småland-Värmland belt (see Section 7.1 above). This has been dated at ~1 800 Ma while the
fenitisation flanking the western side of the Norra Kärr complex has been dated at 1 489 ± 8 Ma
(Sjöqvist et al, 2013 (6); Christensen, 2013 (7)) thus establishing a reliable age for this intrusive body.
It does however, beg the question as to the “provenance” of the Norra Kärr rocks.
7.3 PROPERTY GEOLOGY
Geologically, the Norra Kärr complex is best defined as a zoned agpaitic, peralkaline, nepheline
syenite - similar in many respects to other well-known peralkaline complexes, e.g. Ilimaussaq in
Greenland and Lovozero on the Kola Peninsula of Russia.
The term “agpaitic” is restricted to peralkaline nepheline syenites containing minerals such as
eudialyte and rinkite that is complex silicates of zirconium, titanium, the rare earth elements, and
fluorine and other volatiles.

NI 43-101 - Technical report Norra Kärr REE - 0465-RPT-014 Rev 1
Page 51
Agpaitic nepheline syenites per definition do not contain simple Zr minerals like zircon and
baddeleyite, despite generally high Zr contents (up to 1–2 wt.% ZrO2). Instead, Zr is mainly hosted in
rock-forming complex Na-Ca-Zr silicate minerals such as members of the catapleiite, eudialyte,
rosenbuschite, and wöhlerite groups.
There has historically been considerable discussion about whether or not the Norra Kärr complex has
been deformed and metamorphosed. New Ar-Ar step heating ages on sodic amphibole from Norra
Kärr and muscovite and biotite from the country rocks give plateau ages at 1.1 Ga and 0.94 Ga, which
correspond to ages derived for Sveconorwegian shear zones in the area (Sjöqvist et al, 2013 (4)).
Together with textural and crystal chemical evidence, these ages make a compelling argument for
some form of Sveconorwegian overprint of the Norra Kärr alkaline complex. This is borne out both by
a report on the structural geology of the complex (Rankin, 2011 (8)) and by observations by the
Tasman geologists in the field. Rankin states that:
“Gross magmatic layering and orientation of early deformation fabrics suggest the body was
emplaced as a sill (possibly lopolithic) within Palaeoproterozoic granite / gneissic basement of
the Fennoscandian Shield.
The intrusive underwent 3 significant phases of deformation:
a) D1 – N-S to NE-SW compression with development of subhorizontal to shallow-dipping
foliation (variable intensity). S1 is sub-parallel to So magmatic layering. Folding appears
restricted to small-scale intrafolial folds.
b) D2 – E-W compression with development of a regional N-S F2 synform. The synform dips
moderately to the west and plunges shallow to moderate to the SW. The Norra Kärr intrusive
is preserved in the synformal keel. A variable intensity F2 foliation overprints S1. This is
generally a flattening fabric, but is locally associated with reverse – thrust mylonite
development on the overturned western limb (along the intrusive contact).
c) D3 – N-S compression with development of E-W and minor conjugate NE- / NW- trending
kink folds across the intrusive. The kink folding produces localised complexities in the
orientation of the dominant S0 / S1 fabric.”
While WAI cannot confirm Rankin’s detailed observations and conclusions, there is no doubt that
there has been a degree of deformation.
7.4 NORRA KÄRR GEOLOGY AND MINERALISATION
7.4.1 GEOLOGY
The basic geology of Norra Kärr is relatively straightforward within the undoubted complexities of the
alkaline intrusive environment as noted above.
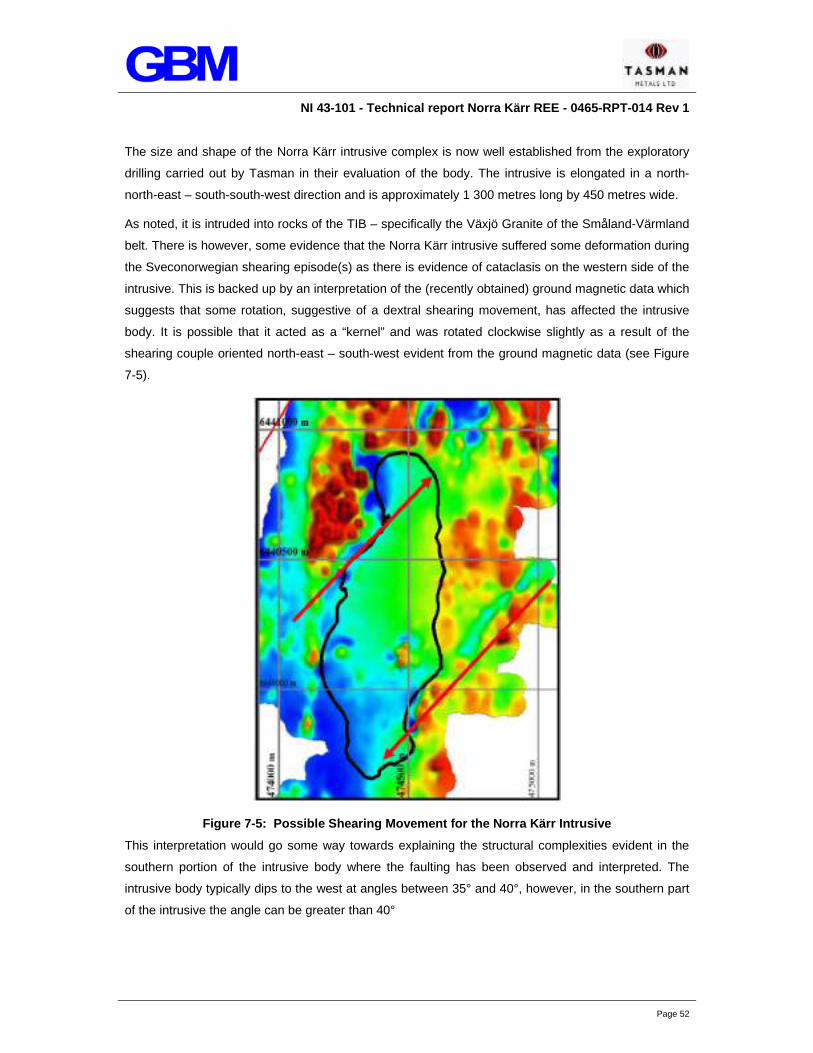
NI 43-101 - Technical report Norra Kärr REE - 0465-RPT-014 Rev 1
Page 52
The size and shape of the Norra Kärr intrusive complex is now well established from the exploratory
drilling carried out by Tasman in their evaluation of the body. The intrusive is elongated in a north-
north-east – south-south-west direction and is approximately 1 300 metres long by 450 metres wide.
As noted, it is intruded into rocks of the TIB – specifically the Växjö Granite of the Småland-Värmland
belt. There is however, some evidence that the Norra Kärr intrusive suffered some deformation during
the Sveconorwegian shearing episode(s) as there is evidence of cataclasis on the western side of the
intrusive. This is backed up by an interpretation of the (recently obtained) ground magnetic data which
suggests that some rotation, suggestive of a dextral shearing movement, has affected the intrusive
body. It is possible that it acted as a “kernel” and was rotated clockwise slightly as a result of the
shearing couple oriented north-east – south-west evident from the ground magnetic data (see Figure
7-5).
Figure 7-5: Possible Shearing Movement for the Norra Kärr Intrusive
This interpretation would go some way towards explaining the structural complexities evident in the
southern portion of the intrusive body where the faulting has been observed and interpreted. The
intrusive body typically dips to the west at angles between 35° and 40°, however, in the southern part
of the intrusive the angle can be greater than 40°

NI 43-101 - Technical report Norra Kärr REE - 0465-RPT-014 Rev 1
Page 53
Lithologically, the Norra Kärr intrusive demonstrates the same complexity of rock types as other
similar agpaitic nepheline syenite intrusives, e.g. Ilimaussaq, Lovozero, with a number of more or less
unique lithologies being present. Due to the age of some of the work - the workers were without other
similar bodies to use as a comparison – “local” rock names were applied. They are mostly variations
on a theme so the lithological complexity originally – and understandably – interpreted by the Tasman
geologists, while somewhat confusing at first sight, is actually relatively easy to understand. More
recently, the Tasman geologists have simplified the “stratigraphy” and WAI have used this simpler
approach in the Mineral Resource estimation (see Section 14). However, the full lithological table as
compiled by the Tasman geological team is provided in order to illustrate both the complexity and the
well-thought out approach by Tasman.
The Norra Kärr intrusive exhibits a clear “layering”. It is not clear if this is primary igneous layering or
not and in this respect there again similarities with the type localities of Ilimaussaq and Lovozero. By
analogy, it is probable that there is at least a degree of igneous differentiation but the mechanics of
this are not yet understood. Notably, if the original intrusion had a lopolithic shape then the later
deformation has played a significant role. Some 75 % of the intrusive consists of varieties of
“grennaite”, an aegirine-rich nepheline syenite carrying the rare, zircono-silicate minerals, eudialyte
and catapleiite. In some respects they resemble the lujavrites present at other agpaitic syenites, e.g.
Ilimaussaq and Lovozero.
Regardless of the mechanism, the Norra Kärr intrusive exhibits a roughly concentric layering (Figure
7-6) with the following pattern being evident. From the centre to the flanks, the main zonal lithotypes
are:
A central (but off-set) core of kaxtorpite (KAX) surrounded by;
A migmatitic grennaite zone (GTM);
A “pegmatitic” grennatite (GPG or PGT) ± lakarpite (LAK);
Fine-grained grennaite containing catapleiite (GTC); and
Various other relatively minor alkaline rocks and mafic intrusives.

NI 43-101 - Technical report Norra Kärr REE 0465-RPT-014 Rev 1
Page 54
Figure 7-6 Geological Map of the Norra Kärr Intrusive

NI 43-101 - Technical report Norra Kärr REE - 0465-RPT-014 Rev 1
Page 55
A brief description of the various rock types (and their sub-types) is given in Figure 7-7.
Figure 7-7: Norra Kärr Intrusive Body Litho Types
[Red outline = principal ore zones.]
The key points on the distribution within the Norra Kärr complex of the main lithotypes shown above
and on the geological map (Figure 7-56) are the lithologies are described below:

NI 43-101 - Technical report Norra Kärr REE - 0465-RPT-014 Rev 1
Page 56
7.4.1.1 KAXTORPITE (KAX)
The main (200 m by 110 m) body of the kaxtorpite is in the (off-set) central core of the intrusive. It is a
zirconium poor, coarse grained, often foliated, sheared, mafic alkaline rock commonly with larger
microcline augen in a groundmass of dark alkali-amphibole, aegirine, pectolite and nepheline as
shown in Figure 7-8. It is relatively barren of REE mineralisation in comparison with the grennaite
varieties discussed below.
Figure 7-8: Foliated Kaxtorpite
7.4.1.2 MIGMATITIC GRENNAITE ZONE (GTM)
Surrounds the kaxtorpite and as the name suggests has a somewhat migmatitic texture with some
kink folding evident (see Figure 7-9) – possibly due to the structural features noted above. This zone
is well mineralised – probably due to the presence of pegmatitic schlieren hosting eudialyte. The
contact with the enclosing pegmatitic grennaite is not sharp and interpretation of this contact depends
to an extent on the percentage pegmatitic schlieren.
Figure 7-9: GTM - “Migmatitic” Grennaite Medium Grained

NI 43-101 - Technical report Norra Kärr REE - 0465-RPT-014 Rev 1
Page 57
7.4.1.3 PEGMATITIC GRENNAITE ZONE (PGT OR GPG)
While not pegmatite, there are visual elements that give this impression (see Figure 7-10). Notably
the quantity and appearance of the eudialyte-bearing schlieren allow for this descriptive term to be
used. The PGT zone is somewhat inhomogeneous and the various subdivisions (GT1, GT2, etc.) are
quite justified. However, it is also fully justified to take the PGT zone as a single unit based on the
criteria utilised by the Tasman technical team. The transition between the GTM and PGT domain is
gradational. The eastern contact between the PGT and GTC domain is however often quite sharp.
Figure 7-10: PGT-Pegmatitic Schlieren/Veining in Grennaite, with Elongated Crystals of Catapleiite and Crystals of Eudyalite
The pegmatitic schlieren and zones generally contain the same main minerals as the fine grained
grennaite but in different proportions. There is also a large variation in mineral composition and grain
size between different pegmatitic schlieren and zones within the complex. Most commonly, the zones
are dominated by microcline-albite and nepheline though darker aegirine rich varieties locally have
been observed.
The distribution of eudialyte and catapleiite are variable but geochemical analyses as well as visual
observations suggest that both minerals are more abundant in the pegmatitic facies than elsewhere.
The amount of eudialyte is seldom greater than ten volume percent though short intervals can be
richer. Eudialyte occurs as rounded to subhedral up to 2 cm in size. Grains are quite variable in colour
from relatively dark brown-red to over clear red to pale pink. In places the eudialyte is pink reddish,
semi-translucent in bands, veins or patches.
7.4.1.4 CATAPLEIITE PORPHYRITIC GRENNAITE (GTC)
The catapleiite porphyritic variety of the grennaite occupies a large volume surrounding the PGT
Zone. The colour varies between greyish green to light green or medium grey (as shown in Figure
7-11). The lighter variations are often found towards the granite contacts. The green colour arises
from the presence of the sodium rich pyroxene aegirine in the groundmass.

NI 43-101 - Technical report Norra Kärr REE - 0465-RPT-014 Rev 1
Page 58
Figure 7-11: GTC-Fine Grained Grennaite with Bluish-White Elongated Catapleiite Crystals
While all the major rock units at Norra Kärr are REE-mineralised to a greater or lesser degree, it is
clear from the work that Tasman has undertaken that the pegmatitic and migmatitic varieties of the
grennaite are the main targets.
7.4.2 MINERALISATION
The mineralisation at Norra Kärr is at once both simple and complex. Simple in mineralogical terms in
that nearly all the REE mineralisation is hosted in the complex zircono-silicate mineral eudialyte.
There are minor amounts of the (probably) secondary Ca-LREE-F-silicate (britholite) and trace
mosandrite. The eudialyte at Norra Kärr is, relatively rich in REE compared to most other similar
deposits and also contains a very high proportion of HREO.
Various studies (e.g. Sjöqvist et al, 2013 (4)), have shown that within the resource, the TREO content
of the eudialyte varies between 6 and 10 %. The percentage of HREO also varies from about 30 % in
the more central GTM zone to above 70 % in more distal GTC zone. The total content and distribution
of the REEs within the eudialyte also varies throughout the deposit. Sjöqvist et al (4) defined three
compositional varieties of eudialyte group minerals at Norra Kärr:
Fe-rich, REE-poor, classical pink eudialyte;
Fe-Mn-bisected, HREE-rich eudialyte from “pegmatitic” grennaite; and
Mn-rich, LREE-rich eudialyte from “migmatitic” grennaite.
This study supports the field and analytical evidence that there are varying types of eudialyte which
can, to an extent, be differentiated by colour with the more vibrant pink variety being poor in REOs
and the duller, brownish-red varieties containing higher values of REOs.
The overall distribution of the REOs within the deposit is illustrated in Figure 7-12, Figure 7-13, and
Figure 7-14.
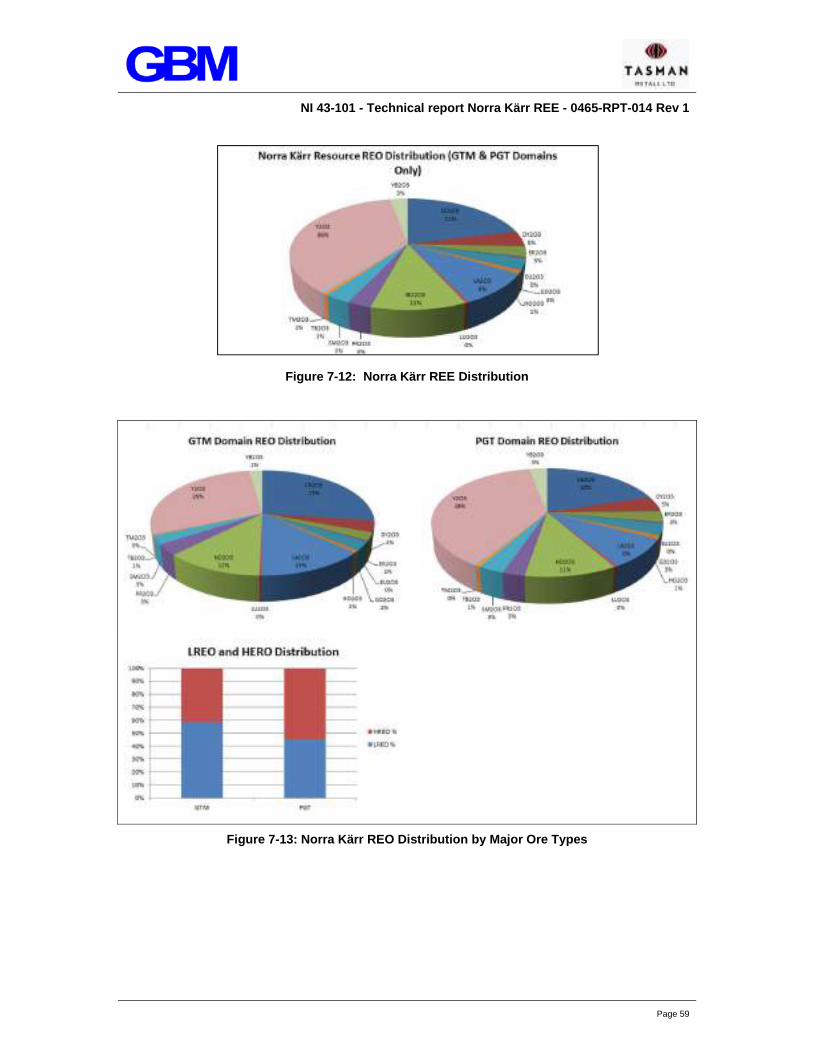
NI 43-101 - Technical report Norra Kärr REE - 0465-RPT-014 Rev 1
Page 59
Figure 7-12: Norra Kärr REE Distribution
Figure 7-13: Norra Kärr REO Distribution by Major Ore Types

NI 43-101 - Technical report Norra Kärr REE - 0465-RPT-014 Rev 1
Page 60
Figure 7-14: Norra Kärr REO Distribution by Rock Domain (Chondrite Normalised)
Equally, it may be shown that ~60 % of the zirconium is hosted by eudialyte with the remaining 40 %
hosted by the catapleiite (Ca/Na2ZrSi3O9•2H2O).
Consequently, whilst the GTC domain contains LREO/HREO and in particular zirconium, the greater
concentrations of LREO and HREO found in GTM and PGT domains, coupled with limited
metalurgical testwork for the GTC domain makes the GTM and PGT the main economic targets at
Norra Karr.

NI 43-101 - Technical report Norra Kärr REE - 0465-RPT-014 Rev 1
Page 61
SECTION 8 DEPOSIT TYPES
8.1 GENERAL
There are a number of different types of REE mineralisation that are of varying importance due to a
number of factors – including some which are not geological. A key factor affecting the importance of
REE is the strategic nature of the minerals and the current dominance in supply from Chinese REE.
Of the “primary” deposits, i.e. not including the highly important ion adsorption clay deposits of China,
the British Geological Survey (BGS) has produced the classification shown in Table 8-1.
Table 8-1: Primary REE Deposit Types (14)
[Norra Kärr-type shown in grey]
Deposit Type Brief Description *Number Documented
Typical Grades and Tonnage
Major Examples
Primary Deposits
Carbonatite-associated
Deposits associated with carbonate-rich igneous rocks associated with alkaline igneous provinces and zones of major faulting.
107 A few 10s thousands of tonnes to several hundred million tonnes, 0.1-10% REO e.g. Bayan Obo: 750 million tonnes at 4.1% REO.
Mountain Pass, USA; Bayan, Obo, China, Okorusu, Namibia, Amba Dongar, India; Barra do Itapirapua, Brazil; Iron Hill, USA.
Associated with alkaline igneous rocks
Deposits associated with igneous rocks characterized by abundant alkali minerals and enrichment in HFSE.
122 Typically <100 million tonnes (Lovozero >1000 million tonnes), grade variable, typically <5% REO e.g. Thor Lake: 64.2 million tonnes at 1.96% REO.
Ilimaussaq, Greenland; Khibina and Lovozero, Russia; Thor Lake and Strange Lake, Canada; Weishan, China; Brockman, Australia, Pajarito Mountain, USA.
Iron-REE deposits (iron-oxide-copper-gold deposits)
Copper-gold deposits rich in iron oxide and diverse in character and form.
4 e.g. Olympic Dam: 2000 million tonnes at 0.3295% REO (Orris and Grauch, 2002)
Olympic Dam, Australia; PEA Ridge, USA.
Hydrothermal deposits (unrelated to alkaline igneous rocks)
Typically quartz, flourite, polymetallic veins and pegmatites of diverse origin.
63(a) Typically <1 million tonnes rarely up to 50 million tonnes, grade variable, typically 0.5 – 4.0%, rarely up to 12% REO e.g. Lemhi Pass: 39 million tonnes at 0.51% REO (Orris and Grauch 2002)
Karonge, Burundi; Naboomspruit and Steenkampskraal, South Africa; Lemhi Pass and Snowbird and Bear Lodge, USA; Hoidas Lake, Canada.

NI 43-101 - Technical report Norra Kärr REE - 0465-RPT-014 Rev 1
Page 62
The other critical factor in assessing REE mineralisation is the “split” between the light rare earth
oxides (LREO) and the heavy rare earth oxides (HREO) within the overall grade of the total rare earth
oxides (TREO). This is critical as many of the HREO are considerably scarcer and attract higher
prices than the LREO. The split of LREO/HREO is shown in Figure 8-1. It will be noted that scandium
and yttrium – whilst not part of the lanthanide group from which the other 15 REE metals occur – are
included in the HREO category as they are often found together in ore deposits. At Norra Kärr the
scandium content is very low and as such has not been assayed by the methods employed by
Tasman, therefore scandium is excluded from the calculation of HREO.
The lighter REE are more incompatible – due to their larger ionic radius – and are consequently more
strongly concentrated in the continental crust than the HREE. They are thus more commonly
available, e.g. in monazite, a common mineral in heavy mineral sand deposits. However, monazite is
also heavily enriched in thorium, a (radioactive) deleterious component.
The BGS also make the mineralogical distinction:
“The vast majority of resources are associated with just three minerals, bastnäsite,
monazite and xenotime. In some REE minerals the LREE are particularly enriched
relative to the HREE, whilst in others the opposite is the case. Bastnäsite and
monasite are the primary source of the LREE, mainly Ce, La and Nd. Monazite has
a different balance as it contains less La and more Nd and HREE. It is also
significant to note that monazite contains the radioactive element thorium.
Xenotime is dominated by the heavier REE including Y, Dy, Er, Yb and Ho
(Harben, 2002)”
However, it is important to note that the mineralisation in the agpaitic syenite complexes (Figure 8-1)
are often dominated by eudialyte group minerals which are particularly favourable for their HREO
content. This is particularly the case at Norra Kärr.

NI 43-101 - Technical report Norra Kärr REE - 0465-RPT-014 Rev 1
Page 63
Figure 8-1: Periodic Table Showing LREO/HERO “Split”
Another important feature is the “criticality” matrix. This is based on the currently perceived
availability both now and in the foreseeable future.
Figure 8-2: REE Criticality Matrices (14)
From Figure 8-2 it is clear that the HREO are the currently preferred target for exploration companies.

NI 43-101 - Technical report Norra Kärr REE - 0465-RPT-014 Rev 1
Page 64
There are a very large number of REE minerals which further complicate the exploration/evaluation
process when considering the economics of REE deposits. A selection of “common” REE-bearing
minerals is shown in Figure 8-3.
Figure 8-3: Selection of REE-bearing Mineral (14)
[Main ore mineral at Norra Kärr outlined in red]
8.2 REE DEPOSITS – DISCUSSION
There are a number of more or less well known REE deposits including the better known Llimaussaq
deposit in Greenland and the Lovozero deposit on the Kola Peninsula, Russia.
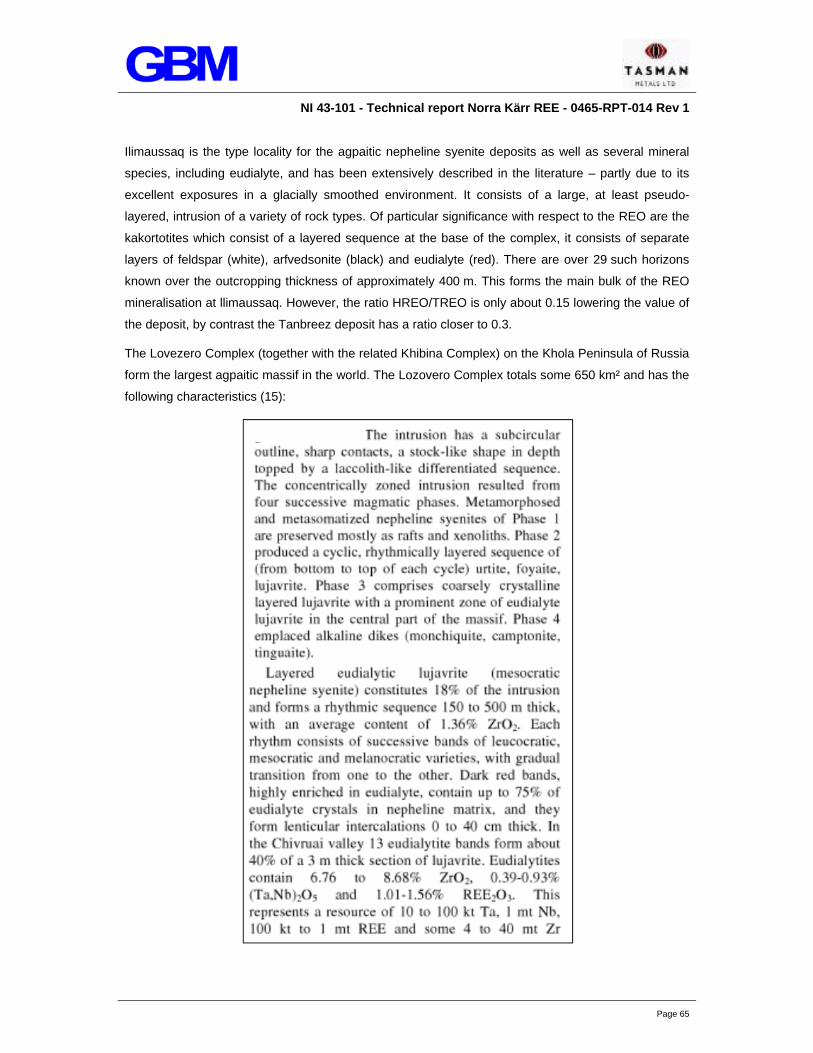
NI 43-101 - Technical report Norra Kärr REE - 0465-RPT-014 Rev 1
Page 65
Ilimaussaq is the type locality for the agpaitic nepheline syenite deposits as well as several mineral
species, including eudialyte, and has been extensively described in the literature – partly due to its
excellent exposures in a glacially smoothed environment. It consists of a large, at least pseudo-
layered, intrusion of a variety of rock types. Of particular significance with respect to the REO are the
kakortotites which consist of a layered sequence at the base of the complex, it consists of separate
layers of feldspar (white), arfvedsonite (black) and eudialyte (red). There are over 29 such horizons
known over the outcropping thickness of approximately 400 m. This forms the main bulk of the REO
mineralisation at llimaussaq. However, the ratio HREO/TREO is only about 0.15 lowering the value of
the deposit, by contrast the Tanbreez deposit has a ratio closer to 0.3.
The Lovezero Complex (together with the related Khibina Complex) on the Khola Peninsula of Russia
form the largest agpaitic massif in the world. The Lozovero Complex totals some 650 km² and has the
following characteristics (15):

NI 43-101 - Technical report Norra Kärr REE - 0465-RPT-014 Rev 1
Page 66
Both the Ilimaussaq and the Lozovero are interpreted as having had (originally, at least) a lopolithic or
laccolithic shape (Figure 8-4) and it is hypothesised that this is possibly the case at Norra Kärr.
Figure 8-4: Possible Mode of Formation of the IIimaussaq Intrusion

NI 43-101 - Technical report Norra Kärr REE - 0465-RPT-014 Rev 1
Page 67
SECTION 9 EXPLORATION
9.1 INITIAL WORKS
Tasman initiated their exploration of Norra Kärr by investigating Boliden’s historical work noted in
Section 6 above. The Boliden trench samples were archived at the Swedish Geological Survey and
were made available to Tasman. Tasman was able to select and assay rocks that were representative
of various lithological units along the two trenches that were excavated (see Section 6) and sampled
by Boliden. While the samples were only grab samples meant to be representative of each of the
lithotypes sampled by Boliden, they served to give a very good indication of the REO potential of the
Norra Kärr intrusive complex. With the Boliden results for the trench composites available a
comparison showed that there was considerable potential for a significant REO deposit. This is shown
in Table 9-1.
Table 9-1: Comparison of Tasman Grab Samples vs. Boliden Composite Trench Samples

NI 43-101 - Technical report Norra Kärr REE - 0465-RPT-014 Rev 1
Page 68
In 2009, Tasman also submitted five rock specimens for petrographic analysis. The findings
supported the observations made by all previous workers at Norra Kärr in that as a whole, the rocks
could be classified as peralkaline nepheline syenites. Small amounts of eudialyte, catapleiite or
rosenbuschite, fluorite and apatite were also noted. Foliation, defined by aligned mineral grains, is
attributed to either regional deformation or as a primary magmatic flow texture (Ashley, 2009 (10)).
“Also in 2009 Tasman contracted Mr John Nebocat of Pacific Geological Services
to prepare an NI43-101 technical report. This report summarised the pre-drilling
history of the property, recommended further exploration, and encouraged Tasman
to continue advancement of the Project.”
(PAH NI43-101 Report 2011 (3))
In keeping with the recommendations of Mr Nebocat, Tasman initiated drilling of the Norra Kärr
project during winter 2009 continuing until spring 2010. Tasman drilled 26 diamond drill holes totalling
3 275.74 m in five east-west orientated profiles across the Norra Kärr intrusion.
Various techniques have been applied when considering the geological mapping of the Norra Kärr
igneous body. These include:
Topographic mapping (including orthophotography and a laser survey);
Geological mapping (including structural mapping); and
Ground Magnetometry.
9.2 TOPOGRAPHIC MAPPING
Various topographic maps of the area are readily available:
Standard Swedish survey maps - at various scales, e.g. 1:50 000 sheet 56375 DinKarta
(Figure 9-1);
Orthophotography (Figure 9-2);
DEM – Figure 9-3 shows a colour-enhance DEM of the Norra Kärr intrusive. It is interesting to
note that it occupies a topographic low to a large extent; and
1 metre contours – a topographic map with 1 m contours has also been produced by Tasman
– this will be of considerable use going forward (see Figure 9-4).
Note: On these figures the Norra Kärr licence is the red outline, the Norra Kärr intrusive is the black
outline and WAI’s visit trajectory is shown in red.
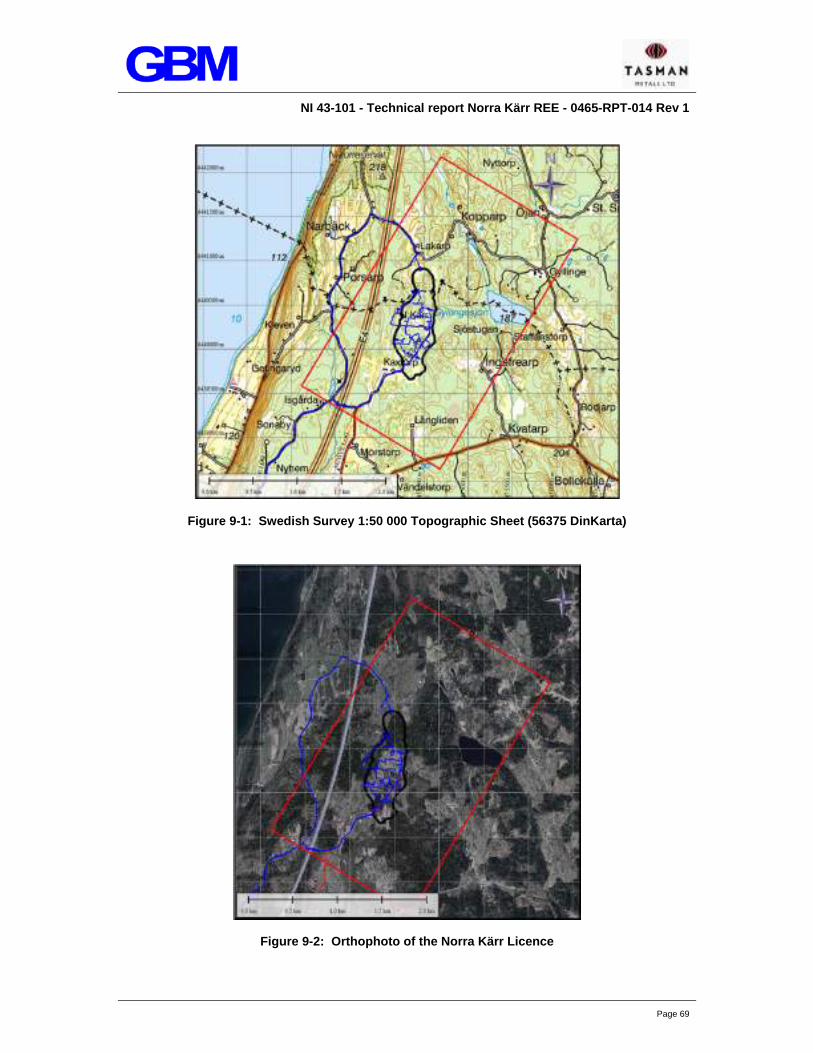
NI 43-101 - Technical report Norra Kärr REE - 0465-RPT-014 Rev 1
Page 69
Figure 9-1: Swedish Survey 1:50 000 Topographic Sheet (56375 DinKarta)
Figure 9-2: Orthophoto of the Norra Kärr Licence

NI 43-101 - Technical report Norra Kärr REE - 0465-RPT-014 Rev 1
Page 70
Figure 9-3: Colour Coded DEM of Norra Kärr
Figure 9-4: Contour Plan of Norra Kärr at 1 m Intervals

NI 43-101 - Technical report Norra Kärr REE - 0465-RPT-014 Rev 1
Page 71
9.3 GEOLOGICAL MAPPING
The geological mapping of the Norra Kärr complex has been an iterative process as many elements
of the work have been utilised to produce the current geological map which is almost certainly
reasonably definitive. It incorporates:
Surface geological mapping;
Ground Magnetometry;
Detailed structural mapping; and
Projection of the drill holes to surface which has confirmed the geology.
9.3.1 SURFACE GEOLOGICAL MAPPING
While there is not a large amount of outcrop, there is sufficient to be able to produce an outcrop map
which confirms the lithotypes - better identified in drill core - and certainly to confirm the overall
lithostructure of the intrusive. Figure 9-5 shows the approximate outline of the Norra Kärr complex
with the surface, geological “observation” points showing the dip and strike and the Tasman coding of
the outcrops. It is apparent that there is some considerable outcrop in the north of the intrusive but it
is somewhat sparser in the south where it is relatively marshy – as indicated by the topography.
The structure of the Norra Kärr complex is well indicated by the dip and strike observations with the
overall westerly dip being apparent. This is better shown in the geological sections which are
included in Section 9.3.3 below.
The trajectory of WAI’s field inspection(s) is also shown on Figure 9-5 and it may be seen that a
considerable number of the outcrops were visited and the Tasman mapping confirmed. Several of the
outcrops were also the loci of the Boliden test pits (believed to be bulk sample sites) from the 1970s.
These are also indicated on Figure 9-5.
These observations immediately give a very reasonable impression of the geology of the Norra Kärr
intrusion and the layering/zonation of the complex. This is further enhanced by the other techniques
that Tasman has applied.

NI 43-101 - Technical report Norra Kärr REE - 0465-RPT-014 Rev 1
Page 72
Figure 9-5: Geological Plan Showing Observation Points and the Old Boliden Pits
Black = outline of Norra Kärr Complex.
Blue = trajectory of WAI visit.
Litho-coding and dip & strike shown at outcrop points.
Red = Boliden pits/trenches

NI 43-101 - Technical report Norra Kärr REE - 0465-RPT-014 Rev 1
Page 73
9.3.2 MAGNETOMETRY
While the ground magnetometry has been the most useful tool in elucidating the tectonics that have
affected Norra Kärr, the regional airborne data has also been applied. This has allowed for a better
understanding of the overall tectonic setting that was discussed in Section 7.4.
The ground magnetometry was discussed and illustrated in Section 7.4 which highlighted the
interpretation of the structural geology. In terms of lithotypes, one other point to note is that the
relatively mafic (and barren of mineralisation) kaxtorpite forming the (offset) centre of the complex
shows up very well as a positive magnetic feature – as is to be expected (see Figure 7-5).
9.3.3 DETAILED STRUCTURAL MAPPING
Tasman commissioned an experienced structural geologist to undertake a study of the intrusive and
its surrounds (Rankin, 2011 (8)) which was discussed in Section 7.4. Rankin concluded that:
“Emplacement and distribution of REE mineralisation is dominantly controlled by
early pegmatite (comagmatic), with some pre- to syn-D1 partial melt remobilisation
possible.
The intrusive was emplaced along a regional, structurally-anomalous N- to NNE-
trending fault/shear corridor within a Palaeoproterozoic granite/gneiss terrane
dominated by a strong WNW- to NEW-trending structural grain. The emplacement
locus may be coincident with an intersecting deep-crustal WNW-trending fault
corridor.”
WAI broadly agrees with these statements with some relatively minor differences concerning the
overall tectonics (see Section 7.4 particularly).
In total 119 drill holes have been drilled and this has been the main tool in elucidating the geology of
Norra Kärr as well as providing an excellent database for the estimation of a Mineral Resource
(Section 14).
Nearly all the holes are angle holes drilled in an easterly direction at 50° to allow for the overall
structure of the intrusion as illustrated in Figure 9-6. The drill hole positions are shown as blue dots
and the traces as the black lines.

NI 43-101 - Technical report Norra Kärr REE - 0465-RPT-014 Rev 1
Page 74
Figure 9-6 Geological Map of the Norra Kärr Intrusive Showing Drill Hole Traces

NI 43-101 - Technical report Norra Kärr REE - 0465-RPT-014 Rev 1
Page 75
The Norra Kärr intrusive is a keel-shaped, synformal body, possibly a folded lopolithic intrusion, more
or less layered and subsequently deformed. The geological interpretation is presented as a geological
map (Figure 9-6) and as various sections across the intrusive (Section A
to Figure 9-14). This interpretation holds together well when rigorously interrogated and thus forms a
robust model for the resource calculations and mine planning which are presented in later Sections of
this document.
There are various observations from the geological map and sections that are worth noting as they
both strongly confirm the geological interpretation and the quality of the drilling database:
Axial plane mafic dyke – this dyke is a consistent feature both in (limited) outcrop and in many
of the drill holes and appears to have been intruded (prior to or more probably during the
major deformation episode) in the axial plane of the intrusive. It forms a good “marker
horizon” and also shows up the strong deformation towards the southern end of the complex
(previously noted) where it is strongly folded and somewhat broken up – probably by the late
rotational (dextral) shearing.
“Foliation” – this feature has been noted previously (see Section 9.3.1 and Figure 9-5, Figure
9-8) and is clearly demonstrated on several “levels”, i.e. plan slices through the intrusive
constructed from the sections. Two illustrations of this are given as Figure 9-8 and Figure 9-7.
Zonation – the obvious zonation of the differing grennaite types is clear. This aids
considerably in the economic assessment of the REO mineralisation of Norra Kärr.
Drilling density – the drilling density (±40 metres) allows for the construction of quite accurate
geological sections and consequently, an accurate map both surface and sub-surface.
All of these features are well noted and described in the Tasman work as well as verified by WAI
(Section 7).

NI 43-101 - Technical report Norra Kärr REE - 0465-RPT-014 Rev 1
Page 76
Figure 9-7: Geological Plan of Norra Kärr Showing Foliation Trends
Figure 9-8: “Typical” Geological Section of Norra Kärr Showing Foliation Trends
Obviously, as a consequence of the drilling and to provide the data necessary to inform the resource
calculations, geological sections have been constructed and a selection of these are presented as
Section A
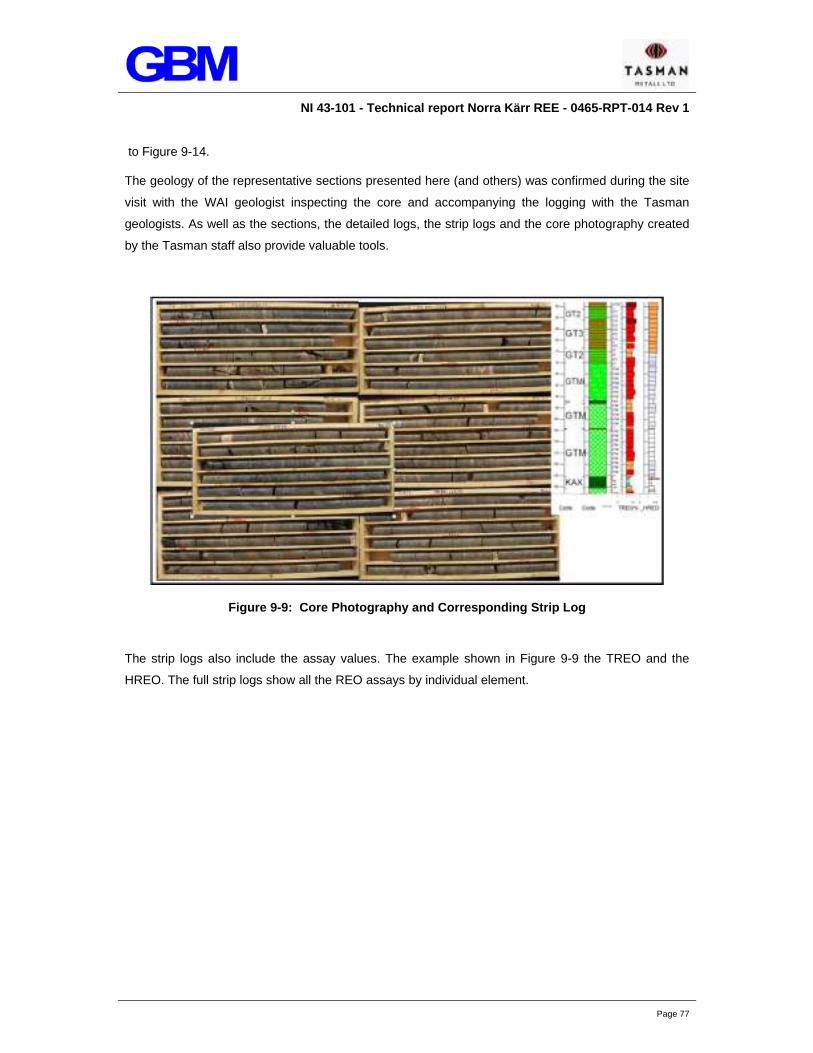
NI 43-101 - Technical report Norra Kärr REE - 0465-RPT-014 Rev 1
Page 77
to Figure 9-14.
The geology of the representative sections presented here (and others) was confirmed during the site
visit with the WAI geologist inspecting the core and accompanying the logging with the Tasman
geologists. As well as the sections, the detailed logs, the strip logs and the core photography created
by the Tasman staff also provide valuable tools.
Figure 9-9: Core Photography and Corresponding Strip Log
The strip logs also include the assay values. The example shown in Figure 9-9 the TREO and the
HREO. The full strip logs show all the REO assays by individual element.

NI 43-101 - Technical report Norra Kärr REE - 0465-RPT-014 Rev 1
Page 78
Table 9-2: Example of Detailed Drill Hole Log (Hole NKA10014) Hole_ID Sample_No From To Width Description
NKA10014 401033 1.95 2.60 0.65 Grennaite with 40% peg zones rich in bluish Cat xx:s.NKA10014 401034 2.60 4.60 2.00 Grennaite slightly cooked, re-crystallized with only occasional cm wide migmatitic-pegmatitoidal schlieren.NKA10014 401035 4.60 6.60 2.00 Grennaite as above with 3-5% bluish Cat laths.NKA10014 401036 6.60 8.25 1.65 Grennaite as above with 3-5% bluish, small Cat laths. Occasional cm-wide migm-peg schlieren.NKA10014 401037 8.25 9.85 1.60 Grennaite as above with 3-5% bluish, small Cat laths. Occasional cm-wide migm-peg schlieren.NKA10014 401038 9.85 11.35 1.50 Grennaite as above with 3-5% bluish, small Cat laths. Occasional cm-wide migm-peg schlieren.NKA10014 401039 11.35 13.35 2.00 Grennaite with 5-10% up to 7 cm wide peg zones/schlieren. Some Eu.NKA10014 401040 13.35 15.40 2.05 Grennaite with 5% peg/migm schlierenNKA10014 401041 15.40 17.45 2.05 Grennaite with 5-10% peg schlieren with some blue Cat and minor Eu.NKA10014 401042 17.45 18.75 1.30 Almost 100% very coarse grained peg. Mic-Alb-Nef, some Aeg and relatively rich in Eu and also pink large (up NKA10014 401043 18.75 20.00 1.25 70% Peg with some zones of Grennaite. Relatively Eu rich and also with large pink Cat xx:s.NKA10014 401044 20.00 21.25 1.25 80% Peg with some zones of Grennaite. Relatively Eu rich and also with large pink Cat xx:s.NKA10014 401045 21.25 23.00 1.75 25% irregular peg zones/schlieren with large orange-red Cat xx:s and some Eu.NKA10014 401046 23.00 24.75 1.75 25% irregular peg zones/schlieren with large orange-red Cat xx:s and some Eu.NKA10014 401047 24.75 25.42 0.67 100% Peg. Pale fsp dominated. Relatively rich in fine diss. PbS, minor blue Cat.. In part pink-red coloured fsp.NKA10014 401048 25.42 27.40 1.98 25% peg/migm schlieren (Mic-Alb-Nef and some Eu).NKA10014 401049 27.40 29.40 2.00 20% peg/migm schlieren as above. Tr PbS.NKA10014 401050 29.40 31.20 1.80 10% peg/migm schlieren as above. Some Natrolite.NKA10014 401052 31.20 33.00 1.80 10% peg/migm schlieren as above. Some Natrolite.NKA10014 401053 33.00 33.45 0.45 100% very coarse grained peg with some Natrolite xx:s in open vugs. Some Eu.NKA10014 401054 33.45 35.20 1.75 100% very coarse grained peg with some Natrolite xx:s in open vugs. Some Eu.NKA10014 401055 35.20 36.90 1.70 30% peg and medium grained migm/peg zones. Some Eu-Cat. Tr. PbS.NKA10014 401056 36.90 38.90 2.00 Grennaite with only occasional thin migm schlieren. Some Natrolite bandlets and vugs.NKA10014 401057 38.90 40.90 2.00 30% peg and medium grained migm/peg zones. Some Eu-Cat. Tr. PbS.NKA10014 401058 40.90 42.90 2.00 Grennaite with 25% up to 3 cm wide peg/migm bands rich in blue-grey Cat xx:s and minor Eu.NKA10014 401059 42.90 44.90 2.00 Grennaite with 40% peg/migm zones. Rel rich in both Eu and Cat. Red-grey Cat xx:s.NKA10014 401060 44.90 46.90 2.00 40-50% peg zones. Relatively Eu rich, some Cat. Tr PbS.NKA10014 401061 46.90 48.90 2.00 25% peg schlieren/zones.NKA10014 401062 48.90 50.90 2.00 30% peg schlieren/zones. Some Eu+Cat.NKA10014 401063 50.90 52.90 2.00 30% peg schlieren/zones. Some Eu+Cat.NKA10014 401064 52.90 54.90 2.00 40% zones of peg and more medium grained "granite textured" migm. Grennaite host.NKA10014 401065 54.90 56.75 1.85 30% peg zones and schlieren with Eu and bluish Cat. Tr. PbS.NKA10014 401066 56.75 58.65 1.90 30-40% peg zones and schlieren with Eu and bluish Cat. Tr. PbS + fluorite.NKA10014 401067 58.65 60.55 1.90 20% peg zones and schlieren with Eu and bluish Cat.NKA10014 401068 60.55 62.45 1.90 80% peg zones and more medium grained Grennaite. Relatively Eu rich, some Cat. Tr. PbS+fluorite.NKA10014 401069 62.45 64.45 2.00 40% peg and medium grained zones. Relatively Eu rich. Minor PbS+fluorite.NKA10014 401070 64.45 65.45 1.00 90-100% very coarse grained peg. Eu rich. Some vugs filled with Natrolite xx:s. Minor fluorite, tr. PbS.NKA10014 401071 65.45 67.45 2.00 40-50% peg zones. Relatively Eu rich. Tr PbS+Fluorite.NKA10014 401072 67.45 69.45 2.00 25-35% peg zones. Relatively Eu rich. Minor bluish Cat.NKA10014 401073 69.45 71.45 2.00 50-60% Peg zones (in part medium grained). Relatively Eu rich, some Cat. Tr PbS+fluorite.NKA10014 401074 71.45 73.45 2.00 30% peg (mainly one zone). In part weathered, vuggy. Some Natrolite xx:s in vugs. Some Eu, minor PbS.NKA10014 401075 73.45 75.45 2.00 15% peg zones/schlieren. Minor Eu, tr. PbS.NKA10014 401077 75.45 77.05 1.60 60% mainly medium grained Grennaite. In part real peg. Some Eu, minor PbS+Fluorite.NKA10014 401078 77.05 78.55 1.50 10-20% Peg schlieren. In part somewhat cooked, re-crystallized Grennaite.NKA10014 401079 78.55 80.55 2.00 80% Peg zones. Often more medium grained texture. Some Eu, tr. PbS + Fluorite.NKA10014 401080 80.55 82.55 2.00 60% Peg zones. Often more medium grained texture. Some Eu, minor. PbS + Fluorite.NKA10014 401081 82.55 84.55 2.00 70% Peg zones. In part more medium grained texture. Some Eu, tr. PbS + Fluorite.NKA10014 401082 84.55 86.55 2.00 90% Peg zones. Often more medium grained texture. Aeg-amph rich. Some Eu, tr. PbS + Fluorite.NKA10014 401083 86.55 88.45 1.90 90% Peg zones. Often more medium grained texture. Aeg-amph rich. Some Eu, tr. PbS + Fluorite.NKA10014 401084 88.45 89.60 1.15 10-15% peg zones in slightly re-crystallized Grennaite.NKA10014 401085 89.60 90.72 1.12 30% Peg zones.NKA10014 401086 90.72 92.20 1.48 85% of the sample medium grained, "granite textured". Not real peg. Rich in Aeg. Some Eu.NKA10014 401087 92.20 94.20 2.00 Somewhat re-crystallized Grennaite with only one 15 cm zone of Peg.NKA10014 401088 94.20 96.20 2.00 Grennaite only rare thin peg schlieren.NKA10014 401089 96.20 98.20 2.00 10% peg schlieren.NKA10014 401090 98.20 100.20 2.00 5-10% Peg zones/schlieren. Somewhat re-crystallized Grennaite.NKA10014 401091 100.20 102.20 2.00 Less than 5% peg schlieren.NKA10014 401092 102.20 104.10 1.90 Only occasional peg schlieren. At 103.35m some pale yellow-red small xx:s in a peg vein (possibly strange Eu?NKA10014 401093 104.10 106.15 2.05 25% irregular peg zones/schlieren. Minor Eu, Tr PbS+Fluorite.
All of the features mentioned in the descriptions above have been checked and WAI is satisfied that
the Tasman staff exercised considerable diligence in their logging and that the sections produced –
see below – are both accurate and well recorded.
The complete suite of geological sections were utilised in producing the 3D geological wireframes and
the Mineral Resource estimate presented in Section 14 below.
The Legend for the geological sections is also reproduced here as Figure 9-10.
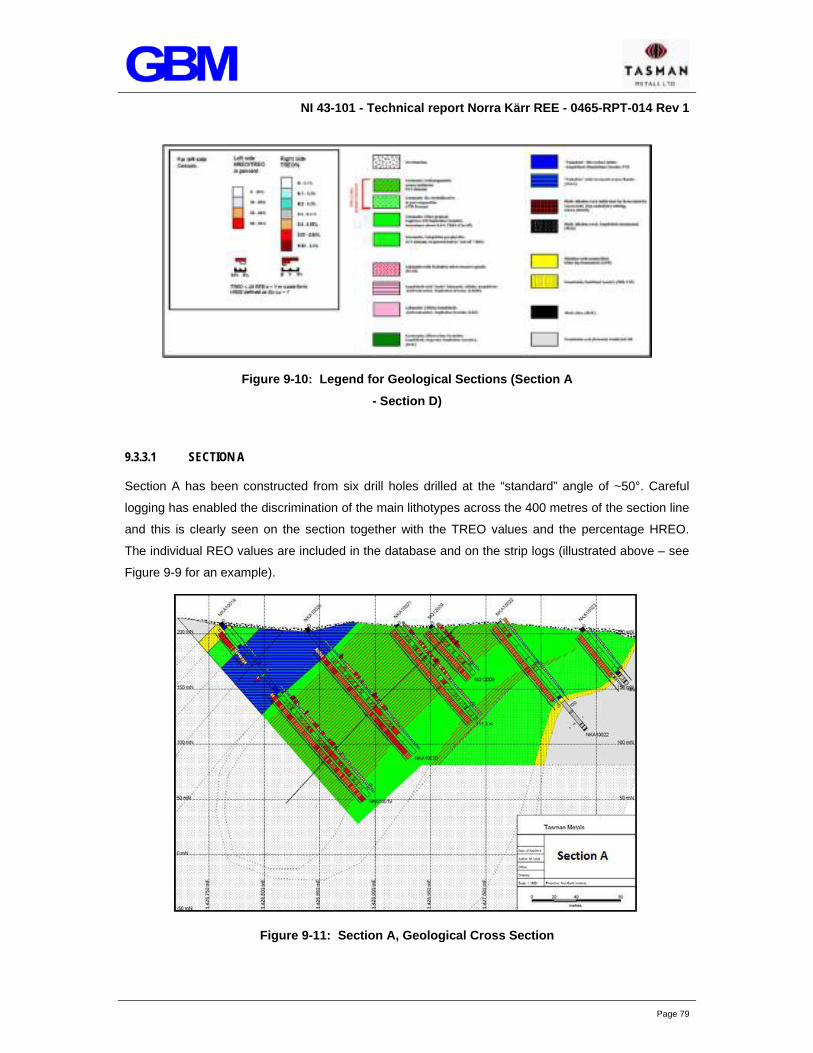
NI 43-101 - Technical report Norra Kärr REE - 0465-RPT-014 Rev 1
Page 79
Figure 9-10: Legend for Geological Sections (Section A
- Section D)
9.3.3.1 SECTION A
Section A has been constructed from six drill holes drilled at the “standard” angle of ~50°. Careful
logging has enabled the discrimination of the main lithotypes across the 400 metres of the section line
and this is clearly seen on the section together with the TREO values and the percentage HREO.
The individual REO values are included in the database and on the strip logs (illustrated above – see
Figure 9-9 for an example).
Figure 9-11: Section A, Geological Cross Section
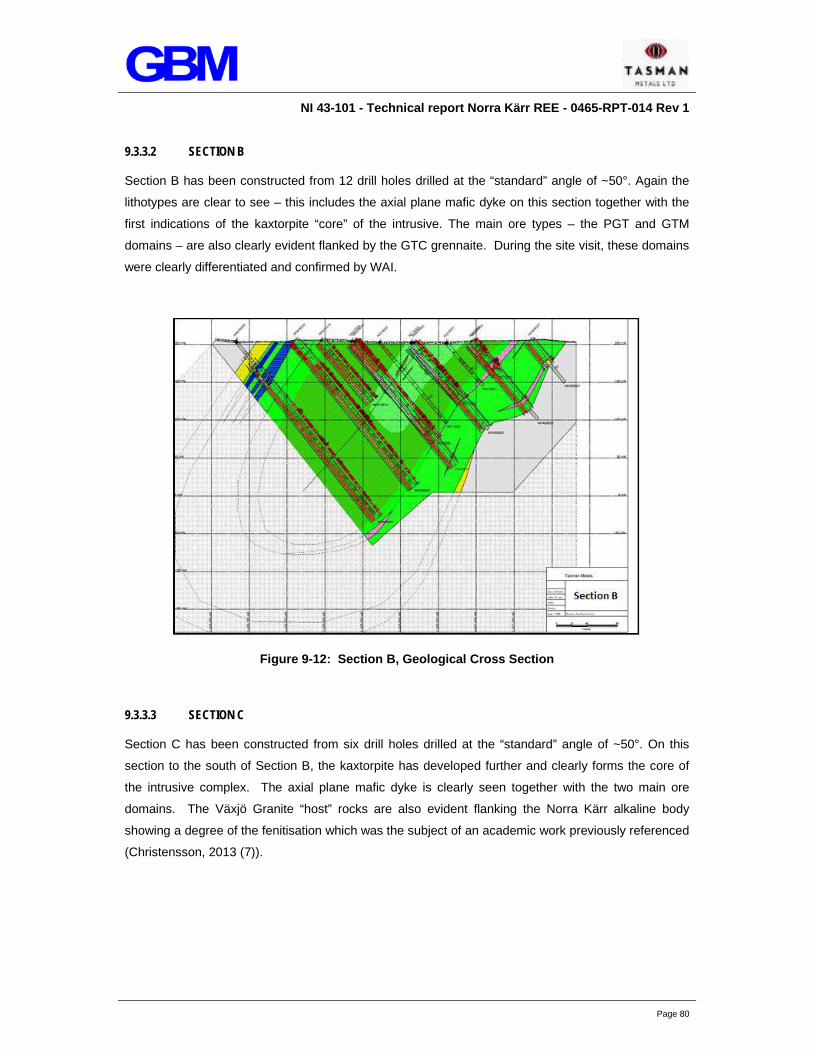
NI 43-101 - Technical report Norra Kärr REE - 0465-RPT-014 Rev 1
Page 80
9.3.3.2 SECTION B
Section B has been constructed from 12 drill holes drilled at the “standard” angle of ~50°. Again the
lithotypes are clear to see – this includes the axial plane mafic dyke on this section together with the
first indications of the kaxtorpite “core” of the intrusive. The main ore types – the PGT and GTM
domains – are also clearly evident flanked by the GTC grennaite. During the site visit, these domains
were clearly differentiated and confirmed by WAI.
Figure 9-12: Section B, Geological Cross Section
9.3.3.3 SECTION C
Section C has been constructed from six drill holes drilled at the “standard” angle of ~50°. On this
section to the south of Section B, the kaxtorpite has developed further and clearly forms the core of
the intrusive complex. The axial plane mafic dyke is clearly seen together with the two main ore
domains. The Växjö Granite “host” rocks are also evident flanking the Norra Kärr alkaline body
showing a degree of the fenitisation which was the subject of an academic work previously referenced
(Christensson, 2013 (7)).

NI 43-101 - Technical report Norra Kärr REE - 0465-RPT-014 Rev 1
Page 81
Figure 9-13: Section C, Geological Cross Section
9.3.3.4 SECTION D
Section D has been constructed from nine drill holes drilled at the “standard” angle of ~50°. At the
southern end of the Norra Kärr body, the kaxtorpite core pinches out and this is well shown on this
section. The GTM domain here forms two “tongues” included in the massive PGT domain. The high
values in the PGT are clearly shown. At the base of the section in drill holes NKA11038 and
NKA11033 a tongue of the ELAK domain is to be seen. This is the eudialyte-bearing lakarpite
previously described.

NI 43-101 - Technical report Norra Kärr REE - 0465-RPT-014 Rev 1
Page 82
Figure 9-14: Section D, Geological Cross Section
9.3.4 SURFACE EXPLORATION SUMMARY
Study of all the available data clearly shows the relatively simple structure and zonation of the Norra
Kärr intrusive. The elongated, ovoid shape is well defined by the magnetometry, the surface mapping
and the drill sections. The foliation indicates that the intrusive body may well “close off” at depth
forming a synformal structure but this is not yet certain. A deep drill hole to test this was proposed by
Rankin (2011) (8) but this is considered by WAI as a “nice to know” at this stage as it has no impact
on the initial 20 year mine life.

NI 43-101 - Technical report Norra Kärr REE - 0465-RPT-014 Rev 1
Page 83
SECTION 10 DRILLING
Tasman commenced drilling in December 2009 and as of the end of 2012 had completed a total of
124 holes totalling 21,171m, of which 5 holes were geotechnical totalling 751m. Drilling has been
carried out on east-west section lines with drilling inclined to the east at approximately 50°. Section
lines are spaced approximately 50 m apart with drill holes spaced along the sections lines at 60-80 m.
Hole depths range from 30.5 m to 395.59 m with an average depth of 172 m.
All drilling has been carried out using diamond core drilling, in total three drilling contractors have
been used as summarised in Table 10-1. The initial phase of drilling comprising 11 drill holes in
2009-2010 was conducted by North Scandinavian Drilling (NSD) who used a Diamec U6 (Atlas
Copco) drill rig producing a core diameter of 42 mm (BGM). In February 2010 after NSD had drilled
11 holes drilling was taken over by Geo-Grupen AB based in Goteborg who drilled 76 holes between
February 2010 and May 2012 producing core with a diameter of 40.7 mm (BQ-TK).
The most recent drilling contractor employed is Olstam Borrteknik AB (Olstam BT) using Sandvik drill
rigs the company drilled 32 holes in 2012 with nine of the holes yielding 39 mm (WL56) core diameter
and 23 holes producing larger diameter 50.7 mm (NQ2) diameter core.
Table 10-1: Summary of Tasman Exploration Drilling Activity
Drill Operator No. Holes Total Length (m) Core Diameter Drill Period Orientated
Core
NSD 11 1 792.58 BGM 2009-Jan 2010 Only for 3 Holes
Geo-Grupen 76 13 418.73 BQ-TK Feb 2010-2012 47 holes
Olstam BT 32 5 209.02 WL56 (9 holes); NQ2 (23 holes) 2012 4 Holes
Total 119 20 420.33 - - 54
10.1.1 CORE RECOVERY
As part of the drilling and core logging works Tasman has recorded core recovery based on length
drilled versus the length recovered. The Tasman drill hole database provided to WAI contains
recovery details for 104 drill holes and comprises 11 295 core recovery records ranging from zero for
6 intervals through to >90% recovery for 99 % of the sample database, core recovery averages
99.7 %.
The geological database provided to WAI also recorded Rock Quality Designation (RQD) for 103 drill
holes and comprised 11 274 records with an average RQD of 86 %.

NI 43-101 - Technical report Norra Kärr REE - 0465-RPT-014 Rev 1
Page 84
As part of the WAI May 2014 site visit drill core was visually reviewed and demonstrated excellent
recovery. Overall WAI is of the opinion that the Norra Kärr mineralisation is highly competent and that
no material losses of core have occurred. Further the high level of recovery and the assay results
obtained preclude any preferential bias due to core loss.
10.1.2 SURVEY
Drill hole locations are initially laid out using a GPS based on the Tasman geologists exploration plan.
A final pick up of the drill hole collar co-ordinates is carried out post drilling by Metria AB, an
independent Swedish land survey company. The collar surveys are carried out using a Differential
Global Positioning System with an accuracy of 0.01 m in the horizontal and 0.2 m in the vertical.
Downhole surveys have been carried out for all drill holes using one of two different downhole survey
instruments:
DeviTool PeeWee; and
Reflex EZ-Trac.
The DeviTool™ PeeWee is a downhole multishot magnetic survey instrument with an azimuth
accuracy of ±0.5° and an inclination accuracy of ±0.1°. This particular downhole instrument was used
for the initial phase of drill holes between 2009 and 2011.
In the later part of the exploration programme in 2001 and 2012 a Reflex EZ-Trac multishot magnetic
downhole instrument was used with an azimuth accuracy of ±0.35° and an inclination accuracy of
±0.25°.
Overall WAI is of the opinion that the survey works carried out by Tasman are robust and accurate.
10.1.3 CORE LOGGING, SAMPLING AND STORAGE
Tasman has taken a diligent approach to the core logging resulting in a detailed geological database
containing driller information, survey data, detailed geological descriptions including lithological codes
and geotechnical data comprising RQD results and foliation orientations.
With the considerable drill programme carried out by Tasman, there was a need to streamline the drill
core preparation and sample handling capability over that which was initially instituted (see PAH
NI43-101, 2011 (3)). Consequently, Tasman has installed what might be termed a “state of the art”
facility in the nearby Town of Gränna.
A large warehouse (with a nearby office) was rented and drill core storage and preparation facilities
installed. The logging tables are almost the complete length of the warehouse and, as a
consequence, all but the longest drill holes can be laid out in consecutive order thereby eliminating
the need to constantly be shuffling core trays around to obtain an integrated picture of any particular
drill hole (Figure 10-1). A hand operated fork lift assists in the moving of core trays.
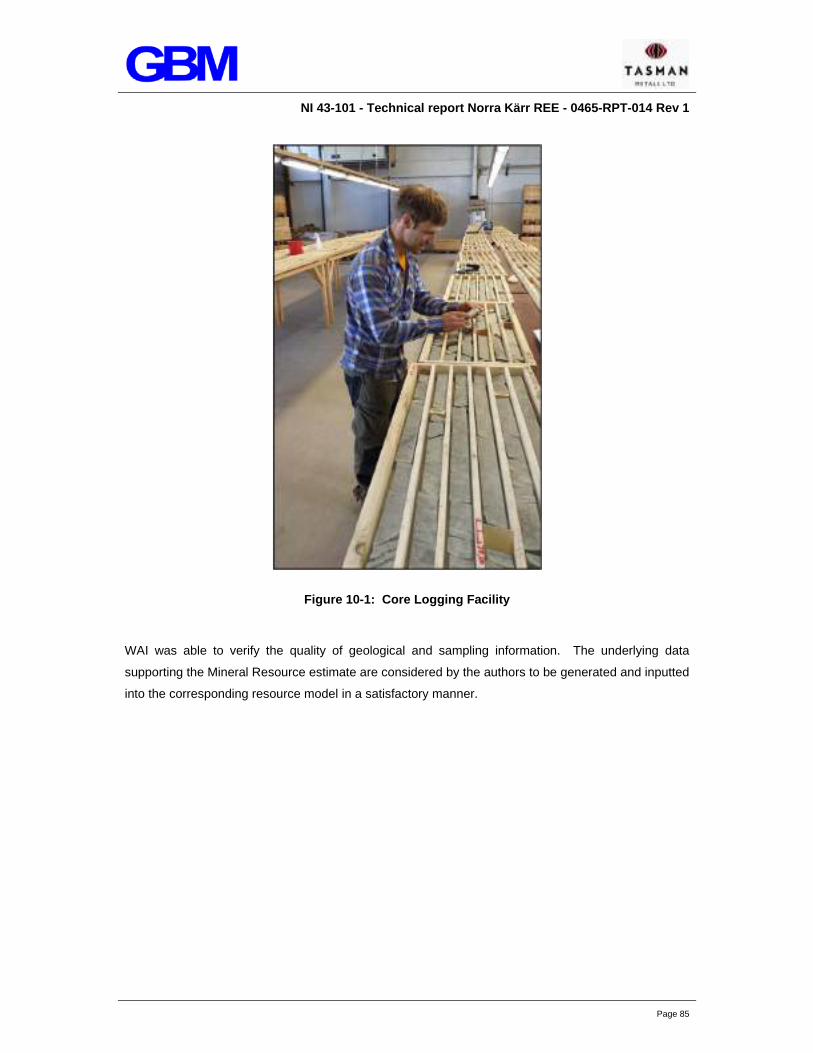
NI 43-101 - Technical report Norra Kärr REE - 0465-RPT-014 Rev 1
Page 85
Figure 10-1: Core Logging Facility
WAI was able to verify the quality of geological and sampling information. The underlying data
supporting the Mineral Resource estimate are considered by the authors to be generated and inputted
into the corresponding resource model in a satisfactory manner.

NI 43-101 - Technical report Norra Kärr REE - 0465-RPT-014 Rev 1
Page 86
SECTION 11 SAMPLE PREPARATION, ANALYSES, AND SECURITY
11.1 CORE CUTTING
At the Tasman core facility in Gränna there is a “built in” core sawing shack which has an automated
core saw to ensure accurate splitting of the core. The core was cut taking into consideration the main
foliation/banding of the rock. When it was possible to reassemble the core, the same half of the core
was submitted for assay. One half of the core was placed in a numbered plastic bag together with the
corresponding sample ticket and the other half was left in the core tray.
Prior to the establishment of the Tasman facility at Gränna, core was cut at the SGU facilities in Malå
by Tasman personnel. To speed up the core cutting process a limited amount of core was also sent
to the ALS sample preparation facility at Öjebyn in 2011. Details of the sample intervals were
provided by Tasman to the contractor ensuing that lithological boundaries were honoured. The core
was then cut perpendicular to the foliation and banding of the rock using a diamond saw. The half
cores for assay were placed into plastic bags with a sample ticket recording the individual sample
numbers. Retained half core was returned to the core trays and stored at the SGU archive in Malå.
11.2 SAMPLE PREPARATION
Samples have been prepared at the ALS Chemex facility at Piteå in northern Sweden. ALS Chemex
is an ISO accredited (ISO/IEC 17025) laboratory and the sample preparation facility is part of the
main ALS laboratory set up.
Samples arriving at the ALS Chemex facility in Piteå are initially checked against the corresponding
sample submission documents submitted by Tasman’s geological staff. Samples are then dried and
weighed and recorded on the ALS Chemex database. Samples are dried at 110-120°C and then
crushed with either an oscillating jaw crusher or a roll crusher.
The crushed sample, typically 250 g to 1 kg, is sub-sampled by use of a riffle splitter. A 250 g sub-
sample is taken for further pulverising whilst the remaining crushed material is bagged up and
returned to Tasman. The 250 g sub-sample is then pulverized using a ring mill till >85 % passes
75 µm (200 mesh screen).
For assay a sub-sample of the pulverised material of approximately 10-15 g is taken and shipped to
the ALS Chemex assay laboratory in Vancouver, Canada for analysis. The remainder of the crush
reject and pulp are stored at ALS Chemex in Piteå prior to being returned to Tasman.
Figure 11-1 shows the ALS Chemex facility in Piteå.

NI 43-101 - Technical report Norra Kärr REE - 0465-RPT-014 Rev 1
Page 87
Figure 11-1: ALS Chemex Sample Preparation Facility Piteå
11.3 ANALYSES
Tasman has submitted all samples for assay at the ALS Chemex laboratory in Vancouver, Canada.
ALS Chemex has analysed the samples using the analytical method ME-MS81, an inductively
coupled plasma (ICP) mass spectrometry technique. In instances where samples returned assays
with zirconium grades >10 000 ppm then samples were also analysed using the ME-XRF10 method.
The analytical specification used by ALS Chemex for the ME-MS81 method is:
“A prepared sample (0.200g) is added to lithium metaborate flux (0.90g), mixed well and fused in a
furnace at 1000°C. The resulting melt is then cooled and dissolved in 100mL of 4% HNO3 / 2% HCl
solution. This solution is then analysed by inductively coupled plasma (ICP) mass spectrometry.”
Details of the detection limits for analytical method ME-MS81 are provided in Table 11-1 below:

NI 43-101 - Technical report Norra Kärr REE - 0465-RPT-014 Rev 1
Page 88
Table 11-1: ALS Chemex ME-MS81 Detection Limits
Element Detection Range (ppm)
Element Detection Range (ppm)
Element Detection Range (ppm) Total Length (m)
Element BGM
Detection Range (ppm)
Min Max Min Max Min Max Min Max
Ag 1 1 000 Ga 0.1 1 000 Pb 5 10 000 Tm 0.01 1 000
Ba 0.5 10 000 Gd 0.05 1 000 Pr 0.03 1 000 U 0.05 1 000
Ce 0.5 10 000 Hf 0.2 10 000 Rb 0.2 10 000 V 5 10 000
Co 0.5 10 000 Ho 0.01 1 000 Sm 0.03 1 000 W 1 10 000
Cr 10 10 000 La 0.5 10 000 Sn 1 10 000 Y 0.5 10 000
Cs 0.01 10 000 Lu 0.01 1 000 Sr 0.1 10 000 Yb 0.03 1 000
Cu 5 10 000 Mo 2 10 000 Ta 0.1 10 000 Zn 5 10 000
Dy 0.05 1 000 Nb 0.2 10 000 Tb 0.01 1 000 Zr 2 10 000
Er 0.03 1 000 Nd 0.1 10 000 Th 0.05 1 000
Eu 0.03 1 000 Ni 5 10 000 TI 0.5 1 000

NI 43-101 - Technical report Norra Kärr REE - 0465-RPT-014 Rev 1
Page 89
WAI is fully satisfied that the analyses have been carried out to the highest standards and that the
results may be used in a preparing a Mineral Resource in accordance with the CIM Definition
Standards for Mineral Resources and Mineral Reserves.
11.4 QA/QC
As part of the Tasman exploration works a Quality Assurance/Quality Control (QA/QC) programme
has been implemented to provide support and credence to the sample assay data. The QA/QC
programme has been applied to the drill core samples and comprises the submission of field
duplicates, laboratory duplicates, external lab duplicates, blanks and certified reference materials
(CRMs) including submission of CRMs to externals labs (ACME 2010-2011 and ACTLABS 2012)..
QA/QC samples use the same numbering sequence as standard samples; so as to ensure the
samples are submitted blind to the laboratory and that no specialist treatment of the samples is
carried out.
WAI was provided with the results of the field duplicates, laboratory duplicates, external laboratory
duplicates, blanks and CRMs in Excel format.
11.4.1 FIELD DUPLICATES
A total of 426 field duplicate results have been provided to WAI. The field duplicate samples were
quarter core which was submitted to the sample preparation facility prior to being sent to the
laboratory. In sending quarter core field duplicates the results allow Tasman to ascertain the potential
sum analytical, sub sampling and sampling error. Any issues associated with the representivity of the
sampling methods, errors occurring due to the sample preparation methods or problems relating to
analytical precision will most likely show up in the field duplicate results.
If an error is identified then further QA/QC procedures such as the use of crushed and pulverised
duplicates, blanks and CRMs are required to better delineate the source of the error.
Figure 11-2, Figure 11-3 and Figure 11-4 show the field duplicate results for Dy, Y and Nd
respectively. As can be seen these show an excellent level of repeatability and therefore precision.
High levels of precision was also exhibited for the other REEs.

NI 43-101 - Technical report Norra Kärr REE - 0465-RPT-014 Rev 1
Page 90
Figure 11-2: Dy Field Duplicate QA/QC Results

NI 43-101 - Technical report Norra Kärr REE - 0465-RPT-014 Rev 1
Page 91
Figure 11-3: Y Field Duplicate QA/QC Results

NI 43-101 - Technical report Norra Kärr REE - 0465-RPT-014 Rev 1
Page 92
Figure 11-4: Nd Field Duplicate QA/QC Results

NI 43-101 - Technical report Norra Kärr REE - 0465-RPT-014 Rev 1
Page 93
11.4.2 LABORATORY DUPLICATES
To test the analytical precision of the laboratory Tasman has submitted duplicate pulp samples. A
total of 601 pulp duplicate sample results have been provided to WAI. Examples of the results are
shown below in Figure 11-5, Figure 11-6 and Figure 11-7 for Dy, Y and Nd respectively.
The results of the Tasman laboratory duplicate samples show excellent levels of repeatability and
thus demonstrate the laboratory is operating with a high level of analytical precision and that the
sample post pulverising, is homogenous and representative.

NI 43-101 - Technical report Norra Kärr REE - 0465-RPT-014 Rev 1
Page 94
Figure 11-5: Dy Laboratory Duplicate QA/QC Results

NI 43-101 - Technical report Norra Kärr REE - 0465-RPT-014 Rev 1
Page 95
Figure 11-6: Y Laboratory Duplicate QA/QC Results

NI 43-101 - Technical report Norra Kärr REE - 0465-RPT-014 Rev 1
Page 96
Figure 11-7: Nd Laboratory Duplicate QA/QC Results
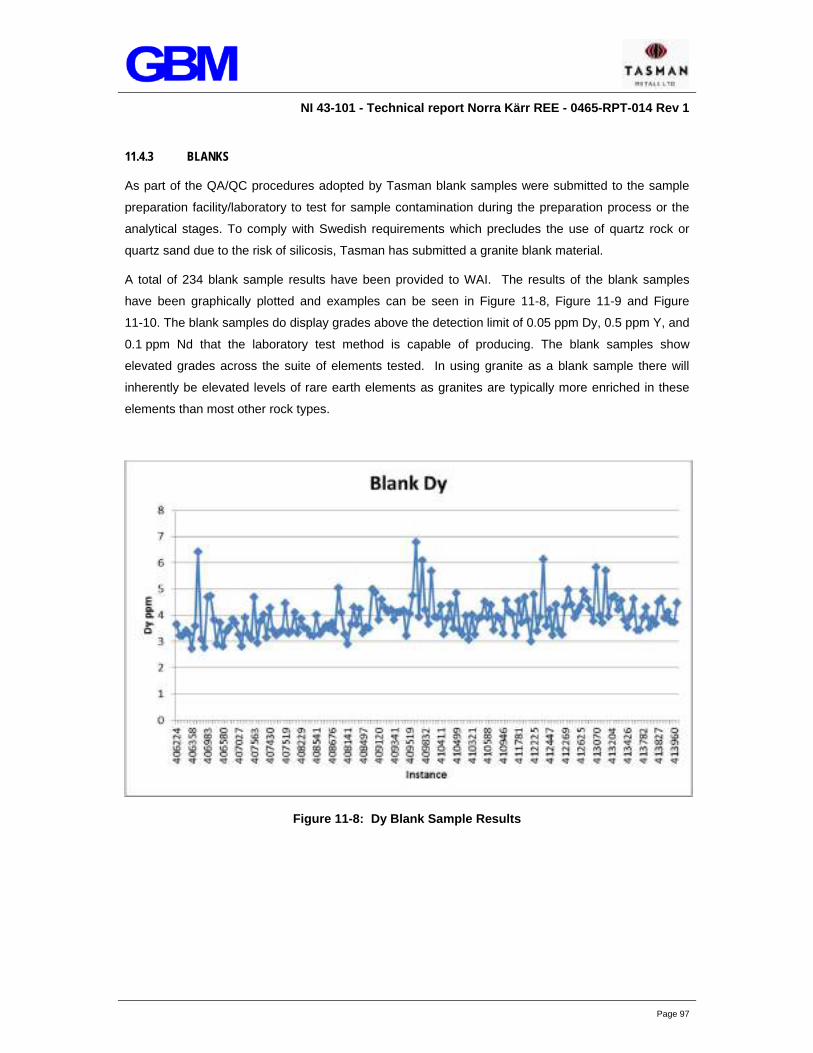
NI 43-101 - Technical report Norra Kärr REE - 0465-RPT-014 Rev 1
Page 97
11.4.3 BLANKS
As part of the QA/QC procedures adopted by Tasman blank samples were submitted to the sample
preparation facility/laboratory to test for sample contamination during the preparation process or the
analytical stages. To comply with Swedish requirements which precludes the use of quartz rock or
quartz sand due to the risk of silicosis, Tasman has submitted a granite blank material.
A total of 234 blank sample results have been provided to WAI. The results of the blank samples
have been graphically plotted and examples can be seen in Figure 11-8, Figure 11-9 and Figure
11-10. The blank samples do display grades above the detection limit of 0.05 ppm Dy, 0.5 ppm Y, and
0.1 ppm Nd that the laboratory test method is capable of producing. The blank samples show
elevated grades across the suite of elements tested. In using granite as a blank sample there will
inherently be elevated levels of rare earth elements as granites are typically more enriched in these
elements than most other rock types.
Figure 11-8: Dy Blank Sample Results

NI 43-101 - Technical report Norra Kärr REE - 0465-RPT-014 Rev 1
Page 98
Figure 11-9: Y Blank Sample Results
Figure 11-10: Nd Blank Sample Results
Whilst it is noted that the blank samples do contain mineralisation WAI is of the opinion that this is due
to the function of using a granite as a blank material and is not a function of contamination issues at

NI 43-101 - Technical report Norra Kärr REE - 0465-RPT-014 Rev 1
Page 99
the sample preparation stage. The grades exhibited are minor, typically <3 % of the mean grade of
the overall Norra Kärr intrusive ore body grades, and if contamination issues were significant then the
error would likely show up in the field duplicate results.
11.4.4 CERTIFIED REFERENCE MATERIAL
Tasman has carried out extensive checks with regards to the accuracy of the analytical methods used
on the Norra Kärr samples through the use of CRMs. CRM samples have been supplied by Ore
Research and Exploration Pty Ltd (OREAS). A few other purchased CRMs have been submitted but
only in very low numbers. A summary of the certified values for the relevant CRMs as well as the
calculated standard deviations is reported in Table 11-2.
As well as using pre-made CRM samples Tasman have produced two of their own CRMs; NKA01 and
NKA02 both of which have been certified by OREAS as matrix-matched certified reference material
(MMCRM). The two MMCRMs represent different TREO concentrations with NKA01 having a TREO
grade of 0.4 % and NKA02 having a grade of 0.6 %. Both MMCRMs were produced from crushed
reject material from the sample preparation stage of the original core samples. To certify the samples
10 commercial laboratories took part in a round robin of lithium borate fusion ICP-MS test work with
five 20 g samples being submitted to each laboratory per MMCRM. The certified values and the
calculated standard deviations for each tested element are shown in Table 11-2.
Table 11-2: CRM Sample Summary
CRM ID Element Target CRM
Grade
±1 SD ±2 SD
Number of CRM
Submitted
Mean Assay Grade
% of Assay Results within ±2 SD of Target CRM
Grade
OREAS100a
Dy 23.2 0.9 0.18
36
23.04 92
Y 142 6 12 134.24 78
Eu 3.71 0.36 0.72 3.88 100
La 260 13 26 255.64 100
Nd 152 14 28 149.81 100
Ce 463 29 58 453.92 100
Gd 23.6 2.2 4.4 24.96 100
Tb 3.80 0.34 0.68 3.83 100
Pr 47.1 4.0 8.0 47.03 100
Sm 23.6 0.7 1.4 23.86 83
OREAS102a
Dy 18.1 1.0 2.0
50
17.46 92
Y 105 5 10 101.31 84
Eu 3.89 0.35 0.7 3.97 100
La 323 16 32 315.10 92
Nd 180 16 32 177.45 100

NI 43-101 - Technical report Norra Kärr REE - 0465-RPT-014 Rev 1
Page 100
CRM ID Element Target CRM
Grade
±1 SD ±2 SD
Number of CRM
Submitted
Mean Assay Grade
% of Assay Results within ±2 SD of Target CRM
Grade
Ce 587 48 96 563.86 98
Gd 20.9 1.6 3.2 22.50 40
Tb 3.05 0.23 0.46 3.13 96
Pr 58 4 8 56.67 100
Sm 24.7 1.3 2.6 24.65 100
OREAS104
Dy 7.11 0.14 0.28
85
7.31 58
Eu 1.29 0.08 0.16 1.30 100
La 48.8 2.7 5.4 48.38 100
Nd 49.5 1.4 2.8 50.16 87
Ce 102 7 14 102.80 100
Gd 9.4 0.9 1.8 9.09 100
Tb 1.39 0.14 0.28 1.33 100
Pr 12.8 0.7 1.4 12.89 100
Sm 10.5 0.7 1.4 10.82 100
OREAS146
Dy 224 16 32
360
220.29 97
Y 905 53 106 922.32 98
Eu 127 9 18 129.28 96
La 2513 185 370 2527.15 98
Nd 2182 192 384 2183.37 98
Ce 4691 360 720 4758.69 99
Gd 359 23 46 339.96 92
Tb 47.2 3.4 6.8 45.21 98
Pr 548 36 72 555.31 99
Sm 441 36 72 449.92 99
NKA01
Dy 175 9.7 19.4
161
168.13 95
Y 1131 62.2 124.4 1136.02 99
Eu 10.8 0.49 0.98 10.93 95
La 313 24.6 49.2 315.84 99
Nd 307 18.6 37.2 309.73 99
Ce 626 58.2 116.4 634.76 100
Gd 111 7.7 15.4 107.46 98
Tb 24 1.68 3.36 23.48 100
Pr 79 3.1 6.2 79.14 92
Sm 88 2.3 4.6 87.57 81
NKA02 Dy 241 11.9 23.8 162 228.19 85

NI 43-101 - Technical report Norra Kärr REE - 0465-RPT-014 Rev 1
Page 101
CRM ID Element Target CRM
Grade
±1 SD ±2 SD
Number of CRM
Submitted
Mean Assay Grade
% of Assay Results within ±2 SD of Target CRM
Grade
Y 1569 94.7 189.4 1659.26 90
Eu 18.2 0.63 1.26 18.09 83
La 520 28.2 56.4 517.96 99
Nd 576 22 44 575.31 89
Ce 1120 81.2 162.4 1135.18 100
Gd 176 12.4 24.8 169.17 99
Tb 34.8 2.12 4.24 33.81 98
Pr 143 6 12 145.75 88
Sm 152 3.8 7.6 153.65 73
OREAS 45P
Dy 4.1 0.2 0.4
28
3.94 86
Y 18 1.4 2.8 17.31 100
Eu 1.2 0.1 0.2 1.17 82
La 24.8 1 2 24.31 89
Nd 21 0.6 1.2 20.75 71
Ce 48.9 1.6 3.2 47.69 71
Gd 4.0 0.2 0.4 4.29 75
Tb 0.69 0.04 0.08 0.69 100
Pr 5.42 2.1 4.2 5.61 100
Sm 4.51 0.14 0.28 4.37 57
OREAS 45C
Dy 4.0 0.1 0.2
74
4.03 61
Y 18.1 1.4 2.8 18.77 100
Eu 1.18 0.08 0.16 1.19 99
La 26.2 1.1 2.2 26.35 89
Nd 22.8 1.7 3.4 22.14 97
Ce 50.2 1.3 2.6 50.92 65
Gd 4.2 0.2 0.4 4.09 81
Tb 0.70 0.04 0.08 0.66 95
Pr 5.61 0.12 0.24 5.89 30
Sm 4.7 0.1 0.2 4.74 54
Example results for a number of the CRMs are shown in Figure 11-11 to Figure 11-17. The CRM
results show a good level of accuracy with the majority of results for both the OREAS CRMs and the
NKA01 and NKA02 CRMs falling within ±2 standard deviations. In the case of CRM OREAS 45c the
results for dysprosium show a lower level of accuracy. Given the low Dy grade in CRM OREAS 45c
WAI is of the opinion that the OREAS 45c Dy CRM results are reasonable.

NI 43-101 - Technical report Norra Kärr REE - 0465-RPT-014 Rev 1
Page 102
Figure 11-11: CRM OREAS 100a Dy Results
Figure 11-12: CRM OREAS 100a Nd Results

NI 43-101 - Technical report Norra Kärr REE - 0465-RPT-014 Rev 1
Page 103
Figure 11-13: CRM OREAS 104 Eu Results
Figure 11-14: CRM OREAS 45p Y Results

NI 43-101 - Technical report Norra Kärr REE - 0465-RPT-014 Rev 1
Page 104
Figure 11-15: CRM OREAS 45c Dy Results
Figure 11-16: CRM NKA01 Dy Results

NI 43-101 - Technical report Norra Kärr REE - 0465-RPT-014 Rev 1
Page 105
Figure 11-17: CRM NKA02 Gd Results
11.4.5 WAI DUPLICATE ASSAYS
As part of the WAI due diligence processes a total of 14 samples were selected by Greg Moseley
(Qualified Person) during the May 2014 site visit, of these samples eight samples were duplicate core
samples, four samples were pulverised duplicates, one sample was CRM NKA02 and one sample
was a blank. A summary of the results is provided in Table 11-3.
A good correlation is exhibited between the original assays and the core and pulverised duplicates
particularly with regards to the core duplicates. Pulverised duplicates show lower levels of precision
for some elements but this may be related to the sample not being fully homogenised using the cone
and quarter method prior to submission to the laboratory.

NI 43-101 - Technical report Norra Kärr REE - 0465-RPT-014 Rev 1
Page 106
Table 11-3: WAI 2014 Duplicate Sample Summary
TYPE BHID From (m) To (m)
Original Grade Duplicate Grade
Dy ppm
Y ppm
Eu ppm
Nd ppm
Tb ppm
Dy ppm
Dy % Diff
Y ppm
Y % Diff
Eu ppm
Eu % Diff
Nd ppm
Nd % Diff
Tb ppm
Tb % Diff
Core
NKA11053 179.4 181.0 145.5 1 015 9.43 238 21.4 156 +7 1 030 +1 9.66 +2 249 +5 21.9 +2
NKA12062 192.7 194.7 299 1 985 23.5 616 41.5 294 -2 2 050 +3 21.9 -7 605 -2 44.1 +6
NKA12090 80.15 82.55 217 1 505 20.6 745 33.4 205 -6 1 505 0 18.55 -10 672 -10 31.2 -7
NKA12090 219.0 221.0 160 946 10.5 245 20.9 151.5 -5 981 +4 9.35 -11 253 +3 21.2 +1
NKA12064 176.92 178.46 7.02 42.6 1.89 61.6 1.19 6.97 -1 38.5 -10 1.93 +2 63.5 +3 1.2 0
NKA12076 114.0 41.3 271 5.06 168 6.34 42.90 +4 294 +8 4.93 -3 197 +17 6.71 +6
NKA12807 223.05 224.55 248 1 910 27.1 1 020 40.2 234 -6 1 870 -2 25.8 -5 990 -3 37.8 -6
NKA12085 148.87 150.78 141 1 055 10.3 384 19.6 137.5 -2 994 -6 9.88 -4 395 +3 19.95 +2
Pulp
Pulp Dup of Sample 402479 9.09 49.3 1.89 52.8 1.48 9.14 +1 55.9 +13 1.83 -3 53.9 +2 1.5 +1
Pulp Dup of Sample 400636 163 1 010 10.9 249 22.7 161.00 -1 1 010 0 8.83 -19 232 -7 21.8 -4
Pulp Dup of Sample 401379 334 2 070 24.8 546 48.9 353.00 +6 2 280 +10 21.9 -12 566 +4 50.6 +3
Pulp Dup of Sample 402695 136.5 939 9.79 192 19.25 152.00 +11 942 0 8.91 -9 195.5 +2 20.9 +9
Blank Blank <0.05 <0.5 <0.03 <0.1 <0.01 3.42 +6 840 20 +4 000 0.44 +1 467 21.2 +21 200 0.64 +6 400
CRM NKA02 241 1 569 18.2 576 34.8 229.00 -5 1 625 +4 17.2 -5 559 -3 34 -2

NI 43-101 - Technical report Norra Kärr REE - 0465-RPT-014 Rev 1
Page 107
11.4.6 QA/QC SUMMARY
The WAI audit of the QA/QC data has identified a number of risks within the sample data. These risks
are summarised in Table 11-4. It should be noted that Table 11-4 does not provide a quantitative risk
assessment, but gives an indication as to where WAI considers the risks lie within the sampling data.
A six-score classification has been employed where:
1-2 (‘low’ risk): Little or no perceived risk, or low uncertainty;
3-4 (‘moderate’ or ‘medium’ risk): Risk present which could lead to small material error in the
resource model; and
5-6 (‘high’ risk): This feature could lead to material error in the resource model (high
uncertainty).
Table 11-4: Risk Matrix: QA/QC Sample Auditing
QA/QC Sampling Risk Comments
Field Duplicates 1 The field duplicates display an excellent correlation and level of repeatability. Such results show that the combined sampling, sample preparation and analytical errors are minor and do not materially impact the precision of the samples.
Lab Duplicates 1 As with the field duplicates the laboratory pulverised duplicates display an excellent level of precision showing that the sample material following pulverisation is homogenous and that the laboratories analytical systems are precise.
Blanks 3
Tasman has used a granite blank for their QA/QC procedures due to state requirements. The results of the analysis of the blanks show that there are low grades of mineralisation above the analytical detection limit. Whilst the blank material has displayed mineralisation WAI believes this is due to natural levels of mineralisation within the granite rock rather than a contamination issue at the sample preparation facility. The blank sample results show a fairly uniform trend, if there was a contamination issue WAI would expect to see a more erratic distribution of results.
If there were contamination issues at the sample preparation stage such errors would be exhibited in the field duplicate samples as the field duplicate results are a sum of the sampling, sample preparation and analytical errors. The high level of correlation in the field duplicates therefore supports the view that the grades in the blank samples are natural grades within the granite.
Certified Reference Materials
2
Tasman has submitted a number of CRMs included CRM samples bought from OREAS as well as CRM NKA02 which Tasman has developed from crushed sample material from Norra Kärr which has been subject to round robin testing and has subsequently been certified by OREAS.
The CRM results for a range of elements and at a range of grades show a good level of analytical accuracy at the laboratory.
WAI Check Assays
2
WAI has chosen 14 duplicate samples during the May 2014 site visit by Greg Moseley (Qualified Person) for submission to the ALS Chemex laboratory for verification purposes. From these samples a total of eight core duplicates were submitted showing a reasonable level of repeatability to the original assays. A further four pulverized duplicates were submitted and showed a lower level of precision although this may be attributable to the cone and quarter method of mixing the pulverized sample not adequately homogenizing the samples.
Whilst the samples show some deviation WAI does not consider it material and is of the opinion that the Tasman assays display both precision and accuracy.
NI 43-101 - Technical report Norra Kärr REE - 0465-RPT-014 Rev 1
Page 108
QA/QC Sampling Risk Comments
External Duplicates 3
A total of 525 samples have been submitted to external laboratories ACME and ACTLABS. WAI has been provided with results for 500 of the external duplicates with 194 provided for the ACME laboratory and 316 for the ACTLABS laboratory. The results display a high level of repeatability of the samples support a good level of precision in the assaying.
Overall Rating 2 Low Risk
WAI considers the Quality Assurance and Quality Control risk for the Norra Kärr project to be “Low”
and that the sample preparation procedures and analytical methods are suitable.
11.4.7 EXTERNAL DUPLICATE ASSAYS
To check the precision of the primary laboratories duplicate samples and some CRM samples were
submitted to external laboratories for verification. In total 525 pulverised duplicate samples have
been submitted to external laboratories, the results of 500 duplicate samples have been provided to
WAI. From the 500 external duplicates supplied to WAI a total of 194 samples were submitted to the
ACME laboratory and 316 samples were submitted to ACTLABS.
WAI has reviewed the results with high levels of repeatability and precision exhibited by both
laboratories as demonstrated in Figure 11-18.

NI 43-101 - Technical report Norra Kärr REE - 0465-RPT-014 Rev 1
Page 109
Figure 11-18: Dy ACTLABS External Duplicates

NI 43-101 - Technical report Norra Kärr REE - 0465-RPT-014 Rev 1
Page 110
11.5 DENSITY DETERMINATION
A total of 1 513 bulk density tests have been carried out by Tasman with the resultant database
supplied to WAI. The database contains the recorded drill hole ID, depth from and to, dry and wet
weights as well recording the lithological rock type. Density values range between 2.22 t/m3 and
3.445 t/m3 and average 2.71 t/m3.

NI 43-101 - Technical report Norra Kärr REE - 0465-RPT-014 Rev 1
Page 111
SECTION 12 DATA VERIFICATION
WAI visited the Norra Kärr project in May and June 2014, including the logging facilities, drill core,
surface exposures, the ALS Chemex sample preparation facility in Piteå, Sweden, as well as
reviewing and discussing the geology, exploration works, testwork and QA/QC procedures with
Tasman and ALS Chemex personnel. The following aspects were inspected during the visits:
The geological and geographical setting of the Norra Kärr alkaline intrusive complex;
The extent of the exploration work completed to date;
Inspection of the core logging, sampling and storage facilities;
Inspection of the core and a review of the logging procedures;
Review of the sampling and sample preparation procedures;
Discussions with the geological staff regarding geological interpretation; and
A visit to the ALS Chemex sample preparation facility in Piteå, Sweden, to review the facilities
as well as discuss the methods and procedures employed.
WAI has undertaken a number of steps to verify the quality and robustness of the sample data. The
data verification is split into three sections:
Field verification;
Sample treatment; and
Laboratory treatment.
12.1 FIELD VERIFICATION
12.1.1 SURFACE MAPPING
Some aspects of the field verification, e.g. surface geological mapping, are covered in Section 9.3.1,
where the location of outcrops and old Boliden excavations was noted and the trajectory of WAI’s site
visit illustrated. WAI visited a considerable number of the important outcrops and photographs of
these some of the sites are shown in Figure 12-1 to Figure 12-4.

NI 43-101 - Technical report Norra Kärr REE - 0465-RPT-014 Rev 1
Page 112
Figure 12-1: Tasman Geologists at a Typical Norra Kärr Outcrop
Figure 12-2: Site of Former Boliden Excavation
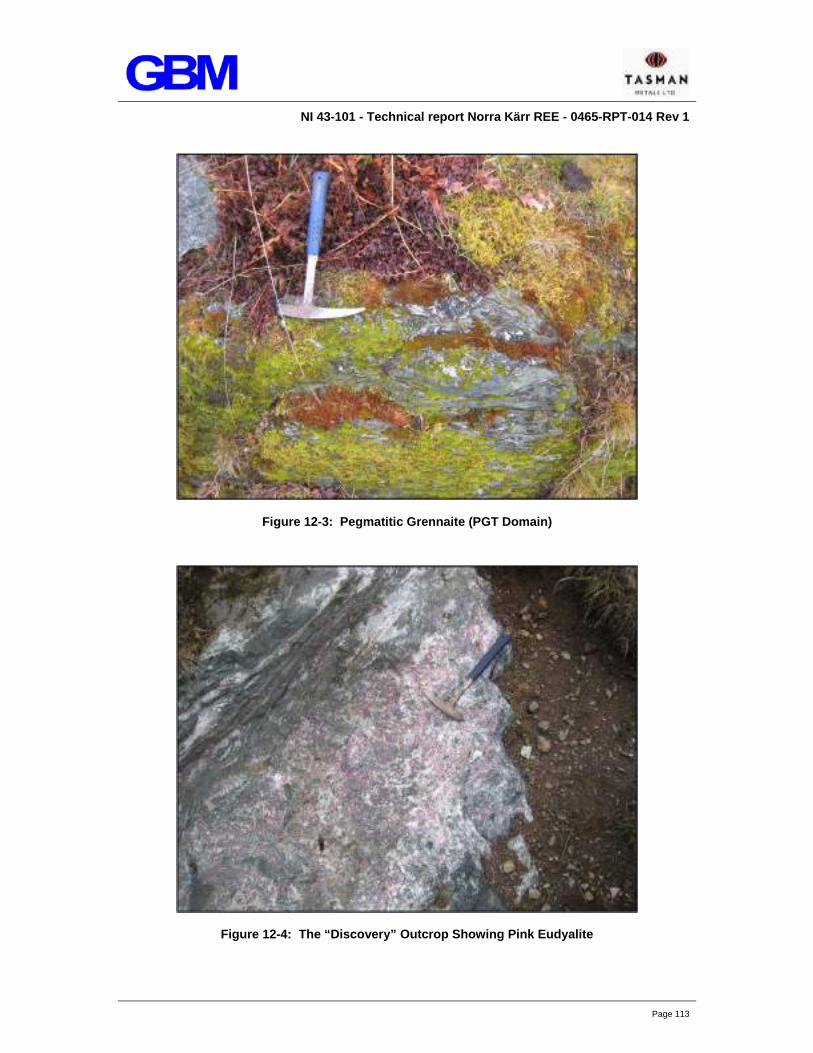
NI 43-101 - Technical report Norra Kärr REE - 0465-RPT-014 Rev 1
Page 113
Figure 12-3: Pegmatitic Grennaite (PGT Domain)
Figure 12-4: The “Discovery” Outcrop Showing Pink Eudyalite

NI 43-101 - Technical report Norra Kärr REE - 0465-RPT-014 Rev 1
Page 114
12.1.2 DRILL HOLE SURVEYS
During the May 2014 site visit WAI undertook a review of drill hole collar positions. This was achieved
during the various traverses undertaken as part of the surface mapping discussed previously.
Approximately 65 % of the more than 100 drill hole sites were visited and their positions confirmed by
GPS.
While there is a consistent small error – in general less than five metres – this can be put down to
“experimental error” and the conversion used from the GPS reading to the SWEREF99TM projection
via the Global Mapper (V15.2) software utilised by WAI. This error is not considered significant and
the collar positions are accepted by WAI as being accurate for all practical purposes.
Figure 12-5 and Figure 12-6 show the Tasman drill hole positions and the trajectory and positions as
measured by WAI in the field. Positions of the drill holes at site were denoted by drill hole casing as
shown in Figure 12-7.

NI 43-101 - Technical report Norra Kärr REE - 0465-RPT-014 Rev 1
Page 115
Figure 12-5: Plan Showing Drill Hole Collar Positions and the WAI Site Visit Trajectory

NI 43-101 - Technical report Norra Kärr REE - 0465-RPT-014 Rev 1
Page 116
Figure 12-6: Enlarged Image Showing Drill Hole Sites and WAI Site Visit Trajectory
Figure 12-7: Drill Hole Collar Marked by Casing

NI 43-101 - Technical report Norra Kärr REE - 0465-RPT-014 Rev 1
Page 117
12.2 SAMPLING VERIFICATION
WAI considers the sampling and assay information to be reliable. WAI chose eight core sample
duplicates and four pulverised sample duplicates for assay (see Section 11.4.5). The results of the
WAI duplicate samples shows support for the robustness of the sample data on which the Mineral
Resource estimate reported in Section 14 is based.
The plastic bags containing the samples were then packed in cardboard boxes and sent by bus to the
ALS Chemex preparation laboratory in Piteå in the north of Sweden prior to being sent to the ALS
Chemex laboratory in Vancouver.
The sample quality is considered to be adequate in all respects – from the logging of the core to the
core splitting and sample despatch to the ALS Chemex facility in Piteå. The handling of the core and
the treatment and despatch of the samples by Tasman has fully conformed to industry “best practice”
and WAI is satisfied with all of these aspects.
WAI discussed core and sample handling procedures with Tasman’s key geological and technical
personnel. On the basis of these discussions, WAI believes that all split core was well and securely
packed and stored prior to transportation to the laboratory for processing. As a result WAI considers
sample security to be adequate.
WAI also understands that other than the core splitting procedure at no time was an officer, director or
associate of Tasman involved in the sample preparation or analytical work and an independent
laboratory was employed for sample preparation and analysis. It is therefore WAI’s belief that it is
highly unlikely that an officer, director or associate would have had the opportunity to contaminate the
sample data.

NI 43-101 - Technical report Norra Kärr REE - 0465-RPT-014 Rev 1
Page 118
SECTION 13 MINERAL PROCESSING AND METALLURGICAL
TESTING
13.1 HISTORICAL TESTING
Historical quantitative mineralogy, beneficiation and hydrometallurgical testing programmes have
been conducted by various agents since Tasman acquired control of the Norra Kärr deposit. Relevant
technical material generated as part of historical programmes has previously been reported in the
Preliminary Economic Assessment (PEA) prepared by Pincock Allen & Holt (May 2012; restated April
2013 (4)). A summary of the relevant results are presented here for convenience however the reader
is referred to the original report for the complete appraisal. SGS Lakefield conducted limited testing on
whole ore employing sulfuric acid. The tests demonstrated the efficacy of the method however the
acid consumption was uneconomic. Beneficiation work was subsequently undertaken by GTK
employing both negative flotation and magnetic separation either separately or in combination. The
programme confirmed that the eudialyte could be beneficiated by means of magnetic separation. The
flotation work demonstrated that aegirine could be also separated from the eudialyte, subject to
sufficient liberation, by means of negative flotation whereby aegirine was selectively floated from the
remaining mineral mass. Finally, hydrometallurgical testing was undertaken by John Litz and
Associates where tests employed both sulfuric and hydrochloric acid leaching on mineral concentrate
prepared by GTK where a majority of acid consuming gangue minerals were rejected. This further
confirmed the efficacy of sulfuric acid leaching and demonstrated an improved acid consumption
profile compared with the whole ore treatment.
13.2 CURRENT TESTING
Testing completed since the PEA published in 2012 covers quantitative mineralogical
characterisation, beneficiation and hydrometallurgical campaigns. Two primary material composites
were prepared to undertake various aspects of the testing programmes. The first composite was
prepared in April 2012 to facilitate investigative testing of various beneficiation methods at the
research facilities of Dorfner ANZAPLAN (ANZAPLAN, Germany). The second composite was
prepared in November 2012 to facilitate a broader testing campaign developing from the ANZAPLAN
work and for the preparation of mineral concentrate for further hydrometallurgical testing.
13.2.1 COMPOSITE DESCRIPTION, SAMPLE PREPARATION AND ANALYSIS
All composites used in the test programmes were prepared under the guidance of Tasman’s Chief
Geologist, Magnus Leijd. The selection criteria for the sourced material was to select material which

NI 43-101 - Technical report Norra Kärr REE - 0465-RPT-014 Rev 1
Page 119
as a whole represented, on a weighted basis, the geological and chemical variability within the
defined resource.
13.2.1.1 ANZAPLAN COMPOSITES
A total of five different samples from the Norra Kärr deposit were sent to ANZAPLAN for beneficiation
testing. The samples will be composed of half or in some case quarter drill core with a diameter of
approximately 41 mm (BQ). Four of the samples weighed approximately 300 kg each (AZ NPGT, AZ
AZ CPGT, AZ SPGT, AZ GTM) and the fifth sample between 100 kg to 200 kg (AZ GTC). The
samples were chosen to represent different areas or domains within the deposit. Three of the samples
labelled AZ SPGT, AZ NPGT and AZ CPGT were composed of intermittently pegmatitic grennaite
(PGT domain) from different parts of the deposit. The sample AZ GTM was taken from the
“migmatitic” grennaite (GTM domain) which occurs around the central “Kaxtorpite”. A fifth sample
taken from the GTC domain.
The three pegmatitic samples were quite similar in mineralogy, chemistry and texture but represent
different spatial areas within the deposit. The sample AZ SPGT was taken from drill core in the
southern part of the intrusive south of the central Kaxtorpite. AZ CPGT was composed of drill core
from the area west and just north-west of the Kaxtorpite and sample AZ NPGT from pegmatitic
material in the northern part of the present resource.
A further composite was prepared by combining equal parts of AZ NPGT, AZ CPGT, AZ SPGT and
AZ GTM which was subjected to the range of beneficiation tests (ANZCOMP).
Figure 13-1 shows the locations within the deposit where the samples were taken.

NI 43-101 - Technical report Norra Kärr REE - 0465-RPT-014 Rev 1
Page 120
Figure 13-1: ANZAPLAN composite locations
13.2.1.2 RESOURCE COMPOSITE
A metallurgical composite, referred to as RESCOMP, weighing 6.87 tonnes was prepared from drill
core. This composite was prepared to represent the resource as defined in the PEA. The composite,
on a mass weighted basis, represented the mineralogical, chemical and textural variability recorded
within the deposit. A total of 13 drill holes, measuring in excess of 1 300 m, were selected from
suitable locations based on the resource database. The location of the selected composite drill holes
are shown in Figure 13-2. The drill holes recovered material from the two main rock domains;
pegmatitic grennaite (PGT) and migmatic grennaite (GTM), which define the resource in an
approximate ratio of 3:1 with minor contributions from the surrounding domains.

NI 43-101 - Technical report Norra Kärr REE - 0465-RPT-014 Rev 1
Page 121
Figure 13-2: Norra Kärr Surface Resource Map with Borehole Locations

NI 43-101 - Technical report Norra Kärr REE - 0465-RPT-014 Rev 1
Page 122
Table 13-1: RESCOMP Modal Mineralogy
Mineral Mass [/%]
Albite 23.46
Aegirine 19.64
Orthoclase 16.35
Natrolite 12.79
Nepheline 11.35
Eudialyte 6.72
Catapleiite 2.74
Eckermannite-(Fe) 2.04
Muscovite 1.08
Other (defined) 3.83
The RESCOMP drill core was dispatched to Loesche (Loesche GmbH, Germany) for comminution to
the desired passing particle sizes (80 % passing, 60 µm, 80 µm, and 100 µm). Drill core was manually
blended at the approximate ratio of three parts PGT to one part GTM then crushed to 10 mm in a jaw
crusher before dry grinding in a vertical roller mill. A subset of the composite was submitted to both
WAI and JKTech for comminution testing.
A sample of the ANZCOMP 60 µm ground composite was submitted for mineralogical
characterization at GTK, employing mineral liberation analysis (MLA) technology. The MLA equipment
consists of the standard scanning electron microscopy (FEI Quanta 600) with an energy dispersive X-
ray analyser (EDAX Genesis with two detectors) and the accompanying software package developed
originally by JKTech (Australia). Modal mineralogy was estimated using the XMOD-STD method and
is presented in Table 13-1. The mineralogical composition of the sample is dominated by albite,
aegirine, orthoclase, natrolite and nepheline. The REE are almost exclusively hosted in eudialyte
which represents 6.72 % of the sample mass. Another potentially economic mineral present is
catapleiite which is a zirconium rich silicate.
13.2.1.3 ANALYTICAL METHOD
All of the geochemical data presented within this report, unless otherwise noted, was analysed by
ALS Minerals ultra-trace level method ME-MS81. In this procedure 0.2 g of sample was decomposed
with 0.9 g lithium metaborate flux in an oven at 1 000 °C. The fused sample was then dissolved in
100 mL solution of 4 % HNO₃ and 2 % HCl and analysed by ICP-MS. With respect to whole-rock
major element analyses, these were also undertaken by ALS Minerals using method ME-MS81d,
which includes the above methods, complemented by Al₂O₃, BaO, CaO, Cr₂O₃, Fe₂O₃, MgO, MnO,
P₂O₅, K₂O, SiO₂, Na₂O, SrO, and TiO₂ by ICP-AES.

NI 43-101 - Technical report Norra Kärr REE - 0465-RPT-014 Rev 1
Page 123
13.2.1.4 SAMPLE REPRESENTATIVITY
The composites prepared from primary material derived from the Norra Kärr deposit (ANZCOMP and
RESCOMP) are considered to be representative of the underlying mineralogy and geochemistry of
the deposit. Additionally, intermediate concentrates prepared during the execution of the testwork
programmes are deemed satisfactory for the preliminary definition of the downstream extraction and
treatment processes.
13.2.2 COMMINUTION
WAI conducted the comminution tests using standard Bond procedure and apparatus and reported
the results in January 2013. Bond Crushing, Rod and Ball Mill Work Indexes were estimated on
composite material from material considered representative of the deposit (derived from the
RESCOMP composite). Comminution test results are shown in Table 13-2 to Table 13-4.
Table 13-2: Crushing Work Index
Variable Value Unit
Specific Gravity 2.65 t/t [g/cm³]
Work Index 12.64 kW h/t
Table 13-3: Bond Mill Work Index
Variable Value Unit
Rod Mill WI [1 180 µm] 14.90 kW h/t
Ball Mill WI [150 µm] 12.85 kW h/t
Ball Mill WI [106 µm] 14.30 kW h/t
Ball Mill WI [90 µm] 15.21 kW h/t
Table 13-4: Abrasion Index
Variable Value Units
Abrasion Index 0.3050 -
Wet Rod Mills Rod media 1.235×10⁻⁴ t/(kW h)
Steel liners 1.095×10⁻⁵ t/(kW h)
Wet Ball Mills Ball media 1.055×10⁻⁴ t/(kW h)
Steel liners 8.135×10⁻⁶ t/(kW h)
Dry Ball Mills Ball media 1.253×10⁻⁵ t/(kW h)
Steel liners 1.253×10⁻⁶ t/(kW h)
Crushers Liners 2.165×10⁻⁵ t/(kW h)

NI 43-101 - Technical report Norra Kärr REE - 0465-RPT-014 Rev 1
Page 124
Additionally, a sample from the same composite with submitted to JKTech (JKTech, Australia) and
subjected to the SMC Test procedure. The results from the SMC Test indicate the Norra Kärr material
is moderately hard when compared with the JKTech database. The JKTech result is consistent with
those generated from the conventional Bond series of tests.
13.2.3 BENEFICIATION
ANZAPLAN conducted mineralogical characterisation and testing on domain specific composites from
several discrete regions of the deposit on the potentially economic rock domains described
previously, PGT, GTM and GTC. The NPGT, CPGT and SPGT are spatially distinct domains of the
PGT rock type whereas the GTM and GTC domains are morphologically distinct from each other and
the PGT domain. A sample from each domain was crushed and ground before being subjected to
quantitative mineralogical characterisation employing the MLA technology. The mineralogical
characterisation determined that the constituent mineralogy was indistinct between the domains and
displayed only minor variability in their relative representation (modal mineralogy) (see Figure 13-3).
The minor variation in the modal mineralogy translated into similarly minor differences in
geochemistry. Further to the modal mineralogical measurements liberation studies were conducted on
some of the key minerals which indicated liberations was satisfactory in the particle size fraction of
+20 µm to -100 µm (see Figure 13-4, Figure 13-5 and Figure 13-6). A more detailed interrogation of
the data indicated particle liberation was largely achieved between 60 µm to 80 µm.
Figure 13-3: ANZAPLAN Modal Mineralogy

NI 43-101 - Technical report Norra Kärr REE - 0465-RPT-014 Rev 1
Page 125
Figure 13-4: Comparison of mineral liberation for samples GTM, PGT, SPGT, CPGT, NPGT and GTC in fraction 0.1 mm to 0.5 mm
Figure 13-5: Comparison of mineral liberation for samples GTM, PGT, SPGT, CPGT, NPGT and GTC in fraction 0.02 mm to 0.1 mm

NI 43-101 - Technical report Norra Kärr REE - 0465-RPT-014 Rev 1
Page 126
Figure 13-6: Comparison of mineral liberation for samples GTM, PGT, SPGT, CPGT, NPGT and GTC in fraction <0 02 mm
Based on the mineralogical characterisation it was mutually decided that a resource composite would
be prepared from each of the potentially economic contributing domains (NPGT, CPGT, SPGT and
GTM) on an equal mass basis which would then be subjected to further beneficiation characterisation
testwork.
ANZAPLAN investigated several beneficiation methodologies to upgrade the eudialyte including
negative flotation of aegirine, magnetic separation, electrostatic separation and gravity separation.
The principal outcome of the work identified that magnetic separation alone was sufficient to
beneficiate eudialyte and reject much of the acid consuming gangue. A mineral concentrate
(ANZCON) was subsequently generated by ANZAPLAN, employing magnetic separation, specifically
for use in the development of the hydrometallurgical processes. The exact methodology employed in
the preparation of this concentrate deviates from current practice resulting in a concentrate which
contained a significant amount of misdeported acid soluble gangue minerals and a characteristically
fine particle size. The concentrate was however deemed suitable to begin the leach characterisation
testing programme.
At the conclusion of the investigative testing campaign conducted by ANZAPLAN a focussed
campaign of testing was initiated with three major original equipment manufacturers (OEM) to conduct
machine specific magnetic beneficiation testing with the aim of maximising the recovery of eudialyte
whilst rejecting acid consuming gangue. Ground composites were prepared by Loesche at particle
sizes within the expected liberation range of 60 µm, 80 µm, and 100 µm. Testing was conducted by

NI 43-101 - Technical report Norra Kärr REE - 0465-RPT-014 Rev 1
Page 127
each of the OEM in-house technical staff in line with their standard operating procedures. This phase
of testing clearly identified the Metso high grade material separation (HGMS) as the superior
technology to recover eudialyte from Norra Kärr material with respect to gangue rejection and REE
recovery (see Figure 13-7 and Figure 13-8 respectively) using a single stage magnetic separation.
Figure 13-7: Aluminium Grade and Recovery Versus Magnetic Mass Fraction

NI 43-101 - Technical report Norra Kärr REE - 0465-RPT-014 Rev 1
Page 128
Figure 13-8: Yttrium Grade and Recovery Versus Magnetic Mass Fraction
Additional testing was conducted by GTK, under the supervision of Metso, with GTK’s in-house Metso
HGMS machine as part of a repeatability and reproducibility testing campaign. The work conducted by
GTK confirmed the results produced by Metso and further confirmed the repeatability of the testing
apparatus when separating these weakly magnetic minerals.
In order to supply additional mineral concentrate to hydrometallurgical testwork laboratories GTK were
commissioned to conduct several batch-continuous magnetic separation campaigns to generate
representative concentrate. The full-scale Metso HGMS has near continuous flexibility when it comes
to setting and varying the machines operating parameters including magnetic field intensity, linear
flow velocity and matrix load density. However, in the laboratory machine the linear flow velocity can
only be set to discrete values limiting the ability to test the optimal set of conditions. The batch-
continuous test campaign successfully generated approximately 30 kg of magnetic mineral
concentrate, confirmed the batch testing results attained by both Metso and GTK (see Table 13-5) as
well as further validating the predictive capability of the mathematical model describing the separation
process. Additional analyses of the products identified where recoverable losses were occurring (see
Table 13-6). It is apparent that the most significant size fraction reporting losses is in the -20 µm

NI 43-101 - Technical report Norra Kärr REE - 0465-RPT-014 Rev 1
Page 129
fraction. Therefore minimising the production of fine material has become the future objective of the
comminution circuit optimisation.
Table 13-5: Selected Results for Batch
Yttrium Yttrium recovery Magnetic mass recovery
Sample ID Head grade Measured Predicted Measured Predicted
11 1 694 84.7 % 85.4 % 34.2 % 34.5 %
12 1 691 84.3 % 85.3 % 33.8 % 34.5 %
13 1 673 84.6 % 84.8 % 33.7 % 34.3 %
14 1 647 84.7 % 84.1 % 34.7 % 34.0 %
15 1 663 83.6 % 84.6 % 33.8 % 34.2 %
Mean 1 674 84.4 % 84.9 % 34.0 % 34.3 %
Table 13-6: Batch 1 Size-By-Size Yttrium Recovery
Sample Particle size fraction
+36 µm +20-36 µm -20 µm
11 95.6 % 92.5 % 59.2 %
12 95.4 % 93.8 % 59.0 %
13 95.4 % 94.1 % 59.8 %
14 94.9 % 92.8 % 57.6 %
15 94.7 % 93.7 % 54.6 %
Mean 95.2 % 93.4 % 58.1 %
13.2.4 HYDROMETALLURGY
ANSTO Minerals (ANSTO Minerals, Australia) were engaged to undertake process testwork to define
both the mineral dissolution and solvent extraction process to produce a bulk REE concentrate.
ANSTO have proceeded to define the extractive metallurgical process from magnetic concentrate to
bulk REE concentrate. The first phase of this definition work was conducted with the ANZCON
mineral concentrate generated by ANZAPLAN. As noted this mineral concentrate had a large mass
contribution of acid soluble gangue and a smaller particle size relative to the current concentrate
preparation. However it is deemed suitable to begin the process of defining suitable leach operating
conditions.
The testwork programme implemented by ANSTO was a systematic appraisal of mineral solubility,
silica solubility and silica stability as well as monitoring the concentration of deleterious elements in
preparation of a pregnant leach solution (PLS) to be used for the recovery of REE. This appraisal
process explored the solution acidity, leach temperature, and pulp density.

NI 43-101 - Technical report Norra Kärr REE - 0465-RPT-014 Rev 1
Page 130
All analytical chemical analyses were conducted by ANSTO for the leach and solvent extraction
programmes. The techniques included analysis by X-ray fluorescence (XRF), fusion/digest followed
by ICP (-OES and -MS), delayed neutron and neutron activation analysis (DNA and NAA,
respectively) all within their facilities in Sydney.
Diagnostic leach tests were conducted to determine the minimum acid activity required to dissolve
eudialyte. It was determined that a relatively mild acidic environment, around pH 1, was required to
dissolve the eudialyte whilst leaving intact the majority of the accompanying minerals. Additionally,
tests were conducted at various temperatures to determine the impact on leaching kinetics and pulp
handleability. The results of which indicated that a leach temperature of 30 °C is sufficient to maintain
satisfactory leach kinetics and pulp condition. Follow-up tests further examined the mineral solubilities
at constant acidities, around the determined range, at various pulp densities to determine the
operating limits for silica in solution. When operating at higher pulp densities a threshold limit was
exceeded whereby the silica would precipitate from solution causing the pulp to gel. The threshold
limit of silica in solution was quantified resulting in an optimal pulp density being determined as
approximately 14 % solids on a weight basis. A sub-set of the leaching results are shown in Figure
13-9 and Figure 13-10 which show the leach acid consumption at various pH values and initial pulp
densities. It is also evident that a majority of the acid consumption occurs in the first two hours of the
leaching process. This correlates strongly with the leach extraction of REE into solution where
extraction efficiencies were routinely in excess of 90 %.
Further leaching with concentrate produced by GTK using an optimised beneficiation method focused
on the rejection of gangue resulting in the acid consumption decreasing to approximately 250 kg/t (per
tonne concentrate). Although the concentrate was prepared from the improved method further
mineralogical analyses indicate further improvements in gangue deportment are possible with
improvements in the particle size control, in particular the removal of particles greater than 100 µm as
these contribute the majority of gangue minerals. This work will form part of ongoing process
optimisation testing being planned and conducted by Tasman.

NI 43-101 - Technical report Norra Kärr REE - 0465-RPT-014 Rev 1
Page 131
Figure 13-9 Acid consumption
Figure 13-10 Acid consumption
The PLS generated by the sulfuric acid dissolution of the mineral concentrate has a characteristically
high silica concentration which is unacceptable for metal recovery by solvent extraction. To remove
the silica the pH is increased from the leach condition to a value in excess of pH 3 to destabilise the
silica causing it to precipitate. This neutralisation can be conducted by the addition of calcium
hydroxide or magnesium oxide. Limited testing has been conducted in this area to ensure ease of

NI 43-101 - Technical report Norra Kärr REE - 0465-RPT-014 Rev 1
Page 132
handling of the residue from the leaching and neutralisation however observations indicated its
feasibility. The neutralisation residue, comprised largely of silica and minor contributions of zirconium
and aluminium, is then separated from the PLS and washed to recover the entrained solution. The
testing to date has reproducibly demonstrated that the neutralisation process is capable of producing
a clarified liquor suitable for solvent extraction. Further definition work is planned with ANSTO for the
continuous demonstration of the leaching and neutralisation circuits to confirm the handleability and
water balance for the circuit. This will involve the further examination of the costs and benefits of using
lime, magnesia or the possibility of employing dolomite as the neutralisation agent.
The principal method tested to recover the rare earth elements from the PLS was by means of solvent
extraction. ANSTO Minerals conducted the preliminary definition work using a mix of pregnant leach
solutions generated as part of the leaching and neutralisation definition programmes. This feed stock
was deemed satisfactory for determination of operating conditions and equilibrium and initial
engineering of the solvent extraction plant. The programme sought to undertake studies to determine
the kinetic and equilibrium phenomenon prevalent in the system. Phase disengagement studies
determined that an elevated operating temperature was required to ensure satisfactory phase
disengagement behaviour within the system. Kinetic loading studies were also conducted which
determined the rate in which equilibrium was attainment was faster than the phase separation kinetics
therefore the system design will be dependent upon phase separation kinetics.
Equilibrium loading isotherms were generation by ANSTO utilising a primary amine solvent in order to
determine its loading capacity and the likely number of equilibrium stages required to extract the
REE’s from the aqueous PLS into the organic solvent. The solvent preferentially loaded the light
REE’s relative to the heavy REE’s where yttrium had the lowest affinity (see Figure 13-11 and Figure
13-12). The equilibrium loading work was successful in enabling the determination of the organic to
aqueous ratio as well as the number of stages to effect an acceptable level of extraction.

NI 43-101 - Technical report Norra Kärr REE - 0465-RPT-014 Rev 1
Page 133
Figure 13-11 Cerium equilibrium loading isotherm
Figure 13-12 Yttrium equilibrium loading isotherm
Finally, the REEs were stripped from the loaded solvent with various concentrated strong acid
solutions however the REEs were very strongly complexed with the solvent and resulted in excessive
acid requirements in order to achieve satisfactory stripping efficiency. An alternative reactive stripping
process was then assessed whereby oxalic acid was contacted with the loaded organic causing the
formation of a rare earth oxalate precipitate at the interface of the two phases. The resulting
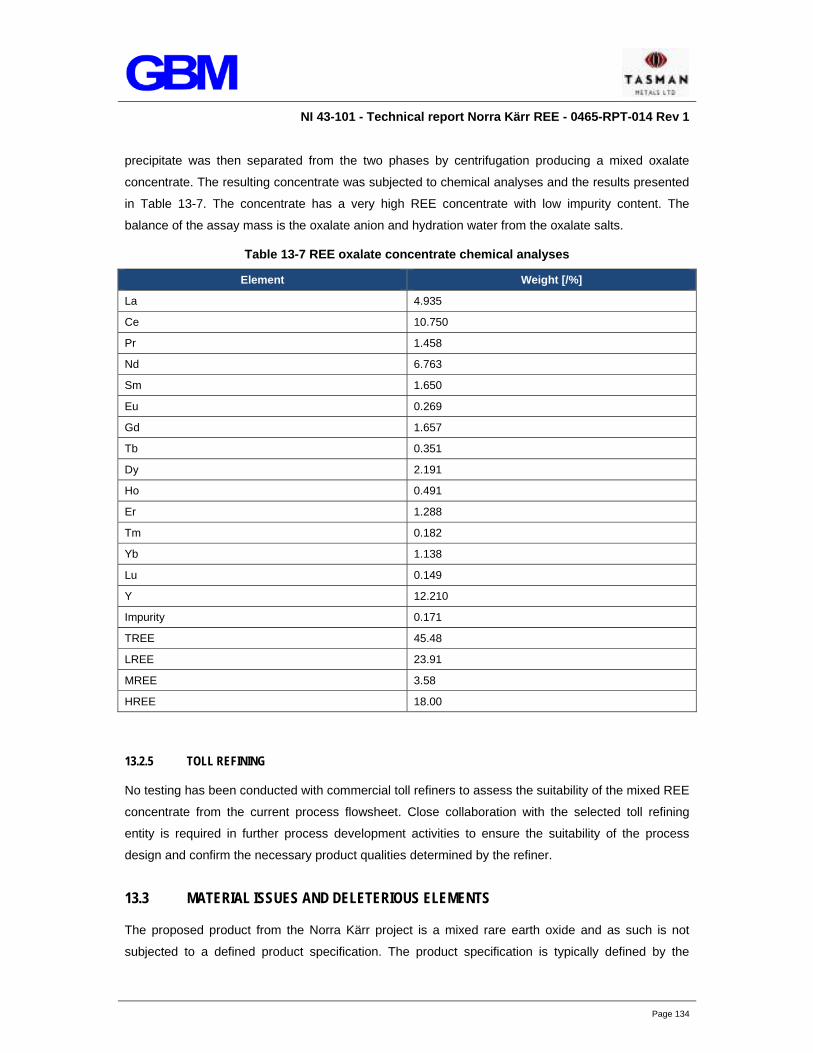
NI 43-101 - Technical report Norra Kärr REE - 0465-RPT-014 Rev 1
Page 134
precipitate was then separated from the two phases by centrifugation producing a mixed oxalate
concentrate. The resulting concentrate was subjected to chemical analyses and the results presented
in Table 13-7. The concentrate has a very high REE concentrate with low impurity content. The
balance of the assay mass is the oxalate anion and hydration water from the oxalate salts.
Table 13-7 REE oxalate concentrate chemical analyses
Element Weight [/%]
La 4.935
Ce 10.750
Pr 1.458
Nd 6.763
Sm 1.650
Eu 0.269
Gd 1.657
Tb 0.351
Dy 2.191
Ho 0.491
Er 1.288
Tm 0.182
Yb 1.138
Lu 0.149
Y 12.210
Impurity 0.171
TREE 45.48
LREE 23.91
MREE 3.58
HREE 18.00
13.2.5 TOLL REFINING
No testing has been conducted with commercial toll refiners to assess the suitability of the mixed REE
concentrate from the current process flowsheet. Close collaboration with the selected toll refining
entity is required in further process development activities to ensure the suitability of the process
design and confirm the necessary product qualities determined by the refiner.
13.3 MATERIAL ISSUES AND DELETERIOUS ELEMENTS
The proposed product from the Norra Kärr project is a mixed rare earth oxide and as such is not
subjected to a defined product specification. The product specification is typically defined by the

NI 43-101 - Technical report Norra Kärr REE - 0465-RPT-014 Rev 1
Page 135
refinery tasked with the separation of the intermediate mixed oxide product from Norra Kärr into the
individual metal oxides. Tasman are actively engaged in discussions with several potential refining
partners with the aim of establishing a commercial and technical arrangement whereby a product
specification will form the basis of any such agreement. Until such time that a specification becomes
available general comments regarding the likely deleterious elements is deemed sufficient.
Although the Norra Kärr deposit is characteristically low in both uranium and thorium a full
radionuclide deportment study on optimised concentrate has not been undertaken. As part of future
testwork campaigns a radionuclide deportment study should form part of the programme in order to
define where the parent and daughter nuclides deport to within the process to ensure there are no
extraordinary control measures required. Additionally, particular attention is required to assess the
deportment of lead within the process as this is likely to be the subject of environmental controls.
13.4 SUMMARY
Comminution with conventional crushing and grinding techniques will be suitable for the process.
Further testing on domain specific material should be undertaken to determine the variability, if any, of
the resource as defined by this PFS. Extensive analysis and modelling of the magnetic beneficiation
process has indicated the importance of minimising the production of fine material less than 20 µm as
recovery performance deteriorates significantly. Equally important is the reduction of particles larger
than 100 µm as these particles carry much of the acid consuming gangue into the mineral
concentrate. It is therefore recommended that a wet screening process be employed in the grinding
circuit to minimise over grinding and eliminate large particles.
Continuous piloting of the hydrometallurgical processes (leach, neutralisation, solvent extraction and
precipitation) are required to fully determine the product quality, deportment of radionuclides and
improve the accuracy of the utility demand and reagent consumptions. The implementation of the
continuous testing will also provide an opportunity to optimise the process with respect to the items
above. The focus of future testing should address handleability of pulp, liquors and residues as well
as the potential substitution of various reagents to the process economics.
Finally, to date no integrated testing has been performed on the raffinate management system. This
system requires further testing and engineering for inclusion into any future feasibility study to confirm
its feasibility as well as accurately estimate utility and reagent costs.

NI 43-101 - Technical report Norra Kärr REE - 0465-RPT-014 Rev 1
Page 136
SECTION 14 MINERAL RESOURCE ESTIMATES
14.1 CURRENT ESTIMATE WAI (2014)
This section describes the Mineral Resource estimation methodology used by WAI for the Mineral
Resource estimate of the Norra Kärr deposit. The effective date of the Mineral Resource estimate is
30 June 2014.
WAI were commissioned to produce a Mineral Resource estimate for the Nora Kärr project. The
Mineral Resource estimate for the Norra Kärr project has been carried out following the guidelines of
the CIM Code. The Mineral Resource estimation was completed using a 3D block modelling approach
utilising CAE Mining Studio 3® software.
14.2 TOPOGRAPHY
A high resolution LIDAR topographic survey was provided to WAI in AutoCAD dwg format. WAI has
trimmed the topographic data to cover only the area of interest so as to make the topographic data file
easier to manage. The Norra Kärr project is a greenfield site and as such there are no operating pits
in the area and the topography is valid as of 30 June 2014. Figure 14-1 shows the topographic
contours for the project area as well as the distribution of exploration drill holes.
Figure 14-1: Drill Hole Layout and Topographic Plan (WAI, 2014)

NI 43-101 - Technical report Norra Kärr REE - 0465-RPT-014 Rev 1
Page 137
14.3 DATABASE COMPILATION
WAI was supplied with a geological database (Tasman_WAI.mdb) in Microsoft Access® format with
an effective date of 6 May 2014. The database comprises:
Diamond drill hole collar surveys in both RT90 and SWEREF99TM co-ordinate systems;
Downhole surveys;
Assays;
Geological log;
RQD results;
Drill hole recoveries;
Density testwork results by drill hole interval and lithology; and
QA/QC results.
A summary of the sample data provided in the database and subsequently used in the Mineral
Resource estimate is shown below in Table 14-1.
Table 14-1: Sample Data Summary
Sample Type No. Holes No. of Samples Total Length (m)
Diamond Drill Holes 119 9 986 20 420.33
Drilling to date extends over a strike length of approximately 1 280 m with drill hole section lines
orientated east-west on typically 50 m spacing. The distribution of drill holes along the section lines is
typically 80 m with drill holes drilled inclined to the east (with the exception of five drill holes;
NQ12019, NQ12015, NKA12083, NKA12082, and NKA074-GT1) with an average inclination of 48°.
A plan showing the spatial distribution of the diamond drill holes is shown in Figure 14-1, a long
section of the drill hole distribution looking towards the west is provided in Figure 14-2.

NI 43-101 - Technical report Norra Kärr REE - 0465-RPT-014 Rev 1
Page 138
Figure 14-2: Long Section of Norra Kärr Drill Holes, Easting Line 474398.65
14.4 GEOLOGICAL INTERPRETATION-WIREFRAME MODELLING
Wireframes to represent the Norra Kärr alkaline igneous intrusive body and associated REE
mineralisation was constructed by WAI based on the geological logging carried out by Tasman. WAI
was provided with geological cross sections and plans by Tasman showing the interpreted structure
based on the detailed lithology logs, geochemical assay results and the foliation measurements.
In total WAI has defined six key lithologies for wireframing and subsequent modelling, these being:
LTYPE 1 (KAX) – Kaxtorpite (Microcline-Pectolite-Amphibole-Aegirine-Nepheline Syenite);
LTYPE 2 (GTM) – Migmatitic Grennaite (Recrystallised to in part migmatitic);
LTYPE 3 (PGT/GT) – Grennaite with pegmatitic zones and Grennaite (fine-grained aegirine
rich nepheline syenite);
LTYPE 4 (GTC) – Grennaite (Catapleiite porphyritic – low grade TREO);
LTYPE 5 (ELAK) – Lakarpite with eudialyte; and
LTYPE 6 (MAF) – Mafic dyke material.
The lithology units LTYPES 2 to 4 do not reflect distinct individual units but observe more diffuse
boundaries. Where there is uncertainty in the recording of a lithological unit Tasman has reviewed
the geochemical assay results to ascertain where the transition occurs.
Within the geological database provided to WAI there are sub-divisions of the six main lithology
groups. Due to the diffuse nature of LTYPES 2 to 4 and the complexity of the geology it was decided

NI 43-101 - Technical report Norra Kärr REE - 0465-RPT-014 Rev 1
Page 139
by Tasman and WAI that the level of detail in the six lithology divisions was sufficient for a Mineral
Resource model, and that there is little benefit in modelling in greater detail.
As well as the six main lithologies Tasman has also logged additional units at the periphery of the
mineralisation which are not of economic interest, these units comprising:
Pulaskite (Microcline-Albite-Amphibole Nepheline Syenite);
Pulaskite (with Grennaite zones/bands);
Alkaline rock (Unspecified); and
Granitoide (fenitisied).
These additional lithological units are not of economic interest and as such for the purpose of the
Mineral Resource estimate have not been modelled.
Upon completion of a preliminary set of mineralisation wireframes, WAI submitted the wireframes to
Tasman geologists for review. Following the review WAI and Tasman geologists worked through the
wireframes and geological sections adjusting the wireframes where necessary to ensure they
honoured the geology. Figure 14-3 shows the Tasman interpreted geological cross section along
northing line 6440409.46 showing the various lithology units. A corresponding geological section from
the WAI mineralisation wireframes is shown in Figure 14-4.

NI 43-101 - Technical report Norra Kärr REE - 0465-RPT-014 Rev 1
Page 140
Figure 14-3: Tasman Geological Interpretation Cross Section – Northing 6440409.46

NI 43-101 - Technical report Norra Kärr REE - 0465-RPT-014 Rev 1
Page 141
Figure 14-4: WAI Mineralised Wireframe Cross Section – Northing 6440409.46 (SWEREF99TM)
The geological database provided to WAI includes a record of the depth of overburden. WAI has
created a digital terrain model surface of the base of overburden and used this to constrain
mineralisation. A long section of the WAI mineralisation wireframes is shown in Figure 14-5.

NI 43-101 - Technical report Norra Kärr REE - 0465-RPT-014 Rev 1
Page 142
Figure 14-5: WAI Mineralisation Wireframes Longsection – Looking West
14.5 SAMPLE DATA PROCESSING
14.5.1 SAMPLE SELECTION
The geological wireframes were used to select the drill hole sample data. The selected sample data
was coded according to lithology to correspond with the wireframe envelope LTYPE codes (see
Section 14.4). A summary of the selected sample data by LTYPE is shown in Table 14-2.
Table 14-2: Selected Sample Summary by LTYPE
LTYPE No. of holes No. of samples Total length (m)
1 22 461 803.59
2 42 1340 2 422.53
3 85 4895 8 498.79
4 95 2134 3 808.425
5 42 266 414.74
6 4 31 40.35

NI 43-101 - Technical report Norra Kärr REE - 0465-RPT-014 Rev 1
Page 143
WAI has undertaken a graphical review of the sample data for all elements including the 11 main
payable elements:
Dy;
Y;
Eu;
La;
Nd;
Ce;
Gd;
Tb;
Pr;
Sm; and
Lu.
The graphical review was to ascertain the grade populations of each lithology and ascertain the need
for additional domaining and the potential for top-cutting of the sample dataset. Figure 14-6 and
Figure 14-7 show the variogram grade distributions for Dy and Y in LTYPES 2 to 5. Overall LTYPES
2, 3, and 4 show normal distributions with some positive skew suggesting that additional domaining is
not required but there may be a requirement for top-cutting to prevent high grade outlier bias.
LTYPES 5 and 6 show more log normal grade distributions with possible sub populations
necessitating domaining. However, in the case of LTYPE 5 the variable grade population is reflective
of the different lenses of ELAK material through the deposit. During the course of the estimation
works these ELAK zones are treated separately of each other effectively sub-domaining the LTYPE 5
(ELAK) material. The very low number of samples in LTYPE 6 (MAF) means that it is impossible to
discern sub-populations, and as such no additional domaining of this material has been carried out.
LTYPE 1 displays a log normal trend for the sample data with a slight negative skew. In reviewing the
data WAI determined that no additional domaining was required.

NI 43-101 - Technical report Norra Kärr REE - 0465-RPT-014 Rev 1
Page 144
Figure 14-6: Dy Histogram Plots for LTYPES 2 to 5

NI 43-101 - Technical report Norra Kärr REE - 0465-RPT-014 Rev 1
Page 145
Figure 14-7: Y Histogram Plots for LTYPES 2 to 5
14.5.2 TOP CUTTING
The presence of high grade outliers in a sample dataset can exert a bias on a grade estimation
leading to overestimation of grades in the block model. To help ascertain the presence of high grade
outliers in the selected Norra Kärr sample database WAI undertook a decile analysis and compared
the results to the grade distribution plots as shown in Figure 14-6 and Figure 14-7. An example table
of results for a decile analysis is shown in Table 14-3.

NI 43-101 - Technical report Norra Kärr REE - 0465-RPT-014 Rev 1
Page 146
Table 14-3: Decile Analysis – Sm LTYPE 4
Quantile % FROM
Quantile %
TO No of
Samples MEAN (ppm)
MIN (ppm)
MAX (ppm) METAL METAL%
0 10 213 14.31 1.66 26.4 3 048.82 2.26
10 20 213 36.76 26.6 46.4 7 830.5 5.79
20 30 214 51.12 46.4 55.2 10 938.8 8.09
30 40 213 58.41 55.2 61.4 12 441 9.21
40 50 214 63.85 61.4 65.8 13 664 10.11
50 60 213 68.40 65.8 70.7 14 568.3 10.78
60 70 213 72.75 70.7 74.7 15 495.6 11.47
70 80 214 76.78 74.7 79.1 16 430 12.16
80 90 213 82.48 79.2 86.6 17 567.5 13.00
90 100 214 108.26 86.8 335 23 168.1 17.14
90 91 21 87.45 86.8 88.1 1 836.5 1.36
91 92 21 88.48 88.1 89 1 858.1 1.37
92 93 22 89.79 89.1 90.4 1 975.3 1.46
93 94 21 91.11 90.4 91.8 1 913.3 1.42
94 95 22 92.89 91.9 94.2 2 043.6 1.51
95 96 21 95.59 94.4 97.7 2 007.4 1.49
96 97 21 100.19 97.8 104 2 103.9 1.56
97 98 22 110.43 104.5 117 2 429.5 1.80
98 99 21 128.38 119 142 2 696 1.99
99 100 22 195.66 142 335 4 304.5 3.18
0 100 2 134 63.33 1.66 335 135 152.6 100
In reviewing the decile analysis WAI assess whether there is a jump in the proportion of contained
metal in the top 1 % (Quantile 99 % - 100 %) of the sample data, such jumps in the grade distribution
are also often visible in the grade distribution histograms and probability plots. Such inflections signify
possible high grade outliers that may bias the grade estimation.
In general there are very few outlier grades that may present an issue during the variography or grade
estimation stages, those that presented a problem have been top-cut and a summary of these is
shown in Table 14-4.

NI 43-101 - Technical report Norra Kärr REE - 0465-RPT-014 Rev 1
Page 147
Table 14-4: Norra Kärr Top-Cut Summary
LTYPE Element Top-Cut (ppm)
4 Eu 27.5
2 Gd 288.0
3 Gd 472.0
4 Gd 282.0
4 Ho 112.0
5 Lu 66.4
4 Sm 222.0
3 Sm 481.0
4 Tb 63.1
5 Tm 67.3
4 Yb 341.0
5 Yb 495.0
Any absent assay values within the sample database have been assigned grades of half the
analytical detection limit.
14.5.3 COMPOSITING
To ensure all samples in the variography and grade estimation stages have equal support the sample
data was composited. The sample dataset was reviewed for sample length to ascertain the optimum
sample composite interval. An average composite length of 2 m was applied to sample data for all
lithologies (LTYPE) corresponding with the median sample length. Figure 14-8 shows the sample
length distribution.

NI 43-101 - Technical report Norra Kärr REE - 0465-RPT-014 Rev 1
Page 148
Figure 14-8: Average Sample Length Histogram
14.6 VARIOGRAPHY
14.6.1 INTRODUCTION
Variography was undertaken:
To determine the presence of any anisotropy in the deposit;
To derive the spatial continuity of mineralisation along the principal main anisotropic
orientations;
To produce suitable variogram model parameters for use in geostatistical grade interpolation;
and
To assist in selection of suitable search parameters upon which to base the resource
estimation.
Variographic analysis was performed using Supervisor v8.2 software. Semi-variogram analysis was
attempted for each variable in each domain.

NI 43-101 - Technical report Norra Kärr REE - 0465-RPT-014 Rev 1
Page 149
14.6.2 ANALYSIS
Semi-variogram analysis was attempted for 20 components in each of the six mineralised domains
using the 2 m composited samples contained within the mineralised domain wireframes.
The methodology for producing experimental variograms and variogram models was as follows:
Experimental variograms with small lag distances were generated downhole to aid in
estimation of nugget effect. Nugget effect is the variance between sample pairs at the same
direction containing components of inherent variability, sampling error and analytical error;
Omni-directional variograms were generated to assist with determining optimal lag distances;
Variogram maps were generated in 18 directions in the horizontal plane, across strike and in
the dip plane at each stage selecting the direction of greatest continuity; and
Experimental variograms were generated and variogram models fitted using the spherical
scheme for three orthogonal directions defining the principal directions of anisotropy; the
major, semi-major and minor axis.
14.6.3 VARIOGRAM INTERPRETATION
During this process it was found that the Kaxtorpite (LTYPE 1) and Lakarpite (LTYPE 5) did not
contain enough sample pairs to calculate robust directional experimental variograms and so for these
zones only omni-directional variogram models were fitted. For the mafic dykes (LTYPE 6) not enough
sample pairs were present for any meaningful experimental variograms to be interpreted. For all
other zones; Grennaite (LTYPE 2), Grennaite with pegamtitic zones (LTYPE 3) and porphyritic
Grennaite (LTYPE 4) enough sample pairs were present to generate robust directional experimental
variograms for which models were fitted. It was found that as a result of the good positive correlation
between most components that experimental variograms were quite similar for a lot of the individual
components. Regardless of this individual variogram models were completed for each component in
each zone.
An example of the process is shown for Dy in the porphyritic Grennaite (LTYPE 4) in Figure 14-9,
which shows the initial continuity map analysis for the horizontal plane and the down dip plane. On
these continuity maps, the lower the value, the greater the continuity with values >1 indicating no
continuity. Variogram maps were constructed measuring continuity in 18 directions for the horizontal
plane, across strike and down dip planes. At each stage lag distances were varied and experimental
variograms were assessed in each direction to determine the directions of greatest continuity.
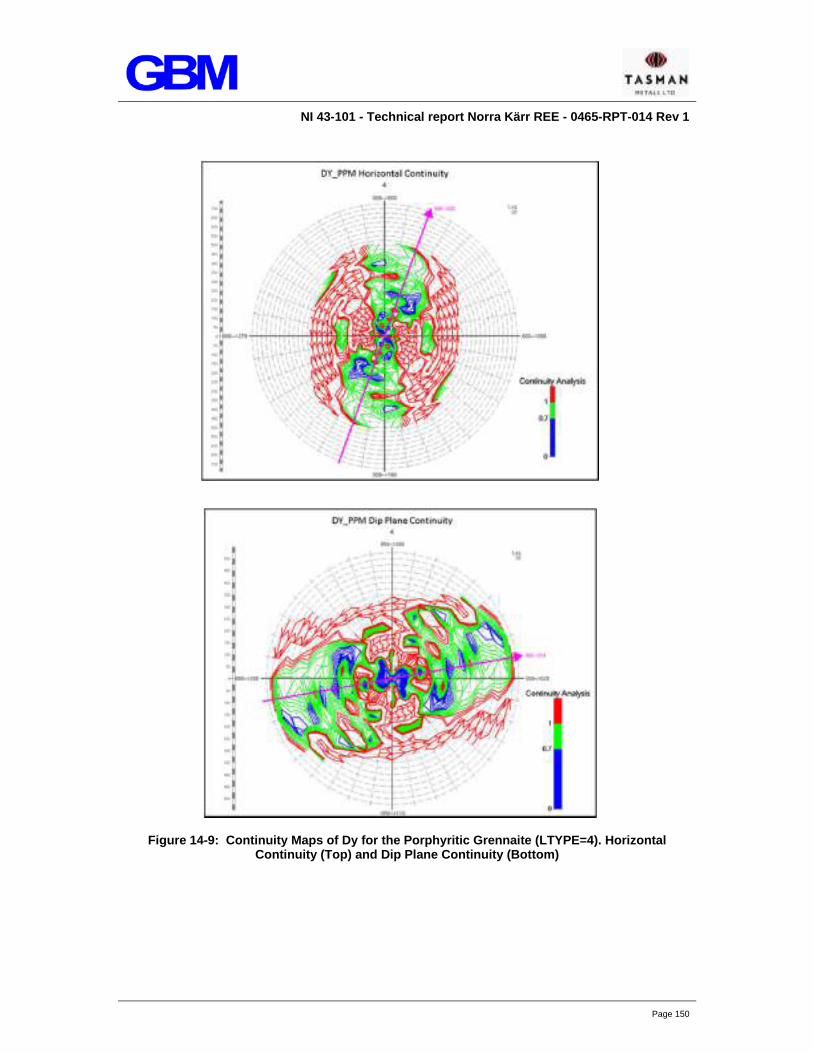
NI 43-101 - Technical report Norra Kärr REE - 0465-RPT-014 Rev 1
Page 150
Figure 14-9: Continuity Maps of Dy for the Porphyritic Grennaite (LTYPE=4). Horizontal Continuity (Top) and Dip Plane Continuity (Bottom)
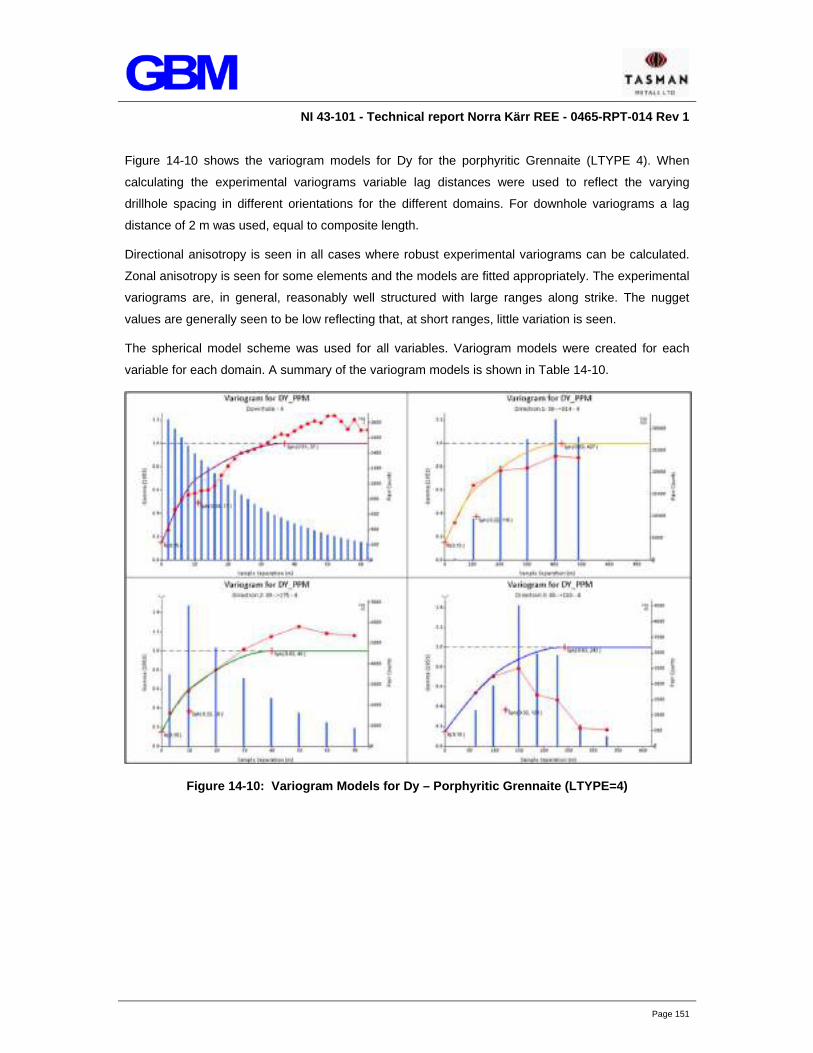
NI 43-101 - Technical report Norra Kärr REE - 0465-RPT-014 Rev 1
Page 151
Figure 14-10 shows the variogram models for Dy for the porphyritic Grennaite (LTYPE 4). When
calculating the experimental variograms variable lag distances were used to reflect the varying
drillhole spacing in different orientations for the different domains. For downhole variograms a lag
distance of 2 m was used, equal to composite length.
Directional anisotropy is seen in all cases where robust experimental variograms can be calculated.
Zonal anisotropy is seen for some elements and the models are fitted appropriately. The experimental
variograms are, in general, reasonably well structured with large ranges along strike. The nugget
values are generally seen to be low reflecting that, at short ranges, little variation is seen.
The spherical model scheme was used for all variables. Variogram models were created for each
variable for each domain. A summary of the variogram models is shown in Table 14-10.
Figure 14-10: Variogram Models for Dy – Porphyritic Grennaite (LTYPE=4)

NI 43-101 - Technical report Norra Kärr REE - 0465-RPT-014 Rev 1
Page 152
Table 14-5: Summary of Variogram Models
Domain Element Rotation Angles (Z,X,Z)
Nugget Range 1
Range 2
Range 3
C1§ Range 1
Range 2
Range 3
C2§ Range 1
Range 2
Range 3
C3§
1 DY Omni-directional 0.06 6 6 6 0.47 35 35 35 0.47 - - - -
1 Y Omni-directional 0.09 10 10 10 0.51 37 37 37 0.4 - - - -
1 EU Omni-directional 0.08 9 9 9 0.46 40 40 40 0.46 - - - -
1 LA Omni-directional 0.09 8 8 8 0.27 39 39 39 0.4 65 65 65 0.24
1 ND Omni-directional 0.07 8 8 8 0.33 35 35 35 0.6 - - - -
1 CE Omni-directional 0.09 9 9 9 0.31 37 37 37 0.39 90 90 90 0.21
1 ER Omni-directional 0.09 10 10 10 0.49 38 38 38 0.42 - - - -
1 GD Omni-directional 0.1 9 9 9 0.43 37 37 37 0.47 - - - -
1 HO Omni-directional 0.09 9 9 9 0.46 37 37 37 0.45 - - - -
1 LU Omni-directional 0.08 10 10 10 0.51 39 39 39 0.41 - - - -
1 PR Omni-directional 0.17 9 9 9 0.31 44 44 44 0.26 80 80 80 0.26
1 SM Omni-directional 0.08 9 9 9 0.43 38 38 38 0.49 - - - -
1 TB Omni-directional 0.08 9 9 9 0.48 40 40 40 0.44 - - - -
1 TM Omni-directional 0.08 10 10 10 0.48 44 44 44 0.37 - - - -
1 YB Omni-directional 0.09 10 10 10 0.52 40 40 40 0.39 - - - -
2 DY -70,60,10 0.11 73 105 8 0.21 221 135 65 0.37 240 172 9 999 0.31
2 Y -70,60,10 0.11 215 114 18 0.3 219 148 120 0.37 222 161 9 999 0.22
2 EU -70,60,10 0.07 76 119 22 0.24 229 120 100 0.39 234 120 9 999 0.3
2 LA -70,60,10 0.17 122 60 8 0.38 164 119 50 0.45 - - - -
2 ND -70,60,10 0.08 78 97 14 0.29 174 98 95 0.46 185 109 9 999 0.17
2 CE -70,60,10 0.11 192 44 13 0.4 200 100 100 0.49 - - - -

NI 43-101 - Technical report Norra Kärr REE - 0465-RPT-014 Rev 1
Page 153
Domain Element Rotation Angles (Z,X,Z)
Nugget Range 1
Range 2
Range 3
C1§ Range 1
Range 2
Range 3
C2§ Range 1
Range 2
Range 3
C3§
2 ER -70,60,10 0.11 74 99 10 0.29 153 104 50 0.38 200 120 9 999 0.22
2 GD -70,60,10 0.06 165 63 17 0.38 173 110 100 0.3 179 111 9 999 0.26
2 HO -70,60,10 0.13 115 112 11 0.26 166 113 40 0.32 179 130 9 999 0.29
2 LU -70,60,10 0.14 115 55 5 0.27 131 102 41 0.59 - - - -
2 PR -70,60,10 0.1 85 97 14 0.28 200 115 100 0.62 - - - -
2 SM -70,60,10 0.1 179 90 21 0.24 226 104 100 0.41 235 110 9 999 0.25
2 TB -70,60,10 0.1 180 30 9 0.11 215 83 45 0.41 221 106 9 999 0.38
2 TM -70,60,10 0.14 92 30 9 0.26 168 91 40 0.42 194 97 9 999 0.18
2 YB -70,60,10 0.14 92 30 9 0.26 168 105 40 0.42 194 107 9 999 0.18
3 DY 90,50,0 0.14 90 8 93 0.21 185 50 94 0.37 450 9 999 9 999 0.28
3 Y 90,50,0 0.12 58 14 93 0.27 348 75 100 0.35 350 9 999 9 999 0.26
3 EU 90,50,0 0.1 118 11 82 0.23 237 82 96 0.37 261 9 999 9 999 0.3
3 LA 90,50,0 0.06 77 8 33 0.11 227 54 62 0.36 228 9 999 9 999 0.47
3 ND 90,50,0 0.07 90 6 52 0.15 212 97 169 0.43 263 9 999 9 999 0.35
3 CE 90,50,0 0.08 90 12 23 0.12 218 78 178 0.45 219 9 999 9 999 0.35
3 ER 90,50,0 0.14 90 8 89 0.21 145 55 110 0.44 335 9 999 9 999 0.21
3 GD 90,50,0 0.1 90 11 96 0.22 280 76 117 0.38 348 9 999 9 999 0.3
3 HO 90,50,0 0.14 51 8 93 0.21 170 48 94 0.37 402 9 999 9 999 0.28
3 LU 90,50,0 0.11 57 8 93 0.24 170 50 120 0.46 324 9 999 9 999 0.19
3 PR 90,50,0 0.07 90 11 76 0.17 215 92 168 0.4 257 9 999 9 999 0.36
3 SM 90,50,0 0.1 164 10 26 0.19 256 84 256 0.37 257 9 999 9 999 0.34
3 TB 90,50,0 0.14 82 10 85 0.2 219 53 91 0.35 457 9 999 9 999 0.31

NI 43-101 - Technical report Norra Kärr REE - 0465-RPT-014 Rev 1
Page 154
Domain Element Rotation Angles (Z,X,Z)
Nugget Range 1
Range 2
Range 3
C1§ Range 1
Range 2
Range 3
C2§ Range 1
Range 2
Range 3
C3§
3 TM 90,50,0 0.14 90 8 87 0.21 164 52 119 0.45 387 9 999 9 999 0.2
3 YB 90,50,0 0.14 144 8 93 0.21 160 54 120 0.46 367 9 999 9 999 0.19
4 DY 110,50,170 0.15 116 10 123 0.22 427 40 242 0.63 - - - -
4 Y 110,50,170 0.13 63 6 189 0.17 391 40 199 0.7 - - - -
4 EU 110,50,170 0.11 34 12 92 0.29 480 47 263 0.6 - - - -
4 LA 110,50,170 0.15 75 9 278 0.26 359 45 336 0.59 - - - -
4 ND 110,50,170 0.1 62 6 164 0.21 372 43 300 0.69 - - - -
4 CE 110,50,170 0.11 65 6 180 0.23 369 45 273 0.66 - - - -
4 ER 110,50,170 0.1 77 8 81 0.27 403 40 274 0.63 - - - -
4 GD 110,50,170 0.1 62 7 115 0.2 434 40 242 0.7 - - - -
4 HO 110,50,170 0.13 116 9 87 0.24 427 42 242 0.63 - - - -
4 LU 110,50,170 0.1 85 8 91 0.27 398 37 252 0.63 - - - -
4 PR 110,50,170 0.13 62 10 228 0.24 389 46 292 0.63 - - - -
4 SM 110,50,170 0.1 26 5 123 0.17 427 40 256 0.73 - - - -
4 TB 110,50,170 0.12 103 9 91 0.25 476 42 242 0.63 - - - -
4 TM 110,50,170 0.11 68 9 74 0.26 394 34 268 0.63 - - - -
4 YB 110,50,170 0.15 96 9 63 0.2 429 38 218 0.65 - - - -
5 DY Omni-directional 0.05 17 17 17 0.12 150 150 150 0.83 - - - -
5 Y Omni-directional 0.09 34 34 34 0.1 150 150 150 0.81 - - - -
5 EU Omni-directional 0.13 27 27 27 0.04 150 150 150 0.83 - - - -
5 LA Omni-directional 0.2 30 30 30 0.14 105 105 105 0.66 - - - -
5 ND Omni-directional 0.2 34 34 34 0.01 125 125 125 0.78 - - - -

NI 43-101 - Technical report Norra Kärr REE - 0465-RPT-014 Rev 1
Page 155
Domain Element Rotation Angles (Z,X,Z)
Nugget Range 1
Range 2
Range 3
C1§ Range 1
Range 2
Range 3
C2§ Range 1
Range 2
Range 3
C3§
5 CE Omni-directional 0.23 51 51 51 0.18 110 110 110 0.59 - - - -
5 ER Omni-directional 0.08 32 32 32 0.05 145 145 145 0.87 - - - -
5 GD Omni-directional 0.12 86 86 86 0.11 145 145 145 0.77 - - - -
5 HO Omni-directional 0.11 18 18 18 0.03 145 145 145 0.86 - - - -
5 LU Omni-directional 0.13 15 15 15 0.02 140 140 140 0.85 - - - -
5 PR Omni-directional 0.21 107 107 107 0.5 115 115 115 0.29 - - - -
5 SM Omni-directional 0.15 32 32 32 0.04 150 150 150 0.81 - - - -
5 TB Omni-directional 0.15 18 18 18 0.01 150 150 150 0.86 - - - -
5 TM Omni-directional 0.19 145 145 145 0.81 - - - - - - - -
5 YB Omni-directional 0.12 36 36 36 0.01 150 150 150 0.87 - - - -
Note: Variances have been normalised to one, ranges for major, semi-major and minor axis respectively, structures modelled with spherical model

NI 43-101 - Technical report Norra Kärr REE - 0465-RPT-014 Rev 1
Page 156
14.6.4 ELLIPSES
Ellipses orientated and sized to represent the variogram model ranges were created and compared to
the mineralised zone wireframes to ensure that the variogram models reflected the geological
interpretation. These ellipses are shown below in Figure 14-11 to Figure 14-13 for the three largest
domains at Nora Kärr.
Figure 14-11: Ellipse Representing Variogram Ranges and GTM Wireframe
Figure 14-12: Ellipse Representing Variogram Ranges and Grennaite with Pegmatitic Zones Wireframe

NI 43-101 - Technical report Norra Kärr REE - 0465-RPT-014 Rev 1
Page 157
Figure 14-13: Ellipse Representing Variogram Ranges with Porphyritic Grennaite Wireframe
14.7 VOLUMETRIC MODELLING
14.7.1 BLOCK MODEL PARAMETERS
An initial empty block model was created inside the mineralised zone wireframes. A summary of the
block model parameters is listed in Table 14-6. A parent cell size of 25 m x 25 m x 5 m (northing x
easting x vertical) was selected. Key fields were established within the block model to identify and
separate the individual mineralised zones for control on grade estimation as described below. The
model was not rotated. A minimum sub cell size of 5 m x 5 m x 1 m was allowed to get a close fit to
the wireframe surfaces.
Table 14-6: Summary of Block Model Parameters
Property Direction Metres (m)
Model Origin
X 473 600
Y 6 439 300
Z -134
Parent Cell Size
X 25
Y 25
Z 5
No. of Cells
X 62
Y 72
Z 79

NI 43-101 - Technical report Norra Kärr REE - 0465-RPT-014 Rev 1
Page 158
14.7.2 DYNAMIC ANISOTROPY
Dynamic anisotropy is the process of reflecting small changes in dip and dip direction of a deposit
during grade estimation by slightly altering the orientations of search ellipses used to select samples.
At Nora Kärr a significant database of foliation directions measured from drill core were used to
interpret these subtle changes in orientation. Dip and dip directions were estimated into the volumetric
block model using IDW3 and the foliation information supplied by Tasman which was converted to
point ‘sample’ locations with consistent lengths of 0.02 m.
Estimation of dip and dip direction was carried out using a single pass estimation run, i.e. a single
non-expanding ellipse was used in order to achieve a block model that had no ‘steps’ in results.
Estimation was carried out using the mineralised domains as key fields, i.e. estimation of dip and dip
direction in a domain only used samples within that domain for the estimation. The size and
orientations of the search ellipses used were based on the variogram models interpreted for Dy
grades as these roughly followed the orientation of the interpreted fold axis.
The size of the final search ellipses used were calculated based on normalising the longest range of
these variograms to 100 m and determining the size of the other axis as a factor based on the
anisotropy. The estimation was then carried out as an iterative process with the search ellipse sizes
being increased for each zone until all blocks in that zone were estimated in a single pass.
A minimum of four samples was specified in order to ‘average out’ any inconsistent dip and dip
directions recorded in the database.
The parameters used for the estimation of dip and dip direction are listed in Table 14-7.
Table 14-7: Estimation Parameters for Dip and Dip Direction
Estimation Method: Inverse Distance Weighting Cubed
Parameter Domain 1 Domain 2 Domain 3 Domain 4 Domain 5 Domain 6
Search Radii 1 (m) 200 300 800 900 400 200
Search Radii 2 (m) 200 210 80 90 400 200
Search Radii 3 (m) 200 75 160 495 400 200
Rotation (Z,X,Z) 0,0,0 -70,60,10 90,50,0 110,50,170 0,0,0 0,0,0
Minimum Composites 4 4 4 4 4 4
Maximum Composites 16 16 16 16 16 16
Minimum Drill Holes
2 2 2 2 2 2
The estimated dip and dip directions were validated visually against the input data. Two example
sections are shown in Figure 14-14 and Figure 14-15 of the results of the estimation.

NI 43-101 - Technical report Norra Kärr REE - 0465-RPT-014 Rev 1
Page 159
Figure 14-14: Vertical Section Showing Estimated Dip and Dip Direction at Y=6,440,015
Figure 14-15: Vertical Section Showing Estimated Dip and Dip Direction at Y=6,440,115

NI 43-101 - Technical report Norra Kärr REE - 0465-RPT-014 Rev 1
Page 160
14.8 DENSITY
A total of 1 692 bulk density tests have been carried out by Tasman with the resultant database
supplied to WAI. To facilitate assigning densities by lithology types WAI has incorporated the density
data into the drill hole file and then extracted the density records by the wireframe lithology (LTYPE).
The average density values shown in Table 14-8 by LTYPE have been calculated and subsequently
assigned to the block model.
Table 14-8: Density Values Applied by Zone
LTYPE Rock Type Density (t/m3)
0 Granite 2.69
1 Kaxtorpite 2.74
2 Migmatitic Grennaite 2.67
3 Grennaite with pegmatitic zones 2.72
4 Porphyritic grennaite 2.71
5 Lakarpite 2.74
6 Mafic dykes 2.74
14.9 GRADE ESTIMATION
14.9.1 KRIGING NEIGHBOURHOOD ANALYSIS (KNA)
14.9.1.1 INTRODUCTION
Kriging Neighbourhood Analysis (KNA) is a method used for optimising block sizes and search
parameters used during grade estimation.
For Nora Kärr the KNA was carried out using Supervisor v8.2 software which enables a series of
tasks to be carried out in turn to determine:
The optimum block sizes;
The minimum and maximum samples to be used during estimation;
The optimum search ellipse size; and
The optimum block discretisation.
For each of these tasks a series of estimation runs are carried out using the variogram parameters
calculated as shown above on a block centre location selected for its representivity of the deposit.
Due to the strong positive correlation between many of the variables under examination the KNA was
run on Dy as being representative of mineralisation across the deposit. KNA studies were carried out
on the two largest domains; the grennaite with pegmatitic zones and the porphyritic grennaite, these
lithotypes provided the greatest coverage of sample data required to generate robust QKNA results.

NI 43-101 - Technical report Norra Kärr REE - 0465-RPT-014 Rev 1
Page 161
Similar results were obtained for both of these zones. The example shown below (Figure 14-16) is Dy
in the largest of the zones, grennaite with pegmatitic zones (LTYPE 3).
14.9.1.2 BLOCK SIZE
Each estimation run is used to calculate a slope of regression and Kriging Efficiency, the comparison
of which allows the optimum scenario to be selected.
A series of block sizes were tested with variation in the X, Y and Z directions. As expected, an
improvement in Kriging Efficiency was seen with increasing block size with the increase in
improvement in results tailing off after 25 m x 25 m x 5 m. Results for all block sizes tested were
above 80 % for Kriging Efficiency and 0.95 for slope of regression.
A block size of 25 m x 25 m x 5 m was chosen for modelling. This block size was a compromise
between gaining acceptable statistical results in this test and the block being small enough for pit
optimisation to be carried out at an adequate resolution. The results for the KNA block size tests can
be seen in Figure 14-16.
Figure 14-16: KNA Results for Block Size Using Dy in Grennaite with Pegamatitic Zones

NI 43-101 - Technical report Norra Kärr REE - 0465-RPT-014 Rev 1
Page 162
14.9.1.3 MINIMUM AND MAXIMUM SAMPLES
A series of tests were carried out at the selected block size of 25 m x 25 m x 5 m to determine the
optimum minimum and maximum samples to be used during the estimation process. As expected
increasing, up to a point, the numbers of samples used during the estimation improved the Kriging
Efficiency and slope of regression of the resulting estimate. Using a minimum of 20 samples
produced acceptable results for these parameters but increasing the samples used above 26
produced very little marked improvement. For further KNA tests a minimum of 20 and a maximum of
40 samples were used. The results for this analysis are shown in Figure 14-17.
Figure 14-17: KNA Results for Varying Number of Samples Used During Estimation Using Dy in Grennaite with Pegmatitic Zones
14.9.1.4 SEARCH ELLIPSE SIZE
A series of tests were carried out to determine the optimum search ellipse size using the selected
block size of 25 m x 25 m x 5 m and using a minimum of 20 samples and a maximum of 40 samples.
Various search ellipse sizes were tested at differing ratios of the variogram model ranges. Very little
change was seen in Kriging Efficiency or slope of regression with increasing search ellipse sizes.
This is probably due to meeting the maximum sample criteria at this size. The results of this test are

NI 43-101 - Technical report Norra Kärr REE - 0465-RPT-014 Rev 1
Page 163
shown in Figure 14-18. The search ellipses used during grade estimation are detailed in Section
14.9.2. For further KNA test work a search ellipse equal to variogram range was used.
Figure 14-18: KNA Results for Varying Search Ellipse Sizes Using Dy in Grennaite with Pegmatitic Zones
14.9.1.5 BLOCK DISCRETISATION
Using a block size of 25 m x 25 m x 5 m, a minimum number of 20 samples and a maximum number
of 40 samples with a search ellipse roughly equal to variogram range, a series of estimation runs
were carried out to determine the optimum block discretisation parameters. With increasing block
discretisation there was an improvement in both Kriging Efficiency and slope of regression from point
Kriging (1 m x 1 m x 1 m discretisation) up to block discretisation of 3 m x 3 m x 2 m. Past this point
there was little gain in the results of either parameter but a block discretisation of 5 m x 5 m x 2 m was
chosen for estimation to give a small spacing of discretisation points across a parent cell. The results
of the block discretisation analysis are shown in Figure 14-19.

NI 43-101 - Technical report Norra Kärr REE - 0465-RPT-014 Rev 1
Page 164
Figure 14-19: KNA Results for Varying Block Discretisation Using Dy in Grennaite with Pegmatitic Zones
14.9.2 ESTIMATION PLAN
Grade estimation was carried out using Ordinary Kriging (OK) as the principle interpolation method.
Inverse Power of Distance Squared (IDW2) and Nearest Neighbour (NN) were also used for
comparative purposes for each element. For the mafic dykes only IDW2 and NN were used due to a
lack of robust variogram models in this zone. The OK method used estimation parameters defined by
the variography and refined after KNA studies as described above. The estimation was performed on
mineralised material domains defined during the domaining process described above and only
drillhole composites contained within a domain were used in the grade estimation of that domain.
For the mineralised zones the OK estimation was run in a three pass estimation plan, the second and
third passes using progressively larger search radii to enable the estimation of blocks not estimated
on the previous pass. The search ellipse sizes and orientations were derived from the variographic
analysis, with the first search distances corresponding to the distance at roughly two thirds of the
variogram range value and the second search distance approximating the variogram range and the
third search ellipse approximating twice the variogram range. Search ellipses were orientated to fit the
directions of continuity as defined by the variography study. The directional control settings defining
the local variation in the strike and dip of the mineralised zones that were defined during the block

NI 43-101 - Technical report Norra Kärr REE - 0465-RPT-014 Rev 1
Page 165
model creation process were used during estimation. The dip and dip directions were used as vectors
to interpolate dip directions and dip values into the block model. These orientations were
subsequently used during grade estimation to orient the search ellipses independently for each block.
This dynamic anisotropy procedure gives a more realistic reflection of the local variations in the strike
and dip of the deposit.
Sample weighting during estimation was determined by variogram model parameters for the OK
method. Block discretisation was set to 5 m x 5 m x 2 m points to estimate block grades. Sub cells
received the same estimate as the parent cell. A summary of the estimation parameters are shown in
Table 14-9 and summary of the search ellipse sizes is shown in Table 14-10.
Table 14-9: Grade Estimation Parameters
Grade Estimation Parameters
Search Ellipse
1 2 3
Search Ellipse Size Increase of ellipse #1 x 1 x 1.5 x 3
Minimum Composites 20 15 8
Maximum Composites 40 40 16
Minimum Octants 4 4 -
Min Composite per Octant 1 1 -
Max Composite per Octant 5 5 -
Minimum Drill Holes 3 3 2
Table 14-10: Initial Search Ellipse Sizes for Grade Estimation
Domain 1 Domain 2 Domain 3 Domain 4 Domain 5 Domain 6
Dy Size (m) of Axis 1,2,3 25,25,25 160,115,45 300,60,35 280,160,25 100,100,100 100,100,100
Y Size (m) of Axis 1,2,3 25,25,25 145,115,45 230,65,50 260,130,25 100,100,100 100,100,100
Eu Size (m) of Axis 1,2,3 25,25,25 155,80,65 170,65,55 315,175,30 100,100,100 100,100,100
La Size (m) of Axis 1,2,3 45,45,45 110,80,35 150,40,35 235,220,30 70,70,70 100,100,100
Nd Size (m) of Axis 1,2,3 25,25,25 120,70,60 175,110,65 245,200,30 80,80,80 100,100,100
Ce Size (m) of Axis 1,2,3 60,60,60 130,65,65 145,155,50 245,180,30 70,70,70 100,100,100
Er Size (m) of Axis 1,2,3 25,25,25 130,80,35 220,70,35 265,180,25 95,95,95 100,100,100
Gd Size (m) of Axis 1,2,3 25,25,25 120,75,65 230,75,50 285,160,25 95,95,95 100,100,100
Ho Size (m) of Axis 1,2,3 25,25,25 120,85,25 265,60,30 280,160,30 95,95,95 100,100,100
Lu Size (m) of Axis 1,2,3 25,25,25 85,65,25 215,80,35 260,165,25 90,90,90 100,100,100
Pr Size (m) of Axis 1,2,3 55,55,55 130,75,65 170,110,65 255,195,30 75,75,75 100,100,100
Sm Size (m) of Axis 1,2,3 25,25,25 155,75,65 170,170,55 280,170,25 100,100,100 100,100,100
Tb Size (m) of Axis 1,2,3 25,25,25 145,70,30 300,60,35 315,160,30 100,100,100 100,100,100
Tm Size (m) of Axis 1,2,3 30,30,30 130,65,25 255,80,35 260,175,20 95,95,95 100,100,100

NI 43-101 - Technical report Norra Kärr REE - 0465-RPT-014 Rev 1
Page 166
Domain 1 Domain 2 Domain 3 Domain 4 Domain 5 Domain 6
Yb Size (m) of Axis 1,2,3 25,25,25 130,70,25 240,80,35 285,145,25 100,100,100 100,100,100
Zr Size (m) of Axis 1,2,3 25,25,25 80,45,20 100,45,45 60,60,60 90,90,90 100,100,100
U Size (m) of Axis 1,2,3 25,25,25 90,65,25 80,65,35 75,75,75 35,35,35 100,100,100
Th Size (m) of Axis 1,2,3 15,15,15 30,30,30 170,40,35 25,25,25 40,40,40 100,100,100
Hf Size (m) of Axis 1,2,3 25,25,25 80,35,20 130,65,40 60,60,60 90,90,90 100,100,100
Nb Size (m) of Axis 1,2,3 25,25,25 150,115,75 265,50,15 60,60,60 95,95,95 100,100,100
14.10 VALIDATION
Following grade estimation a statistical and visual assessment of the block model was undertaken to:
assess successful application of the estimation passes;
to ensure that as far as the data allowed, all blocks within mineralisation domains were
estimated; and
the model estimates performed as expected.
The model validation methods carried out included:
A visual assessment of grade;
Global statistical grade validation; and
Grade profile analysis.
14.10.1 VISUAL ASSESSMENT
A visual comparison of composite sample grade and block grade was conducted in cross section and
in plan, as shown in the example sections in Figure 14-20 to Figure 14-23. Visually the model was
generally considered to reflect the composite grades and the domain boundaries are honoured.

NI 43-101 - Technical report Norra Kärr REE - 0465-RPT-014 Rev 1
Page 167
Figure 14-20: Example East-West Vertical Section Showing Composite and Estimated Grades at Northing=6439915
Figure 14-21: Example East-West Vertical Section Showing Composite and Estimated Grades at Northing=6440115

NI 43-101 - Technical report Norra Kärr REE - 0465-RPT-014 Rev 1
Page 168
Figure 14-22: Example East-West Vertical Section Showing Composite and Estimated Grades at Northing=6440215
Figure 14-23: Example East-West Vertical Section Showing Composite and Estimated Grades at Northing=6440315

NI 43-101 - Technical report Norra Kärr REE - 0465-RPT-014 Rev 1
Page 169
14.10.2 GLOBAL GRADE COMPARISON
Statistical analysis of the block model was carried out for comparison against the composited drill hole
data. This analysis provides a check on the reproduction of the mean grade of the composite data
against the model over the global domain. Typically the mean grade of the block model should not be
significantly greater than that of the samples from which it has been derived. The mean block model
grade for each ore zone and its corresponding mean composite grades are shown in Table 14-11. A
good match is seen between input sample/composite grades and the estimated block grades for each
domain.
Table 14-11: Validation Stats - Composite Grades vs. Block Grades
Zone Element Composite Grades OK IDW2 NN
1 DY_PPM 57.55 56.64 56.08 55.07
1 Y_PPM 402.58 398.90 392.71 386.76
1 EU_PPM 5.79 5.70 5.65 5.56
1 LA_PPM 335.21 333.50 326.14 327.51
1 ND_PPM 212.43 212.88 206.99 205.07
1 CE_PPM 545.66 550.23 530.76 532.96
1 ER_PPM 40.15 39.60 39.16 38.40
1 GD_PPM 46.65 45.85 45.21 44.52
1 HO_PPM 12.76 12.59 12.47 12.21
1 LU_PPM 5.29 5.25 5.18 5.07
1 PR_PPM 61.23 60.70 59.22 59.28
1 SM_PPM 44.84 44.42 43.58 43.03
1 TB_PPM 8.72 8.57 8.47 8.31
1 TM_PPM 6.11 6.00 5.87 5.79
1 YB_PPM 37.62 37.36 36.88 36.22
1 ZR_PPM 3 347.61 3 378.30 3 282.66 3 237.60
1 U_PPM 24.65 24.23 23.76 23.51
1 TH_PPM 65.28 57.20 56.73 55.16
1 HF_PPM 76.55 77.11 75.14 74.01
1 NB_PPM 138.64 138.62 136.20 133.65
2 DY_PPM 159.64 162.47 162.08 161.88
2 Y_PPM 1 200.29 1 229.49 1 229.24 1 219.68
2 EU_PPM 14.11 14.63 14.54 14.53
2 LA_PPM 621.68 618.51 622.11 612.75
2 ND_PPM 554.72 569.22 568.71 569.06
2 CE_PPM 1 269.10 1 285.04 1 288.58 1 276.07
2 ER_PPM 110.35 111.26 111.37 110.96
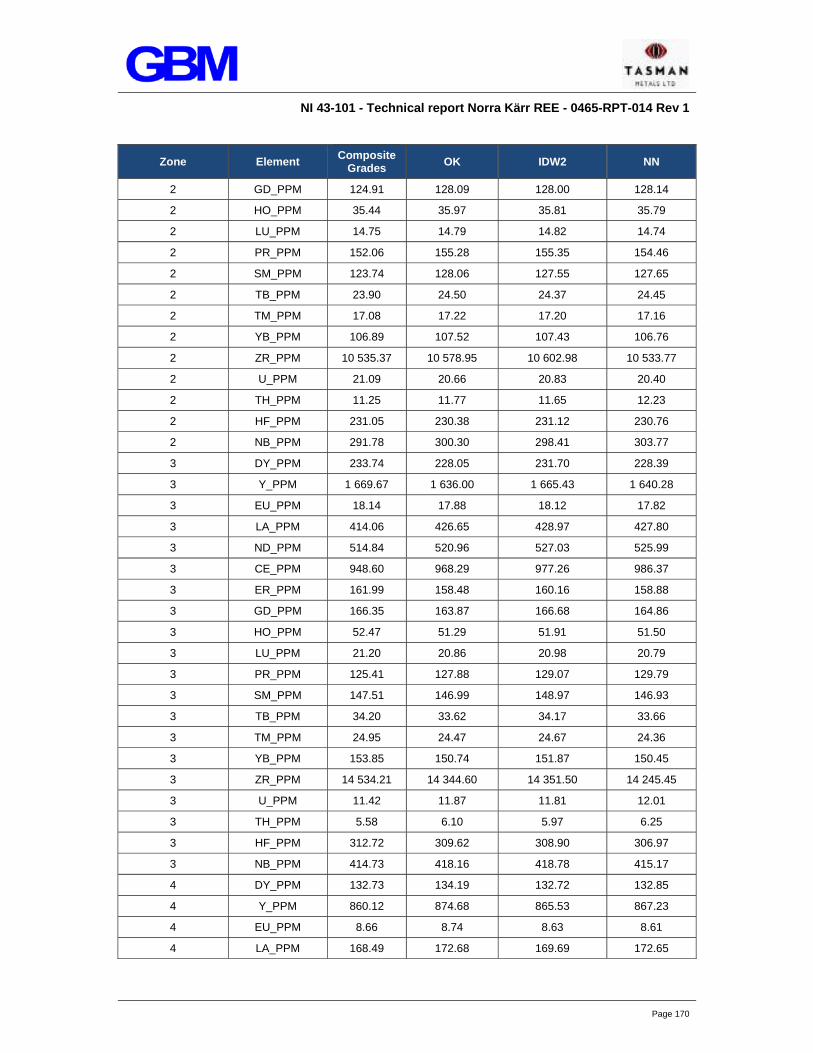
NI 43-101 - Technical report Norra Kärr REE - 0465-RPT-014 Rev 1
Page 170
Zone Element Composite Grades OK IDW2 NN
2 GD_PPM 124.91 128.09 128.00 128.14
2 HO_PPM 35.44 35.97 35.81 35.79
2 LU_PPM 14.75 14.79 14.82 14.74
2 PR_PPM 152.06 155.28 155.35 154.46
2 SM_PPM 123.74 128.06 127.55 127.65
2 TB_PPM 23.90 24.50 24.37 24.45
2 TM_PPM 17.08 17.22 17.20 17.16
2 YB_PPM 106.89 107.52 107.43 106.76
2 ZR_PPM 10 535.37 10 578.95 10 602.98 10 533.77
2 U_PPM 21.09 20.66 20.83 20.40
2 TH_PPM 11.25 11.77 11.65 12.23
2 HF_PPM 231.05 230.38 231.12 230.76
2 NB_PPM 291.78 300.30 298.41 303.77
3 DY_PPM 233.74 228.05 231.70 228.39
3 Y_PPM 1 669.67 1 636.00 1 665.43 1 640.28
3 EU_PPM 18.14 17.88 18.12 17.82
3 LA_PPM 414.06 426.65 428.97 427.80
3 ND_PPM 514.84 520.96 527.03 525.99
3 CE_PPM 948.60 968.29 977.26 986.37
3 ER_PPM 161.99 158.48 160.16 158.88
3 GD_PPM 166.35 163.87 166.68 164.86
3 HO_PPM 52.47 51.29 51.91 51.50
3 LU_PPM 21.20 20.86 20.98 20.79
3 PR_PPM 125.41 127.88 129.07 129.79
3 SM_PPM 147.51 146.99 148.97 146.93
3 TB_PPM 34.20 33.62 34.17 33.66
3 TM_PPM 24.95 24.47 24.67 24.36
3 YB_PPM 153.85 150.74 151.87 150.45
3 ZR_PPM 14 534.21 14 344.60 14 351.50 14 245.45
3 U_PPM 11.42 11.87 11.81 12.01
3 TH_PPM 5.58 6.10 5.97 6.25
3 HF_PPM 312.72 309.62 308.90 306.97
3 NB_PPM 414.73 418.16 418.78 415.17
4 DY_PPM 132.73 134.19 132.72 132.85
4 Y_PPM 860.12 874.68 865.53 867.23
4 EU_PPM 8.66 8.74 8.63 8.61
4 LA_PPM 168.49 172.68 169.69 172.65

NI 43-101 - Technical report Norra Kärr REE - 0465-RPT-014 Rev 1
Page 171
Zone Element Composite Grades OK IDW2 NN
4 ND_PPM 207.23 211.61 208.91 211.14
4 CE_PPM 374.47 384.27 378.15 383.92
4 ER_PPM 104.39 105.25 104.44 104.80
4 GD_PPM 80.18 81.17 80.38 80.64
4 HO_PPM 31.64 31.94 31.70 31.75
4 LU_PPM 15.21 15.36 15.22 15.29
4 PR_PPM 50.12 51.31 50.56 51.26
4 SM_PPM 63.86 64.82 64.13 64.47
4 TB_PPM 18.07 18.31 18.13 18.10
4 TM_PPM 16.84 16.93 16.81 16.84
4 YB_PPM 106.57 107.28 106.46 106.51
4 ZR_PPM 9 874.85 10 118.01 10 031.02 10 250.96
4 U_PPM 4.81 5.12 5.09 5.26
4 TH_PPM 5.50 5.70 5.76 5.88
4 HF_PPM 244.12 248.23 246.88 250.86
4 NB_PPM 187.40 192.96 191.18 201.05
5 DY_PPM 201.49 203.81 197.97 199.99
5 Y_PPM 1 385.51 1 407.70 1 363.42 1 375.91
5 EU_PPM 15.42 15.40 15.17 15.04
5 LA_PPM 405.98 408.14 399.18 400.47
5 ND_PPM 445.60 443.96 440.90 440.81
5 CE_PPM 886.38 886.12 869.72 871.99
5 ER_PPM 141.33 143.69 139.15 142.35
5 GD_PPM 138.10 138.39 135.83 135.91
5 HO_PPM 45.60 46.11 44.85 45.86
5 LU_PPM 18.57 18.91 18.42 19.17
5 PR_PPM 112.25 111.65 112.24 112.12
5 SM_PPM 121.29 122.04 119.76 119.46
5 TB_PPM 28.88 28.88 28.31 28.47
5 TM_PPM 21.61 21.79 21.23 21.92
5 YB_PPM 133.63 135.77 131.27 135.41
5 ZR_PPM 8 647.09 8 942.74 8 522.50 9 008.96
5 U_PPM 10.27 10.47 10.59 9.56
5 TH_PPM 21.11 21.69 22.05 20.87
5 HF_PPM 194.25 201.90 191.80 206.22
5 NB_PPM 405.11 402.84 398.55 398.95
6 DY_PPM 48.44 50.54 81.16

NI 43-101 - Technical report Norra Kärr REE - 0465-RPT-014 Rev 1
Page 172
Zone Element Composite Grades OK IDW2 NN
6 Y_PPM 339.00 353.25 562.82
6 EU_PPM 5.41 5.64 8.46
6 LA_PPM 199.40 207.49 315.04
6 ND_PPM 174.15 181.95 277.13
6 CE_PPM 393.46 411.34 629.66
6 ER_PPM 32.46 33.95 54.30
6 GD_PPM 39.42 41.65 65.38
6 HO_PPM 10.64 11.08 17.78
6 LU_PPM 4.22 4.40 6.78
6 PR_PPM 48.58 51.11 78.54
6 SM_PPM 38.04 39.66 61.06
6 TB_PPM 7.26 7.59 12.02
6 TM_PPM 4.87 5.08 8.05
6 YB_PPM 30.64 31.99 50.10
6 ZR_PPM 2 515.63 2 668.08 2 751.74
6 U_PPM 10.73 11.09 14.10
6 TH_PPM 30.04 29.81 39.25
6 HF_PPM 55.35 58.92 59.52
6 NB_PPM 91.61 94.12 152.44
NB:
No cut-off grade applied
Grades in ppm
Composites sample grades are length weighted
OK=Ordinary Kriging IDW2=Inverse Distance Weighting Squared NN=Nearest Neighbour
14.10.3 LOCAL GRADE PROFILE COMPARISONS
Grade profile plots are a graphical display of the grade distribution derived from a series of bands, or
swaths, generated in several directions through the deposit. The plot compares the grade within
these bands of the composite samples and the block estimated grades for the different methodologies
used. Where the composite grades and the estimated grades show a good correlation, greater
confidence can be placed on the estimate.
These plots were generated in three directions, by easting, northing and vertically to fit with the
general form of the mineralised zones. Comparison of the grade was made against the composited
grades with block grades estimated by OK, IDW2 and NN methods. The swath plots were generated
by averaging the blocks and composites using 25 m bands in easting and northing and 5 m bands by

NI 43-101 - Technical report Norra Kärr REE - 0465-RPT-014 Rev 1
Page 173
elevation. Grade profile plots were generated for the OK, IDW2 and NN estimation methods and
should exhibit a close relationship to the composite data upon which the estimation is based.
A generally close relationship was observed between composite and block grade across the model for
all variables. Some deviations between the composite and estimated block grade occur at the edges
of the deposit where reduced tonnages or wide sample spacing accentuate the differences in grade.
Examples of grade profile plots are shown in Figure 14-24 to Figure 14-26 for Dy in domains LTYPE 2
to 4; Migmatitic Grennaite, Grennaite with pegmatitic zones and Porphyritic Grennaite respectively.
Overall the plots illustrate a good correlation between the composites and the block grades.

NI 43-101 - Technical report Norra Kärr REE - 0465-RPT-014 Rev 1
Page 174
Figure 14-24: Grade Profile Plots for Dy

NI 43-101 - Technical report Norra Kärr REE - 0465-RPT-014 Rev 1
Page 175
Figure 14-25: Grade Profile Plots for Dy in Grennaite with Pegmatitic Zones

NI 43-101 - Technical report Norra Kärr REE - 0465-RPT-014 Rev 1
Page 176
Figure 14-26: Grade Profile Plots for Dy in Porphyritic Grennaite
14.10.4 MODEL RECONCILIATION
The Nora Kärr project is a greenfield site and, as such, no reconciliation studies have been carried
out.

NI 43-101 - Technical report Norra Kärr REE - 0465-RPT-014 Rev 1
Page 177
14.10.5 VALIDATION SUMMARY
Globally no indications of significant over or under estimation are apparent in the model nor were any
obvious interpolation issues identified. From the perspective of conformance of the average model
grade to the input data, WAI considers the model to be a satisfactory representation of the sample
data used and an indication that the grade interpolation has performed as expected. In terms of
conformance to the drill hole composite data WAI considers the OK interpolation method to most
closely represent the drill hole data. The Mineral Resource estimate is therefore based upon the OK
grade estimation.
14.11 DEPLETION
The Nora Kärr project is a greenfield site and, as such, no depletion of the Mineral Resource has
been carried out.
14.12 MINERAL RESOURCE CLASSIFICATION
14.12.1 CIM DEFINITION STANDARDS
Under the CIM definition standards for Mineral Resources and Mineral Reserves a Mineral Resource
is a concentration or occurrence of solid material of economic interest in or on the Earth’s crust in
such form, grade or quality and quantity that there are reasonable prospects for eventual economic
extraction. The location, quantity, grade or quality, continuity and other geological characteristics of a
Mineral Resource are known, estimated or interpreted from specific geological evidence and
knowledge including sampling.
A ‘Measured Mineral Resource’ is that part of a Mineral Resource for which quantity, grade or quality,
densities, shape, and physical characteristics are estimated with confidence sufficient to allow the
application of Modifying Factors to support detailed mine planning and final evaluation of the
economic viability of the deposit. Geological evidence is derived from detailed and reliable
exploration, sampling and testing and is sufficient to confirm geological and grade or quality continuity
between points of observation.
An ‘Indicated Mineral Resource’ is that part of a Mineral Resource for which quantity, grade or quality,
densities, shape and physical characteristics are estimated with sufficient confidence to allow the
application of Modifying Factors in sufficient detail to support mine planning and evaluation of the
economic viability of the deposit. Geological evidence is derived from adequately detailed and reliable
exploration, sampling and testing and is sufficient to assume geological and grade or quality continuity
between points of observation.
An ‘Inferred Mineral Resource’ is that part of a Mineral Resource for which quantity and grade are
estimated on the basis of limited geological evidence and sampling. Geological evidence is sufficient

NI 43-101 - Technical report Norra Kärr REE - 0465-RPT-014 Rev 1
Page 178
to imply but not verify geological and grade or quality continuity. An Inferred Mineral Resource has a
lower level of confidence than that applying to an Indicated Mineral Resource and must not be
converted to a Mineral Reserve. It is reasonably expected that the majority of Inferred Mineral
Resources could be upgraded to Indicated Mineral Resources with continued exploration.
14.12.2 CONSIDERATIONS FOR THE NORRA KÄRR REE RESOURCE CLASSIFICATION
To classify the Nora Kärr deposit WAI have taken into account the following indicators:
Geological Continuity and Complexity;
QA/QC Results - Quality of Data;
Spatial Grade Continuity - Results of Geostatistical Analysis;
Quality of Block Model; and
Expectations of Economic Extraction.
14.12.2.1 GEOLOGICAL CONTINUITY AND COMPLEXITY
The level of geological exploration undertaken by Tasman and the quality of work is to a high
standard and has allowed for detailed modelling of the Norra Kärr geological structure. The drill hole
spacing is sufficient to define the extents of the alkaline intrusive body which hosts the REEs.
Detailed geological logging including textural details has allowed Tasman to refine the broad
geological interpretation further to include transitions between various textural and lithological zones
of the mineralised body. To assist in define the textural sub-divisions of the mineralisation Tasman
has also used geochemical assay results for various REE elements to denote the transition.
The Norra Kärr alkaline intrusive REE body has undergone compressive deformation with folding
exhibited within the core. Tasman has recorded foliation orientation within the drill hole database. In
developing a geological interpretation and model Tasman has used the foliation data to understand
how the intrusive body has been folded.
During the Mineral Resource estimation WAI has used dynamic anisotropy to reflect the changes in
the dip and dip direction of the geological structure. To facilitate the dynamic anisotropy the recorded
foliation data was utilised, this data was used to estimate dip and dip directions into the block model.
The dynamic anisotropy has enabled the grade estimation process to better honour the deposit
geological continuity.
Overall WAI is of the opinion that the Norra Kärr geological structure is well understood and is well
represented by the Mineral Resource block model and estimate.
14.12.2.2 QUALITY OF DATA
Any Mineral Resource estimate is totally reliant on the quality of the sample data on which it is based.
To ensure a high quality robust sample dataset Tasman has implemented a QA/QC programme

NI 43-101 - Technical report Norra Kärr REE - 0465-RPT-014 Rev 1
Page 179
which has included the submission of field quarter core duplicates, pulverised laboratory duplicates,
external duplicates, CRMs and blanks.
WAI has reviewed the QA/QC results supplied by Tasman as well as independently submitting eight
core samples and four pulverised duplicate samples for re-assay. The QA/QC results show an
excellent level of precision and a good level of accuracy. The blank samples did display low grade
mineralisation but WAI is of the opinion that this is a function of the use of granite as the blank
material rather than a sample contamination issue. The sample data appears to be of a good
standard suitable for use in a Mineral Resource estimate.
14.12.2.3 SPATIAL GRADE CONTINUITY
An assessment of spatial grade continuity is important when assigning resource classification. The
confidence that can be placed in the variogram parameters is a major consideration when assessing
classification. The data used in geostatistical analysis resulted in reasonably robust along strike and
down dip variogram structures for all elements allowing the determination of appropriate search
parameters through the KNA process.
14.12.2.4 QUALITY OF BLOCK MODEL
Validation of the block model has shown the estimated grades to be a good reflection of the input
composite grades. Visual and statistical checks reveal no evidence of major under or over estimation.
14.12.2.5 EXPECTATIONS OF ECONOMIC EXTRACTION
In order to report a Mineral Resource in accordance with CIM for disclosure in an NI 43-101 report,
there needs to be the reasonable prospect for eventual economic extraction. To ensure that the Norra
Kärr Mineral Resource reported by WAI has reasonable prospects of economic extraction the mineral
inventory has been constrained by a pit optimisation and only mineralisation falling within the open pit
is disclosed as a Mineral Resource.
The pit optimisation parameters used by WAI to constrain the Mineral Resource are shown in Table
14-12 below.

NI 43-101 - Technical report Norra Kärr REE - 0465-RPT-014 Rev 1
Page 180
Table 14-12: Norra Kärr Mineral Resource Estimate Pit Optimisation Parameters (WAI, 2014)
Description Unit Amount Source
Metal Price
Cerium Oxide USD/g 0.005 Rev C - Carolyn Dennis
Dysprosium Oxide USD/g 0.470 Rev C - Carolyn Dennis
Erbium Oxide USD/g 0.000 Rev C - Carolyn Dennis
Europium Oxide USD/g 0.700 Rev C - Carolyn Dennis
Gadolinium Oxide USD/g 0.020 Rev C - Carolyn Dennis
Holmium Oxide USD/g 0.000 Rev C - Carolyn Dennis
Lanthanum Oxide USD/g 0.007 Rev C - Carolyn Dennis
Lutetium Oxide USD/g 1.300 Rev C - Carolyn Dennis
Neodymium Oxide USD/g 0.105 Rev C - Carolyn Dennis
Praseodymium Oxide USD/g 0.075 Rev C - Carolyn Dennis
Samarium Oxide USD/g 0.007 Rev C - Carolyn Dennis
Terbium Oxide USD/g 0.725 Rev C - Carolyn Dennis
Thulium Oxide USD/g 0.000 Rev C - Carolyn Dennis
Yttrium Oxide USD/g 0.015 Rev C - Carolyn Dennis
Ytterbium Oxide USD/g 0.000 Rev C - Carolyn Dennis
Mining Costs
Mining cost USD/t 3.66
Waste mining cost USD/t -
Ore mining cost USD/t -
Difference USD/t 0
TREO Processing Costs
Processing (Inc G&A) USD/t Ore 48.32 GBM OPEX 0465-CAL-013_RevB
Tailings Management USD/t Ore 3.28 GBM OPEX 0465-CAL-013_RevB
Combined Ore Cost USD/t Ore 51.60
Metallurgical Recovery
TREO % 72
Selling Cost
Refining USD/g Product 0.022 Tasman Quote
Royalty % 0.20 Swedish Minerals Act
Product Dependant Reagent USD/g Product 0.00083 OPEX 0465-CAL-013_RevB (Oxalic Acid)

NI 43-101 - Technical report Norra Kärr REE - 0465-RPT-014 Rev 1
Page 181
Description Unit Amount Source
Transport
(Norra Kärr – La Rochelle)
USD/g Product 0.00013 OPEX 0465-CAL-013_RevB
14.12.3 NORRA KÄRR CLASSIFICATION
The Mineral Resource classification for the Norra Kärr REE deposit is in accordance with the
guidelines of the CIM Definition Standards for Mineral Resources and Mineral Reserves (CIM (2010)
(3)).
Criteria for defining Mineral Resource categories are based on the factors highlighted previously in
Section 14.12.2 covering geostatistical studies, QA/QC data review and the overall degree of
confidence in the geological and grade continuity exhibited at the deposit.
WAI has classified the Norra Kärr deposit as Indicated. Allocation of the Indicated classification
reflects the robust nature of the sample data on which the estimation is based and the detailed
geological work undertaken by Tasman. The exploration works to date have demonstrated geological
continuity both along strike and down dip. Although grade continuity has been demonstrated along
strike through variography, the current drill hole spacing down dip is only sufficient to assume grade
continuity with drill hole spacing corresponding to the upper variogram range.
For the purpose of reporting WAI has converted the REE (individual element grades) to REO (oxide)
grades based on the conversion factors shown in Table 14-13 below
Table 14-13: Rare Earth Oxide Conversion Factors (PAH, 2011) (4)
Element Conversion Oxide Element Conversion Oxide
Ce 1.171 Ce2O3 Nd 1.166 Nd2O3
Dy 1.147 Dy2O3 Pr 1.17 Pr2O3
Er 1.143 Er2O3 Sm 1.159 Sm2O3
Eu 1.157 Eu2O3 Tb 1.151 Tb2O3
Gd 1.152 Gd2O3 Tm 1.142 Tm2O3
Ho 1.145 Ho2O3 Y 1.269 Y2O3
La 1.172 La2O3 Yb 1.138 Yb2O3
Lu 1.137 Lu2O3
Table 14-14 shows the Norra Kärr Mineral Resource estimate in accordance with the CIM Code as
constrained by the pit optimisation using the parameters in Table 14-12.

NI 43-101 - Technical report Norra Kärr REE - 0465-RPT-014 Rev 1
Page 182
Table 14-14: Norra Kärr Mineral Resource Estimate (WAI, 2014)
Classification TREO % Cut-Off Grade
Tonnes (kt) Density (t/m3)
TREO (%) % HREO in TREO
Dy2O3 (%) Y2O3 (%) Eu2O3 (%) La2O3 (%) Nd2O3 (%) Ce2O3 (%) Gd2O3 (%) Tb2O3 (%) Pr2O3 (%) Sm2O3 (%) Lu2O3 (%)
Indicated 0.2 36 821.60 2.71 0.55 53.18 0.02532 0.20053 0.00203 0.05190 0.06025 0.11560 0.01825 0.00371 0.01504 0.01647 0.00227
0.4 31 109.16 2.70 0.61 52.60 0.02729 0.21775 0.00222 0.05729 0.06680 0.12823 0.01997 0.00403 0.01668 0.01815 0.00238
0.6 17 124.71 2.72 0.68 52.23 0.02994 0.24290 0.00253 0.06214 0.07686 0.14413 0.02260 0.00447 0.01896 0.02083 0.00251
Notes:
1. Mineral Resources that are not Mineral Reserves do not have demonstrated economic viability
2. Mineral Resources are reported inclusive of any Mineral Reserves
3. The Mineral Resources reported have been constrained on the basis of a 20 yr. pit.
4. Mineral Resources are reported for the combined GTM, PGT, GTC and ELAK mineralisation only.
5. The Mineral Resources reported represent estimated contained metal in the ground and has not been adjusted for metallurgical recovery.
6. Total Rare Earth Oxides (TREO) includes: La2O3, Ce2O3, Pr2O3, Nd2O3, Sm2O3, Eu2O3, Gd2O3, Tb2O3, Dy2O3, Ho2O3, Er2O3, Tm2O3, Yb2O3, Lu2O3, Y2O3.
7. Heavy Rare Earth Oxides (HREO) includes: Eu2O3, Gd2O3, Tb2O3, Dy2O3, Ho2O3, Er2O3, Tm2O3, Yb2O3, Lu2O3, Y2O3.
8. Preferred Base Case Mineral Resources are reported at a TREO % cut-off grade of 0.4 % TREO.

NI 43-101 - Technical report Norra Kärr REE - 0465-RPT-014 Rev 1
Page 183
SECTION 15 MINERAL RESERVE ESTIMATES
15.1 CURRENT ESTIMATE
The following section describes the Mineral Reserve estimation methodology used by WAI for the
Norra Kärr deposit. The effective date of the Mineral Reserve estimate is 1 November 2014.
Mineral Reserves are reported by order of increasing confidence, either Probable Mineral Reserves or
Proven Mineral Reserves. Mineral Resources reported in this study are at the Indicated Mineral
Resources confidence level only; therefore only Probable Mineral Reserves may be reported, based
on consideration of mining, metallurgical, economic, and other modifying factors. The statement will
include allowances for diluting material and losses based on calculated factors.
WAI was commissioned to produce a Mineral Reserve estimate for the Nora Kärr project. The Mineral
Reserve estimate has been carried out following the guidelines of the CIM Definition Standards for
Mineral Reserves (3).
The reference point for the Mineral Reserves reporting is defined at the final refining point for the
product; in this case, the final destination is mainland Europe. Transport costs, product handling, and
refining costs have been included in the optimised parameters.
The Mineral Reserve estimation was completed using industry standard practices for open pits using
Datamine software: Studio 5D Planner® (5DP) and NPV Scheduler® (NPVS). The software was used
to generate optimal pit envelopes using NPVS and subsequent mine design using 5DP, before final
scheduling was completed on the mine design in NPVS.
15.2 OPEN PIT MINE PLANNING
The methodology for mine planning comprised of the following steps:
Preparation of block model for use in open pit optimisation.
Pit optimisation – production of series of optimal pit shells for scenarios and parameters.
Selection of the most appropriate ultimate pit shell for subsequent pit design. A 20 year open
pit life has been selected due to forecasting and appropriate time scales.
Pit design, followed by evaluation to produce a Mineral Reserve estimate for the open pit.
Final scheduling based on the final pit design.
The economic parameters have been supplied from Tasman, GBM and WAI, based on market
studies, quotations from suppliers, as well as reasonable projections or estimates. A summary of the
current open pit parameters is shown in Table 15-1. Mining losses and dilution were estimated by
WAI based on mining operations and geology through a number of sections of the ore body taking
account of minimum mining selective width; this is within the Dilution Study (12).

NI 43-101 - Technical report Norra Kärr REE - 0465-RPT-014 Rev 1
Page 184
Pit slope parameters were derived from geotechnical investigations, undertaken by WAI in 2014. The
investigation concluded an inter-ramp angle (IRA) of 53° in most areas, whilst an IRA of 56° was
recommended in the eastern sector due to favourable geology and an IRA of 51° due to wedge
formation in the southeast sector. The overall pit slope angles used are sector dependent but range
from 51° to 56°. The geotechnical study designed 20 m final bench heights mined in two lifts of 10 m.
A berm width of 8.5 m has been designed every 20 m and a haul ramp of 17.8 m width has also been
designed which additionally acts as a safety berm. Due to pit configuration and design a smaller,
8.5 m width haul ramp, has been designed in the lowest bench, of the north and south pits.
Examples of the final designs for the Norra Kärr deposit are shown in Figure 15-1 and Figure 15-2.

NI 43-101 - Technical report Norra Kärr REE - 0465-RPT-014 Rev 1
Page 185
Figure 15-1: Norra Kärr – Cut away view – Pit Design and Block Model
(Showing Ore Blocks)
Figure 15-2: Norra Kärr – Optimised Ultimate Pit and Design Pit Shell

NI 43-101 - Technical report Norra Kärr REE - 0465-RPT-014 Rev 1
Page 186
Table 15-1: Norra Kärr Pit Optimisation Parameters
Description Unit Amount Source
Metal Price
Cerium Oxide USD/g 0.005 Rev D - Carolyn Dennis
Dysprosium Oxide USD/g 0.575 Rev D - Carolyn Dennis
Erbium Oxide USD/g 0.000 Rev D - Carolyn Dennis
Europium Oxide USD/g 0.700 Rev D - Carolyn Dennis
Gadolinium Oxide USD/g 0.040 Rev D - Carolyn Dennis
Holmium Oxide USD/g 0.000 Rev D - Carolyn Dennis
Lanthanum Oxide USD/g 0.007 Rev D - Carolyn Dennis
Lutetium Oxide USD/g 0.900 Rev D - Carolyn Dennis
Neodymium Oxide USD/g 0.080 Rev D - Carolyn Dennis
Praseodymium Oxide USD/g 0.115 Rev D - Carolyn Dennis
Samarium Oxide USD/g 0.008 Rev D - Carolyn Dennis
Terbium Oxide USD/g 0.950 Rev D - Carolyn Dennis
Thulium Oxide USD/g 0.000 Rev D - Carolyn Dennis
Yttrium Oxide USD/g 0.025 Rev D - Carolyn Dennis
Ytterbium Oxide USD/g 0.000 Rev D - Carolyn Dennis
Mining Costs
Mining cost USD/t 3.47 WAI OPEX Calculation (30/10/14)
TREO Processing Costs
Processing (Inc G&A) USD/t Ore 88.04 GBM 0465-CAL-013
Treatment & Refining USD/g Product 0.019 Tasman Quote – Confirmed (28/10/14)
Metallurgical Recovery
Cerium Oxide % 78.0 GBM CAL 0464-CAL-002 Rev A
Dysprosium Oxide % 78.8 GBM CAL 0464-CAL-002 Rev A
Erbium Oxide % 77.4 GBM CAL 0464-CAL-002 Rev A
Europium Oxide % 79.4 GBM CAL 0464-CAL-002 Rev A
Gadolinium Oxide % 79.3 GBM CAL 0464-CAL-002 Rev A
Holmium Oxide % 78.0 GBM CAL 0464-CAL-002 Rev A
Lanthanum Oxide % 77.8 GBM CAL 0464-CAL-002 Rev A
Lutetium Oxide % 75.5 GBM CAL 0464-CAL-002 Rev A
Neodymium Oxide % 79.0 GBM CAL 0464-CAL-002 Rev A
Praseodymium Oxide % 78.8 GBM CAL 0464-CAL-002 Rev A
Samarium Oxide % 79.4 GBM CAL 0464-CAL-002 Rev A

NI 43-101 - Technical report Norra Kärr REE - 0465-RPT-014 Rev 1
Page 187
Description Unit Amount Source
Terbium Oxide % 79.1 GBM CAL 0464-CAL-002 Rev A
Thulium Oxide % 76.9 GBM CAL 0464-CAL-002 Rev A
Yttrium Oxide % 72.9 GBM CAL 0464-CAL-002 Rev A
Ytterbium Oxide % 76.1 GBM CAL 0464-CAL-002 Rev A
Selling Cost
Royalty (% Metal Price) % 0.20 Swedish Minerals Act
Other
Mining Dilution % 3.50 WAI Dilution Study
Mining Loss % 5.01 WAI Dilution Study
Production rate Mtpa 1.15 GBM Processing OPEX 0465-CAL-013_RevA
Discount Factor % 10 WAI Standard Rate
Cut-Off Grade g/t x Economic Cut-off Grade (NPVS)
Reporting Report ZrO2
Slope Angle (IRA)
Azi 000 (°) 53 WAI Geotechnical Report
Azi 045 (°) 53 WAI Geotechnical Report
Azi 090 (°) 56 WAI Geotechnical Report
Azi 135 (°) 51 WAI Geotechnical Report
Azi 180 (°) 53 WAI Geotechnical Report
Azi 225 (°) 53 WAI Geotechnical Report
Azi 270 (°) 53 WAI Geotechnical Report
Azi 315 (°) 53 WAI Geotechnical Report
The parameters in Table 15-1 have been used for pit optimisation. REE prices have been based on a
market study using current market prices and projections. For the purpose of mine planning and due
to the complexity of modelling multi-metals deposits, NPVS was used to determine economic blocks
to be mined based on a combined metal ore parcel value. This, in essence, means that while
economic cut-off grades for individual metals are reported, due to the combination of multiple metals
within a single block of differing grade and value this will often mean that the block is economic to be
extracted, even if individual grades are below the cut-off grades.

NI 43-101 - Technical report Norra Kärr REE - 0465-RPT-014 Rev 1
Page 188
15.3 ECONOMIC CUT-OFF GRADES
The economic cut-off grade is defined as the point where revenue per mass unit is equal to the
processing cost per mass unit. The processing cost includes the effect of dilution and the selling cost;
the selling cost includes refining and royalty. It is important to note that the economic cut-off grade
does take account of the mining cost; the economic cut-off grade is used as an ore test for material,
ergo if the revenue exceeds processing costs then the block is considered for mining depending on its
position and time dependency.
The break-even economic cut-off grades are shown in Table 15-2.
Table 15-2: Economic Cut-Off Grades (PGT & GTM)
Metal Oxide Cut-Off Grade Metal Oxide Cut-Off Grade
Ce2O3 Infinite Nd2O3 2 002.2
Dy2O3 210.9 Pr2O3 1 251.9
Er2O3 Infinite Sm2O3 Infinite
Eu2O3 170.7 Tb2O3 125.3
Gd2O3 6 427.2 Tm2O3 Infinite
Ho2O3 Infinite Y2O3 47 949.0
La2O3 Infinite Yb2O3 Infinite
Lu2O3 138.7
N.B. Where Infinite is shown, the metal oxide is uneconomic to mine at the given parameters.
15.4 PIT SHELL SELECTION
The project has been constrained on the following criteria:
Mine life limited to 20 years.
Maintaining a safe blast exclusion zone from the E4 Highway to the east (260 m).
Consider PGT and GTM as ore units only.
Pit shell selection was based a series of Lerch-Grosman phase pits which were run at incremental
commodity price factors, producing a series of nested shells. With the target production rate of
1.15 Mtpa ore for 20 years, a Lerch-Grosman phase shell was selected with contained ore in the
region of 23 Mt. The Lerch-Grosman phase shell is the optimised shell shape for the corresponding
commodity price. This shell was used as a basis for the final pit design, which is shown in Figure 15-3
in plan view.

NI 43-101 - Technical report Norra Kärr REE - 0465-RPT-014 Rev 1
Page 189
Figure 15-3 Norra Kärr – Plan of Final Pit Design
Table 15-3 details the Nora Kärr Mineral Reserve estimate.

NI 43-101 - Technical report Norra Kärr REE - 0465-RPT-014 Rev 1
Page 190
Table 15-3: Norra Kärr Mineral Reserve Estimate (WAI, November 2014)
Classification Ore Tonnes (kt)
TREO (%)
HREO (%)
% HREO in TREO
Ce2O3 (%)
Dy2O3 (%)
Er2O3
(%) Eu2O3
(%) Gd2O3
(%) Ho2O3
(%) La2O3
(%) Lu2O3
(%)
Proved - - - - - - - - - - - -
Probable 23 571 0.592 0.314 0.531 0.124 0.0269 0.0184 0.00218 0.0196 0.00593 0.0551 0.00234
TOTAL 23 571 0.592 0.314 0.531 0.124 0.0269 0.0184 0.00218 0.0196 0.00593 0.0551 0.00234
Classification Ore Tonnes (kt)
Nd2O3
(%) Pr2O3
(%) Sm2O3
(%) Tb2O3
(%) Tm2O3
(%) Y2O3
(%) Yb2O3
(%) Zr (%)
U (%)
Th (%)
Hf (%)
Proved - - - - - - - - - - - -
Probable 23 571 0.0648 0.0161 0.0178 0.00396 0.00280 0.215 0.0172 1.36 0.00131 0.000663 0.0286
TOTAL 23 571 0.0648 0.0161 0.0178 0.00396 0.00280 0.215 0.0172 1.36 0.00131 0.000663 0.0286
Notes:
1) Mineral Reserves are reported based on material contained within the Design Final Pit Shell. 2) Mineral Reserves are constrained a designed 20yr mine life. 3) Mineral Reserves are reported for combined GTM and PGT mineralisation only. 4) Mineral Reserves reported have been adjusted for Mining factors, at 3.5 % Dilution and 5.0 % Loss. 5) Mineral Reserves are reported to 3 S.F. 6) Total Rare Earth Oxides (TREO) includes: La2O3, Ce2O3, Pr2O3, Nd2O3, Sm2O3, Eu2O3, Gd2O3, Tb2O3, Dy2O3, Ho2O3, Er2O3, Tm2O3, Yb2O3, Lu2O3, Y2O3. 7) Heavy Rare Earth Oxides (HREO) includes: Eu2O3, Gd2O3, Tb2O3, Dy2O3, Ho2O3, Er2O3, Tm2O3, Yb2O3, Lu2O3, Y2O3.

NI 43-101 - Technical report Norra Kärr REE - 0465-RPT-014 Rev 1
Page 191
SECTION 16 MINING METHODS
Open pit operations are planned to be conventional diesel hydraulic shovel and truck extraction, with
drill and blasting of final benches at 20 m height. The mine life has been designed at 20 years. There
is pre-stripping required of 600 kt waste and 60 days have been allocated for this task. The life of
mine (LOM) mining rate averages 1.15 Mt/a ore and 0.84 Mt/a waste.
The mine plan has been developed using owner-operated equipment in all aspects of mining. Hauling
is scheduled to operate on a single eight hour shift per day, five days a week. This equates to 241
operating calendar days, less five days for weather delays. Blast hole drilling operates on two eight
hour shifts at the same operating days due to drilling requirements. It has been assumed there will be
85 % operating availability of equipment.
16.1 MINING OPERATIONS AND EQUIPMENT
Blast fragmentation was required to meet a maximum of 600 mm for a planned crusher and the blast
design was made to ensure fly rock does not affect the E4 highway located to the west.
16.1.1 BLAST HOLE DRILLING
Blast hole drilling will be completed with a track mounted blast hole drill, such as an Atlas Copco Flex
Roc D60. Final bench heights will be 20 m, fired in two lifts. Owing to the bulk nature and similarity of
ore and waste, a blasting pattern has been designed for use in all materials. Vertical 110 mm (4.3”)
diameter holes at a 2.75 m x 3.25 m staggered pattern are planned with 0.37 m sub-drill and 2.75 m
stemming.
The overall blast design has a tight pattern with relatively small hole diameters and increased
stemming, this is due to the fragmentation and fly rock constraints, whilst meeting targeted powder
factors for the rock mass.

NI 43-101 - Technical report Norra Kärr REE - 0465-RPT-014 Rev 1
Page 192
16.1.2 BLASTING
Figure 16-1: Example Blast Pattern
Fly rock is a major controllable feature of the blast design and has influenced the drill and blast
design. Face surveying prior to drilling is required to ensure correct burden spacing, as this is a
primary cause of fly rock. Equally, sub drill depth has been minimised to avoid damage to the top of
the bench and thus the effect of crater fly rock. In initial blasting in upper benches located closest to
the highway blast matting and management practices will be required to reduce the fly rock risk.
Trial blasting away from the highway must be practiced to check the design, and allow back analysis
and case history to be recorded.
Fly rock estimation has been based on the effect of bench-top and vertical face fly rock, the American
model by Roth (1979) (13) has been used for estimation. In calculating the estimate, the rock type is
assumed to be granite and an addition has been added for using emulsion rather than ANFO. The
model uses monographs to calculate the ranges, the monographs are based on work by Gurney
which calculates the initial velocity of rock fragments propelled by an explosive, then based on
ballistic trajectory formula for a single drill hole:
Face Flyrock: 67.5 m
Bench Top Flyrock: 160 m
The pit rim of the design open pit is 260m away from the E4 highway, based on the calculated flyrock
projection of 160m, the blast design is within this distance and therefore WAI has selected this blast
design.

NI 43-101 - Technical report Norra Kärr REE - 0465-RPT-014 Rev 1
Page 193
The loading sequence will start by lowering a 454 g (1 lb.) booster down the hole. The booster will be
attached with two non-electric detonators. It is anticipated that the mine will have damp holes, and
owing to the fragmentation requirements, 100 % emulsion will be used as the primary blasting agent.
Bulk emulsion will be mixed on site prior to loading into holes. A loading truck will transport the mixed
emulsion to the holes and pour a measured load into the holes. The remaining holes will be filled with
crushed rock, acting as stemming, this will control the blast energy and minimise fly rock, (10 mm
angular chippings are recommended).
Once holes are loaded, the lead lines to the blasting caps will be tied together with a series of
downhole and surface delays to control the blast. There is provision for use of blasting mats where
required to prevent surface crater fly rock; typically heavy conveyor belts, bolted into sheets is
sufficient. To minimise operating delays, blasting will occur at the end of shifts.
An example of the blast pattern is shown in Figure 16-1. An average annual blasted volume of
426 000 m3 will be required, which will equate to controlled indicative blast volumes of 2 130 m3, or
5 750 bcm every two to three days. Initially powder factor (kilogram of explosive per tonne of rock)
has been designed at 0.27 kg/t, once in production with site experience and analysis, the design will
be optimised for safety, fragmentation, fly rock, and cost.
Blasting design fragmentation has been analysed using the KUZ-RAM fragmentation analysis,
oversize criteria has been set at 600 mm, with the current blast design oversize material is estimated
at 3.5 %. Secondary blasting will be conducted on oversize blocks at the same time as primary
blasting. Once sufficient oversize material is collected, secondary blasting will use smaller diameter
holes and pre-packaged explosives to split or crack the oversize material into manageable pieces.
16.1.3 LOADING
Loading will be undertaken using a hydraulic shovel and large wheel loader as a back-up. The
primary excavator will be a 100 tonne class unit with a 6.7 m3 bucket, such as the Komatsu PC1250-
8. The shovel has been planned in a face shovel configuration as this will allow good operator
visibility, selectivity, and allow the unit to scale loose blocks either reaching upwards or downwards on
the 20 m bench.
The wheel loader is planned for auxiliary tasks such as muck pile loading and bench clean ups, as
well as acting as another loading unit in case of mechanical down time on the primary hydraulic
excavator. The wheel loader will have a 6.9 m3 bucket, such as a Volvo L250G; this is sized to match
55 tonne payload trucks.
Loading was estimated using a 0.95 % fill factor and a swell factor of 1.55. The loading parameters
are shown in Table 16-1.

NI 43-101 - Technical report Norra Kärr REE - 0465-RPT-014 Rev 1
Page 194
Table 16-1: Loading Parameters
Unit Capacity
(m3)
Bank Density
(t/m3)
Swell
Factor
Fill
Factor (%)
Bucket
Capacity (t)
Cycle
Time (s)
PC 1250-7
Ore 6.7 2.70 (Av.) 1.55 95 10.7 100
Waste 6.7 2.72 (Av.) 1.55 95 11.1 100
16.1.4 HAULING
Haulage will be done using 55 tonne class haul trucks. CAT 773G (55.3 t, 35.8 m3 capacity) rigid body
haul trucks were planned with the excavating units and for haulage profiles. Oversize or
unmanageable blocks will be separated by the hydraulic excavator then transported using the wheel
loader to a separate area.
Mining haul ramps are designed at 10 % gradient and at 18 m width, a rolling resistance of 2 % has
been assumed (2 % is equivalent to a hard, smooth surface stabilised surface, watered and
maintained). Although the haul trucks are capable of descending at over 50 km/h, a site speed limit
for heavy plant of 30 km/h on ramps and 40 km/h on the flat is recommended. The mine model has
set the haul truck descending speed to match the inclined speed to ensure a constant cycle, thus
avoiding trucks waiting to be loaded.
Table 16-2 shows the fixed haulage times assumed for the loading, spotting, and dumping.
Table 16-2: Truck Loading and Dumping Parameters
CAT 773G Capacity (t) Loaded (t) Load Time (min)
Spot Time (min)
Dump Time (min)
Ore 55.3 54.8 0.9 0.1 0.03
Waste 55.3 55.6 0.9 0.1 0.03

NI 43-101 - Technical report Norra Kärr REE - 0465-RPT-014 Rev 1
Page 195
16.2 EQUIPMENT FLEET SUMMARY
The primary mine equipment fleet support mine equipment is summarized in Table 16-3.
Table 16-3: Mining Equipment Fleet
Equipment Model Description Information Max. Number Required
AC FlexROC D60 Production Drill 110-170 mm dia. holes,
54 m max. depth
2
Komatsu PC1250-7 Hydraulic Excavator 6.7 m3 bucket capacity 2
Volvo L250G Front End Loader 6.9 m3 bucket capacity 1
CAT 773G Rigid-Body Haul Truck 55.3 t Payload 7
Volvo G990 Motor Grader 4.3 m blade width 1
Volvo FM84 Water Tanker 30 000 l tank 1
Volvo FM66 Fuel Tanker 12 000 l tank 1
16.2.1 MAJOR SUPPORT EQUIPMENT
Support equipment comprises of a grader, a water truck, and light plants to facilitate mining
operations. Ore will be hauled to a ROM pad, where it will be crushed and fed into processing
operations.
The equipment profiles of major mining equipment are shown graphically in Figure 16-2.
Figure 16-2: LOM Equipment Profile

NI 43-101 - Technical report Norra Kärr REE - 0465-RPT-014 Rev 1
Page 196
16.3 MINING OPERATIONS
16.3.1 SITE PREPARATION
The mine site and dumps are located on generally flat terrain with top soil or transitional material
making the immediate material. Where top soil can be recovered, it will be collected into stockpiles
where it can be sourced for future rehabilitation.
16.3.2 PIT ACCESS
The mine design consists of an open pit, 870 m long, 370 m wide, and 150 m deep, with a volume of
22.6 Mm3. The open pit has a low strip ratio (S.R. = 0.73:1, waste to ore) and is located on a relatively
level area. The pit has two main pushbacks before reaching final limits and has been designed with
17.8 m wide haul ramps with an in pit gradient of 10 %. The pit entrance/exit points have been
designed to exit at the southern extent of the pit.
In the south east of the deposit, a known fault zone exists which has been intercepted by drilling. In
recovered core, it is shown as a highly broken zone two to five metres wide. A standoff distance to the
fault of 20 m from the pit has been designed to ensure that it does not act as a major release plane.
Pushbacks and final designs are shown in Figure 16-6.
Haul ramps within the pit have been designed to avoid the south east fault area and the western area
as the geotechnical assessment show some potential poor ground areas in the drill results.
16.3.3 SURFACE HAUL ROADS
Haul roads have been indicatively planned from the entrance/exit of the open pit directly to the ROM
pad to the south. A spur has been included in the design for access to the mine waste dumps; Figure
16-3 shows the planned layout.
Figure 16-3: Site Plan, Main Haul Roads

NI 43-101 - Technical report Norra Kärr REE - 0465-RPT-014 Rev 1
Page 197
Haul road design has used the parameters detailed in Table 16-4.
Table 16-4: Haul Road Design Parameters
Parameter Value
Total Distance 1 120 m
Two –Way Traffic 3 x Truck Width
Truck Width (CAT 773G) 4.9 m
Ditching (1 m Depth) * 1:1 2.0 m
Total Width 17.8 m ≈ 20 m
The final costing for the haul roads is based on a semi-permanent haul road, as the layouts are not
going to change significantly over the mine life. Semi-permanent haul roads also give optimum rolling
resistance characteristics. The construction of haul roads have been typically costed and designed as
illustrated in Figure 16-4.
Figure 16-4: Typical Haul Road Construction (CAT Publication) (14)
An allowance has been made for clearance of the haul road area, and base course (typically crushed
rock) will be sourced from the open pit. Costs have been applied for the sub-base (sand) and final
surface material (crushed gravel).

NI 43-101 - Technical report Norra Kärr REE - 0465-RPT-014 Rev 1
Page 198
16.4 MINE MANPOWER REQUIREMENTS
It is anticipated that the mine will be owner-operated, employing full-time management and operations
personnel. Salaried personnel wages will be based upon the structure detailed in Table 16-5.
Table 16-5: Salary Structure
Grade Description Salary (USD/annum)
A General Manager 191 156
B Senior Management/Chief Super 109 233
D Supervisor - Mine 95 579
E Engineer 81 925
F Process Operator/Technician/Officer 82 611
G Driver / Operator 75 693
H Artisan/Mechanic/Electrician 74 837
I Labour/Cleric Day Shift 60 272
Table 16-6 summarises the total personnel required for mining operations on the project. It should be
noted that no provision has been made for a site general manager or technical services manager as
these roles are included within the overall project cost centre. Furthermore, as blasting operations are
to be carried out by contractor, the personnel schedule includes only for a blasting superintendent to
oversee these works.
Table 16-6: Mining Personnel Requirements
Position Grade Maximum Number Required
Management & Operations
Mine Manager B 1
Foreman C 1
Mine Shift Supervisor D 1
Excavator Operator G 2
Production Truck Driver G 7
Drill Operator G 6
Grader/Water/Telehandler Operator G 1
Blast Team Supervisor D 1
FEL Operator at ROM pad H 1
Technical Services
Chief Mining Engineer D 1
Senior Mining Engineer E 1
Chief Geologist D 1

NI 43-101 - Technical report Norra Kärr REE - 0465-RPT-014 Rev 1
Page 199
Position Grade Maximum Number Required
Senior Geologist E 1
Geologist’s Assistant I 1
Chief Surveyor D 1
Surveyor F 1
Surveyor’s Assistant I 1
Maintenance & Administration
Maintenance Superintendent B 1
Maintenance Supervisor D 1
Maintenance Planner E 1
Maintenance Fitter G 2
Electrician I 1
Secretary/Clerk G 1
No allocation has been made for absenteeism within this estimate given the location of the project in
Western Europe.

NI 43-101 - Technical report Norra Kärr REE - 0465-RPT-014 Rev 1
Page 200
16.5 MINE PRODUCTION SCHEDULE
The final design was imported into NPVS and, with the pushback files, used to generate a mining
schedule. Constraints for the schedule were a 1.15 Mtpa ore feed to the plant with a target of a
constant stripping ratio where achievable. The mining schedule, which covers a period of 20.5 years,
is summarised in Figure 16-5 and shown in detail in Table 16-7.
Figure 16-5: Mining Schedule Summary

NI 43-101 - Technical report Norra Kärr REE - 0465-RPT-014 Rev 1
Page 201
Table 16-7: Mining Production Schedule
Year
ORE MINED (Tonnes) TOTAL ROCK MINED
(Tonnes)
Ce2O3 Grade (g/t) Dy2O3 Grade (g/t)
Er2O3 Grade (g/t)
Eu2O3 Grade (g/t)
Gd2O3 Grade (g/t)
Ho2O3 Grade (g/t)
La2O3 Grade (g/t)
Lu2O3 Grade (g/t)
Nd2O3 Grade (g/t)
Pr2O3 Grade (g/t)
Sm2O3 Grade (g/t)
PGT Ore GTM Ore TOTAL ORE
PGT Feed
GTM Feed
PGT Feed
GTM Feed
PGT Feed
GTM Feed
PGT Feed
GTM Feed
PGT Feed
GTM Feed
PGT Feed
GTM Feed
PGT Feed
GTM Feed
PGT Feed
GTM Feed
PGT Feed
GTM Feed
PGT Feed
GTM Feed
PGT Feed
GTM Feed
0 - - - 600 000 - - - - - - - - - - - - - - - - - - - - - -
1 934 284 219 778 1 154 063 2 829 934 1 198.1 1 528.5 269.6 192.8 180.4 128.8 22.1 17.6 200.6 152.5 59.8 42.5 508.4 725.2 23.1 17.1 646.7 677.8 158.9 183.4 184.4 155.9
2 905 069 244 650 1 149 719 2 266 412 1 177.8 1 554.6 264.5 206.7 180.4 136.9 21.8 19.5 193.9 168.8 59.4 45.3 497.0 732.2 23.4 17.7 635.8 732.5 156.7 194.8 175.5 167.0
3 916 367 233 888 1 150 255 2 280 660 1 204.8 1 491.8 270.3 189.0 180.9 127.5 22.3 17.0 199.9 149.7 59.8 41.6 516.2 716.6 23.1 16.8 649.6 661.2 160.4 180.8 183.3 148.1
4 874 584 278 119 1 152 703 2 189 268 1 250.2 1 435.7 275.0 187.4 183.7 128.5 22.8 16.6 202.8 146.3 60.6 41.4 540.8 709.7 23.5 17.0 673.2 632.4 165.8 173.9 187.4 143.0
5 820 031 326 354 1 146 384 2 237 388 1 280.2 1 561.4 273.2 205.2 180.2 136.9 23.0 18.9 203.8 164.8 60.1 44.7 543.3 742.9 22.9 17.8 693.5 715.6 169.9 195.3 189.3 164.9
6 771 495 378 459 1 149 954 2 497 211 1 318.8 1 603.9 267.4 213.2 175.0 141.8 22.8 20.1 202.8 173.2 58.8 46.9 554.3 760.8 22.0 18.1 709.9 754.1 175.1 205.0 190.9 174.1
7 901 392 249 638 1 151 030 2 350 457 1 153.6 1 440.6 291.0 181.8 199.0 124.6 22.5 16.3 205.3 142.4 64.7 40.2 521.1 687.1 25.4 16.8 627.8 633.3 153.9 170.9 182.2 144.0
8 913 426 235 200 1 148 626 2 392 760 1 134.3 1 415.5 287.9 183.6 198.2 125.4 22.1 17.0 203.7 147.9 64.1 40.1 507.9 685.8 25.4 16.9 617.2 641.4 151.3 170.6 179.4 146.0
9 911 888 239 072 1 150 960 2 392 538 1 131.4 1 372.9 285.5 174.6 197.6 121.1 22.0 15.2 202.6 134.9 63.5 39.3 503.2 681.6 25.3 16.4 619.1 593.3 151.1 163.8 180.0 131.0
10 930 005 222 600 1 152 606 2 385 230 1 122.7 1 341.1 286.9 175.0 197.7 123.0 22.1 15.1 203.2 133.5 63.3 39.0 497.7 668.0 25.2 16.5 615.1 570.5 150.1 157.8 177.7 128.2
11 924 991 219 778 1 144 770 2 444 055 1 091.8 1 379.7 277.0 171.6 189.9 120.2 21.9 15.0 196.4 131.7 61.4 38.0 480.0 685.6 24.2 16.0 605.8 582.9 147.5 162.3 172.9 128.8
12 863 619 289 013 1 152 632 1 961 698 1 069.6 1 381.6 272.5 180.7 187.0 125.9 21.3 15.7 192.5 137.7 60.2 39.8 468.7 684.7 23.7 16.6 590.6 599.3 144.0 165.8 170.7 133.8
13 985 294 164 718 1 150 012 1 878 749 1 104.3 1 454.1 279.2 188.2 191.0 130.2 22.2 17.1 199.2 146.5 61.5 41.7 486.4 691.2 24.1 16.8 612.9 646.5 148.9 177.4 175.1 147.3
14 852 722 301 088 1 153 810 1 547 575 1 152.7 1 409.7 276.1 182.9 188.1 127.8 22.5 16.1 202.4 140.6 60.3 40.4 501.4 689.2 23.7 16.5 634.9 611.8 154.3 168.7 179.2 137.5
15 1 082 432 64 838 1 147 270 1 450 479 1 145.9 1 678.3 294.4 216.4 204.7 141.6 22.5 21.1 208.2 179.8 64.9 46.0 505.3 769.8 25.8 17.9 626.5 802.0 151.8 215.9 181.5 183.9
16 907 342 242 091 1 149 433 1 590 690 1 233.8 1 477.3 282.8 185.7 193.5 128.2 23.6 17.0 209.9 147.2 61.8 40.7 533.5 703.9 24.2 16.5 676.4 651.2 164.4 177.4 191.2 147.3
17 1 041 384 110 513 1 151 897 1 517 339 1 214.5 1 556.5 291.4 197.4 200.2 133.7 23.7 18.8 211.8 161.3 63.7 42.8 528.9 738.3 25.1 16.8 661.4 719.7 160.5 193.7 188.8 163.3
18 1 092 728 51 319 1 144 047 1 349 541 1 201.9 1 655.1 295.8 208.1 205.6 138.0 23.6 20.0 214.8 173.1 65.0 44.7 523.5 781.0 25.9 17.0 649.2 768.0 157.5 206.5 187.5 172.4
19 1119 135 33 534 1 152 669 1 426 368 1 266.7 1 761.4 308.0 153.4 213.9 98.5 24.7 16.3 225.8 140.1 67.8 32.0 555.8 838.3 26.8 12.9 692.2 719.6 166.6 198.6 196.7 146.1
20 1 151 894 3 216 1 155 110 1 266 247 1 239.6 - 310.7 116.4 217.5 77.7 24.0 13.6 222.0 108.6 68.9 23.8 546.0 895.6 27.6 9.6 671.4 647.9 161.7 183.1 195.4 110.8
21 562 576 - 562 576 595 001 1 209.7 - 324.9 - 228.6 - 23.8 - 225.6 - 73.1 - 544.2 - 29.2 - 663.8 - 157.9 - 193.2 -
TOTAL 19 462 659 4 107 864 23 570 523 40 849 599 1 185.51 1 474.40 285 190 195 129 23 17 206 150 63 42 517 711 25 17 646 658 157 179 184 149

NI 43-101 - Technical report Norra Kärr REE - 0465-RPT-014 Rev 1
Page 202
Tb2O3 Grade (g/t)
Tm2O3 Grade (g/t) Y2O3 Grade (g/t) Yb2O3 Grade
(g/t) Zr Grade (g/t) U Grade (g/t) Th (g/t) Hf (g/t) TREO (%) HREO (%) WASTE MINED (Tonnes)
PGT Feed
GTM Feed
PGT Feed
GTM Feed
PGT Feed
GTM Feed
PGT Feed
GTM Feed
PGT Feed
GTM Feed
PGT Feed
GTM Feed
PGT Feed
GTM Feed
PGT Feed
GTM Feed
PGT Feed
GTM Feed
PGT Feed
GTM Feed GTC (w) PGT
(w) GTM (w)
ELAK (w) GNT MAF KAX TOTAL
WASTE
- - - - - - - - - - - - - - - - - - - - - - - - 600 000 - - 600 000
40.2 29.5 27.4 20.2 2 151.7 1 590.3 168.6 125.0 13 390.3 10 501.4 11.8 20.0 6.3 10.6 40.2 29.5 27.4 20.2 2 151.7 1 590.3 433 736 16 016 3 768 81 035 533 029 4 658 3 630 1 075 871
39.0 31.5 27.6 20.9 2 100.5 1 716.9 168.3 129.6 14 208.7 10 887.0 12.9 19.1 5.4 9.6 39.0 31.5 27.6 20.9 2 100.5 1 716.9 140 581 15 515 4 194 - 943 114 - 13 289 1 116 693
40.2 28.6 27.6 19.7 2 158.5 1 565.2 169.1 123.2 13 442.5 10 301.4 11.7 19.8 6.2 10.1 40.2 28.6 27.6 19.7 2 158.5 1 565.2 409 346 15 709 4 009 65 349 617 086 4 452 14 454 1 130 405
40.9 28.0 28.2 19.7 2 192.3 1 530.4 172.3 123.5 13 501.4 10 350.7 12.2 21.1 6.2 11.9 40.9 28.0 28.2 19.7 2 192.3 1 530.4 365 376 14 992 4 768 23 358 560 461 3 973 63 636 1 036 564
40.8 31.3 27.4 20.7 2 178.7 1 693.7 167.5 129.0 13 837.7 11 035.7 13.1 19.9 5.5 11.0 40.8 31.3 27.4 20.7 2 178.7 1 693.7 240 445 14 057 5 594 - 762 749 - 68 157 1 091 003
40.2 32.6 26.6 21.4 2 125.6 1 758.5 162.7 133.7 13 494.7 11 608.7 13.7 19.9 6.2 9.8 40.2 32.6 26.6 21.4 2 125.6 1 758.5 318 899 13 225 6 755 5 001 962 482 1 027 39 867 1 347 256
42.5 27.3 30.3 19.4 2 303.4 1 517.9 187.4 120.5 13 670.5 10 308.2 10.5 21.1 7.5 10.1 42.5 27.3 30.3 19.4 2 303.4 1 517.9 548 030 15 452 4 279 35 552 562 345 14 248 19 522 1 199 428
42.0 27.6 30.3 19.5 2 266.7 1 540.1 186.6 121.3 13 705.3 10 393.2 10.9 23.1 7.0 10.5 42.0 27.6 30.3 19.5 2 266.7 1 540.1 503 112 15 658 4 032 25 893 632 419 18 975 44 045 1 244 134
41.8 25.8 30.3 18.7 2 254.1 1 415.5 186.0 117.0 14 083.1 9 918.8 11.1 21.0 5.9 11.6 41.8 25.8 30.3 18.7 2 254.1 1 415.5 460 226 15 632 4 098 24 454 664 968 17 536 54 663 1 241 577
42.1 25.5 30.3 18.8 2 261.8 1 394.2 185.4 118.2 14 419.3 9 960.4 11.2 21.5 5.7 12.9 42.1 25.5 30.3 18.8 2 261.8 1 394.2 536 987 15 943 3 816 20 139 568 061 17 399 70 281 1 232 625
40.7 25.3 29.0 18.3 2 189.4 1 374.9 178.2 115.2 14 586.5 9 909.2 11.6 21.0 5.1 11.6 40.7 25.3 29.0 18.3 2 189.4 1 374.9 593 355 15 857 3 768 15 413 600 408 10 275 60 211 1 299 286
39.9 26.5 28.6 19.0 2 167.1 1 431.9 175.6 119.4 14 543.0 10 272.5 11.9 20.9 5.0 11.2 39.9 26.5 28.6 19.0 2 167.1 1 431.9 363 547 14 805 4 954 890 355 685 - 69 185 809 066
41.0 28.0 29.2 19.7 2 215.5 1 531.4 178.7 123.2 14 800.0 10 768.1 12.0 20.4 5.2 9.9 41.0 28.0 29.2 19.7 2 215.5 1 531.4 333 262 16 890 2 824 1 096 359 115 - 15 549 728 736
40.7 26.9 28.7 19.3 2 230.9 1 453.1 175.6 121.3 14 523.7 10 546.9 12.0 21.0 5.3 10.1 40.7 26.9 28.7 19.3 2 230.9 1 453.1 202 437 14 618 5 161 - 146 067 - 25 482 393 765
43.0 33.3 31.2 21.8 2 346.9 1 806.8 191.2 135.5 14 570.0 11 695.7 11.1 18.8 5.5 8.5 43.0 33.3 31.2 21.8 2 346.9 1 806.8 146 611 18 556 1 111 2 055 121 655 13 221 - 303 209
41.9 27.9 29.4 19.5 2 304.3 1 513.0 178.7 121.3 14 175.8 10 602.9 12.0 20.4 5.3 10.5 41.9 27.9 29.4 19.5 2 304.3 1 513.0 240 445 15 554 4 150 2 398 169 806 - 8 905 441 258
42.9 29.9 30.4 20.3 2 341.1 1 637.7 184.7 126.7 14 321.7 10 788.4 11.6 19.6 5.3 11.2 42.9 29.9 30.4 20.3 2 341.1 1 637.7 216 258 17 852 1 894 3 356 119 369 6 713 - 365 442
43.2 31.8 31.3 20.8 2 392.3 1 694.7 190.3 129.8 14 564.3 11 067.6 11.2 19.5 5.1 12.9 43.2 31.8 31.3 20.8 2 392.3 1 694.7 100 744 18 732 880 2 740 66 712 15 686 - 205 494
45.3 24.4 32.4 15.9 2 503.4 1 342.0 196.5 100.2 14 503.4 8 756.5 10.8 23.5 5.4 32.6 45.3 24.4 32.4 15.9 2 503.4 1 342.0 177 437 19 185 575 68 48 622 27 811 - 273 698
45.5 18.1 33.0 11.5 2 467.6 1 047.3 200.6 73.0 14 625.1 7 063.8 10.5 30.0 5.6 49.1 45.5 18.1 33.0 11.5 2 467.6 1 047.3 49 796 19 746 55 - 16 880 24 660 - 111 137
47.4 - 35.0 - 2 558.5 - 212.4 - 14 578.7 - 9.9 - 6.3 - 47.4 - 35.0 - 2 558.5 - 10 840 9 644 - - 2 488 9 453 - 32 425
42 28 30 20 2 275 1 552 182 123 14 186 10 556 11.6 20.6 5.7 10.9 42 28 30 20 2 275 1 552 6 391 470 333 637 70 686 308 798 9 413 522 190 088 570 879 17 279 080

NI 43-101 - Technical report Norra Kärr REE - 0465-RPT-014 Rev 1
Page 203
Figure 16-6 Norra Kärr – Pushbacks and Final Designs
Top Left – Pushback 1 (South Pit) and Fault zone, Top Right – Pushback 2 (North Pit) Bottom - Final
pit limits and fault zone.

NI 43-101 - Technical report Norra Kärr REE - 0465-RPT-014 Rev 1
Page 204
Figure 16-7 Norra Kärr – Final Design with Topography and E4 Highway
260m Blast Exclusion Zone shown around pit (Red), E4 Highway located to West of Pit.

NI 43-101 - Technical report Norra Kärr REE - 0465-RPT-014 Rev 1
Page 205
16.6 GEOTECHNICAL PARAMETERS
Key findings of the geotechnical assessment are summarised below. During operations, feedback
from trial slopes, and routine monitoring and mapping should be incorporated into design reviews to
assess whether the design matches predictions of geotechnical conditions on a bench or domain
scale. Modifications of slope geometry modification, or the provision of additional support or drainage
measures may be required to cater for the conditions encountered on site.
16.6.1 STEREOGRAPHIC ANALYSIS
The program Dips (version 6.0) was used for the analysis (Rocscience Inc.), the data analysed for
each design sector includes six orientated geotechnical holes completed in 2014, structural logging
from exploration holes, and surface mapping undertaken during the site visit. The logging data was
filtered for joints meeting a high level of confidence and open joints. The foliation has been noted as a
preferred weakness orientation; however, owing to the high strength ground mass the structure is
rarely open. All data was corrected using a Terzaghi weighting to account for the effects of drill hole
and mapping orientation bias.
The stereographic analysis (Table 16-8) checked for the nature of joint sets by lithology and found
that the structural discontinuities are persuasive through all units encountered, so will therefore be
used for the assessment, joint sets can be summarised below:
Joint Sets: Set 1 – Steep North (67°/355°)
Set 2 – Flat Set (08°/271°)
Set 3 – Shallow West (71°/282°)
Table 16-8: Sector Stereographic Analysis
Slope Sector (Azimuth) Planar Failure Wedge Failure Toppling Failure
North (000°) None None Yes (Set 1)
North-East (045°) None None None
East (090°) Yes (Set 3) None Risk (Set 3)
South-East (135°) None Yes (Set 1 + 3) None
South (180°) Yes (Set 1) Risk (Set 1 + 3) None
South-West (225°) None None None
West (270°) None None Yes (Set 3)
North-West (315°) None None Yes (Intersection Set 1+3)
16.6.2 SLOPE ANGLE CONFIGURATION SUMMARY
Based on the kinematic analysis the configurations detailed in Table 16-9 are shown by pit sector and
bench height, IRA assumes a resulting bench stack.
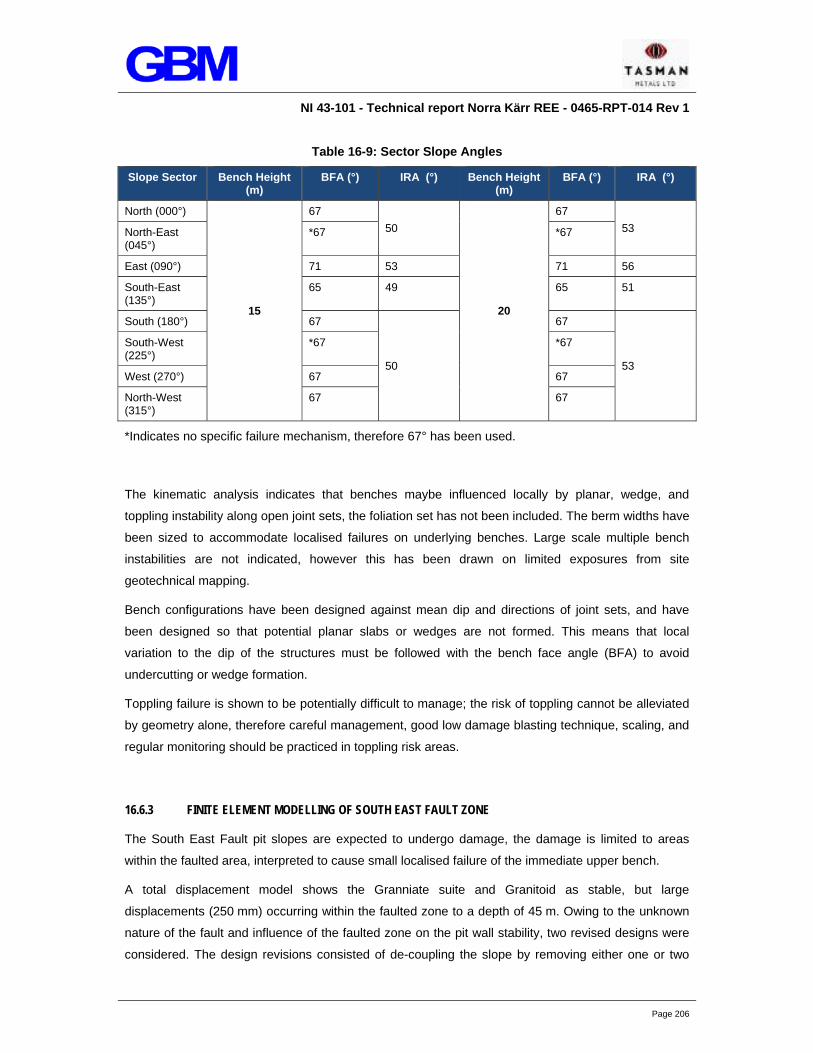
NI 43-101 - Technical report Norra Kärr REE - 0465-RPT-014 Rev 1
Page 206
Table 16-9: Sector Slope Angles
Slope Sector Bench Height (m)
BFA (°) IRA (°) Bench Height (m)
BFA (°) IRA (°)
North (000°)
15
67
50
20
67
53 North-East (045°)
*67 *67
East (090°) 71 53 71 56
South-East (135°)
65 49 65 51
South (180°) 67
50
67
53
South-West (225°)
*67 *67
West (270°) 67 67
North-West (315°)
67 67
*Indicates no specific failure mechanism, therefore 67° has been used.
The kinematic analysis indicates that benches maybe influenced locally by planar, wedge, and
toppling instability along open joint sets, the foliation set has not been included. The berm widths have
been sized to accommodate localised failures on underlying benches. Large scale multiple bench
instabilities are not indicated, however this has been drawn on limited exposures from site
geotechnical mapping.
Bench configurations have been designed against mean dip and directions of joint sets, and have
been designed so that potential planar slabs or wedges are not formed. This means that local
variation to the dip of the structures must be followed with the bench face angle (BFA) to avoid
undercutting or wedge formation.
Toppling failure is shown to be potentially difficult to manage; the risk of toppling cannot be alleviated
by geometry alone, therefore careful management, good low damage blasting technique, scaling, and
regular monitoring should be practiced in toppling risk areas.
16.6.3 FINITE ELEMENT MODELLING OF SOUTH EAST FAULT ZONE
The South East Fault pit slopes are expected to undergo damage, the damage is limited to areas
within the faulted area, interpreted to cause small localised failure of the immediate upper bench.
A total displacement model shows the Granniate suite and Granitoid as stable, but large
displacements (250 mm) occurring within the faulted zone to a depth of 45 m. Owing to the unknown
nature of the fault and influence of the faulted zone on the pit wall stability, two revised designs were
considered. The design revisions consisted of de-coupling the slope by removing either one or two

NI 43-101 - Technical report Norra Kärr REE - 0465-RPT-014 Rev 1
Page 207
benches and subsequent faulted material, thus reducing the impact of the fault material on the overall
slope.
Reviewing the results of the two designs, Design Two has increased SRF (FoS), minimal total
displacement and minimal depth of yielding within the fault system, making it a safer design option.
Figure 16-8 is a total displacement model of the two designs and Figure 16-9 models shear strain.
Critically, in Design Two total displacement and shear strain within the fault system is significantly
reduced, indicating that the system is far less stressed. It is important to note that the rock properties
are interpreted to be best estimates of the material rock mass properties and conclusions are drawn
from those properties. In light of the design results, Design Two is favourable owing to the minimised
stress that occurs around the fault zone and particularly around upper benches where the proximity to
the fault is much closer.

NI 43-101 - Technical report Norra Kärr REE - 0465-RPT-014 Rev 1
Page 208
Figure 16-8: Phase2 Models of Total Displacement of South East Fault Design 1 and 2
Designs shown at SRF 1.4, Yielded Elements (Symbols) shown with fixed displacement contour legends. Total displacement highlighted at bench mid-heights and within the fault.
Figure 16-9: Phase2 Models of Maximum Shear Strain of SE Fault Design 1 and 2,
Designs shown at SRF 1.4, Yielded Elements (Symbols) shown with fixed displacement contour legends. Maximum Shear Strain highlighted within modelled fault

NI 43-101 - Technical report Norra Kärr REE - 0465-RPT-014 Rev 1
Page 209
16.6.4 ROCK QUALITY DESIGNATION (RQD) MODEL OF OPTIMISED DESIGN
Using the results of the drilling programs, the optimised pit shell was coloured by RQD. The majority
of the pit shows excellent to very good conditions, there are isolated areas to the south-east, (South
East Fault) and west (Altered Zone) that reduce in rock quality from average to poor.
Figure 16-10: Optimised Pit Shell with Interpolated RQD on Shell Surface

NI 43-101 - Technical report Norra Kärr REE - 0465-RPT-014 Rev 1
Page 210
16.6.5 SURFICIAL GEOTECHNICS
The investigations have concentrated on identifying the geotechnical properties of the solid
strata. There are localised pond features on site and it is conceivable that deep deposits of saturated
peat and organic soils are present within the pond footprint. Dewatering and excavation of these
deposits may require special measures for stability. Should such deposits extend across the pit
slope, and be exposed in a bench face, additional permanent measures – such as buttressing and
drainage - may be needed for stability during operation. Further investigations are needed to
evaluate the implications on slope design of the superficial deposits.
16.7 OPEN PIT PUMPING REQUIREMENTS
A steady-state numerical groundwater model was constructed to estimate groundwater inflow to the
proposed open pit using the optimised design shells. Inflows were estimate for each of the designed
pushback years (10, 13, 15, 18, and 20), and for years 1, 5, and 8.
The model was constructed using data from Tasman, mine planning data from the WAI team,
information from the PEA hydrogeological study (20), and findings from the recent hydrogeological
investigation.
Inflows were predicted as detailed in Table 16-10.
Table 16-10: Predicted inflow rates
Year Inflow (m3/day) Inflow (L/s)
1 329.7 3.8
5 1 521.8 17.6
8 2 643.0 30.6
10 3 529.1 40.8
13 3 528.4 40.8
15 3 596.5 41.6
18 3 841.8 44.5
20 4 335.9 50.2
The water table will be intersected at approximately 200 m above ordnance datum. Inflows will be
managed using a pair of pumps located in sumps. One sump will be constructed in each of the
northern and southern pits.
16.7.1 PUMP DESIGN
The type of pump will be determined according to water management practices and sediment load.
For the purposes of calculating CAPEX and OPEX, it is assumed that there will be one standby and

NI 43-101 - Technical report Norra Kärr REE - 0465-RPT-014 Rev 1
Page 211
one operational pump in each sump and that sediment loads are minimal. A total of four pumps will be
required. The pump specification is shown in Table 16-11.
Table 16-11: Pump Specifications
Pump Capacity Cost (USD) Power Requirement (kWh)
Grundfos SP30 - 20 25 L/s at 180 m head 7 840 18.5
16.7.2 PIPEWORK DESIGN
Water will be removed from two sumps, one in each of the pits, via a floating submersible pump
connected to 200 mm heavy duty water hose. Hoses are anticipated to weigh approximately 30 kg/m
and connect to permanent fixed surface pipe-work located within 250 m of the pit sump. The location
of the sumps will change with time and the hose and pumps will have to be relocated using cranes.
Water will be delivered to surface with a maximum flow velocity of 1 m/s.
16.8 WASTE ROCK DUMPS
The total mine waste produced during the life of mine is approximately 17.3 Mt. Assuming the
material achieves a bulk density of 1.9 t/m3 when placed in the waste dump or when used for other
engineering purposes, this tonnage equates to a volume of 9.1 Mm3. Mine waste will be used for
construction of embankments at the tailings facility, ROM pad and haul roads around the mine site. A
mine waste storage facility will be required to store the remainder of the materials. Currently the
tailings embankment fill volume requirement for the life of mine is about 5.6 Mm3 additional to the
initial quantities needed for start-up (to be supplied by excavation within the tailings footprint area).
The volumetric storage requirement for the waste dump is therefore assumed to be in the region of 3
– 4 Mm3.
The selected location for mine waste storage is to the south-east of the orebody, as shown in Figure
16-11. The proposed layout adopts stand offs from the process plant site, main road, small stream
route, and open pit shell, and makes best use of the area in-between to accommodate mine waste.
The waste dump footprint does not overlap future potential extensions to the open pit shell.
The material generated during pre-stripping operations is likely to comprise a mixture of superficial
materials and weathered rock. Suitable pre-strip materials will be used to form access roads, the
ROM pad, and the initial waste dump toe berm and ditch and formation drains. Topsoil materials,
including other organic soils such as peat that may be encountered, will be stockpiled for future
restoration purposes.

NI 43-101 - Technical report Norra Kärr REE - 0465-RPT-014 Rev 1
Page 212
Figure 16-11: Proposed Mine Waste Dump Site
The layout attempts to minimise the number of properties affected by the facility and minimise the
visual impact.
Following removal of vegetation and any deleterious materials, and the installation of formation
drainage measures to cater for springs or drainage features, the waste dump will be filled from the
base upwards by end tipping in lifts. It is envisaged that mine waste for embankment building at the
tailings facility will be stockpiled on the waste dump, crushed and screened as required, and then
selected material will be transported separately to the tailings facility. A haul road will be constructed
between the mine waste dump and tailings storage area for this purpose. Surface run off from the
waste dump will be collected in a ditch and directed alongside the haul road to the storm water
collection pond. There will be a need for additional drainage measures during operation to manage
run off, and only the ditch arrangement on the eastern side of the waste dump footprint is shown.
The capacity of the waste dump is approximately 4 Mm3. The maximum height of the waste dump is
27 m, and the surface footprint is about 29 ha. It is possible to raise the dump further to
accommodate more material. Side slopes are shown at a gradient of 1(v) to 3(h), or equivalent to a
nominal restoration slope, but closure details have not yet been determined. A benched profile or
simple slope may be adopted at closure, with appropriate vegetation and drainage measures.

NI 43-101 - Technical report Norra Kärr REE - 0465-RPT-014 Rev 1
Page 213
SECTION 17 RECOVERY METHODS
The mineral processing and hydrometallurgical plant design was prepared based on the information
generated by the testwork conducted by WAI, JKTech, Geological Survey of Finland, Dorfner
ANZAPLAN and ANSTO Minerals as well as design experience provided by GBM. The process
design is preliminary in nature and subject to change based on ongoing and future testwork
programmes. The design philosophy for the process plant is a zero-liquid-discharge policy which
ensures the risk to the environment by means of water contamination is mitigated.
17.1 PROCESS DESCRIPTION
The process design criteria in Table 17-1 and Table 17-2 formed the operational basis for the process
flowsheet design.
Table 17-1 Process design criteria
Description Magnitude Unit
Process plant throughput - ore 1 150 kt/a
ROM TREO equivalent grade 0.6 %
Contained TREO 6 910 t/a
Recovered TREO 5 280 t/a
Process plant operation 24/7/365 -
Crushing mechanical availability 75 %
Grinding and beneficiation availability 91 %
Hydrometallurgy plant availability 91 %

NI 43-101 - Technical report Norra Kärr REE - 0465-RPT-014 Rev 1
Page 214
Table 17-2 REE Overall Recovery
Element Magnitude Unit
Y 72.92 %
La 77.84 %
Ce 78.02 %
Pr 78.82 %
Nd 79.01 %
Sm 79.42 %
Eu 79.44 %
Gd 79.32 %
Tb 79.13 %
Dy 78.78 %
Ho 78.00 %
Er 77.40 %
Tm 76.89 %
Yb 76.10 %
Lu 75.48 %
17.1.1 COMMINUTION AND MINERAL BENEFICIATION
The beneficiation process is shown schematically in Figure 17-1. An apron feeder will reclaim Run of
Mine (ROM) material from the ROM bin onto a vibrating grizzly screen. Oversize material reports to a
jaw crusher where the material is comminuted before recombining with the grizzly screen undersize
and fed to the secondary crushing screen. Similarly, oversize from the secondary crushing screen will
report to the secondary cone crusher where the material will be comminuted before reporting to the
tertiary crushing screen. Screen undersize from the secondary and tertiary screens will then be
transferred to the fine ore bin. Oversize material from the tertiary crushing screen will report to a
tertiary crusher where it will be comminuted before being recycled to the tertiary crushing screen for
classification. All material transfers between process units will be by conveyors.
Discharge from the fine ore bin will be delivered for primary grinding, via a conveyor, to an open
circuit rod mill. Rod mill discharge will be screened with the oversize reporting to a tower mill for
secondary grinding. Tower mill discharge is combined with rod mill discharge and classified over the
same screen in a closed circuit.
Undersize from the mill screen will be fed to a low intensity magnetic separator to remove any
residual grinding media, before reporting to a wet high gradient magnetic separator. The magnetic
separator will produce two product streams:
the magnetic concentrate enriched in aegirine and eudialyte; and
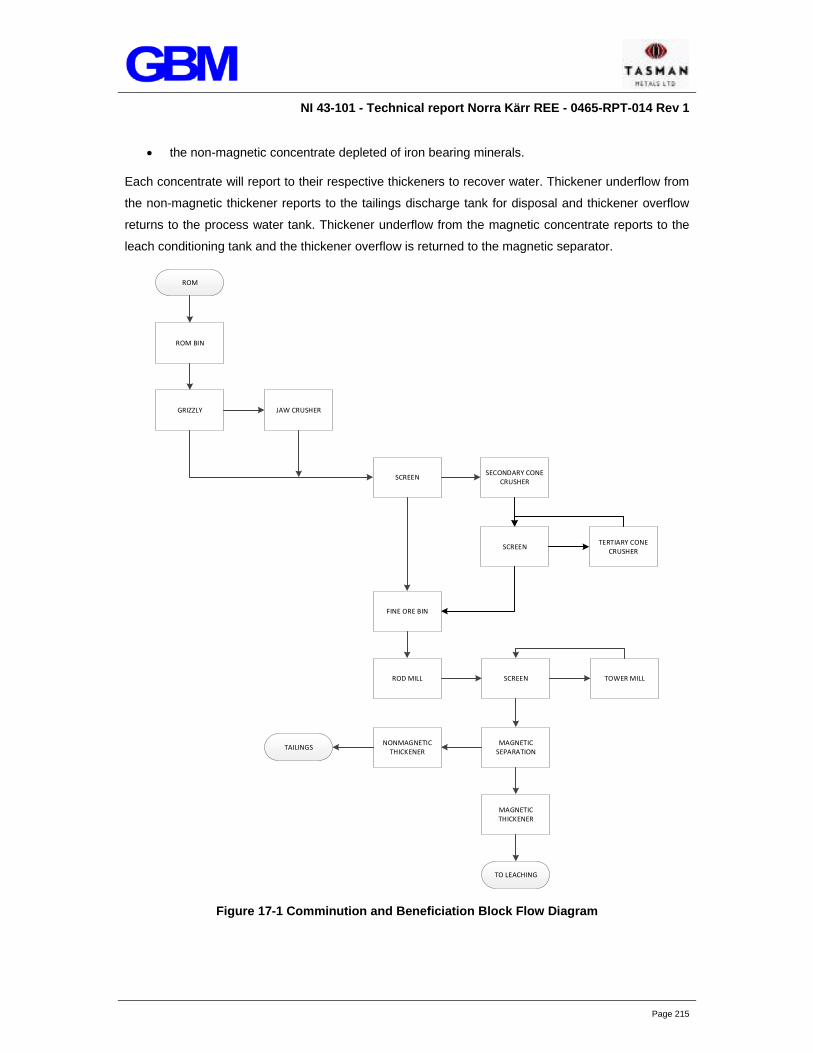
NI 43-101 - Technical report Norra Kärr REE - 0465-RPT-014 Rev 1
Page 215
the non-magnetic concentrate depleted of iron bearing minerals.
Each concentrate will report to their respective thickeners to recover water. Thickener underflow from
the non-magnetic thickener reports to the tailings discharge tank for disposal and thickener overflow
returns to the process water tank. Thickener underflow from the magnetic concentrate reports to the
leach conditioning tank and the thickener overflow is returned to the magnetic separator.
ROM
ROM BIN
GRIZZLY
FINE ORE BIN
JAW CRUSHER
SCREENSECONDARY CONE
CRUSHER
ROD MILL SCREEN TOWER MILL
MAGNETIC SEPARATION
MAGNETIC THICKENER
NONMAGNETIC THICKENER
TAILINGS
TO LEACHING
SCREENTERTIARY CONE
CRUSHER
Figure 17-1 Comminution and Beneficiation Block Flow Diagram

NI 43-101 - Technical report Norra Kärr REE - 0465-RPT-014 Rev 1
Page 216
17.1.2 HYDROMETALLURGICAL EXTRACTION AND RECOVERY
The leaching process is shown schematically in Figure 17-2. Fresh sulfuric acid will be added to the
slurry in the leach conditioning tank. Additional sulfuric acid will be recycled from the solvent
extraction plant. In order to maintain the pH set-point sulfuric acid will be added in each of the leach
tanks.
After leaching, the pH of the solution will be raised through the addition of magnesium oxide. A pH
value is established in order to reject various impurities, which will be precipitated, allowing their
removal from the solution via thickening and filtration (filter cake reports to tailings tank). Following
impurity removal the temperature of the pregnant leach solution (PLS) is raised and the pH reduced,
using sulfuric acid, to enhance solvent extraction characteristics.
PLS will report to solvent extraction to recover the REE. Solution will be contacted with a suitable
solvent, into which the rare earths will preferentially exchange. The loaded organic solvent will then be
scrubbed with dilute sulfuric acid to remove most of the loaded impurities. The REE will be stripped
from the pregnant solvent using oxalic acid. The precipitate will then be removed by a combination of
centrifugation and filtration of the insoluble rare earth oxalates.
The REE oxalate filtercake is then dried and calcined in a calciner to produce a REE rich mixed oxide.
The oxide will then be cooled and packed in preparation for dispatch to a refinery for metals
separation.
Raffinate from solvent extraction will contain various dissolved metals, the concentration of which will
build up in the system when recycled. Ultimately, these dissolved species will interfere with the
recovery of rare earths if their concentration gets too high. As such, a portion of the waste water will
be sent for treatment, involving the addition of lime, nanofiltration, reverse osmosis (RO) and brine
evaporation. The gypsum sludge resulting from the addition of lime reports to the tailings discharge
tank for disposal. The neutralised effluent will then undergo a series of nanofiltration and reverse
osmosis stages producing a permeate (water) and a brine. The RO water reports back to the raw
water tank and the brine will then be further subjected to thermal evaporation to remove the contained
water to produce a solid salt residue (predominately magnesium and sodium sulfates) and a water
vapour condensate. The condensate reports back to the raw water tank and the salt is transported to
a licenced storage facility for long term management.

NI 43-101 - Technical report Norra Kärr REE - 0465-RPT-014 Rev 1
Page 217
LEACH CONDITIONER
LEACH
NEUTRALISATIONTHICKENERFILTER
SOLVENT EXTRACTION
STRIPPING CENTRIFUGE/FILTERWATER TREATMENT
GYPSUM/SALT RESIDUE
REO PRODUCT
SULFURIC ACID
SULFURIC ACID
MgO
MAGNETIC THICKENER UNDERFLOW
CALCINER
Figure 17-2: Hydrometallurgical Extraction and Recovery Block Flow Diagram
17.2 PROCESS PLANT INFRASTRUCTURE AND REAGENTS
17.2.1 REAGENTS
The principal reagents required in the process are sulfuric acid, magnesium oxide, lime, oxalic acid,
flocculant, primary amine solvent, iso-decanol (diluent) and Shellsol 2046.
Delivery of reagents will be every month for solids and every week for liquids. Sulfuric acid will be
received twice a week. With varying ore body characteristics, the reagent consumption may change
through the life of mine.
The three largest volumes of reagents consumed at the plant are sulfuric acid, magnesium oxide and
lime. The sulfuric acid will be supplied domestically by rail to the Tränas unloading facility at which
point it will be transferred to trucks and driven approximately 30 km to the project site. The
magnesium oxide will be supplied internationally from China and shipped to the Netherlands. From
the port the product will be transferred to rail and transported to the Tränas unloading facility. Lime will
be supplied domestically and trucked to the plant.
NI 43-101 - Technical report Norra Kärr REE - 0465-RPT-014 Rev 1
Page 218
All reagents will be made-up with raw water when and where required.
17.2.2 SERVICES AND UTILITIES
Raw water will be sourced from nearby Lake Vättern. The raw water will provide make up water into
the process; gland seal water, reagent make-up and potable water requirements.
Diesel fuel oil is to be stored on site in two separate facilities, one mine infrastructure facility which will
service the mining fleet and mobile equipment, and one process plant facility which will service the
boiler.
The site boiler plant will produce 10 bar steam and distribute at 2 bar for use in the process (solvent
extraction) and brine evaporation. The steam boiler plant will be fired via the combustion of diesel fuel
oil and the resulting condensate will returned to the boiler in a closed circuit.

NI 43-101 - Technical report Norra Kärr REE - 0465-RPT-014 Rev 1
Page 219
SECTION 18 PROJECT INFRASTRUCTURE
18.1 FACILITY LAYOUT
Figure 18-1 Plant and Infrastructure layout
18.2 ACCESS
The beneficiation and hydrometallurgy process site will be accessible from both the E4 and the
Tränas to Gränna road. Access to the site is by a bitumen road for some 3 km and 1 km respectively.
Roads that are local to the site and link key operating facilities shall be gravel roads.
18.3 BUILDINGS AND STRUCTURE
The buildings and infrastructure of the Nora Kärr site are summarised in Table 18-1 and depicted in
Figure 18-1.

NI 43-101 - Technical report Norra Kärr REE - 0465-RPT-014 Rev 1
Page 220
Table 18-1 Building and Structure Details of Nora Kärr process plant
PLANT INFRASTRUCTURE - BUILDINGS
Building Footprint (m²)
Description
Admin Building 1 075.64 Single storey, load bearing wall buildings with steel insulated sandwiched panel roofs and suspended ceiling, all necessary electrical, water supply sanitation facilities to suit for the purpose of the building, decorated with plaster and paints, ready to move. - H shaped, approximately 43.3 m x 12.7 m block connected with corridor to a next 13.7 m x 36.7 m block, 2.4 m minimum floor to ceiling height.
Plant Mess Hall 336.70 Single storey, load bearing wall buildings with steel insulated sandwiched panel roofs and suspended ceiling, all necessary electrical, water supply sanitation facilities to suit for the purpose of the building, decorated with plaster and paints, ready to move. - Single L type building with maximum dimension 13 m x 25.9 m, 2.4 m minimum floor to ceiling height.
Ablution Building
55.46 Single storey, load bearing wall buildings with steel insulated sandwiched panel roofs and suspended ceiling, all necessary electrical, water supply sanitation facilities to suit for the purpose of the building, all fixtures fixed, decorated with plaster and paints, ready to move. - Single block building with dimension 9.4 m x 5.9 m.
Plant Workshop & Warehouse
2 595.60 Single storey, portal framed or beam - column - Truss structured buildings with steel insulated sandwiched panel roofs, all necessary electrical, water supply sanitation facilities to suit for the purpose of the building, all fixtures fixed, decorated with plaster and paints, ready to move. - Main block building with dimension 25.2 m x 103 m, 10 MT overhead crane arrangement throughout (excluding crane but including crane girders) at 10 m level, approximately 12 m truss height, at least 12 roller shutter doors, with additional personnel doors etc. all complete plus an additional lean to annex attached (9 m x 45.5 m, 6 m truss height, with at least 3 roller shutters)
Security Office 32.50 Single storey, load bearing wall buildings with steel insulated sandwiched panel roofs and suspended ceiling, all necessary electrical, water supply sanitation facilities to suit for the purpose of the building, all fixtures fixed, decorated with plaster and paints, ready to move. - Single block building with dimension 5 m x 6.5 m.
Emergency services
656.19 Single storey, load bearing wall buildings with steel insulated sandwiched panel roofs and suspended ceiling, all necessary electrical, water supply sanitation facilities to suit for the purpose of the building, all fixtures fixed, decorated with plaster and paints, ready to move. - Single block building with dimension 20.7 m x 31.2 m.
Laboratory 656.88 Single storey, load bearing wall buildings with steel insulated sandwiched panel roofs and suspended ceiling, all necessary electrical, water supply sanitation facilities to suit for the purpose of the building, all fixtures fixed, decorated with plaster and paints, ready to move. - Single block building with dimension 13.6 m x 48.3 m.
Solvent Extraction Plant Building
4 410.00 Single storey, portal framed or beam - column - Truss structured buildings with steel insulated sandwiched panel roofs, all necessary electrical, water supply sanitation facilities to suit for the purpose of the building, all fixtures fixed, decorated with plaster and paints, ready to move. - Building with dimension 42 m x 105 m (with central posts for crane and roof support), 10 MT overhead crane arrangement throughout (excluding crane but including crane girders) at 8 m level, approximately 10 m truss height, at least 10 roller shutter doors, with additional personnel doors etc. all complete.

NI 43-101 - Technical report Norra Kärr REE - 0465-RPT-014 Rev 1
Page 221
PLANT INFRASTRUCTURE - BUILDINGS
Product Handling Building
1 115.68 Single storey, portal framed or beam - column - Truss structured buildings with single skin steel panel roofs, all necessary electrical, water supply sanitation facilities to suit for the purpose of the building, all fixtures fixed, decorated with plaster and paints, ready to move. - Building with dimension 30.4 m x 36.7 m, 5 MT overhead crane arrangement throughout (excluding crane but including crane girders) at 8 m level, approximately 10 m truss height, at least 2 roller shutter doors, with additional personnel doors etc. all complete.
Oxalic Acid Building
404.43 Single storey, portal framed or beam - column - Truss structured buildings with single skin steel panel roofs, all necessary electrical, water supply sanitation facilities to suit for the purpose of the building, all fixtures fixed, decorated with plaster and paints, ready to move. - Building with dimension 22.1 m x 18.3 m, 5 MT overhead crane arrangement throughout (excluding crane but including crane girders) at 8 m level, approximately 10 m truss height, at least 2 roller shutter doors, with additional personnel doors etc. all complete.
Boiler Building 60.00 Single storey, portal framed or beam - column - Truss structured buildings with steel insulated sandwiched panel roofs, all necessary electrical, water supply sanitation facilities to suit for the purpose of the building, all fixtures fixed, decorated with plaster and paints, ready to move. - Building with dimension 6 m x 10 m approximately 10 m truss height, at least 2 roller shutter doors, with additional personnel doors etc. all complete
Sulphuric Acid Building
145.92 Single storey, portal framed or beam - column - Truss structured buildings with steel insulated sandwiched panel roofs, all necessary electrical, water supply sanitation facilities to suit for the purpose of the building, all fixtures fixed, decorated with plaster and paints, ready to move. - Building with dimension 7.6 m x 19.2 m approximately 10 m truss height, at least 2 roller shutter doors, with additional personnel doors etc. all complete.
Magnesium Oxide Building
348.46 Single storey, portal framed or beam - column - Truss structured buildings with steel insulated sandwiched panel roofs, all necessary electrical, water supply sanitation facilities to suit for the purpose of the building, all fixtures fixed, decorated with plaster and paints, ready to move. - Building with dimension 13.1 m x 26.6 m approximately 10 m truss height, at least 2 roller shutter doors, with additional personnel doors etc. all complete.
Milling & Process Building
3 104.00 Single storey, portal framed or beam - column - Truss structured buildings with steel insulated sandwiched panel roofs, all necessary electrical, water supply sanitation facilities to suit for the purpose of the building, all fixtures fixed, decorated with plaster and paints, ready to move. - Main block building with dimension 32 m x 97 m, 25 MT overhead crane arrangement throughout (excluding crane but including crane girders) at 24.5 m level, approximately 27.1 m truss height, at least 5 roller shutter doors, with additional personnel doors etc. all complete.
Annex to Process Building
490.00 Single storey, portal framed or beam - column - Truss structured buildings with steel insulated sandwiched panel roofs, all necessary electrical, water supply sanitation facilities to suit for the purpose of the building, all fixtures fixed, decorated with plaster and paints, ready to move. - Annexed lean-to to Main Milling and Process building, with dimension 10 m x 49 m, approximately 13.1 m truss height, at least 2 roller shutter doors, with additional personnel doors etc. all complete.
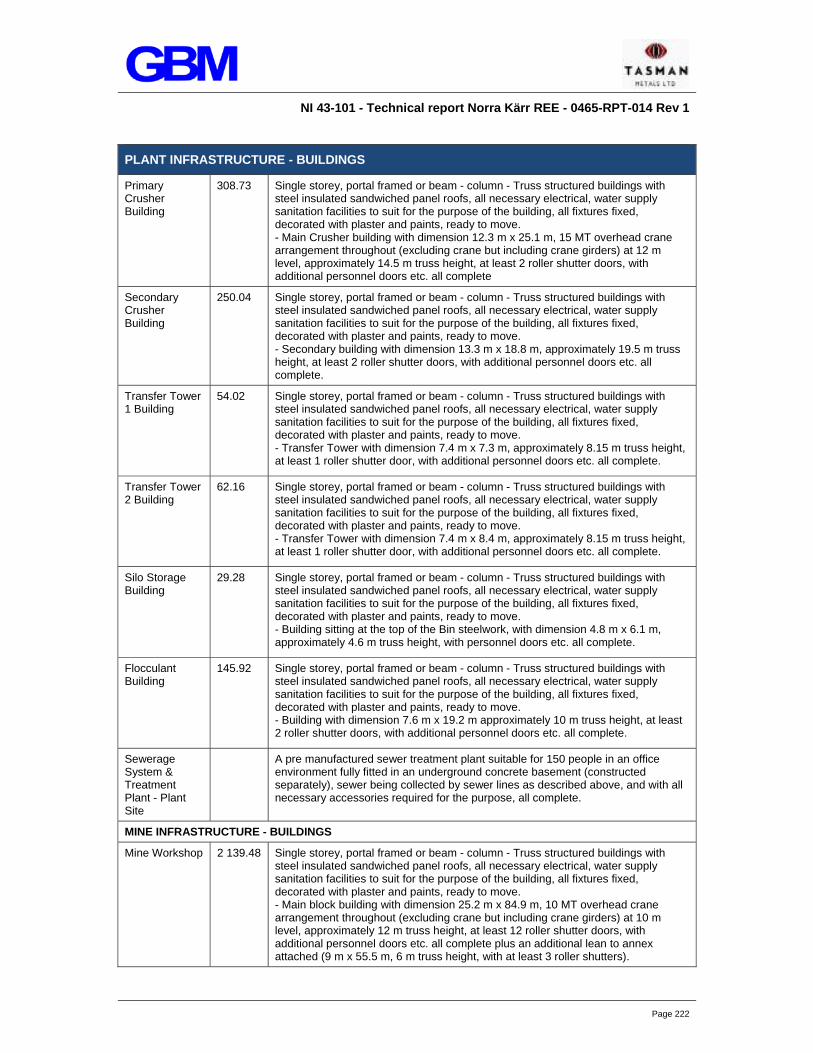
NI 43-101 - Technical report Norra Kärr REE - 0465-RPT-014 Rev 1
Page 222
PLANT INFRASTRUCTURE - BUILDINGS
Primary Crusher Building
308.73 Single storey, portal framed or beam - column - Truss structured buildings with steel insulated sandwiched panel roofs, all necessary electrical, water supply sanitation facilities to suit for the purpose of the building, all fixtures fixed, decorated with plaster and paints, ready to move. - Main Crusher building with dimension 12.3 m x 25.1 m, 15 MT overhead crane arrangement throughout (excluding crane but including crane girders) at 12 m level, approximately 14.5 m truss height, at least 2 roller shutter doors, with additional personnel doors etc. all complete
Secondary Crusher Building
250.04 Single storey, portal framed or beam - column - Truss structured buildings with steel insulated sandwiched panel roofs, all necessary electrical, water supply sanitation facilities to suit for the purpose of the building, all fixtures fixed, decorated with plaster and paints, ready to move. - Secondary building with dimension 13.3 m x 18.8 m, approximately 19.5 m truss height, at least 2 roller shutter doors, with additional personnel doors etc. all complete.
Transfer Tower 1 Building
54.02 Single storey, portal framed or beam - column - Truss structured buildings with steel insulated sandwiched panel roofs, all necessary electrical, water supply sanitation facilities to suit for the purpose of the building, all fixtures fixed, decorated with plaster and paints, ready to move. - Transfer Tower with dimension 7.4 m x 7.3 m, approximately 8.15 m truss height, at least 1 roller shutter door, with additional personnel doors etc. all complete.
Transfer Tower 2 Building
62.16 Single storey, portal framed or beam - column - Truss structured buildings with steel insulated sandwiched panel roofs, all necessary electrical, water supply sanitation facilities to suit for the purpose of the building, all fixtures fixed, decorated with plaster and paints, ready to move. - Transfer Tower with dimension 7.4 m x 8.4 m, approximately 8.15 m truss height, at least 1 roller shutter door, with additional personnel doors etc. all complete.
Silo Storage Building
29.28 Single storey, portal framed or beam - column - Truss structured buildings with steel insulated sandwiched panel roofs, all necessary electrical, water supply sanitation facilities to suit for the purpose of the building, all fixtures fixed, decorated with plaster and paints, ready to move. - Building sitting at the top of the Bin steelwork, with dimension 4.8 m x 6.1 m, approximately 4.6 m truss height, with personnel doors etc. all complete.
Flocculant Building
145.92 Single storey, portal framed or beam - column - Truss structured buildings with steel insulated sandwiched panel roofs, all necessary electrical, water supply sanitation facilities to suit for the purpose of the building, all fixtures fixed, decorated with plaster and paints, ready to move. - Building with dimension 7.6 m x 19.2 m approximately 10 m truss height, at least 2 roller shutter doors, with additional personnel doors etc. all complete.
Sewerage System & Treatment Plant - Plant Site
A pre manufactured sewer treatment plant suitable for 150 people in an office environment fully fitted in an underground concrete basement (constructed separately), sewer being collected by sewer lines as described above, and with all necessary accessories required for the purpose, all complete.
MINE INFRASTRUCTURE - BUILDINGS
Mine Workshop 2 139.48 Single storey, portal framed or beam - column - Truss structured buildings with steel insulated sandwiched panel roofs, all necessary electrical, water supply sanitation facilities to suit for the purpose of the building, all fixtures fixed, decorated with plaster and paints, ready to move. - Main block building with dimension 25.2 m x 84.9 m, 10 MT overhead crane arrangement throughout (excluding crane but including crane girders) at 10 m level, approximately 12 m truss height, at least 12 roller shutter doors, with additional personnel doors etc. all complete plus an additional lean to annex attached (9 m x 55.5 m, 6 m truss height, with at least 3 roller shutters).

NI 43-101 - Technical report Norra Kärr REE - 0465-RPT-014 Rev 1
Page 223
PLANT INFRASTRUCTURE - BUILDINGS
Fuel Farm Single storey, portal framed or beam - column - Truss structured buildings with steel single skin roof, typical for petrol pumps, all necessary electrical, water supply sanitation facilities to suit for the purpose of the building, all fixtures fixed, ready to use.
Mine Office 871.05 Single storey, load bearing wall buildings with steel insulated sandwiched panel roofs and suspended ceiling, all necessary electrical, water supply sanitation facilities to suit for the purpose of the building, decorated with plaster and paints, ready to move. - H shaped, approximately 32.8 m x 12.7 m block connected with corridor to a next 13.7 m x 31.5 m block, 2.4 m minimum floor to ceiling height.
Mine Mess Hall 284.70 Single storey, load bearing wall buildings with steel insulated sandwiched panel roofs and suspended ceiling, all necessary electrical, water supply sanitation facilities to suit for the purpose of the building, decorated with plaster and paints, ready to move. - Single L type building with maximum dimension 13 m x 21.9 m, 2.4 m minimum floor to ceiling height.
Sewerage System & Treatment Plant - Mine Site
A pre manufactured sewer treatment plant suitable for 250 people in an office environment fully fitted in an underground concrete basement (constructed separately), sewer being collected by sewer lines as described above, and with all necessary accessories required for the purpose, all complete.
18.4 TRANSPORTATION OF GOODS AND SERVICES
The Nora Kärr processing plant will consume a significant volume of reagents, and all will arrive by
truck. It was established that approximately 202 000 tonnes per annum of combined reagents will be
consumed, two thirds of which will arrive in the local area by rail. The unloading facility and rail
modifications have been designed and estimated by in-country consultants.
The labour force for the process and mine operations will not require housing on-site, due to the close
proximity of the local towns of Gränna, Tränas and Ödeshög.
18.5 POWER
The total Nora Kärr facilities will require three connections into the existing power network. The three
identifiable areas are:
Raw water pump station located at the bank of Lake Vättern;
Rail unloading station located at the Tränas industrial estate; and
Process plant and mining related infrastructure.
The process plant and mining related infrastructure require approximately 10 MW, this could be
sourced from the local wind farm, however due to peak load requirements during start-up this supply
is not suitable nor reliable. Electricity is to be supplied from east of the plant from the regional 40 kV

NI 43-101 - Technical report Norra Kärr REE - 0465-RPT-014 Rev 1
Page 224
line that runs from north to south. The battery limit for the supply is at the transformer local to the
process site. The capital costs for extension of overhead lines are built into the tariff costs per supply.
The power required at both the unloading facility and raw water pump station is minimal and limited
power lines will be required.
18.6 WATER
Approximately 100 m³/h of raw water is required at the process plant to account for losses of moisture
to product concentrate and tailings. The additional water will be sourced from Lake Vättern via a
pumping station at the lake edge. The pumping station is 3.8 km directly west of the process plant and
will operate continuously. The pipeline from the pumping station to the water storage tank at site is to
be installed below ground level.
18.7 TAILINGS FACILITY
18.7.1 SITE OPTIONS STUDY
The location of the project 2 Km east of Lake Vättern in a moderately populated region makes tailings
management an important and sensitive issue. In this area environmental and social considerations
have a strong influence on the choice of technical solution for the disposal and storage of tailings
generated by the project.
Initially for the PFS, fourteen potential sites for locating a tailings storage facility (TSF) were reviewed
in a Localisation Study (14) undertaken by Golder. The suitability of the candidate sites was assessed
utilising a series of evaluation criteria. Different sites within 10 km of the orebody were compared by
this means and ranked in terms of suitability based on environmental, technical and cost
considerations. Figure 18-2 shows the locations of the potential sites.

NI 43-101 - Technical report Norra Kärr REE - 0465-RPT-014 Rev 1
Page 225
Figure 18-2: Localisation Study TSF option sites
There is no single TSF site that stands out as being the best from all viewpoints. All the sites
assessed by the study are generally suitable, but the recommended sites that had the least number of
unsuitable scores (based on environmental, technical and cost factors) are located close to the
orebody. The siting study also considered three typical disposal methodologies, comprising slurry
disposal, paste or thickened tailings and dry stack disposal of a filter cake, as part of the evaluation
process. Of the recommended sites for slurry disposal, one incorporated a partial water cover and
slurry disposal methods (Site 12), and two were sites suitable for paste or thickened tailings disposal
in the form of sub-aerial deposition from a central location within the storage cell (Sites F and K).
The Localisation Study also contained the results of preliminary storage modelling (undertaken by
Tailings Consultants Scandinavia AB TCS) of the TSF sites. TCS also summarised the current best
practice for tailings disposal in Sweden.
Site selection is a fundamental starting point for the design of the TSF. The factors controlling the
selection of the optimum scheme for tailings storage are complex, and not all information is available
at this early stage in the project for informed judgement. The likely nature of the waste streams and

NI 43-101 - Technical report Norra Kärr REE - 0465-RPT-014 Rev 1
Page 226
the waste handling and transport options were assessed in a preliminary design study by WAI (15),
using the results and recommendations of the Localisation Study and information contained in the
PEA report (16). Concept designs, based on available process design criteria and assuming a 20 year
mine life, were prepared for slurry or paste or thickened tailings options.
18.7.2 DESIGN APPROACH
The recommended approach to tailings disposal is to combine the solid waste streams generated at
the process plant (beneficiation tailings, leach residue and gypsum sludge) into one tailings stream
and dispose of the material using sub-aerial methods into a single storage cell, which corresponds in
land take terms to part of Sites F and K identified by the Localisation Study.
The brine solution waste from reverse osmosis water treatment contained elevated sulfur, sulfate and
aluminium (17), which should not be discharged into water courses (18). The brine will not be
incorporated within the tailings stream because of the potential to cause environmental harm, and will
be further treated to form a solid waste and then disposed of offsite to landfill.
This thickened (segregating or non-segregating) approach, following a sub-aerial deposition method,
has the benefit of reducing the land take and minimising the risk of seepage. The construction costs
are likely to be less than with slurry disposal behind water storage dams. Other options are however,
still feasible and can be reviewed at a later stage with the benefit of further information, if necessary.
Risks associated with water management are considered to be most significant and the main aim of
the design approach is to provide a stable containment structure with minimal impacts on the
surrounding area.
The storage strategy is simple and aims to store supernatant water largely separately to tailings
solids, to dispose of excess water to the environment, to minimise seepage, and to maximise the
strength and density of the stored tailings solids for stability. The TSF comprises a single cell for the
storage of tailings solids, and downstream ponds for water clarification and handling of flood waters
Figure 18-3 shows the general layout of the tailings storage area and the reservoirs for handling and
storing excess water, which makes best use of the existing topography to minimise earthworks and
construction activities, and to direct all decant water away from Lake Vättern.

NI 43-101 - Technical report Norra Kärr REE - 0465-RPT-014 Rev 1
Page 227
Figure 18-3: Proposed Layout of TSF
Although the location selected for tailings storage will impact on existing properties the layout has
been designed to minimise that impact and help manage risks such as dust blow. The facility has
been designed to accommodate extreme meteorological events by designing for the probable
maximum flood, which minimises the risks associated with overtopping.
The design of the storage facility and associated water dams utilises mine waste where possible as
construction material. This approach not only minimises the size of waste dumps and the associated
environmental and health and safety risks, but also is a sustainable approach that maximises
recycling of waste for beneficial purposes and reduces the demand for local materials – with
consequently reduced risks associated with importing materials to site.
18.7.3 BACKGROUND
Land in the vicinity of the orebody is used for forestry and hunting. The topography of the general
area selected for tailings storage is undulating, and is dissected by small streams leading to small
lakes. The area contains extensive tracts of forested land. Surface levels rise to about 225 m AMSL
along a series of north-north-west trending ridges, falling to around 195 m AMSL in the intervening
valley areas. The catchment boundary between Lake Vättern and the Baltic drainage courses lies
across the area selected for tailings storage.

NI 43-101 - Technical report Norra Kärr REE - 0465-RPT-014 Rev 1
Page 228
It was not possible to undertake site investigations at the TSF site for the PFS due to land ownership
and access permission constraints. Information on the geology and ground conditions is inferred from
published information and a site walk over visit in June 2014 (19).
The geology comprises mixed outcrops of granite or boulder fields, and glacial till and glaciofluvial
deposits. There are localised peat deposits in the low lying areas, see Figure 18-4.
Figure 18-4: Geology of TSF site
The storage area contains outcrops of granite, or areas where granite lies close to surface beneath
superficial deposits, including extensive boulder fields. The solid granite strata appear to be relatively
fresh and unjointed at outcrop.
The glacial till is exposed in small excavations in this area, where it appears to comprise a silty or
sandy material (with numerous large boulders). There is a localised linear glaciofluvial deposit in the
northern part of the TSF, which is presumed to be an esker. Local exposures of laminated gravelly
sand were visible at the location of this feature.
There are major north-north-west trending drainage features at the TSF site, which could represent
zones of faulting or broken ground.
Peat Glacial coarse siltto fine sand
Glaciofluvial sediment
Thin or discontinuoussoil cover on rock
Till Rock

NI 43-101 - Technical report Norra Kärr REE - 0465-RPT-014 Rev 1
Page 229
The project site is located on an old and stable region of the earth’s crust, and is a low seismicity
area. Seismic activity in Sweden is not evenly distributed, and the south-east part of the country near
the project site is relatively inactive. According to published seismic hazard maps, the site lies in an
area where the Peak Ground Acceleration with a 10 % probability of exceedance in 50 years lies
between 0.2 and 0.4 m/s2.
Climatic factors affecting the design of the TSF have been collated into a separate report (20). The
TSF is located near the head of the local catchments, where flows into the storage area and
associated pond areas are at a minimum.
18.7.4 TAILINGS PROPERTIES
The approach to tailings disposal is to combine the solid waste streams generated at the process
plant (beneficiation tailings, leach residue and gypsum sludge) into one tailings stream and dispose of
the material using sub-aerial methods into a single storage cell. It is considered, based on available
information, that the geochemistry of the combined waste stream would not present an environmental
hazard, although further testwork is needed to confirm this assumption and to identify the
geochemical and geotechnical characteristics of the combined waste stream.
A small sample of beneficiation tailings was available for testing, but no samples of leach residue or
gypsum sludge were available. It was decided to undertake limited geotechnical testwork on the
sample of beneficiation tailings to add to the bank of knowledge. The geotechnical testing comprised
the determination of specific gravity, plasticity, particle size distribution, and undertaking oedometer
consolidation testing and multistage undrained triaxial testing with pore water pressure
measurements.
The beneficiation tailings comprise the greatest proportion of the tailings waste stream. The effect of
including leach residue and gypsum sludge materials on the geotechnical properties of the waste
stream are speculative, but could result in an increase in the fines content, with consequential
implications for consolidation, permeability and pore pressure response of the combined material
under loading, in comparison to the test results.
The results of the geotechnical testing on the beneficiation tailings are summarised below, and
compared with the results of metallurgical testwork on similar samples.
The specific gravity was determined following procedures set out in BS1377: Part 2: 1990 (21) and
recorded a value of 2.02. However, previous metallurgical testing estimated a value of 2.56 for the
beneficiation tailings. There is no obvious explanation for the difference in test results. The value
proposed for the combined tailings waste stream is 2.65 (21), which has been adopted for the tailings
design work.
The particle size distribution was determined and recorded a significantly coarser material than
determined by previous metallurgical testing. There is no obvious explanation for the difference in
NI 43-101 - Technical report Norra Kärr REE - 0465-RPT-014 Rev 1
Page 230
test results. The metallurgical testing results have been adopted for design; using the metallurgical
test results the tailings would classify as a uniformly graded medium – coarse silt-size material (P80 is
60 micron, and P10 is 10 micron), rather than a gap graded sandy silt with a P80 of about 150 micron,
and P10 of 3.5 micron. It is conceivable that the P10 size may be lower for the combined waste
materials due to the gypsum precipitate.
The beneficiation tailings material is non-plastic. This is considered unlikely to change for the
combined waste stream.
Consolidation and undrained triaxial tests were undertaken on the beneficiation tailing sample at an
initial voids ratio of about unity, and the results were interpreted using a specific gravity (SG) of 2.65.
Testing identified that:
the final dry density recorded by consolidation testing is 1.36 Mg/m3, which is assumed to be
representative of the combined waste stream;
the permeability of the material (as determined from the consolidation test results) is low at
10-10 to 10-11 m/s – however, these values are inconsistent with the likely permeability
estimated using Hazen’s rule and the particle size distribution, from which a permeability
value of 10-7 m/s would be inferred;
the coefficient of volume compressibility is between 0.06 and 0.21 m2/MN under the
anticipated loadings, which again is considered representative for the combined waste
stream; and
effective stress parameters of c’ = 9 kPa and phi’ = 39o apply to the drained condition, which
may be high for the combined waste stream when gypsum is introduced to the waste stream.
Although the Tasman test results have been adopted for design purposes, the uncertainties regarding
specific gravity have been catered for by including a contingency storage allowance and the
uncertainties in particle size distribution by adopting more conservative overall beach angles than
initially envisaged for storage analysis.
18.7.5 DESIGN CRITERIA
The design parameters are based on the current mass and liquid balance and assume:
production of a combined tailings solids throughput of 155 tph, or say 1.24 Mtpa at 7 972 h
(annual operating hours);
a 20 year life of mine;
tailings solids content of about 63 %;
o tailings dry density = 1.36 t/m3 (weight of solids / total weight); and
24.8 Mt = 18.0 Mm3 of tailings storage requirement.
The waste stream parameters are summarised in Table 18-2.
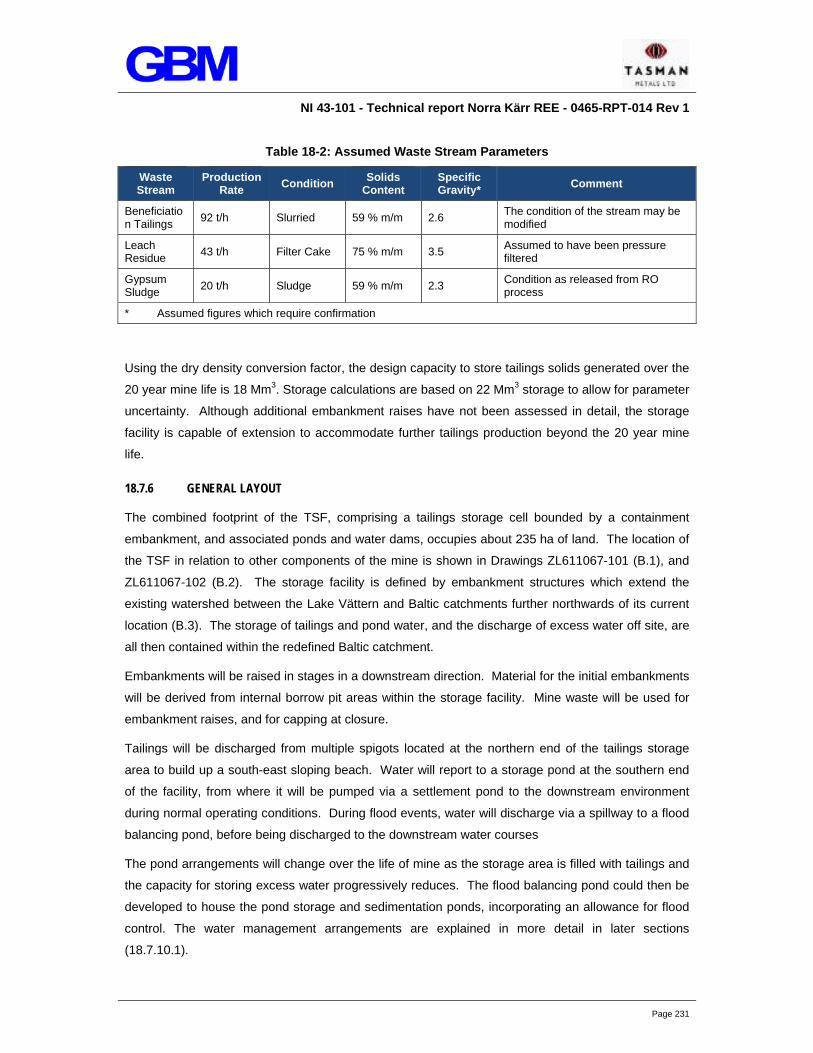
NI 43-101 - Technical report Norra Kärr REE - 0465-RPT-014 Rev 1
Page 231
Table 18-2: Assumed Waste Stream Parameters
Waste Stream
Production Rate Condition Solids
Content Specific Gravity* Comment
Beneficiation Tailings
92 t/h Slurried 59 % m/m 2.6 The condition of the stream may be modified
Leach Residue 43 t/h Filter Cake 75 % m/m 3.5 Assumed to have been pressure
filtered
Gypsum Sludge 20 t/h Sludge 59 % m/m 2.3 Condition as released from RO
process
* Assumed figures which require confirmation
Using the dry density conversion factor, the design capacity to store tailings solids generated over the
20 year mine life is 18 Mm3. Storage calculations are based on 22 Mm3 storage to allow for parameter
uncertainty. Although additional embankment raises have not been assessed in detail, the storage
facility is capable of extension to accommodate further tailings production beyond the 20 year mine
life.
18.7.6 GENERAL LAYOUT
The combined footprint of the TSF, comprising a tailings storage cell bounded by a containment
embankment, and associated ponds and water dams, occupies about 235 ha of land. The location of
the TSF in relation to other components of the mine is shown in Drawings ZL611067-101 (B.1), and
ZL611067-102 (B.2). The storage facility is defined by embankment structures which extend the
existing watershed between the Lake Vättern and Baltic catchments further northwards of its current
location (B.3). The storage of tailings and pond water, and the discharge of excess water off site, are
all then contained within the redefined Baltic catchment.
Embankments will be raised in stages in a downstream direction. Material for the initial embankments
will be derived from internal borrow pit areas within the storage facility. Mine waste will be used for
embankment raises, and for capping at closure.
Tailings will be discharged from multiple spigots located at the northern end of the tailings storage
area to build up a south-east sloping beach. Water will report to a storage pond at the southern end
of the facility, from where it will be pumped via a settlement pond to the downstream environment
during normal operating conditions. During flood events, water will discharge via a spillway to a flood
balancing pond, before being discharged to the downstream water courses
The pond arrangements will change over the life of mine as the storage area is filled with tailings and
the capacity for storing excess water progressively reduces. The flood balancing pond could then be
developed to house the pond storage and sedimentation ponds, incorporating an allowance for flood
control. The water management arrangements are explained in more detail in later sections
(18.7.10.1).

NI 43-101 - Technical report Norra Kärr REE - 0465-RPT-014 Rev 1
Page 232
The embankment section for the tailings containment embankment comprises an upstream sloping
core of glacial till separated from a downstream engineered rockfill shell by a filter layer. The
upstream core is keyed into the natural formation for seepage control. Water dams will be constructed
using engineered rockfill. Seepage control will be provided by a layer of asphaltic concrete placed
over a filter layer on the upstream face, a grout curtain below the upstream toe, and a basal drainage
layer across the downstream shell.
The embankment sections take into account the engineering functions of the structures, and the
availability of materials on site – especially the lack of any clay materials identified on site as yet. The
design is relatively simple to construct, with the only specialist input being the grouting and asphaltic
concrete requirement.
Geotechnical and hydrogeological site investigations will be needed to confirm the design
assumptions and further hydrological studies will be needed to confirm the spillway details.
18.7.7 CONSTRUCTION STRATEGY
Embankment construction will be undertaken in stages to suit the mine operation requirements.
Waste material is not generated from the open pit during the development stage of the project, so
material for construction will be derived from an internal borrow pit in the area of tailings storage. This
allows for the storage area to be developed to suit storage of tailings, and in particular to develop a
fall across the tailings storage area that suits the beaching characteristics of the tailings.
For preliminary design purposes, the overall tailings beach is assumed to be a gradient of 1:80 (V:H),
and the storage formation has been graded to allow the tailings to beach and water to flow
southwards to the pond storage area behind Dam 1. The tailings containment embankment, and
Dams 1 and 2 will be constructed during the mine development stage.
It should be noted that the tailings containment embankment is not a water-retaining structure, and
the crest falls away from a high point at the northern end of the facility. It is proposed to raise the
tailings containment embankment in two main stages utilising downstream construction methods. In
the second construction stage, Dams 3 to 5 will be constructed along with a new spillway structure. In
the third stage, Dam 1 will be raised.
The approximate total earthworks quantities are summarised in Table 18-3. The earthworks
quantities relate to all of the components of the TSF, including the containment embankment and the
water dams.
Table 18-3: Approximate earthworks quantities for TSF construction
Earthworks Stage 1 (Mm3) Stage 2 (Mm3) Stage 3 (Mm3)
Excavation 0.84 0.30 0.19
Filling 0.66 1.59 3.16

NI 43-101 - Technical report Norra Kärr REE - 0465-RPT-014 Rev 1
Page 233
Excess material generated in Stage 1 would be used in Stage 2 or would be stockpiled separately for
final restoration.
It is conceivable that an upstream construction strategy could be adopted for the tailings containment
embankment structure. The possibility of upstream embankment raising should be evaluated at
subsequent design stages when more information is available.
18.7.8 PRINCIPAL TSF STORAGE PARAMETERS
The tailings storage area has been modelled using RiftTD, proprietary tailings design software, and
storage elevation curves that characterise the facility have been generated. Variations in tailings
beach gradient, as well as SG and densities, could result in significant changes to the storage
characteristics of the TSF, but for this preliminary design a reasonably conservative beach gradient of
1 in 80 has been adopted. The beach gradient could potentially vary between about 1 in 50 and 1 in
150.
The principal dimensions of the TSF are summarised in Table 18-4.
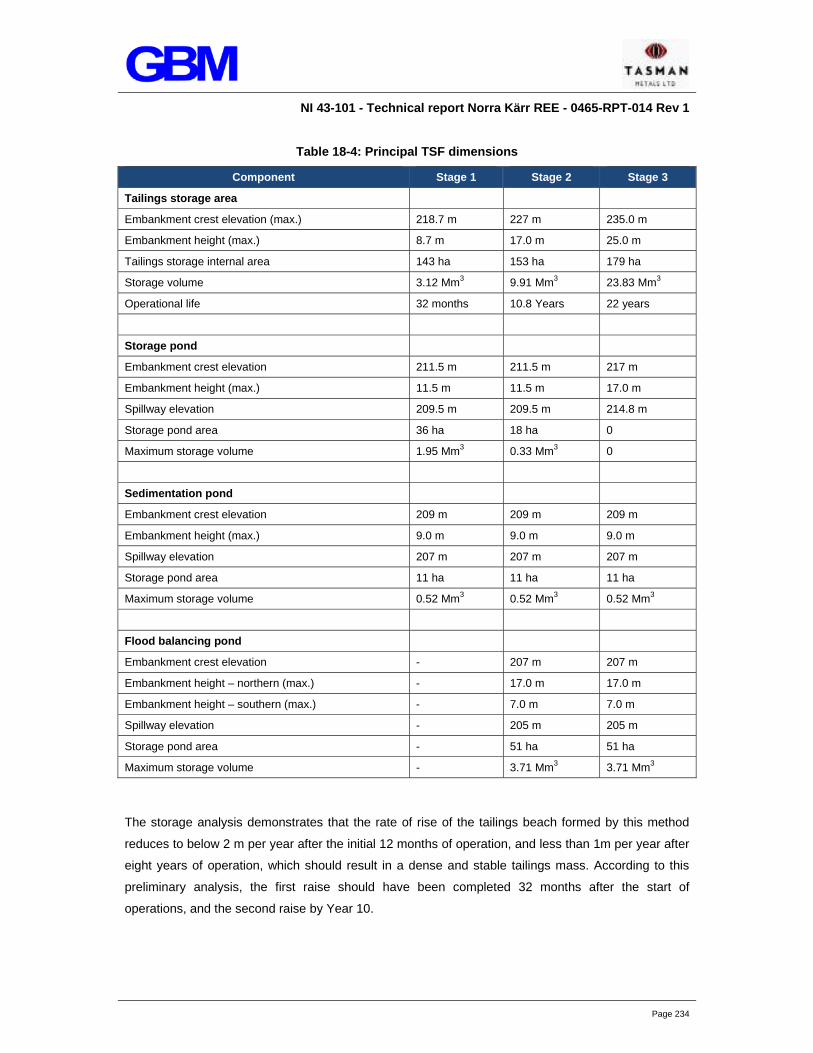
NI 43-101 - Technical report Norra Kärr REE - 0465-RPT-014 Rev 1
Page 234
Table 18-4: Principal TSF dimensions
Component Stage 1 Stage 2 Stage 3
Tailings storage area
Embankment crest elevation (max.) 218.7 m 227 m 235.0 m
Embankment height (max.) 8.7 m 17.0 m 25.0 m
Tailings storage internal area 143 ha 153 ha 179 ha
Storage volume 3.12 Mm3 9.91 Mm3 23.83 Mm3
Operational life 32 months 10.8 Years 22 years
Storage pond
Embankment crest elevation 211.5 m 211.5 m 217 m
Embankment height (max.) 11.5 m 11.5 m 17.0 m
Spillway elevation 209.5 m 209.5 m 214.8 m
Storage pond area 36 ha 18 ha 0
Maximum storage volume 1.95 Mm3 0.33 Mm3 0
Sedimentation pond
Embankment crest elevation 209 m 209 m 209 m
Embankment height (max.) 9.0 m 9.0 m 9.0 m
Spillway elevation 207 m 207 m 207 m
Storage pond area 11 ha 11 ha 11 ha
Maximum storage volume 0.52 Mm3 0.52 Mm3 0.52 Mm3
Flood balancing pond
Embankment crest elevation - 207 m 207 m
Embankment height – northern (max.) - 17.0 m 17.0 m
Embankment height – southern (max.) - 7.0 m 7.0 m
Spillway elevation - 205 m 205 m
Storage pond area - 51 ha 51 ha
Maximum storage volume - 3.71 Mm3 3.71 Mm3
The storage analysis demonstrates that the rate of rise of the tailings beach formed by this method
reduces to below 2 m per year after the initial 12 months of operation, and less than 1m per year after
eight years of operation, which should result in a dense and stable tailings mass. According to this
preliminary analysis, the first raise should have been completed 32 months after the start of
operations, and the second raise by Year 10.

NI 43-101 - Technical report Norra Kärr REE - 0465-RPT-014 Rev 1
Page 235
18.7.9 TAILINGS DEPOSITION
The tailings storage will be operated as a sub-aerial storage for the following reasons:
To avoid storing water against the embankments and thereby simplify the embankment design.
To reduce the head of any leachate on the liner and minimise impact on the liner. To maximise the strength and density of the tailings and reduce the risk of liquefaction, and
increase storage.
Tailings will be discharged as a slurry from the northern end of the facility. The delivery pipeline will be
routed around the northern section of the embankment structure, and tailings discharged from
multiple spigots so that the material can accumulate across the main storage area. Tailings discharge
will be cycled to form a uniform beach falling generally southwards and allowing supernatant water to
flow to Pond 1 away from the containment embankments.
The spigot offtakes on the distribution pipeline will be fitted with short lengths of flexible hose which
will be used to lead the tailings slurry into lengths of drilled PVC which will take the slurry to the base
of the embankments. The PVC pipes will be progressively buried by the slurry as the tailings beach
level rises. Simple clamps will be used to open and close the spigot offtakes.
The tailings delivery will be alternated over the beach areas such that the level of the tailings adjacent
to the embankments will be maintained approximately level. As each area of tailings beach is rested,
the tailings will drain and subsequently air dry. The regular rotation of the tailings around the storage
will ensure that the entire mass will attain the highest possible density.
The beaching of the tailings from the embankment will form a sloping surface. As the tailings solids
settle out, the water that accompanies the tailings will flow towards Pond 1 (see Section 18.7.10).
The embankment will be raised in stages to maintain a minimum of 500 mm operational freeboard
over the deposited tailings.
18.7.10 WATER MANAGEMENT
18.7.10.1 GENERAL ARRANGEMENT
Water management has been addressed in a separate report (20), which identifies the spillway
design requirements for the TSF.
During the early years of operation, water accumulating in the tailings storage impoundment area will
report to Pond 1. Flood waters will be directed via a spillway at Dam 1 to Pond 2. During normal
operational conditions, water in Pond 1 will be pumped to Pond 2 for clarification before being
discharged via a spillway in Dam 2 to the downstream environment. Only Dams 1 and 2 (as well as
the main containment embankment) will have been built at start up. With time, tailings deposited into
the TSF will encroach into Pond 1, and reduce its capacity. Pond 3 will be created before 32 months
of operation by the construction.
NI 43-101 - Technical report Norra Kärr REE - 0465-RPT-014 Rev 1
Page 236
With time, tailings deposited into the TSF will encroach into Pond 1 and reduce its capacity. Pond 3
will be created by the construction of Dams 3 to 5, and a spillway channel will be constructed to
connect Pond 1 to Pond 3. Pond 3 operates as a flood water retention pond, leaving Pond 2 as the
clarification water pond.
Dam 2 will be raised after about 10 years of operation to provide additional capacity for the tailings
water storage basin. The spillway channel will be raised at the same time. Ultimately, Pond 3 will
need to function as a tailings water storage basin as well as provide flood water retention capacity.
Surface water does not accumulate behind the main tailings containment embankment, and the
embankment is not designed to store water over the long term. The purpose of the main
containment’s embankment is to provide a platform for the discharge of tailings into the storage area
and a stable, limiting buttress to the tailings materials.
18.7.11 DECANT OF EXCESS WATER
Because the TSF will not be used for supply purposes the maintenance of water storage is not
required. Also, it is desirable from a dam safety and operational perspective to minimise the amount
of water held within the storage basin and tailings. Therefore, discharge of excess water will be
required from the TSF to the downstream watercourse.
At this stage of the study specific environmental controls on the quantity of water that can be, and
should be, released have not been established. Such controls will constrain the magnitude and
possibly the frequency/seasonal pattern of flows to minimise impacts on downstream aquatic habitats,
channel morphology and flood risk. These controls will also set a minimum release for the purposes
of meeting in-stream flow requirements in compensation for the capture of upstream catchment runoff
behind the storage embankment of the TSF.
A pragmatic approach to the specification of releases has been adopted for the time being. Based on
the 1999 – 2012 meteorological record the seasonal flow variation in the catchment is variable and
does not necessarily reflect a pattern of higher flows in the winter months and drier conditions during
the summer. The restriction of releases to only the winter months of the year has been made on the
basis of perceived environmental constraints.
The magnitude of release has been established by a desire to minimise uncontrolled overflows from
the TSF to an annual frequency of less than 1 in 50 years. Should a requirement for all-year round
releases be required, as may be necessary, this would increase the annual volume.

NI 43-101 - Technical report Norra Kärr REE - 0465-RPT-014 Rev 1
Page 237
SECTION 19 MARKET STUDIES AND CONTRACTS
19.1 OVERVIEW OF RARE EARTH ELEMENTS AND PRODUCTS
Rare earth elements refer to the fifteen lanthanides (atomic numbers 57 to 71) plus scandium (21)
and yttrium (39). They are typically classified into two groups, light (La - Sm) and heavy (Eu - Lu plus
Y), although sometimes there is a medium group (Sm - Gd). However, because the elements are
chemically similar, often occur together, and are found in a variety of mineralogies, the ability to
economically mine, process and recover the elements is rare. For the past 25 years China has
dominated the mining and processing of REEs.
Mineralogy is a key driver in determining the economics of rare earth deposits. Historically (and as a
generalisation), REEs are found in carbonates (Bastnaesite, LREE), oxides (Loraprite and
Fergusonite, both LREE and HREE), phosphates (Monazite/Apatite, LREE; Xenotime, HREE) and
complex silicates (Eudialyte, Allanite, Britholite, both LREE and HREE).
REE products come in many formats, which depend on the original mineralogy and REO distribution,
as well as the level of processing. Rare earths can be sold as mineral concentrates from the mine,
mixed chemical concentrates (chlorides/carbonates), mixed oxides (didymium - Nd/Pr), separated
oxides (in a range of purity levels), mischmetal, metal (in a range of purity levels), alloys and powders.
REOs (typically 99.9 %) are the most common product reported.
19.2 RARE EARTH ELEMENT PRODUCTION AND SUPPLY FORECAST
World production of total REOs in 2013 is estimated at approximately 119 000 t with China
dominating global rare earth mining and upstream processing. Approximately 90 % of REEs are
sourced (mined) in China; however, it is estimated that China produces ~90 % of the LREEs and
~99 % of the HREEs due to its domination in mid-stream processing (metals/alloys/powders). Light
rare earth production outside of China is starting to increase, notably with the ramp up of Molycorp’s
Mountain Pass and Lynas’ Mt. Weld facilities (USA and Australia). Table 19-1, Table 19-2
summarizes REE mining production by country over the past five years and breaks down 2013 global
REO production by element. Note that separation of oxides does not always take place at the mine
site or in the same country. Furthermore, Chinese production is difficult to estimate due to illegal
activity.

NI 43-101 - Technical report Norra Kärr REE - 0465-RPT-014 Rev 1
Page 238
Table 19-1: Global Rare Earth Production by Country (t)
Country 2009 2010 2011 2012 2013
China 129 000 130 000 120 000 110 000 107 000
United States - - - 800 4 000
India 2 700 2 800 2 800 2 900 2 900
Russia - - - 2 400 2 400
Australia - - 2 200 3 200 2 000
Vietnam - - - 220 220
Brazil 550 550 250 140 140
Malaysia 350 30 280 100 100
Total 132 600 133 380 125 530 119 760 118 760
Source: USGS, industry sources
Table 19-2: 2013 REE Production
Element 2013 Production %
Ce 43.35
La 27.94
Nd 15.30
Pr 4.68
Sm 1.63
Eu 0.22
Gd 1.15
Tb 0.13
Dy 0.62
Y 4.15
Lu 0.04
Other 0.80
Source: Journal of Rare Earths (January2011, Chen); IMCOA; Chinese Society of Rare Earths; Company Reports; USGS
China has imposed increasingly restrictive export quotas REE’s since 2005 in order to ensure that
domestic demand is met internally and to facilitate the shift of downstream production into China. As
a result, a two tiered pricing system exists for rare earth products (FOB and inside China). In the
second half of 2010, the total export quota (for domestic and JV producers) was down 72 % year on
year, which resulted in a 2010 export quota of 30 258 t (-40 % year on year). This significant
reduction in Chinese exports (which consequently sent prices to unprecedented highs in 2011) was
followed by an additional 35 % reduction in export quota in the first half of 2011. Since 2010, the
export quota has remained ~30 000 – 31 000 t. In 2014, the Chinese export quota has been set at

NI 43-101 - Technical report Norra Kärr REE - 0465-RPT-014 Rev 1
Page 239
30 611 t. Given the recent WTO ruling against China, it is anticipated that the quotas will eventually
be eliminated. The recent establishment of the Baotou Rare Earths Exchange and talk of rare earth
futures on the Shanghai exchange also indicates an eventual move to one global pricing system.
China continues to consolidate and streamline its rare earth industry, which is divided into three
regions:
Northern District/Inner Mongolia (LREE, home to Bayan Obo);
Western District/Sichuan (LREE); and
Southern District/Guangdong, Jiangxi, Hunan, Yunnan, Guangxi and Fujian (HREE).
Consolidation started in 2011 and in January 2014, (Ministry of Industry and Information Technology
of the Chinese government) MIIT presented a plan for the formation of a rare earth ‘group’ that
consisted of six companies who are responsible for 85 % of rare earth production in China.
Companies include Baogang Group (Inner Mongolia and Gansu province), CHINALCO (Guangxi,
Jianxu, Sichuan and Shandong), Xiamen Tungsten Group (Fuijan), Minmetals (Hunan, Fuijan,
Guangdong, Yunnan, Jiangxi), Guangdong Rising Nonferrous Group (Guangdong), and Ganzhou
Mining Group (Jiangxi). There are a number of initiatives in place that support this streamlining
including increased monitoring of production quotas at mines and recycling facilities, as well as
stockpiling initiatives.
China is expected to remain dominant in global rare earth production and supply. China’s mining
production quota in 2014 is 105 000 t, which currently represents 84 % of estimated global supply and
is expected to be at least maintained going forward. China is even more dominant in midstream
processing (purification, metal and alloy processing, etc.), which has been developed and optimized
over the past 35 years.
Global rare earth production is forecast to be 163 000 t in 2020, up from 119 000 t in 2013 (a seven
year compound annual growth rate of 4.6 %).

NI 43-101 - Technical report Norra Kärr REE - 0465-RPT-014 Rev 1
Page 240
19.3 RARE EARTH ELEMENT CONSUMPTION AND DEMAND FORECAST
Global demand for REE’s in 2013 is estimated at ~121 000 t. Global demand has been negatively
impacted by the unprecedented high prices in 2011. Since then, demand growth has tempered as the
Chinese economy has softened and buyers have moved to just in time inventory management. A
breakdown of Rare Earth usage in 2013 can be seen in Figure 19-2.
The majority of REE’s are currently consumed by the glass and magnet industries (each segment
comprises 23 % of total consumption), followed by catalysts and alloys (19 % and 17 %, respectively).
Japan and the USA are the key importers of rare earths, each representing ~37 % of Chinese exports
Year to date May 2014. Shipments for the first five months of the year to Japan and the USA were up
99 % and 57 %, respectively.
Figure 19-1: Estimated Global REO Supply (by Element)
0
20000
40000
60000
80000
100000
120000
140000
160000
180000
2013 2014 2015 2016 2017 2018 2019 2020
Ce La Nd Pr Eu Tb Dy Y Lu Other

NI 43-101 - Technical report Norra Kärr REE - 0465-RPT-014 Rev 1
Page 241
Source: industry sources
REO demand is forecast to grow to ~139 000 t in 2020 (a seven year compound annual growth rate of
2 %) driven by a number of end markets including industrial applications (auto and fluid cracking
catalysts, glass additives and polishing powders, metal alloys) and technology-related applications
(primarily permanent magnets). With respect to specific elements, demand for Dy and Nd is expected
to grow at the highest rates (~4 % per year). Details of demand by segment are summarized in Table
19-3.
Figure 19-2: Breakdown of Rare Earth Usage by Element 2013
Ce32.8%
La28.3%
Nd21.5%
Pr6.5%
Eu0.3%
Tb0.3%
Dy0.8%
Y7.8%
Lu0.0%
Other1.7%

NI 43-101 - Technical report Norra Kärr REE - 0465-RPT-014 Rev 1
Page 242
Table 19-3: Demand Summary
Application Description
Demand (t REO) CAGR [%]
Key Drivers REE 2013 2016 2020 2013-2016 2016-2020
Glass 28 000 30 000 33 600 2 3
% of total 23 23 24
Additive Ce - stabilizer in CRTs; UV blocker in auto glass La - reduces dispersion in optical glass
Ce, La Some Nd, Pr, Er
7 900 8 900 10 800 3 5
Ce - CRT use; car manufacturing La - digital cameras, binoculars, medical
Polishing Powder Polishing of semiconductor components
Ce primarily, La, Nd, Y 20 100 21 100 22 800 1 2
Use of nano-particulate polishing powders
Magnets 28 500 32 800 37 100 4 3
% of total 23 26 27
Nd-Fe-B magnets - higher power with lower size/weight SmCo
Nd, Dy, Sm, Pr, Tb
adoption of EV's; adoption of wind power; demand for HDD, mobile phones
Catalyst 23 300 25 200 27 900 2 3
% of total 19 20 20
Auto reduce pollutants, increase efficiency
40g REO/unit; Ce (some Pr, Nd, La) 6 000 6 800 8 000 3 4 stricter emission
controls; GDP
FCC enhances gasoline yield in oil refining process
1%-5% REO by weight; 60%-99% La, remainder Ce
17 300 18 400 19 900 2 2 oil consumption (esp. oil sands); GDP

NI 43-101 - Technical report Norra Kärr REE - 0465-RPT-014 Rev 1
Page 243
Application Description
Demand (t REO) CAGR [%]
Key Drivers REE 2013 2016 2020 2013-2016 2016-2020
Alloy 20 600 18 400 17 500 -3 -1
% of total 17 14 13
Metal Added to aluminium, iron, steel
Ce primarily, La, Nd, Pr 11 700 12 400 14 000 1 3 industrial use
Battery annode of NiMH battery rechargeable batteries and energy storage
Mischmetal (La, Ce, Nd, Pr)
8 900 6 000 3 500 -9 -13
adoption of EV's; adoption of Li-ion batteries as a NiMH replacement
Ceramics 6 800 7 400 8 100 2 2
% of total 6 6 6
Stabilizer and sintering aid; colourant
Y, La, Ce, Pr, Nd
Demand for capacitors and semiconductors
Phosphor 6 900 6 100 5 900 -3 -1
% of total 6 5 4
Coating for flat screens; energy efficient lighting
High purity required; 92%-96% Y, 4%-8% Eu for red phosphor; also use Ce, Tb, Gd, La
growth of LCD and plasma displays; shift to efficient lighting
Other 7 200 8 000 9 200 3 4
% of total 6 6 7

NI 43-101 - Technical report Norra Kärr REE - 0465-RPT-014 Rev 1
Page 244
Application Description
Demand (t REO) CAGR [%]
Key Drivers REE 2013 2016 2020 2013-2016 2016-2020
Nuclear, military weapons, water treatment, fertilizers (China), laser, magnetic refrigeration, fuel cells
Various
Various
Total 121 300 127 900 139 300 1 2
Source: Industry Sources

NI 43-101 - Technical report Norra Kärr REE - 0465-RPT-014 Rev 1
Page 245
19.4 REE SUPPLY/DEMAND BALANCE
The increasing availability of the lighter elements (especially Ce) suggests that these markets will be
well supplied in the future. However, production of heavier elements outside of China is expected to
take longer, primarily due to metallurgical and cost challenges. Elements expected to be in short
supply (and therefore ‘critical’) by 2020 include Nd, Pr, Tb, Dy and Y as shown in Figure 19-3.
Source: industry sources
19.5 REE PRICING AND FORECAST
Rare earth pricing is more complex than for commodities and is definitely more opaque. Historically,
there has been no open market for rare earths (which are primarily ‘traded’ individually – all 17 of
them) and most of the sales up to this point have been in the form of long term supply agreements,
which are subject to a number of variables including volume discounts, cost structure of the buyer,
potential cost subsidies, and effect of co-products at the producing mine. Furthermore, there is a
range of rare earth products sold, which has an impact on price. In this report the focus is on REOs
(typically 99.9 %), which is the common product reported.
There are a few agencies/companies reporting rare earth pricing (Metal Pages, Asian Metal, Industrial
Minerals) although not all contracts are reported and volumes are unclear. As a result, there is
typically a variance around pricing although directional movements are accurate.
Figure 19-3: Identification of Critical Rare Earth Elements - Percentage Over/Under Supply
‐0.8
‐0.6
‐0.4
‐0.2
0
0.2
0.4
0.6
0.8
Ce La Eu Nd Pr Tb Dy Y
2015 2018 2019 2020

NI 43-101 - Technical report Norra Kärr REE - 0465-RPT-014 Rev 1
Page 246
REE pricing is impacted by more than just supply and demand. Prices have been volatile for the last
decade as China introduced export quotas in 2005 and significantly reduced them in 2010, which sent
some rare earth prices up over ten times. Prices in 2011 were at unprecedented highs, which
resulted in stockpiling, recycling and ‘thrifting’ in applications. Currently, prices are depressed as
demand growth has slowed and inventory (including illegal product) continues to work through the
system.
The long term price forecast is lower than the trailing 3-year average for all elements but above
current prices for some elements today (Nd, Tb, Dy and Y). Higher prices are primarily supported by
demand growth for permanent magnets and the slower ramp up of heavy rare earth mines outside of
China.

NI 43-101 - Technical report Norra Kärr REE - 0465-RPT-014 Rev 1
Page 247
Table 19-4 REO Price Deck
REO Price Deck
US$/kg La Ce Pr Nd Sm Eu Gd Tb Dy Lu* Y
TSM PFS 7 5 115 80 8 700 40 950 575 900 25
Comparisons:
L3Y avg. FOB 16 15 115 94 33 1 661 67 1 349 747 1 422 50
L3Y avg. China 10 10 85 78 9 1 214 27 972 576 1 138 23
TSM PEA (March 2012) 10 5 75 75 10 500 40 975 520 n/a 20
Current Price - FOB 5 5 120 60 6 725 47 615 340 13
Current Price - China 2 2 78 46 3 365 15 405 224 1510 6
Source: Industrial Minerals and Rocks, Metal Pages, Bloomberg, Company Reports

NI 43-101 - Technical report Norra Kärr REE - 0465-RPT-014 Rev 1
Page 248
19.6 POTENTIAL CUSTOMERS
Finished rare earth products (99.9 % separated REO) from Norra Kärr can be marketed globally
although the initial focus is Europe. REO demand in Europe is estimated at ~8 000 tpa REO (broken
down as per Table 19-5). Norra Kärr’s expected annual output has been included to illustrate which
local markets could potentially be satisfied by the new project. It appears that there is potential to sell
a good portion of the Nd and Pr locally while Tb, Dy, Y, Eu and Lu will likely have to be marketed
outside of the region. Tasman currently does not have any contracts in place.
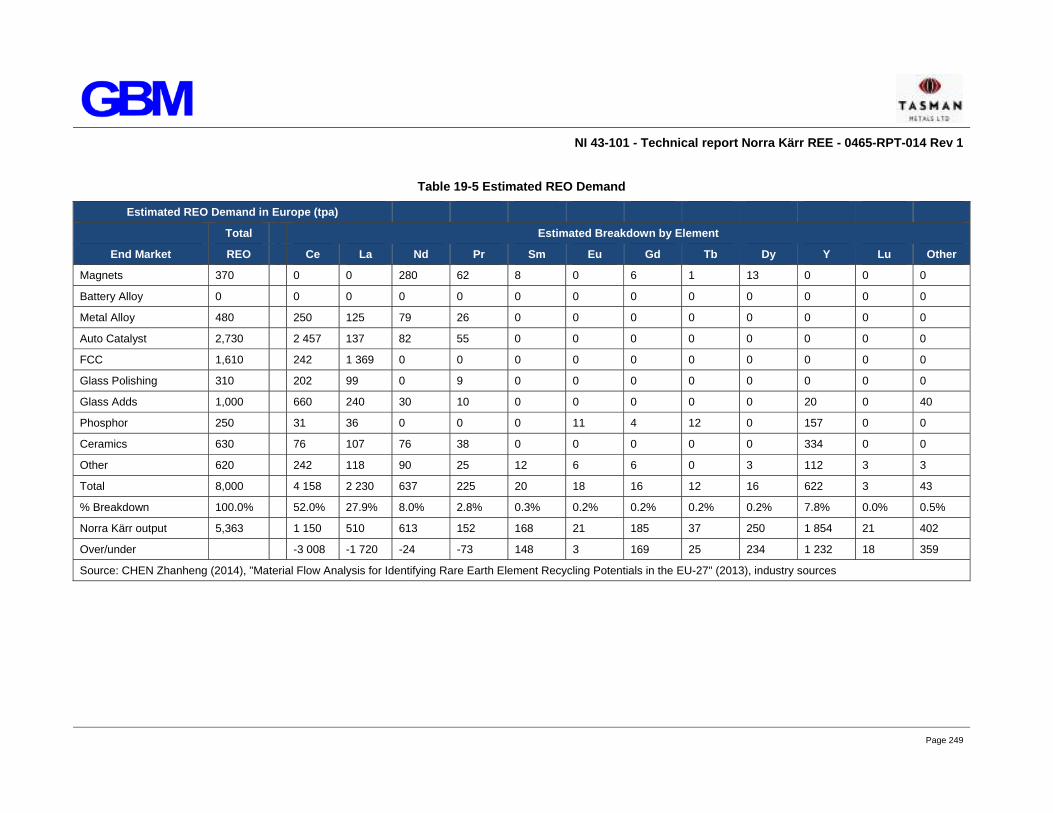
NI 43-101 - Technical report Norra Kärr REE - 0465-RPT-014 Rev 1
Page 249
Table 19-5 Estimated REO Demand
Estimated REO Demand in Europe (tpa)
Total Estimated Breakdown by Element
End Market REO Ce La Nd Pr Sm Eu Gd Tb Dy Y Lu Other
Magnets 370 0 0 280 62 8 0 6 1 13 0 0 0
Battery Alloy 0 0 0 0 0 0 0 0 0 0 0 0 0
Metal Alloy 480 250 125 79 26 0 0 0 0 0 0 0 0
Auto Catalyst 2,730 2 457 137 82 55 0 0 0 0 0 0 0 0
FCC 1,610 242 1 369 0 0 0 0 0 0 0 0 0 0
Glass Polishing 310 202 99 0 9 0 0 0 0 0 0 0 0
Glass Adds 1,000 660 240 30 10 0 0 0 0 0 20 0 40
Phosphor 250 31 36 0 0 0 11 4 12 0 157 0 0
Ceramics 630 76 107 76 38 0 0 0 0 0 334 0 0
Other 620 242 118 90 25 12 6 6 0 3 112 3 3
Total 8,000 4 158 2 230 637 225 20 18 16 12 16 622 3 43
% Breakdown 100.0% 52.0% 27.9% 8.0% 2.8% 0.3% 0.2% 0.2% 0.2% 0.2% 7.8% 0.0% 0.5%
Norra Kärr output 5,363 1 150 510 613 152 168 21 185 37 250 1 854 21 402
Over/under -3 008 -1 720 -24 -73 148 3 169 25 234 1 232 18 359
Source: CHEN Zhanheng (2014), "Material Flow Analysis for Identifying Rare Earth Element Recycling Potentials in the EU-27" (2013), industry sources

NI 43-101 - Technical report Norra Kärr REE - 0465-RPT-014 Rev 1
Page 250
Key end markets for Norra Kärr include magnets (Nd, Dy) and phosphors (Tb, Eu, Y). To a lesser
extent, auto catalysts, ceramics and glass additives are also potential markets although these end
markets also consume a significant amount of La and Ce, which are not key payables for Norra Kärr.
19.7 POTENTIAL UPSIDE FROM CO-PRODUCTS
The Norra Kärr project has the potential to produce nepheline syenite as a co-product, which could
have a favourable impact on economics. Nepheline syenite is a type of igneous rock composed of
sodium and potassium feldspars and nepheline and can only form in a geologic environment deficient
in silica. Nepheline syenite is primarily used in manufacturing glass (acts as a source of alumina to
achieve the lowest melting temperature) and ceramics (used as a flux and in glazes and coatings) but
also as roofing granules, road materials, riprap, as well as asphalt and concrete aggregate (because
of its weather-resistant properties and high strength). It adds durability to paint while reducing the use
of volatile organic compounds and can be used as a whitener in ceramics (as opposed to zirconium
silicate, which can contain radioactive elements).
Global production of nepheline syenite is currently dominated by Russia (UC Rusal), which primarily
uses the product (100 % captive) in the production of aluminium (although concentrate produced by
OJSC Apatit is used in glass and ceramics). The major company involved in production of nepheline
syenite for use in glass and ceramics is Sibelco of Norway, which owns operations globally including
Unimin Canada (operates two mines in Ontario) and Sibelco Nordic (operates a mine on the island of
Stjernoy in Norway). Canada and Norway are currently the major producers of nepheline syenite for
use in glass and ceramics at ~600 000 tpa and 300 000 tpa, respectively.
The major segment consuming nepheline syenite in Europe is the glass industry (~80 % of Norwegian
production, or ~240 000 tpa) followed by ceramics (~15 %, or ~45 000 tpa) and the remainder as filler.
Transport costs are significant for nepheline syenite and therefore markets tend to be regional.
Growth is expected in the ceramics industry (China, Italy and Spain) while demand for glass
production is challenged by increased recycling technologies and initiatives.

NI 43-101 - Technical report Norra Kärr REE - 0465-RPT-014 Rev 1
Page 251
SECTION 20 ENVIRONMENTAL STUDIES, PERMITTING, AND SOCIAL
OR COMMUNITY IMPACT
20.1 ENVIRONMENTAL SUMMARY
20.1.1 BASIS OF ASSESSMENT
This section contains:
Brief description of the project area (= the PFS nominated project footprint and environs) and
the baseline environment;
Description of expected potentially material environmental issues;
Brief description of activities of particular importance to environmental impacts caused by the
mining operation, i.e. waste management, water management and monitoring;
Description of the permitting process related to a mining project in Sweden;
Discussion of social and community issues; and
Brief commentary on health and safety aspects of the project.
The baseline reports used in the preparation of this assessment are listed in Table 20-1.

NI 43-101 - Technical report Norra Kärr REE - 0465-RPT-014 Rev 1
Page 252
Table 20-1: Baseline studies prepared by other experts
Study Title Author/Source Date
Water
Norra Kärr Regional Environmental Assessment iO global Solutions Ic. 2012
Miljötillstånd och naturvärden I Gyllingesjön, Stavabäcken och Narbäcken 2011-2013
Naturvatten 2013
Ytvattenprovtagning för kemisk analys vid Norra Kärr (Results from surface water sampling)
Sweco Environment AB 2014
Swedish Water-Information system VISS http://www.viss.lansstyrelsen.se/
Biodiversity
Naturvärdesinventering. Underlag inför ansökan om bearbetningskoncession för jordartsmetaller (Inventory of nature values)
Pro Natura 2012
Naturvärdesinventering och beskrivning av fem alternative sandmagasin vid Norra Kärr / Gränna, 2012
Pelagia Miljökonsult AB 2012
Naturvärden vid Norra Kärr / Gränna med omnejd Pelagia Miljökonsult AB 2012
Protection areas
Bevarandeplaner för Natura områden i Jönköpings län (Conservation plans for Natura 2000 areas in County of Jönköping)
http://www.lansstyrelsen.se/jonkoping/Sv/djur-och-natur/skyddad-natur/natura-2000/Pages/bevarandeplaner.aspx
Bevarandeplaner för Natura 2000 områden i Östergötland (Conservation plans for Natura 2000 areas in County of Östergötland)
http://www.lansstyrelsen.se/OSTERGOTLAND/SV/DJUR-OCH-NATUR/SKYDDAD-NATUR/NATURA-2000/BEVARANDEPLANER-KOMMUNVIS/Pages/bevarandeplaner.aspx
Naturreservat i Jönköpings län (Nature reserve areas in County of Jönköping)
http://www.lansstyrelsen.se/JONKOPING/SV/DJUR-OCH-NATUR/SKYDDAD-NATUR/NATURRESERVAT/Pages/default.aspx
Biosfärområde Östra Vätterbranterna (Biosphere area) http://www.ostravatterbranterna.se/
Geochemistry
Detaljerad beskrivning av de sällsynta jordartsmetallerna, Zn, Pb, U, Th, Y och Sc (Description of REEs)
Golder Associates AB 2012
Technical Note AM_TM_2014_27_03 Norra Kärr Project – Process Development and Radioactivity Deportment
ANSTO Minerals 2014
Cultural heritage
Arkeologisk utredning etapp 1 inför bearbetningskoncessionsansökan, Gränna och Ödeshög socken i Jönköping och Ödeshögs kommun, Jönköping och Östergötlands län (An archaeological survey)
Jönköpings Läns Museum 2012
Social and community
Gruvdrift i Norra Kärr – Effekter på arbetsmarknad och näringsliv (Effects on labour market and economy) NU! Nordiska Undersökningsgruppen, 2013: Norra Kärr – Tasman Metals AB 2013 Rapport (Survey results)
Tyréens AB NU! Nordiska Undersökningsgruppen
2012
2013

NI 43-101 - Technical report Norra Kärr REE - 0465-RPT-014 Rev 1
Page 253
Study Title Author/Source Date
Land use
Översiktsplan 2002 (Municipal Overview Plan 2002)
http://www.jonkoping.se/byggabomiljo/stadsplanering/oversiktligplanering/oversiktsplan2002.4.14be7193136a0d804b72689.html
Other subjects
Combiterminal Hubbarps industriområde Tränas (Transhipment Terminal for acid trains, Tränas),
WSP Sverige AB 2014
Utlåtande avseende jordskalv (Mine’s predicted impact on seismic risk), Norra Kärr
ITASCA Consultants AB 2012
The assessment is based on the design information acquired from the design team during the PFS
process. The design is described in the previous Sections of this report. The key documents used as
the basis for the assessment work are listed in Table 20-2.
Table 20-2: Key source documents
Document Source Date
Process package, including Process description, Process design criteria and Process flow diagrams
GBM 2014-10-31
Water treatment package Veolia 2014-09-30
Site layout drawings GBM 2014-10-29
Project Design Criteria GBM 2014-10-20
Phase 1 Report on Tailings Storage Facility WAI 2014-09-22
TSF preliminary design drawings and costings WAI 2014-10-29
Proposed MWD layout memo WAI 2014-09-18
Spillway Design – Hydrological Analysis Report WAI 2014-10-27
Site Wide Water Balance Inputs for process (pdf memo and spreadsheets)
GBM 2014-10-29
Transient Water Balance for the Open Pit and Tailings Storage Facility Ponds memorandum
WAI 2014-10-29
Spreadsheets of water balance (transient WB results), updated WAI 2014-11-04
Norra Kärr Preliminary Feasibility Hydrogeological Study WAI 2014-11-11
20.1.2 SITE DESCRIPTION
The Norra Kärr site and the surrounding area are characterised by alternating agricultural land and
forests. The area is populated and the forests have been in commercial forestry use for generations.
Significant areas within the project site and around it have been clear-cut recently and are either open
or young-growth seedling stands. The entire environment is considered to be anthropogenic. There
are a few small watercourses. Most of the project area naturally drains towards Lake Vättern via small

NI 43-101 - Technical report Norra Kärr REE - 0465-RPT-014 Rev 1
Page 254
streams, Narbäcken and Stavabäcken. The eastern part of the project area where the TSF is located
drains southward via stream Adelövån, into the Motala Ström catchment away from Lake Vättern and
further east into the Baltic Sea.
Figure 20-1 illustrates the environmental context of the project, i.e. the relationship of the project site
with protection areas, watercourses and catchment areas. Baseline sampling locations in the vicinity
of the site area also shown.

NI 43-101 - Technical report Norra Kärr REE - 0465-RPT-014 Rev 1
Page 255
Figure 20-1: Environmental context

NI 43-101 - Technical report Norra Kärr REE - 0465-RPT-014 Rev 1
Page 256
Several environmental baseline studies have been undertaken, concentrating particularly on the area
of the Norra Kärr property and immediately around it, but partially also encompassing a wider area.
Findings of key studies are summarised in the following sections.
Figure 20-2: Environment within and near the Project site is characterised by an interaction of human and natural factors. Typical landscape includes agricultural land and deciduous trees
20.1.3 PROTECTION AREAS
There are several various types of conservation areas near the project area. However, the project site
does not overlap with any protection areas that in and of themselves would form a restriction to
project development.
The most noteworthy areas are listed here. In addition there are a few areas of various national
designations within 5 km radius of the project site.
20.1.3.1 NATURA 2000 SITES
Natura 2000 is a network of conservation areas within the European Union (EU), and is a key
instrument in the EU’s commitment to halt loss of biodiversity. The network was established by the
identification of Specially Protected Areas under the EU Birds Directive (79/409/EEC) and Special
Areas of Conservation under the Habitats Directive (92/43/EEC). Approximately 2 000 species are
protected under the system which encompasses some 26 000 protected areas Europe-wide covering
a total area of more than 850 000 km2. This corresponds to approximately 18 % of the EU terrestrial
area. In Sweden, statutes related to the Natura 2000 network of sites are included in the
Environmental Code (Miljöbalken, SFS 1998:808).

NI 43-101 - Technical report Norra Kärr REE - 0465-RPT-014 Rev 1
Page 257
Any plan or project likely to have a significant effect on a Natura 2000 site, either individually or in
combination with other plans or projects, shall undergo an Appropriate Assessment to determine its
implications for the site. The competent authorities can only agree to the plan or project after having
ascertained that it will not adversely affect the integrity of the site concerned (Chapter 7 of the
Environmental Code and Article 6.3 of the Habitats Directive).
Natura 2000-area Vändelstorp och Målskog (SE0310725), which is designated under the Habitats
Directive, is located about 500 m south of the process plant area on the other side of the road to
Tränas. The area consists of grazed pastures near Vändelstorp with birches and oaks as dominant
tree types. An area with old pollarded ashes, whitebeams and sweet cherries has a very high nature
value. Nearly half of the Natura 2000 site area represents a priority grassland habitat type (habitat
code *6270 in Annex I of the Habitats directive).
Natura 2000-areas Narbäck (SE0230184) located 1.3 km northwest of Norra Kärr (Figure 20-3), and
Holkaberg (SE0230331) directly to the north of the Narbäck site, are part of the Holkaberg och
Narbäck nature reserve area and are designated under the Habitats Directive. The combined site
stretches in and along the steep slopes of the eastern shores of Lake Vättern. These slopes have
generally very high nature values. There are a lot of deciduous forests with a special climate, which
forms a suitable habitat for number of rare lichens, mosses and other humid-dependent species. The
Narbäck site includes a ravine with a small stream. The ravine forest has very high biological values.
The most prominent habitat type in both sites is priority habitat type 9020 Fennoscandian old-growth
deciduous forest. The small streams Narbäcken and Stavabäcken both flow from the project area into
Lake Vättern through these Natura 2000 sites.
Figure 20-3: Lush vegetation at Natura 2000 site Narbäck

NI 43-101 - Technical report Norra Kärr REE - 0465-RPT-014 Rev 1
Page 258
Several Natura 2000 sites cover the area of Lake Vättern, of which Vättern (södra) (SE0310432) and
Vättern (östra) (SE0230268) are the nearest to the project site at a distance of about 1.5 km. Both
are designated under the Habitats Directive and the Vättern (östra) site also under the Birds Directive.
Natura 2000-area and nature reserve area Huluskogen (SE0310225), designated under the
Habitats Directive, lies 4.5 km south-east from Norra Kärr. The distance to the southern part of the
TSF ponds is about 2 km. The area is hilly and comprises of an old coniferous forest with spruce and
pine. More than half of the site is covered by priority habitat type 9010 western taiga.
Natura 2000-area Lilla Morlejan (SE0230320), designated under the Habitats Directive, lies about
3 km to the east of the TSF and is covered mostly by priority grassland habitat type 6270.
20.1.3.2 NEW NATURE RESERVE AREAS
The municipality of Jönköping is in the process of defining two new nature reserve areas along the
Vättern eastern escarpment. The new nature reserves will form a southern extension of the current
Narbäck-Holkaberg area on the Ödeshög side of the county border. These sites will be located at
about 1.3 km to the west of the project area at the nearest point. A narrow gap of un-designated area
is planned to be left between the two sites where there is currently a road.
Kleven (Klevenbranten) is a west facing scarp within the Vättern fault steep just south from Narbäck.
This area extends from the Vättern shore to the top of the steep which is 190 m higher than the lake
surface. The nature reserve area comprises of an old broadleaved forest with humid microclimate and
an old mixed forest with pines and oaks (five registered key habitats).
Boerydsberget is a narrow 2 km long broadleaved forest on Vättern fault steep south from Kleven.
The nature reserve area comprises of an old broadleaved forest and an old mixed forest with pines
and oaks (10 registered key habitats). There are plenty of deadwood and many trees worthy of
protection. Different species of moss grow abundant on rock walls.
20.1.3.3 BIOSPHERE AREA
Biosphere reserve East Vättern Scarp Landscape Biosphere areas are part of UNESCOs scientific
program “Man and the Biosphere”, whose purpose is to improve the relationship between people and
the environment globally. The biosphere area is split into three types of zones: the central zone, buffer
zones and development zones. The mine concession area lies completely within the biosphere
development area. The biosphere designation does not cause any immediate, direct influence in
environmental permitting of the mine, but it will be taken into consideration.
20.1.3.4 LAKE VÄTTERN PROTECTION AREA
Water protection zone: Lake Vättern is a very important water source. The protection zone
comprises the Lake Vättern surface area, inflowing water courses (lower parts of the streams

NI 43-101 - Technical report Norra Kärr REE - 0465-RPT-014 Rev 1
Page 259
Narbäcken and Stavabäcken) and 50 m wide shorelines. There are some restrictions in the protection
zone including that chemicals cannot be directly delivered on soil to prevent dusting, and storage and
transport of hazardous chemicals in volumes over 250 litres is forbidden.
Shoreline protection area: There is a shoreline protection area around Lake Vättern. In the
municipality of Jönköping (and Habo) the protection area is 300 m inland from the shoreline (at mean
water level); As an average around the Lake the protection distance is 100 m.
The protection measures include a restriction on the storage of chemicals within the zone. The
restriction does not apply to the project area. The project site does not overlap with these protection
areas. However, since the natural flow of surface waters from most of the project is towards Lake
Vättern, protection of the lake will be taken into account in the environmental permitting
considerations.
20.1.4 NATIONAL INTEREST AREAS
The Swedish system of National Interest (Riksintresse) is created under Chapters 3 and 4 of the
Environmental Code. It is a system of designating areas of importance for various issues of public
interest. The designation as a National Interest area is not a complete restriction of other types of
development and indeed there can be directly conflicting National Interest designations for the same
area. However, the interests must always be taken into consideration in permitting. The county board
has the responsibility to ensure national interests within its area are not significantly damaged.
In the Norra Kärr site there are four overlapping National Interest designations.
National Interest for nature value (Riksintresse naturvärde) Area immediately on top of the
mineral deposit is declared of nature value because of the unusual rock type. The Vättern eastern
escarpment area to the west of the site is also a National Interest for nature value because of its
biodiversity value.
National Interest for valuable minerals and materials (Riksintresse värdefulla ämnen) This
designation is due to the Norra Kärr deposit and its importance.
National Interest for wind power (Riksintresse vindbruk) overlaps the westernmost part of the
project area (part of pit and plant areas). It is based upon modelling data which covers a very large
area. The project site affects a very small part of that area and is therefore assessed not to
compromise the region’s wind power development significantly.
National Interest for outdoor recreation (Riksintresse friluftsliv) overlaps only a small portion of
the concession area on the western side. All other project site is outside of this National interest
designation.
The nearest designated National Interest for heritage protection (Riksintresse kulturmiljövård) is
situated about 1 km from the project area.
NI 43-101 - Technical report Norra Kärr REE - 0465-RPT-014 Rev 1
Page 260
The conflict of various National Interests as concerns the concession area is dealt with by the
Exploitation Concession; exploitation of the geological resource is allowable despite Nature Value
designation. However, if significant effects on other National Interest nature value areas would be
deemed to be caused by the project, the interest conflict would need to be considered between the
interest of mining and the other interests.
20.1.5 WATERCOURSES
In general, the current ecological status of watercourses within the project site and in the surrounding
area is typically moderate to good. The watercourses have been impacted by agricultural land use
(nutrients) and morphological modifications.
Locally watercourses are given two chemical quality classifications: one including mercury
concentration and the other if mercury is not taken into account. This is because very many surface
water courses in Sweden have such high mercury concentrations that the chemical quality status for
most of the watercourses in the country would very commonly be low. Therefore in Sweden the
chemical quality status taken into account is usually the one without mercury. The watercourses
within the project area and nearby have high (best) or good chemical status notwithstanding mercury.
Baseline data concerning the chemical and ecological quality of the watercourses in the surrounding
area has been collected in various studies, see Table 20-3.
Table 20-3: Baseline Studies Relating to Surface Water
Norra Kärr Regional Environmental Assessment (29)
Chemical status of the region and the effect of land use and bedrock type on water chemistry were studied. The study included water, soil and vegetation samples. The analyses included physical and chemical properties of the water courses, metal and nutrient concentrations, alkalinity and pH. In addition, data from Swedish Geological Survey (SGU) was also collected from the same area and was used to study the soil chemistry.
All lakes showed very good buffering capacity and almost neutral pH. However, there were signs for anthropogenic SO4 wet deposition. Nutrient levels were generally elevated, which is likely due to the prevalence of farming and agriculture in the area. Metal concentrations in lakes were low, although in many lakes As, Cu; Ni and Zn concentrations were above the background levels. In vegetation samples, metal concentrations were mostly low. In the few samples where elevated concentrations were found, these were due to Cd, Cu, Ni and Zn.
Miljötillstånd och naturvärden i Gyllingesjön, Stavabäcken och Narbäcken (30)
Dynamics, quality and environmental status were described for Stavabäcken, Narbäcken and Gyllingesjön. If the discharge will affect other water courses, the environmental status of the receiving water bodies will need to be determined. Such information may also be available from water and environmental authorities.
The study included water, sediment, diatom, benthic fauna and fish samples. Golder considers that the undertaken sampling is adequate for the purpose, but notes that only two sediment samples were taken. Both physical and chemical properties were analysed. Analyses included alkalinity, turbidity and TOC, nutrients, oxygen, chlorophyll, metals, SO4 and chloride.
In this study alkalinity indicated good buffering capacity against acidification, nitrogen concentrations were elevated, and metal concentrations did not exceed the environmental quality standards (EQS). In these samples metal concentrations were comparable to values in reference waters. Uranium concentrations were found to be slightly elevated and mercury levels were high in pike flesh.
Ecological status, chemical status and nature values were set for Gyllingesjön, Stavabäcken and Narbäcken.

NI 43-101 - Technical report Norra Kärr REE - 0465-RPT-014 Rev 1
Page 261
Kemisk Vattenprovtagning vid Norra Kärr (31)
In this study four lakes (Gyllingesjön, Lille Glan (part of Adelövån stream), Ören, Bunn) and twelve streams were investigated. There was also sampling points in Vättern and in Munksjön (lake on the southern side of Vättern). From the water samples, pH, alkalinity, turbidity, nutrients, TOC, metals, SO4, Cl and F were analysed. In addition, temperature, conductivity and oxygen were measured.
In the summary tables, there are reference values, but the results that are exceeding the values are not marked. In general the values were low or similar to reference data. In most samples, turbidity and TOC were high.
20.1.5.1 LAKE VÄTTERN
Most of the project site, including the Norra Kärr deposit itself, lies within the catchment area of Lake
Vättern. Vättern, with its surface area of nearly 2 000 km2 is the second largest lake (by area) in
Sweden and the sixth largest in Europe. Its mean surface elevation is +88 AMSL and average depth
is 41 m. The level is regulated. In addition to being of natural, cultural and practical value, Vättern is a
very important water source, currently 250 000 people get their drinking water from the lake.
Because of the good water quality, Lake Vättern is sensitive to pollution. The turnover time of the lake
water is long (60 years) also increasing the sensitivity. Around the lake there are numerous industrial
activities including paper manufacture and mining.
There is a water protection zone around Lake Vättern. The protection zone also includes the lower
portions of the streams Narbäcken and Stavabäcken. The concession area lies outside the protected
area.
20.1.5.2 ADELÖVÅN STREAM
The current strategy is to discharge all water from the process, TSF and any other facilities away from
the Vättern catchment into Adelövån, which is a smallish stream flowing towards the south into Lake
Noen and later into the Svartån river system, and eventually into the Motala Ström major river, via
several lakes including Sommen. The Motala Ström will finally flow into the Baltic Sea.
Much of the course of the Adelövån stream is made up of a series of small lakes and ponds, which
are all officially categorised as part of the Adelövån watercourse (ID SE643599-143039). The area
around the planned discharge points and the two uppermost of these stream-lakes were visited by
Golder team in September 2014. Based on the observations during this visit it is clear that the current
channel upstream of Lake Gransjön is a modified, man-made ditch. The official watercourse Adelövån
originates in the Gransjön, south of the road to Tränas. The stream passes under the Tränas road via
a rectangular culvert. The channel is a couple of metres wide and partially overgrown. From Gransjön
the watercourse appears upon brief inspection to more or less follow the natural channel; however,
modifications have likely taken place. Altered stream morphology is the chief factor diminishing the
ecological status of the entire stream. See Figure 20-4.

NI 43-101 - Technical report Norra Kärr REE - 0465-RPT-014 Rev 1
Page 262
The first of the stream-lakes, Gransjön, is largely overgrown with reeds particularly in the northern end
but there is also an open water area. The stream is small here in its upper reaches. Gransjön has a
very low-lying western bank and would appear prone to flooding. The next one, Hultsjön also appears
to have low-lying area in the northern end. In the later stages of project design the receiving
watercourse should be investigated with more detail.
Adelövån stream is classified (in 2009) as having moderate (“måttlig”) ecological quality status (23).
The factors currently diminishing the ecological quality status are related to stream morphology, which
has been altered. As required by national legislation and the EU Water Framework Directive, the
stream has been set a target to reach good ecological quality status by 2021. However, the current
status and factors affecting it have been investigated as required by legislation and the
hydromorphological changes have been deemed so high that the Swedish water authorities estimate
that this target will not be technically achievable.
In terms of chemical quality status the stream is classified as high (best) chemical quality, which has
the target of remaining at level high, when mercury is not taken into account. On the other hand, the
mercury concentration in this stream, as well as most of the other watercourses in the area is so high
that in the latter classification (including mercury) the chemical quality status is low, and is expected to
remain so in the future as well. The Adelövån has also been determined to be sensitive to nitrogen.
Figure 20-4: Adelövån stream at Häggebäcken (between Gransjön and Hultsjön)
The Adelövån (total length of stream 12.8 km) discharges into Lake Noen which is considered to have
a very high nature value. Lake Noen also has ecological quality status moderate (target status: good)

NI 43-101 - Technical report Norra Kärr REE - 0465-RPT-014 Rev 1
Page 263
and chemical quality status high (notwithstanding mercury). The lake is described in the
Vatteninformationssystem Sverige (VISS) as having very high biological function and high biodiversity
value with otters, many species of fish, rich birdlife and as well as certain rare plant species present.
Lake Noen is designated as a Nationally Valuable Water (nature value) (“Nationellt Särskilt Värdelful
Vatten (Natur)”) as well as regionally valuable water (fishing) (22).
The flow rate in Adelövån varies greatly throughout the year. Currently there is no flow rate data
available for the upper reaches of the Adelövån. Such data will be needed in the later stages of the
project to ensure the capacity of the channel to take in all discharged water and for the design and
permitting of potentially needed channel works. The Swedish Water Information System VISS
includes modelled flow data for the entire sub-catchment (sub-catchment SE643599-143093 “Mynnar
i Noen” i.e. “Flows into lake Noen”, which largely consists of the Adelövån itself). The modelled data
has been provided by Swedish meteorology institute SMHI.
There are no regular periods of the year when there would always be very low or very high flow.
Periods of low flow may occur at any time throughout the year, particularly later in the summer but
also in autumn and winter in years of low rainfall and/or cold winters (when most precipitation arrives
as snow and enters the stream only at snowmelt following spring). However, there are also warmer
years when there is reasonably high flow throughout the winter, reflecting the fact that precipitation
comes as water or keeps melting even during the winter months. The highest monthly flow normally
follows snowmelt in April but again after a warm winter there isn’t much snow to melt. Overall the
yearly flow patterns are very varied.
The average flow rate for the catchment “Mynnar i Noen” is 0.37 m3/s or 1 332 m3/h (based on
modelled data 2010-2012 by SMHI, downloaded from VISS).
20.1.5.3 OTHER WATERCOURSES WITHIN AND NEAR PROJECT AREA
The area around the Norra Kärr deposit and most of the project site notwithstanding the TSF itself
and two of the three planned ponds, drain naturally towards Lake Vättern via two small streams
Narbäcken and Stavabäcken. There is a small lake Gyllingesjön located east of the deposit (between
the planned pit and TSF) which collects water from most of the project area and drains via
Stavabäcken stream (see Figure 20-5). No discharge of any contact water, including any storm water
collected from project site or roads, is planned into any of these watercourses.
Aquatic ecology of these watercourses has been partially investigated during the baseline programme
(Gyllingesjön and the streams towards Vättern i.e. Narbäcken and Stavabäcken). These
watercourses are sensitive and relate to high nature value.
Lake Gyllingesjön (Figure 20-5) is not classified as a water source. The lake is already affected by
over fertilization and organic matter load. The bottom layer of Lake Gyllingesjön is low in oxygen for
most of the year.

NI 43-101 - Technical report Norra Kärr REE - 0465-RPT-014 Rev 1
Page 264
Figure 20-5: Lake Gyllingesjön
The Narbäcken and Stavabäcken streams flow into Lake Vättern through a Natura 2000 site. Water
flow in the streams Stavabäcken and Narbäcken exhibit large annual variation. Any changes in flow
conditions (increased or decreased) may affect the ecology downstream.
The current status of these small watercourses was determined in a baseline study (23). Stavabäcken
was determined to have moderate ecological status in its mid-reaches and good in the lower portion.
Narbäcken was similarly determined to have moderate ecological status in the higher reaches and
good in the lower portion. Furthermore chemical status was determined for the higher reaches of
Narbäcken and was found to be good (notwithstanding mercury). Lake Gyllingesjön’s ecological
status is determined to be moderate, chemical good (notwithstanding mercury). All three
watercourses were determined to have a moderate level of nature value (moderate level of being in
natural condition, with no known rare species present).
Streams and Lake Gyllingesjön that are close to the site may also be affected by the project. There
are several base line study points in these water bodies. Parameters studied from these water bodies
include nutrients, metals and sulfate and are considered to be adequate for surface waters.
Sediments need to be investigated further in all possibly impacted water bodies.

NI 43-101 - Technical report Norra Kärr REE - 0465-RPT-014 Rev 1
Page 265
20.1.6 GROUNDWATER
The crystalline bedrock at the planned location of the open pit is covered by thin sandy-silty till and
small peat areas and the bedrock is occasionally outcropping. The deepest observed soil depth at the
site is 11 m.
The hydrogeological description of the Norra Kärr site has been developed in several stages involving
both desktop studies and field investigations conducted by Golder and WAI in 2012 and 2014. Results
indicate that groundwater is typically close to ground surface (approximately 200 masl), and flows
towards the northeast.
There are several private wells located near the mining concession area, both water supply wells and
geoenergy wells. The wells have been identified from official records in the area around the
concession but not in the area of the TSF.
For hydrogeological purposes, five groundwater wells have been installed. Using these wells
groundwater quality was studied (two sampling campaigns) to determine the baseline of groundwater
quality for the site. Overall the results indicate normal quality of groundwater; however the sampling
is not comprehensive and should be further supplemented. There is a risk of naturally high levels of
fluoride in the groundwater in the bedrock in the whole area due to mineralogy of local rock.
20.1.7 ECOLOGICAL BASELINE
The area belongs to the boreo-nemoral vegetation zone, which means a mixture of deciduous and
coniferous forests with no clear domination of either type. Typical broad-leaved trees include ash
(Fraxinus), oak (Quercus), elm (Ulmus) and lime (Tilia) species, with conifers being dominated by
spruce (Picea). In the area, deciduous forests tend to have more nature value than the coniferous
forests, partially due to the tree species present and partially due to the fact that much of the spruce is
planted for forestry purposes. There are a number of small watercourses, many of which are originally
man-made ponds that add to the biodiversity features.
The project area and the area surrounding it are characterised by mixed agricultural and forestry use
and have been inhabited for centuries. There are numerous dwellings and roads in the area. The
entire environment in the area is considered to be anthropogenic. There are no pristine nature areas
and no nature values related to purely natural development although certain areas are protected by,
for example, varying topography have experienced less human influence and thus providing refuges
for species and some valuable habitat. On the other hand, the very interaction of natural and human
processes has resulted in a mosaic of varying environments (see Figure 20-6) that have certain
nature values in their own right. Particularly areas where open land (grazing land and/or meadows) is
interspersed with sparse trees or small copses tend to have high biodiversity, and when open water is
also present, even more so.

NI 43-101 - Technical report Norra Kärr REE - 0465-RPT-014 Rev 1
Page 266
Figure 20-6: A mosaic of environments typical of the project area and environs
Thus some nature values of certain importance have been identified in the project area. These consist
of areas of valuable habitats, occurrences of protected species and individual trees of high value.
However, the identified nature values do not represent restrictive protection with the exception of
certain protected species. Destroying individuals of protected species is prohibited, but it is possible to
get an exemption from the prohibitions by application.
Parts of the impacted area have been recognised in various nature value inventories. For example
some areas listed as “forest key biotopes” (skogliga nyckelbiotoper) or “valuable agricultural
landscape” (värdeful natur i odlingsmark). These are limited in terms of area. These inventories are
performed with the purpose of providing guidance to authorities in the field of biodiversity protection
but are not restrictive protection designations.

NI 43-101 - Technical report Norra Kärr REE - 0465-RPT-014 Rev 1
Page 267
Table 20-4: Ecology baseline studies
Norra Kärr naturvärdesinventering. Underlag inför ansökan om bearbetningskoncession för jordartsmetaller (Pro Natura, 2012)
Ecology consultancy firm Pro Natura was commissioned by Tasman to undertake an inventory including field studies at the Norra Kärr site and environs to recognize the scientific nature values in the planned mining area and make an impact assessment of these.
An ecological survey was carried out in 2011 covering a study area of 2 km x 3 km around the Norra Kärr site that encompasses the mining concession, the industrial area and about half of the area of the mine waste dump. The TSF and the related ponds are however almost completely outside of the study area.
Naturvärden vid Norra Kärr / Gränna med omnejd (Pelagia Miljökonsult AB, 2012)
A desk top study of various protection areas, non-binding programmes and inventories of valuable areas (e.g. county-level inventories, forest authority’s inventory programme) inasmuch as they overlap with the 31 TSF location options that were being considered at the time. Among these options, areas A and 12 overlap with considerable portion of the PFS project area.
In general, nature values in the area are tied to historical agricultural use and conditions have
changed during the past few decades. Grazing grassland management has ceased and nowadays
the focus is on spruce plantation for economic reasons. Many of the nature values related to past
agricultural use are threatened by overgrowing. This progressive loss of value is also reflected in the
results of the field inventory undertaken around the exploitation concession area (24). Of the total of
60 object areas of nature value identified within the 2 km by 3 km study area, only one was classified
to represent the highest nature value, Class 1. A further 11 object areas were classified as Class 2
and all others having local value only in the Pro Natura study (24).
One area immediately around an outcrop within the Norra Kärr site itself is classified as Class 1
based on historic mixed agricultural use. The remaining flora values in the pastures with underlying
unique rock types give the object a highest nature value class. This value is also the basis for the
National Interest Nature Protection (Riksintresse Naturvård) designation. The Class 2 objects consist
mostly of valuable agricultural land but include also some deciduous forest and one object of
waterlogged forest (Carr). None of the identified object areas within the study area are legally
protected.
A brief field visit was undertaken by another ecology consultant Pelagia Miljökonsult AB in 2012 to
areas being studied as options for the TSF. Two of these overlap with the current project area. Areas
of valuable agricultural landscape as well as smallish areas of key forest biotope were identified
during this visit around Kaxtorp-Mörstorp (western part of the project area), Staffanstorp and S Bråten
(TSF area) as well as around Ingefrearp in an area that is located between the mine waste dump and
the TSF.

NI 43-101 - Technical report Norra Kärr REE - 0465-RPT-014 Rev 1
Page 268
20.1.7.1 ENDANGERED SPECIES AND GREAT CRESTED NEWT
IUCN (International Union for Conservation of Nature and Natural Resources) classifies species
according to their level of being threatened by extinction. The classification ranges from LC (least
concern) to EX (extinct). The classification NT (near threatened) means a species is not endangered,
but is not doing very well either. Species that are classified as NT or below (VU, EN, CR) are red
listed by the IUCN. In the studies undertaken, occurrences of red-listed species have been identified
within the project area. These comprise species of lichen, fungi, vascular plants and insects, and one
bird, the lesser spotted woodpecker (Dendrocopos minor) which is NT in Sweden although LC
worldwide. All but one of these are species classified as NT, i.e. not exactly endangered, and one
species of fungi classified as VU (vulnerable).
Great crested newt (Triturus cristatus) is present in several small ponds at the mine site and nearby.
Although not endangered in Sweden or in the study area (IUCN listed LC, least concern), it is listed in
Annex IV of the EU’s Habitats Directive. The species, along with its breeding grounds and other
habitats used by it, are protected. If disturbance cannot be avoided, compensatory measures will
need to be undertaken. A limited great crested newt inventory was carried out as part of the Pro
Natura study (24) and established the presence of the species in several places within the project
area (including the Norra Kärr site itself) and in the immediate environs.
20.1.7.2 TREES WITH HIGH NATURE VALUE
A particular biodiversity feature typical to the project area and its environs is the centuries-old tradition
of pollarding trees. Pollarding means regular pruning of trees to produce continual new growth. In the
area this has been practiced to produce animal fodder on various species of broadleaved trees, ash in
particular. The pollarded trees can reach a very high age (several centuries) because the severe
pruning keeps them in partially juvenile state. Many such old trees have high biodiversity value due to
species, particularly lichens, living on the bark.
The Environmental Protection Agency approved, in 2004, a protection plan for trees in cultural
landscapes in southern Sweden. Many endangered or threatened species are associated with these
kinds of environments. The nature authorities have undertaken a tree survey in the area and a large
number of trees have been classified as “worth protection” (skyddsvärda träd). These are individual
trees that have particular ecological value due to old age (>200 years of age at minimum, depending
on species) and their large size (see Figure 20-7). Many of the listed trees are pollarded but some are
listed on the basis of being old, hollow and/or very large. The classification is not a formal protection
designation.

NI 43-101 - Technical report Norra Kärr REE - 0465-RPT-014 Rev 1
Page 269
Figure 20-7: Great ash trees in the exploitation concession area, near the outcrop
There are a large number of such trees in the project area, around 100 in the Pro Natura study area
alone and more in the surrounding areas. Particularly many listed trees grow around Ingefrearp, north
and north-east of the mine waste dump but there are also several in Kaxtorp, Mörstorp, Långliden and
Kvatarp. Clusters have been identified also within and near the TSF area.
Biosphere reserve East Vättern Scarp Landscape includes sub-areas where particular values are
recognised. The western part of the project area is situated within sub-area H1 recognised for
pollarded trees (dellandskap hamling). The importance of the sub-area recognition is to raise
awareness of the value of the pollarded trees and it is not a formal protection designation.
20.1.8 CULTURAL HERITAGE
Norra Kärr and its surroundings were largely colonized during the period 1550-1650 and the historical
mapping shows that there were crofts and small holdings in the area. Furthermore there were old
village plots together with now fossilized farming fields. Quite many of the fossilized fields can be
seen on relatively recent maps from the 1950s. An archaeological baseline study has been
undertaken for the area immediately surrounding the concession area but much of the project area
remains un-investigated. More studies are required.

NI 43-101 - Technical report Norra Kärr REE - 0465-RPT-014 Rev 1
Page 270
Table 20-5: Archaeological baseline study
Arkeologisk utredning etapp 1 inför bearbetningskoncessionsansökan, Gränna och Ödeshög socken I Jönköping och Ödeshög kommun, Jönköping och Östergötlands län (35)
An archaeological survey was carried out (Jönköpings County Museum, 2012) during the autumn of 2011 using the records held at the Jönköping County museum and a field study. The aim of the survey was to identify the known ancient and cultural relics, examine the previously not known areas and to create background information for the possible hidden ruins and relics. An area of approximately 100 hectares was surveyed around the mining concession area. An earlier archaeological survey (Jönköpings County Museum, 2010) in the area was carried out in connection with the planned wind turbines and is briefly referenced in the 2012 report.
The surveyed area covers mainly the concession area and its vicinity. There is some information from the planned tailings facility south-east from the concession but quite a large part of the project’s total footprint area has limited data concerning the cultural environment.
There are no national interest objects for cultural heritage environment protection in the surveyed
area. Some archaeological finds are known but most the objects have been classified as “other
cultural historical relics” which means that they are not fixed relics but still thought to have some
antique value and should be brought to attention. These objects include old (fossil) fields, building
foundations, apartment settlements, fences, a well/water source, a fracture/quarry and a linen pit.
There are a few objects classified as fixed relics (R, fast fornlämning). Some of these are designated
“monitoring objects” which means they must always be investigated further prior to any ground works.
Table 20-6 shows the monitoring objects identified in the area immediately surrounding Norra Kärr,
together with an area with old field clearing stone piles which is classified as fixed relic.
Table 20-6: Cultural heritage objects
Cultural heritage objects identified in the archaeology studies (35)
25 Apartment Settlements. Area with a number of remains; crofting remains, cellar, foundations, water well/spring, linen pit and stone wall. Within the area has also been a Grenadier cottage with evidence from the 1600s according to the historical mapping. Monitoring object. Suggested archaeological survey.
RAÄ 369 Apartment Settlements. Croft/cottage “Jeppahemmet” according to geometric surveying from 1718. No visible remains found in the field study. Fixed relic, monitoring object, archaeological survey suggested.
RAÄ 374 Village property/farming property. Norra Kärr farming property. Monitoring object. Fixed relic, suggested preliminary archaeological survey.
RAÄ 373 Old (fossil) fields. Area with old field clearing stone piles. Fixed relic, suggested preliminary archaeological survey.
RAÄ 181, RAÄ 182 Apartment Settlement in Ingefrearp east from Norra Kärr.
20.1.9 DATA COVERAGE
As described in the previous sections, baseline studies relating to ecology and archaeology do not
encompass the entire Project area. Conversely, some water sampling has been carried out in a wider
area. Baseline data coverage in terms of project area is described in this section.

NI 43-101 - Technical report Norra Kärr REE - 0465-RPT-014 Rev 1
Page 271
20.1.9.1 COVERAGE OF BASELINE STUDIES (TERRESTRIAL)
Parts of the nominated project area have not been subject to any field studies and therefore data
gaps exist. Particularly the area proposed for the flood water retention pond (west of the water
storage pond) and the northernmost part of the TSF are outside the study areas of any ecology field
studies. Furthermore the TSF area along with some other parts of the project area has only been
subjected to a very brief field visit by ecology consultants Pelagia during their 2012 field visit. The
more comprehensive ecology study carried out by Pro Natura in 2011 covers the area around the pit,
most of the industrial area and western part of the mine waste dump. There will also be other
infrastructure directly related to the project that has not been sited yet.
The archaeology study undertaken by the County Museum of County of Jönköping in 2012 covers
only the area around the mining concession.
Figure 20-8 illustrates the study areas in relation to the Project area.

NI 43-101 - Technical report Norra Kärr REE - 0465-RPT-014 Rev 1
Page 272
Figure 20-8: Areas covered by terrestrial baseline studies

NI 43-101 - Technical report Norra Kärr REE - 0465-RPT-014 Rev 1
Page 273
20.1.9.2 SAMPLING POINT LOCATIONS (WATER)
All water discharged from the project is in the current design directed towards the stream Adelövån
flowing south. The chemical and ecological status of Adelövån has been determined by the authorities
and is available in VISS (Swedish Water-Information system). Furthermore baseline sampling has
been performed upstream of Gransjön (immediately downstream of the planned discharge point),
downstream of Gransjön (between Gransjön and Hultsjön) and further down in the stream-lake Lille
Glan. Samples were taken in 2012 (Oct), 2013 (Feb, May, Aug, Oct) and 2014 (Feb, May, Aug).
The study by IoGlobal Solutions Ic., Norra Kärr Regional Environmental Assessment (IoGlobal, 2012)
presents an overall status of surrounding areas.
Water sampling for water chemistry has been undertaken over a wide area and it covers the affected
watercourses quite well. However, sampling related to aquatic ecology (plankton, benthic fauna etc.)
has only been carried out in some of the potential watercourses and may need to be supplemented.
This is balanced by the fact that information related to ecological status of the Adelövån stream has
been gathered by authorities and is available through VISS.
Sampling point locations around the exploitation concession and in the wider area are illustrated in
Figure 20-9.
It should be noted however that despite good coverage in terms of geographic area, some data
concerning watercourses is also lacking. Quality data on sediments will likely need to be
supplemented. Furthermore it is possible that when more information is available about expected
quality of discharge water based on more comprehensive geochemistry testing, further sampling may
be required to establish baseline levels for certain contaminants that may have not been included in
the general baseline campaign.
It is considered likely that further information will be needed concerning water level and flow rates in
the watercourses of the area, particularly the receiving stream.

NI 43-101 - Technical report Norra Kärr REE - 0465-RPT-014 Rev 1
Page 274
Figure 20-9: Sampling Point Locations

NI 43-101 - Technical report Norra Kärr REE - 0465-RPT-014 Rev 1
Page 275
20.1.10 TRANÅS SITE
Most of the project-related infrastructure is planned to be located at the Norra Kärr project area, near
the exploitation concession area as has been described above. In addition, there is a plan to construct
a new loading and storage facility to be used for transhipment of sulfuric acid to the site. Industrial
area Hubbarps on the southern edge of the town of Tränas has been identified as the best location for
such a facility on the Swedish main trunk railroad line. A new side track would be connected to the
transfer station “Tränas south” and the required infrastructure would be constructed next to it.
The municipality of Tränas has commissioned infrastructure consultants WSP Sverige AB to look at
possibility of building a new combi terminal along the main railway track between the main railway line
and Highway 32 south-south-west of Tränas centre, east of Trafikplats Tränas (the main exit from
Highway 32 to Tränas). The initial report by WSP is from 2007. Tasman commissioned WSP to
update the study to consider a transhipment facility in the same location. WSP considers (WSP 2014)
the site to be well suited for such a facility considering space requirements, geotechnical conditions
(based on WSP’s cursory inspection) and operability of the railroad line. There are currently no
loading areas or facilities, but there is an existing pass-by rail which would make the construction of
the new terminal easier and more feasible.
Currently the planned site is open ground. To the north is the industrial area, south of that there is
open space that is located between the highway and the railroad. WSP considers the area to not be
used much for recreation due to its unfavourable position between the railroad and the highway (WSP
2014).
There are some residential properties along the street which connects the area and Tränas centre,
Katarpsvägen. WSP considers that a noise screen would be possible to be constructed if required.
Current connection to the area is street Katarpsvägen, but according to the WSP preliminary plan, a
new connecting road would likely be constructed. The WSP plan also indicates that a new industrial
area is planned for the area between the railroad and Highway 32 (WSP, 2014). The existing
industrial area, Hjälmaryd has industrial and warehousing properties. The companies in the area
include metals industry, concrete manufacturing and scrap metal recycling. To the east of the
industrial area there is a residential area about 1 km from the planned site of the transhipment
terminal.
Currently the road access to the planned site is constrained and would be passing close to a Natura
2000 site and a residential area to reach the interchange to the Highway 32. However the municipality
of Tränas has indicated an interest in developing a logistics area in the location and the road access
may be improved in the future. In terms of railway traffic the suggested loading station has the benefit
of being accessible directly from the main line both from north and south direction.
Close to the planned site there is also the river Svartån, flowing into Lake Sommen. The Svartån is
one of the major rivers in the area. In the WSP preliminary plan certain objects of note are mentioned

NI 43-101 - Technical report Norra Kärr REE - 0465-RPT-014 Rev 1
Page 276
in the surrounding area, however in WSP’s opinion these are not expected to present obstacles to the
development of the planned facility. These include trees classified as worthy of protection
(skyddsvärda träd) in the southern part of the area as well as a cultural heritage monitoring object
very near or within the planned construction site. WSP describes the area as culturally and historically
interesting and suggests that a Phase 1 archaeology study is likely to be required (WSP, 2014).
Considering there is a monitoring object known at the site it is also expected that a Phase 2 study will
be required concerning the monitoring object before the remains can be disturbed.
20.2 EXPECTED MATERIAL ENVIRONMENTAL ISSUES
20.2.1 SURFACE WATER QUALITY
20.2.1.1 GENERAL: CONTROL OF WATER DISCHARGES IN SWEDEN
The control of discharges into watercourses in Sweden, as well as many other European countries is
based on the resulting ecological and environmental quality. This approach is pursuant to the EU
Water Framework Directive. This means that no uniform, Europe wide, levels of allowable discharges
are determined, because the resulting environmental quality is a factor of both the discharge and the
receiving environment. No discharge must cause deterioration of the ecological status of the receiving
watercourse. The Water Framework Directive calls for an improvement in the chemical as well as
ecological status so that all surface waters should be to good chemical status and good ecological
status by 2015.
In practice this means that the allowability of discharge into any given watercourse will need to be
considered on a case by case basis. This consideration will in practice be performed by the
environmental permitting authority when considering whether an environmental permit can be
awarded to a given operation or activity. In Sweden this is the Land and Environmental Court (Mark-
och Miljödomstolen).
For certain contaminants there are EQS. These are set either by the Dangerous Substances Directive
2006/11/EC or by national regulations. When the EQS is set, the approach is in principle the
following:
Concentration in the watercourse after discharge ≤ environmental quality standard
As the concentration actually under scrutiny is the final concentration, the result of this calculation
depends on the flow rates of the discharge and the receiving watercourse, as well as concentration in
the discharge and the baseline concentration already present in the receiving watercourse.
Basically a larger stream with cleaner water could tolerate a higher discharge. However, if the
receiving stream is already of a high ecological quality, then smaller changes in overall concentrations
will result in deterioration of ecological status, which is prohibited under the Water Framework
Directive and related national law.

NI 43-101 - Technical report Norra Kärr REE - 0465-RPT-014 Rev 1
Page 277
EQS are only available for a limited suite of substances. For any other contaminants the consideration
of whether the discharge would cause deterioration of the ecological status of the receiving
watercourse will be made on a case by case basis. This will be based on combining information
concerning the discharge, the contaminants in question and the baseline conditions at the receiving
watercourse.
In addition to the resultant ecological status of the receiving watercourse, the environmental court will
also take into account a number of other factors. The applicant will need to demonstrate that BAT
(Best Available Technique) is utilised. Further factors that the court will consider include, for example,
the presence of sensitive species in the watercourses, protected waters and other case-specific
issues.
20.2.1.2 POTENTIAL ISSUES RELATED TO SURFACE WATER QUALITY
Quality of water discharged from process: There will be no liquid water discharged from the
process. The raffinate water in the process will be recycled in the water treatment plant, which
incorporates RO treatment and nanofiltration. The concentrated reject solution (brine) will be
evaporated on site and disposed of by trucking to off-site treatment or disposal.
The only water leaving the process is in the moisture content of the tailings streams (and, to a small
extent, the product). All three tailings streams will be pumped into the TSF.
Pit water quality: based on current information about geochemistry, particularly the waste rock
characterisation, it is expected that the local geology (waste rock) will not result in contamination of
the pit water. However, the pit water may contain nitrous residues from the explosives. As the
receiving watercourse Adelövån flows into Lake Noen, which is determined to be sensitive to nitrogen,
it is possible that nitrogen removal may be required. Currently it is expected that the pit water is likely
to be suitable for release into the environment via a sedimentation pond, with monitoring for nitrogen.
Quality of water discharge from TSF: early geochemical characterisation of one tailings stream is
available. The nepheline/feldspar tailings are not expected to have a significant impact on water
quality. However, the composition of the leached and neutralised residue (mostly made up of the
mineral aegirine, a pyroxene) or gypsum from neutralisation is not known and thus water quality
cannot be predicted. The actual waste water quality should be determined by testing incorporating
representative amounts from each tailing stream.
Currently it is expected that excess water from the TSF can be discharged via a clarification pond to
clarify solids. The need for further treatment such as removal of nitrogen or other contaminants
remains unclear.
The discharges will be directed into the Adelövån which is a small stream. Contaminant loading via
the Adelövån will end up in the small stream-lakes along the course of the stream and in Lake Noen.

NI 43-101 - Technical report Norra Kärr REE - 0465-RPT-014 Rev 1
Page 278
Issues that will need to be taken into consideration in the future determination of possible treatment
need, may be related to nitrogen loading (eutrophication), toxicological effects of various
contaminants and other hydrodynamic and/or ecological effects caused by discharged waters. The
discharge is different from the natural water in various aspects and the resulting consequences will
need to be assessed. For example loading by salts at levels that have no toxicological effect could
nevertheless strengthen stratification of the water layers of a lake or pond to such extent that harmful
impacts to the pond/lake ecosystem could be caused. Very high salt loading may result in anoxic
lower layers and sometimes formation of hydrogen sulphide.
Impacts on water quality in these lakes cannot be predicted with the current level of information and
will need to be assessed later in the further stages of project development when more information is
available. If significant negative impacts on water quality or the aquatic ecosystem were expected
based on this assessment, suitable treatment of the discharge water is likely to be required.
Spills from TSF: The TSF area is located partially in an area that in natural conditions lies within the
Vättern catchment. The embankment will form the new catchment boundary, however according to
current TSF design surface water does not accumulate behind the main tailings containment
embankment. The flood balancing pond is entirely situated within the current Vättern catchment.
Discharges, including possible overflow, are diverted toward the Adelövån catchment, away from the
Lake Vättern. Spills towards the Lake Vättern would be possible only in the unlikely event of dam
failure. A risk assessment and a detailed risk management plan should be established for TSF failure
risks.
Similarly to Lake Noen mentioned above, the Lake Gyllingesjön, while not considered sensitive, may
be impacted if it receives water from the mining area, for example in the form of contaminated runoff.
20.2.2 SURFACE WATER QUANTITY
Quantity of water discharged from the TSF: The receiving watercourse has average flow of
0.37 m3/s or 1 332 m3/h (average modelled flow 2010-2012) for the entire catchment area Mynnar i
Noen, with considerably lower flows (~350 m3/h) occurring during dry months (modelled flow data by
Swedish Meteorological Institute SMHI, loaded via VISS). Thus the discharge from the project even
with water recycling is expected to be a significant portion of the entire stream flow. This may result in:
Strict requirements for discharge water quality;
Streamflow effects: project may change seasonal flow patterns, although controlling the
discharge pattern can be used to mitigate such change; and
Due to a notable increase in the stream flow over the year, it is possible that flood risks along
the receiving stream may be aggravated. Flood risk assessment will likely be required.
It appears that the Adelövån, including the uppermost small lakes, perhaps could not readily
accommodate flows much higher than at present. On the other hand the watercourse is already

NI 43-101 - Technical report Norra Kärr REE - 0465-RPT-014 Rev 1
Page 279
heavily modified. Thus it is assumed likely that required dredging and other works in the channel
could be permitted. The permit for such works would be part of the environmental permit for the
mining operation itself. It appears likely that flood risk modelling and related design will be required in
the future to establish conditions suitable for discharge.
The current process design incorporates a water recycling plant, resulting in a considerable reduction
of both make up water intake and the discharge water flow rate.
Make up water: the amount of water to be extracted from Lake Vättern, 93.45 m³/h, is not likely to be
significant in terms of physical or environmental impact. The flow is negligible in comparison to the
size of the lake. The pumping by a conventional pipeline is not expected to cause risk of
contamination. However, the water intake facility should be carefully designed to avoid any issues at
the area of intake. The shape and design of the intake pipe, its exact location in relation to the local
morphology at the lake and flow velocity at the point of intake all need careful consideration to avoid
impacts. Due to the importance of the Lake, in order to receive a permit for extraction, it must be
demonstrated that no significant harmful impacts will be caused.
Existing watercourses within project area: Currently there are two small watercourses, the streams
Narbäcken and Stavabäcken located within the project area, and the small Lake Gyllingesjön through
which Stavabäcken flows. In the current plan the channels are not intercepted, however the
catchment areas of the watercourses are modified. These streams flow into Lake Vättern through the
Natura 2000 area and nature reserve Holkaberg och Narbäck. These streams will need to be
preserved and no significant deterioration in water quality or quantity is expected to be permittable.
The impact of pit drainage on Lake Gyllingesjön has not been implicitly assessed, but it is expected
that the water level in the lake is directly dependent on groundwater level. Therefore if pit drainage
results in a groundwater drawdown zone of influence that extends to the lake, the water level in the
lake would be affected. The preliminary assessment suggests a drawdown radius of influence of
approximately 500 m (drawdown in bedrock) (see Section 20.2.4). The shortest distance from the 20
year pit to the lake is about 700 m. Furthermore some of the precipitation currently flowing into the
lake will be considered to be contact water and thus intercepted and led towards the Adelövån.
Therefore the issue should be further investigated. The impact on the lake should be further assessed
and monitored. Should further investigations indicate cause for concern, technical solutions are
available to mitigate the effect and should be designed accordingly.
Management measures should be developed to avoid significant contamination of the water in the
streams and to maintain flow rates at or near natural rates. Currently measures are planned to ensure
all contact water will be diverted to the Adelövån catchment. When this approach is successfully
implemented, risk of significant contamination at these two streams is considered low. On the other
hand it must be simultaneously ensured that sufficient flow will be available in the streams.

NI 43-101 - Technical report Norra Kärr REE - 0465-RPT-014 Rev 1
Page 280
20.2.3 FURTHER WATER MANAGEMENT DESIGN NEEDS
Detailed water management plan: In the future stages of project development, a detailed water
management plan should be developed. The plan should reconsider potential needs for further
treatment of the water to be discharged into the environment. All mines in Sweden have in their
environmental permits discharge limits for various substances in the water discharged into the
environment. The substances controlled by the permits and the limit values vary depending on the
expected waste waters and the receiving environment. The discharge limits that will be applied at
Norra Kärr will be established during environmental permitting.
Particular note should be taken in the future water management plan to consider potential need for
nitrogen removal (from pit outflow or environmental discharge). Several Swedish mines have
discharge limits for nitrogen in waste water and the issue appears to be gaining importance.
If significant impacts on water quality are predicted in the future investigations, mitigation measures
are expected to be required. Depending on the contaminants of concern and their concentrations,
various types of treatment options exist for water discharges varying from simple after-treatment units
to sophisticated treatment processes.
Furthermore the water management plan should concentrate on management of water quantity,
considering both the need to avoid excessive discharge to the Adelövån (including consideration of
flood risks) and maintain sufficient flow in the small streams within the project area. Issues relate to
flow rates will also be established in environmental permitting.
20.2.4 GROUNDWATER
20.2.4.1 OPEN PIT
Open pit mining will involve drainage of surface runoff and seeping groundwater. The lower benches
of the pit may also have drain boreholes installed to decrease groundwater pressure in the slope walls
for stability reasons (19). The predicted maximum groundwater inflow rate is about 50 L/s at the end
of mining. The drainage will result in a local drawdown of the water table in the immediate
surroundings of the open pit. The spreading of the drawdown will depend on the development depth
of the pit, and the radius of influence has been estimated by both analytical calculations and by
numerical groundwater modelling to extend approximately 500 m from the perimeter of the open pit at
full development depth. The westward radius of influence is estimated to be shortest due to the
topographical water divide between the site and Lake Vättern.
Groundwater levels in both the bedrock and the soil may be impacted within the influence area of the
open pit. However, the drawdown in the soil will be smaller than in the bedrock, the magnitude
depending on the permeability of soil and bedrock, the soil depth and the recharge rate. In this case
the permeability of the soil is estimated to be relatively low. The groundwater levels in the soil are

NI 43-101 - Technical report Norra Kärr REE - 0465-RPT-014 Rev 1
Page 281
therefore not expected to be affected more than marginally in most of the influence area. However,
vegetation could be affected by groundwater drawdown close to the open pit perimeter.
The yield of wells in bedrock in the area has been estimated from regional hydrogeological
information to 600–2000 l/h and smaller than 600 l/h in the area north-east of the site (Golder, 2012).
There is a risk of naturally high levels of fluoride in the groundwater in the bedrock in the whole area
due to mineralogy of local rock. There are 10 private wells within 1 km of the mining concession area
registered in public records, both water supply wells and geoenergy wells. No water supply wells are
identified close to the planned open pit; however, two geoenergy wells are located at Kaxtorp
immediately to the south of the proposed pit area. About seven of these wells are estimated to be
located within the area of influence of the open pit and the risk for drawdown of groundwater levels in
wells decreases with the distance to the pit. The two (geoenergy) wells closest to the planned open pit
belong to properties that probably will be acquired by the mine prior to start of mining operation. No
protected areas are located within the estimated area of influence and are not expected to be affected
by the groundwater drawdown.
The surface waters at the site, i.e. wetlands, streams, ponds and Lake Gyllingesjön, are believed to
be dependent on groundwater level and groundwater drawdown may thus impact surface water levels
and discharge.
20.2.4.2 TAILINGS STORAGE FACILITY AND SEDIMENTATION POND
Water stored in the TSF and the sedimentation ponds will to some degree seep to the underlying
groundwater in soil and rock. The seepage rates depend on the hydraulic properties of the basement
geological materials, the design of the facilities and on the management and disposal practices of the
facilities. The probable seepage rates have not been quantified at this stage (4). The potential impact
on the groundwater includes raised groundwater levels in soil and rock in the vicinity of the facilities
(lowered levels as a result of reduced infiltration due to low permeability of tailings is unlikely). The
changed groundwater flow conditions may also affect nearby surface waters, wetlands and surface
seeps. The potential impact on the groundwater at the proposed localisation of the tailings facility has
not been investigated in detail (4). Furthermore, the occurrence of water supply wells in the
surroundings of the proposed facility has not been investigated.
Potential changes in groundwater quality due to seepage from the tailings cannot be predicted based
on current information because data is lacking concerning two of the three tailings streams. Quality of
seepage water and its potential impacts should be investigated based on further information about
tailings geochemistry.
20.2.5 BIODIVERSITY
Terrestrial biodiversity and ecology have been investigated in the field on most parts of the
nominated project area. In these areas, certain nature values have been identified. Currently known
NI 43-101 - Technical report Norra Kärr REE - 0465-RPT-014 Rev 1
Page 282
values are of such character and significance that it is expected they will not present an obstacle for
the project to go ahead; however, some management measures are expected to be required. At a
minimum, a great crested newt management and compensation programme is expected to be
needed.
Some parts of the project area have been surveyed very briefly, or not at all. There will also be other
infrastructure directly related to the project that has not been sited yet such as the new power line. For
the study areas please refer to 20.1.9.
However the entire environment is considered to be anthropogenic. Furthermore Swedish authorities
are known to have environmental data of good quality and several county-level studies of nature
values have been performed in the area. Based on these considerations Golder expects that the
nature values related to the terrestrial ecology in the project’s impacted area are fairly well known.
Comprehensive ecology field studies covering the entire project area and the ecological area of
influence (including e.g. the power line) are expected to be required in the future to supplement
current data and to determine, among other things, the presence or lack of populations of endangered
species in more detail.
Based on currently available information, Golder considers it likely that there are no terrestrial nature
values of such character that they would present an obstacle for the project to go ahead. Nor is it
expected that such “showstopper" values will be identified in future studies. Certain mitigation or
compensatory measures may be required, for example for endangered plant species found in the
area it is possible that habitat compensation and translocation of the plants will need to be
undertaken.
Aquatic ecology of the potentially impacted watercourses has been partially investigated during the
baseline programme (Gyllingesjön and the streams towards Vättern i.e. Narbäcken and
Stavabäcken). Furthermore data from the water and environmental authorities of Sweden has been
collected concerning the planned receiving watercourse Adelövån. These watercourses are sensitive
and relate to high nature value. The Narbäcken and Stavabäcken flow into Lake Vättern through a
Natura 2000 site. The Adelövån flows away from Vättern, but the lakes downstream, including the
nearest Lake Noen, have high nature value. Lake Noen is described in the Swedish’ water authorities’
information system VISS as having very high biological function and high biodiversity value with
otters, many species of fish, rich birdlife and as well as certain rare plant species present. Lake Noen
is designated as a Nationally Especially Valuable Water (nature value) (“Nationellt Särskilt Värdelful
Vatten (Natur)”) as well as regionally valuable water (fishing) (VISS, 2014).
20.2.5.1 KNOWN NATURE VALUES (TERRESTRIAL)
Several parts of the project area have been identified to have regional-level value in environmental
studies undertaken by the respective counties of Östergötland and Jönköpings län. There are areas
defined to represent key biotopes by an inventory undertaken by the Swedish forest authority

NI 43-101 - Technical report Norra Kärr REE - 0465-RPT-014 Rev 1
Page 283
Skogssyrelsen. Furthermore trees defined as valuable for biodiversity, as well as some occurrences
of endangered plant species are known to be present within the project footprint.
Ecology baseline studies have been undertaken over parts of the project area in 2011 and 2012 (Pro
Natura, 2012; Pelagia Miljökonsult, 2012). In these inventories further valuable areas have been
identified. Most of the areas with highest biodiversity value are old agricultural land where historical
agricultural practices have resulted in a mosaic land use with high biodiversity value.
One such area of valuable agricultural landscape is the area around Kaxtorp and Mörstorp. While a
large part of this area will be affected and outright destroyed by the project (pit in the northern part,
plant area in the south-east), a significant portion will also be left outside of the project area. The
agricultural landscape around Ingefrearp has similar values. This area lies north and east of the mine
waste dump. With careful planning and carrying out of operations, most of these areas can likely be
preserved.
Golder expects these identified values are not likely to become material issues in permitting. The
designations and listings overlapping the project area are not restrictive as such (i.e. are not nature
reserves with statutory limitations to development), with the exception of some protected species and
the great crested newt. As concerns the protected species, the mining company will need to apply for
exemptions from the prohibition regulations under the Species Protection Ordinance (2007:845) for
each of the species in question. The exemption can be granted by the County Administrative Board
or, normally, be included with the environmental permit application and decided by the Land and
Environmental Court.
However, it is possible that some compensation measures may be required to be carried out to
compensate for loss of some habitats or to translocate some occurrences of endangered species in
addition to the great crested newt. The most important biodiversity values in the area are related to
previous agricultural uses. Because of this compensation by arranging active management (such as
use as pastureland or yearly mowing to simulate earlier practices of feed production) could possibly
be relatively straightforward to arrange.
20.2.5.2 GREAT CRESTED NEWT
Great crested newts (Triturus cristatus) are known to be present within the mining concession. In the
2011 ecology field study (Pro Natura) trapping was undertaken in several small ponds suitable for the
species. The presence of newts was established in one small pond within the concession area (west
of the two larger ponds at Norra Kärr and shown in Figure 20-10) as well as several other locations
nearby. At least one of the established locations is very close to the planned TSF boundary and likely
will be affected by the TSF. Furthermore the County of Östergötland has undertaken a newt study in
2006 and the species was identified at numerous places near the project site (Karlsson, 2006). There
are several similar small ponds in various places in the project area. Golder expects that some of

NI 43-101 - Technical report Norra Kärr REE - 0465-RPT-014 Rev 1
Page 284
these ponds are likely to have great crested newt populations in addition to the minimum of two
known locations to be affected.
The great crested newt, while not particularly rare in Southern Sweden (categorised as LC = Least
Concern as of 2010), is strictly protected under the EU’s Habitats Directive. Therefore any activities
that would cause deterioration of the populations or habitats will need to compensate for the losses
caused in order to get a permit.
Prior to any construction work, a compensation programme for the great crested newt should be
implemented. The programme will need to be approved by the supervising authority.
The newt management programme could include the following measures:
Design a management program, including:
o New habitat creation (recommended ratio 3:1 i.e. for each pond lost three new habitat
ponds should be created);
o Trapping and translocation;
o Measures to prevent translocated newts from homing back into their previous area;
and
o Habitat improvement programmes at other off-site locations to create net benefit for
species
Implement new habitat creation at compensation site(s)
Implement newt management for each pond affected
Monitor success
The programme must be based on accurate data. Therefore a comprehensive newt survey
encompassing all potentially suitable ponds in the entire project area should be carried out. The study
should be carried out in springtime (usually May) when the populations can be detected with highest
certainty.

NI 43-101 - Technical report Norra Kärr REE - 0465-RPT-014 Rev 1
Page 285
Figure 20-10: This pond within the concession area is home to great crested newt
20.2.5.3 POLLARDED TREES
Old pollarded trees are a distinctive biodiversity feature typical of the project area. There are many
such trees, and a large number have been classified as “worthy of protection” (skyddsvärda träd) by
the environmental authorities. Many such are located also directly within the project area, particularly
around the process plant area.
While it is inevitable that a number of such valuable trees will be lost as a result of the project, it would
be advisable to preserve any specimens where possible. The biodiversity value of these trees
depends on the individual tree and thus preservation of each one has value. For example a cluster of
such trees has been identified at Kaxtorp, close to the pit area but not within it. If care is taken in
advance the trees or some of them could probably be preserved. Preservation measures would
include identification of the important individuals in the field and reserving a small exclusion zone
around them.
Furthermore as compensatory measure the company could well establish a restoration pollarding
programme. The practical need for pollarding to produce animal fodder has ceased and thus it is to be

NI 43-101 - Technical report Norra Kärr REE - 0465-RPT-014 Rev 1
Page 286
expected less and less such very old trees will be found in the coming decades and even centuries.
The species residing on the bark of the current trees will be stressed for habitat. Establishing a
number of young ash trees at a few suitable locations and management of those by pollarding every
couple of years would give a good start for a future conservation programme and the cost would be
insignificant.
20.2.6 PROTECTED AREAS
There are no nature reserves, Natura 2000 sites, or other nature protection areas within the project
area. However, there are several current and planned protected sites nearby. The area is also
included in the East Vättern Scarp Landscape Biosphere reserve of the UNESCO (included in the
buffer zone).
Based on current information about project design (i.e. all process equipment to be indoors and make
up water pipe to be located in the gap between future Natura 2000 sites) it is expected that impacts
caused to these sites are not likely to become obstacles to project development. However, further
impact studies and Natura 2000 Appropriate Assessment (minimum of screening assessment but
possibly also full assessment) will likely be required for environmental permitting.
Due to the closeness of the Lake Vättern protection zone, there may be limitations on the quantity of
chemicals stored at the site. In addition, there may be need for additional safety measures for the
case of spills. However, the protection zone does not extend into the project area.
The deposit and the mining concession are located within a National Interest for Nature Value area
(Riksintresse naturvärde). The interest conflict between protection of this Nature Value and the
interest to exploit the mineral resources was resolved when the mining concession was granted. In
this case the exploitation interest was given precedence and the Nature Value interest of this
particular designation was deemed secondary. Any other National Interest areas conflicting with the
exploitation activities, should there be any, will need to be separately resolved in further decisions.
The current project area does not intercept other National Interests for Nature Value.
20.2.7 GEOCHEMISTRY
Current information available about the project geochemistry is partially lacking. Waste rock
characterisation is complete. The nephelite/ feldspar tailings have been mostly characterised (a one
year humidity cell testing is still undergoing). These two streams have been determined not to be
problematic and the acid rock drainage potential is low. However, there is no data available for the
leached and neutralised tailings and the gypsum from neutralisation. As there is no material available
for testing, assumptions have been made concerning these streams and their suitability for disposal.
According to available information, the deposit has background levels of radioactivity. Testing of
deportment of radionuclides was conducted by ANSTO Minerals in 2013-2014. While the testing
focused on product and was undertaken for the purposes of process development, the related

NI 43-101 - Technical report Norra Kärr REE - 0465-RPT-014 Rev 1
Page 287
memorandum (ANSTO, 2014) states also that the neutralised waste (corresponding to the leached
and neutralised tailings) contains only very small amounts of U and Th, and is not radioactive as per
the definition of a radioactive substance by the International Atomic Energy Agency.
20.2.8 AMENITY IMPACTS
Mining activities will result in certain noise, dust, vibration and visual impacts in the project area and
around it. On the other hand, the project area is close to the busy main motorway. Thus the difference
in relation to existing baseline conditions will be less pronounced than in a more remote location.
These impacts should be studied further in the later stages of project development. Dispersion
modelling is likely to be required to be undertaken as part of the Environmental Impact Assessment
(EIA) for environmental permitting.
A brief study about the mine’s predicted impact on seismic risk in the area has been undertaken by
ITASCA Consultants AB (2012). Vibrations caused by the operation are expected to be so small that
they will not have an impact on seismic activity or occurrence of earthquakes (which are naturally very
few and of unnoticeably low magnitude in this part of Sweden).
Considering that the dwellings most severely affected will be purchased by Tasman, these impacts
are not expected to cause material obstacles to project development.
However, based on the results of the studies to be undertaken later, some mitigation measures may
need to be undertaken. Potential mitigation measures could include the construction of a noise
protection fence or bunds, visibility screening bunds, etc. These will be determined in environmental
permitting.
20.2.9 CULTURAL HERITAGE
An archaeology survey has been undertaken for the area of the mining concession. The survey only
covers a portion (less than half) of the footprint. A field inventory encompassing the entire project area
is likely to be required to be undertaken for environmental permitting. Any other cultural heritage
values such as potential values related to existing buildings have not been investigated.
Based on current information, obstacles to project development are not expected. Some detailed
inventory work of potential findings may need to be required to be undertaken before construction of
facilities may proceed. The need for such measures will be established by the field survey and cannot
be determined at this point.
Three of the targets identified in the study already undertaken are listed as requiring further inventory
(Phase 2 study) before the target site can be disturbed. One of these targets is within the 20 year pit
area and the other two very close to its planned borders.
The coastal plain of Lake Vättern within the municipality of Jönköping is designated as a Natural
Interest Area for protection of cultural environment (Riksintresse för Kulturmiljövård). Due to the steep

NI 43-101 - Technical report Norra Kärr REE - 0465-RPT-014 Rev 1
Page 288
topography the project site is not expected to be visible to the Natural Interest Area and thus no
impact is expected.
20.2.10 ENERGY USAGE
The energy demand of the project is significant. The power requirement has been estimated to be 10
MW of electrical power and 12-15 MW of thermal.
Electricity will be available from a range of suppliers, as the electricity markets in Sweden are
deregulated. A new high voltage connection to the site will be developed if the project proceeds.
Preliminary negotiations with power company Vattenfall have been initiated.
Although the proportion of electricity produced by renewable sources is comparable high in Sweden
(48 %), the electricity available in the Swedish national grid represents the residual mix of production
sources in the Nordic countries from which certified green energy purchases by users have been
subtracted. For 2013 this residual mix has been calculated to contain 9.5 % renewable energy,
34.5 % from nuclear production and 55.5 % from fossil fuel production. However, it is possible to
procure “green energy” by purchasing green energy certificates. By this system the electricity user is
guaranteed access to electricity from renewable sources such as hydropower or certified wind. Green
electricity comes with a premium.
The required heat has been determined to be produced on site by boiler using fuel oil as the base
case for PFS design. The total consumption of fuel oil would be over 12 000 m3 a year (1 376.3 l/h) or
approximately one fuel truck every day.
A preliminary survey of alternative sources of energy has been undertaken by Golder in connection
with the PFS. The following options have been identified:
Purchasing green energy certificates for a premium, to ensure part or all electricity used is
produced by renewable sources (bio fuel, wind, solar and/or hydropower);
Procuring electricity from a local renewable producer, e.g. by acquiring shares of a wind
power company situated nearby;
On-site low enthalpy geothermal energy;
Geothermal energy is often a very cost effective option in mining areas where there may be
boreholes and other suitable infrastructure readily available:
o The granite bedrock in the site area has good geothermal properties. Several of the
nearby houses have (household-scale) geothermal wells in utilization;
o Geothermal energy is well suited for heating of buildings and de-icing of roads,
portals etc. in the temperature ranges typical of the Nordic environment. Geothermal
energy is also suitable for pre-heating in the process plant. However, geothermal
energy is not suitable for high-temperature applications such as evaporation;

NI 43-101 - Technical report Norra Kärr REE - 0465-RPT-014 Rev 1
Page 289
On-site boiler plant or CHP (combined heat and power) utilizing bio fuel such as wood chips
or pellets, straw or biogas:
o On-site bio fuel plant could be used to generate heat for evaporation, all heat demand
or heat and some of the electricity (CHP). Equipment for installations from small (<
1 MW) to very large (> 300 MW) is available in the Nordic market;
o Wood-based biofuels are the most widely utilised in Sweden. Wood chips are readily
available and there are several suppliers in the area;
On-site solar production receives investment support from the state (up to 35 % of installation
cost); or
Combination of the above:
o For example a CHP of 20 MW capacity could produce 15 MW of heat and 5 MW of
electrical power. Such a CHP plant could use wood chips and peat.; and
o The remaining electrical power needed could be procured from a power company and
supported by on-site solar.
Further study to identify preferable options should be undertaken. The study should take into
consideration operability, cost and environmental impact. As solid wood-based fuels are bulky and
generate lots of transport requirements, it would be advisable not to make the boiler plan
unnecessarily large. An optimal solution could include on-site generation of heat only (bio fuel boiler
plant for steam, supplemented by geothermal for lower temperature range needs) with electricity
supplied from a power company. However, all options including CHP should be considered in more
detail in the further study.
An environmental permit is required:
For boiler plant or CHP unit, if the power output is over 10 MW, when using fuel oil or gas
only;
For boiler plant or CHP unit, if the power output is over 0.5 MW, when using other fuels such
as biofuel;
If power output is over 20 MW (either case) and the plant is permitted separately, the permit
application is submitted to the County Administrative Authority CAB, below 20 MW the
permitting authority is the municipality environmental department;
If more than 10 MW of geothermal energy is utilised, the permitting authority is the
municipality environmental department;
In any of the above cases, the environmental permit for the energy installation can be
included with the mine’s overall environmental permit application and decided by the Land
and Environment Court.

NI 43-101 - Technical report Norra Kärr REE - 0465-RPT-014 Rev 1
Page 290
20.3 WASTE AND TAILINGS DISPOSAL
20.3.1 WASTE ROCK
A mine waste dump of about 3-4 Mm3 capacity is being planned to be placed between the industrial
area and the TSF and related ponds. Geochemical characterisation has been carried out for the
waste rock (Golder, 2013).
Based on the characterisation results for the waste rock it is expected that the waste rock will be
considered as inert waste and no requirement for containment structures is anticipated. Waste rock is
expected to be usable for TSF construction, when available. The seepage water is expected to not be
problematic based on current data available on waste rock quality.
Nevertheless, surface runoff at the mine waste dump area is planned to be collected in a ditch and led
into a balancing pond, where it will be discharged into the Adelövån stream away from Lake Vättern.
20.3.2 TAILINGS
Three types of solid tailings will be produced:
Nepheline / feldspar tailings from magnetic separation;
Leached neutralised tailings from hydrometallurgy; and
Gypsum sludge from water treatment.
In addition to the above streams, the water recycling system produces concentrated sulfate brine that
will not report to the TSF.
A preliminary design for the TSF has been prepared for the PFS stage by WAI. The suggested
approach is co-disposal of all three tailings streams. Co-disposal is often a good strategy as some
contaminants would likely become immobilized by precipitation and sorption reactions, depending on
the pH and redox conditions in the TSF. However, the resultant quality of any excess water from the
TSF after these potentially stabilizing effects cannot be predicted, because no chemical
characterization is available for two of the solid tailings streams (leached neutralised residue and
gypsum).
On the other hand, co-disposal of gypsum may present a risk that in time it could start to dissolve, if
the equilibrium conditions are not uniformly upheld. Co-disposal can have numerous benefits and help
with stabilization of the wastes if it is done properly. However, this requires sufficient information
about characteristics of all waste streams as well as other conditions, and careful design.
In practice, also in cases presented in the BAT document for the Extractive Waste Directive
(2006/21/EC), co-disposal is in use at many mines across Europe and is reported to be acceptable.
This is however only expected to be the case when it can be demonstrated that the streams
NI 43-101 - Technical report Norra Kärr REE - 0465-RPT-014 Rev 1
Page 291
combined for co-disposal will not react or interact in ways that would increase potential negative
impacts, or generate new harmful impacts.
Thus co-disposal of streams where one fraction helps stabilize contaminants in another fraction could
be good practice, whereas increasing risk of environmental contamination by co-disposal would not
be acceptable. More information as to the chemical characteristics of each of the solid tailings
streams as well as all water streams intended for the co-disposal will be required before suitability can
be established with certainty.
As there is insufficient data available on the chemistry of two of the three tailings streams, it is not
certain whether the combined waste stream will be considered to be inert waste. If future testing of
the combined stream or some of the components indicated that this material is not inert, the
requirements for containment structures both at operational phase (bottom structures and liners) and
at closure would be stricter and associated costs considerably higher. Should the waste stream be
determined hazardous waste, the requirements and costs would be even higher again.
According to WAI’s preliminary design, a low permeability lining is recommended for the TSF dams,
comprising of a single layer (60 mm) of asphalt cement. Wardell Armstrong estimates that the risk of
pollution associated with the thickened and combined tailings is low (Wardell Armstrong, 2014).
However, the test results are incomplete, the quality of the excess water discharged cannot be
predicted, and consequently, its impacts on receiving water courses or ground water quality cannot be
fully determined.
20.3.3 SALT RESIDUE
Process water is being recycled in a water treatment plant using RO technology. According to
information received from process design, the RO plant produces sulfate brine (concentrated solution
of salts) and water that is recycled back to the process. The sulfate brine will be evaporated on site to
form dry salt residue. The salt residue will be a crystalline solid with less than 15 % moisture. Annually
18 333 t of the salt residue will be generated.
The salt residue is proposed to be transported off-site to an appropriate treatment facility that has
environmental permit and suitable processing and/or disposal facilities available to dispose of such
material in an environmentally safe way. The related cost has been included in the OPEX calculation.
20.3.4 OTHER WASTE STREAMS
20.3.4.1 NON-HAZARDOUS WASTE
Conventional waste such as waste paper and cardboard, empty packages, trash from offices and
personnel quarters, non-hazardous waste from maintenance etc. will be collected and sorted for
recycling at the source. A waste management company/ companies will collect the waste from the site
and deliver it for proper treatment or disposal.

NI 43-101 - Technical report Norra Kärr REE - 0465-RPT-014 Rev 1
Page 292
20.3.4.2 HAZARDOUS WASTE
All hazardous wastes, which mainly consist of chemical waste and empty packages of some process
chemicals, will be collected separately. The hazardous waste will be collected from the site by a
professional company licensed to treat hazardous waste and delivered to a proper treatment or
disposal facility.
20.3.4.3 SANITARY AND MAINTENANCE WASTE WATER
Sanitary waste water will be collected into a closed tank system and transported off-site by pump-
truck into an appropriate treatment facility (municipal waste water treatment plant or similar). There
will be no environmental discharge of sanitary waste water from the site, whether purified or not.
Waste water from maintenance activities will similarly be collected into the closed tank system or
otherwise managed according to Swedish regulations and practices. Oil traps will be installed in areas
where there is a possibility of oil leaks from machinery.
Sanitary and maintenance waste water are not expected to pose a significant risk to soil, groundwater
or surface water quality.
20.4 SITE MONITORING
20.4.1 BEFORE CONSTRUCTION
A baseline surface water monitoring programme was performed in 2012 – 2013 by Sweco
Environment AB. A few one-off groundwater samples have also been taken.
A regular monitoring programme should be commenced prior to the start of construction to establish a
comprehensive baseline.
20.4.2 CONSTRUCTION AND OPERATION STAGE
A stringent site monitoring programme will be carried out throughout the construction and operation
stages of the mine project development. The monitoring requirements will be set in the environmental
permit. It is expected that the monitoring programme will include, but may not be limited to, the
following:
Emissions monitoring;
Monitoring of operations and maintenance activities;
Surface water (quality and quantity):
o Adelövån, Gyllingesjön, Stavabäcken, Narbäcken, TSF and other storage ponds;
Groundwater (quality and quantity):
o from a number of existing drill holes;

NI 43-101 - Technical report Norra Kärr REE - 0465-RPT-014 Rev 1
Page 293
o additionally some new groundwater monitoring boreholes and wells are likely to be
required; and
o also monitoring of private wells in the vicinity;
Biodiversity (great crested newts, other species, bioindicators);
Dust (fallout);
Noise;
Vibration and structural effects on nearby houses; and
Traffic surveys.
20.4.3 CLOSURE AND POST-CLOSURE
The monitoring requirements for the closure and post-closure stage will be outlined in the
environmental permit and specified in the final closure plan. It is expected that monitoring will be
required to be carried out for a period of time after closure activities have been finalised. Under
current legislation the post-closure monitoring requirement is normally 30 years. Post-closure
monitoring is expected to focus on monitoring of potential emissions, stability of remediated areas and
structures, and quality of surface water and groundwater.
20.5 WATER MANAGEMENT
Potential environmental issues related to surface waters (quality and quantity) have been considered
in Section 20.2.2. In the design phase, a detailed water management plan should be created based
on further information about quality and quantity of various water streams.
This section outlines current water management design. Current process design incorporates a water
recycling plant, resulting in a considerable reduction of both make up water intake and the discharge
water flow rate.
20.5.1 EFFLUENTS
Currently, the following water treatment and management has been proposed:
Process water recycling: all raffinate water from the process is purified in the process water
treatment plant (RO + nanofiltration) and reused in the process. In the current design there is
no liquid water stream leaving the process.
Any storm water that might become contaminated with process liquids or chemicals in the
process plant area will be collected into the process water recycling system. However, as all
process equipment is to be housed inside buildings, no such contamination potential is
expected.
Surface water runoff will be collected from all road areas and the industrial area (roof water
and yard areas) and discharged towards the stream Adelövån.
Drainage water from the open mine pit will be diverted towards the stream Adelövån.

NI 43-101 - Technical report Norra Kärr REE - 0465-RPT-014 Rev 1
Page 294
The waste rock dump will be equipped with seepage collecting ditches installed around its
perimeter as well as a sedimentation pond and oil filters. Waste rock is also used in dam,
road and other infrastructure construction. Surface runoff from the area of the mine waste
dump will be collected and discharged towards the Adelövån.
Excess water from the TSF will be diverted to a sedimentation pond.
Sanitary waste water will be collected into a closed tank system.
Consequently, waters discharged to the environment at the site will be:
Excess water from the sedimentation pond (at TSF), discharged at Dam 2; and
Surface water runoff and pit drainage water, discharged to the direction of Adelövån. Point of
discharge to be defined later but likely to be located at or close to Dam 2.
In general, the impacts on receiving water courses are created via the quality and quantity of the
effluents, as well as the sensitivity of the receiver.
20.5.2 SEEPAGE WATER
20.5.2.1 WASTE ROCK AND OPEN PIT
Explosives (ammonium nitrate and fuel oil) produce nitrogen and oil hydrocarbons in the seepage
water of the open pit and waste rock.
The waste rock material has been tested for acid formation and leaching potential. Testing is
assumed to indicate also the quality of seepage water from the open pit. According to the test results,
for the waste rock, acid rock drainage is not expected and metal leaching potential is considered very
limited. Testing performed included screening testing, acid base accounting, shake flask and humidity
cell testing for 20 weeks.
In general, from an environmental point of view, waste rock is likely to be suitable for construction of
dams, roads and other infrastructure.
20.5.2.2 TSF
There is insufficient information about tailings geochemistry. Quality of seepage water cannot be
determined. Wardell Armstrong (4) estimated that the risk of pollution associated with the thickened
and combined tailings is low, however this assumption needs to be verified in the future when more
information is available.
An assessment of the risks to the surface and groundwater environment from the TSF will be
undertaken as part of the environmental permitting process.
20.5.3 SITE WIDE WATER BALANCE
PFS-level water balances have been developed for the project. Water balances for the open pit and
the TSF were drawn up by WAI and the process water balance by GBM. Golder has developed the

NI 43-101 - Technical report Norra Kärr REE - 0465-RPT-014 Rev 1
Page 295
Site Wide Water Balance (SWWB) using these components as inputs for pit, TSF and process. The
water balances are modelled on a monthly time-step.
Furthermore the SWWB includes runoff from all other areas of the Project area. For the purposes of
the PFS it is considered that no water coming into contact with the mining will be discharged towards
the Lake Vättern. This applies also to all surface runoff from road areas etc.
20.5.3.1 METEOROLOGICAL DATA
Precipitation records for the SWWB are adopted from the Högemålen Meteorological station, located
about 5 km S/SE of the Norra Kärr site or about 3 km S of the southern end of the TSF ponds. A daily
record of precipitation (rainfall and equivalent water in snow) was obtained for the period spanning
from 1961 to 2014. A concurrent monthly average temperature record was obtained for the
Ramsjöholm Meteorological station, also in relatively close proximity to the site for the same period.
In order to allow for the natural lag between snowfall and snow melt, the precipitation record was
adjusted based on a snow melt threshold of -2.5 °C (WAI, 2014a). This effectively defers some of the
precipitation (as runoff) from the winter months (November - April) to the warmer spring months (May
onwards). Table provides summary statistics for the precipitation, temperature and snowmelt
adjusted time series.

NI 43-101 - Technical report Norra Kärr REE - 0465-RPT-014 Rev 1
Page 296
Table 20-7: Input Meteorological Data and WAI snowmelt adjustment
Month Average Monthly Precipitation1
(mm)
Average Monthly Temperature2
(°C)
Snowmelt adjusted Precipitation
(mm)
January 41.9 -2.2 20.6
February 32.4 -2.4 16.6
March 32.3 0.2 35.6
April 37.6 5.5 80.4
May 44.0 10.2 59.7
June 66.2 13.5 66.3
July 77.9 16.1 77.9
August 73.6 15.3 73.6
September 61.1 11.2 61.1
October 59.5 6.4 59.5
November 55.6 2.3 52.4
December 49.8 -1.2 28.1
Annual 632.0 6.2 631.8
Notes: 1 Data from Högemålen Meteorological Station 2 Data from Ramsjöholm Meteorological Station
Based on data given in Table 20-8, the percentile annual depths representative of a dry, median, wet
and extreme wet year were estimated.
Table 20-8: Percentile Annual Precipitation Depths
Climate Scenario Annual Precipitation
Dry Scenario (5th Percentile) 483.6
Median Scenario (50th Percentile) 622.4
Wet Scenario (95th Percentile) 765.8
Extreme Wet Scenario (99th Percentile) 864.9
Using the percentage distribution of rainfall across each calendar month for the precipitation and
snowmelt time series, these climate scenario annual depths were converted into equivalent monthly
averages.
A synthetic 20 year record for each scenario was created by looping the individual climate scenario
year 20 times to represent the proposed transient life of mine development. As mining operations are
projected to commence in the month of May, month 1 is assumed to be May.
Evaporation data for the SWWB has been adopted from the potential evaporation data for Jönköping
Meteorological station, adjusted for monthly mean temperature and total annual evaporation.

NI 43-101 - Technical report Norra Kärr REE - 0465-RPT-014 Rev 1
Page 297
For areas of catchment contributing to the SWWB and not captured elsewhere in the component
water balances, a Rational Method calculation has been applied to estimate losses to evaporation,
infiltration and soil moisture deficit. The runoff coefficient allows estimation of the volume of incident
rainfall which results in runoff. (The Rational Method is described by the equation Q = CiA where Q is
estimated runoff, C is runoff coefficient and A is catchment area).
20.5.3.2 PROCESS WATER BALANCE
The process water balance assumes all raw water intake is supplied from Lake Vättern, the
impounded excess water at the tailings facility being geochemically unsuited for use in the process
plant. The water requirement for the process was defined under the process developments scope.
There is no outflow of liquid water from the process. Water entrained within the tailings stream is
assumed to be captured in the tailings water balance and thus the process balance does not need to
be independently represented in the SWWB.
20.5.3.3 PIT WATER BALANCE
The WAI pit water balance was presented as a series of spreadsheet based pit inflows and pit
outflows for each of the four climate scenarios provided by Golder. This water balance is dominated
by groundwater inflow.
The extent of the pit area identified in WAI’s pit water balance is 17.9 hectares based on the
economic pit extent rather than the total 20 year LOM pit extent of 25.2 hectares on design drawings.
Golder has taken the WAI pit water balance as it is and thus runoff from this additional 7.3 hectares of
catchment is not included as an additional inflow to the SWWB.
20.5.3.4 TSF WATER BALANCE
The WAI TSF water balance is presented as a series of spreadsheet based TSF inflows and TSF
outflows for each of the four climate scenarios provided by Golder. Wardell Armstrong’s report
“Spillway Design - Hydrological Analysis” (20) presents the basis for the sizing of TSF ponds which in
turn govern the TSF water balance.
The key constraint imposed in this water balance is in the temporal restriction of discharge to the
Adelövån during the summer months. Decant pumping from TSF ponds is considered to be prohibited
between May and September, inclusive, so that discharge to the Adelövån will coincide with elevated
flows in receiving watercourses during the wetter winter and spring-melt months. Overflow through the
spillways is permitted during this period during storm events, with only the extreme wet scenario
producing such an overflow event during the summer months.
While the specific months to which restrictions apply may not reflect the real low flow months in a
typical year (as in the site conditions this varies widely between years), this conceptual approach
allows representation in the models of discharge thresholds and restrictions which will likely be in

NI 43-101 - Technical report Norra Kärr REE - 0465-RPT-014 Rev 1
Page 298
place. The thresholds which will likely be applied will result in periodic impoundment of excess water
from the site and for PFS level studies the conceptual monthly restriction sufficiently represents this
constraint.
The TSF outflow series indicate a large water surplus for this part of the site, representing a large
proportion of the natural flow in the Adelövån watercourse.
20.5.3.5 AREAS CAPTURED IN THE SWWB
The following were not captured by the component water balances and have been considered in the
SWWB:
Mine Waste Dump: In the absence of a deposition plan the area of the mine waste dump was
estimated based on yearly tonnage as estimated by Wardell Armstrong. The maximum area was
estimated to be 275 243 m2 in Year 20.
No losses are assumed for the mine waste dump area, all runoff both direct and infiltrated being
captured in a toe drainage and under-drainage system. While in reality there will be significant losses
due to soil moisture deficit, surface evapotranspiration of remediated areas and direct
evaporation/ablation of snow, for conservatism it is assumed that 100 % of these flows are captured
and conveyed to the system. This modelling assumption is appropriate for a PFS level study, to be
replaced with a more detailed model in later feasibility level studies.
Process plant area: Precipitation to the area of the process plant (runoff from yard areas and roofs)
is not included in the process water balance and was thus estimated in the SWWB. The area of the
process plant was estimated based on the drawings by GBM. The overall extent of the plant area is
assumed to be 8.14 hectares based on currently available plans. This includes buildings, access
roads, circulation areas and parking areas within the plant as well as the ROM pad.
All contaminated runoff within the plant area is recycled as part of the plant process. Runoff from roof
areas and a proportion of the plant area access roads would in reality be considered to be
uncontaminated. However for the purposes of the PFS, all water coming into contact with the mining
operation is assumed to be diverted to the Adelövån catchment. Based on interrogation of the
supplied design drawings, a nominal 40 % of the plant area is assumed to be diverted to the SWWB,
the remainder being assumed to be recycled within the plant area processes or lost to the
environment. The diverted runoff is assumed to be discharged from a balancing pond / storage basin
towards the Adelövån.

NI 43-101 - Technical report Norra Kärr REE - 0465-RPT-014 Rev 1
Page 299
Access and haul roads: Road areas taken from the design drawing files with the following surface
area:
Table 20-9: Haul and Access road areas
Description Area (m²)
TSF to Mine Waste Dump Haul Road 15 666
Plant to Mine Waste Dump and Plant to Mine Waste Dump Haul Roads
15 724
Plant Area to Western Access road 10 702
20.5.3.6 DUST SUPPRESSION
Two categories of dust suppression water supply are assumed to be required at the site:
Crusher plant dust suppression; and
Access and haul road dust suppression.
For the purposes of the PFS level SWWB, it is assumed that both of these dust suppression
requirements can be made up from pit dewatering and mine runoff flows.
Crusher plant dust suppression requirements are based on the 1 150 000 tonnes per annum
throughput equating to a 131 t/hr crushing rate and a total water demand of 42 m³ per day.
Based on accepted application rates for mine sites in similar climatological regions, a rate of
2 l/m²/hour is used for haul road dust suppression requirements. This is equivalent to 48 mm per day
applied to haul road areas, assumed to be applied year round. Dust suppression demand for access
roads and other areas of the site is assumed to be zero; as this site is in water surplus.
20.5.3.7 WATER BALANCE MODEL
Figure 20-11 shows how the component water balances have been integrated and identifies the areas
of the mine infrastructure solely considered under the SWWB.
The component water balances have been integrated together with additional runoff areas from areas
solely considered in the SWWB based on the conceptual model set out in 20.5.3.5. Component water
balance outputs are included as “black-box” sub-models, monthly outputs from the TSF and pit
models presented as time series.

NI 43-101 - Technical report Norra Kärr REE - 0465-RPT-014 Rev 1
Page 300
Figure 20-11: Conceptual Water Balance flow diagram

NI 43-101 - Technical report Norra Kärr REE - 0465-RPT-014 Rev 1
Page 301
The SWWB has been implemented in the Goldsim 11.1.1 modelling platform, using a monthly
reporting time-step.
In line with the conceptual model set out in 20.5.3.5, it is assumed that non TSF flows are combined
in a nominal balancing pond in order to compute the supplementary volume required at the TSF. This
balancing pond has not been designed at this stage and will be revisited in future design stages. It is
possible that this balancing pond would form an additional volume within the TSF ponds. No
evaporative losses or dimensions are assigned to the nominal pond in the model as it is assumed for
the purposes of modelling that this volume would be contained within the TSF ponds and thus these
losses are already accounted for in the TSF balance.
In order to interrogate the likely additional volume required, a range of allowable average monthly
discharge rates from non-TSF sources to the balancing pond/additional storage is assumed: 75 L/s,
100 L/s and 150 L/s. These discharge rates were selected iteratively with a goal of limiting runaway
volume generation in the nominal pond. At lower allowable rates of discharge, the required storage
volume escalates to impractically high levels.
In additional to this rate limiting, the same temporal restriction as is employed in the TSF model is
also applied here: discharge to the Adelövån is restricted to overflows only (i.e. no planned
discharges or decant flows) from May to September inclusive.
The model also allows interrogation of flows at intermediate points within the model and the
evaluation of the relative importance of each component balance and source of runoff within the
overall SWWB.
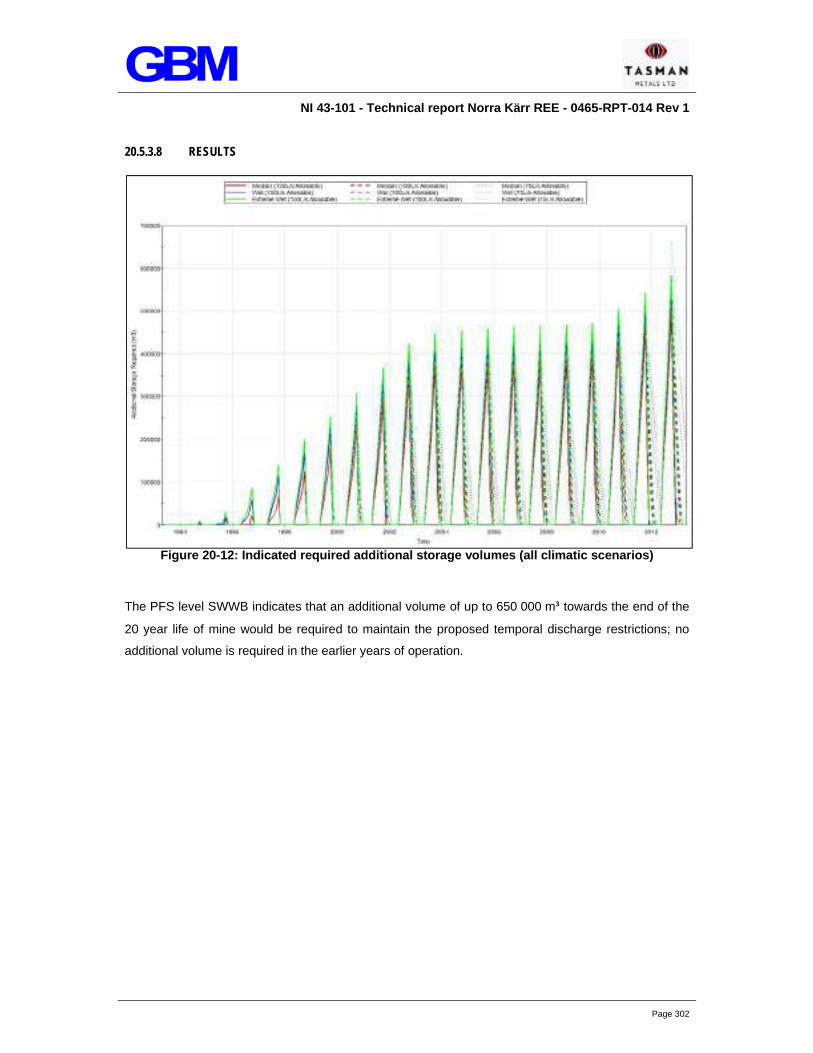
NI 43-101 - Technical report Norra Kärr REE - 0465-RPT-014 Rev 1
Page 302
20.5.3.8 RESULTS
Figure 20-12: Indicated required additional storage volumes (all climatic scenarios)
The PFS level SWWB indicates that an additional volume of up to 650 000 m³ towards the end of the
20 year life of mine would be required to maintain the proposed temporal discharge restrictions; no
additional volume is required in the earlier years of operation.

NI 43-101 - Technical report Norra Kärr REE - 0465-RPT-014 Rev 1
Page 303
Figure 20-13 identifies the overall (total) discharge required when combined with outflows from the
TSF model. Clearly the original TSF outflows still dominate the discharge regime with the additional
discharge increasing the required rate to a peak of between 305 L/s and 380 L/s average monthly
flow.
The SWWB indicates that a range of average allowable monthly additional discharges (between 75
L/s and 150 L/s) will allow excess volume generated from elements of the mine not modelled in the
TSF balance to be retained on site. The SWWB indicates that an additional volume of up to
650 000 m³ will be required at the TSF to maintain the proposed temporal discharge restrictions.
However, no additional volume is required in the earlier years of operation, minimising the capital cost
of provision of this storage.
While this SWWB model predicts additional discharge and storage volume are required from the TSF
to the Adelövån watercourse, the likely revisiting of the assumptions regarding disposition of
discharge are likely to reduce the requirement for additional storage and discharge. Further to this,
inclusion of refined models for mine waste dump, pit water management and TSF are likely to result in
reduction in overall water storage requirements albeit the effect of short (daily/sub-daily) spikes in
runoff need to be accounted for in the model.
20.5.3.9 SWWB CONCLUSIONS AND RECOMMENDATIONS
Possibilities to limit the amount of water that will need to be routed towards the Adelövån
should be explored. In the current model the operating assumption is discharging all water
towards there.
Figure 20-13: Total discharge to Adelövån (Extreme Wet scenario)
NI 43-101 - Technical report Norra Kärr REE - 0465-RPT-014 Rev 1
Page 304
The final design of the water management system has yet to be completed. A need for
additional water storage capacity for water pumped from the pit has been identified and will
be provided in the final design based on further information regarding realistic flow rates on
site. The water management plan should include measures to separate potentially
contaminated water from clean water to minimise the need for treatment prior to disposal and
maximise the potential discharge options such that the impact on the surface water
environment will be mitigated.
Plant water supply is entirely sourced from Vättern and does not vary. In reality it might be
possible to use water on site during much of the year for wash-down of trucks, dust
suppression, and other non-critical water needs. This is likely to decrease the requirement for
pumping from the Vättern and result in lower discharges to receiving watercourses.
Sub-monthly rainfall and evaporation distribution is not included in the models. The potential
evaporative losses and the effect of storm systems should be more accurately represented for
feasibility level water balance modelling.
The additional volume retention requirements should be examined using a combined TSF
pond and additional storage approach, rather than modelling as standalone storage.
20.5.4 SURFACE WATER RUNOFF
The quality of surface water runoff and particularly the outflow from the TSF cannot be estimated at
this point due to lack of data on the geochemical characteristics of the tailings to be co-disposed in
the TSF. In general, all surface water runoff is planned to be diverted to the direction of Adelövån.
TSF water will be collected into the TSF ponds system and discharged into the environment in a
single discharge point. Pit drainage water and surface runoff will also be diverted into the Adelövån,
either at the same discharge point or near it.
The SWWB developed for the project predicts very high flows from the site compared to mean natural
flow in the Adelövån stream. An overall discharge of 0.38 m3/s (380 L/s) at maximum is predicted.
Surface water runoff quality, quantity and treatment needs to be considered in the environmental
impact assessment and environmental permitting. At this stage, surface water runoff is not considered
to pose a major risk considering its expected quality or quantity
20.5.5 STORM WATER MANAGEMENT
Storm water infrastructure will be designed in the later stages of the project development. In the PFS
stage it has been determined that all surface water runoff will be collected from all areas of the project
area including site roads, and led into a balancing pond from where it will be discharged into the
environment with all other site water. The balancing pond and the TSF pond system discharge will be
into the stream Adelövån, away from the Lake Vättern.

NI 43-101 - Technical report Norra Kärr REE - 0465-RPT-014 Rev 1
Page 305
In recent years intense rainfall episodes appear to have become more severe, and this trend is
expected to continue because of global climate change. Therefore sufficient storm water management
infrastructure and auxiliary flood storage volume as well as contingency planning at the TSF to
accommodate excess water are highly important.
20.5.6 EFFECTS IN RECEIVING WATERCOURSE ADELÖVÅN STREAM
Flow rate data for the Adelövån stream itself is not available. However modelled data is available from
the Swedish Water Information System VISS. The modelled data is available for the entire catchment
“Mynnar i Noen” which basically is made up of the Adelövån stream. The average flow rate for the
catchment is 0.37 m3/s or 1 332 m2/h (2010-2012) and SWWB predicts for mining year 20 the
average discharge rate to be nearly 0.2 m3/s (200 L/s), with flows as high as 0.38 m3/s (380 L/s) in the
months of highest discharge (depending on the scenario). The highest discharge approximately
corresponds to the average flow rate of the receiving stream. However it should be noted that the
highest discharge from the TSF will be controlled to correspond with highest natural flow and thus the
proportion of the flow originating from the project is not expected to be quite as high at any given time.
Nevertheless the discharge of excess water to Adelövån is expected to be a significant portion of the
entire stream flow. This is expected to result in:
Strict requirements for discharge water quality;
Streamflow effects: the project may change seasonal flow patterns, although controlling the
discharge pattern can be used to mitigate such change; and
Due to a notable increase in the stream flow over the year, it is possible that flood risks along
the receiving stream may be aggravated. Flood risk assessment will likely be required.
20.5.7 POTENTIAL EFFECTS IN OTHER WATER BODIES
Currently there are two small watercourses, the streams Narbäcken and Stavabäcken located within
the project area. In the current plan the channels are not intercepted, however the catchment areas of
the watercourses are modified. All waters are planned to be discharged away from the Vättern
catchment, towards Adelövån. The streams Narbäcken and Stavabäcken will need to be preserved. It
is expected that in environmental permitting it will be required to demonstrate there is no significant
deterioration predicted in water quality or quantity. It must be ensured that sufficient flow will be
available in the streams. In addition, management measures will need to be developed to avoid
contamination of the water in the streams and to maintain flow rates at or near natural rates.
There is potential for seepage of tailings water to groundwater. The disposal method (subaerial
disposal of thickened tailings) should create relatively dense and physically stable, low permeability
material retaining quite a lot of the pore water in the tailings. Thus the groundwater table can be
lowered due to the decreased infiltration, however this is considered unlikely. On the other hand, input
of water in the TSF area can increase the infiltration. If the groundwater flow conditions change, this

NI 43-101 - Technical report Norra Kärr REE - 0465-RPT-014 Rev 1
Page 306
can affect nearby lakes, springs, streams or surface seeps as the surface water bodies at the site are
expected to be in continuity with groundwater table.
20.6 PERMITTING
20.6.1 APPLICABLE RULES AND REGULATIONS (ENVIRONMENTAL CODE)
Sweden’s environmental law comprises “The Environmental Code” which constitutes a modernised,
broad and stringent legislation, aimed at promoting sustainable development. It came into force on
1 January 1999 and replaced fifteen previous environmental acts which were amalgamated into the
Code.
The objectives and area of application of the Code are provided in Table 20-10.
Table 20-10: Objectives and area of application of the Environmental Code
The purpose of this Code is to promote sustainable development which will assure a healthy and sound environment for present and future generations. Such development will be based on recognition of the fact that nature is worthy of protection and that our right to modify and exploit nature carries with it a responsibility for wise management of natural resources.
The Environmental Code shall be applied in such a way as to ensure that:
Human health and the environment are protected against damage and detriment, whether caused by pollutants or other impacts;
Valuable natural and cultural environments are protected and preserved;
Biological diversity is preserved;
The use of land, water and the physical environment in general is such as to secure a long term good management in ecological, social, cultural and economic terms; and
Reuse and recycling, as well as other management of materials, raw materials and energy are encouraged with a view to establishing and maintaining natural cycles.
20.6.1.1 THE ENVIRONMENTAL CODE (APPLICATION)
An application under the Environmental Code (Miljöbalken) (SFS 1998:808) is required in order to
conduct mining operations. For an application under the Environmental Code, a more extensive
environmental impact assessment is needed compared to the application for the exploitation permit.
The following chapters of the Code are the most relevant for the project:
Chapter 2 ”Rules of consideration” states that the best possible techniques are to be used in
relation to pollution prevention and control as per the EU Industrial Emissions Directive;
Chapter 3 regulates areas of national interest which, for example, include commercial fishing,
areas for the purposes of nature conservation, conservation of the cultural environment or
outdoor recreation, areas for wind farming and mineral deposits considered to be of national
importance, and others;
Chapter 5 states that environmental quality standards may be issued for Sweden as a whole,
for specific regions, or for certain types of region for given periods of time. The purpose of

NI 43-101 - Technical report Norra Kärr REE - 0465-RPT-014 Rev 1
Page 307
environmental quality standards is to satisfy the national environmental objectives, and to
transpose EU quality standards into Swedish legislation;
Chapter 6 sets out general requirements of Environmental Impact Assessments (Swedish:
Miljökonsekvensbeskrivning or MKB). More detailed provisions are provided in the various
ordinances including the Ordinance on EIA (Förordning 1998:905 om
Miljökonsekvensbeskrivningar);
Chapter 7 prohibits activities that could significantly affect the environment in protected areas
without a license. Such areas are Natura 2000 sites, nature and cultural preserves, shoreline
protection. If during the permitting process, the relevant authorities consider that the proposed
activity can significantly affect the environment of a Natura 2000 site, they can request a
specific Appropriate Assessment of the impacts of the project to the site. Alternatively an
Appropriate Assessment can be appended to the permit application by the applicant to begin
with; and
Chapter 11 covers operations in or involving water, including the construction and alteration of
structures in water areas, the removal of water from or excavation in water areas, measures
for which the purpose is to change the depth or position of the water; diversion and
recharging of groundwater and measures undertaken to drain land. The Code stipulates that
water operations may only be undertaken if the public and/or private benefits are greater than
the associated costs and damage. Water operations must not be prejudicial to other activities
which are likely to involve the same water source in the future and which serve important
public or private purposes. A permit must usually be obtained for water operations, although
permission would be granted for operations that have been examined and permitted
elsewhere such as through granting of mining license. (Förordning (1998:1388) om
vattenverksamhet m.m.).
20.6.1.2 ENVIRONMENTAL QUALITY STANDARDS
Environmental Quality Standards (EQS) are legally binding instruments governed by Chapter 5 of the
Swedish Environmental Code. They may be valid for the whole country or a particular geographical
area. The main purpose of EQS is to deal with the environmental impact of diffuse pollution sources.
Most EQS are based on the requirements of EU Directives. The regional authority County
Administrative Board (CAB) is responsible for ensuring that the environmental quality standards are
fulfilled in its county through permitting and monitoring.
The current EQS are specified in the Air Quality Regulation (Luftkvalitetsförordningen) (SFS
2010:477), Regulation on Environmental Quality Standards for Fish and Shellfish (Förordning om
miljökvalitetsnormer för fisk- och musselvatten) (SFS 201:554), the EU Directive 2008/105/EC on
Environmental Quality Standards in the Field of Water Policy and Regulation on Environmental Noise
(Miljökvalitetsnormer inom vattenpolitikens område and Förordning om omgivningsbuller (SFS

NI 43-101 - Technical report Norra Kärr REE - 0465-RPT-014 Rev 1
Page 308
2004:675)). The target concession area is located in the South Baltic (Södra Östersjöns) water district
for which EQS are established.
The Air Quality Regulation (SFS 2010:477) specifies EQS for several pollutants. There are threshold
standards for particles <10 μm/m3 (PM10), particulate matter <2.5 μm/m3 (2.5), sulphur dioxide,
carbon monoxide, benzene and nitrogen dioxide that will affect the operations of mining.
Within Sweden’s continual work to implement the EU Water Framework Directive, five regional water
authorities were formed in order to define quality in terms of EQS for surface water, groundwater and
protected areas within each district. The purpose of the standards is to prevent further deterioration of
the state of our water and that all water must achieve a certain environmental quality. Information of
the current status on water bodies and future goals can be obtained via the Swedish Water
Information System (VISS). EQS for surface water quality are specified in Regulation of Fish and
Bivalve Waters (2001:554). Chapter 4 of the regulation relates to the provisions applicable to the
Swedish Agency for Marine and Water Management (Swedish: Hav och Vattenmyndigheten, HAV).
The nearby Lake Vättern is defined as a Fish water (salmon) with EQS for water quality parameters.
The requirements of EU Directive (2008/105/EC) on EQS in the field of water policy, is incorporated
into Swedish law by reference to water regulations and through a regulation issued by the Swedish
Agency for Marine and Water Management (HVMFS 2013:19). The Directive and the pursuant
regulation regulate the 33 priority substances and 8 other pollutants using class boundaries. Class
boundaries are used by water authorities for classification and identification of quality requirements for
the chemical status of surface water. With the exception of class limits for certain metals (cadmium,
lead, mercury and nickel), the planned mining operation only has a limited connection to the
substances mentioned in the directive.
20.6.1.3 NATIONAL AND REGIONAL ENVIRONMENTAL OBJECTIVES
The Swedish Environmental Code identifies 16 national non-legally binding environmental objectives
for achieving an ecologically sustainable development of society which were passed by the Swedish
parliament in 1999, and revised most recently in 2012. These objectives are to be met within one
generation, i.e. by 2020 (2050 in the case of the climate objective).
The CAB (Swedish: Länsstyrelsen) in Jönköping is the competent environmental authority for the
project. The CAB has the responsibility for adapting 15 of the 16 national environmental objectives
identified in the Code to its county with the exception of Objective 12, Sustainable Forests, for which
the Swedish Forest Agency (Swedish: Skogsstyrelsen) is responsible. The CAB in Jönköping
approved regional environmental objectives and interim targets for Jönköping County in 2013.
In the EIA that will be required to be undertaken, the Applicant has to address how it contributes to
the environmental objectives. All 16 might not be relevant for the Norra Kärr project, though for
example No 1. Reduced climate impact, No 3. Natural acidification only, No 4. A non-toxic
environment and No 9. Good quality groundwater could have touching points with the project.

NI 43-101 - Technical report Norra Kärr REE - 0465-RPT-014 Rev 1
Page 309
The business sector, in cooperation with other stakeholders, has a substantial role in achieving the
environmental quality objectives. Today, many companies in Sweden are engaged in structured
environmental work that has a major bearing on the environment.
20.6.1.4 EUROPEAN UNION LEGISLATION
The Code also contains provisions concerning the consequences of the Treaty on European Union
and other instruments and of the decisions of the European Communities.
The following EU Directives are applicable to the project. The Directives have been transposed into
the Swedish Environmental Code as described above:
Directive 79/409/EEC of 2 April 1979 on the conservation of wild birds, as last amended by
Directive 2009/147/EC (the Birds Directive);
Directive 92/43/EEC of 21 May 1992 on the conservation of natural habitats and of wild fauna
and flora, as last amended by EC Directive 2013/17/EU (the Habitats Directive);
Directive 2000/60/EC of 23 October 2000 establishing a framework for Community action in
the field of water policy as amended by Decision 2455/2001/EC and Directives 2008/32/EC,
2008/105/EC and 2009/31/EC;
Directive 2003/35/EC of 26 May 2003 providing for public participation in respect of the
drawing up of certain plans and programmes relating to the environment with regard to public
participation and access to justice (incorporating requirements of Aarhus Convention);
The Seveso III Directive2012/18/EU entered into force on 13 August 2012 replacing Directive
2003/105/EC of 16 December 2003 amending Council Directive 96/82/EC on the control of
major-accident hazards involving dangerous substances (Seveso II Directive);
Directive 2006/21/EC on the management of waste from extractive industries and amending
Directive 2004/35/EC (Mining Waste Directive);
Directive 2010/75/EU on industrial emissions (integrated pollution prevention and control);
and
The Environmental Impact Assessment (EIA) Directive (2014/52/EU) which is newly amended
and entered into force on 15 May 2014 to simplify the rules for assessing the potential effects
of projects on the environment.
A number of the Directives incorporate international treaties into EU legislation, notably the Espoo
Convention and Aarhus Convention.
The key piece of EU legislation with respect to water management is the Water Framework Directive
(WFD) 2000/60/EC and two 'daughter’ directives, one aimed at protecting groundwater (2006/118/EC,
adopted December 2006), the second (2008/105/EC, adopted December 2008) aimed at reducing
pollution of surface water (rivers, lakes, estuaries and coastal waters) by pollutants on a list of priority
substances. The Habitats Directive, together with the Birds Directive, establishes the Natura 2000

NI 43-101 - Technical report Norra Kärr REE - 0465-RPT-014 Rev 1
Page 310
network of conservation sites as well as procedures related to the sites and protected species and
habitats.
20.6.2 SWEDISH MINE PERMITTING PROCESS
Rights to mineral deposits (exploration and exploitation) are governed under the Minerals Act
(1991:45). The Mining Inspectorate of Sweden (Bergsstaten) is the agency responsible for decisions
concerning permits for exploration and mining. In addition to the rights, the mining company needs
permits under environmental legislation to open a mine. Permits for mining activities are issued by
Land and Environmental courts. There are five such courts in Sweden that service different parts of
the country and one Supreme Court, the Land and Environmental Court of Appeal. The permits
needed to open a mine in Sweden are described in Figure 20-14.
Figure 20-14: Swedish mining permitting process. Permits needed to open a mine in Sweden
20.6.2.1 PERMITTING PROCESS
When permitting mining activities the rules of the Environmental Code (Miljöbalken (1998:808)) are
applied. The Rules of Consideration in Chapter 2 of the Environmental Code are applied when
deciding mitigation measures, restraints and other conditions applicable to the specific project.
The only differences compared to sectors other than mining is that land use issues according to
Chapter 3 and 4 in the Environmental Code are not tried again in so far as the issues have been
decided as part of the exploitation concession. However, facilities outside the concession area have
to be considered regarding land use matters in the permitting process by the Land and Environmental
Court. In respect of the Norra Kärr project this land use consideration applies to all facilities and
activities outside the 2014 exploitation concession (i.e. the process plant area, TSF, mine waste dump
and related areas).
The steps of the permitting process are described in Figure 20-15.
Minerals ActExploitation concession
Mining Inspectorate
Environmental Code
Environmental Permit according to Code chapter 9
and 11
Land and Environmental
Court

NI 43-101 - Technical report Norra Kärr REE - 0465-RPT-014 Rev 1
Page 311
Figure 20-15: Permitting process according to Environmental Code
The steps in the Swedish mine permit process are governed by three pieces of legislation as
described below: The Minerals Act, the Environmental Code and the Planning and Building Act.
20.6.3 THE MINERALS ACT (1991:45)
The Minerals Act is applicable to the exploration and exploitation stages of mine development. The
project proponent must gain first an exploration permit and later an exploitation concession that grants
certain rights to the potential mineral deposit. In addition to the proceedings under the Minerals Act,
the Environmental Code also needs to be followed.
An exploration permit is granted for a specific area, where there is some likelihood of a successful
discovery being made, and does not require any specific environmental or social assessments.
Tasman has the required exploration permits in force.
20.6.3.1 EXPLOITATION CONCESSION
An exploitation concession is granted by the Mining Inspectorate if a mineral deposit has been found
which can probably be exploited economically and the location and nature of the deposit does not
make it inappropriate that the applicant is granted a concession. The exploitation concession grants
the right to exploit the mineral deposit to the concession holder.
In terms of environmental issues the exploitation concession application (ECA) must include an EIA
(MKB) compliant with the Environmental Code, which is reviewed by CAB. The EIA reflects the project
design at this early stage, and is developed in more detail at the environmental permitting phase.
Hearing with CAB, Municipality, central
Authorities, stakeholders, public, NGOs
Application including EIA and other appendices is
sent to Land and Environmental Court
The L&E Court is sent to authorities for
consideration and requirement of complements
The Company can complement the
application
The L&E Court decides that the application is
complete and advertise it in the local press
The application is subject to public and stakeholder review and the Company
can reply
Court hearing with site visit
Court decision in full or with postponed issues
Legal force or appeal to the Supreme Land & Environmental Court.

NI 43-101 - Technical report Norra Kärr REE - 0465-RPT-014 Rev 1
Page 312
Tasman holds an exploitation concession for the area immediately surrounding the Norra Kärr
deposit, granted in January 2014.
20.6.3.2 DESIGNATION OF LAND
For exploitation and activities connected therewith that are undertaken at the surface, however, the
concession holder may only make use of land that has been designated for that purpose. Land or
other space outside the concession area may, as determined in the designation of land, be utilized for
purposes other than exploration or exploitation.
Applications for designation of land shall be considered in a land designation proceeding in
accordance with Minerals Act. The Chief Mining Inspector may permit land or other space to be
utilized pending determination of the question of land designation. Such permission may only be
granted if the concession holder furnishes security for compensation.
It is recommended to apply for designation of all land needed, even if the company plans to acquire
the land necessary for the project. The reason for this is to avoid additional applications for different
areas if some landowners refuse to sell the land. Specific impacts on landowners are expected to be
compensated through individual negotiations in accordance with Swedish practices.
20.6.4 THE ENVIRONMENTAL CODE (1998:808)
20.6.4.1 EIA AND PUBLIC HEARING
The procedure and requirements for environmental impact assessments, plans and planning
documents should follow Chapter 6, of the Swedish Environmental Code. The applicant is obliged to
consult the CAB or the local Environmental and Public Health Committee before submitting an
application for a permit and a public hearing is often held. This gives the authorities (including the
Swedish Environmental Protection Agency SEPA) an opportunity to comment on the application.
Swedish SEPA is consulted in the licensing procedure as an expert and should provide guidance (e.g.
on BAT) to the permitting authorities. The SEPA is also active in some licensing cases, for example
when legal principles are at stake or if the activity concerned could lead to major environmental
impact.
20.6.4.2 ENVIRONMENTAL IMPACT ASSESSMENT
The environmental impact assessment (EIA) must be submitted together with the permit application.
A more comprehensive EIA has to be carried out compared to the EIA already made for the
concession application. The purpose of the EIA is to describe the direct and indirect impact of the
planned activity. The EIA must include a site description of the facilities or activities as well as
descriptions of the technology that will be used. Different alternatives for both these aspects are
compulsory. A localization study for the TSF, considering a wide array of alternatives, has been
undertaken in 2014. This study satisfies the requirement to identify potential alternatives for TFS

NI 43-101 - Technical report Norra Kärr REE - 0465-RPT-014 Rev 1
Page 313
location, and as such is directly usable in permitting. Alternative locations for above ground facilities
such as process plant and waste rock dump have to be considered in the EIA.
The EIA must also describe the impact on people, animals, plants, land, water, air, climate, landscape
and the cultural environment. Furthermore, it should describe impacts on the management of land,
water and the physical environment in general, as well as on the management of materials, raw
materials and energy.
A developer must address social and economic issues under the Environmental Code. However,
there are no specific requirements for a dedicated Social Impact Assessment (SIA) (Swedish: Social
konsekvens-beskrivning). A competent authority when reviewing the EIA may request a SIA, whereas
the Land and Environmental Court can require a developer to perform a dedicated SIA.
In the environmental permit process the Appropriate Assessment of Natura 2000 may need to be
prepared and applied for.
20.6.4.3 THE APPLICATION
The application must also include a demonstration that the applicant has the right to water
(groundwater or surface water) that the applicant wants to use. Such rights are in place if the
applicant owns the land or water body. If this is not the case, a written agreement (right of usage) with
the subject property owners has to be presented as part of the application.
When it comes to land designation according to the Minerals Act, this is not necessary prior to
submitting an application according to the Environmental Code. Land designation matters are dealt
with after the decision from the Land and Environmental Court has been made.
The Mine Waste Regulation (SFS 2013:319) which transposes the EU Mining Waste Directive into
Swedish legislation requires the developer to submit a preliminary closure plan for projects involving
disposal of mining waste. The preliminary closure plan must describe how the operations will be
closed and the disturbed areas remediated to fulfil the closure guidelines. Provisions for a bond
should be set off. The bond must cover the costs for reclamation in the event that the developer, for
any reason, is unable to fulfil its obligations. The bond is settled in the Land and Environmental Court
and may comprise an initial amount to be paid when commencing the activities and a yearly sum to
be paid depending on the additional area affected per year during the life of the operations. A
conceptual closure plan is being developed as part the PFS. This conceptual plan will need to be
further supplemented to satisfy the requirements for permitting.
20.6.4.4 CONSIDERATION
The Land and Environmental Court will review the application for completeness and then split the
document to various Technical Advisory Committees (TACs). The TAC for the overall EIA is the CAB
and in effect ultimately approves the EIA. CAB and the various TACs (HAV – Water management and
fisheries; Skogsstyrelsen – forestry; Trafikverket – roads & transport; MSB – The Swedish Civil

NI 43-101 - Technical report Norra Kärr REE - 0465-RPT-014 Rev 1
Page 314
Contingencies Agency, emergency response and rescue, etc.) provide comments on the EIA to the
Land and Environmental Court.
Should a permit be issued it is generally with conditions based on the comments received from the
TACs. In Sweden Emission Limit Values are set for each individual project in the permit. These are
based on BAT at the time the permit is granted and taking into account the local conditions.
20.6.5 PLANNING AND BUILDING ACT (PLAN- OCH BYGGLAGEN (2010:900))
Once the Land and Environmental Court has granted permission to begin operations, a construction
permit is required by the local municipality. A construction permit normally takes between four and
eight weeks to process and covers buildings and other facilities that need to be constructed in
connection with the mining project.
However, granting a construction permit is only possible if the municipality's Master and Detailed
Plans (land use plans) have designated the land required for the project as being suitable for such
activities.
A Detailed Plan is required if the planned building and activities connected to it may have a significant
impact on the surroundings, such as landscape or traffic. This is normally considered to be the case
for the industrial areas related to mines in Sweden. The land use is considered in the planning
process to decide if the purpose is appropriate for the location.
Generally the municipality will prepare a Detailed Plan for industrial areas and will usually also carry
the related costs; however, this can also be a cost for the developer if the plan is not considered to be
of public interest. The developer has to ask the municipality to initiate detailed planning and at that
point it will also be decided what costs it will entail for the company.
For this project it’s particularly important to note that the project area is situated within three
municipalities. Therefore the building permits as well as the land use plans will need to be processed
with several municipalities. Building permits and Detailed Plans will be required at minimum for the
industrial area (process plant location) in Jönköping and the acid loading station in Tränas.
Currently there are no Detailed Plans in force in the project area and there are no related area
regulations. Norra Kärr is included in Jönköping’s Municipal Overview Plan 2002 (Översiktsplan 2002
Jönköpings Kommun), sub-area 8: Gränna-Visingsö. The project area is not reserved for any specific
purpose in the Overview Plan. However, the area around the deposit, as well as the area to south and
west, are listed as an area of important nature value, and the deposit area itself also as area of
importance for mineral exploitation .The plan is being reviewed with a new Municipal Overview Plan
expected in 2015.

NI 43-101 - Technical report Norra Kärr REE - 0465-RPT-014 Rev 1
Page 315
20.6.6 RIGHT TO APPEAL
Some authorities (including Swedish Environmental Protection Agency SEPA) can appeal against a
permit decision. The right to appeal also includes the applicant, local trade union associations, people
affected by the decision, and non-profit associations focused on promoting nature conservation or
environmental protection interests.
The Land and Environmental Court decision can be appealed in the Supreme Land and
Environmental Court.
20.6.7 TIMEFRAME
The application, consideration and eventual granting of an environmental permit can often take
several years in Sweden. According to a study commissioned by the Confederation of Swedish
Enterprise (Svenskt Näringsliv) in 2012 (Ramböll Management Consulting, 2012), mining is the
industry that takes most time for permitting. According to the study, the mean throughput time for the
permitting process was about four years on average, from start of pre-studies to permit. When
possible appeals (if any) were taken into consideration, the average time was five years in total.
According to the study, the average throughput times were as follows:
Pre-studies (information gathering and preparation for public hearing) 1.5 years;
Public hearing (consultation) phase 0.5 years;
Preparation of permit application including EIA 1 year;
Consideration at the Land and Environmental Court 1 year;
Average time from start-up to having the permit 4 years;
When taking into account potential appeals, should there be any, the average throughput time
was 5 years.
It should be noted that the timeframe described here is an average for many projects and varies a lot.
In the case of the Norra Kärr project, many preparatory studies have already been undertaken.
A Detailed Plan will usually take up to two years to process Some of this time is often parallel with the
time for environmental permitting.
20.6.8 SUMMARY OF PERMITTING REQUIREMENTS
A summary of permits required under Swedish law is described in Table 20-11. The Chief Mining
Inspector handles permits for The Minerals Act and is applicable to the exploration and exploitation
stages of mine development. Licensing authorities according to the Environmental Code are Land and
Environmental Courts, Land and Environmental Court of Appeal, and the County Administrative
Boards. The Environmental Courts handle activities with large environmental impact. For some minor
environmentally hazardous activities, licensing is carried out at local level.

NI 43-101 - Technical report Norra Kärr REE - 0465-RPT-014 Rev 1
Page 316
Table 20-11: Required permits
Law or regulation Permit Authority Status
The Minerals Act (1991:45)
Exploration permit
Exploitation concession
Designated Land decision
The Chief Mining Inspector (Bergsstaten)
Granted before 2014
Granted January 2014
Designated land application needed if necessary land cannot be acquired
The Environmental Code (1998:808)
Environmental permit for mining and storage of acid as well as other fuels, chemicals and explosives, chapter 9
Environmental permit for water use, chapter 11
Natura 2000, chapter 7
Land and Environmental Court (Mark- och Miljödomstolen)
Application needed
The Species Protection Ordinance (2007:845)
Exemption from the prohibitions, for all protected species affected
County Administrative Board, CAB
Application needed, can be included in application to Land and Environmental Court, see above
Flammable and explosive goods Act (2010:1011)
Safety Authorisation for Storage and handling of fuels, chemicals and explosives
Local Fire and Rescue service
Application needed
Planning and Building Act (2010:900)
Construction permit Local Municipality, building committee
Applications needed
Detailed Plan for the industrial area will be needed for buildings by the municipalities
Electricity law (1997:857) Power Line concession Swedish Energy Markets Inspectorate
The grid operator will apply
A summary of the activities and the rules and regulations according to the Environmental Code
(Miljöbalken) (SFS 1998:808) that apply are provided in Table 20-12. An application under the
Environmental Code (Miljöbalken) (SFS 1998:808) is required in order to conduct mining operations.
An extensive environmental impact assessment should be included in the application under the
Environmental Code.

NI 43-101 - Technical report Norra Kärr REE - 0465-RPT-014 Rev 1
Page 317
Table 20-12: Activities Subject to the Permitting Process of Environmental Code
Activity Environmental Code Chapter
Laws and regulations
Mining operations on site, process facilities
Chapter 6, 9 Environmental permitting (Miljöprövningsförordning (2013:251))
Chapter 4 §11 mining, §12 processing
Environmental impact assessment (Förordning (1998:905) om Miljökonsekvensbeskrivningar).
Handling of mining waste Chapter 9, 11 Ordinance on exploitation waste (Förordning (2013:319) om utvinningsavfall)
Handling, storage and transportation of Sulphuric acid
Chapter 9 Environmental permitting (Miljöprövningsförordning (2013:251))
20 kap 1§ 2. > 5000 ton on each occasion or > 50 000 ton per year
< 5000 ton, required to notify local authority
Transport of Dangerous Goods Act (SFS 2006:263) and the Transport of Dangerous Goods Ordinance (SFS 2006:311)
Handling and storage of chemicals, explosives and fuel as well as storage and transportation of waste and wastewater treatment
Chapter 9 Environmental permitting (Miljöprövningsförordning (2013:251))
Chemicals and fuels
20 kap 1§ 2. > 5000 ton on each occasion or > 50 000 ton per year
23 kap 2§ if >1000 fuel, required to notify local authority
Chapter 28 waste water treatment, not process
Chapter 29 storing of waste, not mining unless inert then §34, 2.
Ordinance on waste handling Avfallsförordning (2011:927)
Handling and storage of fuels and explosives, transportation of dangerous goods
Chapter 9 Flammable and explosive goods Act (Lag (2010:1011) om brandfarliga och explosiva varor)
Handling of flammable and explosive goods Ordinance (Förordning (2010:1075) om brandfarliga och explosiva varor)
Transport of Dangerous Goods Act (SFS 2006:263) and the Transport of Dangerous Goods Ordinance (SFS 2006:311)
Land use
Areas of national interest, Natura 2000, shoreline protection, cultural heritage
Chapter 3,4,7
The Species Protection Ordinance (2007:845) incorporates EU directive (2009/147/EC) on conservation of Wild birds and Natural habitats and of Wild fauna and flora directive (92/43/EEC), Natura 2000
Cultural Heritage Management Act (Kulturmiljölagen (1988:950) )
Drainage of groundwater from the open pit
Water supply withdraw from Lake Vättern
Discharge to the recipient
Channel works and dredging of the Adelövån (recipient stream)
Chapter 11
Ordinance on water activities (Förordning (1998:1388) om vattenverksamhet m.m.)

NI 43-101 - Technical report Norra Kärr REE - 0465-RPT-014 Rev 1
Page 318
Activity Environmental Code Chapter
Laws and regulations
Roads and pipelines off site Chapter 12 The Species Protection Ordinance (2007:845) incorporates EU directive (2009/147/EC) on conservation of Wild birds and Natural habitats and of Wild fauna and flora directive (92/43/EEC), Natura 2000
20.7 SOCIAL AND COMMUNITY REQUIREMENTS
The Norra Kärr project is to be located within a populated area and will thus bring both benefits and
concerns to the communities nearby. Benefits are particularly related to employment opportunities
created directly and indirectly as a result of the project. Potential negative effects mostly affect the
nearby area within and near the project area. Environmental impacts that affect or may affect the
nearby residents are discussed earlier in this section under environmental impacts. Social impacts will
also result from the fact that some residents of houses within and around the project area will need to
move. The mining company will purchase the houses or otherwise compensate the owners for the
loss as per Swedish practice.
Furthermore, Tasman has been interacting with various stakeholders concerning the project. There
has been a degree of public concern over the project, centred around the potential effects on the Lake
Vättern. Stakeholder issues are discussed in Section 20.7.3.
There are no indigenous issues related to the project and while the indigenous Sami people do have
areas in northern Sweden, the project is located not within Samiland either by currently designated
area nor historical use.
20.7.1 EMPLOYMENT
The potential employment effects of the mine have been studied in 2012 by Tyréns AB (Tyréns,
2012). This study is the source for this section.
The study estimates about 2 000 full time new jobs could be created directly and indirectly as a result
of the mining project, of these 75 % would be related to the investment phase and 25 % to the
operating phase. The availability of a suitable workforce is estimated to be generally good. Although
mining is currently not a big industry in the area, there may be some lack of employees with mining-
specific skills locally. This is estimated to mean that at least some migration of professionals from
other areas (mostly within Sweden) is expected. At the time of writing their study, Tyréns anticipated
that there is fierce competition for the best mining professionals due to the ongoing mining boom in
Sweden. However, since 2012 this situation has changed somewhat and the availability of mining
professionals is likely to have increased.

NI 43-101 - Technical report Norra Kärr REE - 0465-RPT-014 Rev 1
Page 319
A majority of the employees are expected to be residents of the three nearby municipalities of
Jönköping, Ödeshög and Tränas. Inhabitants of each municipality who are employed pay municipality
tax, which forms the basis of the municipal economy. Thus it would be locally important to ensure a
significant proportion of the workforce lives in the area.
However, Tyréns points out that this is dependent on the housing market. In 2012 the housing prices
particularly in the town of Gränna had spiked and Tyréns mentions concern over a lack of reasonably-
priced housing available for the potential influx of workers to the Norra Kärr mine. Nevertheless it is
expected that the staff and employees will be living in the nearby towns and villages of Gränna,
Jönköping, Tränas, Ödeshög and possibly even Linköping so no accommodation is needed near the
site.
The project location is central in Sweden (particularly in comparison with the more traditional mining
areas mostly located in the north) and the area, particularly Gränna town and Jönköping municipality
are attractive areas that would make it easier for potential employees moving into the area to come
with their families, particularly in the operational phase of the mine.
The tax revenue and dynamic economic effects created by such employees, who with their families,
settle in the area in a permanent fashion is greater than that of workers who only come to the area to
work and go home to their families somewhere else, as is the case in many mining areas around the
world. As Tyréns points out, the local municipalities hold the key to attracting the employees to settle
permanently. The municipalities should in cooperation with the local businesses ensure suitable
housing and private and public services (such as retail and day care) are available and of an
attractive quality to potential movers.
Furthermore, Tyréns estimates it is possible that opening the Norra Kärr mine may lead to a
development of an industrial cluster focusing around REEs and their utilisation. Any numerical
estimates of economic or employment effects of such a development are however impossible to arrive
to at this early stage.
20.7.2 RESETTLEMENT
There are several houses within the project area and its immediate vicinity. A total of seven houses
(including year-round dwellings and summer houses) are located inside the project’s footprint, in the
area of the TSF and the related ponds or in the industrial area. Furthermore a number are located so
close that significant impacts are expected to be caused.
Tasman intends to purchase the houses where the impacts such as noise are assessed to be severe,
unless the owner wishes to stay. A reasonable buffer zone will be established based on the
environmental impacts, which will be determined in the later design stages of the project. In the case
where the owner does not wish to sell the property, a land designation can be acquired from the
Mining Inspector granting access to required land. In such a case the owner will be compensated for
any damages caused. Swedish practice on property acquisition and compensation will be followed.

NI 43-101 - Technical report Norra Kärr REE - 0465-RPT-014 Rev 1
Page 320
In the PFS stage the impacts have not been assessed in sufficient detail to determine with certainty
which houses exactly will be impacted by the project. For the purposes of the PFS economic
calculations, an allocation for the land acquisition costs based on experience from other Swedish
mines has been included.
Tasman has arranged meetings with the landowners and initial discussions related to acquisition of
certain key areas have been initiated.
20.7.3 STAKEHOLDERS
20.7.3.1 STAKEHOLDER ENGAGEMENT AND COMMUNICATIONS
Tasman is involved in an extensive stakeholder engagement process. Stakeholder meetings have
been arranged in the form of public meetings as well as meetings with various stakeholder groups
such as landowners, local organisations, and local, regional and national decision-makers. Overall,
dozens of meetings have been conducted over the course of the project’s preliminary development
phase.
Tasman has endeavoured to distribute information about the project to both local and national
stakeholders. Locally, newsletters have been distributed to households in the project area. The
newsletters have provided project information as well as interviews of experts in the field of mining
concentrating on key themes related to the project. The company also has an internet site where
project information is provided.
As a part of the permitting process for the exploitation concession, a public hearing process for the
concession EIA was undertaken in 2012.
20.7.3.2 LOCAL OPINIONS ABOUT THE PROJECT
Tasman has commissioned survey company Nu! (Nordiska Undersökningsgruppen AB) to undertake
a survey of local opinions by telephone interviews in October 2013. Responses were gathered from
two respondent groups: 763 local residents (living in municipalities Jönköping, Ödeshög and Tränas),
as well as 38 close neighbours (living within 2-3 km of the exploitation concession area) were
collected.
The overall attitude towards the project of the local residents varied widely with 17 % being positive or
very positive, 28 % negative or very negative and 27 % neither. A further 28 % responded “I don’t
know”.
The close neighbours were, perhaps unsurprisingly, more negative with no positive responses, 64 %
negative or very negative, 24 % neither negative nor positive and 12 % “I don’t know”. The attitude
towards mining in Sweden in general was positive with 84 % of local residents and 72 % of close
neighbours agreeing that Sweden should have mines.

NI 43-101 - Technical report Norra Kärr REE - 0465-RPT-014 Rev 1
Page 321
The greatest concerns were related to Lake Vättern, 55 % (residents) and 80 % (close neighbours)
think that Vättern will be negatively affected by the mining activity. A clear majority (57 %) of residents
and all of the close neighbours also believe the mine would negatively affect living conditions for
those living close to it. When asked to estimate how far from an operating mine its impacts would be
noticeable, the most common estimate was 5-10 km (given by 19 % of close neighbours and 20 % of
residents), however about half of both respondent groups responded they don’t know.
More recently, two more surveys have been undertaken. In both of these surveys the respondents
have been markedly more positive. This is probably at least partially due to the fact that the Nu! study
particularly sought opinions of people living near the site whereas the respondents in the other
surveys are from a wider area.
In September 2014 slightly over 500 people were interviewed on the phone by survey company Skop
upon assignment by one of the Swedish political parties, Christian Democrats (Kristdemokraterna).
The survey was reported on 5 September 2014 by the local newspaper Jönköpings-Posten on their
internet site (Jönköpings-Posten, 2014).
All respondents were inhabitants of the municipality of Jönköping. The survey had one question: “If
mining can be undertaken in an environmentally safe way, are you in that case positive or negative
towards a mine in Norra Kärr outside of Gränna?” (“Om brytningen kan ske på ett miljömässigt säkert
sätt, är du då positiv eller negativ till en gruva i Norra Kärr utanför Gränna?”). A clear majority of the
responses were positive as shown in Table 20-13.
Table 20-13: Responses, September 2014 telephone survey (Skop / Kristdemokraterna)
Responses, September 2014 telephone survey (Skop / Kristdemokraterna) 504 inhabitants of Jönköping municipality
If mining can be undertaken in an environmentally safe way, are you in that case positive or negative towards a mine in Norra Kärr outside of Gränna?
Very positive 10 %
Quite positive 48 %
Quite negative 21 %
Very negative 19 %
No answer 2 %
http://www.jonkopingsposten.se/artikel/31011/jonkopingsborna-vill-ha-gruva-i-norra-karr
In August 2014 the P4 Jönköping, the local channel of the Sveriges Radio, the public broadcasting
company in Sweden, undertook a web panel study of 500 respondents in the community of Jönköping
and the County of Jönköpings län (Sveriges Radio, 2014). The survey was carried out by Novus
Group International AB and the responses can be seen in Table 20-14.

NI 43-101 - Technical report Norra Kärr REE - 0465-RPT-014 Rev 1
Page 322
Table 20-14: Responses, August 2014 web panel survey (Novus / P4 radio)
Responses, August 2014 web panel survey (Novus / P4 radio) Total of 500 inhabitants of Jönköping municipality and County of Jönköping
Response Municipality of Jönköping County of Jönköping
Positive, independent of environmental impact
8 % 5 %
Positive, if there is no (negative) impact on environment
56 % 55 %
Neither 11 % 13 %
Negative, independent of environmental impact
16 % 15 %
Don’t know 9 % 12 %
http://sverigesradio.se/sida/artikel.aspx?programid=91&artikel=5939917
20.7.3.3 CONCERN AND LOCAL OPPOSITION
Certain stakeholders are concerned about the project. Much of the concern is centred on perceived
threats to Lake Vättern. The concerned parties include both local residents and national activists, who
are part of an emerging anti-mining movement in Sweden. The activists have organized some
demonstrations in the local area. However it is not expected that the demonstrations would escalate
into destructive rioting or violence.
According to information provided by Tasman concerning meetings and negotiations with local,
regional and national level decision makers, there is less opposition towards the project among
decision makers. This is estimated partially to be due to better access to project related information.
At the national level, the granting of the exploitation concession demonstrates that the project has the
support of the state of Sweden.
20.7.3.4 PROJECT IN THE NEWS
In the local press the project has generated much interest. Golder has briefly reviewed a sample of
approximately 80 news articles from 2013 to 2014. Most of the articles were published in the internet
sites of the local newspapers such as Jönköpings-Posten (www.jonkopingsposten.se), Tränas Tidning
(www.tranastidning.se), Östergöta Correspondenten (www.corren.se) but some also on other
sources. A majority of the articles focused on environmental impact and/or the concerned
stakeholders. The protest campaigns by activists, such as the demonstration on site during summer
2014, were covered in the news. As 2014 was an election year in Sweden this resulted in a number of
articles briefly mentioning the mine as one of the local issues listed by a candidate.
Many of the articles appear to be slanted towards the view held by the activists and in many articles
the activists state their claims with no commentary from either Tasman or any other party. This has
unfortunately led to spreading of some incorrect information related to, for example, the likely
magnitude of impacts on Lake Vättern. On the other hand news positive to the project such as the

NI 43-101 - Technical report Norra Kärr REE - 0465-RPT-014 Rev 1
Page 323
granting of the exploitation concession and the positive results of surveys were also published. Some
articles also described the employment opportunities.
20.8 PROJECT CLOSURE
A conceptual-level closure plan has been developed for the project by Golder. The plan is preliminary
and conceptual in nature based on available information at the time of writing. The plan will need to
be refined further for environmental permitting. Requirements related to closure planning will be set in
the environmental permit. Prior to closure an updated closure plan has to be approved by the
authorities, normally at least one year prior to closure. The preliminary plan must be reviewed
regularly (usually a minimum of once every three years) and modified where necessary to reflect
changes in operations.
The conceptual closure plan and consequently the closure approach briefly described below are
based on the assumption that the co-disposed tailings in the TSF will be considered inert waste.
20.8.1 CLOSURE DESIGN CRITERIA
The preliminary closure plan is based on general closure principles. The suggested purpose is that
the solutions shall be presumed as “walk away solutions” and after completing reclamation the area
should comply with the legislative demands and not pose a potential detrimental threat to the
surroundings.
However, part of the remedial design may encompass a possibility to re-open the mine in the future, if
unmined mineralised zones should become economic after closure. It is therefore paramount that the
open pit mine void should not be back-filled.
In the further stages of project development the closure targets and site specific closure design
criteria are to be defined further. Potential post-closure land uses should be developed, where
appropriate in cooperation with relevant stakeholders. The subsequent versions of the closure plan
should reflect these targets and land uses.
A number of preliminary guiding closure principles have been worked out and are listed below:
There will be no significant, physical off-site impacts.
Baseline surface water quality in recipients will be maintained (unless directly physically
affected).
The established vegetative cover within the site area shall be self-sustaining and with time
show progression towards the surrounding undisturbed vegetation in terms of species
diversity and plant density.
The post-mining landforms will be stable and respond to erosive forces in a similar manner to
equivalent landforms occurring naturally within the area (e.g. slopes, undulating hills).

NI 43-101 - Technical report Norra Kärr REE - 0465-RPT-014 Rev 1
Page 324
No unsafe areas will remain where the public or wildlife can gain access either inadvertently
or without exceptional effort. Fences will be used to prevent this access to unsafe areas.
Pit voids will be left and allowed to refill with seepage and rain water. Where necessary the
slopes will be re-graded.
Final landform designs will be re-graded and landscapes to be similar to the existing regional
landforms, within the constraints imposed by the physical nature of the materials and the
additional cost necessary.
As a required part of the closure plan a monitoring programme will be in place for a number of years
after completed remediation to ensure that the closure complies with legislative demands (often up to
30 years).
20.8.2 PLANNED REMEDIATION MEASURES
20.8.2.1 OPEN PIT
The open pit void (120 m depth) will be allowed to form a pit lake by ceasing pumping of water. Above
the ground recharge surface level, slopes will be re-graded to 1V:3H by blasting and haulage. These
slopes will be covered with topsoil and/or till to stabilize the pit slopes. A minimum of 0.3 m thickness
shall be used, and where necessary, hydro-seeded to provide erosion control and slope stabilization.
In addition, a 2 m high perimeter fence will be installed to reduce the incidence of wild animals and
humans falling into the void.
20.8.2.2 MINE WASTE DUMP
The mine waste dump is considered as inert waste with an option to quarry the material in the future.
Because of this, the cover design will be minimal with the objective to aesthetically remediate the
area, stabilize to prevent erosion, and landscape the deposit into the surrounding natural
environment. The mine waste dump will be re-graded to an overall slope angle of 1V:3H. A 0.5 m till
layer sourced from the overburden from the open pit mine will be applied and hydro-seeded with
grass to stabilize the slopes. A storm water management system consisting of a ditch located to the
east of the deposit with riprap (waste rock) will be constructed to prevent erosion and collect surface
water runoff.
20.8.2.3 TSF
The TSF will be allowed to drain naturally. Pond 1 will be incorporated into the TSF during operation
and if present, clarification pond sludge from Ponds 2-3 may be relocated into the TSF after
operation, but before the remediation commences. Pond 1 will not be dismantled and will form the
south-leading edge of the remedial design.

NI 43-101 - Technical report Norra Kärr REE - 0465-RPT-014 Rev 1
Page 325
The TSF will be covered using a single layer dry protective cover consisting of till/topsoil cover applied
to a depth of 0.3 m. Grass will be hydro-seeded, and in addition, small shrubs and trees will be
planted (100 per hectare).
20.8.2.4 TSF PONDS
Ponds 2-3 related to the TSF will be drained. The dam embankments (2-5) will be breached. The
clarification sludge if present is considered to be inert and will remain or alternatively be relocated into
the TSF. The pre-existing soil horizons will be hydro-seeded with grass to enable erosion control,
stabilization, and landscaping.
20.8.2.5 INDUSTRIAL AREA, INFRASTRUCTURE AND ROADS
An environmental due diligence audit will be carried out before any remediation is conducted. All
equipment in the industrial buildings will be removed and sold where possible. All above ground
structures will be knocked down and removed. The remaining land surface and peripheral industrial
land will be remediated where directed by the environmental due diligence findings. Where applicable,
contaminated soil will be remediated in-situ or removed. A thin layer of 0.2 m topsoil/till cover will be
applied where pre-existing soil is thin. Where necessary, the land will be hydro-seeded with grass, re-
graded, and landscaped into the natural surroundings.
Roads/car parks will be dismantled by cracking concrete and bulldozer removal of bitumen coatings.
Gravel and earthen roads will be flattened. No protective cover or vegetation will be applied.
20.8.3 POTENTIAL ISSUES
Potential issues related to closure and post-closure may include
Requirement for containment: The current conceptual closure plan is based on the
assumption that the co-disposed tailings are considered to be inert waste. If, based on further
testing, this turns out to not be the case; it is possible that further requirements for
containment structures in the covering layers of the TSF will be set.
Post-closure land use(s): In the later stages of project design or potentially during
operations, post-closure land uses should be developed, where appropriate in cooperation
with relevant stakeholders. The closure plan will need to be modified to reflect these land
uses and refined closure targets.
Potential for progressive closure: If possible, in terms of environmental impact it would be
recommended to undertake progressive closure. Potential for this approach will be
determined later based on more advanced design.
Dam safety post closure: Both the dam design and the closure approach must be designed
to ensure no risk of dam failure post-closure. It should also be noted that using a
geomembrane in the construction of water-retaining dams, is not a structure that will last
indefinitely (4).

NI 43-101 - Technical report Norra Kärr REE - 0465-RPT-014 Rev 1
Page 326
Pit water / mine lake: The pit is located within the Vättern catchment and after it fills up to
become a mine lake the water will eventually find its way to Vättern. Based on current
knowledge of waste rock geochemistry, the pit water quality post closure is not expected to be
problematic and no water treatment need is foreseen. However, as water issues and Lake
Vättern are the key concerns, it is likely that the activists will take this issue up as a cause for
concern.
20.8.4 TOPSOIL MANAGEMENT
According to information received from Wardell Armstrong, borrow pits are expected to be created
within the TSF footprint. According to current information no other borrow pits are expected to be
required.
Topsoil management is currently not determined. Topsoil is needed for the eventual rehabilitation of
the various facilities. It is currently unknown whether it would be possible to store original topsoil, or if
not, where replacement topsoil for closure and rehabilitation can be obtained.
20.9 HEALTH AND SAFETY ISSUES
Tasman is committed to being an environmentally and socially responsible corporate citizen in how it
conducts its exploration and development activities. Therefore the Tasman Safety and Environmental
Policy shall be fully followed on the Norra Kärr project.
Golder gathered information related to how health and safety has been taken into consideration in the
PFS-level design from the designers involved with the various technical scopes (Mining, Process,
Engineering, Tailings) with a questionnaire that covered following topics:
Consideration of health and safety in design;
Requirements and regulations;
Identification of most relevant risks; and
Most significant risks identified.
In addition to the questionnaire, key documents and plans were reviewed to identify potential
concerns.
Based on the responses received from the design teams and the document review, health and safety
is being taken into consideration in the design at a level commensurate with the preliminary nature of
this study and the design stage of the project. Golder has not undertaken any health and safety
design review or second opinion of any part of the design.
Considerable amounts of various chemicals are to be used in the processing, most notably solvent,
oxalic acid and sulfuric acid, as well as very large amounts of diesel and fuel oil, which will be used
and stored on site. Safe use and storage of all chemicals, including secondary containment of storage

NI 43-101 - Technical report Norra Kärr REE - 0465-RPT-014 Rev 1
Page 327
vessels, is vitally important for safety of both the environment and humans. All chemicals will be
managed in accordance with Swedish legislation and current good practice.
The most relevant regulations at the current stage of this project (PFS), issued by the Swedish Work
Environmental Authority are listed in Table 20-15.
Table 20-15: Most Relevant Swedish H&S Regulations
H&S regulations (Swedish Work Environmental Authority)
AFS 2010:01 Rock works and mining
AFS 1999:03 Construction work
AFS 2007:01 Blasting
AFS 2011:19 Chemical safety risks
AFS 2011:18 Occupational exposure limits
AFS 2001:03 Use of personal protective equipment.
PFS –stage risk identifications have showed that “Pit-scale Fault” (in the south-east of the proposed
open pit) and “Fly rock onto highway” are the most significant health and safety risks that should be
taken into deeper consideration in further design stages. Based on the designers’ answers, health
and safety risks are considered to the extent which is adequate compared to current project, PFS,
stage.
However, prior to the start-up phase major health and safety risks that may disturb the continuity of
production should be evaluated. Therefore a major risk assessment that is focused on fatal incidents
and severe chemical spills that could affect Tasman personnel, contractor personnel or third parties
should be carried out. Adequate risk elimination or reduction measures shall be taken into account at
all product related (e.g. site plan, process and process equipment, chemical transportation and
storing) planning.
Relevant health and safety measures must be at an adequate level compared to current facilities,
activities and personnel on site. Risks include issues such as working with machinery, chemical safety
and explosives. It is assumed all activities related to health and safety risks will be carried out
compliant with Swedish legislation and international mine safety standards (e.g. IFC Environmental,
Health and Safety Guidelines). To ensure this it is strongly recommended that a HSE professional is
recruited prior to on start-up stage. All documents, procedures and measures should be updated and
the need of supportive health and safety personnel should be evaluated in accordance with increasing
activities on site.

NI 43-101 - Technical report Norra Kärr REE - 0465-RPT-014 Rev 1
Page 328
SECTION 21 CAPITAL AND OPERATING COSTS
All capital and operating expenditure for the Norra Kärr project has been estimated by GBM, WAI and
Golder. The capital estimate effective date is the report effective date. The currency used in the
compilation of the estimate has been stated in United States dollars (USD)
21.1 CAPITAL COST ESTIMATES
Initial and sustaining capital costs have been estimated and an explanation given for each major area
of the site. The overall level of accuracy of the estimate is within the ±25 % range appropriate for a
Pre-Feasibility study.
21.1.1 INCLUSIONS
Mechanical equipment costs
Process plant piping, platework, earthworks, civil, structural, control and
instrumentation, electrical, installation and freight forwarding
Provision of utilities during construction, including water, fuel and electricity
Mine Operations infrastructure including workshops, fuel and lubricant facility, vehicle
wash, administration and amenities
Process plant associated infrastructure; mill control room, laboratory, security,
emergency services, mess hall, change rooms, car park and required storage for
reagents and spare parts
Mobile equipment for the operation
Mining fleet
TSF
Acid supply; Train unloading facility and additional rail infrastructure required.
EPCM cost for the delivery of the plant and infrastructure as per the battery limits.
All roads required at site; including haul roads, entrance/exit of E4 to site.
Rehabilitation and Closure.
Environmental Impact Assessment (Newt management)
21.1.2 ASSUMPTIONS
The following assumptions have been made during the preparation of this estimate:
New equipment is used for the operation;
Equipment costs are based on GBM selected suppliers that may not be the final
equipment supplier for the project;
The construction is as detailed in the PFS;
Costing is based on the current design; and

NI 43-101 - Technical report Norra Kärr REE - 0465-RPT-014 Rev 1
Page 329
It is expected that the design will be refined but not altered significantly.
21.1.3 EXCLUSIONS
No allowance has been made for:
Cost escalation
Currency fluctuations;
Container demurrage costs;
Any transportation or storage required of oxides after treatment at the La Rochelle
facility;
Required permits, licences or legal and administrative costs associated with
government mining and environmental regulations. This includes reporting
requirements during operation and related administrative costs;
Transmission lines and main substations to connect the project to the national
electricity grid;
Monitoring during operation and post closure;
Insurance; and
Management Reserve.
The total capital investment for the Norra Kärr project is USD 378.3 million. The contingency reported
is for the process package only and was based on accessing each minor area of the process. The
mining and waste management costs have accounted for contingency within the total, as supplied by
sub-consultants.

NI 43-101 - Technical report Norra Kärr REE - 0465-RPT-014 Rev 1
Page 330
The total capital to be spent over the life of mine for the Norra Kärr project is reported in Table 21-1,
the total expenditure shown accounts for sustaining capital planned to be spent over the 20 years of
operation.
Table 21-1 Total capital cost estimate
Total Capital Investment 423 039 268
FIXED CAPITAL TOTAL 397 726 462
DIRECT TOTAL 266 524 303
General 7 563 513
Mining 26 899 872
Process 169 467 528
Waste Management 44 500 000
Product Handling -
Infrastructure and Utilities 18 093 388
INDIRECT TOTAL 131 202 159
EPCM 36 165 294
Field Indirect 54 853 204
Contingency 40 183 660
WORKING CAPITAL TOTAL 25 312 805
21.1.4 SUSTAINING CAPITAL
The processing plant has been designed for the duration of the expected operating life and as such
sustaining capital requirements shall be limited to the following items:
The TSF has been designed such that the initial investment will be sufficient for the
first two years of operations. Further expansions required at years 2 and 10 of
operation.
The mining fleet and infrastructure has been designed such that 50 % of the initial
investment will be replaced/ overhauled in year 10 of operation.
Infrastructure, in areas where infrastructure is subjected to heavy traffic, such as
roads and stockpiles, refurbishment and patchwork may have to be supplemented
with the complete replacement of the asset, or part thereof.
21.1.5 MINING CAPITAL COST ESTIMATES
Capital cost estimates have been made from vendor quotes for major mining equipment where
available at the time of writing. Quotes have been received for hydraulic excavators and haul trucks; a
quote for the drilling rig has been scaled accordingly. Other capital costs have been referenced from
Western Mine Cost Service, 2014 (36)

NI 43-101 - Technical report Norra Kärr REE - 0465-RPT-014 Rev 1
Page 331
LOM capital costs are shown in Table 21-2. The initial capital cost estimate is USD 16.1 million, of
which USD 4.0 million is capitalised waste removal. An additional USD 5.0 million in sustaining capital
will be required. Total LOM capital will therefore be USD 16.1 million.
Table 21-2: Mining CAPEX Summary
Total 21 107 000*
Pre-Production 16 101 000
Pre-strip 4 012 000
Equipment 10 775 000
First Fill 215 000
Initial Spares 539 000
ROM Pad 80 000
Haul Road 480 000
Post Production 5 005 000
Equipment 4 938 000
Additional Items 2 685 000
Replacement items -
Overhaul 2 253 000
Pumping 67 000
Note: 5.8 M USD for mine related infrastructure (buildings and fuel storage) not reported as outside of mining
consultant scope, this has been captured in Process capital.
Mining will be performed using an owner operated fleet, therefore the bulk of the costs for mining
CAPEX is in pre-production fleet purchase. Equipment has been estimated at USD 10.9 million being
capitalised operating costs of pre-stripping, haul road development, and ROM pad clearing.
Sustaining CAPEX consists of additional equipment purchase where scheduling requires and
maintain overhauls at critical machine hours.
It is noted that replacement items are not required, due to low annual working hours of 1 687 hours.
At the end of the 20 year production schedule the majority of machines are still within their operating
life.
Sustaining overhaul costs have been estimated based on a major overhaul of 50 % of the capital cost,
at the halfway point of the scheduled machine life. Overhaul costs would typically include major
transmission components and major wear parts (tracks, tubs, etc).
21.1.6 PROCESS PLANT & RELATED INFRASTRUCTURE
The costs for the process plant and related infrastructure are summarised in Table 21-3. To ensure
the correct level of accuracy was achieved for the estimate, 79 % of mechanical equipment was

NI 43-101 - Technical report Norra Kärr REE - 0465-RPT-014 Rev 1
Page 332
based on budget quotes with the remaining 21 % calculated from first principles and factored
estimates.
The direct capital costs include:
All labour required for project construction and management activities (excluding EPCM
cost);
All material and equipment required for construction;
Mechanical, electrical, control, instrumentation, civil works, earthworks and piping installation
services;
Transport and freighting services;
Insurance and capital spares; and
Construction and installation
Table 21-3 Process Capital estimate summary
Total Capital Investment 316 644 344
FIXED CAPITAL TOTAL 291 331 539
DIRECT TOTAL 200 918 303
Earthwork 695 000
Civil 45 223 125
Structural 27 533 060
Mechanical 103 213 844
Mobile Equipment 734 947
Electrical 8 084 424
Control and Instrumentation 3 674 738
Piping 5 144 633
Platework 6 614 529
INDIRECT TOTAL 90 413 236
EPCM 36 165 294
Field Indirect 14 064 281
Contingency 40 183 660
WORKING CAPITAL TOTAL 25 312 805
Cash Reserve 25 312 805
21.1.7 TAILINGS STORAGE FACILITY
The capital costs for construction of the TSF and following expansions are summarised in Table 21-4.
The quantities have been taken from engineering design drawings and rates prepared to suit the
construction operations.

NI 43-101 - Technical report Norra Kärr REE - 0465-RPT-014 Rev 1
Page 333
Table 21-4: TSF Budget Cost Summary
Stage 1 2 3 Total
Construction Year 0 Year 1-2 Year 9-10
Operation Year 1 – 2 Year 2 – 10 Year 10 – 20 20 years
Construction cost (USD)
14 300 000 11 200 000 19 000 000 44 500 000
21.2 OPERATING COST ESTIMATES
The total operating costs for the Norra Kärr project is represented in Table 21-5. The operating costs
are to the point of off-site treatment and refining.
Table 21-5 Operating Summary
Area
Total Cost per annum
USD/t ROM Ave
USD/kg REO Ave %
000 GENERAL General and Admin 5 079 832.07 4.53 1.04 5.04
- - - 0.0
100 Mining Ore mining cost 3 849 852.58 3.43 0.79 3.82
100 Mining Waste mining cost 2 724 248.43 2.43 0.56 2.7
100 Mining Overhead mining cost - - - 0.0
100 Mining - - - 0.0
Plant $ 89,215,224.82
$ 79.49
$ 18.30 46.1%
200 PROCESSING Maintenance & Operating Spares 6 233 849.12 5.55 1.28 6.18
200 PROCESSING Consumable - Grinding media and liners 1 660 921.74 1.48 0.34 1.65
200 PROCESSING Labour 8 347 749.52 7.44 1.71 8.28
200 PROCESSING Reagents 35 699 032.18 31.81 7.32 35.39
200 PROCESSING Utilities - Diesel 6 427 982.83 5.73 1.32 6.37
200 PROCESSING Consumable – Electricity 6 449 553.24 5.75 1.32 6.39
280 WATER TREATMENT Water treatment 21 311 567.24 18.99 4.37 21.13
300 WASTE MANAGEMENT Waste Management 3 084 568.94 2.75 0.63 3.06
Grand Total 100 870 000er annum
89.97 ROM Ave
20.69 REO Ave
11100%

NI 43-101 - Technical report Norra Kärr REE - 0465-RPT-014 Rev 1
Page 334
The total operating costs are visually demonstrated in Figure 21-1. The annual expenditure on
reagents accounts for 50 % of total expenditure. Due to the importance and impact that the costing of
reagents has on the overall financials, budget quotations were received the key reagents shown in
Figure 21-2, sulphuric acid, magnesium oxide, lime, calcium chloride and solvent.
Figure 21-1 Total project operating costs breakdown
General & Administration
5%Labour8% Product Handling
1%
Maintenance & Operating Spares
6%
Mining6%
Reagents50%
Utilities11%
Consumables10%
Waste Management
3%

NI 43-101 - Technical report Norra Kärr REE - 0465-RPT-014 Rev 1
Page 335
Figure 21-2 Reagent cost breakdown
Sulphuric acid16%
Magnesium oxide39%
Solvent4%
Oxalic acid9%
Lime (burnt)18%
Hydrogen peroxide
1%
Calcium Chroride12%
Flocculant1%

NI 43-101 - Technical report Norra Kärr REE - 0465-RPT-014 Rev 1
Page 336
21.2.1 MINING OPERATING COST ESTIMATE
Operating costs are based on mine design criteria and engineering, they have been derived from first
principles and based on data from Western Mine Cost Service, 2014 (36). Mining operating cost will
average 3.41 USD/t mined rock (5.90 USD/t mined ore). The breakdown of the mining OPEX is
shown Table 21-6.
Table 21-6: Mining Operating Costs
Cost Centre USD/t – Rock Mined LOM
Drilling 0.56 22 898 000
Blasting 0.81 32 961 000
Grading 0.00 199 000
Loading & Stockpiling 0.44 17 988 000
Hauling 0.60 24 676 000
Engineering/Geology 0.42 17 108 000
General Mine Maintenance 0.36 14 601 000
Supervision 0.24 9 643 000
Pumping 0.56 0
Total 3.43 140 074 000
The majority of costs are associated with drill and blasting, some 40 % of the OPEX cost. Other major
contributors to the mining OPEX are loading and hauling, of which the primary cost will be diesel fuel
for the equipment and labour costs.
21.2.2 PROCESS OPERATING COST ESTIMATE
The operating costs for the Norra Kärr process plant were based on annual tonnages treated and a
LOM of 20 years. The operational cost estimates include the following:
Reagents, costs include delivery to Norra Kärr process plant;
Consumables, grinding media, liners;
Maintenance and operating spares;
Utilities, power and diesel;
Labour, refer to Table 21-7 for the various rates; and
General and administration

NI 43-101 - Technical report Norra Kärr REE - 0465-RPT-014 Rev 1
Page 337
Table 21-7: Bill of Rates – Labour
Position Grade Monthly
Salary (SEK) Basic Salary
(SEK/a)
Process Allowance
(SEK/a)
Mining Allowance
(SEK/a)
Fringe Benefits
Allowance Total Salary
(SEK) Total Salary
(USD)
General Manager A 70 000.00 840 000.00 1.5 1 260 000.00 191 158.18
Senior Management / Chief Superintendent B 40 000.00 480 000.00 1.5 720 000.00 109 233.24
Supervisors - Process plant C 35 000.00 420 000.00 96 000.00 1.5 726 000.00 110 143.52
Supervisors - Mine D 35 000.00 420 000.00 50 400.00 1.5 680 400.00 103 225.41
Engineers E 30 000.00 360 000.00 1.5 540 000.00 81 924.93
Process Operators / Technicians / Officers F 24 918.00 299 016.00 96 000.00 1.5 544 524.00 82 611.28
Driver / Mine Operator G 24 918.00 299 016.00 50 400.00 1.5 498 924.00 75 693.18
Artisan / Mechanic / Electrician H 22 071.00 264 852.00 96 000.00 1.5 493 278.00 74 836.61
Clerical / Labour / Assistants - Day Shift I 22 071.00 264 852.00 1.5 397 278.00 60 272.17

NI 43-101 - Technical report Norra Kärr REE - 0465-RPT-014 Rev 1
Page 338
SECTION 22 ECONOMIC ANALYSIS
A discounted cash flow model has been prepared by GBM and was based on the mine production
schedule, capital and operational cost estimates for the mine, processing plant, and associated
infrastructure as determined by all consultants involved.
The key economic inputs used are detailed in Table 22-1.
Table 22-1 Key input parameters
Item Value Unit Notes
Depreciation Method Straight line -
Depreciation – Buildings 5 %
Depreciation – Plant equipment
10 %
Depreciation – Mobile Equipment
20 %
Salvage Value 0 USD
Royalty 0.2 % Royalty based on in situ oxide value rather than
recoverable oxides
Treatment & Refining 19 USD/kg REO concentrate
Base discount rate 10 %
The economic analysis will allow for a two year construction period, and which point the plant will be
fully commissioned and handed to operations. The DCF also accounts for a ramp up period for the
process plant throughput, the mining schedule at this stage of development account for full production
however stockpiling and deferring of feed will occur and extend life of project.
The process plant has been scheduled to reach full production by Year 4; this has been reflected in
the DCF model. This is a conservative approach and has a direct impact on the annual cashflow;
however due to current industry knowledge and information available GBM and Tasman believe this
to be required.
The plant ramp up has been based on Figure 22-1, series 3, with reference to paper; Plant Ramp-up
profiles, an update with emphasis on process development, Terry McNulty. The series 3 graph
reflects the year’s 1-3 operation of 60 %, 75 % and 85 % respectively.

NI 43-101 - Technical report Norra Kärr REE - 0465-RPT-014 Rev 1
Page 339
Figure 22-1 Percent of Design Capacity versus Months since Commissioning
The REO prices used in the financial model were sourced from Section 19. Prices have been based
upon three year trailing average prices for both China (FOB) and domestic Europe markets.
The REO prices are applied individually per kilogram of REO recovered, rather than applying a
discounted basket price. The pricing used in the DCF model is reported in Table 22-2. The overall
basket price of saleable REO’s is 64.46 USD/kg which excludes Ho, Er, Tm and Yb.
Table 22-2 REO Prices used in Financial model
REO UNIT PRICE (USD/kg)
Ce₂O₃ USD/kg 5.00
Dy₂O₃ USD/kg 575.00
Er₂O₃ USD/kg -
Eu₂O₃ USD/kg 700.00
Gd₂O₃ USD/kg 40.00
Ho₂O₃ USD/kg -
La₂O₃ USD/kg 7.00
Lu₂O₃ USD/kg 900.00
Nd₂O₃ USD/kg 80.00
Pr₂O₃ USD/kg 115.00
Sm₂O₃ USD/kg 8.00
Tb₂O₃ USD/kg 950.00
Tm₂O₃ USD/kg -
Y₂O₃ USD/kg 25.00

NI 43-101 - Technical report Norra Kärr REE - 0465-RPT-014 Rev 1
Page 340
REO UNIT PRICE (USD/kg)
Yb₂O₃ USD/kg -
The economic analysis was conducted over a range of discount rates and results have been
presented in Table 22-3. Sensitivity analysis was conducted on the base case, which demonstrates
the sensitivity to the NPV if an increase or decrease is seen in the operating income, operating
expenditure, capital expenditure, recovery and basket price.
Table 22-3 DCF results for Norra Kärr in USD
Discount Rate (%) NPV (Post Tax) NPV (Pre Tax)
6 620 163 983 837 098 796
8 443 922 980 619 112 592
10 312 679 426 456 175 601
12 213 682 321 332 761 664
The full economic analysis conducted for the Norra Kärr project is presented in Section 24.1. The
DCF model gave a robust result of, a post-tax NPV of USD 312.7 M and an IRR of 20 %. This result
reflects a technically and economically feasible project, which should lead to further investment and
development.
The annual cashflow and cumulative cashflow are reported in Figure 22-2 and Figure 22-3, this also
shows that a payback period of 4.8 years is shown.
Figure 22-2 Norra Kärr at 10 % discount rate
‐USD 200
‐USD 150
‐USD 100
‐USD 50
USD 0
USD 50
USD 100
USD 150
USD 200
‐2 ‐1 0 1 2 3 4 5 6 7 8 9 10 11 12 13 14 15 16 17 18 19 20
Millions per an
num
Annual Cashflow
Post‐tax Annual cashflow Pre‐tax Annual Cashflow

NI 43-101 - Technical report Norra Kärr REE - 0465-RPT-014 Rev 1
Page 341
Figure 22-3 Norra Kärr Project at 10 % discount rate
The sensitivity analysis was conducted on the discount rate of 10 % used in the DCF. The analysis
has shown in Figure 22-4 the importance to marketing and understanding the market to which the
metals are sold into. The second most influential factor is the metallurgical recovery and with further
optimisation this has potential to increase however sensitivity analysis was only conducted by ±2 %
increments to ±6 %. The process operating costs have the greater potential to be reduced, through
the reduction in reagent consumptions, and the recycling of reagents. As part of the operating costs is
the treatment of all waste streams, once further characterisation is obtained there may be opportunity
to change method and increase efficiency. The capital expenditure and mining costs have opportunity
to reduce however the impact this will have on project financials is limited.
Figure 22-4 Norra Kärr Project at 10 % discount rate
‐USD 500
USD 0
USD 500
USD 1,000
USD 1,500
USD 2,000
USD 2,500
‐2 ‐1 0 1 2 3 4 5 6 7 8 9 10 11 12 13 14 15 16 17 18 19 20
Millions
Cumulative Cashflow
Post‐tax Cumulative Cash Flow Pre‐tax Cumulative Cash Flow
$‐
$100,000,000
$200,000,000
$300,000,000
$400,000,000
$500,000,000
$600,000,000
80.00% 85.00% 90.00% 95.00% 100.00% 105.00% 110.00% 115.00% 120.00% 125.00%
Post Tax NPV(USD)
Sensitivity Analysis
Capex Recovery Process Opex
Mining Opex Treatment TREO Basket Price

NI 43-101 - Technical report Norra Kärr REE - 0465-RPT-014 Rev 1
Page 342
SECTION 23 ADJACENT PROPERTIES
There is no additional information in respect of adjacent properties in the context of the Tasman Norra
Kärr property that is material to the information in this technical report.

NI 43-101 - Technical report Norra Kärr REE - 0465-RPT-014 Rev 1
Page 343
SECTION 24 OTHER RELEVANT DATA AND INFORMATION
24.1 DISCOUNTED CASH FLOW MODEL

NI 43-101 - Technical report Norra Kärr REE - 0465-RPT-014 Rev 1
Page 344
Production Schedule LoM Total LoM ‐2 ‐1 0 1 2 3 4 5 6 7 8 9 10 11 12 13 14 15 16 17 18 19 20
Mining
Mining operations (proportion of year) 20 ‐ 0.0 0.0 1.0 1.0 1.0 1.0 1.0 1.0 1.0 1.0 1.0 1.0 1.0 1.0 1.0 1.0 1.0 1.0 1.0 1.0 1.0 1.0 1.0
Total mineralised tonnes delivered (ROM) 23,570,526 1,122,406 1,154,063 1,149,719 1,150,255 1,152,703 1,146,384 1,149,954 1,151,030 1,148,626 1,150,960 1,152,606 1,144,770 1,152,632 1,150,012 1,153,810 1,147,270 1,149,433 1,151,897 1,144,047 1,152,669 1,155,110 562,576
Waste tonnes mined 16,679,072 794,242 1,075,871 1,116,693 1,130,405 1,036,564 1,091,003 1,347,256 1,199,428 1,244,134 1,241,577 1,232,625 1,299,286 809,066 728,736 393,765 303,209 441,258 365,442 205,494 273,698 111,137 32,425
Total tonnes mined 40,249,598 1,916,648 0 0 2,229,934 2,266,412 2,280,660 2,189,267 2,237,387 2,497,210 2,350,458 2,392,760 2,392,537 2,385,231 2,444,056 1,961,698 1,878,748 1,547,575 1,450,479 1,590,691 1,517,339 1,349,541 1,426,367 1,266,247 595,001
Waste : ROM ratio 0.69 0.93 0.97 0.98 0.90 0.95 1.17 1.04 1.08 1.08 1.07 1.13 0.70 0.63 0.34 0.26 0.38 0.32 0.18 0.24 0.10 0.06
TREO grade (delivered) 0.592% 0.579% 0.575% 0.579% 0.585% 0.599% 0.605% 0.585% 0.579% 0.571% 0.570% 0.556% 0.548% 0.571% 0.569% 0.606% 0.599% 0.613% 0.620% 0.650% 0.642% 0.653%
Ce₂O₃ contained grams per tonne 29,119,760 1,235 1,261 1,258 1,263 1,295 1,360 1,413 1,216 1,192 1,182 1,165 1,147 1,148 1,154 1,220 1,176 1,285 1,247 1,222 1,281 1,236 1,210
Dy₂O₃ contained grams per tonne 6,330,929 270 254.96 252 254 254 254 250 267 267 262 265 257 249 266 252 290 262 282 292 303 310 325
Er₂O₃ contained grams per tonne 4,330,925 185 171 171 170 170 168 164 183 183 182 183 176 172 182 172 201 180 194 203 211 217 229
Eu₂O₃ contained grams per tonne 513,913 22 21 21 21 21 22 22 21 21 21 21 21 20 21 21 22 22 23 23 24 24 24
Gd₂O₃ contained grams per tonne 4,631,546 197 191 189 190 189 193 193 192 192 189 190 184 179 192 186 207 197 207 213 223 222 226
Ho₂O₃ contained grams per tonne 1,397,905 60 57 56 56 56 56 55 59 59 58 59 57 55 59 55 64 57 62 64 67 69 73
La₂O₃ contained grams per tonne 12,987,081 551 550 547 557 582 600 622 557 544 540 531 519 523 516 550 520 569 549 535 564 547 544
Lu₂O₃ contained grams per tonne 551,832 24 22 22 22 22 21 21 24 24 23 24 23 22 23 22 25 23 24 26 26 28 29
Nd₂O₃ contained grams per tonne 15,275,855 648 653 656 652 663 700 724 629 622 614 607 601 593 618 629 636 671 667 655 693 671 664
Pr₂O₃ contained grams per tonne 3,801,217 161 164 165 165 168 177 185 158 155 154 152 150 149 153 158 155 167 164 160 168 162 158
Sm₂O₃ contained grams per tonne 4,192,786 178 179 174 176 177 182 185 174 173 170 168 164 161 171 168 182 182 186 187 195 195 193
Tb₂O₃ contained grams per tonne 934,272 40 38 37 38 38 38 38 39 39 38 39 38 37 39 37 42 39 42 43 45 45 47
Tm₂O₃ contained grams per tonne 660,635 28 26 26 26 26 26 25 28 28 28 28 27 26 28 26 31 27 29 31 32 33 35
Y₂O₃ contained grams per tonne 50,662,410 2,159 2,045 2,019 2,038 2,033 2,041 2,005 2,133 2,118 2,080 2,094 2,033 1,983 2,117 2,028 2,316 2,138 2,274 2,361 2,470 2,464 2,558
Yb₂O₃ contained grams per tonne 4,048,986 173 160 160 160 161 157 153 173 173 172 172 166 162 171 161 188 167 179 188 194 200 212
ZrO₂ contained grams per tonne 13,579 12,840 13,502 12,804 12,741 13,040 12,874 12,941 13,027 13,218 13,558 13,689 13,472 14,223 13,486 14,408 13,423 13,983 14,407 14,336 14,604 14,579
HfO₂ contained grams per tonne 287 268 285 268 268 275 270 275 279 283 290 293 288 301 283 304 283 295 303 299 306 306
Plant
Plant operations (proportion of year) 20 0.0 0.0 0.60 0.75 0.85 1.0 1.0 1.0 1.0 1.0 1.0 1.0 1.0 1.0 1.0 1.0 1.0 1.0 1.0 1.0 1.0 1.0 1.0
Plant feed tonnes 22,648,933 1,078,521 0 0 692,438 862,289 977,717 1,152,703 1,146,384 1,149,954 1,151,030 1,148,626 1,150,960 1,152,606 1,144,770 1,152,632 1,150,012 1,153,810 1,147,270 1,149,433 1,151,897 1,144,047 1,152,669 1,155,110 562,576
Total TREO recovered 102,395 4,876 3,064 3,792 4,324 5,158 5,255 5,328 5,143 5,077 5,019 5,011 4,862 4,821 5,012 5,012 5,298 5,256 5,388 5,410 5,710 5,657 2,798
Ce₂O₃ tonnes recovered 21,807 1,038 681 846 963 1,164 1,216 1,267 1,092 1,068 1,061 1,047 1,024 1,032 1,036 1,098 1,052 1,152 1,121 1,091 1,152 1,114 531
Dy₂O₃ tonnes recovered 4,864 232 141 173 198 233 232 229 245 244 241 244 235 229 244 232 265 241 260 266 279 286 146
Er₂O₃ tonnes recovered 3,230 154 91 114 129 152 149 146 163 163 162 163 156 153 162 154 179 160 173 179 188 194 100
Eu₂O₃ tonnes recovered 393 19 12 15 17 20 20 20 19 19 19 19 19 18 20 19 20 20 21 21 22 22 11
Gd₂O₃ tonnes recovered 3,535 168 105 129 147 173 175 176 175 175 172 173 167 163 175 170 188 179 189 193 204 203 101
Ho₂O₃ tonnes recovered 1,050 50 31 38 43 50 50 49 53 53 52 53 51 50 53 50 57 51 55 57 60 62 32
La₂O₃ tonnes recovered 9,709 462 296 367 424 522 535 557 499 486 484 476 463 469 461 494 464 509 492 476 506 492 238
Lu₂O₃ tonnes recovered 401 19 11 14 16 19 19 18 20 21 20 20 20 19 20 19 22 20 21 22 23 24 12
Nd₂O₃ tonnes recovered 11,593 552 357 447 504 604 634 658 572 565 558 552 544 540 561 573 577 609 607 592 631 613 295
Pr₂O₃ tonnes recovered 2,876 137 89 112 127 152 160 168 143 141 139 138 136 136 139 144 141 151 149 144 152 147 70
Sm₂O₃ tonnes recovered 3,201 152 98 119 137 162 166 169 159 157 155 154 149 148 156 154 166 166 170 170 179 179 86
Tb₂O₃ tonnes recovered 712 34 21 26 29 34 35 34 36 36 35 35 34 33 36 34 39 35 38 39 41 41 21
Tm₂O₃ tonnes recovered 489 23 14 17 20 23 23 22 25 25 25 25 24 23 25 23 27 24 26 27 28 29 15
Y₂O₃ tonnes recovered 35,565 1,694 1,032 1,269 1,452 1,708 1,705 1,681 1,790 1,773 1,745 1,760 1,697 1,666 1,775 1,706 1,937 1,791 1,909 1,969 2,075 2,075 1,049
Yb₂O₃ tonnes recovered 2,969 141 84 105 119 141 137 134 151 151 150 151 145 142 149 142 164 146 157 163 170 176 91
ZrO₂ tonnes recovered 20 0 0 0 0 0 0 0 0 0 0 0 0 0 0 0 0 0 0 0 0 0 0
HfO₂ tonnes recovered 0 0 0 0 0 0 0 0 0 0 0 0 0 0 0 0 0 0 0 0 0 0 0
CAPEX Schedule LoM Total ‐2 ‐1 0 1 2 3 4 5 6 7 8 9 10 11 12 13 14 15 16 17 18 19 20
Fixed 397,727,473 176,481,777 176,481,777 455,139 455,139 11,655,139 1,417,139 455,139 455,139 455,139 1,350,139 455,139 1,371,139 20,850,139 1,293,139 455,139 455,139 455,139 455,139 455,139 455,139 455,139 455,139 455,139
Working 25,312,805 0 0 25,312,805 0 0 0 0 0 0 0 0 0 0 0 0 0 0 0 0 0 0 0 0
Total 423,040,278 176,481,777 176,481,777 25,767,944 455,139 11,655,139 1,417,139 455,139 455,139 455,139 1,350,139 455,139 1,371,139 20,850,139 1,293,139 455,139 455,139 455,139 455,139 455,139 455,139 455,139 455,139 455,139
Operating Cost Schedule LoM Total
USD/t ROM
Ave ‐2 ‐1 0 1 2 3 4 5 6 7 8 9 10 11 12 13 14 15 16 17 18 19 20
General 106,676,473 4.5 0 0 3,261,382 4,061,382 4,605,046 5,429,231 5,399,469 5,416,283 5,421,351 5,410,028 5,421,022 5,428,774 5,391,867 5,428,897 5,416,557 5,434,445 5,403,642 5,413,829 5,425,435 5,388,461 5,429,071 5,440,568 2,649,733
General and Admin 106,676,473 5 0 0 3,261,382 4,061,382 4,605,046 5,429,231 5,399,469 5,416,283 5,421,351 5,410,028 5,421,022 5,428,774 5,391,867 5,428,897 5,416,557 5,434,445 5,403,642 5,413,829 5,425,435 5,388,461 5,429,071 5,440,568 2,649,733
0 0 0
Mining Costs 138,056,121 5.9 0 0 7,648,674 7,773,793 7,822,664 7,509,186 7,674,237 8,565,430 8,062,071 8,207,167 8,206,402 8,181,342 8,383,112 6,728,624 6,444,106 5,308,182 4,975,143 5,456,070 5,204,473 4,628,926 4,892,439 4,343,227 2,040,853
Ore mining cost 80,846,904 3 0 0 3,958,436 3,943,536 3,945,375 3,953,771 3,932,097 3,944,342 3,948,033 3,939,787 3,947,793 3,953,439 3,926,561 3,953,528 3,944,541 3,957,568 3,935,136 3,942,555 3,951,007 3,924,081 3,953,655 3,962,027 1,929,636
Waste mining cost 57,209,217 2 0 0 3,690,238 3,830,257 3,877,289 3,555,415 3,742,140 4,621,088 4,114,038 4,267,380 4,258,609 4,227,904 4,456,551 2,775,096 2,499,564 1,350,614 1,040,007 1,513,515 1,253,466 704,844 938,784 381,200 111,218
Overhead mining cost 0 0 0 0 0 0 0 0 0 0 0 0 0 0 0 0 0 0 0 0 0 0 0 0 0
0 0 0
Plant 1,873,519,721 79.5 0 0 57,278,455 71,328,567 80,876,730 95,351,592 94,828,884 95,124,195 95,213,202 95,014,343 95,207,411 95,343,568 94,695,374 95,345,719 95,128,993 95,443,163 94,902,174 95,081,098 95,284,920 94,635,568 95,348,780 95,550,699 46,536,287
Maintenance & Operating Spares 130,910,832 6 0 0 4,002,290 4,984,032 5,651,203 6,662,623 6,626,100 6,646,734 6,652,953 6,639,058 6,652,549 6,662,063 6,616,771 6,662,213 6,647,069 6,669,022 6,631,221 6,643,723 6,657,965 6,612,592 6,662,427 6,676,536 3,251,689
Consumable ‐ Grinding media and liners 34,879,357 1 0 0 1,066,354 1,327,925 1,505,684 1,775,163 1,765,431 1,770,929 1,772,586 1,768,884 1,772,478 1,775,013 1,762,946 1,775,053 1,771,018 1,776,867 1,766,796 1,770,127 1,773,921 1,761,832 1,775,110 1,778,869 866,367
Labour 175,302,740 7 0 0 5,359,469 6,674,119 7,567,528 8,921,921 8,873,012 8,900,644 8,908,972 8,890,365 8,908,430 8,921,170 8,860,520 8,921,372 8,901,093 8,930,489 8,879,870 8,896,611 8,915,683 8,854,924 8,921,658 8,940,551 4,354,338
Reagents 749,679,676 32 0 0 22,919,691 28,541,774 32,362,424 38,154,469 37,945,310 38,063,477 38,099,093 38,019,521 38,096,776 38,151,259 37,891,887 38,152,119 38,065,397 38,191,111 37,974,637 38,046,232 38,127,791 37,867,956 38,153,344 38,234,141 18,621,266
Utilities ‐ Disel 134,987,639 6 0 0 4,126,929 5,139,244 5,827,192 6,870,110 6,832,449 6,853,726 6,860,139 6,845,811 6,859,722 6,869,532 6,822,829 6,869,687 6,854,072 6,876,708 6,837,729 6,850,621 6,865,306 6,818,520 6,869,907 6,884,456 3,352,953
Consumable – Electricity 135,440,618 6 0 0 4,140,778 5,156,490 5,846,746 6,893,164 6,855,376 6,876,725 6,883,159 6,868,783 6,882,741 6,892,584 6,845,725 6,892,739 6,877,072 6,899,784 6,860,675 6,873,609 6,888,344 6,841,401 6,892,961 6,907,558 3,364,204
Water treatment 447,542,912 19 0 0 13,682,571 17,038,836 19,319,683 22,777,411 22,652,548 22,723,091 22,744,353 22,696,850 22,742,970 22,775,495 22,620,655 22,776,008 22,724,237 22,799,286 22,670,055 22,712,796 22,761,485 22,606,369 22,776,739 22,824,974 11,116,502
Waste Management 64,775,948 3 0 0 1,980,372 2,466,147 2,796,270 3,296,731 3,278,658 3,288,868 3,291,946 3,285,070 3,291,746 3,296,453 3,274,042 3,296,528 3,289,034 3,299,897 3,281,192 3,287,378 3,294,425 3,271,974 3,296,633 3,303,615 1,608,967
Sales Costs 1,945,513,128 83 0 0 58,225,072 72,045,841 82,146,614 97,999,757 99,847,047 101,236,318 97,707,991 96,465,158 95,366,945 95,215,064 92,383,393 91,603,749 95,221,304 95,218,942 100,667,140 99,864,513 102,375,696 102,791,476 108,494,747 107,473,759 53,162,603
Transport ‐ Area 400 Product handling 0 0 0 0 0 0 0 0 0 0 0 0 0 0 0 0 0 0 0 0 0 0 0 0 0
Treatment & Refining TREO 1,945,513,128 82 0 0 58,225,072 72,045,841 82,146,614 97,999,757 99,847,047 101,236,318 97,707,991 96,465,158 95,366,945 95,215,064 92,383,393 91,603,749 95,221,304 95,218,942 100,667,140 99,864,513 102,375,696 102,791,476 108,494,747 107,473,759 53,162,603
Treatment & Refining Zr/Hf 0 0 0 0 0 0 0 0 0 0 0 0 0 0 0 0 0 0 0 0 0 0 0 0 0
0 0 0
TOTAL OPERATING COST 4,063,765,444 172.4 126,413,583 155,209,583 175,451,053 206,289,766 207,749,637 210,342,227 206,404,614 205,096,696 204,201,779 204,168,749 200,853,747 199,106,989 202,210,959 201,404,733 205,948,099 205,815,510 208,290,523 207,444,431 214,165,037 212,808,253 104,389,476
Discounted Cash Flow LOM
USD/t ROM
Ave ‐2 ‐1 0 1 2 3 4 5 6 7 8 9 10 11 12 13 14 15 16 17 18 19 20
Total Capital Investment 423,040,278 176,481,777 176,481,777 25,767,944 455,139 11,655,139 1,417,139 455,139 455,139 455,139 1,350,139 455,139 1,371,139 20,850,139 1,293,139 455,139 455,139 455,139 455,139 455,139 455,139 455,139 455,139 455,139
Sales 6,600,312,157 291.4 0 0 194,469,129 240,514,765 273,642,101 324,078,145 326,866,393 327,017,243 331,189,981 328,832,978 324,509,680 326,426,094 315,769,289 310,064,395 327,895,496 317,928,414 351,390,095 332,628,593 350,548,206 355,654,898 374,322,115 377,135,348 189,428,799
Total Cost of Goods Sold 4,067,685,086 179.6 0 0 126,593,023 155,387,796 175,629,876 206,469,391 207,931,782 210,523,862 206,588,493 205,279,646 204,381,956 204,349,729 201,030,008 199,278,888 202,393,158 201,580,808 206,143,857 206,000,435 208,485,003 207,643,136 214,372,609 213,016,928 104,604,701
Production Cost 2,118,252,316 89.9 0 0 68,188,510 83,163,742 93,304,439 108,290,009 107,902,591 109,105,909 108,696,624 108,631,538 108,834,835 108,953,685 108,470,353 107,503,240 106,989,655 106,185,791 105,280,959 105,950,997 105,914,827 104,652,955 105,670,289 105,334,495 51,226,873
Cost of Sales 1,945,513,128 82.5 0 0 58,225,072 72,045,841 82,146,614 97,999,757 99,847,047 101,236,318 97,707,991 96,465,158 95,366,945 95,215,064 92,383,393 91,603,749 95,221,304 95,218,942 100,667,140 99,864,513 102,375,696 102,791,476 108,494,747 107,473,759 53,162,603
Royalty 3,919,642 0.2 0 0 179,440 178,213 178,823 179,625 182,145 181,635 183,879 182,950 180,177 180,980 176,261 171,900 182,199 176,076 195,758 184,925 194,480 198,705 207,572 208,674 215,226
Annual Operating Income 2,532,627,071 107 0 0 67,876,106 85,126,969 98,012,225 117,608,754 118,934,611 116,493,381 124,601,488 123,553,332 120,127,724 122,076,365 114,739,281 110,785,507 125,502,338 116,347,606 145,246,237 126,628,158 142,063,203 148,011,762 159,949,506 164,118,420 84,824,098
Pre Tax 90 ‐176,481,777 ‐176,481,777 42,108,162 84,671,830 86,357,086 116,191,615 118,479,472 116,038,242 124,146,349 122,203,193 119,672,585 120,705,226 93,889,142 109,492,368 125,047,199 115,892,467 144,791,098 126,173,019 141,608,064 147,556,623 159,494,367 163,663,281 84,368,959
Pre Tax Cumulative ‐176,481,777 ‐352,963,554 ‐310,855,392 ‐226,183,562 ‐139,826,477 ‐23,634,862 94,844,611 210,882,852 335,029,201 457,232,395 576,904,980 697,610,206 791,499,348 900,991,716 1,026,038,915 1,141,931,382 1,286,722,480 1,412,895,499 1,554,503,563 1,702,060,187 1,861,554,553 2,025,217,834 2,109,586,793
Annual Depreciation Claimed 381,878,861 0 0 26,472,267 17,670,935 17,693,692 18,276,449 18,468,849 18,491,606 18,514,362 18,537,119 18,738,876 18,569,233 18,775,190 20,026,947 20,217,304 20,061,061 20,083,818 19,923,375 19,667,132 19,506,593 19,529,350 10,728,018 1,926,686
Annual depreciation allowance 0 8,824,089 17,648,178 17,670,935 17,693,692 18,276,449 18,468,849 18,491,606 18,514,362 18,537,119 18,738,876 18,569,233 18,775,190 20,026,947 20,217,304 20,061,061 20,083,818 19,923,375 19,667,132 19,506,593 19,529,350 10,728,018 1,926,686
Annual depreciation carry forward 0 0 8,824,089 0 0 0 0 0 0 0 0 0 0 0 0 0 0 0 0 0 0 0 0
Working capital take out 0 0 0 0 0 0 0 0 0 0 0 0 0 0 0 0 0 0 0 0 0 0 0 0
Taxable Operating Income 2,150,748,210 91 0 0 41,403,840 67,456,034 80,318,533 99,332,305 100,465,763 98,001,775 106,087,126 105,016,213 101,388,848 103,507,132 95,964,091 90,758,559 105,285,034 96,286,545 125,162,419 106,704,783 122,396,071 128,505,169 140,420,156 153,390,402 82,897,412
Taxes 473,164,606 20 0 0 9,108,845 14,840,327 17,670,077 21,853,107 22,102,468 21,560,391 23,339,168 23,103,567 22,305,547 22,771,569 21,112,100 19,966,883 23,162,707 21,183,040 27,535,732 23,475,052 26,927,136 28,271,137 30,892,434 33,745,888 18,237,431
Corporations Tax 473,164,606 20 0 0 9,108,845 14,840,327 17,670,077 21,853,107 22,102,468 21,560,391 23,339,168 23,103,567 22,305,547 22,771,569 21,112,100 19,966,883 23,162,707 21,183,040 27,535,732 23,475,052 26,927,136 28,271,137 30,892,434 33,745,888 18,237,431
Loss Carry Forward 0 0 0 0 0 0 0 0 0 0 0 0 0 0 0 0 0 0 0 0 0 0 0
Loss Carry Forward Claimed 0 0 0 0 0 0 0 0 0 0 0 0 0 0 0 0 0 0 0 0 0 0 0
Annual Post Tax Income 1,677,583,604 71 0 0 32,294,995 52,615,706 62,648,456 77,479,198 78,363,295 76,441,385 82,747,958 81,912,646 79,083,301 80,735,563 74,851,991 70,791,676 82,122,326 75,103,505 97,626,687 83,229,731 95,468,936 100,234,032 109,527,722 119,644,514 64,659,981
Annual Cash Income 2,059,462,465 87 0 0 58,767,261 70,286,641 80,342,147 95,755,647 96,832,144 94,932,990 101,262,320 100,449,765 97,822,178 99,304,796 93,627,181 90,818,624 102,339,631 95,164,566 117,710,505 103,153,106 115,136,068 119,740,625 129,057,071 130,372,531 66,586,667
Annual Cash Flow 1,636,422,187 69 ‐176,481,777 ‐176,481,777 32,999,317 69,831,502 68,687,008 94,338,508 96,377,005 94,477,851 100,807,181 99,099,626 97,367,039 97,933,657 72,777,042 89,525,485 101,884,492 94,709,427 117,255,366 102,697,967 114,680,929 119,285,486 128,601,932 129,917,392 66,131,528
Cumulative Cash Flow ‐176,481,777 ‐352,963,554 ‐319,964,237 ‐250,132,734 ‐181,445,726 ‐87,107,218 9,269,786 103,747,637 204,554,819 303,654,445 401,021,484 498,955,141 571,732,183 661,257,668 763,142,159 857,851,587 975,106,953 1,077,804,919 1,192,485,848 1,311,771,334 1,440,373,266 1,570,290,659 1,636,422,187
Discounted Cash Flow Analysis
Annual Calculations

NI 43-101 - Technical report Norra Kärr REE - 0465-RPT-014 Rev 1
Page 345
24.2 PROJECT EXECUTION PLAN
The implementation schedule for the Norra Kärr project is to provide all services, labour, materials
and equipment required to design, procure, install, construct and commission the mine, beneficiation
and hydrometallurgy facility and all necessary infrastructure. It spans the entire life of the project from
the feasibility study to commissioning of the plant and final handover.
This implementation plan commences at the submission of the PFS, at which time the further
recommended testwork is conducted and the feasibility study can be awarded. This study is expected
to take nine months from award in October 2015. At the completion of the BFS, a period of three
months has been allowed for approval and financing of the project. On approval of the project, a
period of four months has been allowed for the EPCM tender process. On award of the EPCM
contract a period of 49 months is envisaged to allow for basic engineering, detail design, procurement
and construction. The implementation schedule is below in Figure 24-1.
Figure 24-1 Norra Kärr Implementation schedule

NI 43-101 - Technical report Norra Kärr REE - 0465-RPT-014 Rev 1
Page 346
SECTION 25 INTERPRETATION AND CONCLUSIONS
GBM considers that the Norra Kärr project has fulfilled its purpose of demonstrating, to a reasonable
degree of confidence, the potential to cost effectively and profitably mine and process the REE
deposit.
No fatal flaws at this stage of project development have been identified, in terms of mineral resource,
process, waste management, logistics and environmental impact.
The DCF model gave a robust result of, a post-tax NPV of USD 312.7 M and an IRR of 20 %. This
result reflects a technically and economically feasible project, which should lead to further investment
and development.
25.1 MINERAL RESOURCES
The Norra Kärr deposit is a zoned agpaitic, peralkaline, nepheline syenite which hosts REO
mineralisation in the form of the complex zircon-silicate mineral eudialyte. The Norra Kärr complex
outcrops at surface and the intrusive body has a strike length of approximately 1 300 m and a width of
450 m making it potentially an attractive target for open pit mining.
Tasman has carried out an extensive exploration programme comprising geological mapping,
geophysical surveys, structural mapping and has drilled 119 surface diamond drill holes totalling
20 420 m. Drill holes have generally been drilled on east-west section lines spaced 50 m apart and
inclined approximately 50° to the east. WAI is of the opinion that the spatial distribution of the drilling
coupled with the high level of geological logging and mapping has robustly defined the extents,
structure and lithologies of the Norra Kärr deposit.
The risk of their being a different interpretation to the geological model or to the morphology of the
deposit is low. Drill holes are sufficiently spaced to allow WAI to evaluate spatial continuity of grades
through variography, with WAI able to produce defined variogram models.
A robust QA/QC programme has been implemented by Tasman to ensure the integrity of the sample
data. WAI has reviewed the QA/QC results and is of the opinion that the sample data is both accurate
and precise and the risk of biased samples affecting the Mineral Resource estimate is low.
WAI has produced a Mineral Resource estimate in accordance with the CIM Code (2010 (3)) based
on a geological model with the domains defined by geological logging and elemental assay ratios.
WAI has undertaken a detailed variographic analysis of the sample data for each element and host
lithotype. Based on the variography a QKNA analysis has been undertaken allowing WAI to derive the
optimal block sizes and search parameters in the grade estimation. WAI has classified the Mineral
Resources at Norra Kärr as “Indicated” reflecting the high confidence in the quality of the sample data
and the geological continuity. The limitation of the classification to “Indicated” reflects that whilst

NI 43-101 - Technical report Norra Kärr REE - 0465-RPT-014 Rev 1
Page 347
grade continuity is well demonstrated along strike the spacing of drill holes down dip is only sufficient
to correspond to the variogram range.
WAI is of the opinion that the Mineral Resource is robust and based on sound geological and sample
data with the grade estimates representative of the sample data.
25.2 MINERAL RESERVES
The result of open pit optimisation and design has shown that the deposit is highly suited to open pit
mining. The deposit’s bulk nature, expanse, and favourable geotechnics support the open pit design.
Existing drilling has shown a fault zone to the south-east; however this has been taken into account
within the geotechnical study and resulting open pit design.
The economics of supporting an open pit design are also favourable, considering the relative low cost
of mining and the high USD/tonne value of the ore make open pit mining the favoured choice for
extraction.
Through open pit optimisation, geotechnical assessment, loss/dilution study, and mine engineering
the project has shown sufficient confidence in the modifying factors to be able to demonstrate the
conversion into a mining reserve. It is highlighted that only Probable category Mineral Reserves are
issued, this is due to available Mineral Resource category rather than confidence of mining modifying
factors.
25.2.1 GEOTECHNICAL
The investigation has shown the deposit generally has a very high rock strength with defined
structural jointing, in the form of a broad orthogonal joint pattern and foliation trend, which, due to the
high rock strength is a preferential weakness plane.
Owing to the rock strength and geometry of the joint sets, the limiting factor for the pit design has
been based on structural failures at the bench level scale of design. Bench geometry in order to
minimise kinematic failures has dictated the overall slope angles. The current bench design aimed to
use the critical joint plane as the bench face angle resulting in the removal of kinematic failures.
Operational this means the bench faces will need to use care when blasting final pit limits, ideally with
pre-splits and scaling to engineer the contact with joint dip. This will also mean the bench design will
need to follow variations in trend and dip with the joint plane where it migrates.
The investigation also took note of a known fault to the south-east, as part of the investigation, using
data supplied from site geologists; a wireframe was generated for a rough fault trend that will be used
for further pit design. Reviewing numerical modelling around the fault, WAI recommends benching or

NI 43-101 - Technical report Norra Kärr REE - 0465-RPT-014 Rev 1
Page 348
de-coupling areas of the fault, as the modelling highlighted potential high risk areas associated with
proximity to the fault.
The western pit wall was also highlighted by the geotechnical drilling program as having a comparably
poorer rock mass quality, with the drilling indicating poor RQD areas that could in interpolated as
being isolated or part of large scale structure. The assessment has considered the poor RQD areas
only during whole slope analysis. The general trend of the deposit means any structures would be
favourably orientated, but this is an area where further work is recommended, ideally with a trial put or
slope to confirm on a larger scale
25.3 ENVIRONMENTAL AND COMMUNITY
Some environmental baseline information is available particularly for the area of the exploitation
concession. However there are still many information gaps. In preparation for the future
environmental permit application, a number of field studies and other investigations such as noise and
dust estimation are likely required to be carried out.
Issues and concerns related to water are likely the most important environmental issue. Much of the
stakeholder concern is related to fears regarding impacts on water, particularly on Lake Vättern. The
watercourses potentially affected by the project are sensitive and have high nature value. The small
streams currently located within the footprint flow into Lake Vättern through Natura 2000 sites. The
receiving watercourse Adelövån flows away from Lake Vättern, but also on that route there are
important and sensitive water bodies, including the next lake downriver of the project site, Lake Noen.
The importance of all these waters cannot be overstated. Strict management measures are likely to
be required to be planned and implemented to ensure no significant deterioration of any of these
watercourses is caused. Golder considers it most likely that an environmental permit will be granted to
the project only after it can be demonstrated that no significant harm will be caused to Lakes Vättern
or Noen. The current plan is to discharge all water coming into contact with the mining away from
Lake Vättern. The predicted maximum flow rates are very high compared to the natural flow rate in
the receiving watercourse, the stream Adelövån. Discharge will be controlled to coincide periods of
highest discharge with highest natural flow. Nevertheless based on the current plan the discharge
from the project would form a considerable portion of the stream flow.
The exact requirements for treatment of discharged water will be determined in the later design
stages of the project. A detailed water management plan will need to be developed in the later design
stages of the project, based on sufficient data on all factors affecting water quality as well as quantity.
Biodiversity values related to certain species and habitats have been identified in the area impacted
by the project. None of these are strictly protected with the exception of the great crested newt. It is
expected that a compensation program for the great crested newt is likely to be required in
environmental permitting.

NI 43-101 - Technical report Norra Kärr REE - 0465-RPT-014 Rev 1
Page 349
There are data gaps. While Golder currently expects that these future investigations are unlikely to
reveal such values that would become obstacles to project development altogether, it is possible that
further mitigation and management measures may be required based on the results of such
investigations.
Should the project go ahead, a considerable number of jobs are expected to be created particularly in
the construction phase but also on a more permanent basis during operations. It is expected that the
majority of the workforce would likely live in the nearby municipalities, and also pay their taxes there.
Some anti-mining activists have voiced their objections towards the project. Based on experience
from other projects, and backed up by surveys undertaken in the local area, it is expected that there is
much less opposition among the local people than would seem based on the public discussion only.
In the two surveys undertaken during 2014, around 60 % of respondents were positive towards the
mine assuming no adverse environmental impact is caused.

NI 43-101 - Technical report Norra Kärr REE - 0465-RPT-014 Rev 1
Page 350
SECTION 26 RECOMMENDATIONS
Based on the outcomes of the PFS, it is recommended that consideration be given by Tasman to
continue with further development and characterisation and optimisation of the process and conduct a
more advanced technical and economic study to Feasibility level. This work should include the
demonstration and optimisation of the beneficiation, hydrometallurgical and waste treatment systems
in a continuous campaign.
26.1 MINERAL RESERVES
The optimized pit within this PFS is designed for a 20 year mine life and produces 23.6 Mt of
ore. Potentially economic mineralized rock lies within and below the optimised pit shell, and therefore
presents significant potential beyond the current design. It is recommended therefore that this larger
amount of potentially economic mineralized rock both within and outside the optimised pit shell, be
studied further to assess the potential for increasing the mine production rate or mine life.
The mining engineering for the Norra Kärr pit design has been constrained primarily through blasting
conditions. The maximum fragmentation size of 600 mm has led to a reduced blasting spacing, which
in turn has increased drill metres and blasting costs. This cost may be reduced if a larger
fragmentation size could be achieved. In addition proximity to the E4 highway (west of the mine) has
constrained the design. WAI is of the opinion that appropriate management and design of blasting can
reduce fly-rock risk; enabling the pit to be extended towards the highway. It is recommended that a
blasting trial and study be conducted to investigate the potential of increasing the blast hole spacing
whilst maintaining fragmentation; and managing the fly-rock potential. It is estimated that this work
will cost in the region of USD 20 000 to USD 40 000.
26.1.1 GEOTECHNICAL
The south-east fault is known to contain water and has significant recharge, the position of the lower
benches in the vicinity of the fault are recommended to have drain holes to prevent build-up of ground
water pressures in the slope high walls, similar sumps should be located nearby. To carry out
hydrogeological drilling, logging, hydraulic testing and an impact assessment and borehole inventory
costs are estimated at approximately USD 315 000.
It is recommended during excavation a review by bench or domain on the suitability of design to in-
situ conditions is completed, with a view to either slope geometry modification or additional support if
required i.e. a minor revision to the bench face angle, rather than undercutting the slope and exposing
loose blocks. Similarly final pit wall blasting of pre-splitting or cushion blasting is recommended to
reduce the rock mass damage into the final slopes and enable a split to a joint plane.

NI 43-101 - Technical report Norra Kärr REE - 0465-RPT-014 Rev 1
Page 351
It is recommended that development be conducted using an observational method of design, whereby
feedback from monitoring and mapping are incorporated into a review of the design to ensure it is
suitable for purpose.
In the case of the project, a trial slope to test and monitor the effect of the design on a small scale
should be undertaken to ensure that the designs are appropriate, even conducting an over steepened
trial area that can be used for back analysis could be considered.
Also as highlighted in the conclusions, the effect of small scale faulting has not been considered for
whole slope or bench scale stability. Therefore, an appropriate logical search for faults during
excavation or further drill investigations is recommended. The search needs to be carried out before
and during excavation with suitable procedures and management of implications. Geophysics could
be considered as a good remote sensing tool for initial studies.
For the purpose of initial costings for the next stage of the study, it is recommended that further
geotechnical drilling and trenching is undertaken at the site, targeting structures such as the known
faulting as well as weaker zones near the surface. The investigations would be undertaken in
conjunction with hydrogeological investigations and testwork, which are costed elsewhere. It is
considered that a nominal allowance should be made for between 1 000 m and 1 200 m of
geotechnical orientated core drilling and associated geotechnical laboratory testwork. The budget
costings for geotechnical these investigations are between USD 230 000 and USD 315 000.
26.1.2 MINE WASTE MATERIAL
Site investigations should also be undertaken to identify the geotechnical and hydrogeological
conditions at the proposed waste dump site. The available topographic survey data covering the
waste dump footprint should be checked and updated if necessary.
26.2 TAILINGS STORAGE FACILITY
More technical information is needed to further progress the TSF design. Specifically, testwork should
be undertaken on the combined tailings stream for geochemical and geotechnical characterisation
purposes. A topographic survey should be undertaken for future engineering modelling and design
work. Geotechnical site investigations should be undertaken at key locations – i.e. the main
embankment structures, and areas of cut and fill. Hydrogeological site investigations should be
undertaken to characterise the aquifers at the tailings site. The potential cost for site investigations is
estimated to be between USD 150 000 and USD 230 000 in addition to estimated costs of
USD 75 000 and USD 110 000 for tailings testwork. Additional costs for hydrogeological drilling,
logging, hydraulic testing, impact assessment and borehole inventory are estimated in the region of
USD 150 000.

NI 43-101 - Technical report Norra Kärr REE - 0465-RPT-014 Rev 1
Page 352
26.3 METALLURGY AND PROCESS
A significant amount of the operating costs and land usage is devoted to the treatment and storage of
solid waste and effluent streams generated by the process. Ongoing testwork should attempt to
address this issue by undertaking the following investigations:
characterisation of the waste streams;
investigate opportunities to valorise waste streams; and
investigate opportunities to minimise waste streams.
The confidence in the process feasibility can be improved with the continuous demonstration and
optimisation of the process flowsheet. This process will look to:
confirm the operability of the process;
confirm mass and energy balance for the process; and
Optimisation of process variables.
The Norra Kärr ore has very low level of uranium and thorium however a detailed radionuclide
deportment study on the optimised process is required to determine the fate of all deleterious
elements and ensure they are properly managed.
Most of the process development testwork has been conducted on composites. Although this is
satisfactory for a PFS domain variability testing should be conducted to confirm the reproducibility of
the results generated to date.
Comminution testing to assess work properties and liberation behaviour of the
composites employing the planned comminution and classification equipment; and
Magnetic separation testing to improve the modal mineralogical characteristics of the
magnetic concentrate.
26.4 ENVIRONMENTAL AND COMMUNITY
In order to be able to start construction and operations at the mine, Tasman will need an
environmental permit.
26.4.1 FURTHER STUDIES EXPECTED TO BE REQUIRED
In order to prepare the environmental permit application, including the required EIA, further studies
are needed. Studies that are likely to be required include, but are not necessarily limited to, the
following:
26.4.1.1 GEOCHEMISTRY
Full characterisation of all tailings streams will be needed in addition to the waste rock
characterisation already available. Testing of the combined tailings in representative quantities to

NI 43-101 - Technical report Norra Kärr REE - 0465-RPT-014 Rev 1
Page 353
determine the expected quality of water discharged from the TSF. The results of the above mentioned
studies should be utilised to steer design of potentially required management measures in the later
design stages of the project. Ultimately the requirements for any water treatment, containment
structures etc. will be set by the environmental permitting process.
26.4.1.2 SURFACE WATER
Baseline data on the flow rate, flow patterns and water level in the upper reaches of the receiving
stream Adelövån are currently not available. There is only the modelled flow data for the entire
catchment available from VISS (Swedish Water Information System). Data for the stream near the
discharge point and downriver from there will be needed in the later stages of the project to ensure
the capacity of the channel to take in all discharged water and for the design and permitting of
potentially needed channel works.
The longer the time series, the better baseline data is obtained. A minimum of one years’ data is
recommended. Therefore Golder recommends that monitoring of flow rate in the channel and water
level in the Gransjön and some of the other small lakes / ponds along the course of the Adelövån
stream, as well as in the Narbäcken, Stavabäcken and Gyllingesjön be set up. Continuous
measurement would be best, or alternatively several measurement rounds should be spread over all
seasons to capture at least some of the seasonal variation.
Based on current information it is estimated that the watercourses in and around the Project area,
including the Lake Gyllingesjön, are in continuity with groundwater table. The impact of drawdown
resulting from pit drainage has not been investigated in detail in the PFS stage. It is recommended to
investigate predicted impacts on water level of the lake, taking into consideration also that some of
the precipitation into the lake’s current catchment area is planned to be directed elsewhere.
In order to predict the impacts on surface water at the level required for environmental permitting, it is
likely that further studies will be required. Such requirements could be related to:
More detailed estimate of the quality of the seepage water from the open mine pit (acid
formation, expected fluoride concentrations, leaching potential, estimated concentrations of
explosive residuals);
Seepage water from mine pit, waste rock dump and surface water runoff: is there need for
treatment;
Estimate on the leaching of metals and fluoride from the open pit and waste rock;
Based on the expected discharge water quality, it should be ensured that baseline data
concerning all key substances concerned is available. If this is not the case, it would be
recommended to conduct further sampling;
Stratification and hydrodynamics of receiving lakes;
Sediments in all receiving water courses;

NI 43-101 - Technical report Norra Kärr REE - 0465-RPT-014 Rev 1
Page 354
It is recommended that a database be created to store all the raw data from the baseline
studies.
Furthermore risk assessment related to surface water may be required related to the following:
Dam break risk;
Erosion damage (downstream in channel);
Flood risk analysis along the Adelövån (taking into account the channel works potentially to
be undertaken); and
Sufficiency of flood storage capacity in more detail.
26.4.1.3 GROUNDWATER
A more detailed hydrogeological study should be performed before the environmental permit
application. In particular, the hydraulic properties of the soil cover and potential impact on the
groundwater at the proposed location of the TSF needs further assessment. The study should include
an inventory of water supply and geoenergy wells in the surroundings of the proposed tailings
management facility with clarification ponds and an extended inventory of wells in the area that may
be affected by the mining activities that may be missing in the public records. The hydrogeological
study should also investigate what protective measures related to groundwater may be needed.
26.4.1.4 BIODIVERSITY
Ecology field studies encompassing the entire project footprint and areas affected by project
infrastructure will likely be required for environmental permitting. The areas that have so far only been
briefly visited should also be part of a more comprehensive ecology field study.
There are a number of small open water ponds in various parts of the Project area, including e.g. the
northern part of the TSF, which appear potentially suitable for the great crested newt (Triturus
cristatus). Therefore a newt inventory encompassing all the ponds affected by the project should be
carried out to ensure all newt populations in the area are known prior to any works being undertaken.
26.4.1.5 PROTECTED AREAS
There are a number of Natura 2000 sites and other protected areas within a few kilometres distance
of the project area. Impact studies, particularly Natura 2000 Appropriate Assessments will likely be
required to demonstrate that there will be no adverse impact on site integrity caused for any Natura
2000 areas located near the project footprint as well as downstream from the water discharge point.
26.4.1.6 CULTURAL HERITAGE
The archaeology inventory undertaken at and around the exploitation concession area has identified a
few targets for which a phase 2 archaeology study is required before actions disturbing the remains
can be undertaken.

NI 43-101 - Technical report Norra Kärr REE - 0465-RPT-014 Rev 1
Page 355
Furthermore, a baseline archaeology inventory should be carried out for the entire area of the project
footprint. This further study may indicate further targets also warranting Phase 2 archaeology studies.
26.4.1.7 NOISE, VIBRATIONS AND DUST IMPACTS
Considering that there are a number of dwellings located close to the project footprint, it is expected
that in order to be able to assess impacts at the level required for environmental permitting, dispersal
modelling of noise and/or dust emissions may need to be undertaken. Furthermore impact of ground
vibrations on existing buildings will need to be assessed. Monitoring of all of these impacts will likely
to be required.
26.4.1.8 LANDSCAPE AND VISUAL
A landscape study and assessment of visual impacts, possibly including production of photomontages
and other visualisation, may be required.
26.4.1.9 VIABLE OPTIONS FOR ENERGY PRODUCTION
The base case solution for production of required heat energy for the PFS design stage is a diesel
boiler plant. However more environmentally friendly options are available in the Swedish market. It is
recommended that these options are reviewed to identify potential and then preferable options. Such
a study should take into consideration operability, cost and environmental impact and particularly look
into combination of various energy sources such as bio fuel, procured electricity and geothermal
energy.
26.4.2 FURTHER NEEDS FOR DESIGN AND PLANNING
The further studies briefly described above should be used to steer design and planning of the project
in the future stages of development. Based on current knowledge and plans, the following plans and
programmes are recommended to be developed, but there may be need for more.
26.4.2.1 PREPARATION OF ENVIRONMENTAL PERMIT APPLICATION
It is recommended to start the preparation of the environmental permit application to be submitted to
the Land and Environmental Court in good time. The preparation, including the various studies
required, the environmental impact assessment and the public hearing phase can take several years.
The permitting of various related infrastructure in addition to the actual mining operation and
processing can be included in the same permit application.
The application and the required appendixes, including the Technical Description TD and
Environmental Impact Assessment EIA, must be prepared in Swedish language. Certain Swedish
requirements such as the impact classification of dams (GruvRIDAS) should also be included.

NI 43-101 - Technical report Norra Kärr REE - 0465-RPT-014 Rev 1
Page 356
A cost estimate for the preparation of the permit application including the TD and EIA and the related
studies would be approximately USD 740 000, divided as follows:
USD 350 000 for required further studies
USD 250 000 for preparation of the application, including TD and EIA
USD 140 000 for the refined plans, risk classifications etc. required by Swedish legislation
and practice such as waste management plan, refined closure plan, GruvRIDAS etc.
26.4.2.2 DETAILED WATER MANAGEMENT PLAN
In the later design stages a more detailed water management plan should be developed. The plan
should be based on more data on water balances, developed to a higher level of detail than currently
(e.g. daily time-step) and flow rates as well as factors affecting water quality, particularly
characterisation of all tailings streams. The plan should include consideration of at least:
Water quantities
o Flow rates towards Adelövån
o Capacity of the Adelövån system to take in all the water with no aggravation of flood
risk
o Ensuring sufficient flow in the other watercourses
Water quality
o Potential need for treatment of some or all water streams
o Design of a cost-efficient treatment approach (e.g. treatment of certain streams only
vs. treatment of the entire volume for environmental discharge)
Stormwater management plan, including contingency planning for heavy rainfall episodes
A need for additional water storage capacity for water pumped from the pit has been identified
in the PFS-level Site Wide Water Balance. The storage capacity will be provided in the final
design based on further information on realistic flow rates on site. The water management
plan should include measures to separate potentially contaminated water from clean water to
minimise the need for treatment prior to disposal and maximise the potential discharge
options such that the impact on the surface water environment will be mitigated
Considering the high flow rates of discharge water in relation to the receiving watercourse, it
is recommended that all options to reduce amount of water that needs to be considered as
contact water should be investigated to limit the need of discharge where possible. Technical
and management solutions are likely to be available.
26.4.2.3 OTHER MITIGATION MEASURES AND/OR COMPENSATION PROGRAMS
In the future design stages of the project, and ultimately in the environmental permit, further needs for
mitigation measures and/or compensation may be identified. Such could be related to e.g.

NI 43-101 - Technical report Norra Kärr REE - 0465-RPT-014 Rev 1
Page 357
compensation of impacts to some other species besides the great crested newt, or mitigation such as
noise and visibility screening. Based on current information such requirements are considered unlikely
but the need should be revisited when more information is available.
26.4.2.4 HEALTH AND SAFETY
Health and safety considerations have been considered in the design at a high level reflecting the
preliminary design level suitable for PFS stage of project. In the future stages of design, all relevant
health and safety risks and issues should be identified in good time and taken into account in the
design and planning of all operations. Various types of risk assessments are likely to be required in
the further project development stages. Advance planning to avoid and mitigate risks is usually the
safest as well as the most cost-effective option.
26.5 ESTIMATED COSTS FOR RECOMMENDATIONS
An indicative budget has been prepared based on the current scope for the preparation and
completion of a Feasibility study for the project. Table 26-1 presents the probable anticipated costs.
Table 26-1 Estimated Costs for development
Activity Estimated Cost USD
Blast study 40 000
Geotechnical study 315 000
Tailings storage development 490 000
Environmental studies and applications 740 000
Comminution and beneficiation definition 250 000
Hydrometallurgical definition 1 250 000
Process demonstration 2 000 000
Industrial pilot plant - Design, build & decommission 5 500 000
Industrial pilot plant – Operation and off-take preparation 11 500 000
Complete definitive feasibility study 3 000 000
Total 25 085 000

NI 43-101 - Technical report Norra Kärr REE - 0465-RPT-014 Rev 1
Page 358
SECTION 27 REFERENCES
1. Repeal and Replacement of National Instrument 43-101 Standards of Disclosure for Mineral
Projects, Form 43-101F1 Technical Report, and Companion Policy 43-101CP, Supplement to the
OSC Bulletin. The Ontario Securities Commission. 14 (Supp-2), Toronto : Published under
authority of the Commission by Carswell, a Thomson Reuters business., 24 June 2011, Vol. 34. NI
43-101.
2. Canadian Institute of Mining, Metallurgy and Petroleum. CIM Standards for Mineral Resources
and Mineral Reserves. [Online] 27 November 2010. http://web.cim.org/standards/.
3. CIM Definition Standards for Mineral Resources and Mineral Reserves [Online]. CIM. [Online]
2010. http://web.cim.org/standards/.
4. Wardell Armstrong International. Report on Tailings Storage Facility, Norra Karr Rare Earth
Project, Sweden. 2014.
5. Pincock, Allen, and Holt (PAH). NI43-101 Technical Report, Norra Kärr REE – Zirconium Deposit,
Gränna, Sweden. 2011.
6. Erik Jonnson, Nils Jonsson, Karin Högdahl, Ingmar Lundström and Per Nysten (ed). The
Norra Kärr REE-Zr Project and the Birth Place of Light REEs. . s.l. : SWE3.
7. Christensson, Ulf. Charactersing the Alteration of the Contact to the Norra Kärr Alkaline Complex,
Southern Sweden. s.l. : University of Göteborg, 2013.
8. Appelquist, Karin. Proterozoic Crustal Evolution in Subcentral Fennoscandia. s.l. : Univeristy of
Göteborg. , 2010.
9. Andersson, J, et al., et al. The Sveconorwegian orogen of southern Scandinavia: setting,
petrology and geochronology of polymetamorphic high-grade terranes. s.l. : 33 IGC excursion No 51,
2008.
10. Development of Nepheline Syenites in Rift Zones - Information from three Rift Complexes.
Sørensen, H. s.l. : Geolines, 2003, Vol. 15, pp. 140-146.
11. Christensen, U. Characterising the alteration of the contact to the Norra Karr Alkaline Complex,
Southern Sweden, B.Sc Thesis. s.l. : University of Goteborg, 2013.

NI 43-101 - Technical report Norra Kärr REE - 0465-RPT-014 Rev 1
Page 359
12. Three Compositional Varieties of Rare-Earth Element Ore: Eudialyte-Group Minerals from the
Norra Kärr Alkaline Complex, Southern Sweden. Sjöqvist, A.S.L., Cornell, D.H., Andersen, T.,
Erambert, M., Ek, M. and Leijd, M. 1, s.l. : Minerals, 2013, Vol. 3, pp. 94-120.
13. Rankin, L.R. Structural setting of the Nora Kaar Intrusive Complex, Central Sweden. Geointerp
Confidential Report 2011/2014 for Tasman Metals Ltd, Vancouver. 2011.
14. US Department of Energy. REE Criticality Matrices. [Online]
http://energy.gov/sites/prod/files/edg/news/documents/criticalmaterialsstrategy.pdf.
15. Laznicka, P. Giant Metallic Deposits; Future Sources of Industrial Metals. 2006. pp. 466,467.
16. Ashley, P.M. Petrographic report of five rock samples from Norra Kärr, Jonkoping region,
Sweden. 2009.
17. Wardell Armstrong International. Norra Kärr Mining Loss / Dilution Study. 2014.
18. J., Roth. A model for the determination of flyrock range as a function of shot conditions. s.l. : Los
Altos, CA: Management Science Associates. U.S. Bureau of Mines contract J0387242., 1979.
19. Holman, P. Caterpillar Haul Road Design and Management. s.l. : Caterpillar Global Mining, 2006.
20. Gates, P., Horlacher, C.F. and Reed, G. Amended and Restated Preliminary Economic
Assessment NI43-101 Technical Report for the Norra Karr (REE-Y-Zr) Deposit, Gränna, Sweden. s.l. :
Runge Pincock Minarco, 2013.
21. Golder Associates AB. Site Localisation Study – Draft. 2014.
22. Minarco, Runge Pincock. Amended and Restated Preliminary Economic Assessment NI43-101
Technical Report for the Norra Kärr (REE-Y-Zr) Deposit, Gränna, Sweden. July 2013.
23. GBM Minerals Engineering Consultants Limited . Tailings Composition Memo. 23 July 2014.
24. Golder Associates. Acceptability of Raffinate Waste Water Stream as Discharge to
Environmental Receptor. 22 August 2014.
25. Wardell Armstrong International. Geotechnical and Mining Site Visit Report, Norra Kärr Rare
Earth Project, Sweden. June 2014.
26. —. Spillway design, hyrdological analysis report, Norra Kärr Rare Earth Project, Sweden. October
2014.

NI 43-101 - Technical report Norra Kärr REE - 0465-RPT-014 Rev 1
Page 360
27. BSI. Methods of test for soils for civil engineering purposes . 1990. BS1377 Part 2 Classification
Tests.
28. GBM Minerals Engineering Consultants Limited. Process Design Criteria – 0465-SPC-007
Rev0. 31 October 2014.
29. iO global Solutions Ic. . Norra Kärr Regional Environmental Assessment. 2012.
30. Naturvatten. Miljötillstånd och naturvärden i Gyllingesjön, Stavabäcken och Narbäcken 2011-
2013. 2013.
31. Sweco Environment AB. Ytvattenprovtagning för kemisk analys vid Norra Kärr (Results from
surface water sampling). 2014.
32. VISS), VISS Vatteninformationssystem Sverige (Swedish Water-Information system. [Online]
http://www.viss.lansstyrelsen.se/.
33. Pro Natura. Naturvärdesinventering. Underlag inför ansökan om bearbetningskoncession för
jordartsmetaller (Inventory of nature values). 2012.
34. Ontario Securities Commission. Report on Staff's Review of Technical Reports by Ontario
Mining Issuer. OSC Staff Notice 43-705. 27 June 2013.
35. Adamson, O. J. The Petrology of the Norra Kärr District. An Occurrence of Alkaline Rocks in
Southern Sweden. 1944, Vol. 66, pp. 112-25.
36. (n.d.), Bergsstaten. The Mining Inspectorate of Sweden [Online]. Geological Survey of Sweden.
[Online] http://www.sgu.se/en/mining-inspectorate/.
37. Mineral Profile - Rare Earth Elements [Online]. British Geological Survey. [Online] 2011.
http://www.bgs.ac.uk/mineralsUK/statistics/mineralProfiles.html.
38. (n.d.), GeoNord. A Guide to Mineral Legislation and Regulations in Sweden [Online]. [Online]
http://www.geonord.org/law/minlageng.html.
39. Seismic hazard assessment for Central, North and Northwest Europe: GSHAP Region 3. G,
Grünthal. 6, s.l. : Annali di Geofysica, 1999, Vol. 42, pp. 999-1011.
40. The Transscandinavian Igneous Belt (TIB) in Sweden: a review of its character and evalution. .
Högdahl, K., Andersson, U.B. & Eklund, O. (eds.), Andersson, U.B. et al,. Special Paper 37, s.l. :
Geological Survey of Finland, 2004.

NI 43-101 - Technical report Norra Kärr REE - 0465-RPT-014 Rev 1
Page 361
41. Sveriges Geologiska Undersökning. Guide to Mineral Legislation and Regulations in Sweden
[Online]. [Online] www.sgu.se..
42. (n.d.), World Weather and Climate Information. Average weather and climate in Sweden
[Online]. [Online] http://www.weather-and-climate.com/average-monthly-Rainfall-Temperature-
Sunshine-in-Sweden..
43. Pelagia Miljökonsult AB. . Naturvärdesinventering och beskrivning av fem alternative
sandmagasin vid Norra Kärr / Gränna, 2012. 2012.
44. Pelagia Miljökonsult AB. Naturvärden vid Norra Kärr / Gränna med omnejd. . 2012.
45. Östra Vätterbranterna. Biosfärområde Östra Vätterbranterna (Biosphere area). [Online]
http://www.ostravatterbranterna.se/.
46. Länsstyrelsen. Bevarandeplaner för Natura 2000 områden i Jönköpings län (Conservation plans
for Natura 2000 areas in County of Jönköping). [Online]
http://www.lansstyrelsen.se/Jonkoping/Sv/djur-och-natur/skyddad-natur/natura-
2000/Pages/bevarandeplaner.aspx.
47. —. Naturreservat i Jönköpings län (Nature reserve areas in County of Jönköping). [Online]
http://www.lansstyrelsen.se/JONKOPING/SV/DJUR-OCH-NATUR/SKYDDAD-
NATUR/NATURRESERVAT/Pages/default.aspx.
48. —. Bevarandeplaner för Natura 2000 områden i Östergötland (Conservation plans for Natura
2000 areas in County of Östergötland). [Online]
http://www.lansstyrelsen.se/OSTERGOTLAND/SV/DJUR-OCH-NATUR/SKYDDAD-
NATUR/NATURA-2000/BEVARANDEPLANER-KOMMUNVIS/Pages/beva.
49. Golder Associates. Detaljerad beskrivning av de sällsynta jordartsmetallerna, Zn, Pb, U, Th, Y
och Sc (Description of REEs). 2012.
50. ANSTO Minerals. Technical Note AM_TM_2014_27_03 Norra Kärr Project – Process
Development and Radioactivity Deportment. 2014.
51. Ödeén, A. Ödeén, A. Arkeologisk utredning etapp 1 inför bearbetningskoncessionsansökan,
Gränna och Ödeshög socken i Jönköping och Ödeshög kommun, Jönköping och Östergötlands län
(An archaeological survey). s.l. : Jönköpings Läns Museum, 2012.
52. Tyréns AB. Gruvdrift i Norra Kärr – Effekter på arbetsmarknad och näringsliv (Effects on labour
market and economy). 2012.

NI 43-101 - Technical report Norra Kärr REE - 0465-RPT-014 Rev 1
Page 362
53. NU! Nordiska Undersökningsgruppen AB. Norra Kärr – Tasman Metals AB 2013 Rapport
(Survey results). 2013.
54. Jönköpings Kommun. Översiktsplan 2002 (Municipal Overview Plan 2002). [Online] 2002.
55. WSP Sverige AB. Combiterminal Hubbarps indutriområde Tranås (Transhipment Terminal for
acid trains, Tranås). 2014.
56. ITASCA Consultants AB. Utlåtande avseende jordskalv (Mine’s predicted impact on seismic
risk), Norra Kärr. 2012.
57. Veolia. Water treatment package. . 2014.
58. —. Water Treatment Package. 2014.
59. Golder Associates AB. . Miljökonsekvensbeskrivning - Bearbetningskoncession i Norra Kärr.
2012.
60. Karlsson, T. Större vattensalamander (Triturus cristatus) i Östergötland. Sammanställning av
inventeringar 1994-2005 och övriga fynd I Östergötlands län. . s.l. : Länsstyrelsen Östergötland ,
2006.
61. Golder Associates AB. Materialkaraktärisering av gråberg. 2013.
62. Ramböll Management Consulting. Undersökning av genomförandetider och framtida
resursbehov för project med miljöpåverkan. 2012.
63. Jönköpings-Posten. . Jönköpingsborna vill ha gruva i Norra Kärr - Ny opinionsundersökning om
gruvan. [Online] [Cited: 5 9 2014.] http://www.jonkopingsposten.se/artikel/31011/jonkopingsborna-vill-
ha-gruva-i-norra-karr .
64. Sveriges Radio. Undersökning: Miljön går före gruvdrift. . [Online] 18 8 2014.
http://sverigesradio.se/sida/artikel.aspx?programid=91&artikel=5939917.

NI 43-101 - Technical report Norra Kärr REE - 0465-RPT-014 Rev 1
Page 363
APPENDIX A. QUALIFIED PERSONS CERTIFICATES

NI 43-101 - Technical report Norra Kärr REE - 0465-RPT-014 Rev 1
Page 364
CERTIFICATE OF QUALIFIED PERSON
MICHAEL JOHN SHORT
As the individual who has co-authored or supervised the preparation of sections of the Technical Report prepared
for Tasman Metals Ltd (Issuer) entitled “Amended and Restated Prefeasibility Study - NI 43-101 - Technical
report for the Norra Kärr Rare Earth Element Deposit” dated July 10, 2015 (Technical Report), I hereby certify
that:
1. I am a Chartered Engineer and the Managing Director of GBM Minerals Engineering Consultants
Limited (GBM) of Regal House 70 London Road, Twickenham, Middlesex, TW1 3QS, England.
2. I graduated with a Bachelor of Engineering in Civil Engineering from the University of New South Wales,
Australia in 1975. I am a Chartered Engineer (CEng) registered with the Engineering Council UK and a
Fellow of the Institute of Materials, Minerals and Mining (FIMMM). I am a Chartered Professional (CP)
and a Fellow of the Australasian Institute of Mining and Metallurgy (FAusIMM). I am a Chartered
Professional Engineer (CPEng) and Fellow of Engineers Australia (FIEAust). I have been working in the
engineering profession continuously since 1975 and have had experience in metallurgy, process design
and engineering, plant operations and management.
3. I have read the definition of “Qualified Person” set out in the National Instrument 43-101 (NI-43-101) and
certify that by reason of my education, affiliation with a professional association (as defined in NI 43-
101) and past relevant work experience, I fulfil the requirements to be a “Qualified Person” for the
purposes of NI 43-101.
4. GBM professionals have visited the site from 23rd to 26th June 2014.
5. I have authored or supervised the work carried out by other GBM professionals for GBM’s contribution
to the Technical Report, and take responsibility for Sections 1, 2, 3, 4, 6, 18, 19, 21, 22, 23, 24, 25, 26
and 27.
6. I am independent of the Issuer applying the test set out in Section 1.5 of NI 43-101.
7. I, and GBM, have had no prior involvement with the project.
8. I have read NI 43-101, and the sections of the Technical Report for which I am responsible, as stated
above, have been prepared in compliance with NI 43-101 and Form 43-101F1.
9. To the best of my knowledge, information, and belief, as of the date of this certificate, the Technical
Report contains all scientific and technical information that is required to be disclosed to make the
Technical Report not misleading.
Dated this July 10, 2015, London, United Kingdom.
_____________________________
Michael John Short, BE (Civil), CEng FIMMM, FAusIMM(CP), FIEAust CPEng
Qualified Person

NI 43-101 - Technical report Norra Kärr REE - 0465-RPT-014 Rev 1
Page 365
CERTIFICATE OF QUALIFIED PERSON
THOMAS ARTHUR APELT
As the individual who has co-authored or supervised the preparation of sections of the Technical Report prepared
for Tasman Metals Ltd (Issuer) entitled “Amended and Restated Prefeasibility Study - NI 43-101 - Technical
report for the Norra Kärr Rare Earth Element Deposit” dated July 10, 2015 (Technical Report), I hereby certify
that:
1. I am a Chartered Engineer and Senior Process Engineer of GBM Minerals Engineering Consultants
Limited (GBM) of Regal House 70 London Road, Twickenham, Middlesex, TW1 3QS, England.
2. I graduated with a Bachelor of Engineering degree in Chemical Engineering from the University of
Queensland, Australia in 1992. I graduated with a Doctor of Philosophy (Chemical Engineering) from
the University of Sydney, Australia in 2007. I am a Chartered Engineer registered with the Engineering
Council UK. I am a Member of the Institute of Chemical Engineers (IChemE) and a Chartered
Professional (Metallurgy) Member of the Australasian Institute of Mining and Metallurgy (MAusIMM). I
have been working in the engineering profession continuously since 1993 in process operations,
advanced process control applications, research and development and the conceptual design and
evaluation of mineral processing facilities, including hydrometallurgical processes which employ mineral
leaching in acidic lixiviants and the recovery of metals by solvent extraction, consistent with processes
employed in the treatment of rare earth elements.
3. I have read the definition of “Qualified Person” set out in the National Instrument 43-101 (NI-43-101) and
certify that by reason of my education, affiliation with a professional association (as defined in NI 43-
101) and past relevant work experience, I fulfil the requirements to be a “Qualified Person” for the
purposes of NI 43-101.
4. GBM professionals have visited the site from 23rd to 26th June 2014.
5. I have authored or supervised the work carried out by other GBM professionals for GBM’s contribution
to the Technical Report, and take responsibility for Sections 13 and 17.
6. I am independent of the Issuer applying the test set out in Section 1.5 of NI 43-101.
7. I, and GBM, have had no prior involvement with the project.
8. I have read NI 43-101, and the sections of the Technical Report for which I am responsible, as stated
above, have been prepared in compliance with NI 43-101 and Form 43-101F1.
9. To the best of my knowledge, information, and belief, as of the date of this certificate, the Technical
Report contains all scientific and technical information that is required to be disclosed to make the
Technical Report not misleading.
Dated this July 10, 2015, London, United Kingdom.
_____________________________
Thomas Arthur Apelt, PhD (Chemical Engineering), BEng, MIChemE (CEng), MAusIMM (CP)
Qualified Person

NI 43-101 - Technical report Norra Kärr REE - 0465-RPT-014 Rev 1
Page 366
CERTIFICATE OF QUALIFIED PERSON
Mark Robert Burke Mounde
As the individual who has co-authored or supervised the preparation of sections of the Technical Report prepared
for Tasman Metals Ltd (Issuer) entitled “Amended and Restated Prefeasibility Study - NI 43-101 - Technical
report for the Norra Kärr Rare Earth Element Deposit” dated July 10, 2015 (Technical Report), I hereby certify
that:
1. I am a Chartered Engineer, Technical Director of Wardell Armstrong International, 3rd Floor, 46
Chancery Lane, WC2A 1JE, UK.
2. I graduated with a Bachelor of Engineering in Mining Engineering from the Camborne School of Mines,
Camborne, Cornwall UK 1993. I am a member of the Institute of Materials, Mining and Metallurgy,
Associate Member of the Southern Africa Institute of Mining and Metallurgy and Associate Member of
Camborne School of Mines. I have practised my profession as a Mining Engineer for the past 23 years
with worldwide experience in precious, base, coal and industrial minerals.
3. I have read the definition of “Qualified Person” set out in the National Instrument 43-101 (NI-43-101) and
certify that by reason of my education, affiliation with a professional association (as defined in NI 43-
101) and past relevant work experience, I fulfil the requirements to be a “Qualified Person” for the
purposes of NI 43-101.
4. I have personally visited the Norra Kärr site in 23 – 26 June 2014. Additionally Wardell Armstrong
International professionals have visited the site in 7 – 13 May 2014. I have authored or supervised the
work carried out by other Wardell Armstrong International professionals for Wardell Armstrong
International’s contribution to the Technical Report, and take responsibility for Sections 5, 15 and 16.
5. I am independent of the Issuer applying the test set out in Section 1.5 of NI 43-101.
6. I, and Wardell Armstrong International, have had no prior involvement with the project.
7. I have read NI 43-101, and the sections of the Technical Report for which I am responsible, as stated
above, have been prepared in compliance with NI 43-101 and Form 43-101F1.
8. To the best of my knowledge, information, and belief, as of the date of this certificate, the Technical
Report contains all scientific and technical information that is required to be disclosed to make the
Technical Report not misleading.
Dated this July 10, 2015, London, United Kingdom.
_________________________________
Mark Robert Burke Mounde BEng (Min Eng), CEng, MIMMM
Qualified Person

NI 43-101 - Technical report Norra Kärr REE - 0465-RPT-014 Rev 1
Page 367
CERTIFICATE OF QUALIFIED PERSON
Gregory Moseley
As the individual who has co-authored or supervised the preparation of sections of the Technical Report prepared
for Tasman Metals Ltd (Issuer) entitled “Amended and Restated Prefeasibility Study - NI 43-101 - Technical
report for the Norra Kärr Rare Earth Element Deposit” dated July 10, 2015 (Technical Report), I hereby certify
that:
1. I am a Chartered Engineer and an associate consultant working for Wardell Armstrong International, 3rd
Floor, 46 Chancery Lane, London WC2A 1JE, UK.
2. I graduated with a Bachelor of Science from the University of Cape Town, South Africa 1969 and with a
Master of Science and a DIC from the Royal School of Mines, Imperial College of Science and
Technology, London University in 1981. I am a member of the Institute of Materials, Mining and
Metallurgy. I have practised my profession as a geologist for the past 45 years with worldwide
experience in precious, base and the rare metals.
3. I have read the definition of “Qualified Person” set out in the National Instrument 43-101 (NI-43-101) and
certify that by reason of my education, affiliation with a professional association (as defined in NI 43-
101) and past relevant work experience, I fulfil the requirements to be a “Qualified Person” for the
purposes of NI 43-101.
4. I have personally visited the Norra Kärr site in 7 – 13 May 2014. Additionally Wardell Armstrong
International professionals have visited the site in 23 – 26 June 2014.
5. I have authored or supervised the work carried out by other Wardell Armstrong International
professionals for Wardell Armstrong International’s contribution to the Technical Report, and take
responsibility for Sections 6 – 12 and 14.
6. I am independent of the Issuer applying the test set out in Section 1.5 of NI 43-101.
7. I, and Wardell Armstrong International, have had no prior involvement with the project.
8. I have read NI 43-101, and the sections of the Technical Report for which I am responsible, as stated
above, have been prepared in compliance with NI 43-101 and Form 43-101F1.
9. To the best of my knowledge, information, and belief, as of the date of this certificate, the Technical
Report contains all scientific and technical information that is required to be disclosed to make the
Technical Report not misleading.
Dated July 10, 2015, London, United Kingdom.
Gregory Moseley, BSc, MSc, CEng, MIMMM
Qualified Person

NI 43-101 - Technical report Norra Kärr REE - 0465-RPT-014 Rev 1
Page 368
CERTIFICATE OF QUALIFIED PERSON
Gareth Digges La Touche
As the individual who has co-authored or supervised the preparation of sections of the Technical Report
prepared for Tasman Metals Ltd (Issuer) entitled “Amended and Restated Prefeasibility Study - NI 43-101 -
Technical report for the Norra Kärr Rare Earth Element Deposit” dated July 10, 2015 (Technical Report), I
hereby certify that:
1. I am a Chartered Geologist and Senior Hydrogeologist and Associate of Golder Associates (UK)
Ltd of Attenborough House, Browns Lane Business Park, Stanton-on-Wolds, Nottinghamshire,
NG12 5BL, United Kingdom.
2. I graduated with a B.Sc. in Geology and Geography from the University of Keele in 1990, an M.Sc. in
Computing in Earth Science from the University of Keele in 1991 and an M.Sc. in Hydrogeology, from
the University of Birmingham in 1995. I have approximately 20 years geoscience consulting
experience of which the last 15 have been spent working in the extractive minerals sector
3. I have read the definition of “Qualified Person” set out in the National Instrument 43-101 (NI-43-
101) and certify that by reason of my education, affiliation with a professional association (as
defined in NI 43-101) and past relevant work experience, I fulfill the requirements to be a “Qualified
Person” for the purposes of NI 43-101.
4. I have personally visited the Norra Kärr site in 29 and 30 September 2014. Additionally Golder
Associates professionals have visited the site in 19 and 20 May 2014.
5. I have authored or supervised the work carried out by other Golder Associates professionals for
Golder Associates Oy’s contribution to the Technical Report, and take responsibility for Sections 5
and 20.
6. I am independent of the Issuer applying the test set out in Section 1.5 of NI 43-101.
7. I have had no prior involvement with the project. Golder Associates AB (Sweden) have had prior
involvement with the project on behalf of the Issuer as described in the following reports:
Technical Report entitled “Amended and Restated Preliminary Economic Assessment
N1 43-101 Technical Report for the Norra Kärr (REE-Y-Zr) Deposit Gränna, Sweden”,
dated effective: original reprint date May 11, 2012, amended and restated on July 9,
2013, Report No: DE-00215
8. I have read NI 43-101, and the sections of the Technical Report for which I am responsible, as
stated above, have been prepared in compliance with NI 43-101 and Form 43-101F1.
9. To the best of my knowledge, information, and belief, as of the date of this certificate, the
Technical Report contains all scientific and technical information that is required to be disclosed to
make the Technical Report not misleading.
Dated this July 10, 2015, London, United Kingdom.
Gareth Digges La Touche BSc, MSc, FGS, CGeol, Eur Geol
Qualified Person

NI 43-101 - Technical report Norra Kärr REE - 0465-RPT-014 Rev 1
Page 369
APPENDIX B. WAI TAILINGS DRAWINGS
B.1 ZL611067-101-LAYOUT
B.2 ZL611067-102-LAYOUT
B.3 ZL611067-108-LAYOUT

NI 43-101 - Technical report Norra Kärr REE - 0465-RPT-014 Rev 1
Page 370

NI 43-101 - Technical report Norra Kärr REE - 0465-RPT-014 Rev 1
Page 371

NI 43-101 - Technical report Norra Kärr REE - 0465-RPT-014 Rev 1
Page 372

NI 43-101 - Technical report Norra Kärr REE - 0465-RPT-014 Rev 1
Page 373
APPENDIX C. GBM LAYOUT DRAWINGS
C.1 0465-000-G-001_REV0
C.2 0465-000-G-003_REV0
C.3 0465-000-G-004_REV0

NI 43-101 - Technical report Norra Kärr REE - 0465-RPT-014 Rev 1
Page 374

NI 43-101 - Technical report Norra Kärr REE - 0465-RPT-014 Rev 1
Page 375

NI 43-101 - Technical report Norra Kärr REE - 0465-RPT-014 Rev 1
Page 376