ameren missouri efficient products impact and … · ameren missouri efficient products impact and...
TRANSCRIPT

Ameren Missouri
Efficient Products
Impact and Process Evaluation:
Program Year 2015
Final May 13, 2016
Ameren Missouri 1901 Chouteau Avenue
St. Louis, MO 63103

This page left blank.

Prepared by:
Sara Wist
Jane Colby
Andrew Carollo
Cadmus

This page left blank.

Table of Contents Executive Summary ....................................................................................................................................... 3
Program Description ............................................................................................................................... 3
Key Impact Evaluation Findings .............................................................................................................. 4
Key Process Evaluation Findings ............................................................................................................. 8
Key Conclusions and Recommendations ................................................................................................ 8
PY14 Recommendation Tracking ............................................................................................................ 9
Introduction ................................................................................................................................................ 11
Program Description ............................................................................................................................. 11
Program Activity ................................................................................................................................... 13
Evaluation Methodology ............................................................................................................................. 14
Data Tracking Review ........................................................................................................................... 14
Stakeholder Interviews ......................................................................................................................... 14
Participant Surveys ............................................................................................................................... 15
Engineering Analysis ............................................................................................................................. 15
Cost-Effectiveness Analysis .................................................................................................................. 15
CSR Impact Evaluation Requirements .................................................................................................. 15
Process Evaluation Findings ........................................................................................................................ 17
Program Design .................................................................................................................................... 17
Program Delivery .................................................................................................................................. 19
Marketing and Outreach ...................................................................................................................... 20
CSR Summary ....................................................................................................................................... 21
Gross Impact Evaluation Results ................................................................................................................. 23
Measure Installation Verification ......................................................................................................... 23
Measure-Specific Gross Savings ........................................................................................................... 24
Summary............................................................................................................................................... 41
Net Impact Evaluation Results .................................................................................................................... 44
Free Ridership Results .......................................................................................................................... 46
Participant Spillover Results ................................................................................................................. 46
Nonparticipant Spillover ....................................................................................................................... 46
Net Savings Summary ........................................................................................................................... 55

Appendix A. Ex Post Demand Reductions ................................................................................................... 58
Appendix B. Stakeholder Interview Guide .................................................................................................. 59

3
Executive Summary
Ameren Missouri engaged Cadmus and Nexant (the Cadmus team) to perform annual process and
impact evaluations of the Efficient Products (formally RebateSavers) program for a three-year period,
from 2013 through 2015. This annual report covers the impact and process evaluation findings for
Program Year 2015 (PY15), the period from January 1, 2015, through December 31, 2015, which is the
final year of the three-year program cycle.
Program Description In PY15, the Efficient Products program provided downstream mail-in and online rebates for:
ENERGY STAR®-certified room air conditioners (RACs)
ENERGY STAR-certified heat pump water heaters
ENERGY STAR-certified air purifiers
ENERGY STAR-certified water coolers1
ENERGY STAR-certified dual-speed pool pumps
ENERGY STAR-certified variable-speed pool pumps
Programmable thermostats2
Electric storage water heaters with an energy factor (EF) of 0.93 or higher3
The Efficient Products program also offered two Home Energy Kit options to customers using electric hot
water heaters and who requested the kit after receiving a postcard from Ameren Missouri. Participants
who wanted a free kit could order Home Energy Kit 1, which included the items shown in Table 1.
Participants interested in receiving an advanced power strip could order Home Energy Kit 2 for $4.95.
Other items in Kit 2 are the same as Kit 1.
The program also provided direct-install kits for multifamily properties. Eligible properties received
items from Kit 1, with the expectation that property staff would install the items in each unit.
Advanced power strips were also available for purchase at a discounted price through Ameren
Missouri’s online store.
1 Ameren Missouri did not market water coolers in PY15 but honored its customers’ rebate requests.
2 Ameren Missouri did not market programmable thermostats but honored its customers’ rebate requests.
3 Ameren Missouri phased out electric storage water heaters in February and March 2015.

4
Table 1. PY15 Home Energy Kit Contents
Measure Kit 1
Quantity Kit 2
Quantity*
Energy-Efficient Faucet Aerator 2 2
Energy-Efficient Showerhead 1 1
Pipe Wrap** 1 1
Advanced Power Strip 0 1
Compact Fluorescent Bulbs (CFLs) 4 4
Light Emitting Diode Bulbs (LEDs) 2 2
* Participants elected to pay $4.95 to receive this kit.
** 12-foot total
Key Impact Evaluation Findings The Cadmus team’s key findings for the PY15 evaluation period are described in the next sections.
Program Data Adjustments
The Cadmus team reviewed data for the single-family customers who received home energy kits to
ensure the program was counting only one kit per customer. The PY15 program reported distributing
5,380 kits. The team found that 54 kits were sent to customers who had already received a kit earlier in
PY15 so it adjusted the total to 5,326 kits, which resulted in a 99% verification rate.
Gross Impacts
As shown in Table 2, we estimated per-unit gross realization rates for all Efficient Product measures as
the ratio of Ameren Missouri’s ex ante savings from its 2012 Technical Resource Manual (TRM) and our
evaluated (ex post) savings.4 We found the highest realization rates were for direct-install pipe wrap
(324%), dual-speed pool pumps (167%), and heat pump water heaters (159%). We attributed these
higher realization rates to:
Longer lengths of pipe wrap installed
Differences between ENERGY STAR pool pump outputs for dual-speed pool pumps compared
with 2012 TRM calculations
Higher efficiency levels than assumed for purchased heat pump water heaters
Compared to the PY14 findings, programmable thermostats in PY15 exhibited the lowest realization rate
(19%). Advanced power strips (29%-35%) and water coolers (39%) also exhibited lower realization rates
in PY15 because of lower estimates of how these products would be used than assumed in the 2012
TRM.
4 Ameren Missouri. Technical Resource Manual. 2012. https://www.efis.psc.mo.gov/mpsc/commoncomponents/viewdocument.asp?DocId=935658483

5
Because no changes were made to program delivery in PY15, the Cadmus team did not conduct
participant phone surveys. Instead, the team applied installation rates from the most recent evaluation
results. It used PY14 installation rates for kit measures in single-family homes and PY13 installation rates
for direct-install kit measures and equipment rebate measures.
Table 2 summarizes PY15 participation, ex post gross per-unit savings, realization and installation rates,
and ex post total gross savings.

6
Table 2. PY15 Summary: Ex Post Program Gross Savings Accounting for Installation Rates
Measure PY15
Participation*
Per-Unit Ex
Post Savings
(kWh/yr)
Realization
Rate
Installed and
Operating
Total Ex Post
Gross Savings
(kWh/yr)
Equipment Rebates
Electric Water Heaters 39 175 111% 100% 6,816
Heat Pump Water
Heaters 371 2,865 159% 100% 1,063,044
RACs 1,171 50 43% 100% 58,085
Programmable
Thermostats*** 18 105 19% 99% 1,879
Dual-speed Pool Pumps 12 1,810 167% 100% 21,720
Variable-speed Pool
Pumps 807 2,061 134% 100% 1,663,237
Air Purifier 1,963 515 107% 100% 1,011,268
Water Coolers 26 140 39% 100% 3,649
Kit Measures – Single-Family (5,326 total kits)
CFLs 21,304 24 56% 75% 375,703
LEDs 10,652 26 74% 92% 249,819
Advanced Power Strips,
Load Sensing 1,259 54 23% 78% 53,204
Faucet Aerators 10,652 39 35% 52% 213,678
Low-Flow Showerheads 5,326 222 29% 47% 555,878
Water Heater Pipe Wrap 5,326 312 49% 41% 673,991
Kit Measures – Multifamily (3,686 total kits)
CFLs 14,744 24 73% 98% 341,118
LEDs 7,372 26 80% 98% 184,772
Faucet Aerators 7,372 38 102% 100% 279,938
Low-Flow Showerheads 3,686 252 106% 86% 798,135
Water Heater Pipe Wrap 3,686 91 324% 100% 334,341
Upstream Discounts – Online Store
Advanced Power Strips,
Load Sensing 275 59 32% 100% 16,269
Advanced Power Strips,
Motion Sensing 21 64 35% 100% 1,354
Total 96,082 N/A 79% 89% 7,907,987
* Verified measures.

7
The program’s overall gross savings realization rate increased from 57% in PY14 to 79% in PY15.
Net Savings
As shown in Table 3, the Efficient Products program has an overall savings-weighted net-to-gross (NTG)
ratio of 98.1%.
Table 3. PY15 Net Impact Results Summary
Measure Group
Ex Post Gross
Savings
(kWh/yr)
Free
Ridership
Participant
Spillover
Non-
Participant
Spillover
NTG
Net
Savings
(kWh/yr)
Equipment Rebates 3,829,698 6.20% 3.10% 3.70% 100.6% 3,852,367
Home Energy Kits 4,060,666 10.40% 3.40% 3.70% 96.7% 3,884,225
Upstream Discount
Advanced Power Strips
17,623 N/A N/A 3.70%
103.7% 18,275
Total 7,661,134 N/A N/A N/A 98.1% 7,754,868
*Results may not match calculations in table due to rounding
As shown in Table 4, the PY15 program achieved 31% of its net energy savings target of 25,087 MWh, as
specified in the Ameren Missouri’s residential tariff.5
Table 4. PY15 Efficient Products Savings Comparisons
Metric MPSC-
Approved Target1
Ex Ante Gross Savings Utility
Reported2
Ex Post Gross Savings
Determined by EM&V3
Ex Post Net Savings
Determined by EM&V4
Percent of Goal Achieved5
Energy (MWh) 25,087 10,049 7, 908 7,755 31%
Demand (kW) 3,838 1,586 1,162 1,152 30% 1 Union Electric Company. Electric service applying to residential energy efficiency in Missouri service area. Effective June 30, 2013. Available at: http://www.ameren.com/-/media/missouri-site/Files/Rates/UECSheet191EEResidential.pdf 2 Calculated by applying verified program activity to 2012 TRM savings values. Available at: https://www.efis.psc.mo.gov/mpsc/commoncomponents/viewdocument.asp?DocId=935658483 3 MWh calculated by applying verified program activity to the Cadmus team’s evaluated savings values; kW
calculated by dividing Ex Post Net savings by program NTG. 4 Calculated by multiplying the Cadmus team’s evaluated gross savings and evaluated NTG ratio. 5 Compares MPSC Approved Target and Ex Post Net Savings Determined by EM&V.
5 Union Electric Company. Electric service applying to residential energy efficiency in Missouri service area. Effective June 30, 2013. Available at: http://www.ameren.com/-/media/missouri-site/Files/Rates/UECSheet191EEResidential.pdf

8
Key Process Evaluation Findings Interviews with program stakeholders (program management and implementation staff) focused on
changes made to PY15, including adjustments to measures offered by the program and a shifting focus
to the home energy kits’ direct-install component.
The program did not meet its PY15 energy savings goal of 25,087 kWh/year, as specified in the Ameren
Missouri tariff. However, the program was able to achieve greater energy savings while maintaining
participation levels consistent with PY14.
Marketing and Outreach
The Efficient Products program marketed each component (equipment rebates, home energy kits,
direct-install kits, and discounted advanced power strips) differently:
Equipment Rebate Measures. The program worked with retailers to place program materials in
stores, coordinate in-store activities, and provide training on rebates and applications.
Implementers also worked with retailers to conduct on-site promotions to show customers
products and to discuss the rebates.
Home Energy Kits. The program marketed home energy kits by sending a series of postcards
targeting customers living in single-family homes and using electricity for hot water. To identify
eligible multifamily properties for the direct-install kits involved cross-marketing with other
programs, following up with contractors who were researching upgrades but were not qualified
for other programs, and using Ameren Missouri’s low-income multifamily program to identify
entities that manage additional properties.
Advanced Power Strips. Ameren Missouri offered discounted advanced power strips at
promotional prices through its online store.
Program Data
In PY14, the program began making the transition to a new database, Vision, which was designed to
make program data accessible to program administrators and evaluators in real time. The transition was
completed in PY15 and the Cadmus team used these data for PY15 evaluation activities. Similar to PY14,
program data did not include some relevant product information for all measures (e.g., room air
conditioner data did not include Btu/hr or energy efficiency ratio (EER) values) and the Cadmus team
relied on PY13 program data or TRM variables to calculate impacts.
Key Conclusions and Recommendations The Efficient Products program achieved greater energy savings in PY15 while maintaining participation
levels similar to PY14. However, the program fell short of its annual target in 2015 because of
differences between the TRM-based deemed savings and evaluated savings values and phase-out of the
program.

9
However, the dual- and multispeed pool pumps were particularly successful in PY15, and a large portion
of the program’s energy savings was attributed to heat pump water heaters and the installation of the
kit’s measures.
The Cadmus team offers these conclusions and recommendations for improving the program.
Conclusion 1. Changes made to the data tracking and reporting system are expected to improve future
program reporting and evaluation activities. Although the transition to the Vision database was
completed by the time of the PY15 evaluation, the measure detail available for rebated measures
remained unchanged.
Recommendation 1. If the program continues, consider working with the evaluator and
implementer to review data that is currently not recorded in Vision and identify any changes
that could improve program and evaluation activities. For example, although a field exists for
EER values for RACs in the Vision database, these data were not captured. Detailed program
data in Vision would improve the accuracy of evaluated savings values by allowing evaluators to
base EER values on rebated RACs rather than program assumptions.
PY14 Recommendation Tracking The Cadmus team also followed up with Ameren Missouri’s response to the PY14 evaluation’s
recommendations to track what has and has not been implemented. These actions, as reported by
Ameren Missouri, are presented in Table 5.

10
Table 5. PY14 Evaluation Recommendation Tracking
PY14 Recommendation Ameren Missouri Response
Explanation
Consider tying installation of kit items to receipt of the advanced power strip through “call to action” marketing to help capture savings associated with installing Kit 4 items.
Not Implemented
Modified Home Energy Kit choices to one free Home Energy Kit and one $4.95 Home Energy Kit containing an advanced power strip.
Consider increasing the number of LEDs included in kits. In determining the optimal number of bulbs to include in the kit, consider the balance between likely installation rates and overhead cost savings achieved from providing a larger number bulbs in each kit. High LED installation rates indicate participants may be willing to replace older bulbs prior to burn out.
Partially Implemented
Modified design to decrease number of CFLs in EE Kit. CLEAResult completed customer follow-up calls to aid in increasing the installation rate of Home Energy Kit items.
Develop a protocol for property management staff to report the number and location of items installed at each property and to report these data along with current data, showing the number of kits delivered through the program. This will increase the accuracy of reported participation in this delivery channel and improve verification activities.
Partially Implemented
CLEAResult conducted installation verification in multifamily dwelling units.
Report the number of items and kits returned by property management staff. This will increase the ability to track items and kits distributed through the program.
Not Implemented
The number of multifamily dwelling units is verified before the kits mailed to property management.
Consider working with the evaluator and implementer to revisit data currently unpopulated in Vision and identify changes to would help improve program and evaluation activities. For example, while a field exists for EER values for RACs in the Vision database, these data were not captured. Detailed program data would help ensure rebated items qualify for the program and would improve verification.
Not Implemented
Rebates for RACs and other ENERGY STAR-qualified measures are verified against ENERGY STAR models in the database on Energystar.gov website.
Develop a protocol for assigning dates to participant and program activities and define the date used to establish participation year. Inconsistent dating protocols may have contributed to differences between Vision data and reported participation in PY14.
Implemented
Worked with AEG (Vision implementation) and Residential Program portfolio implementers to establish uniform protocols to aid in minimizing reporting inconsistencies.
11
Introduction
Ameren Missouri engaged Cadmus and Nexant (the Cadmus team) to perform annual process and
impact evaluations of the Efficient Products (formerly RebateSavers) program for a three-year period.
This annual report covers the limited impact and process evaluation findings for Program Year 2015
(PY15), the period from January 1, 2015, through December 31, 2015, which is the final year of the
three-year program cycle.
Program Description The Efficient Products program began in Cycle 1 (2009–2012) as the energy-efficient product rebate
component of the combined PY09 Lighting and Appliance program.
Ameren Missouri partnered with two third-party contractors:
CLEAResult (formerly Applied Proactive Technologies) implemented the program and managed a
network of retail partners that sell qualifying equipment.
Energy Federation Incorporated (EFI) processed the rebates on Ameren Missouri’s behalf and
operated the online store for smart strips.
Beginning in PY12, Ameren Missouri discontinued the appliance portion of the combined Lighting and
Appliance program so the program focused exclusively on lighting products. Ameren Missouri and
CLEAResult reintroduced RebateSavers in PY13 as a new, stand-alone appliance program, designed to
promote a variety of energy-efficient products in the marketplace. In PY14, Ameren Missouri changed
the program name from RebateSavers to Efficient Products.
The Efficient Products program provides incentives that encourage customers to purchase technologies
that can save money, improve comfort, and save energy. The program also seeks to educate customers
about energy-efficient product options and energy-savings tips.
The PY15 Efficient Products program provided downstream mail-in and online rebates for the following:
ENERGY STAR®-certified room air conditioners (RACs)
ENERGY STAR-certified heat pump water heaters
ENERGY STAR-certified air purifiers
ENERGY STAR-certified water coolers6
ENERGY STAR-certified dual-speed pool pumps
ENERGY STAR-certified variable-speed pool pumps
6 Ameren Missouri did not market water coolers but honored its customers’ rebate requests.

12
Programmable thermostats7
Electric storage water heaters with an Energy Factor (EF) of 0.93 or higher8
The Efficient Products also offered a Home Energy Kit upon request to customers with electric hot water
heaters. Participants who wanted a free kit could order Home Energy Kit 1, which included the items
shown in Table 6. Participants interested in an advanced power strip could order Home Energy Kit 2 for
$4.95. Table 6 shows items provided in each kit.
Table 6. PY15 Home Energy Kit Contents
Measure Kit 1 Quantity Kit 2 Quantity
Energy-Efficient Faucet Aerator 2 2
Energy-Efficient Showerhead 1 1
Pipe Wrap* 1 1
Advanced Power Strip 0 1**
Compact Fluorescent Bulbs (CFLs) 4 4
Light Emitting Diode Bulbs (LEDs) 2 2
* 12-foot total
** Participants elected to pay $4.95 to receive this measure.
The program also provided direct-install kits for multifamily properties. Eligible properties received the
items from Kit 1, with the expectation that property staff would install the items in each unit. Ameren
Missouri’s online store featured discounted advanced power strips.
7 Ameren Missouri did not market programmable thermostats but honored its customers’ rebate requests.
8 Ameren Missouri phased out electric storage water heaters in February and March 2015.
13
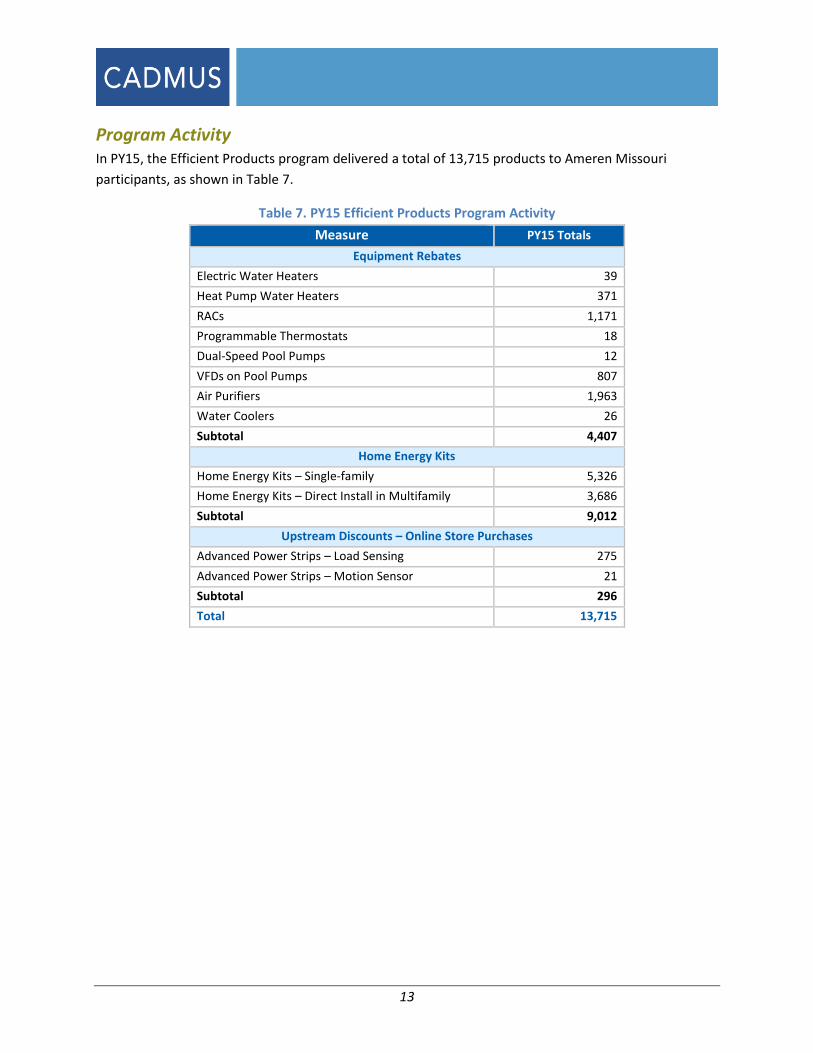
Program Activity In PY15, the Efficient Products program delivered a total of 13,715 products to Ameren Missouri
participants, as shown in Table 7.
Table 7. PY15 Efficient Products Program Activity
Measure PY15 Totals
Equipment Rebates
Electric Water Heaters 39
Heat Pump Water Heaters 371
RACs 1,171
Programmable Thermostats 18
Dual-Speed Pool Pumps 12
VFDs on Pool Pumps 807
Air Purifiers 1,963
Water Coolers 26
Subtotal 4,407
Home Energy Kits
Home Energy Kits – Single-family 5,326
Home Energy Kits – Direct Install in Multifamily 3,686
Subtotal 9,012
Upstream Discounts – Online Store Purchases
Advanced Power Strips – Load Sensing 275
Advanced Power Strips – Motion Sensor 21
Subtotal 296
Total 13,715

14
Evaluation Methodology
In evaluating Ameren Missouri’s Efficient Products program, the Cadmus team identified these
objectives for PY15:
Identify PY15 program changes
Estimate the program’s gross energy savings and demand reductions
Calculate the program’s cost-effectiveness
Assess the program’s achievements against goals
Table 8 lists evaluation activities and briefly explains the purpose of each activity. Descriptions of each
activity follow the table.
Table 8. PY15 Process and Impact Evaluation Activities and Rationale
Evaluation Activity Process Impact Rationale
Review the Tracking Data
Provide assurance that all necessary program data are
tracked accurately and incorporated into savings
estimates.
Interview Stakeholders Identify changes to program delivery and identify
successes and challenges.
Update Engineering Analysis
Variables Update gross kWh savings estimates.
Conduct a Cost-Effectiveness
Analysis
Measure the program’s cost-effectiveness using five
standard perspectives: total resource cost, utility cost,
societal cost test, participant cost test, and ratepayer
impact test.
Data Tracking Review The Cadmus team reviewed the program tracking data recorded in the Vision database to determine
completeness and identify variables necessary for impact calculations.
Stakeholder Interviews In November 2015, the Cadmus team interviewed Efficient Products program stakeholders. We
designed these interviews to:
Gather information on how the program has changed since PY14;
Identify challenges program staff or implementers have encountered; and
Determine appropriate solutions.
The Cadmus team spoke with four program stakeholders across Ameren Missouri and CLEAResult, as
shown in Table 9. Appendix B provides the stakeholder interview guide.

15
Table 9. PY15 Completed Stakeholder Interviews
Stakeholder Group Interviews Conducted
Ameren Missouri Program Management 2
CLEAResult Program Management 2
Total 4
Throughout PY15, we regularly spoke with Ameren Missouri program staff to discuss program
operations and coordinate evaluation activities.
Participant Surveys Participant surveys were not conducted in PY15 because the Efficient Products program did not change
its delivery, process, and offerings.
Engineering Analysis To estimate per-unit gross savings for each Efficient Products measure, the Cadmus team used
engineering algorithms, assumptions, and all available Ameren Missouri- and participant-specific inputs.
These algorithms yielded estimates of the difference in energy use of the rebated product and usage of
a similar product meeting the minimum federal standard for efficiency. The Gross Impact Evaluation
Results section of this report presents each algorithm and input assumption.
Cost-Effectiveness Analysis Using final PY15 Efficient Products participation and implementation data as well as ex post gross and
net savings estimates presented in this report, Morgan Marketing Partners (MMP) determined the
program’s cost-effectiveness using DSMore (a financial analysis tool designed to evaluate the costs,
benefits, and risks of demand-side management [DSM] programs and services). MMP also calculated
measure-specific cost-effectiveness. As shown in the Cost-Effectiveness Results section, MMP assessed
cost-effectiveness using all five of the standard perspectives produced by DSMore:
Total Resource Cost (TRC)
Utility Cost Test (UCT)
Societal Cost Test (SCT)
Participant Cost Test (PART)
Ratepayer Impact Test (RIM)
CSR Impact Evaluation Requirements According to the Missouri Code of State Regulations (CSR),9 demand-side programs that are part of a
utility’s preferred resource plan are subject to ongoing process and impact evaluations that meet certain
9 State of Missouri. “Administrative Rules: Missouri Code of State Regulations.” Revised January 2016. Available
online: http://www.sos.mo.gov/adrules/csr/csr.asp

16
criteria. Specifically, the CSR requires that impact evaluations of a demand-side program satisfy the
requirements listed in Table 10. The table also indicates the data our team used to satisfy these impact
CSR evaluation requirements for the Efficient Products program. We provide a summary of the process
CSR requirements in Table 14 at the end of the Process Evaluation section.
Table 10. Summary Responses to CSR Impact Evaluation Requirements
CSR Requirement Method
Used Description of Program Method
Approach: The evaluation must use one or both of the following comparisons to determine the program impact:
Comparisons of pre-adoption and post-adoption loads of program participants, corrected for the effects of weather and other intertemporal differences
Unchanged from the PY14 approach, the program compares the pre-adoption load based on assumed baseline technology with the post-adoption load based on program technology and estimates weather and interactive effects using TRM and industry assumptions, metering, and modeling, when necessary.
Comparisons between loads for program participants and an appropriate control group over the same period
Data: The evaluation must use one or more of the following types of data to assess program impact:
Monthly billing data
Hourly load data
Load research data
End-use load metered data Unchanged from the PY14 approach, Cadmus used metered
lighting hours of use by room in a sample of homes in the program area during 2013-2014.
Building and equipment simulation models
Unchanged from the PY14 approach, Cadmus used simulation modeling to determine the waste-heat impact of efficient lighting.
Survey responses Cadmus relied on PY14 participant surveys on purchasing
practices and other product participants to determine installation rates.
Audit and survey data on:
Equipment type/size efficiency
Cadmus relied on the PY14 audit of all lighting in sample of homes in program area and an audit of equipment type/efficiency for other products through review and analysis of the program database.
Household or business characteristics Cadmus relied on PY14 household characteristics from homes participating in lighting audit: home type, own/rent home, and kit participants and Low Income program participants.
Energy-related building characteristics

17
Process Evaluation Findings
This section presents the Cadmus team’s process evaluation findings for Ameren Missouri’s Efficient
Products program. The findings are organized in three sections—Program Design, Program Delivery, and
Marketing and Outreach.
Program Design The Efficient Products program design seeks to promote awareness of energy efficiency and to
encourage the purchase and use of energy-efficient products. The program uses three components to
achieve these objectives:
Downstream rebates for customers purchasing high-efficiency, home energy products from
participating retailers
Free Home Energy Kits for customers with electric water heaters
Upstream discounts for advanced power strips, sold through Ameren Missouri’s online store
Downstream Rebates
The downstream rebate component primarily relies on partnerships with participating retailers to
communicate available incentives and to create customer awareness about energy-efficient products.
Table 11 lists the Efficient Products program’s eligible products and associated rebate amounts.
Table 11. Rebated Measures*
Qualifying Products Rebate Amount
ENERGY STAR Certified Heat Pump Water Heater $500
ENERGY STAR Certified Dual-Speed Pool Pumps $350
ENERGY STAR Certified Variable Speed Pool Pumps $350
ENERGY STAR Certified Air Purifiers $50
Electric Storage Water Heaters with an EF of 0.93 or higher** $45
ENERGY STAR Certified Room Air Conditioner $20
ENERGY STAR Certified Water Coolers*** $15
* Ameren Missouri did not offer programmable thermostats in PY14 or PY15 and these were not re-evaluated;
however, in PY15 Ameren Missouri honored PY13 rebates for $25 per thermostat.
** Ameren Missouri phased out electric storage water heaters in February and March 2015.
*** Ameren Missouri no longer markets the water coolers but will honor its customers’ rebate requests.
Similar to PY14, more than 200 retailers participated in the PY15 Efficient Products program.
Home Energy Kits
Ameren Missouri continued to distribute Home Energy Kits to its electric water heating customers in
FY15. Customers could choose either Kit 1 for free or pay $4.95 for Kit 2, which included an advanced
power strip. In addition to the energy-saving measures, each kit contained installation instructions.
Table 12 lists the number of measures in each kit.

18
Table 12. Home Energy Kit Measures
Measure Kit 1
Quantity
Kit 2
Quantity
Energy Efficient Faucet Aerator 2 2
Energy Efficient Showerhead 1 1
Pipe Wrap* 1 1
Advanced Power Strip 0 1**
Compact Fluorescent Bulbs (CFLs) 4 4
Light Emitting Diode Bulbs (LEDs) 2 2
* 12-foot total
** Participants elected to pay $4.95 to receive this kit.
CLEAResult delivered these kits through two channels—direct mail and direct install. The majority of kits
were mailed directly to single-family households requesting a kit; the remaining kits were mailed to
multifamily property owners and directly installed by building maintenance staff.
Upstream Discounts
Ameren Missouri sold four types of advanced power strips at a discount through an online store
managed by EFI. To qualify for the discount, customers must verify upon check-out that they live within
Ameren Missouri’s service territory. The price of these advanced power strips ranges from $4.95 to
$32.95, as shown in Table 13.

19
Table 13. Available Advanced Power Strips
Manufacturer and Model Type Cost Image
TrickleStar 12 Outlet
Advanced Power Strip Load-sensing $18.95
TrickleStar Motion Sensor
Advanced Power Strip
Occupancy-sensing
and Load-sensing $15.95
TrickleStar 7-Outlet
Advanced Power Strip Load-sensing $4.95
TrickleStar APS Plus +
Infra-red remote
sensing and Load-
sensing
$32.95
Program Delivery This section discusses responses from program stakeholder during the Cadmus team’s interviews
regarding program management and delivery topics. Interviews primarily focused on changes occurring
since PY14.
PY15 Program Changes
The configuration of the Home Energy Kits remained the same as PY14. Program staff said the
multifamily direct-install delivery channel received greater emphasis than the single-family direct-mail
channel. Program staff reported that marketing conducted by senior field representatives to multifamily

20
unit owners significantly increased installations of kit products in PY15 over the same period in FY14.
Stakeholders reported the program phased out water coolers and electric storage water heaters in PY15
in response to the PY14 evaluation, but had not introduced any new measures.
Delivery Successes and Program Achievements
Stakeholders reported the following about aspects of the program that worked particularly well:
Program implementer said pool pumps and air purifiers were both “wins” in PY15, as
demonstrated by pool pump participation increasing from 52 in PY14 to 819 in PY15, and air
purifier participation increasing from 392 in PY14 to 1,963 in PY15. Program staff said the
program received more pool pump rebates than had been “considered possible.” These
increases may relate to the implementer’s report that retailers have changed their stocking
patterns and inventory to ensure they have qualifying products and that the measures were
available at the start of PY15. The increase may also be a result of the measures being available
from the beginning of PY15, compared with PY14 when the measures were introduced mid-
year, toward the end of the summer season.
Staff also reported the program received more ENERGY STAR Certified Room Air Conditioner
rebates, as demonstrated by air conditioner participation increasing from 372 in PY14 to 1,171
in PY15. These increases may relate to the increased incentive for these measures.
Program Implementation Challenges and Potential Changes
Program stakeholders identified few challenges and areas for future exploration:
The program saw a decline in activity for the high-performance water heater. The implementer
said in past years General Electric had discounted these products; however, it had not seen
these same discounts offered in PY15.
The implementer said smart thermostats should be considered for inclusion in the program.
Marketing and Outreach This section provides the Cadmus team’s findings on Efficient Products marketing strategies.
Primary Marketing Channels: Equipment Rebates
Efficient Products primarily conducted marketing through retailers to place program materials in stores,
coordinate in-store activities, and provide training on rebates and applications. Implementers also
worked with retailers to conduct on-site promotions to show products to customers and discuss rebates.
The implementer reported over 200 retailers participated in the program in PY15.
Program implementers said they had increased outreach to plumbers, with the goal of increasing heat
pump water heater and pool pump installations. It was unclear at the time of the evaluation if this
outreach was successful, as multiple factors may have influenced the installation of these measures,
including pool pumps being available to participants from the beginning of PY15 (compared to mid-way
through PY14) and the phase-out of the PY15 program.

21
Primary Marketing Channels: Home Energy Kits and Advanced Power Strips
The program also promoted discounted advanced power strips through Ameren Missouri’s online store
and free Home Energy Kits. PY15 marketing for these delivery channels relied on the same strategies
discussed in PY14:
Advanced Power Strips: Ameren Missouri offered discounted advanced power strips at
promotional prices through the online store.
Home Energy Kits: The program marketed energy-saving kits through a series of postcards
targeting electric hot water customers.
CSR Summary As previously mentioned, the Missouri CSR requires that demand-side programs that are part of a
utility’s preferred resource plan are subject to ongoing process and impact evaluations that meet certain
criteria. Process evaluations must address, at a minimum, the five questions listed in Table 14. The table
provides a summary response for each specified CSR process requirement, taken from both this year’s
evaluation and the prior year. We previously offered a summary of the data used to meet with impact
CSR requirements in Table 10.

22
Table 14. Summary Responses to CSR Process Evaluation Requirements
CSR
Requirement
Number
CSR Requirement Description Summary Response
1
What are the primary market
imperfections common to the target
market segment?
Prior research has indicated that lack of energy-
efficiency awareness and the higher upfront cost of
energy-efficient products are common barriers to
this market segment. The PY15 evaluation did not
determine that these imperfections have been
addressed and it is assumed that the primary market
has remained stable across the PY13-PY15 period.
2
Is the target market segment
appropriately defined, or should it be
further subdivided or merged with
other market segments?
PY13 findings indicated the target market of all
residential customers is appropriate for the
equipment rebate programs. The target market
segments remain unchanged from PY13 and it was
determined that a market study would not be
completed in PY14 or PY15.
Efficiency Kits are limited to those with electric water
heating. This is appropriate for this program.
Additional markets, such as schools, may be explored
in future years.
3
Does the mix of end-use measures
included in the program appropriately
reflect the diversity of end-use energy
service needs and existing end-use
technologies within the target market
segment?
The Efficient Products program continues to be a
highly diverse program, offering 13 energy-efficient
home technologies in HVAC, lighting, plug-load,
pumps, and water heating end-uses. This is a
dynamic, responsive program, as demonstrated by
the addition of multiple measures in PY14 and the
discontinuation of measures in PY14 and PY15.
4
Are the communication channels and
delivery mechanisms appropriate for
the target market segment?
Unchanged from PY14, the delivery channels are
appropriate and reach customers through retail and
direct-mail efforts, including in-store advertisements,
bill inserts, contractors, postcards, and Ameren
Missouri’s website. In PY15, outreach to multifamily
property owners resulted in increased installation of
kit products.
5
What can be done to more effectively
overcome the identified market
imperfections and to increase the rate
of customer acceptance and
implementation of each end-use
measure included in the program?
Program promotions that provide program and
energy education can help to overcome market
imperfections. Timing product promotions so that
they coincide with seasons of high use may also help
implementation, as demonstrated by the higher
participation in the pool pump rebate in PY15.

23
Gross Impact Evaluation Results
This section details the Cadmus team’s determination of each measure’s installation rate and
calculations of per-unit savings for Ameren Missouri’s Efficient Products’ program.
Measure Installation Verification The Cadmus team used PY14 installation rates to estimate energy savings for PY15 measures.10 As
shown in Table 15, the installation rates varied by delivery channel.
Table 15. Measure Installation
Measure Percentage Installed and Operating*
Equipment Rebates
Electric Water Heaters 100%
Heat Pump Water Heaters 100%
RACs 100%
Programmable Thermostats 99%
Variable-speed Pool Pumps 100%
Air Purifier 100%
Water Coolers 100%
Kit Measures—Single-Family
CFLs 75%
LEDs 92%
Advanced Power Strips 78%
Faucet Aerators 52%
Low-Flow Showerheads 47%
Water Heater Pipe Wrap 41%
Kit Measures—Multifamily
CFLs 98%
LEDs 98%
Faucet Aerators 100%
Showerheads 86%
Water Heater Pipe Wrap 100%
Upstream Discounts – Online Store Purchases
Advanced Power Strips, Load Sensing 100%
Advanced Power Strips, Motion Sensing 100%
*PY14 value applied in PY15.
10 Cadmus conducted participant surveys in PY13 and PY14 to assess measure installation rates.

24
Measure-Specific Gross Savings Using the engineering algorithms established in the Efficient Products evaluation plan, the Cadmus
team’s engineers estimated savings for each program measure. We describe the gross energy savings
determined for each measure along with algorithms and inputs used.
Electric Water Heaters
We estimated per-unit electric savings for water heaters using the following algorithm:
𝑬𝒏𝒆𝒓𝒈𝒚 𝑺𝒂𝒗𝒊𝒏𝒈𝒔 (𝒌𝑾𝒉/𝒀𝒆𝒂𝒓)
= (𝟏
𝑬𝑭𝒃𝒂𝒔𝒆−
𝟏
𝑬𝑭𝒆𝒇𝒇) × (𝑯𝑾𝑻 − 𝑪𝑾𝑻) × 𝑫𝒆𝒏 × 𝑮𝑷𝑫 × 𝟑𝟔𝟓 × 𝑪𝒑 ×
𝟏
𝟑𝟒𝟏𝟑
Table 16. Electric Water Heaters PY15 Savings Assumptions
Term PY15 Value PY15 Source
EFbase 0.90 Federal minimum standard
EFeff 0.94 PY14 Efficient Products Database - Average EF
HWT 135 Ameren Missouri 2012 TRM1
CWT 61.3 Ameren Missouri 2012 TRM1
GPD 64 Secondary Source 2
CP 1 Specific Heat of Water (Btu/lb-oF)
Den 8.33 Density of water (lb/gallon)
Days 365 Conversion Factor (day/yr)
3413 3,413 Conversion Factor (Btu/kWh) 1 Available at: https://www.efis.psc.mo.gov/mpsc/commoncomponents/viewdocument.asp?DocId=935658483 2 U.S. Department of Energy (DOE) Federal Energy Management Program Energy Cost Calculator. Available at: http://www1.eere.energy.gov/femp/technologies/eep_waterheaters_calc.html
Using this engineering algorithm, the Cadmus team determined an ex post energy savings value of
175 kWh/year for each installed and retained electric water heater. This value represented
approximately 111% of the program’s ex ante value (157 kWh/year), based on Morgan Measure Library
(MML) data (Table 17). The difference between ex ante and ex post savings estimates resulted from the
average energy factor (EF) of the rebated measures (0.94), whereas the ex ante value assumed a value
of 0.93.
Table 17. Ex Ante and Ex Post Comparison for Electric Water Heaters
Ex Ante Savings/Unit Ex Post Savings/Unit Realization Rate
157 kWh/yr 175 kWh/yr 111%

25
Heat Pump Water Heaters
The Cadmus team estimated per-unit savings for heat pump water heaters using the following
algorithm:
𝑬𝒏𝒆𝒓𝒈𝒚 𝑺𝒂𝒗𝒊𝒏𝒈𝒔 (𝒌𝑾𝒉/𝒀𝒆𝒂𝒓)
= (𝟏
𝑬𝑭𝒃𝒂𝒔𝒆−
𝟏
𝑬𝑭𝒆𝒇𝒇) × (𝑯𝑾𝑻 − 𝑪𝑾𝑻) × 𝑫𝒆𝒏 × 𝑮𝑷𝑫 × 𝟑𝟔𝟓 × 𝑪𝒑 ×
𝟏
𝟑𝟒𝟏𝟑− 𝒌𝑾𝒉𝒉𝒆𝒂𝒕 + 𝒌𝑾𝒉𝒄𝒐𝒐𝒍
Where:
EFbase = energy factor of baseline water heater
EFeff = energy factor of program-qualified water heaters
HWT = hot water temperature (oF)
CWT = cold water temperature (oF)
GPD = gallons of hot water used per day
Cp = specific heat of water
Den = the water density (lb/gal)
kWhheat = heating interaction due to heat removed from room to heat water
kWhcool = cooling interaction due to heat removed from room to heat water
Table 18. Heat Pump Water Heaters PY15 Savings Assumptions
Term PY15 Value PY15 Source
EFbase 0.90 Federal minimum standard
EFeff 2.7 PY15 Efficient Products Database, Average EF1
HWT 135 Ameren Missouri 2012 TRM2
CWT 61.3 Ameren Missouri 2012 TRM2
GPD 64 Secondary Source 3
kWhheat Electric Resistance = 1,577
Heat Pump = 779
Ohio Statewide 2012 TRM 4
kWhcool 180 Ohio Statewide 2012 TRM 4
CP 1 Specific Heat of Water (Btu/lb-oF)
Den 8.33 Density of water (lb/gallon)
Days 365 Conversion Factor (day/yr)
3413 3,413 Conversion Factor (Btu/kWh) 1 Value updated from PY14. 2 Available at: https://www.efis.psc.mo.gov/mpsc/commoncomponents/viewdocument.asp?DocId=935658483 3 DOE Federal Energy Management Program Energy Cost Calculator. Available at:
http://www1.eere.energy.gov/femp/technologies/eep_waterheaters_calc.html 4 Interactive effects were adjusted to account for the saturation of electric resistance heat, heat pumps, and central air conditioners in Ameren Missouri’s territory, as found by the PY14 Efficient Products survey (11%, 29%, and 91% respectively).

26
Using this engineering algorithm, we determined an ex post energy savings value of 2,865 kWh/year for
each installed and retained heat pump hot water heater. This value was approximately 159% of the
program’s ex ante value (1,802 kWh/year), based on MML data (Table 19). The difference between
estimates resulted from higher-than-expected efficiency levels of actual purchases.
Table 19. Ex Ante and Ex Post Comparison for Heat Pump Water Heaters
Ex Ante Savings/Unit Ex Post Savings/Unit Realization Rate
1,802 kWh/yr 2,865 kWh/yr 159%
Room Air Conditioners
The Cadmus team estimated per-unit savings for RACs using the following algorithm:
𝑬𝒏𝒆𝒓𝒈𝒚 𝑺𝒂𝒗𝒊𝒏𝒈𝒔 (𝒌𝑾𝒉/𝒀𝒆𝒂𝒓) =
𝑩𝑻𝑼𝒉𝒓
× (𝟏
𝑬𝑬𝑹𝑩𝑨𝑺𝑬−
𝟏𝑬𝑬𝑹𝑬𝑭𝑭
) × 𝑬𝑭𝑳𝑯𝑪𝑶𝑶𝑳
𝟏, 𝟎𝟎𝟎
Where:
Btu/hr = the RAC’s cooling capacity (Btu/hour)
EERBASE = the baseline energy efficiency ratio (Btu/W-hour)
EEREFF = the energy efficiency ratio (Btu/W-hour)
EFLHCOOL = the cooling equivalent full-load hours (hour)
1,000 = the conversion factor between Wh and kWh (Wh/kWh)
Table 20. Room Air Conditioner PY15 Savings Assumptions
Term PY15 Value PY15 Source
Btu/hr 9,558 PY13 Efficient Products Program Database, Average Btu/hr
EERBASE 9.8 Federal minimum efficiency standard
EEREFF 10.7 PY13 Efficient Products Program Database, Average EER
EFLHCOOL – primary unit1 860 PY13 CoolSavers Program Data
EFLHCOOL – secondary unit1 556 Secondary Source2
1,000 1,000 Conversion Factor (Wh/kWh) 1 A weighted average for EFLHCOOL for primary and secondary sources was used, based on PY14 survey
responses; 84% of respondents reported using their RAC as a secondary cooling source. 2 Based on weather-adjusted metering data from California. Report available here: Cadmus. Residential Retrofit
High Impact Measure Evaluation Report: Evaluation of PGE2000, SDGE3024, & SCE2501 Room Air Conditioners (2006-2008). 2010. http://www2.epa.gov/sites/production/files/documents/CA_PUC_Assessment.pdf
Using this engineering algorithm, we determined an ex post energy savings value of 50 kWh/year for
each installed and retained RAC, which, as shown in Table 21, was approximately 43% of the program’s
ex ante value (115 kWh/year).

27
Table 21. Ex Ante and Ex Post Comparison for RACs
Ex Ante Savings/Unit Ex Post Savings/Unit Realization Rate
115 kWh/yr 50 kWh/yr 43%
The difference between estimates primarily resulted from the difference in effective full-load hours
(EFLH)—with a higher assumed value in ex ante calculations, which relied on the ENERGY STAR
calculator. The ENERGY STAR calculator assumes that a RAC was used as the primary cooling source in
the home and that it would be used similar to a central air conditioner; however, the PY13 Efficient
Products participant survey determined 84% of respondents used their RACs as secondary cooling
sources. The PY13 evaluation determined a weather-adjusted EFLH for secondary units, as shown in
Table 22, which lists the CPUC study EFLH, the weather adjustment factor for conversion to an Ameren
Missouri-specific value, and the resulting Ameren Missouri-specific EFLH value.
Table 22. Weather-Adjusted EFLH Value for Ameren Missouri
Source Study Metered
Sites CA Climate Zone 9 CDD
Ameren Missouri
CDD
Adjustment Factor
CA Climate Zone 9 EFLH
Adjusted EFLH for Ameren
Missouri
2009 CPUC 102 RACs 1,456 1,550 106% 522 556
ENERGY STAR Air Cleaner
The Cadmus team estimated per-unit ENERGY STAR air cleaner savings using the following ENERGY STAR
calculator algorithm:
𝑬𝒏𝒆𝒓𝒈𝒚 𝑺𝒂𝒗𝒊𝒏𝒈𝒔 (𝒌𝑾𝒉
𝒀𝒆𝒂𝒓) = {𝑪𝑨𝑫𝑹 ((
𝟏
𝑬𝒇𝒇𝑩𝑳) − (
𝟏
𝑬𝒇𝒇𝑬𝑺)) × (𝑯𝒓𝒐𝒑𝒆𝒓) + (𝑺𝑩𝑩𝑳 − 𝑺𝑩𝑬𝑺) ×
(𝟐𝟒 − 𝑯𝒓𝒐𝒑𝒆𝒓)} ×𝟑𝟔𝟓
𝟏,𝟎𝟎𝟎
Where:
EffES = CADR/Watt for ENERGY STAR unit
EffBL = CADR/Watt for baseline unit
SBEW = Standby for ENERGY STAR unit
SBBL = Standby for baseline unit
CADR = Clean air recovery rate for dust
Hroper = Hours per day of operation

28
Table 23. ENERGY STAR Air Cleaner PY15 Savings Assumptions
Term PY15 Value PY15 Source
EffES 2.77 PY15 Efficient Products Database
EffBL 1.00 ENERGY STAR Appliance Calculator
SBEW 0.272 ENERGY STAR Appliance Calculator
SBBL 1.00 ENERGY STAR Appliance Calculator
CADR 137.59 PY15 Efficient Products Database
Hroper 16 ENERGY STAR Appliance Calculator
Using this engineering algorithm, we estimated a per-unit savings value of 515 kWh/year for each
ENERGY STAR air cleaner (Table 24). This value was approximately 107% of the 2012 TRM estimate
(482 kWh/year), based on an older version of the ENERGY STAR calculator algorithm (which has since
been updated). The difference between 2012 TRM and estimated savings estimates primarily resulted
from a higher clean-air delivery rate for dust, which was 123.5 when the 2012 TRM was developed and
137.59 in the program data.
Table 24. Ex Ante and Ex Post Comparison for ENERGY STAR Air Cleaners
Ex Ante Savings/Unit Ex Post Savings/Unit Realization Rate
482 kWh/yr 515 kWh/yr 107%
ENERGY STAR Hot and Cold Storage Tank Water Coolers
The Cadmus team estimated per-unit ENERGY STAR hot and cold storage tank water cooler savings using
the following ENERGY STAR calculator algorithm:
𝑬𝒏𝒆𝒓𝒈𝒚 𝑺𝒂𝒗𝒊𝒏𝒈𝒔 (𝒌𝑾𝒉
𝒀𝒆𝒂𝒓) = (𝑫𝑬𝑼𝑩𝑳 − 𝑫𝑬𝑼𝑬𝑺) × 𝟑𝟔𝟓
Where:
DEUBL = Daily energy use (kWh/day) for baseline
DEUES = Daily energy use (kWh/day) for ENERGY STAR
Table 25. ENERGY STAR Hot & Cold Storage Tank Water Cooler PY15 Savings Assumptions
Term PY15 Value PY15 Source
DEUBL 1.09 Baseline value established by ENERGY STAR Program
DEUES 0.70 PY15 Efficient Products Database
Using this engineering algorithm, we estimated a per-unit savings value of 140 kWh/year for each
ENERGY STAR water cooler. This value was approximately 39% of the 2012 TRM estimate of
361 kWh/year that was based on an older version of the ENERGY STAR calculator algorithm (which has
since been updated), as shown in Table 26.

29
The difference between 2012 TRM and estimated savings estimates primarily resulted from a lower daily
energy use baseline (i.e., water coolers have become much more efficient) and the new ENERGY STAR
specification level effective in February 2014. The 2012 TRM estimate was based on a much higher
difference between baseline and ENERGY STAR specification daily energy use (DEU) values.
Table 26. Ex Ante and Ex Post Comparison for ENERGY STAR Water Coolers
Ex Ante Savings/Unit Ex Post Savings/Unit* Realization Rate
361 kWh/yr 140 kWh/yr 39%
* Value differs due to rounding.
ENERGY STAR Dual-Speed Pool Pumps
The Cadmus team estimated per-unit dual-speed pool pump savings using the following algorithm:
𝑬𝒏𝒆𝒓𝒈𝒚 𝑺𝒂𝒗𝒊𝒏𝒈𝒔 (𝒌𝑾𝒉
𝒀𝒆𝒂𝒓) = 𝑫𝒂𝒚𝒔𝒐𝒑𝒆𝒓 × {(
𝒌𝑾𝒉𝒔𝒔
𝑫𝒂𝒚) − (
𝒌𝑾𝒉𝒅𝒔
𝑫𝒂𝒚)}
Where:
(𝒌𝑾𝒉𝒅𝒔
𝑫𝒂𝒚) = (
𝒌𝑾𝒉𝒉𝒔
𝑫𝒂𝒚) + (
𝒌𝑾𝒉𝒍𝒔
𝑫𝒂𝒚)
And:
(𝒌𝑾𝒉𝒔𝒔
𝑫𝒂𝒚) =
(𝑹𝑻𝒔𝒔 × 𝑮𝑷𝑴𝒔𝒔 × 𝟔𝟎)
(𝑬𝑭𝒔𝒔 × 𝟏, 𝟎𝟎𝟎)
And:
(𝒌𝑾𝒉𝒉𝒔
𝑫𝒂𝒚) =
(𝑹𝑻𝒉𝒔 × 𝑮𝑷𝑴𝒉𝒔 × 𝟔𝟎)
(𝑬𝑭𝒉𝒔 × 𝟏, 𝟎𝟎𝟎)
And:
(𝒌𝑾𝒉𝒍𝒔
𝑫𝒂𝒚) =
(𝑹𝑻𝒍𝒔 × 𝑮𝑷𝑴𝒍𝒔 × 𝟔𝟎)
(𝑬𝑭𝒍𝒔 × 𝟏, 𝟎𝟎𝟎)
And where:
Daysoper = Days/year of operation
RTss = Runtime in hours/day using single-speed pump
RTls = Runtime in hours/day in low speed using dual-speed pump
RThs = Runtime in hours/day in high speed using dual-speed pump
GPMss = Gallons per minute using single-speed pump
GPMls = Gallons per minute in low speed using dual-speed pump
GPMhs = Gallons per minute in high speed using dual-speed pump

30
EFss = Energy factor using single-speed pump
EFls = Energy factor in low speed using dual-speed pump
EFhs = Energy factor in high speed using dual-speed pump
Table 27. ENERGY STAR Dual-Speed Pool Pump PY15 Savings Assumptions
Term PY15 Value PY15 Source
Daysoper 121.6
ENERGY STAR Pool Pump Calculator adjusted for
dual speed in Missouri.
RTss 11.4
RTls 9.8
RThs 2.0
GPMss 64.4
GPMls 31.0
GPMhs 56.0
EFss 2.1
EFls 5.4
EFhs 2.4
Using this engineering algorithm, we estimated a per-unit saving value of 1,810 kWh/year for dual-
speed pool pumps (Table 28). This value was approximately 167% of the 2012 TRM’s per unit savings
(1,081 kWh/year), based on motor efficiency, load factor, and horsepower and not using the ENERGY
STAR calculation methodology to estimate savings.
Table 28. Ex Ante and Ex Post Comparison for ENERGY STAR Dual-Speed Pool Pumps
Ex Ante Savings/Unit Ex Post Savings/Unit Realization Rate
1,081 kWh/yr 1,810 kWh/yr 167%
ENERGY STAR Variable Speed Pool Pumps
The Cadmus team estimated per-unit variable speed pool pump savings using the following algorithm:
𝑬𝒏𝒆𝒓𝒈𝒚 𝑺𝒂𝒗𝒊𝒏𝒈𝒔 (𝒌𝑾𝒉
𝒀𝒆𝒂𝒓) = 𝑫𝒂𝒚𝒔𝒐𝒑𝒆𝒓 × {(
𝒌𝑾𝒉𝒔𝒔
𝑫𝒂𝒚) − (
𝒌𝑾𝒉𝒗𝒔
𝑫𝒂𝒚)}
Where:
(𝒌𝑾𝒉𝒗𝒔
𝑫𝒂𝒚) = (
𝒌𝑾𝒉𝒉𝒔
𝑫𝒂𝒚) + (
𝒌𝑾𝒉𝒍𝒔
𝑫𝒂𝒚)
And:
(𝒌𝑾𝒉𝒔𝒔
𝑫𝒂𝒚) =
(𝑹𝑻𝒔𝒔 × 𝑮𝑷𝑴𝒔𝒔 × 𝟔𝟎)
(𝑬𝑭𝒔𝒔 × 𝟏, 𝟎𝟎𝟎)

31
And:
(𝒌𝑾𝒉𝒉𝒔
𝑫𝒂𝒚) =
(𝑹𝑻𝒉𝒔 × 𝑮𝑷𝑴𝒉𝒔 × 𝟔𝟎)
(𝑬𝑭𝒉𝒔 × 𝟏, 𝟎𝟎𝟎)
And:
(𝒌𝑾𝒉𝒍𝒔
𝑫𝒂𝒚) =
(𝑹𝑻𝒍𝒔 × 𝑮𝑷𝑴𝒍𝒔 × 𝟔𝟎)
(𝑬𝑭𝒍𝒔 × 𝟏, 𝟎𝟎𝟎)
And where:
Daysoper = Days/year of operation
RTss = Runtime in hours/day using single-speed pump
RTls = Runtime in hours/day in low speed using variable-speed pump
RThs = Runtime in hours/day in high speed using variable-speed pump
GPMss = Gallons per minute using single-speed pump
GPMls = Gallons per minute in low speed using variable-speed pump
GPMhs = Gallons per minute in high speed using variable-speed pump
EFss = Energy factor using single-speed pump
EFls = Energy factor in low speed using variable-speed pump
EFhs = Energy factor in high speed using variable-speed pump
Table 29. ENERGY STAR Variable Speed Pool Pump PY15 Savings Assumptions
Term PY15 Value PY15 Source
Daysoper 121.6
ENERGY STAR Pool Pump Calculator adjusted for variable speed in
Missouri.
RTss 11.4
RTls 10.0
RThs 2.0
GPMss 64.4
GPMls 30.6
GPMhs 50.0
EFss 2.1
EFls 7.3
EFhs 3.8
Using this engineering algorithm, we estimated a per-unit saving value of 2,061 kWh/year for variable
speed pool pumps (Table 30). This value was approximately 134% of the 2012 TRM’s per-unit savings
(1,542 kWh/year), based on motor efficiency, load factor, and horsepower and not using the ENERGY
STAR calculator to estimate savings.

32
Table 30. Ex Ante and Ex Post Comparison for ENERGY STAR Variable Speed 1 Pumps
Ex Ante Savings/Unit Ex Post Savings/Unit Realization Rate
1,542 kWh/yr 2,061 kWh/yr 134%
Programmable Thermostats
The Cadmus team did not evaluate this measure in PY15 because the program did not offer it. Instead,
we used PY13 evaluated savings, which were estimated using the PY13 Efficient Products participant
survey data with the Ameren Missouri 2012 TRM savings algorithm and assumptions.
To calculate programmable thermostat savings, we weighted the savings values from the MML database
to the reported program building stock then applied an adjustment factor to account for changes in
participant behavior. We used the following resources and inputs:
MML database to obtain home type, HVAC system type, home vintage, and building type.
Participant survey data to obtain heating and cooling system saturations.
Participant survey data to obtain behavioral data:
Use of previous thermostat (whether manual or programmable)
Use of Ameren Missouri-rebated replacement thermostat (including Nest thermostats)
Using weighted MML savings values—modified with a thermostat use factor derived from participant
behavioral data—we determined the per-unit thermostat savings using the following algorithm:
We determined per-unit thermostat savings using the following algorithm:
𝑬𝒏𝒆𝒓𝒈𝒚 𝑺𝒂𝒗𝒊𝒏𝒈𝒔 (𝒌𝑾𝒉
𝒀𝒆𝒂𝒓) = 𝑴𝑴𝑳 𝒌𝑾𝒉 𝑿 𝑻𝒉𝒆𝒓𝒎𝒐𝒔𝒕𝒂𝒕 𝒖𝒔𝒆 𝒇𝒂𝒄𝒕𝒐𝒓
Where:
MML kWh = MML kWh savings weighted by program-specific housing characteristics
Thermostat use factor = Program-specific behavioral adjustment (%)
For our PY13 calculation of the thermostat use factor, we asked survey respondents how they used their
new programmable thermostat (including participants who purchased Nest thermostats). Then, to
determine if their behavior changed after the new thermostat was installed, we asked how they used
their previous thermostat. Our survey showed that a large percentage (72%) of PY13 respondents had
been using their previous thermostat in a way that saved energy and that that 93% of PY13 respondents
used their new thermostat in a manner that would save energy. The high percentage of PY13
participants who were already using a thermostat in a manner that would save energy resulted in a low
net value of 21%. Table 31 presents the MML kWh, the thermostat use factor, and the ex post per-unit
kWh for programmable thermostats.

33
Table 31. Programmable Thermostat Savings
Program MML kWh Thermostat Use Factor Ex Post kWh
Efficient Products 502.0 21% 105.4
We determined an ex post energy savings value of 105 kWh/year for each installed and retained
programmable thermostat. As shown in Table 32, this value was approximately 19% of the program’s
ex ante value (543 kWh/year). The main differences between the ex ante and ex post savings resulted
from the program-specific adjustments made for heating and cooling equipment saturations and the
thermostat use factor of 21%.
Table 32. Ex Ante and Ex Post Comparison for Programmable Thermostats
Ex Ante Savings/Unit Ex Post Savings/Unit Realization Rate
543 kWh/yr 105.4 kWh/yr 19%
CFLs and LEDs
The Cadmus team estimated per-unit savings for CFLs and LEDs using the following algorithm:
𝑬𝒏𝒆𝒓𝒈𝒚 𝑺𝒂𝒗𝒊𝒏𝒈𝒔 (𝒌𝑾𝒉/𝒀𝒆𝒂𝒓) = (𝑾𝒂𝒕𝒕𝑩𝑨𝑺𝑬 − 𝑾𝒂𝒕𝒕𝑬𝑬) × 𝑯𝒐𝒖𝒓𝒔𝑹𝑬𝑺 × 𝑫𝒂𝒚𝒔
𝟏, 𝟎𝟎𝟎× 𝑾𝑯𝑭
Where:
WattBASE = wattage of the original incandescent bulb replaced by a Home Energy Kit CFL or LED
WattEE = wattage of new bulb installed
HoursRES = the average hours of use per day
Days = days used per year
1,000 = the conversion factor between Wh and kWh (Wh/kWh)
WHF = Waste heat factor to account for interactive effects
Table 33. CFL and LED PY15 Savings Assumptions
Term PY15 Value
PY15 Source CFL LED
WattBASE 43 43 PY15 Lighting Evaluation shelf-stocking study
WattEE 13 10.5 Program Data – kits contain 13 Watt CFLs and 10.5 Watt LEDs
Hours 2.2 PY14 Lighting Evaluation*
Days 365 Conversion Factor (day/yr)
1,000 1,000 Conversion Factor (Wh/kWh)
WHF 0.98 PY13 Engineering Simulation Modeling adjusted for heating and cooling
saturations**
* See the PY14 Lighting evaluation for more details regarding the metering study.
** See the PY13 evaluation report for more details.

34
Using this engineering algorithm, we determined an ex post energy savings value of 24 kWh/year for
each installed and retained CFL and 26 kWh/year for LEDs. These values were approximately 75% and
81%, respectively, of the program’s ex ante value (31.5 kWh/year), based on the MML. The difference
between estimates primarily resulted from lower hours of use found during the PY14 Lighting Evaluation
than those assumed by MML and from differences baseline kWh/year values.
Table 34. Ex Ante and Ex Post Comparison for Kit CFLs and LEDs
Lighting Type Ex Ante
Savings/Unit
Ex Post
Savings/Unit
Realization
Rate
CFLs 31.5 kWh/yr 24 kWh/yr 75%
LEDs 54.5 kWh/yr 26 kWh/yr 47%
Advanced Power Strips
For advanced power strips, we used PY13 evaluated per-unit savings derived from secondary research.11
We calculated the ex ante and ex post per-unit savings for the different types of advanced power strips
sold through the program in PY15 and used in various home locations (Table 35).
Table 35. Ex Ante and Ex Post Comparison for Advanced Power Strips
APS Type Ex Ante Savings/Unit Ex Post Savings/Unit Realization Rate
Home Office—Load sensing
184 kWh/yr
31 kWh/yr 17%
Home Entertainment—Load sensing 75 kWh/yr 41%
Home Office—Motion sensing 34 kWh/yr 18%
Home Entertainment—Motion sensing 82 kWh/yr 45%
To determine final per-unit savings values for load-sensing advanced power strips provided through the
kit, we adjusted ex post savings based on the saturation levels of peripheral device use, as determined
through PY14 Home Energy Kit participant surveys. Responses to our surveys revealed saturation levels
differed by delivery channel (Table 36).
Table 36. Adjusted Ex Post Values Considering Peripheral Device Saturation
Delivery Channel and APS Type Home Office
Saturation
Entertainment Center
Saturation
Adjusted Ex Post
Savings/unit
Home Energy Kit: Load sensing1 48% 52% 54 kWh/yr
Online Store: Load sensing2 36% 64% 59 kWh/yr
Online Store: Motion sensing2 36% 64% 64 kWh/yr 1 Source: PY14 Home Energy Kit participant survey. 2 Source: PY13 PerformanceSavers participant survey.
11 A detailed overview of NYSERDA algorithms used and differences in assumptions between the NYSERDA report and the Ameren TRM are contained in the PY13 Final RebateSavers Evaluation.

35
Faucet Aerators
The Cadmus team estimated per-unit savings for faucet aerators using the following algorithm:
𝑬𝒏𝒆𝒓𝒈𝒚 𝑺𝒂𝒗𝒊𝒏𝒈𝒔 (𝒌𝑾𝒉/𝒀𝒆𝒂𝒓) = 𝑷𝒆𝒐𝒑𝒍𝒆 × 𝑭𝒂𝒖𝒄𝒆𝒕 𝑻𝒊𝒎𝒆 × 𝑫𝒂𝒚𝒔 × ∆𝑮𝑷𝑴 × (𝑻𝑭𝑨𝑼𝑪𝑬𝑻 − 𝑻𝑰𝑵) × 𝑪𝑷 × 𝑫𝒆𝒏
𝟑𝟒𝟏𝟑 × 𝑹𝑬 × 𝑵𝒖𝒎𝒃𝒆𝒓 𝒐𝒇 𝑭𝒂𝒖𝒄𝒆𝒕𝒔
Where:
People = the number of people using faucet aerators (people/household)
Faucet Time = the average length of faucet use per day (min/day)
Days = the number of days per year (day/yr)
ΔGPM = the difference in rated gallons per minute between the base unit and the new unit
(gal/min)
TFAUCET = the average water temperature out of the faucet (oF)
TIN = the average inlet water temperature (oF)
CP = the specific water heat (Btu/lb-oF)
Den = the water density (lb/gal)
ΔTemp = the temperature at the tap minus the temperature at the water main
RE = the water heater’s recovery efficiency
Number of Faucets = the number of used faucets per home
Although the engineering algorithm was the same for faucet aerators delivered to single-family homes
and installed in multifamily properties, several assumptions differed, as shown in Table 37.
Using this engineering algorithm, we determined the following ex post energy savings values:
39 kWh/year for each installed and retained aerator delivered to single-family homes
(approximately 68% of the program’s ex ante values).
38 kWh/year for multifamily homes (approximately 102% of the program’s ex ante values).
The difference between ex post and ex ante estimates primarily resulted from two factors:
The 2012 TRM assumed an average faucet time of five minutes per day, based on a 1997 report
by American Water Works Association Research Foundation. For the evaluated savings
assumption, we used metering data from the PY11 Multifamily Income Qualified (MFIQ)
program, which found an average faucet use time of 3.7 minutes per day.
The 2012 TRM assumed 1.9 faucets per home, based on the PY10 MFIQ program site visits. In
contrast, the 2012 Ameren Missouri potential study found an average of 2.04 bathrooms and
assumed one kitchen faucet (for a total of 3.04 faucets per home) for single-family homes; PY13
data indicated 2.4 faucets per home in multifamily homes.

36
Table 37. Faucet Aerator PY15 Savings Assumptions
Term PY15 Value:
Single-Family
PY15 Source:
Single-Family
PY15 Value:
Multifamily PY15 Source: Multifamily
People 2.67 PY14 Energy Kit Participant
Survey1
2.07 PY14 Community Savers
Program Data1
Faucet Time 3.7 PY11 MFIQ Metering
Study/Person
3.7 PY11 MFIQ Metering
Study/Person
Days 365 Conversion Factor (day/yr) 365 Conversion Factor (day/yr)
ΔGPM 0.7 PY13 Program Data 0.7 PY13 Program Data
TFAUCET 80 Ameren Missouri 2012 TRM2 80 Ameren Missouri 2012 TRM2
TIN 61.3 Ameren Missouri 2012 TRM2 61.3 Ameren Missouri 2012 TRM2
RE 0.98 Secondary Source3 0.98 Secondary Source3
CP 1 Specific Heat of Water
(Btu/lb-oF)
1 Specific Heat of Water
(Btu/lb-oF)
Den 8.33 Density (lb/gal) 8.33 Density (lb/gal)
3413 3,413 Conversion Factor (Btu/kWh) 3,413 Conversion Factor (Btu/kWh)
Number of
faucets
3.04 Secondary Source4 2.4 PY13 Program Data
1 Value updated from PY13. 2 Available at: https://www.efis.psc.mo.gov/mpsc/commoncomponents/viewdocument.asp?DocId=935658483 3 Recovery efficiency for electric hot water heater. 2010 Ohio Technical Reference Manual. Available at:
http://amppartners.org/pdf/TRM_Appendix_E_2011.pdf 4 Assumes one kitchen faucet per household, plus an average of 2.04 bathrooms per home, as determined by
the Ameren Missouri 2012 potential study.
Table 38 shows ex ante and ex post savings.
Table 38. Ex Ante and Ex Post Comparison for Kit Low-Flow Aerators
Home Type Ex Ante Savings/Unit Ex Post Savings/Unit Realization Rate
Single-Family 57 kWh/yr 39 kWh/yr 68%
Multifamily 37 kWh/yr 38 kWh/yr 102%
Showerheads
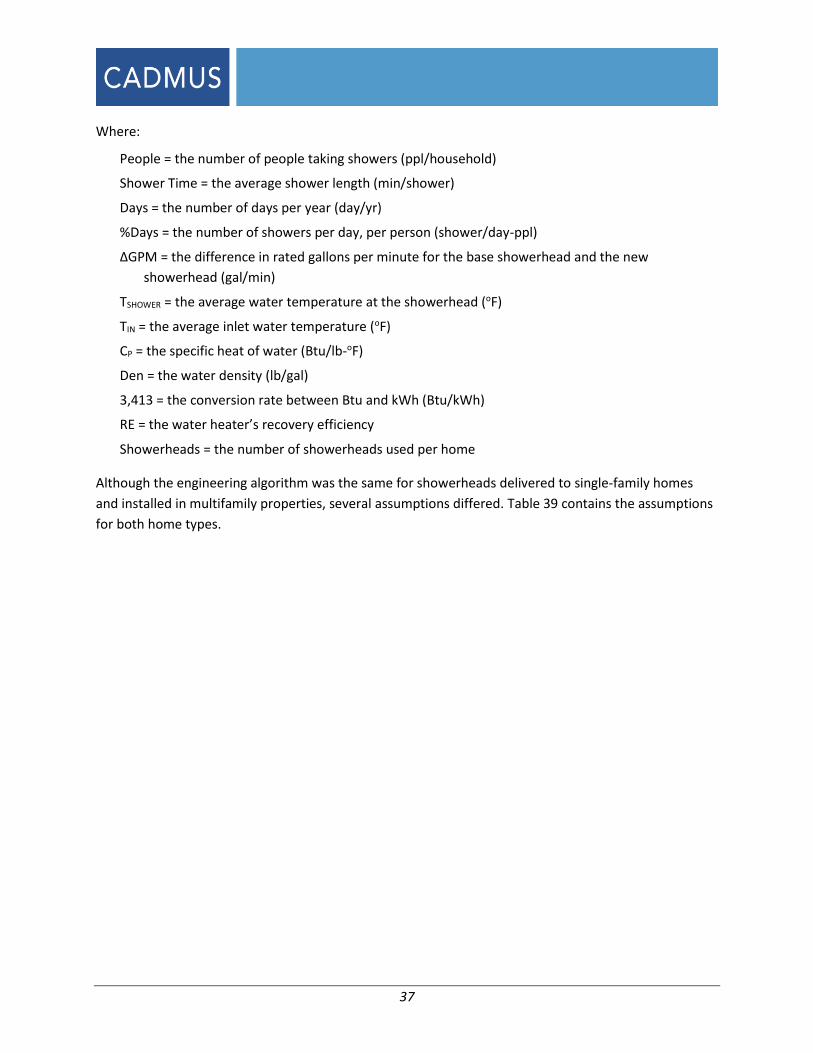
The Cadmus team estimated energy-efficient showerhead savings using the following algorithm:
𝑬𝒏𝒆𝒓𝒈𝒚 𝑺𝒂𝒗𝒊𝒏𝒈𝒔 (𝒌𝑾𝒉/𝒀𝒆𝒂𝒓)
= 𝑷𝒆𝒐𝒑𝒍𝒆 × 𝑺𝒉𝒐𝒘𝒆𝒓 𝑻𝒊𝒎𝒆 × 𝑫𝒂𝒚𝒔 × %𝑫𝒂𝒚𝒔 × ∆𝑮𝑷𝑴 × (𝑻𝑺𝑯𝑶𝑾𝑬𝑹 − 𝑻𝑰𝑵) × 𝑪𝑷 × 𝑫𝒆𝒏
𝟑, 𝟒𝟏𝟑 × 𝑹𝑬 × 𝑺𝒉𝒐𝒘𝒆𝒓𝒉𝒆𝒂𝒅𝒔
37
Where:
People = the number of people taking showers (ppl/household)
Shower Time = the average shower length (min/shower)
Days = the number of days per year (day/yr)
%Days = the number of showers per day, per person (shower/day-ppl)
ΔGPM = the difference in rated gallons per minute for the base showerhead and the new
showerhead (gal/min)
TSHOWER = the average water temperature at the showerhead (oF)
TIN = the average inlet water temperature (oF)
CP = the specific heat of water (Btu/lb-oF)
Den = the water density (lb/gal)
3,413 = the conversion rate between Btu and kWh (Btu/kWh)
RE = the water heater’s recovery efficiency
Showerheads = the number of showerheads used per home
Although the engineering algorithm was the same for showerheads delivered to single-family homes
and installed in multifamily properties, several assumptions differed. Table 39 contains the assumptions
for both home types.

38
Table 39. Showerhead PY15 Savings Assumptions
Term PY15 Value:
Single-Family
PY15 Source:
Single-Family
PY15 Value:
Multifamily
PY15 Source:
Multifamily
People 2.67 PY14 Energy Kit Participant
Survey1
2.07 PY14 CommunitySavers
Program Data1
ShowerTime 8.66 Secondary Source2 8.66 Secondary Source2
Days 365 Conversion Factor (day/yr) 365 Conversion Factor (day/yr)
%Days 0.66 Secondary Source3 0.66 Secondary Source3
ΔGPM 0.75 PY14 Program Data 0.75 PY14 Program Data
TSHOWER 105 Secondary Source4 105 Secondary Source4
TIN 61.3 Ameren Missouri 2012 TRM5 61.3 Ameren Missouri 2012 TRM5
RE 0.98 Secondary Source6 0.98 Secondary Source6
CP 1 Specific Heat of Water
(Btu/lb-oF)
1 Specific Heat of Water
(Btu/lb-oF)
Den 8.33 Density (lb/gal) 8.33 Density (lb/gal)
3,413 3,413 Conversion Factor (Btu/kWh) 3,413 Conversion Factor (Btu/kWh)
Showerheads 2.05 PY13 Program Data 1.4 PY13 Program Data 1 Value updated from PY13.
2DeOreo, William, P. Mayer, L. Martien, M. Hayden, A. Funk, M. Kramer-Duffield, and R. Davis. California Single-Family Water Use Efficiency Study. Sponsored by California Department of Water Resources. 2011. pp. 90-91. http://www.aquacraft.com/sites/default/files/pub/DeOreo-%282011%29-California-Single-Family-Water-Use-Efficiency-Study.pdf. 3DeOreo, Op cit. %Days are calculated by the number of showers per day per household (1.96, pp. 90 of the DeOreo study) divided by the average number of people per household (2.95, pp. 182 of the DeOreo study). 4The Bonneville Power Administration measured average shower temperatures as 104–106. 5 Available at: https://www.efis.psc.mo.gov/mpsc/commoncomponents/viewdocument.asp?DocId=935658483 6 RE for electric hot water heater. 2010 Ohio Technical Reference Manual. Available at: http://amppartners.org/pdf/TRM_Appendix_E_2011.pdf
Using this engineering algorithm, we determined the following ex post energy savings values for each
installed and retained showerhead:
222 kWh/year for single-family homes (approximately 61% of the program’s ex ante values).
252 kWh/year for multifamily homes (approximately 124% of the program’s ex ante values).
Table 40 shows ex ante and ex post savings. The difference between the estimates for single-family
homes primarily resulted from the following two factors:
The 2012 TRM assumed one shower per person per day (%Days in the algorithm). The study we
used, however, indicated 0.66 showers per person per day.12
12 DeOreo, William, P. Mayer, L. Martien, M. Hayden, A. Funk, M. Kramer-Duffield, and R. Davis. California Single-Family Water Use Efficiency Study. Sponsored by California Department of Water Resources. pp. 90-91. 2011. Available at: http://www.aquacraft.com/sites/default/files/pub/DeOreo-%282011%29-California-Single-Family-Water-Use-Efficiency-Study.pdf.

39
The 2012 TRM assumed one showerhead per home. However, primary data collected in PY13
found single-family homes receiving the kits had an average of 2.05 showerheads per home and
multifamily homes had an average of 1.4 showerheads.
Table 40. Ex Ante and Ex Post Comparison for Kit Low-Flow Showerheads
Home Type Ex Ante Savings/Unit Ex Post Savings/Unit Realization Rate
Single-family 361 kWh/yr 222 kWh/yr 61%
Multifamily 204 kWh/yr 252 kWh/yr 124%
Water Heater Pipe Wrap
The Cadmus team estimated per-unit savings from pipe wrap using the following algorithm:
𝑬𝒏𝒆𝒓𝒈𝒚 𝑺𝒂𝒗𝒊𝒏𝒈𝒔 (𝒌𝑾𝒉/𝒀𝒆𝒂𝒓) =
((𝟏
𝑹𝑬𝑿𝑰𝑺𝑻−
𝟏𝑹𝑵𝑬𝑾
) × 𝑳 × 𝑪 × ∆𝑻 × 𝟖, 𝟕𝟔𝟎)
𝑹𝑬 × 𝟑𝟒𝟏𝟑
Where:
REXIST = pipe heat loss coefficient of uninsulated pipe (existing) (Btu/hr-°F-ft) = 1.0
RNEW = pipe heat loss coefficient of insulated pipe (new) (Btu/hr-°F-ft)
L = length of pipe from a water heating source covered by pipe wrap (ft)
C = circumference of pipe (ft); (Diameter (in) * π * 0.083)
T = average temperature difference between supplied water (hot water) and ambient air
temperatures (°F)
8,760 = the number of hours during which heat loss occurs throughout the year (hr/yr)
RE= recovery efficiency of the electric hot water heater
3,413 = the conversion rate between Btu and kWh (Btu/kWh)
Although the engineering algorithm was the same for pipe wrap delivered to single-family homes and
pipe wrap installed in multifamily properties, the multifamily properties used a shorter length of pipe
wrap (four feet) than the average for single-family homes (12 feet), which resulted in a lower ex post
savings value.
Table 41 shows the difference in the two assumptions.

40
Table 41. Pipe Wrap PY15 Savings Assumptions
Term PY15 Value PY15 Source
REXIST 1 Secondary Source1
RNEW 4 PY14 Program Data
L (in feet) 12 ft – single-family
4 ft - multifamily
PY13 & PY14 Program Data2
C 0.196 Calculated (assumed ¾” D)3
T 67.5 – single-family
58.9 – multifamily
Secondary Source; Ameren Missouri 2012 TRM4
Secondary Source; PY11MFIQ site-visits5
8,760 8,760 Constant (Hours per year)
RE 0.98 Secondary Source6
3,413 3,413 Conversion Factor (Btu/kWh) 1 Navigant Consulting Inc. “Measures and Assumptions for Demand Side Management Planning; Appendix C Substantiation Sheets.” April 2009. Pg. 77. 2 Value updated from PY13. 3 3/4” is standard pipe diameter. 4Ambient air temperature is 67.5 degrees based on U.S. Department of Energy Test Procedure for Water Heaters. May 11, 1998. http://www.gpo.gov/fdsys/pkg/FR-1998-05-11/pdf/98-12296.pdf. Hot water temperature is 135 degrees according to Ameren Missouri 2012 TRM. 5 Ambient air temperature is 67.5 degrees based on U.S. Department of Energy Test Procedure for Water Heaters. May 11, 1998. http://www.gpo.gov/fdsys/pkg/FR-1998-05-11/pdf/98-12296.pdf. Hot water temperature of 126.4 based on site visits. 6 RE for electric hot water heater. 2010 Ohio Technical Reference Manual. Available at: http://amppartners.org/pdf/TRM_Appendix_E_2011.pdf
Using this engineering algorithm, we determined the following ex post energy savings values for
installed pipe wrap:
312 kWh/year in single-family homes (approximately 121% of the program’s ex ante value)
91 kWh/year in multifamily homes (approximately 324% of the program’s ex ante value)
Table 42 shows ex ante and ex post savings. The difference between ex ante and ex post savings
estimates for multifamily homes, compared with single-family homes, primarily resulted from installing
the shorter average pipe length wrap.
Table 42. Ex Ante and Ex Post Comparison for Pipe Wrap
Home Type Ex Ante Savings/Unit Ex Post Savings/Unit Realization Rate
Single-family 257 kWh/yr 312 kWh/yr 121%
Multifamily 23 kWh/yr 91 kWh/yr 324%

41
Summary Table 43 lists per-unit ex ante and ex post gross savings by measure.
Table 43. PY15 Summary: Comparison of Ex Ante and Ex Post Per-Unit Gross Savings
Measure Ex Ante
(kWh/yr)
Ex Post
(kWh/yr) Realization Rate
Equipment Rebates
Electric Water Heaters 157 175 111%
Heat Pump Water Heaters 1,802 2,865 159%
RACs 115 50 43%
Programmable Thermostats 543 105 19%
Dual-speed Pool Pumps 1,081 1,810 167%
Variable-speed Pool Pumps 1,542 2,061 134%
Air Purifier 482 515 107%
Water Coolers 361 140 39%
Kit Measures—Single-Family
CFLs 32 24 75%
LEDs 32 26 81%
Advanced Power Strips—Load Sensing 184 54 29%
Faucet Aerators 57 39 68%
Showerheads 361 222 61%
Water Heater Pipe Wrap 257 312 121%
Kit Measures—Multifamily
CFLs 32 24 75%
LEDs 32 26 81%
Faucet Aerators 37 38 102%
Showerheads 204 252 124%
Water Heater Pipe Wrap 28 91 324%
Upstream Discounts—Online Store
Advanced Power Strips—Load Sensing 184 59 32%
Advanced Power Strips—Motion Sensing 184 64 35%
To estimate the program’s total gross energy savings, we applied the per-unit values shown in Table 43
to the Efficient Products’ PY15 participation rates, as shown in Table 44.

42
Table 44. PY15 Summary: Ex Post Program Gross Savings Accounting for Installation Rates
Measure PY15
Participation
Per-Unit Ex Post
Savings (kWh/hr)
Percent Installed
and Operating
Total Ex Post
Savings (kWh/yr)
Equipment Rebates
Electric Water Heaters 39 175 100% 6,816
Heat Pump Water
Heaters
371 2,865 100% 1,063,044
RACs 1,171 50 100% 58,085
Programmable
Thermostats
18 105 99% 1,879
Dual-speed Pool Pumps 12 1,810 100% 21,720
Variable-speed Pool
Pumps
807 2,061 100% 1,663,237
Air Purifier 1,963 515 100% 1,011,268
Water Coolers 26 140 100% 3,649
Kit Measures—Single-Family
CFLs 21,304 24 75% 375,703
LEDs 10,652 26 92% 249,819
Advanced Power
Strips—Load Sensing
1,259 54 78% 53,204
Faucet Aerators 10,652 39 52% 213,768
Low-Flow Showerheads 5,326 222 47% 555,878
Water Heater Pipe
Wrap
5,326 312 41% 673,991
Kit Measures—Multifamily
CFLs 14,744 24 98% 341,118
LEDs 7,372 26 98% 184,772
Faucet Aerators 7,372 38 100% 279,938
Low-Flow Showerheads 3,686 252 86% 798,135
Water Heater Pipe
Wrap
3,686 91 100% 334,341
Upstream Discounts—Online Store
Advanced Power
Strips—Load Sensing
275 59 100%
16,269
Advanced Power
Strips—Motion Sensing
21 64 100%
1,354
Total 96,082 N/A 89% 7,907,987
*Kit measure installation rates varied, depending on where they were mailed or installed directly. Final ex post
savings were weighted according to the proportion of kits delivered through each method.

43
Table 45 compares the program’s ex ante and ex post gross savings. Appendix A provides ex post
demand savings, determined through DSMore using these ex post energy savings.
Table 45. PY15 Summary: Comparison of Ex Ante and Ex Post Program Gross Savings
Measure Ex Ante
(kWh/yr) Ex Post
(kWh/yr) Realization
Rate
Equipment Rebates
Electric Water Heaters 6,123 6,816 111%
Heat Pump Water Heaters 668,542 1,063,044 159%
RACs 134,665 58,085 43%
Programmable Thermostats 9,774 1,879 19%
Dual-speed Pool Pumps 12,972 21,720 167%
Variable-speed Pool Pumps 1,244,659 1,663,237 134%
Air Purifier 946,156 1,011,268 107%
Water Coolers 9,395 3,649 39%
Kit Measures—Single-family
CFLs 671,076 375,703 56%
LEDs 335,538 249,819 74%
Advanced Power Strips, Load Sensing 231,656 53,204 23%
Faucet Aerators 607,164 213,768 35%
Low-Flow Showerheads 1,922,686 555,878 29%
Water Heater Pipe Wrap 1,368,782 673,991 49%
Kit Measures—Multifamily
CFLs 464,436 341,118 73%
LEDs 232,218 184,772 80%
Faucet Aerators 274,238 279,938 102%
Low-Flow Showerheads 750,838 798,135 106%
Water Heater Pipe Wrap 103,208 334,341 324%
Upstream Discounts—Online Store
Advanced Power Strips, Load Sensing 50,600 16,269 32%
Advanced Power Strips, Motion Sensing 3,864 1,354 35%
Total 10,048,590 7,907,987 79%

44
Net Impact Evaluation Results
Free ridership is the percentage of savings that would have occurred in the program’s absence due to
participants purchasing the same measures without the program’s influence. Thus free riders are
customers who would have purchased the measure independent of the program and, because they
account for some program costs but none of its benefits, they decrease a program’s net savings.
To calculate the Efficient Products Program’s NTG, the Cadmus team used the following formula:
𝑵𝑻𝑮 = 𝟏 − 𝑭𝒓𝒆𝒆𝒓𝒊𝒅𝒆𝒓𝒔𝒉𝒊𝒑 + 𝑷𝒂𝒓𝒕𝒊𝒄𝒊𝒑𝒂𝒏𝒕 𝑺𝒑𝒊𝒍𝒍𝒐𝒗𝒆𝒓 + 𝑵𝒐𝒏𝒑𝒂𝒓𝒕𝒊𝒄𝒊𝒑𝒂𝒏𝒕 𝑺𝒑𝒊𝒍𝒍𝒐𝒗𝒆𝒓 + 𝑴𝒂𝒓𝒌𝒆𝒕 𝑬𝒇𝒇𝒆𝒄𝒕𝒔
Spillover is the savings that occur when customers undertake installation of additional energy efficiency
measures or perform energy-efficient activities without receiving financial assistance due to their
experience participating in a given program. Unlike free ridership, no program costs are associated with
spillover savings, but energy-saving benefits do occur, which increase net savings.
Since the program offerings have not changed significantly, the Cadmus team applied the PY14 spillover
results (Table 46) to PY15 gross savings estimates. We did not estimate market effects for the Efficient
Products program. The Cadmus team did calculate nonparticipant spillover in PY15, which is shown in
Table 46 with the program’s net impacts.

45
Table 46. PY15 Net Impact Results Summary
Program Measure
Ex Post Gross
Savings (kWh/yr)
Free Ridership
Participant Spillover
Non-participant
Spillover NTG
Net Savings (kWh/yr)
Equipment Rebates
Electric Water Heaters
6,816 60.2%
3.1% 3.7%
46.6% 3,176
Heat Pump Water Heaters
1,063,044 18.7% 88.1% 936,542
RACs 58,085 58.2% 48.6% 28,229
Programmable Thermostats
1,879 56.0% 50.8% 954
Dual-Speed Pool Pumps
21,720 0.0% 106.8% 23,197
Variable-Speed Pool Pumps
1,663,237 0.0% 106.8% 1,776,337
Air Purifier 1,011,268 0.0% 106.8% 1,080,035
Water Coolers 3,649 0.0% 106.8% 3,897
Subtotal* 3,829,698 6.2% 3.1% 3.7% 100.6% 3,852,367
Kit Measures
CFLs 716,821 12.0%
3.4% 3.7%
95.1% 681,696
LEDs 434,591 24.1% 83.0% 360,711
Advanced Power
Strips 53,204 8.1% 99.0% 52,672
Faucet Aerators 493,706 3.7% 103.4% 510,492
Low-Flow
Showerheads 1,354,013 10.6% 96.5% 1,306,622
Water Heater Pipe
Wrap 1,008,332 10.7% 96.4% 972,032
Subtotal* 4,060,666 11.4% 3.4% 3.7% 96.7% 3,884,225
Upstream Discounts—Online Store*
Advanced Power Strips—Load Sensing
16,269 N/A N/A
3.7%
103.7% 16,871
Advanced Power Strips—Motion Sensing
1,354 N/A N/A 103.7% 1,404
Program Total** 7,907,987 8.9 3.2% 3.7% 98.1% 7,754,868
* Values weighted by total program measure-level savings.
** Free ridership and participant spillover were not assessed for these measures.
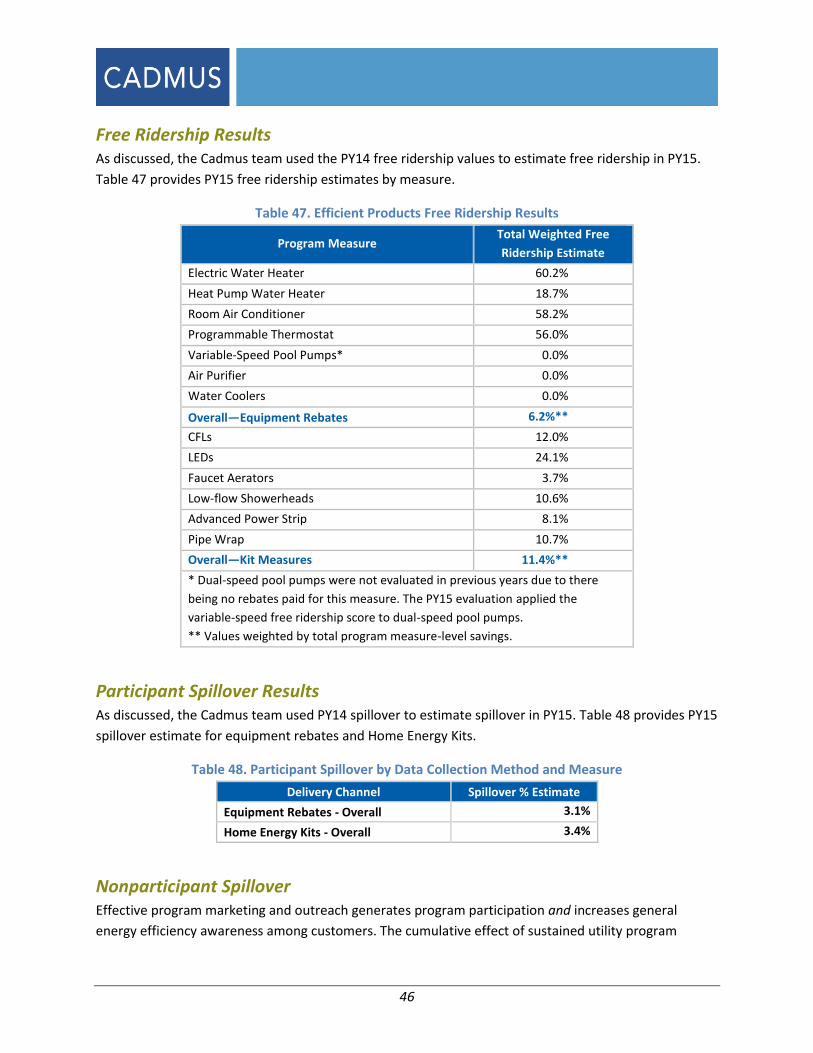
46
Free Ridership Results As discussed, the Cadmus team used the PY14 free ridership values to estimate free ridership in PY15.
Table 47 provides PY15 free ridership estimates by measure.
Table 47. Efficient Products Free Ridership Results
Program Measure Total Weighted Free
Ridership Estimate
Electric Water Heater 60.2%
Heat Pump Water Heater 18.7%
Room Air Conditioner 58.2%
Programmable Thermostat 56.0%
Variable-Speed Pool Pumps* 0.0%
Air Purifier 0.0%
Water Coolers 0.0%
Overall—Equipment Rebates 6.2%**
CFLs 12.0%
LEDs 24.1%
Faucet Aerators 3.7%
Low-flow Showerheads 10.6%
Advanced Power Strip 8.1%
Pipe Wrap 10.7%
Overall—Kit Measures 11.4%**
* Dual-speed pool pumps were not evaluated in previous years due to there
being no rebates paid for this measure. The PY15 evaluation applied the
variable-speed free ridership score to dual-speed pool pumps.
** Values weighted by total program measure-level savings.
Participant Spillover Results As discussed, the Cadmus team used PY14 spillover to estimate spillover in PY15. Table 48 provides PY15
spillover estimate for equipment rebates and Home Energy Kits.
Table 48. Participant Spillover by Data Collection Method and Measure
Delivery Channel Spillover % Estimate
Equipment Rebates - Overall 3.1%
Home Energy Kits - Overall 3.4%
Nonparticipant Spillover Effective program marketing and outreach generates program participation and increases general
energy efficiency awareness among customers. The cumulative effect of sustained utility program

47
marketing (which often occurs concurrently for multiple programs) can affect customers’ perceptions of
their energy usage and, in some cases, motivates customers to take efficiency actions outside of the
utility’s program. This phenomenon—called nonparticipant spillover (NPSO)—results in energy savings
caused by but not rebated through a utility’s demand-side management (DSM) activity.
During PY15, Ameren Missouri spent over $1.91 million dollars to market individual residential efficiency
programs (excluding low-income) and the portfolio-wide Act on Energy campaign—an amount more
than Ameren Missouri’s PY14 marketing expenditure ($1.53M).
To understand whether Ameren Missouri’s program-specific and general Act On Energy marketing
efforts generated energy efficiency improvements outside of Ameren Missouri’s incentive programs, the
Cadmus team implemented a general population survey of residential customers in PY15 to determine
the general population’s energy efficiency awareness and non-program participants energy efficiency
actions. This approach is consistent with the Uniform Methods Project protocols. 13
Methodology
In PY15, the Cadmus team selected and surveyed 200 customers, based on a randomly generated
sample frame of approximately 20,000 of Ameren Missouri’s residential customers. Through screening
survey respondents, we determined that the sample contained a number of customers (n=23) self-
reporting that they participated in an Ameren Missouri residential program during PY15. When
estimating NPSO, we excluded these customers from analysis, focusing on the 177 remaining random
nonparticipants; this avoided potential double-counting of program savings and/or program-specific
spillover. The sample of 200 is valid at 90% confidence level and within +-6% for estimating proportions.
We also limited the NPSO analysis to the same efficiency measures rebated through Ameren Missouri
programs (known as “like” spillover) because Ameren Missouri focuses its marketing primarily on
promoting the program portfolio, rather than through broad energy efficiency education. Program
specific marketing doesn’t preclude customers from implementing other energy efficiency
improvements as a result of their exposure to the programs, however since spillover estimates are
somewhat uncertain, restricting spillover to “like” measures adds a degree of conservativeness.14
Examples of “like” spillover included removing a secondary refrigerator and installing a programmable
thermostat. We did, however, exclude one notable category of “like” measures: lighting products. This
precluded double-counting NPSO lighting savings already captured through the upstream Lighting
program market affects analysis.
To ensure the responses included in the analysis represented electric spillover savings, Cadmus asked
customers questions about fuel type for water heaters, heating systems, and cooling systems. The
13 http://energy.gov/sites/prod/files/2015/02/f19/UMPChapter23-estimating-net-savings_0.pdf 14 Ameren Missouri promoted the portfolio of programs in a number of channels including pre-game shows at St. Louis Cardinals games, an outfield sign at Busch Stadium, digital banners, key word searches, metro link signs, social media, and Cardinals sweepstakes.

48
analysis only counted savings associated with measures where there was a corresponding electric water
heater, electric heat, or central air conditioning as spillover.
To confirm a relationship between Ameren Missouri’s energy efficiency programs, Ameren Missouri’s
awareness campaign, and actions taken by nonparticipants, our survey asked about nonparticipants’
familiarity with Ameren Missouri’s energy-efficiency programs and associated campaign. To be included
in the NPSO analysis, nonparticipating respondents had to indicate the following:
They were familiar with Ameren Missouri’s campaign; and
Ameren Missouri’s efficiency messaging motivated their purchasing decisions.
If a reported spillover measure type was offered under an Ameren Missouri rebate program,
respondents were asked why they or their contractor did not apply for a rebate through Ameren
Missouri. We did not count measures towards spillover if respondents reported applying for an Ameren
Missouri rebate but did not receive one because their product did not qualify. We compared the names,
addresses, and phone numbers of respondents to tracking databases to ensure that the respondents
were not confused by the questions and had, in fact, participated in the program. We did not find any,
which would have eliminate the measure as nonparticipant spillover. Since it was the largest savings
measure, we further investigated the logic of refrigerator recycling as a spillover measure—i.e. why
would someone find out about the program, then recycle the refrigerator own their own? Although
motivations aren’t known, Ameren Missouri staff indicate that in PY15, and similar to other years, 18.2%
of customers who originally sign up for recycling, cancel the pickup. Possible reasons might be inability
to agree upon a schedule or a perceived opportunity to earn more money for parts. Thus it is logical
that due to Ameren Missouri’s marketing efforts, customers may recycle on their own.
For measure types where it applied, we also asked respondents how they know their product is energy
efficient. Examples of answers that would keep reported measures in consideration for spillover are:
It’s ENERGY STAR rated
The retailer/dealer/contractor told me it was
We eliminated two measures from spillover consideration because the respondents ‘did not know’ how
to justify their product was energy efficient.

49
Results
Of 177 nonparticipants surveyed, 12 cited Ameren Missouri’s marketing as “very important” or
“somewhat important” in their decisions to purchase non-rebated, high-efficiency measures during
2015:15
Among nonparticipants citing their knowledge of Ameren Missouri’s energy efficiency programs
or the Ameren Missouri’s campaign as “very important,” we counted ex post, gross, per-unit
savings, determined through the PY15 evaluation towards the NPSO analysis.
If nonparticipants found Ameren Missouri “somewhat important” in their decisions, we applied
a 50% decrement and applied one-half of ex post energy savings for the specified measure.
The analysis excluded nonparticipant responses indicating Ameren Missouri’s programs or campaign
were “not very important” or “not at all important” to their efficiency actions.
Table 49Error! Reference source not found. shows measures and PY15 gross evaluated kWh savings
attributed to Ameren Missouri, with average savings per spillover action of 171 kWh.
15 This translates to approximately 7% of the general population, with a range of 90% confidence of 4% to 10%. Despite the range, the 7% middle point remains the most likely value. With 7% of the population undertaking actions on their own, a sample size of nearly 5,000 surveys would be needed to detect such a level with ±10% (6.3% to 7.7%) —clearly a prohibitive undertaking.
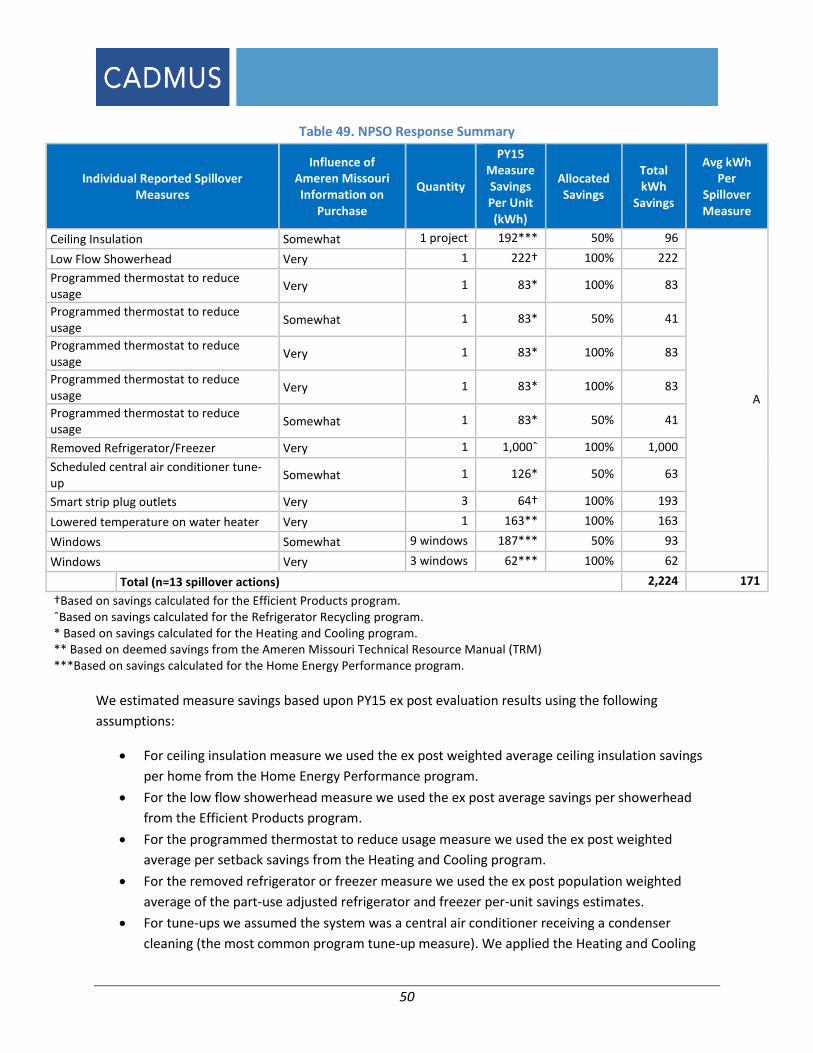
50
Table 49. NPSO Response Summary
Individual Reported Spillover Measures
Influence of Ameren Missouri Information on
Purchase
Quantity
PY15 Measure Savings Per Unit (kWh)
Allocated Savings
Total kWh
Savings
Avg kWh Per
Spillover Measure
Ceiling Insulation Somewhat 1 project 192*** 50% 96
A
Low Flow Showerhead Very 1 222† 100% 222
Programmed thermostat to reduce usage
Very 1 83* 100% 83
Programmed thermostat to reduce usage
Somewhat 1 83* 50% 41
Programmed thermostat to reduce usage
Very 1 83* 100% 83
Programmed thermostat to reduce usage
Very 1 83* 100% 83
Programmed thermostat to reduce usage
Somewhat 1 83* 50% 41
Removed Refrigerator/Freezer Very 1 1,000ˆ 100% 1,000
Scheduled central air conditioner tune-up
Somewhat 1 126* 50% 63
Smart strip plug outlets Very 3 64† 100% 193
Lowered temperature on water heater Very 1 163** 100% 163
Windows Somewhat 9 windows 187*** 50% 93
Windows Very 3 windows 62*** 100% 62
Total (n=13 spillover actions) 2,224 171
†Based on savings calculated for the Efficient Products program. ˆBased on savings calculated for the Refrigerator Recycling program. * Based on savings calculated for the Heating and Cooling program. ** Based on deemed savings from the Ameren Missouri Technical Resource Manual (TRM) ***Based on savings calculated for the Home Energy Performance program.
We estimated measure savings based upon PY15 ex post evaluation results using the following
assumptions:
For ceiling insulation measure we used the ex post weighted average ceiling insulation savings
per home from the Home Energy Performance program.
For the low flow showerhead measure we used the ex post average savings per showerhead
from the Efficient Products program.
For the programmed thermostat to reduce usage measure we used the ex post weighted
average per setback savings from the Heating and Cooling program.
For the removed refrigerator or freezer measure we used the ex post population weighted
average of the part-use adjusted refrigerator and freezer per-unit savings estimates.
For tune-ups we assumed the system was a central air conditioner receiving a condenser
cleaning (the most common program tune-up measure). We applied the Heating and Cooling

51
program ex post savings for this measure of 251.4 kWh. For purposes of NPSO, we
conservatively de-rated the estimated savings by 50% to get 125.7 kWh savings considering that
a non-program tune-up may not meet the program quality standards and would save less.
For smart strip plug outlets we used the ex post average savings for smart strips from the
Efficient Products program.
For the lowered temperature on water heater measure we used the deemed savings from the
Ameren Missouri Technical Resource Manual which assumes a 40 gallon residential tank and a
current typical existing market baseline of electric water heater thermostat set at 135 degrees F
and a minimum threshold for savings credit of a post set point at 120 degrees F.
For the respondent who installed 9 energy efficient windows we used the ex post average
window savings per home from the Home Energy Performance program of 186.9 kWh.
For the windows respondent who installed 3 energy efficient windows we applied one-third of
the ex post average window savings per home from the Home Energy Performance Program.
To arrive at a single savings estimate (Variable A in Table 49Error! Reference source not found.), the
Cadmus team used numbers in the Total kWh Savings column to calculate an average for the 15
measures assessed for NPSO. Thus, the 171 kWh estimate represented average nonparticipant energy
savings, per respondent attributing spillover to Ameren Missouri’s residential programs.
To determine the total NPSO generated by Ameren Missouri marketing in 2015, we used the following
variables (as shown in Table 50Error! Reference source not found.):
A is the average kWh savings per NPSO response.
B is the number of NPSO measures attributed to the program.
C is the number of nonparticipants contacted by the survey implementer.
D is Ameren Missouri’s total residential customer population (excluding PY15 participants).
E is NPSO energy savings, extrapolated to the customer population, and calculated by dividing B
by C, and then multiplying the result by A and D.
F is Ameren Missouri’s total reported 2015 program year ex post gross savings for Refrigerator
Recycling, Heating and Cooling, Lighting, Home Energy Performance, and Efficient Products.
(Similarly to PY14, the PY15 analysis did not include the Low Income program.)16
G (representing NPSO as a percentage of total evaluated savings) is the nonparticipant
percentage used in the NTG calculations.
Using this information, the Cadmus team estimated overall, portfolio-level NPSO at 8.6% of total PY15
reported ex post gross savings, as shown in Table 50Error! Reference source not found.. Smaller NPSO
savings were reported in PY14
(7,592 MWH) than in PY15 (12,247 MWH). This combined with lower total ex post residential portfolio
16 We excluded the Low Income program as it exclusively worked directly with property managers of low-income buildings; so marketing for this program would likely generate little NPSO.

52
savings in PY15 (142,016 MHW) than in PY14 (210,530 MH). Consequently, this resulted in a higher
NPSO as a percent of total ex post residential portfolio savings values in PY15 (8.6%) than estimated for
PY14 (3.6%). Both years identified a similar list of measures installed. A growing proportion of
nonparticipant spillover is consistent with what we would expect from long running marketing of a
program portfolio.

53
Table 50. NPSO Analysis
Variable Metric Value Source
A Average kWh Savings per Spillover Measure 171 Survey Data/Impact Evaluation
B Number of Like Spillover Nonparticipant Actions 13 Survey data
C Number Contacted 177 Survey disposition
D Total Residential Population minus PY15 participants 974,784
Customer database minus PY15 participants
E Non-Part SO MWh Savings Applied to Population 12,247 (((B÷C)×A) × D)/1000
F Total Reported Gross Ex Post Savings (MWh) 142,016 2015 Program Evaluations
G NPSO as Percent of Total Evaluated Savings 8.6% E ÷ F
In some jurisdictions, evaluators apply NPSO as an adjustment at the portfolio-level. Though a
reasonable approach, it inherently assumes all programs contribute equally to generating observed
NPSO. However, given the significant differences between the programs’ marketing tactics and budgets
as well as programs’ designs and scales, an alternate approach likely produces a better attribution
estimate.
The Cadmus team considered the following three approaches for allocating total observed NPSO to
individual programs:
1. Even Allocation: The most straightforward approach, this allocates NPSO evenly across
residential programs (i.e., makes an 8.6% adjustment to each program’s NTG). Doing so,
however, is equivalent to applying NPSO at the portfolio-level, which, as noted, assumes all
programs contribute equally to generating NPSO. This approach may be most appropriate when
NPSO derives from a broad energy efficiency education campaign, rather than the program
specific marketing Ameren Missouri used.
2. “Like” Programs: This approach allocates NPSO savings to specific programs, based on the
measure installed by the nonparticipant or by the action they took. For example, one
nonparticipant reported tuning up their central air conditioner, based on energy efficiency
messaging from Ameren Missouri. Using this approach, we would assign NPSO savings
associated with a central air conditioner tune-up. While this approach establishes a clear
connection between a reported NPSO measure and Ameren Missouri’s program promoting that
measure, our research has found this direct measure-program relationship does not prove as
straightforward as it appears. There are indications Ameren Missouri generated NPSO through
the cumulative effects of various program-specific and portfolio-level marketing efforts.
Mapping NPSO measures solely to the program offering that measure could undervalue overall
impacts of cumulative and sustained energy efficiency messaging.
3. Marketing Budget and Program Size. The final allocation approach the Cadmus team
considered—and eventually chose to use—assigns overall NPSO as a function of each program’s
marketing and program budget. This approach remains consistent with the theory that NPSO
results from the cumulative effect of program-specific and Ameren Missouri marketing and
program activity over a period of time, not necessarily by a single, program-specific marketing

54
effort and not by a broad education campaign. In addition, while NPSO most commonly is
associated with mass media marketing campaigns, the scale of program activity proves to be a
factor. For example, even without a significant marketing campaign, a program’s size can drive
NPSO through word-of-mouth and in-store program messaging. We find this approach
accurately reflects and attributes NPSO to programs, ensuring proper accounting for total costs
(including marketing) and total benefits (net savings, including NPSO) when assessing overall
program cost-effectiveness.
The Cadmus team distributed the portfolio-level result of 12,247 MWh NPSO to Ameren Missouri’s
residential programs (excluding Low Income). As noted, we considered the PY15 program size (in terms
of total gross ex post MWh savings) and each program’s marketing budget (as shown in Table 51) when
allocating NPSO across programs.
Table 51. Program-Specific Savings and Marketing
Program Program Ex Post Gross
Savings (MWh) Percentage of
Portfolio Savings Total
Marketing Percentage of
Total Marketing
Refrigerator Recycling 10,774 7.6% $630,194 32.9%
Heating and Cooling 54,622 38.5% $955,454 49.9%
Lighting 68,326 48.1% $71,804 3.8%
Home Energy Performance 385 0.3% $46,670 2.4%
Efficient Products 7,908 5.6% $209,907 11.0%
Total 142,016 100% $1,914,029 100%
The results of this approach—shown in Table 52Error! Reference source not found. and Error! Reference
source not found.—reflect each program’s impact on the nonparticipant population, based on
marketing expenditures and the magnitude of the program’s intervention in the regional marketplace.
Table 52. Combined Savings and Marketing Allocation Approach
Program
Ex Post Gross
Energy
Savings (A)
Marketing
Spending
(B)
Combined
Savings/
Marketing
(AxB)
Percentage of
Combined
Savings/
Marketing
Refrigerator Recycling 7.6% 32.9% 2.5% 10.4%
Heating and Cooling 38.5% 49.9% 19.2% 79.6%
Lighting 48.1% 3.8% 1.8% 7.5%
Home Energy
Performance
0.3% 2.4% 0.01% 0.03%
Efficient Products 5.6% 11.0% 0.6% 2.5%
Total 100% 100% 24.1% 100%
Analysis credited two programs with the greatest NPSO: Heating and Cooling (accounting for one-half of
all marketing dollars and 38% of total energy savings) at 9,749 MWh; and Refrigerator Recycling

55
(accounting for 33% of marketing dollars and 8% of total energy savings) at 1,268 MWh. As NPSO
impacts program-specific NTG results,17 all NPSO estimates have been reported as a percentage of each
program’s total gross energy savings.
As shown in Table 53Error! Reference source not found., we allocated 310 MWh of NPSO to the Efficient Products program, representing 2.5% of the combined residential portfolio savings and marketing expenditure. This resulted in a 3.9% adjustment to the program’s PY15 NTG—findings generally similar to the PY14 NPSO analysis.
Table 53. NPSO by Program
Program Program Gross Savings (MWh)
Total NPSO
(MWh)
Percentage of Combined Savings/
Marketing
Program-Specific NPSO
(MWh)
NPSO as a Percentage of Gross Savings
Refrigerator Recycling 10,774
12,247
10.4% 1,268 11.8%
Heating and Cooling 54,622 79.6% 9,749 17.8%
Lighting 68,326 7.5% 916 1.3%
Home Energy Performance
385 0.03% 3 0.9%
Efficient Products 7,908 2.5% 310 3.9%
Total 142,016 100% 12,247 8.6%
Net Savings Summary To estimate the overall program and measure NTG ratios, the Cadmus team used total population
ex post gross kWh savings to weight results for each data collection method. Table 54 shows the
components of each program measure’s NTG estimate (free ridership and spillover) and the percentage
of total program savings related to each measure’s data collection method. We used the percentage of
total program savings and NTG ratios specific to each measure to arrive at a savings-weighted NTG
estimate of 100.6% for the program’s equipment rebate portion. The savings-weighted NTG estimate for
the program’s kit measures portion was 95.2%.
Table 54. NTG by Measure
Measure Free Ridership Participant
Spillover
Non-participant
Spillover NTG
Equipment Rebates
Electric Water Heaters 60.2%
3.1% 3.7%
46.6%
Heat Pump Water Heaters 18.7% 88.1%
Room Air Conditioners 58.2% 48.6%
Programmable Thermostats 56.0% 50.8%
Dual and Variable Speed Pool Pumps 0.0% 106.8%
Air Purifiers 0.0% 106.8%
17 NTG = 1 – Free Ridership + Participant Spillover + NPSO + Market Effects

56
Measure Free Ridership Participant
Spillover
Non-participant
Spillover NTG
Water Coolers 0.0% 106.8%
Total 6.2% 3.1% 3.7% 100.6%
Kit Measures
CFLs 12.0%
3.4% 3.7%
95.1%
LEDs 24.1% 83.0%
Faucet Aerators 3.7% 103.4%
Low-flow Showerheads 10.6% 96.5%
Advanced Power Strip 8.1% 99.0%
Pipe Wrap 10.7% 96.4%
Total 8.9% 3.2% 3.7% 98.1%
As shown in Table 55, an overall weighted-by-total gross program savings NTG estimate of 97.9%
resulted for the program as a whole.
Table 55. Overall Program NTG
Subprogram
Total Gross
Program kWh
Savings
Percentage of
Program Savings NTG
Overall Program
NTG
Equipment Rebate Measures 3,829,698 48.4% 100.6%
98.1% Kit Measures 4,060,666 49.8% 96,7%
Advanced Power Strip-Online 17,623 0.2% 103.7%
Discount Rate = 6.95%
Ameren Missouri 2012 MEEIA Filing
Line Losses = 5.72%
Summer Peak occurred during the 16th hour of a July day, on average
Escalation rates for different costs occurred at the component level, with
separate escalation rates for fuel, capacity, generation, transmission and
distribution, and customer rates carried out over 25 years.
Avoided Energy and Capacity Costs Ameren Missouri 2014 IRP
Avoided Electric T&D = $23.60/kW
In addition, MMP used the Batch Tools (model inputs) that Ameren Missouri used in its original analysis
as input into the ex post DSMore analysis, then modified these solely with new data from the evaluation
(e.g., PY15-specific Lighting participation counts, per-unit gross savings, and NTG), which ensured
consistency. For HVAC, we also updated the per-unit demand reduction based on our analysis of primary
sub-meter data.
Particularly, model assumptions were driven by measure load shapes, which indicated when the model
should apply savings during the day. This ensured that the load shape for an end-use matched the
system peak impacts of that end use and provided the correct summer coincident savings. MMP used
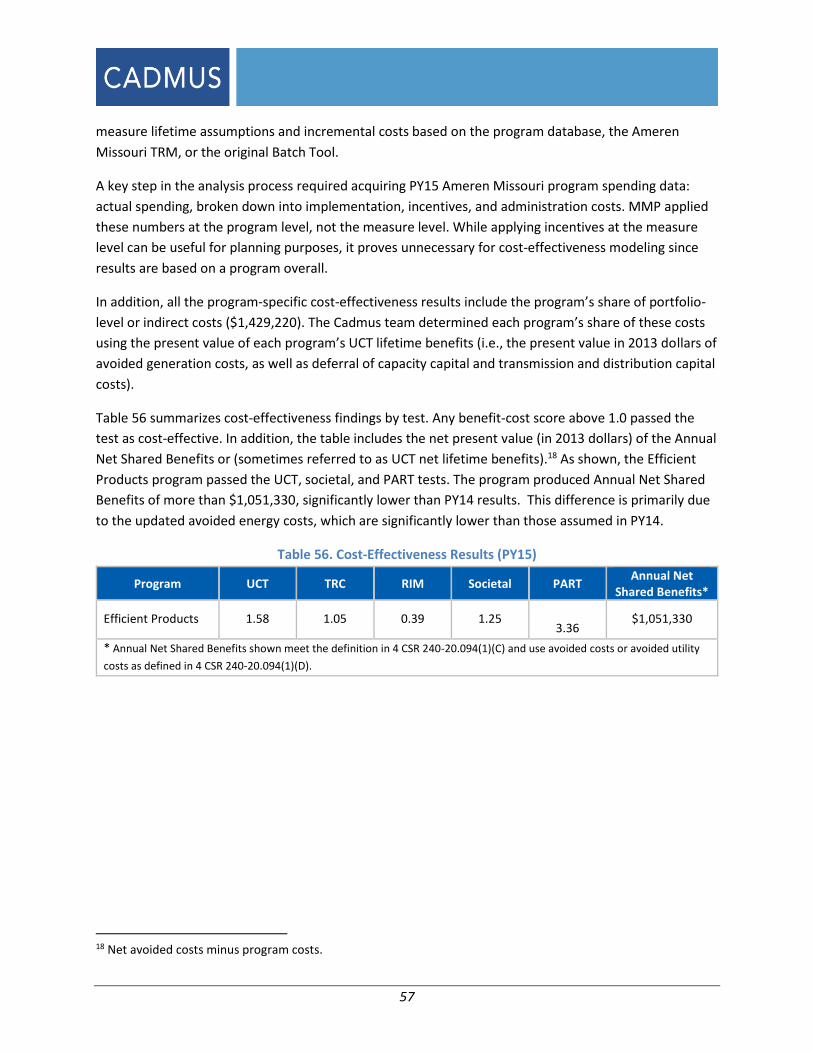
57
measure lifetime assumptions and incremental costs based on the program database, the Ameren
Missouri TRM, or the original Batch Tool.
A key step in the analysis process required acquiring PY15 Ameren Missouri program spending data:
actual spending, broken down into implementation, incentives, and administration costs. MMP applied
these numbers at the program level, not the measure level. While applying incentives at the measure
level can be useful for planning purposes, it proves unnecessary for cost-effectiveness modeling since
results are based on a program overall.
In addition, all the program-specific cost-effectiveness results include the program’s share of portfolio-
level or indirect costs ($1,429,220). The Cadmus team determined each program’s share of these costs
using the present value of each program’s UCT lifetime benefits (i.e., the present value in 2013 dollars of
avoided generation costs, as well as deferral of capacity capital and transmission and distribution capital
costs).
Table 56 summarizes cost-effectiveness findings by test. Any benefit-cost score above 1.0 passed the
test as cost-effective. In addition, the table includes the net present value (in 2013 dollars) of the Annual
Net Shared Benefits or (sometimes referred to as UCT net lifetime benefits).18 As shown, the Efficient
Products program passed the UCT, societal, and PART tests. The program produced Annual Net Shared
Benefits of more than $1,051,330, significantly lower than PY14 results. This difference is primarily due
to the updated avoided energy costs, which are significantly lower than those assumed in PY14.
Table 56. Cost-Effectiveness Results (PY15)
Program UCT TRC RIM Societal PART Annual Net
Shared Benefits*
Efficient Products 1.58 1.05 0.39 1.25
3.36 $1,051,330
* Annual Net Shared Benefits shown meet the definition in 4 CSR 240-20.094(1)(C) and use avoided costs or avoided utility
costs as defined in 4 CSR 240-20.094(1)(D).
18 Net avoided costs minus program costs.

58
Appendix A. Ex Post Demand Reductions
MMP determined ex post demand reductions using ex post energy savings estimated in this PY15 report
and DSMore (using load shapes provided by Ameren Missouri).
Table 57. PY15 Summary: Net Ex Post Per-Unit Demand Reductions
Measure PY15 Participation Per-Unit Net Ex Post Demand Reduction
(kW)
Total Net Ex Post Savings (kW)*
Equipment Rebates
Electric Water Heaters 39 0.0091 0.4
Heat Pump Water Heaters 371 0.2830 105.0
RACs 1,171 0.0204 23.9
Programmable Thermostat 18 0.0000 0.0
Dual and Variable-speed Pool Pumps 819 0.5892 482.5
Air Purifier 1,963 0.0873 171.3
Water Coolers 26 0.0265 0.7
Kit Measures – Single-Family (7,690 total kits)
CFLs 21,304 0.0007 15.4
LEDs 10,652 0.0008 8.6
Advanced Power Strips, Load Sensing 1,259 0.0066 8.3
Faucet Aerators 10,652 0.0023 24.7
Low-Flow Showerheads 5,326 0.0113 59.9
Water Heater Pipe Wrap 5,326 0.0137 73.1
Kit Measures – Multifamily (2,114 total kits)
CFLs 14,744 0.0009 13.6
LEDs 7,372 0.0009 6.5
Faucet Aerators 7,372 0.0044 32.5
Low-Flow Showerheads 3,686 0.0235 86.5
Water Heater Pipe Wrap 3,686 0.0098 36.3
Upstream Discounts – Online Store
Advanced Power Strips, Load Sensing 275 0.0097 2.7
Advanced Power Strips, Motion
Sensing 21 0.0105 0.2
Total 96,082 N/A 1,152
*Accounts for line losses; total may not add to sum of measure-specific kW due to rounding

59
Appendix B. Stakeholder Interview Guide
Respondent name:
Respondent phone:
Interview date: Interviewer initials:
For the PY15 evaluation, Cadmus will interview stakeholders annually. The interview will focus on PY15
program changes and identify recommendations for improving subsequent programs.
Introduction
1. What are your main responsibilities for Ameren Missouri’s Efficient Products Program? Has this
changed since PY14?
2. What percent of your time is dedicated to Efficient Products?
3. What tasks do you regularly spend the majority of your time on?
Program Design and Implementation
4. Can you provide a summary of how the program has changed since PY14?
a. Program name? Why was this change made?
b. New measures? How was this decision made?
c. Any delivery changes to equipment rebates?
d. Any delivery changes to single family kits?
e. Any delivery changes to multifamily kits?
i. Are these installed by contractor? Property managers?
ii. Who is paying for the $4.95 powerstrip?
f. Did these changes have the desired outcomes?
5. What would you say is working particularly well so far in PY15? Why is that?
6. Conversely, what is not working as well as anticipated? Why is that?
Program Goals
7. What are the program’s participation and savings goals for PY15? By equipment type?
8. How were these goals determined?
9. In your opinion, how has the program performed so far in PY15 (in general, as well as
savings/participation goals)?
10. Why do you think this is?
11. Are there benchmarks in place to monitor progress throughout the year?
12. Have you identified the triggers for contingency plans in case goals are not being met?

60
Measures
13. In your opinion, should any additional measures be considered for inclusion in future programs?
If so, what measures?
14. Conversely, should any current measures be excluded?
Marketing Efforts
15. How has marketing changed since PY14?
Retailer Participation
16. How many retailers currently participate in the program?
17. Has the retailer participation process changed since PY14? (Probe: do they need to sign an
agreement with APT, and what are their obligations?)
Rebate Processing and Data Management
18. Do you have a goal for rebate processing times?
19. Have there been any issues or difficulties with rebate processing so far?
20. How is the online rebate portal working? (Any issues?) (PROBE: What proportion of sales do you
anticipate coming through this channel? Is there a goal?)
21. How is the Vision database working? (Any issues?)
Quality Control
22. In your own words, please explain how the program’s quality control process works.
23. For the EEKits, are there systems in place to prevent participants from receiving more than one
kit?
24. How does the program ensure EEKit items are installed?
25. Does Ameren Missouri perform any ride-along or independent quality control checks? Please
explain.
26. Is there anything else you’d like us to know?

61
Appendix C. Bibliography
Ameren Missouri. Technical Resource Manual. 2012. Available at:
https://www.efis.psc.mo.gov/mpsc/commoncomponents/viewdocument.asp?DocId=935658483
Cadmus. Residential Retrofit High Impact Measure Evaluation Report: Evaluation of PGE2000,
SDGE3024, & SCE2501 Room Air Conditioners (2006-2008). 2010. Available at:
http://www2.epa.gov/sites/production/files/documents/CA_PUC_Assessment.pdf
DeOreo, William, P. Mayer, L. Martien, M. Hayden, A. Funk, M. Kramer-Duffield, and R. Davis. California
Single-Family Water Use Efficiency Study. Sponsored by California Department of Water Resources. pp.
90-91. 2011. Available at: http://www.aquacraft.com/sites/default/files/pub/DeOreo-%282011%29-
California-Single-Family-Water-Use-Efficiency-Study.pdf.
National Renewable Energy Laboratory. The Uniform Methods Project. April 2013. Available online:
https://www1.eere.energy.gov/office_eere/de_ump_protocols.html.
State of California. California Standard Practice Manual: Economic Analysis of Demand-Side Programs
and Projects. October 2001. Available at: http://www.calmac.org/events/SPM_9_20_02.pdf
State of Missouri. “Administrative Rules: Missouri Code of State Regulations.” Revised January 2016.
Available online: http://www.sos.mo.gov/adrules/csr/csr.asp
State of Ohio. 2010 Ohio Technical Reference Manual. Available at:
http://amppartners.org/pdf/TRM_Appendix_E_2011.pdf
Union Electric Company. Electric service applying to residential energy efficiency in Missouri service
area. Effective June 30, 2013. Available at: http://www.ameren.com/-/media/missouri-
site/Files/Rates/UECSheet191EEResidential.pdf