american association of collegiate ......volume 89 issue no. 4 american association of collegiate...
TRANSCRIPT
VOLUME 89 ◆ ISSUE NO. 4
AMERICAN ASSOCIATION OF COLLEGIATE REGISTRARS AND ADMISSIONS OFFICERS
C&UCOLLEGE and UNIVERSITYEducating the Modern Higher Education Administration Professional
Providing Affordable Access to Higher Education through Year-Round Operation:A Case Study in Public Higher Education
Transfer Credit Evaluations:How They Are Produced, Why It Matters, and How to Serve Students Better
Transitioning from Quarters to Semesters:Changes in College Students’ Predicted and Perceived Motivation
Assessing the Impact of the Cambridge International Acceleration Program on U.S. University Determinants of Success:A Multi-Level Modeling Approach
Be a Pine Tar Registrar Creating Traditions of Collaboration
Managing Chaos
Eastern Dreams: Alternative Pathways for Chinese Students Pursuing Baccalaureate Degrees in the United States
Paying for the Party: How College Maintains Inequality
The College Fear Factor: How Students and Professors Misunderstand One Another
COMMENTARY CAMPUS VIEWPOINT
RESEARCH IN BRIEF
BOOK REVIEWS
forum

Offering Effective Consulting Solutions to the Higher Education Community
To discuss your institution’s needs and explore your opportunities, contact us at [email protected], or call us at (202) 355–1056. For more information about
AACRAO Consulting visit us at http://consulting.aacrao.org/
AACRAO Consulting (AC) is in a unique
position to off er colleges and universities
high-quality, cost-eff ective consultation services
to meet today’s challenges and prepare for
tomorrow’s opportunities.
We help institutions of all types achieve success by:■ Setting Strategic Enrollment
Management projections and goals
■ Improving institutional fi nancial outcomes and predicting yield
■ Ensuring best practices in enrollment and registration services, including regulatory compliance
■ Maximizing student recruitment and retention
■ Developing organizational structures that optimize eff ectiveness
AC possesses a team of leading experts who
combine hands-on experience with institutional
challenges, tools and expertise for in-depth
research, and the change management skills
needed in today’s higher education environment.
VOLUME 89 ◆ ISSUE NO. 4
Contents2 Providing Affordable Access to Higher Education
through Year-Round Operation: A Case Study in Public Higher EducationBY JOHN BUTTERMORE, ELIOTT BAKER, AND DAVID CULP
14 Transfer Credit Evaluations: How They Are Produced, Why It Matters, and How to Serve Students BetterBY ALEXANDER P. OTT AND BRUCE S. COOPER
26 Transitioning from Quarters to Semesters: Changes in College Students’ Predicted and Perceived MotivationBY MARCUS LEE JOHNSON AND JESSICA L. KESTLER
38 Assessing the Impact of the Cambridge International Acceleration Program on U.S. University Determinants of Success: A Multi-Level Modeling ApproachBY STUART SHAW, JAYNE WARREN, AND TIM GILL
EDITOR IN CHIEFLouise LonabockerBoston College
Daniel BenderUniversity of the Pacific
Marc CamilleLoyola University
Sharon CramerBuffalo State College (retired)
Bruce CunninghamDuke University
Polly GriffinPrinceton University
William HaidUniversity of California — San Diego
Stan HendersonUniversity of Michigan at Dearborn
David KalsbeekDePaul University
Philomena MantellaNortheastern University
Paul MarthersRensselaer Polytechnic Institute
Bryan NewtonAiken Technical College
Clayton SmithUniversity of Windsor
Heather SmithBridgewater State College
Roger J. ThompsonUniversity of Oregon
Jim WagerPennsylvania State University (retired)
Beth WeckmuellerUniversity of Wisconsin — Milwaukee
MANAGING EDITORHeather ZimarAACRAO
CONSULTING EDITORKathy WinarskiBoston College
C&U EDITORIAL BOARD
PRESIDENTAdrienne K. McDayWilliam Rainey Harper College
PRESIDENT-ELECTBrad A. MyersThe Ohio State University
PAST PRESIDENTJeffrey von Munkwitz-SmithBoston University
VICE PRESIDENT FOR ADMISSIONS AND ENROLLMENT MANAGEMENTTracey JamisonUniversity System of Maryland
VICE PRESIDENT FOR INTERNATIONAL EDUCATIONMelanie GottliebWebster University
VICE PRESIDENT FOR ACCESS AND EQUITYLuisa HavensFlorida International University
VICE PRESIDENT FOR LEADERSHIP AND MANAGEMENT DEVELOPMENTPaul KyleJohnson County Community College
VICE PRESIDENT FOR RECORDS AND ACADEMIC SERVICESTina FalknerUniversity of Minnesota — Twin Cities
VICE PRESIDENT FOR FINANCEStan DeMerrittWayland Baptist University
VICE PRESIDENT FOR INFORMATION TECHNOLOGYJames BouseUniversity of Oregon
AACRAO BOARD OF DIRECTORS
COLLEGE and UNIVERSITYEducating the Modern Higher Education Administration Professional
Analysis, Commentaries, Campus Viewpoint, Surveys, International Resources, and Book Reviewsforum
Be a Pine Tar RegistrarBY RICHARD MORRELL
Creating Traditions of CollaborationBY JERRY ROSS, LESLEY COT-TRELL, AND MELANIE STIMELING
Managing ChaosBY KARL E. BURGHER AND MICHAEL SNYDER
Eastern Dreams: Alternative Pathways for Chinese Students Pursuing Baccalaureate Degrees in the United StatesBY LINDA SERRA HAGEDORN AND JIAYI HU
Paying for the Party: How College Maintains InequalityREVIEWED BY MATTHEW FIFOLT
The College Fear Factor: How Students and Professors Misunderstand One AnotherREVIEWED BY MATTHEW FIFOLT
57 61 75 83
COMMENTARYCAMPUS VIEWPOINT
RESEARCH IN BRIEF
BOOK REVIEWS

for College and UniversityWrite
Founded in 1910, the American As-sociation of Collegiate Registrars and Admissions Officers (AACRAO) is one of the nation’s oldest and largest higher education associations. Widely re-garded as the leading authority on the emerging field of enrollment manage-ment, the association is a recognized
source of information on student admissions, academic records, technology solutions and international education.
In addition to its professional development offerings, AACRAO serves as an independent advocate for the collegiate sector on a broad range of policy issues in Washington, D.C. The Asso-ciation’s policy agenda is founded on the principles of academic autonomy, access and accountability.
W All rights reserved. AACRAO is a registered trademark. Use, reproduction, copying or redistribution of the AACRAO logo is strictly prohibited without written permission from AACRAO.
W AACRAO adheres to the principles of non-discrimination without regard to age, color, handicap or disability, ethnic or national origin, race, religion, gender (including discrimina-tion taking the form of sexual harassment), marital, parental or veteran status, or sexual orientation.
W AACRAO does not endorse the products or services of any advertiser. The advertiser assumes responsibility and liability for the content of any advertising.
W The articles published in College and University do not reflect the opinions or positions of the Association.
POSTMASTER: Send address changes to College and University, One Dupont Circle, NW, Suite 0, Washington, DC 00-11. Copyright © 008 American Association of Collegiate Registrars and Admissions Officers.
College and University (USPS 110) is published four times a year by the American Association of Collegiate Registrars and Admissions Officers, One Dupont Circle, NW, Suite 0, Wash-ington, DC 00-11. The cost of the publication is included in the AACRAO membership fee. For information on subscrip-tions and package rates, please visit www.aacrao.org/publica-tions/college_and_university_journal. Back issues are 0 each (price includes shipping). ISSN: 0010-0889.
INDEXES: College and University is indexed in Current Index to Journals in Education (ERIC), Education Index, Higher Educa-tion Abstracts and Contents Pages in Education.
What’s the best way to share your ideas, innovations, and opinions with registrars, admissions officers, and enrollment managers nationwide? Contribute to AACRAO’s prestigious College and University (C&U) quarterly journal.
Give your research and experience a voice by writing for the “Feature” section, or address best practices, how-tos, new technologies, the latest books, and other perti-nent topics in “The Forum” section. With a substantial circulation base, C&U is an excellent vehicle for shap-ing the profession and gaining recognition.
AACRAO members are especially encouraged to submit articles, but non-members, faculty, graduate students, and members of the corporate sector are also welcome to share their work. Authors will receive cop-ies of the issue in which their article appears, and will be issued an author honorarium.
For editorial procedures and manuscript preparation guidelines, visit <www.aacrao.org/write>.
Submit manuscripts, letters, and direct inquiries to:
Louise Lonabocker, C&U Editor-in-Chief, Director, Student Services, Boston College, Lyons 10, Chestnut Hill, MA 07; Tel: (17) –18; E-mail: lonabock [email protected]
Submit Forum articles (commentary, analysis, book reviews, and other non-refereed pieces) to:
Heather Zimar, C&U Managing Editor, AACRAO, One Dupont Circle, NW, Suite 0, Washington, DC 00; Tel: (07) 7–7; E-mail: [email protected]
What’s the best way to share your ideas, innovations, and opinions with registrars, admissions officers, and enroll-ment managers nationwide? Contribute to AACRAO’s
prestigous College and University quarterly journal.
Give your research and experience a voice by writing for the feature section, or address best practices, how-tos, new technologies, the latest books, and other pertinent topics in “The Forum.”
With a substantial circulation base, College and University is an excellent vehicle for shaping the profession and gaining recognition.
Heed the call and get involved! For submission criteria, visit us at www.aacrao.org/write or e-mail us at C&[email protected].
Call for Authors
A m e R i C A n A s s O C i A T i O n O F C O l l e G i A T e R e G i s T R A R s A n d A d m i s s i O n s O F F i C e R s
CUJ_PrintAd_2013Upd_gs.pdf 1 6/16/13 2:56 PM
J
JA
O
F
AM
N
M
SJ
D
Prov
idin
g A
ffor
dable
Access to Higher Education through Year-Round Operation
A Case Study in Public Higher Education

Prov
idin
g A
ffor
dable
Access to Higher Education through Year-Round Operation
College & University | 3
By John Buttermore, Eliott Baker, and David Culp
The public higher education landscape in the United States has changed significantly over the past several de-cades. The most widely publicized change has been the steadily decreasing percentage of operating revenues from state support. This issue has been thrust into public view by states’ assaults in recent years on public university bud-gets. Current economic conditions have brought state budgetary issues concerning education funding to the crisis stage, though public universities have been facing reductions in the percentage of funding from their states for some time. By now it is well known that state spending on corrections, entitlement programs, and state employee pension funds is diminishing its ability to support public higher and K–1 education (Tandberg 010).
The second change has been the increasing demand for access to public higher education. Altbach, Reisberg and Rumbley (009) report an enrollment increase from 000 to 007 of more than 0 million students globally in the eighteen to -year-old cohort. High school graduates, their parents, and nontraditional workers increasingly perceive a higher education degree as a ticket to success. Employment statistics bear this out: The Bureau of Labor Statistics reported in June 01 that the group includ-ing bachelor’s and higher degree holders had a seasonally adjusted unemployment rate of .1 percent compared to an overall civilian labor force unemployment rate of 1.
percent (U.S. Dept. of Labor 01). Yet increasing demand for access and increasing operating costs have caused the average tuition at private and public higher education in-stitutions to increase faster than the average inflation rate (Archibald and Feldman 010).
At a time when demand for access to higher education is at an all-time high, some regions are experiencing abso-lute decreases in population as well as demographic shifts in birth rates that negatively affect enrollment (Tucker 01). In addition, many states are reducing their level of support for higher education, with the result that tu-ition increases have become one of the only means left for balancing budgets. In many states where tuition rates are controlled by state legislatures, universities are increas-ingly pressed to match annual revenues with expenditures. Many institutions are seeking to raise revenues and cut costs where they can.
The purpose of this article is to examine the potential for public universities to utilize year-round operations for revenue generation and cost containment by increasing the number of courses offered during summer and winter sessions and thereby increasing overall enrollment. Two factors have inspired the increase in time-compressed courses: (1) the ability to develop online versions of exist-ing courses in order to improve access and () the iden-tification of practical ways to support classes with low
Time-compressed courses at state-supported universities have served a variety of
purposes. It has been traditional to set scheduling policies that would make
summer and winter sessions self-funding. They have not been viewed, however,
as potential enrollment generators. This is an opportunity that can no longer be
overlooked. This paper describes one state university’s efforts to enhance
enrollment through year-round operation. Although Slippery Rock University faces
unique constraints, much can be learned from its efforts.
College & University | 4
enrollment so more courses can be made available. This analysis is supported by a case study of Slippery Rock Uni-versity (SRU) of Pennsylvania’s movement toward year-round operation. SRU is one of fourteen state-owned institutions in the Commonwealth of Pennsylvania. To-gether, they make up the Pennsylvania State System of Higher Education (PASSHE). PASSHE is the tenth largest university system in the United States and the rd larg-est in the world, with a system-wide enrollment in 010 of nearly 10,000 students (PASSHE 011).
INNOVATIONS IN HIGHER EDUCATION
Because funding increases have become increasingly prob-lematic, some institutions have found innovative ways to produce more graduates without increasing their net costs. One of the more interesting approaches is at Brigham Young University–Idaho (BYU–Idaho), where a com-plete third (summer) semester was added to the traditional two-semester plus summer school model. Administrators enroll the same number of students in all three semesters. Faculty are compensated for the increased teaching load, but other added expenses are minimal. This has resulted in a -percent reduction in instructional costs per student, even taking into account increased faculty compensa-tion (Cota, Jayaram and Laboissiere 011). BYU–Idaho’s many innovations in course delivery, modular curriculum, and other areas are detailed in The Innovative University: Changing the DNA of Higher Education from the Inside Out (Christensen and Eyring 011).
A less complicated approach to increasing revenue is to find ways to increase summer school enrollments—and, more recently, to develop winter terms between the fall and spring semesters.
THE EVOLUTION OF TIME-COMPRESSED COURSES
In The American University in Summer Revisited, Schoenfeld (198) observes, “Among the more endur-ing American news media myths is the implication that each summer every college and university takes up the campus sidewalks, so to speak, not to rise until autumn.” Despite the widespread belief that very little happens on American campuses in the summer, 1,00 accredited col-leges and universities were already offering some type of summer session by 19. In 199, the U.S. Department of Education reported in its Institutional Characteristics
Survey that an estimated ,07 out of a total of ,800 U.S. higher education institutions had a summer term. Today, virtually every college and university offers some sort of summer program. This trend has also spread to England, Scotland, Canada, Australia, Mexico, and the Caribbean (Howard 00).
One of the longest-running debates over the use of time-compressed courses pertains to such courses’ aca-demic integrity. As long ago as 197, Glenn Frank, then president of the University of Wisconsin–Madison, said, “Six weeks was too short a time in which to produce any-thing of educational value” (Slichter 197). Despite the proliferation of the use of some variant of summer term, Howard (00) states, “Annual reports of summer pro-gram deans/directors consistently mention that they face challenges to academic excellence in the summer even as they are asked to meet the changing academic needs of learners in creative and innovative ways.” Howard (00) reports further that the annual meeting agendas of sum-mer session associations (for example, the Association of University Summer Sessions, the North Central Confer-ence of Summer Sessions, the North American Associa-tion of Summer Sessions, and the Western Association of Summer Session Administrators) always include topics related to the academic effectiveness of summer-term ses-sions. Nevertheless, time-compressed sessions at U.S. col-leges and universities continue to increase in scope as well as focus. This alone is fairly conclusive evidence that time-compressed programs have academic merit. One study of more than ,000 students found evidence of higher grades and increased learning in time-shortened courses (Austin and Gustafson 00). The researchers used matched sets of prerequisite and follow-on courses and then compared students’ performance in the follow-on course on the basis of their enrollment in a semester-long versus a time-compressed prerequisite course. Students who had enrolled in the time-compressed prerequisite courses earned significantly higher grades in the follow-on course compared to their peers who had taken semester-long prerequisite courses. Another study comparing the rigor of time-compressed courses to that of semester-long courses found that students enrolled in the latter studied more per credit hour per week but that the workload in any given class was more likely to be influenced by the in-structor and the subject than by the length of the course

College & University | 5
(Lutes and Davies 01). Other institutional surveys re-port students’ high level of satisfaction with the quality of their summer educational experience (Grobsmith 1997, Lee 1999).
The increase of time-compressed offerings has been fu-eled by demand as well as supply. During the past decade, student perceptions of their educational experiences have changed. As much as faculty and universities try to cre-ate lifelong learners, students today are very much career driven. Many students’ overriding question when they ar-rive on campus is “How soon can I get my degree?” This is especially true of the growing number of students in Penn-sylvania who are transfering from community colleges to four-year institutions. The pattern of attending school during a nine-month academic year and working during the summer has been replaced with year-round part- and even full-time employment. If students work year round, it is natural for them to also want to attend school year round. Summer and winter sessions provide the opportu-nity for students to complete their education sooner than they otherwise would be able to. This can save them money and get them to full-time employment sooner. Students also perceive time-compressed offerings as a solution to the peak load problems they encounter during the regular school year. Courses that quickly enroll to capacity and/or that have high enrollments may also be offered during summer and winter terms. Students may need to balance their school workload against their employment schedule during the traditional fall and spring semesters. Students may find other advantages in time-compressed offerings, such as the opportunity to enroll at an institution closer to home when their primary college is not in regular session; to complete graduation requirements without returning for an entire semester; or to take a course as an alternative to summer or holiday idleness.
On the supply side, the university has provided time-compressed terms for a variety of reasons. In many cases, offerings have been a response to student demand. If the university does not respond to this demand, then students will enroll elsewhere. Faculty perceive shortened terms as a way of supplementing their annual income and of reduc-ing their own boredom. Many colleges and universities use the opportunity to teach during summer or winter terms as a faculty recruitment tool. Time-compressed terms are also a way to use existing facilities and staff more ef-
ficiently, helping to offset the peak load problem. Rather than hiring more faculty and building more classrooms, existing resources can be utilized year round, spreading fixed costs over more units. The final benefit on the sup-ply side is the potential for additional revenue generation through increased enrollment. This potential has been greatly enhanced by the growing popularity of distance education. This is due in no small part to technological advances that have made the offering of classes through learning management systems (LMS) both efficient and cost effective.
ORGANIZATIONAL MODELS FOR TIME-COMPRESSED SESSIONS
Organizational models for time-compressed terms typi-cally are of three types: centralized, decentralized, and hy-brid. Demetrulias (00) describes a centralized model as a summer school program that is self-funded and admin-istered by an autonomous summer session office. Decen-tralized organizational structures are more distributive: state-funded summer-term functions are performed by various collegiate units with dispersed accountability. Hy-brid models typically are structured as centralized admin-istration with decentralized academic functions.
Although data indicate a general ten-year trend of in-creasing numbers of decentralized programs, the largest number of shortened sessions continues to be described as centralized organizational structures (Demetrulias 00). Johnson (000) studied the fiscal practices of doctoral re-search universities: 7 percent of those studied used an al-locative model to fund time-compressed terms; 8 percent funded such terms with self-generated income; and per-cent used a decentralized approach in which revenue was directed to the academic unit responsible for its generation.
SLIPPERY ROCK UNIVERSITY CASE STUDY: THE PROBLEM
SRU is located in a region of the country experiencing both stagnant population growth and a demographic shift in birth rates that has negatively affected high school graduation rates (Tucker 01). Traditionally, graduating high school seniors have represented the most important pool of potential SRU students. With this population de-creasing, the university needed to identify other means of maintaining or increasing enrollment and credit-hour

College & University | 6
production. One solution was to increase the number of courses available during summer and winter terms. How-ever, two important issues had to be resolved in order to do so: First, more online offerings had to be identified. Second, courses with low enrollments had to be offered economically. How SRU met these two challenges is the focus of this case study.
Increase Online Offerings
PASSHE system administrators recognized the impor-tance of developing online courses and realized as well that the pedagogical differences between face-to-face and on-line classes meant that significant work had to be done to effect such a change. PASSHE faculty were offered a one-time “development fee” to create and teach the first sec-tion of an online version of a course. Faculty responded to the incentive enthusiastically, with the result that a signifi-cant number of courses began to be offered online. In fact, SRU’s winter session (during the traditional break between fall and spring semesters) comprises only online courses.
SRU developed a training and certification program to help faculty migrate courses from a traditional class-room setting to a virtual environment and to familiarize them with the differences between online and face-to-face learning. The campus’s Center for Excellence in Teaching and Educational Technology administers the three-week online program. Faculty learn pedagogy and rudiments of course design and implementation specific to online deliv-ery. Faculty must complete this certification successfully before they may teach an online or hybrid (i.e., partially delivered online) course.
Slippery Rock University prides itself on being a pre-mier residential university. For this reason, it limits the use of online instruction to special programs and the summer term and winter session. PASSHE contracts with a learn-ing management system provider that provides a course shell for all academic offerings. The collective bargaining agreement (CBA) with the faculty union includes specific language about faculty compensation for online teach-ing. The number of online or distributed education (DE) courses as a percentage of total university course offerings has increased rapidly over the past several years. Table 1 shows that in 009–10, 170 courses—or approximately percent of all undergraduate courses—were offered on-line; by 01–1, the number had increased to courses,
or . percent of all undergraduate courses. In just one year, winter-term courses (all DE) accounted for almost half as many courses as the number offered in the summer (8 compared to 10 in AY 01–1).
Overcoming Roadblocks to Low-Enrolled Courses
The organizational model for time-compressed sessions at SRU is a fairly complex hybrid model. The Office of Academic Records and Summer School administers the summer and winter terms. The executive director of aca-demic records, summer school, and graduate studies typi-cally makes recommendations concerning low-enrolled courses to the provost. The provost has final administra-tive authority regarding the number of courses offered campus-wide, how the academic unit will allocate them, and whether a specific course has sufficient enrollment for the course to be offered. A Summer School Advisory Committee assists the executive director in setting policy guidelines. The committee includes the executive director, an academic dean, and three faculty members.
Historically, the Office of Academic Records and Summer School used a formula as the basis for allocat-ing courses to academic units: An academic unit received one undergraduate course for every eighteen students enrolled in the unit’s courses the previous summer term. For graduate courses, the allocation number was twelve. The rationale was that summer school was to be self-sup-porting—that is, it was to generate sufficient revenue to pay for all additional summer contracts at the university. This included faculty teaching the courses, chairpersons’ non-teaching summer compensation, and any additional summer contracts at the discretion of the provost. Occa-sionally, other summer contracts were issued for a variety of non-instructional purposes. Winter courses are a rela-tively new phenomenon at SRU, having first been offered in 011. The data show that they have quickly become a significant part of SRU’s time-compressed course offerings.
Though not mandated by the CBA, an allocated course at SRU was considered ‘guaranteed’ once it was assigned to a faculty member to teach. This guarantee was independent of the course’s actual enrollment. In addition to guaranteed courses, each academic dean historically had also been given three courses to be allocated among academic units at his/her discretion. These additional courses were offered contingent on reaching enrollment of at least eighteen stu-

College & University | 7
dents. Not surprisingly, few contingency courses were suc-cessful because most high-enrollment courses were already built into the regular summer schedule.
SRU’s administrative model is decentralized as relates to the programmatic quality of summer offerings. Courses and programs to be offered during the summer term are subject to the same faculty-driven curricular approval process as fall- and spring-term offerings. Once a depart-ment chair receives a course allocation, he or she devel-ops a summer schedule based on student needs, program needs, and faculty availability. The allocation formula has a built-in incentive in that next year’s course allocation is dependent upon this year’s enrollments. Assuming a de-sire to at least maintain if not increase the department’s course allocation, summer offerings are often predicated more on student demand than on other program goals. In other words, the departments have always believed that summer school is about the numbers.
Two problems developed that encouraged the provost to direct the Summer School Advisory Committee to re-consider the historical procedure. First, summer school enrollments began to decrease. Anecdotally, this was at-
tributed to two factors: The first was a change in the num-ber of credit hours students are allowed to transfer from community colleges. SRU is bound by PASSHE and state guidelines regarding community college transfer credits. In an effort to make education more affordable to Penn-sylvania residents, the number of credits that can be trans-ferred from community colleges to PASSHE schools was increased from the first credit hours toward an under-graduate degree to an unlimited number. The only limits are that students must complete at least 8 credit hours of upper-level courses and take 0 of their last credit hours at the institution granting the degree. Students quickly re-alized that they could take the same courses offered dur-ing the summer term at SRU at a community college near their home—and for a lower price. Another reason for de-creasing summer enrollments at SRU was the availability of competing institutions’ online courses—courses that enabled students to work full time by not requiring that they attend class during part of the work day.
The second problem was the growing perception that summer courses were guaranteed once they were allocated. Out of concern for fairness, department chairs often at-
Table 1. Numbers and Percentages of Undergraduate Distance Education Courses
Offered at SRU Per Academic Year, 2006–07 Through 2012–13
Academic Year All CoursesAll DE Courses Winter DE Summer DE Winter/
Summer DE
n % n % n % n %
2006–07 3,469 78 2.2 0 0.0 21 0.6 21 0.6
2007–08 3,506 96 2.7 0 0.0 32 0.9 32 0.9
2008–09 3,572 158 4.4 0 0.0 61 1.7 61 1.7
2009–10 3,653 170 4.7 0 0.0 71 1.9 71 1.9
2010–11 3,745 184 4.9 0 0.0 93 2.5 93 2.5
2011–12 3,422 190 5.6 22 0.6 94 2.7 116 3.4
2012–13 3,603 235 6.5 48 1.3 105 2.9 153 4.2
Source: SRU Institutional Research

College & University | 8
tempted to provide an equal opportunity to teach during the summer to all faculty members in the department who wanted to do so. But with supply based on faculty equity and demand based on student preference, there was often a mismatch. Some courses enrolled significant numbers of students whereas others enrolled as few as two students. The provost scrutinized this practice as it became increas-ingly apparent that the institution was paying faculty to teach courses that did not generate sufficient tuition rev-enue to cover the instructor’s salary. During summer 008, the provost determined that courses were not guaranteed if no contract had yet been issued to the faculty member assigned to teach the course. The provost canceled several courses with low enrollments before the faculty contracts were issued. Department chairs, the faculty union, and faculty members teaching summer school reacted with concern to this significant departure from past practice.
THE SUMMER SCHOOL ADVISORY COMMITTEE RECOMMENDS POLICY CHANGE
In fall 008, the Summer School Advisory Committee met to discuss issues related to summer school. The committee determined that it would be helpful to know what pro-cedures the other thirteen PASSHE schools used. The ex-ecutive director of Academic Records and Summer School designed and forwarded a twelve-question survey to the person in charge of summer school operations at each PASSHE campus. Administrators at eight of the fourteen PASSHE institutions responded to the survey. (The survey questions and responses are summarized in the appendix.)
The survey results made it clear that there is little stan-dardization among PASSHE universities in the admin-istration of summer term. All eight of the respondent universities use a hybrid model with varying degrees of cen-tralized decision making. Only six of the eight institutions indicated that revenue generation was a concern when allocating summer classes. The survey results also helped clarify that the presence of a faculty union is significant.
After reviewing the survey results, the Summer School Advisory Committee made several recommendations to the provost. The first was to change the course allocation formula. Rather than base course allocation by academic unit on the previous year’s cumulative summer enrollment divided by eighteen for undergraduate courses and by twelve for graduate courses, the committee recommended
an immediate reduction of the divisors to sixteen under-graduates and ten graduates. This modest change resulted in an increase of courses across all academic units.
The second recommendation was to establish minimum enrollments of ten for undergraduate courses and eight for graduate courses in order for a course to be offered at full compensation. Going forward, no class would be consid-ered ‘guaranteed.’ For any course not meeting the minimum required enrollment, the provost would have the option of canceling the course, prorating payment according to a per-capita compensation plan (referred to as Article 7 of the CBA), or offering the course as individualized instruction. (Article 7 states that faculty receive approximately 7 per-cent of the tuition revenue generated by the course up to a maximum of 1 percent of the overload rate as defined by the CBA.). The committee’s final recommendation was that academic deans should continue to be given three courses that could be allocated among the academic units in their area. These courses would be offered contingent on reach-ing the threshold enrollment of sixteen for undergraduate courses and ten for graduate courses. After the committee secured the faculty union’s endorsement of the proposal, the provost accepted the recommendations.
Winter Session
For the first time in its history, SRU moved to year-round operation with the offering of a winter session in 011. Course offerings were limited to only those courses that had previously been offered online. Faculty compensa-tion was provided according to Article 7 (which pays the faculty member 7 percent of the tuition). The revenue-generating potential of the winter session was clear: The university would bear no operating cost because teaching and learning would be conducted online and the univer-sity would receive a set amount of the revenue generated. In the inaugural 011 winter session, a total of 1,1 under-graduate credit hours were generated; in 01, the number more than doubled—to ,799 undergraduate credit hours. Early enrollment data for 01 indicated a 0 percent in-crease from winter session 01.
Data Analysis
Tables and present the undergraduate enrollment headcount for the past seven academic years and the un-dergraduate credit-hour production over the same period.

College & University | 9
Initially, there was concern that the elimination of guaranteed courses might result in some classes not be-ing offered, with the result that enrollment and credit-hour production would suffer. This was a concern both in terms of potential lost revenue and lost opportunities for students to take courses during the summer. In summer 009, after the changes in policy were made, headcount enrollment increased by 19, and the number of credit hours increased by 1,0—more than 7 percent higher
than the previous year. In summer 010, headcount enroll-ment decreased by 9 students, but the number of credit hours increased by more than 0—a 1. percent increase. In 011—the first year SRU offered a winter term—com-bined summer and winter headcount increased by more than 00 compared to the previous year’s summer-only headcount, and credit-hour production increased by 7 hours—a percent increase. In 01, combined headcount increased by 8 students, and credit-hour production in
Table 2. Undergraduate Enrollment Headcount at Slippery Rock University,
Academic Years 2006–07 through 2012–13*
Academic YearFall and Spring Combined Summer Session Winter Session Academic
Year Totaln % n % n %
2006–07 14,758 86 2,667 15.5 0 0.0 17,245
2007–08 14,703 84 2,767 15.8 0 0.0 17,470
2008–09 14,908 83 3,005 16.8 0 0.0 17,913
2009–10 15,310 83 3,200 17.3 0 0.0 18,510
2010–11 15,556 83 3,105 16.6 0 0.0 18,661
2011–12 15,428 81 3,270 17.2 365 1.9 19,063
2012–13 15,209 80 3,087 16.2 796 4.2 19,092
* Enrollment headcounts are based upon total registrations and may be duplicated.Source: SRU Institutional Research
Table 3. Undergraduate Credit-Hour Production at Slippery Rock University,
Academic Years 2006–07 through 2012–13**
Academic YearFall and Spring Combined Summer Session Winter Session Academic
Year Totaln % n % n %
2006–07 208,718 94 13,227 6.0 0 0.0 221,945
2007–08 212,876 94 13,504 6.0 0 0.0 226,380
2008–09 215,840 94 14,348 6.2 0 0.0 230,188
2009–10 220,571 93 15,390 6.5 0 0.0 235,961
2010–11 225,204 94 15,553 6.5 0 0.0 240,757
2011–12 224,155 93 14,849 6.2 1,231 0.5 240,235
2012–13 221,053 93 13,918 5.9 2,799 1.2 237,770
** Credit hour totals are by student level, not course level.Source: SRU Institutional Research

College & University | 10
the time-compressed terms increased by 7 hours—a percent increase overall.
Traditional fall and spring enrollment and credit hours peaked in 010–11 and have decreased approximately per-cent in the past two years. The increase in enrollment from summer and winter over the same period has offset the headcount decrease during the traditional instructional terms, and the decrease in total credit-hour production over the two-year period has been mitigated to -1. percent.
SUMMARY, CONCLUSIONS, AND RECOMMENDATIONS FOR FUTURE RESEARCH
The evolution of year-round operation at U.S. colleges and universities has been a steady, if not somewhat slow, process. Forces of both demand and supply have over-whelmed long-stated concerns about the academic qual-ity of courses taught in condensed time periods, but recent studies suggest that students’ knowledge retention is greater following shorter rather than traditional-length courses. Summer and winter terms complement the life-style and meet the expectations of the current generation of college students. They also bolster faculty compensa-tion and enable more efficient use of facilities and staff. Perhaps most important, year-round operation offers the prospect of sustainable revenue centers—something most institutions badly need in today’s economy. The preceding analysis indicates that a hybrid model for inter-sessions best supports fiscal efficiency. The SRU case study high-lights explicit policy changes implemented by one institu-tion in order to maximize course offerings. This optimally serves the needs of today’s students and enhances revenue.
Distance education poses both an opportunity and a threat with regard to institutions’ year-round operation. The majority of students continue to prefer face-to-face education during the ‘regular’ school year, but they seem to feel differently about inter-session terms. Students are comfortable with technology and seek the freedom both to accelerate their work and to take online courses during the summer and winter breaks. Indeed, online courses are exceptionally well enrolled and appear to be the future of summer and winter offerings. Student demand is there. On the supply side, those who are concerned about the aca-demic quality of the shorter inter-session term are doubly concerned about the quality of online courses in a com-pressed time frame. Market forces win: If one institution
does not make online courses available between semesters, then others will. Institutions that offer such courses inter-nally retain control over their quality. It is worth noting that accreditation agencies will focus increasingly on assess-ing the learning outcomes of online inter-session courses.
This case study describes one institution’s somewhat modest attempts to convert summer school and winter session into revenue centers. Given the precarious fiscal climate in which higher education finds itself, it is impera-tive that institutions do everything possible to contain costs and to enhance revenues. At least initially, SRU has helped minimize the impact of decreasing enrollments by adopting online courses and adding a winter term; it has even implemented an innovative faculty compensation model that doesn’t penalize faculty or students for courses with low enrollments.
With the creation of both the summer and winter ses-sions, new programs have been developed that only offer classes in these two terms. These new programs are often-times geared toward educators who have time off in late De-cember/early January and summers. In addition, by offering courses only in these two terms, the university has been able to reduce the risk of losing money on under-enrolled sec-tions, because regardless of the enrollment, the university is assured of making one-third of the total tuition revenue for each course through Article 7 of the CBA.
Opportunities for further research include exploring student motivations and decisions with regard to summer versus winter terms. Are students substituting winter for summer courses? After only two years, data at SRU sug-gest that students in fact may be replacing summer- with winter-term courses. (See Table : summer enrollments decrease as winter enrollments increase). A survey de-signed to elicit information about students’ intentions may enable greater understanding of this behavior. Now that year-round schedules are facilitated by technology, are students motivated to graduate in fewer than four years? Several accelerated degree programs being devel-oped at SRU make use of fall, winter, spring, and summer terms. Will a shift toward year-round operation increase graduation rates? Some programs are considering com-bining undergraduate and graduate degree programs and allowing students to complete the degrees in a shortened timeframe. Is that practical? These are just a few of the questions that have begun to arise as a result of our brief

A m e r i c A n A s s o c i A t i o n o f c o l l e g i A t e r e g i s t r A r s A n d A d m i s s i o n s o f f i c e r so n e d u p o n t c i r c l e , n W , s u i t e 5 2 0 , W A s h i n g t o n , d c 2 0 0 3 6
www.aacrao.org/bookstore
To order these and other AACRAO publications, call (301) 490-7651 or visit us on the Web at www.aacrao.org/bookstore.
Featuring Recent Additions to the AACRAO Publications Library
in printLeadership Lessons: Vision and Values for a New Generation
AACRAO’s Professional Development Guidelines for Registrars: A Self-Assessment
For nearly 40 years, AACRAO has pub-lished the Self-Assessment, and this 185-page update will provide a cost effective and simple way to evaluate your office operations by stimulating thought, encouraging self-reflection, and evaluating policies and procedures. The Assessment is arranged by topical
area with chapters addressing most basic registrar functions. Within each chapter are Basic Principles, which provide a foun-dation for the discussion topic and guide the development of the questions that follow. The questions give direction, evoke thought, and allow for a variety of approaches to a given topic. Action Plan items are provided to expand your expertise and allow more in-depth study of a topic. Finally, a Further Reading section has been added to the end of each chapter to direct the reader to useful resources on the topics discussed.
ITem #0136 | $50 memBeRS | $70 NONmemBeRS ITem #0133 | $70 memBeRS | $95 NONmemBeRS
If the finest voices in higher education were gathered together in one room to discuss leadership, what would you learn? Leadership Lessons: Vision and Values for a New Generation took that notion to create a compilation of 22 articles on the topic of leadership, written by today’s leaders in higher education. Filled with unique kernels of wisdom, each chapter
shares the authors’ visions and values in ways that inspire, motivate, and illustrate how to be an exceptional leader. Au-thors include many who have worked in the registrar’s office for decades to others with varied backgrounds in theater, stu-dent activism and German literature. This is a book you will want to share with colleagues, friends and employees; all of whom will benefit from the lessons learned by these remark-able, wise and fascinating professionals.

College & University | 12
experience of year-round operation. We are anxious to ex-plore this new model of operation further.
REFERENCESAltbach, P., L. Reisberg, and L. Rumbley. 009. Trends in global higher
education: Tracking an academic revolution. UNESCO World Confer-ence on Higher Education 2009, UNESCO, Paris. 9–11.
Archibald, R., and D. Feldman. 008. Why do higher education costs rise more than prices in general? Change. May–June: –1.
Austin, A. and L. Gustafson. 00. Impact of course length on student learning. Journal of Economics and Finance Education. (1): –7.
Christensen, C., and H. Eyring. 011. The Innovative University: Chang-ing Higher Education from the Inside Out. San Francisco: Jossey-Bass.
Cota, A., K. Jayaram, and M. Laboissiere. 011. Boosting productivity in U.S. higher education. In McKinsey Social Sector Practice. New York: McKinsey & Co. –7.
Demetrulias, D. 00. From self-supported administration of summer programs: The California state university’s conversion to year round education. Summer Academe. : 7–.
Grobsmith, E. S. 1997. Report on 199 summer session student satisfac-tion survey. Summer Academe. 1: 7–.
Heikel, K. 000. Centralized vs. decentralized university summer session programs: Examining the Continuum. Summer Academe. : –.
Hentschel, D. 1991. The hybrid model for implementing the continuing education mission. Continuing Higher Education Review. (): 1–17.
Howard, M. 00. Summer at North American universities and colleges: Impacts and influences. Summer Academe. : 1–8.
Johnson, J. K. 000. The economic management of summer session: Fis-cal practices at research universities. Summer Academe. : 7–.
Lee, R. 1999. A comparison of student expectations before and after at-tending summer session. North Central Conference of Summer Ses-sions, 0th Annual Proceedings.
Lutes, L., and R. Davies. 01. Comparing the rigor of compressed format courses to their regular semester counterparts. Innovative Higher Edu-cation. 8(1): 19–9.
What is the process involved in making summer course alloca-tions, and who is responsible for course allocation to academic departments? At least five of the eight respondents indi-cated that historical or previous enrollment trends played a significant role in allocations. One institution indicated that a department’s summer schedule is dependent on fac-ulty desire to teach. The other two respondents indicated that each academic dean makes his own decision about allo-cations. Most respondents indicated that they have a fairly centralized process for course allocation and a decentralized process for determining what is taught and who will teach.
Are summer courses guaranteed regardless of enrollment? Three institutions indicated that courses were guaranteed regardless of enrollment, and three indicated that courses were not guaranteed. One institution indicated that a course is guaranteed dependent on it having minimum en-rollment by a specific date. The last institution indicated that it guaranteed only certain courses.
Must a course reach a specific minimum enrollment in order to be offered, and, if so, what is that level? Four of the eight respondents indicated that a minimum enrollment was required. Of these, only one had a specific minimum enrollment (twelve for undergraduate courses and seven
for graduate courses); the other three indicated that the minimum changes from year to year.
Do faculty teach courses with low enrollments at a reduced salary, or are such courses canceled? All of the respondents indicated that they either did not have this option, or they allowed instructors to teach the course as an independent study (if warranted).
When are low-enrollment courses canceled, and who makes the decision to do so? This question applied only to the five institutions that do not have a guaranteed course policy. Of those, the decision to cancel is made at a pre-determined date. The process varies by institution, but in each case, the academic deans are heavily involved.
What are the minimum enrollments required for contin-gency courses? Two institutions repeated that they offer only guaranteed courses. One institution indicated that it of-fered guaranteed courses but that each academic dean could allocate additional contingency courses to departments. Such courses must achieve enrollment of at least sixteen un-dergraduates or ten graduate students or they are canceled. A fourth institution indicated that its courses must enroll at least seventeen undergraduates or twelve graduates prior to May 1 in order to be considered guaranteed; otherwise,
APPENDIX: Summary of Summer School Survey

College & University | 13
PASSHE. See Pennsylvania State System of Higher Education.Pennsylvania State System of Higher Education. 011. PASSHE Fact Book
2010–11. Retrieved from: <www.passhe.edu/inside/research/Docu-ments/FactBook 010–011.pdf>.
Schoenfeld, C. 198. The American university in summer revisited. In Ed-ucation in Summer: 100 Years at UW–Madison, edited by H.E. Samson et al. Madison, WI.
Slichter, C. 197. Debunking the master’s degree. Journal of the Association of American Universities. XXVII: 107–111.
Tandberg, D. 010. Politics, interest groups and state funding of higher education. Research in Higher Education. 1(): 1–0.
Tucker, C. 01. Pennsylvania Population Projections: Background Re-ports, Fertility, Mortality and Migration. University Park, PA: Penn State University.
U.S. Department of Labor, Bureau of Labor Statistics. 01. Employment status of the civilian population years and over by educational attain-ment. Retrieved from: <www.bls.gov/news.release/empsit.t0.htm>.
About the Authors
JOHN BUTTERMORE is an Assistant Professor at Slippery Rock University’s School of Business. He teaches management and marketing courses and functions as the accreditation coordinator for the department. Prior to joining SRU, Buttermore held senior executive positions in the consumer products packaging industry. He earned his bachelor’s degree in econom-ics at West Virginia University, his MBA at Seton Hall University, and his doctorate in higher education at Indiana University of Pennsylvania. His research interests include challenges to higher education, business cur-riculum, and business process analysis. John can be reached at [email protected].
ELIOTT G. BAKER is Executive Director of Academic Records, Summer School and Graduate Studies at Slippery Rock University. He holds a bachelor’s degree in secondary education–English and a master of educa-tion degree in secondary education from Springfield College. His interests lie in higher education law. He has presented at AACRAO meetings and has contributed to AACRAO publications on the Solomon Amendment, FERPA, and Student Right to Know. He is a past president of the Middle States Association of Collegiate Registrars and Officers of Admission. In 2010, Eliott received Slippery Rock University’s President’s Award for Out-standing Service. Eliott can be reached at [email protected].
DAVID CULP is Chairperson of the School of Business at Slippery Rock Uni-versity. He received his Ph.D. in economics from Southern Illinois Univer-sity in 1996. His current research interests are in the areas of building the sustainable business curriculum and the role of online instruction in the residential university setting. Dave can be reached at [email protected].
they are contingency courses. The other institutions did not specify any minimum enrollment for contingency courses.
Is Article 27 of the CBA utilized in determining summer compensation? Article 7 of the current CBA allows insti-tutions to offer continuing education courses at off-cam-pus locations and to compensate faculty by paying them a percentage ( %) of the tuition revenue generated by the course. None of the eight respondents indicated that it had utilized Article 7 to determine compensation for faculty teaching traditional summer school offerings.
Are summer contracts utilized for work other than teach-ing? All respondents indicated that they use summer contracts for chairpersons’ compensation and for other non-instructional activities.
What type of maximization objective does the institution have in making summer school allocations? Four options were provided: profit maximization, revenue generation (but not necessarily profit maximization), break-even enroll-ment generation, and other. Four of the eight chose profit maximization but with the caveat of meeting the needs of students. Two chose revenue generation (but not necessar-ily profit maximization). One chose break-even enrollment generation. The last chose “other,” indicating that the aca-demic deans are charged with meeting a net revenue target.
What cost or non-cost constraints, other than faculty sala-ries, are considered when making summer school allocations? Five of the eight either did not respond or indicated that they did not take into account any other constraints. One institution reiterated the need for each dean to meet a net revenue target. One institution mentioned additional in-structional costs such as equipment or field trips. The re-maining institution indicated that it requires departments to distribute summer teaching on an equitable basis.
How does the institution determine the break-even point or necessary profit margin for each class considering differ-ences in faculty salaries? One institution indicated that each department reviews overall versus individual courses. There is an incentive to make summer school profitable because 10 percent of the profit is returned to the depart-ment. Three respondents indicated that they use some type of spreadsheet analysis in making this decision. Two did not respond. One institution repeated its commit-ment to the faculty union not to cancel classes because of faculty salaries. The last respondent indicated that it does not use individual class profitability as a deciding factor.
How do non-curricular courses (workshops) fit in with sum-mer school offerings? Only one institution indicated that workshops play a significant role in overall summer offerings.
TCERESEARCH HAS FOUND THAT APPROXIMATELY ONE-THIRD OF UNDERGRADUATES
TRANSFER FROM ONE COLLEGE TO ANOTHER AND THAT TRANSFERRING IS BECOMING
INCREASINGLY COMMON. IN THIS STUDY, THE AUTHORS FOCUS ON THE TRANSFER
CREDIT PROCESS, RESEARCHING HOW ACADEMIC CREDIT IS EVALUATED AND WHEN
IN THE ENROLLMENT PROCESS STUDENTS RECEIVE A DEGREE-SPECIFIC TRANSFER
CREDIT EVALUATION. THE AUTHORS UNDERTAKE A COMPARATIVE CASE STUDY OF
SIX PRIVATE, NONPROFIT, FOUR-YEAR COLLEGES IN NEW YORK STATE—THREE THAT
PROVIDE “EARLY” TRANSFER CREDIT EVALUATIONS (THOSE GIVEN PRIOR TO THE
STUDENT’S REQUIRED ENROLLMENT DEPOSIT) AND THREE THAT PROVIDE “LATE”
TRANSFER CREDIT EVALUATIONS (THOSE GIVEN ONLY AFTER THE REQUIRED
ENROLLMENT DEPOSIT). THE AUTHORS ENCOURAGE INSTITUTIONS TO PROVIDE ALL
ADMITTED TRANSFER STUDENTS A DEGREE-SPECIFIC TRANSFER CREDIT EVALUATION
PRIOR TO REQUIRING THEIR ENROLLMENT DEPOSIT; SUCH INFORMATION IS ESSENTIAL
FOR TRANSFER STUDENTS TO MAKE AN INFORMED ENROLLMENT DECISION.
Transfer Credit Evaluations
TCECollege & University | 15
By Alexander P. Ott and Bruce S. Cooper
THE PROBLEM
For a student transferring from one college to another—as from a community college to a four-year college—transfer credit represents time and money (Bell 00). It repre-sents the time and money the student spent earning credit up to the point of transferring as well as the time and money that will be required to complete a degree at the college to which she transfers. Given the value of transfer credit, students are advised to use transfer credit accep-tance and credit applicability to intended degree as fac-tors in their decisions regarding which four-year college to attend (Dunn 00; Gonsher and Halberstam 009; Silver 009; Stainburn 011).
Unfortunately, many colleges provide degree-specific transfer credit evaluations only after students commit to attend the institution by making a nonrefundable de-posit—typically of several hundred dollars—to hold their place in the incoming class (American Association of Col-legiate Registrars 001; Ashby 00; Knoell and Medsker 19; Stainburn 011). Colleges that require a financial
commitment from students before providing a degree-specific transfer credit evaluation are essentially telling transfer students, “Buy now! We’ll tell you later what it will actually cost you.”
Difficulties in the transfer process take on heightened significance as a result of the prevalence of transfer stu-dents in undergraduate higher education in the United States. The National Center for Education Statistics fol-lowed a nationally representative sample of college stu-dents for six years, beginning with their initial enrollment, and found that percent of the students transferred from their initial institution to another (Berkner, He and Cataldi 00). Other studies have found the total transfer student percentage to be much higher, depending on how “transfer student” is defined (Handel and Williams 01). Thus, transfer-related difficulties—such as not receiving transfer credit evaluations in a timely fashion—could af-fect between one-third and one-half of students who pur-sue a college degree.
Transfer Credit EvaluationsHOW THEY ARE PRODUCED, WHY IT MATTERS, and HOW TO SERVE STUDENTS BETTER

College & University | 16
Not only are transfer students a significant percent-age of the total undergraduate population in the United States, but the percentage is increasing (Adelman 00, Cutright 011, Jacobs 00b, McGlynn 00). The Spell-ings Commission notes that “more students than ever be-fore have adopted a ‘cafeteria’ approach to their education, taking classes at multiple institutions before obtaining a credential” (U.S. Department of Education 00, p. xiii). A recent report on transfer students notes that the “tra-ditional” full-time, eighteen to -year-old students who attend a single college for four years “no longer dominate college classrooms” (Center for American Progress 011, p. ). This increase in the percentage of transfer students may relate to the growing financial incentive associated with attending community college prior to transferring to a four-year school (Gonsher and Halberstam 009; Mc-Glynn 00).
Public two-year colleges are the “most likely post-secondary entry point for economically disadvantaged students, minority students, and first-generation college
attendees” (Gutierrez 00, p. 199). Transfer students from community colleges thus are more likely to be lower income and members of a minority group than are stu-dents who begin their college studies at a four-year insti-tution (Bowen, Chingos and McPherson 009; Chang, Altbach and Lomotey 00; Cuseo 00; McPhee 00). As a result, difficulties in the transfer of credit—including the practice of withholding the degree-specific transfer credit evaluation until a student makes a nonrefundable enrollment deposit—negatively affect those who are al-ready at a disadvantage in their pursuit of a college degree.
PURPOSE OF THE STUDY
The purpose of this study is to investigate, analyze, and compare early and late transfer credit evaluation processes at six private, nonprofit, four-year colleges in New York State. For the purposes of this study, a college that pro-vides a degree-specific transfer credit evaluation to a stu-dent before requiring an enrollment deposit has a process characterized as “early.” In contrast, a college that requires
For more sem-related titles and inFormation on aaCrao Consulting serviCes, visit www.aaCrao.org
The SeM AnThologyA compilation of 29 articles, originally appearing in AACRAO’s SEM Monthly, chronicling enrollment management concepts, challenges, and successes at campuses nationwide.
SeM And InSTITuTIonAl SucceSSProposes an innovative student-centric SEM planning model aimed at helping institutions improve enrollment and financial outcomes while advancing student access and success.
SeM: TrAnSforMIng hIgher educATIonProvides a roadmap for the required paradigm shift, building on the solid foundation of prior SEM practice and offering insights to new approaches that will lead to sustainable SEM efforts into the future.
ApplyIng SeM AT The coMMunITy collegeIdentifies the vital and unique enrollment issues confronting two-year colleges and suggests effective strate-gies for resolving them.
MAnAgIng for ouTcoMeSTransforms process-oriented managers into successful outcomes-oriented leaders.
BASIc guIde To enrollMenT MAnAgeMenTAn in-depth primer on understanding and applying SEM best practices—a handy reference for newcomers as well as seasoned enrollment managers.
SeM In cAnAdADescribes how Canadian colleges and universities are using SEM to improve student and institutional outcomes.
The Complete SEM Solution. strategic enrollment management know-how from the most respected leaders in the field
American Association of Collegiate Registrars and Admissions Officers

College & University | 17
a student to make an enrollment deposit before it provides a degree-specific transfer credit evaluation has a process characterized as “late.”
LITERATURE REVIEW
No literature was found that focuses primarily on the transfer credit evaluation process and its effectiveness for students. Further, no literature examines the transfer credit evaluation process from the perspective of those who participate in the process—e.g., transfer admission counselors, transfer credit evaluators, and transfer aca-demic advisors. Given the relative paucity of research in this area, this brief review of the literature focuses primar-ily on the theoretical justification and process orientation of the present study. We then summarize several key areas of transfer research that relate to transfer credit evaluation processes and that provide key variables for this study.
Theoretical Justification and Process Orientation
This study was motivated by a concern that transfer stu-dents may not always be treated fairly and equitably dur-ing the transfer process. John Rawls’ (1971) social justice theory provided the theoretical justification for this concern, grounding the study in a philosophical concep-tion of social justice. In Rawlsian social justice, equality of opportunity is essential to creating a truly just society. Because education is linked with social and economic op-portunities (see, for example, Baum, Ma and Payea 010; Schultz 191; U.S. Department of Education 00), bar-riers to education—including lack of clarity regarding transfer credit—undermine opportunity. Further, transfer students often must overcome social and economic disad-vantages given that they are more likely than traditional students to be from a minority group, to be first-gener-ation college students, and to be poor (Bowen, Chingos and McPherson 009; Cuseo 00; McPhee 00).
Although the motivation for this study was justice for transfer students, the study itself focused on processes—specifically, transfer credit evaluation processes at six colleges. Robert Birnbaum’s (1988) application of bureau-cratic theory to colleges (characterized here as “collegiate bureaucratic theory”) was particularly helpful. Birnbaum (1988) focuses on issues that seem likely to arise in a study of process: Where on the organizational chart does the process fall? What is the division of labor in the process?
Who has final authority in the process? What is the stan-dard operating procedure for the process? These questions are classically bureaucratic (Birnbaum 1988) and are likely to apply to the transfer credit evaluation process.
The theoretical frameworks provided by Rawls (1971) and Birnbaum (1988) played essential roles in orienting this study: Rawlsian social justice provided the overall frame-work for the importance of the study; Birnbaum’s bureau-cratic theory provided an important perspective on the transfer credit evaluation process itself, helping the research-ers understand and illuminate the elements of the process.
Transfer Literature
The literature on collegiate transfer issues dates to the 190s, when researchers began to focus on transfer stu-dents’ experience as they transitioned from two- to four-year institutions (Knoell and Medsker 19). Although this early research did not identify the acceptance of trans-fer credit and the transfer credit process as significant is-sues, subsequent research elevated the importance of these topics. Transfer credit acceptance took on some political importance in the 00 congressional debate over the reauthorization of the Higher Education Act (Dervarics 007) as the Government Accountability Office under-took a major study of the acceptance of transfer credit in relation to college accreditation (Ashby 00). Transfer credit acceptance is described (though at times tangen-tially) in the literature on transfer articulation (Roksa and Keith 008). The transfer advising and counseling literature sometimes addresses transfer credit acceptance and transfer credit evaluation, though again, often only tangentially (Bell 00; Gordon and McDonald 00; Marling and Jacobs 010). Some scholarship on technol-ogy in the transfer process has explored the transfer credit process (Holaday and McCauley 00) but with a focus on new technology and not on the people involved in the process or the process itself.
Even though little of the research reviewed directly ad-dressed the topic of this study, it nevertheless helped the researchers better understand the topic and identify vari-ables that relate to the transfer credit evaluation process. All of the variables in the study—bureaucratic structure, technology, personnel, articulation agreements, policy, and quality of transfer student service—were derived from the literature.

College & University | 18
RESEARCH DESIGN AND METHODOLOGYThis study compares colleges that have effective transfer credit evaluation processes with those that have ineffec-tive processes. The researchers chose the six colleges for the study carefully, purposely selecting three with effective processes and three with ineffective processes. Effective processes are defined as those that provide the degree-specific transfer credit evaluation to a prospective student early—i.e., before the student is required to provide an enrollment deposit. Ineffective processes are those that provide the degree-specific transfer credit evaluation to a prospective student late—i.e., only after the student pro-vides a deposit. Ineffective processes deprive students of information that is essential to their making an informed choice about which college to attend; they constitute a violation of Rawlsian social justice.
The central research question in this study is as follows: How do effective transfer credit evaluation processes dif-fer from ineffective transfer credit evaluation processes? Implicit in this question are the following two questions: What common themes, if any, exist among effective pro-cesses? What common themes, if any, exist among ineffec-tive processes?
In order to answer the research question, this study focuses on six variables related to the transfer credit evaluation process. Five of these variables—bureaucratic structure, technology, personnel, articulation agreements, and policy—relate to how and why the process functions as it does and potentially play a role in the effectiveness of the process. The last variable, quality of transfer student service, is an outcome of the transfer credit evaluation process. One premise of this study is that students who re-ceive the transfer credit evaluation late are disadvantaged because they receive degree-specific transfer credit infor-mation only after they submit their deposit. One could reasonably expect these students to be frustrated with the transfer credit process and to communicate their frustra-tion to staff (e.g., transfer professionals) who are involved in the process.
The research design reflects the likely relationships among the variables in this study. (See Figure 1.)
Data Collection and Sample
This study relied on three main data sources: interviews, document review, and a focus group. As Berg (009)
points out, using multiple forms of data to verify findings improves studies by allowing researchers to “obtain a bet-ter, more substantive picture of reality” (p. ). Interviews are the most common qualitative research technique (King and Horrocks 010) and were the main source of data for this study. Documentary evidence is “likely to be relevant to every case study topic” (Yin 009, p. 101) and plays an important role in this study by supporting its rationale and providing evidence that corroborated inter-view data. Focus groups can play many roles in qualitative research, including that of reviewing data gathered from other sources (Berg 009), as in this study. The findings of this study were stronger than they would have been had only one method been used.
For the interviews, two participants (usually a transfer admission counselor and a transfer credit evaluator) were chosen from each of the six colleges in the study. Consis-tent with qualitative research practices, these participants were chosen purposefully because they were likely to pro-vide rich data as a result of their involvement in the pro-cess that was the focus of the study (Yin 009). All play a role in the transfer credit evaluation process (Holaday and McCauley 00), making them more likely to have valuable insights into the process and its effects on transfer students. The interviews were focused (Yin 009)—also known as semistandardized (Berg 009) or semistructured (King and Horrocks 010)—in that the questions were prepared in advance (though they may be reordered dur-ing the interview).
Three categories of documents were identified to serve as a source of data for this study: The first includes official college print publications—primarily college catalogs and transfer-oriented admission brochures that might include information about transfer credit. The second category includes any type of publicly accessible, online material (including social media sites) produced by or directly re-lating to the college in the study. The third includes any college-produced paperwork (such as acceptance letters and actual transfer credit evaluations) targeted at indi-vidual transfer students.
Preliminary answers to the research question were for-mulated after collecting and analyzing data derived from interviews and documents. A focus group was convened to review summaries of the data and tentative conclusions. Focus group participants included transfer professionals

College & University | 19
from institutions that were not part of the study; their participation helped broaden the study beyond the six in-stitutions that were the primary focus of the research.
Data Analysis
Data were organized in four ways: First, the interview and document data were sorted by institution into a flowchart detailing the steps in the transfer credit evaluation pro-cess. Second, the interview and document data were orga-nized by institution into categories based on the variables in the study. Third, these data were compiled and analyzed by variable across institutions, both within and between the early and late categories. (See Table 1.)
The fourth and final level of data sorting and analy-sis involved the focus group’s review of the institutional flowcharts and the summary data across institutions by variable. The principles of collegiate bureaucratic theory (Birnbaum 1988) provided the focusing lens.
LimitationsThis qualitative comparative case study was limited by the role of the researcher in data gathering as well as by the rel-atively small number of private institutions that were in-vestigated. As a result of these limitations, two main issues arise that are typical of qualitative research projects: (a) the potential for researcher bias; and (b) concerns about the generalizability of findings.
Because the researcher is “the primary instrument for gathering and analyzing data” in qualitative research (Mer-riam 1998, p. 0), the opportunity for researcher bias is significant. This potential for bias can be combated in sev-eral ways, including by collecting multiple forms of data “to obtain a better, more substantive view of reality”—a process called triangulation (Berg 009, p. ). Data for the present study were collected from three sources: inter-views, document analysis, and a focus group.
The issue of generalizability “has plagued qualitative investigators for some time” (Merriam 1998, p. 07). The
l FIGURE 1. Study Design
Early/Late Process
Quality of Transfer
Student Service
Bureaucratic Structure
Technology PersonnelArticulation Agreements
Policy

College & University | 20
question is whether it is possible to apply the findings from a single qualitative case study to a larger universe of somewhat similar cases. As part of the effort to address the concern about generalizability, a multi-case compara-tive study was used in this research project. Researching multiple cases and varying the characteristics of the cases demonstrate potentially greater applicability of findings (Bogdan and Biklen 007). That is, if a specific finding ap-pears in several cases, it is less likely to be an anomaly than if it were found in only one setting.
Despite using a multi-case study, the problem of gen-eralizability does not disappear, in part because the re-searchers must decide which cases to include and which to exclude. Deciding to exclude certain cases undermines the ability to expand from the findings to a broader group of cases. For example, in this research study, the researchers chose to limit the study to private, nonprofit institutions of relatively low admission selectivity. Public institutions were intentionally omitted, as were more selective insti-
tutions. These choices were logical given that public and more selective institutions have very different enrollment needs than do private, nonprofit institutions of relatively low selectivity, but they do limit the potential applicabil-ity of the study’s findings.
The associated limitations of bias and concerns about generalizability remain, despite steps taken to mitigate them. Researchers and readers alike should be aware of these limitations when reviewing the findings and decid-ing how and even whether to apply them to other cases.
FINDINGS AND ANALYSIS
Of the variables in this study, only two divided exactly between early and late institutions: quality of transfer ser-vices and policy. That is, only in these two areas did all early institutions show similar findings and all late insti-tutions show similar findings. The clear division in the quality of transfer services variable demonstrated that the concerns motivating this study—that late institutions do
Table 1. Sorting Grid Based on Variables by College*
Institution Bureaucratic Structure Technology Personnel Articulation
Agreements Policy Quality of Transfer Service
Earlsville College
Ercot College
Ervington College
Lakeside College
Latham College
Laynette College
* Each institution was assigned a pseudonym to preserve its confidentiality as well as that of the individuals who participated in the study. Given the importance of distinguishing “early” from “late” colleges in this study, the pseudonym of each early college begins with the letter E and that of each late college begins with the letter L.
College & University | 21
a disservice to transfer students—were justified, at least in the context of the institutions in this study. The clear division on the policy variable speaks to its being key in distinguishing early from late processes.
Three variables—bureaucratic structure, technology, and personnel—revealed some patterns that seem to dis-tinguish early from late institutions (especially when com-paring the institutions at the extremes of the early and late categories). These variables may help determine how diffi-cult or easy it is for a college to move from a late to an early process, though they seemed insufficient on their own to actually move a college from a late to an early process. One variable—articulation agreements—seemed to have little relationship to either early or late processes and was criti-cized nearly universally by participants.
Quality of Transfer Services
Institutions divided clearly according to the quality of transfer services variable. Participants at the late institu-tions expressed concern about the quality of transfer stu-dent service as it related to the transfer credit evaluation process, citing student frustration with the process. At Latham College, for example, students receive the trans-fer credit evaluation in two stages: The first is the institu-tional evaluation provided by the admissions office soon after acceptance. This evaluation is not degree specific, so a student does not know how many credits will count toward his intended bachelor’s degree program. The sec-ond stage, the degree-specific evaluation, is provided only after the student confirms his enrollment by making the required deposit and meeting with an academic advisor.
The associate director of transfer advising at Latham College described how difficult this two-stage process is for advisors: “We’re the bad guys…. We’ll really some-times get students’ wrath,” as when she has to tell a student that although 8 credits transferred, “none of them count [sic]” toward the degree. Even though the phrase is likely to be hyperbole, the point is clear: Students feel frustrated when the institutional evaluation leads them to believe that more credits toward the degree will transfer than ac-tually do—particularly as they learn the truth only after they’ve committed to attend the institution by paying a nonrefundable deposit.
In contrast, participants at the early colleges were con-fident that their institutions were delivering high levels
of transfer student services and reported no student frus-tration. The transfer admissions counselor at Ervington College stated that students “seem very pleased” with the information they receive prior to enrollment. Of the pro-cess overall, she noted, “I just don’t see flaws.” The trans-fer credit evaluator at Ervington commented similarly: “I think it serves [students] very well.”
Notably, participants at all three late colleges expressed interest in shifting to an early process in order to improve student service. Two participants at early colleges criti-cized late colleges for being unclear in the transfer credit information they provide to their prospective students. The consensus among participants who offered an opin-ion was that early processes serve transfer students well while late processes serve transfer students poorly and should be corrected.
Bureaucratic Structure
Early and late institutions did not divide clearly according to the bureaucratic structure variable: both had a diver-sity of transfer credit evaluation structures, with no clear pattern indicating that certain bureaucratic structures were always associated with either early or late processes. Nevertheless, two notable findings did emerge. The ear-liest college—Ercot—administered the process primar-ily from one office (the office of admissions). (Ercot’s office of admissions recently took over responsibility for first-semester transfer advising from the student services department.) Ercot’s dean of transfer evaluations noted how centralization and specialization have sped the pro-cess: “This whole unit…which is under the auspices of the admissions office, does all of the admissions and evalua-tions processing,” and the process is “quicker than before; we get [the transfer credit evaluation] out very quickly to students so they can make a decision.”
At the latest college (Latham), academic departments exercised the most power in granting equivalencies and delayed the process the most. The process of referring transfer students’ transcripts to the pertinent academic department(s), tracking the referral(s), reviewing the re-turned document(s), and updating the evaluation took a considerable amount of time, from two weeks to well over a month. As Latham’s associate director of transfer admis-sions noted, the academic department chair has “two weeks to do the evaluation” but often can “take a month or more.”

College & University | 22
Analyzing these findings using Robert Birnbaum’s (1988) collegiate bureaucratic theory leads to the following conclusion: Concentrating authority for the transfer credit evaluation process in one department (such as the office of admissions) can speed the process. However, given that in-stitutions with early processes can have complicated bureau-cratic structures (as at Earlsville College), it is not essential to concentrate the process in the office of admissions.
Technology
The researchers expected that the early colleges would be characterized by advances in information technology tools—e.g., document imaging, transfer course databases, and automated degree audits—whereas the late colleges would lag in their utilization of technology. (The assump-tion was that these technologies, if implemented well, can save staff time and make the process more efficient.) This hypothesis was borne out at five of the six colleges as the late colleges showed less utilization of these tools than did the early colleges. The transfer admissions director at Er-cot College noted, “Apart from the counseling of students, everything else is technology driven.” One institution—Earlsville College—was an outlier. Although the college was virtually bereft of technology, it managed nevertheless to provide degree-specific transfer credit evaluations early. Thus, at least at the six colleges studied, the integration of information technology tools seems to make the process more efficient within the category of early or late but is not sufficient by itself to move a college from a late to an early process. Like bureaucratic structure, effective use of technology aids but is not essential for an early process.
Personnel
Two aspects of the personnel variable seemed most rel-evant to process effectiveness: adequate staffing levels and relationships among key staff members in departments in-volved in the process. Of the six processes studied, three seemed significantly understaffed (those at Latham Col-lege, Laynette College, and Earlsville College). The inclu-sion of one early college in this group suggests that this variable, too, does not divide clearly between early and late processes; that is, it is possible to have an early pro-cess and yet be understaffed. It is noteworthy that key staff members at Earlsville College have a strong working rela-tionship. According to the director of academic advising,
she and the associate director of admissions “have a nice friendship, a good personal friendship.”
These two key staff members leverage their relationship across departments in a way that compensates for staffing insufficiencies. During peak periods, the evaluation func-tion shifts from the office of advisement to the office of ad-missions, thereby helping the institution provide transfer credit evaluations early by increasing the number of staff who are working on them. Some minimum staffing level seems necessary for a college to provide evaluations early, but it does not seem to be a determining factor in shifting a policy from late to early. For example, Lakeside College seems adequately staffed but has not shifted from a late to an early transfer credit evaluation process.
Articulation Agreements
An articulation agreement is a written compact among two or more colleges that details how students may trans-fer from one participating college to another; often, such agreements stipulate how college credit earned at one in-stitution will transfer to a degree program at another insti-tution (Kintzer and Wattenberger 198; Roksa and Keith 007). Ultimately, articulation agreements are intended to smooth the transfer process. However, only one college in this study demonstrated that articulation agreements were of any significant advantage in terms of the efficiency of the credit transfer process. In fact, even in this case, the benefit was limited by challenges inherent in articula-tion agreements. The professionals who were interviewed agreed that articulation agreements are virtually impos-sible to keep current, are time-consuming to construct, and are of little value to students. Other institutions in the study found the agreements to be of virtually no value, and at least one participant from each institution found the agreements highly problematic. The associate director of transfer admissions at Earlsville College noted, “By the time that it’s agreed on, then it’s not agreed upon anymore because it’s outdated.”
Policy
Ultimately, providing a degree-specific transfer credit eval-uation before a student submits his enrollment deposit is an institutional policy decision. Other process variables, such as tight bureaucratic structure, extensive use of tech-nology, and appropriate staffing, can influence how quickly
College & University | 23
a college produces a transfer credit evaluation. But if a col-lege does not decide to provide the degree-specific evalua-tion prior to the enrollment deposit deadline, these other factors are not likely to result in an early evaluation. Quite simply, a college could produce a degree-specific transfer credit evaluation within hours of admission and still be a late institution if, as a matter of policy, it held the evalu-ation until the student submitted her enrollment deposit.
This study suggests several reasons that a college might have a policy to produce degree-specific transfer credit evaluations late. At some institutions, process variables may play a role: bureaucratic inefficiencies, limited tech-nology, and inadequate staffing make it unlikely that a college would commit to providing the evaluation sooner. Historical precedent also may play a role: If a college has traditionally provided the degree-specific evaluation late (as the three late colleges in this study seem to have done), then it is more likely to continue this policy unless some compelling reason prompts a change.
Enrollment could constitute a compelling reason. This study found evidence that an early transfer credit evalua-tion process may improve transfer student enrollment by reducing transfer credit ambiguity and enhancing student service. If the transfer student is happier with the service and information (such as degree-specific transfer credit information) provided after admission but before enroll-ment, then he may be more likely to enroll. A comparison of the colleges’ yield rates (i.e., the percentage of admit-ted students who enroll) supports this theory: Whereas early colleges had an average transfer student yield of 1 percent, late colleges had an average transfer student yield of only percent. Ervington had the highest transfer student yield in the survey—71 percent—whereas Latham had the lowest, at 8 percent. Other factors certainly play a role in yield, but the yield comparison is notable and pro-vides evidence that early schools make effective use of the transfer credit evaluation process as a recruitment tool.
Some late colleges may fear negative enrollment conse-quences as a result of shifting to an early process, particu-larly if they tend to award few transfer credits. Colleges that are conservative in awarding transfer credit may actu-ally have an enrollment advantage by essentially conceal-ing transfer credit applicability to intended degree until after the student has paid the enrollment deposit. The as-sociate director of transfer advising at Latham suggests as
much when explaining why her institution is unlikely to provide the degree-specific transfer credit evaluation prior to the enrollment deposit deadline:
[Advisement should] have a presence over in the ad-missions office—and this will never happen—when students are getting that initial credit evaluation; [the degree applicability] could be presented with the advisement person in a collaborative way. But then I honestly think they might lose students.
Policy, then, is a complicated variable: Early colleges seem to derive an enrollment benefit from their policies; this is substantiated both by the comments of study par-ticipants and the yield data comparison with late colleges. However, some colleges may be disadvantaged by shifting to an early transfer credit evaluation process, particularly if they are less generous than their competitor schools in the award of transfer credit.
IMPLICATIONS OF THE STUDY
This study offers evidence that colleges (minimally, the six in this study) could and should provide early degree-specific transfer credit evaluations. Transfer professionals in this study were unequivocal about the importance of providing such evaluations early. Participants at each of the three late colleges perceived their late evaluations as a pro-cess shortcoming and often reported student frustration. Participants at the three early colleges also perceived the practice of the late colleges as a shortcoming and criticized it as confusing and sometimes misleading students. One transfer admissions professional in the focus group com-mented, “I think some institutions have a catch-and-release policy: We got them, we got their deposit, and we got them to pay their first semester of tuition.” After the first semes-ter, some students choose to transfer again or even drop out because they decide that the “lost” transfer credit—of which they become aware only after submitting their en-rollment deposit and perhaps only after starting classes—is too great a loss. In an effort to provide high-quality transfer student services, the three late colleges in the study should change their transfer credit evaluation policies and pro-cesses so that the degree-specific evaluation is provided early—i.e., prior to the enrollment deposit deadline.
Generalizing findings based on qualitative research is problematic for reasons already discussed, but the data
College & University | 24
gathered in this study should prompt institutions to re-view their transfer credit evaluation processes in order to determine whether they are serving students well. We ex-pect that colleges with late processes will find that they are not. Given the role that transfer student degree attain-ment can play in improving national economic competi-tiveness and in maintaining the promise of economic and social mobility, any practices that make transferring more difficult should be reviewed and changed. The Obama ad-ministration has called for colleges and states to undertake such changes, noting that “the lack of a coherent, navi-gable, and transparent transfer process both increases the cost and time needed to earn a degree and diminishes the likelihood of completion” (U.S. Department of Education 011, p. 11). This study provides evidence that failure to provide a degree-specific transfer credit evaluation prior to the enrollment deposit deadline contributes to this lack of a coherent, navigable, and transparent transfer process.
Perhaps the most likely objection to our recommen-dation that all colleges provide degree-specific transfer credit evaluations to all admitted students prior to the en-rollment deposit deadline is that this would be too much work. This objection was common in the responses to our commentary in the Chronicle of Higher Education (Ott and Cooper 01). Apart from the fact that doing what is right sometimes requires more work, it is quite possible that colleges with late transfer credit evaluation processes may be able to accomplish the shift to an early process by making the process more efficient. Our study highlighted factors that can play a role in process efficiency (bureau-cratic structure, technology, and personnel) and how the processes at early colleges often excel in these areas. Late colleges could learn from their early peers how to improve their processes, possibly without adding significantly to the workload of the individuals involved.
Transfer students encounter many challenges, often with little attention or support from college administra-tors, faculty, and researchers (Carey 010, Handel 010). One of the few books on collegiate transfer issues char-acterizes the transfer student as “the forgotten student” ( Jacobs 00a). This neglect extends to higher education enrollment structures and processes that were designed without transfer students in mind—including, at some institutions, the transfer credit evaluation process. Trans-
fer students deserve better. After all, it is their time and money that are at stake.
REFERENCESAdelman, C. 00. Moving Into Town—and Moving On: The Community
College in the Lives of Traditional-Age Students. Washington, D.C.: U.S. Department of Education. Retrieved from: <http://files.eric.ed.gov/fulltext/ED9111.pdf>.
American Association of Collegiate Registrars and Admissions Of-ficers, American Council on Education, and Council for Higher Education Accreditation. 001. Joint Statement on the Transfer and Award of Credit. Retrieved from: <www.acenet.edu/news-room/Documents/001-Joint-Statement-on-Credit.pdf>.
Ashby, C. 00. Transfer Students: Postsecondary Institutions Could Promote More Consistent Consideration of Coursework by Not Basing Determinations on Accreditation. Report to congressional requesters. Government Accountability Office Publication No. 0–. Retrieved from: <www.gao.gov/new.items/d0.pdf>.
Baum, S., J. Ma, and K. Payea. 010. Education Pays, 2010: The Benefits of Higher Education for Individuals and Society. New York: College Board. Retrieved from: <http://trends.collegeboard.org/education-pays>.
Bell, L. W. 00. Critical issues in advising transfer students: Student re-tention begins before matriculation. In The College Transfer Student in America: The Forgotten Student, edited by B. C. Jacobs. Washington, D.C.: American Association of Collegiate Registrars and Admissions Officers.
Berg, B. L. 009. Qualitative Research Methods for the Social Sciences, 7th ed. Boston: Allyn & Bacon.
Berkner, L., S. He, and E. F. Cataldi. 00. Descriptive Summary of 1995–96 Beginning Postsecondary Students: Six Years Later. Washington, D.C.: National Center for Educational Statistics. Retrieved from: <http://nces.ed.gov/pubsearch/pubsinfo.asp?pubid=0011>.
Birnbaum, R. 1988. How Colleges Work: The Cybernetics of Academic Or-ganization and Leadership. San Francisco: Jossey-Bass.
Bogdan, R. C., and S. K. Biklen. 007. Qualitative Research for Education: An Introduction to Theories and Methods, 5th ed. Boston: Pearson Allyn & Bacon.
Bowen, W. G., M. M. Chingos, and M. S. McPherson. 009. Crossing the Finish Line: Completing College at America’s Public Universities. Princ-eton, NJ: Princeton University Press.
Carey, K. 010. Despite years of credits, still no degree. The Chronicle of Higher Education. April 11. Retrieved from: <http://chronicle.com/article/Despite-Years-of-Credits/0/>.
Center for American Progress. 011. Articulation Agreements and Prior Learning Assessments: Tools to Help 21st Century Students Achieve Their Postsecondary Education Goals and Keep America Competitive. Re-trieved from: <www.americanprogress.org>.
Chang, M. J., P. G. Altbach, and K. Lomotey. 00. Race in higher edu-cation: Making meaning of an elusive target. In American Higher Education in the Twenty-first Century: Social, Political, and Eco-nomic Challenges, 2nd ed., edited by P. G. Altbach, R. O. Berdahl, and P. J. Gumport. Baltimore, MD: Johns Hopkins University Press.
Cuseo, J. 00. The transfer transition from two-year to four-year insti-tution: Critical issues and promising practices. Paper presented at the Tenth National Conference on Students in Transition. Lake Buena Vista, FL. Retrieved from: <https://transferinstitute.unt.edu>.
Cutright, M. 011. The changing nature of today’s transfer student. In Transfer Students in Higher Education: Building Foundations for Policies, Programs, and Services That Foster Student Success, edited by M. A. Poisel and S. Joseph. Columbia, SC: National Resource Center for the First-Year Experience and Students in Transition.
College & University | 25
Dervarics, C. 007. Education Department, Congress has sights trained on community college transfer of credit problem. Diverse Issues in Higher Education. July 1. Retreived from: <http://diverseeducation.com/article/8/>.
Dunn, B. 00. Transfer issues from the perspective of the two-year col-lege student. In Advising Transfer Students: Issues and Strategies, edited by T. J. Kerr, M. C. King, and T. J. Grites. Manhattan, KS: National Academic Advising Association.
Gonsher, D., and J. Halberstam. 009. The Community College Guide: The Essential Reference from Application to Graduation. Dallas, TX: BenBella Books.
Gordon, V. N., and M. L. McDonald. 00. Advising diverse transfer students. In Advising Transfer Students: Issues and Strategies, edited by T. J. Kerr, M. C. King, and T. J. Grites. Manhattan, KS: National Aca-demic Advising Association.
Gutierrez, D. A. 00. Articulation agreements that foster a transfer men-tality. In The College Transfer Student in America: The Forgotten Stu-dent, edited by B. C. Jacobs. Washington, D.C.: American Association of Collegiate Registrars and Admissions Officers.
Handel, S. J. 010. Silent partners in transfer admissions: Four-year insti-tutions need to give much more help to students from community col-leges. The Chronicle of Higher Education. September 19. Retrieved from: <http://chronicle.com/article/Silent-Partners-in-Transfer/11/>.
Handel, S. J., and R. A. Williams. 01. The Promise of the Transfer Path-way: Opportunity and Challenge for Community College Students Seek-ing the Baccalaureate Degree. New York: College Board. Retrieved from: <http://advocacy.collegeboard.org/sites/default/files/community-college-transfer-pathway-1.pdf>.
Holaday, T., and M. E. McCauley. 00. Using the web to enhance trans-fer services. In Advising Transfer Students: Issues and Strategies, edited by T. J. Kerr, M. C. King, and T. J. Grites. Manhattan, KS: National Academic Advising Association.
Jacobs, B. C. 00a. The College Transfer Student in America: The Forgot-ten Student. Washington, D.C.: American Association of Collegiate Registrars and Admissions Officers.
———. 00b. Today’s transfer student: Trends and challenges. In The College Transfer Student in America: The Forgotten Student, edited by B. C. Jacobs. Washington, D.C.: American Association of Collegiate Registrars and Admissions Officers.
King, N., and C. Horrocks. 010. Interviews in Qualitative Research. Lon-don: Sage Publications.
Knoell, D. M., and L. L. Medsker. 19. From Junior to Senior College: A National Study of the Transfer Student. Washington, D.C.: American Council on Education.
Marling, J. L., and B. C. Jacobs. 010. Establishing pathways for transfer student success through orientation. In Transfer Students in Higher Education: Building Foundations for Policies, Programs, and Services That Foster Student Success, edited by M. A. Poisel and S. Joseph. Co-
lumbia, SC: National Resource Center for the First-Year Experience and Students in Transition.
McGlynn, A. 00. Transfers from four-year to two-year colleges grow. The Education Digest. 7(): 0–.
McPhee, S. 00. En Route to the Baccalaureate: Community College Student Outcomes. Washington, D.C.: American Association of Com-munity Colleges. Retrieved from: <www.aacc.nche.edu/Publications/Briefs/Documents/09100enroute.pdf>.
Merriam, S. B. 1998. Qualitative Research and Case Study Applications in Education. San Francisco: Jossey-Bass.
Ott, A and B. S. Cooper. 01, March 18. They’re transfer students, not cash cows. The Chronicle of Higher Education. Retrieved from: <http://chronicle.com/article/Theyre-Transfer-Students-Not/179/>.
Rawls, J. 1971. A Theory of Justice. Cambridge, MA: Harvard University Press.
Roksa, J., and B. Keith. 008. Credits, time, and attainment: Articulation policies and success after transfer. Educational Evaluation and Policy Analysis. 0(): –.
Schultz, T. W. 191. Investment in human capital. The American Economic Review. 1(1): 1–17.
Silver, D. 009. Community College Transfer Guide. Los Angeles: Adams-Hall Publishing.
Stainburn, S. 011, April 17. Transferring? Get schooled. The New York Times. Education Life: .
U.S. Department of Education. 00. A Test of Leadership: Charting the Future of U.S. Higher Education. Washington, D.C.: Government Printing Office. Retrieved from: <www.ed.gov/about/bdscomm/list/hiedfuture/reports/final-report.pdf>.
———. 011. College Completion Tool Kit. Washington, D.C. Retrieved from: <www.ed.gov/college-completion/governing-win>.
Yin, R. K. 009. Case Study Research: Design and Methods, 4th ed. Thou-sand Oaks, CA: Sage.
About the Authors
ALEXANDER P. OTT, ED.D. , is Associate Dean, Academic and Enrollment Support Services, at New York Institute of Technology. He is also a past president of the New York State Transfer and Articulation Association and has worked in the collegiate transfer field for more than ten years. Ott has recently completed the dissertation on which this article is based, Transfer Credit Evaluations at New York State Colleges: Comparative Case Studies of Process Effectiveness. His commentary, co-authored with Bruce S. Cooper, on the issue of transfer credit evaluations was published in The Chronicle of Higher Education on March 18, 2013.
BRUCE S. COOPER, PH.D. , is Professor (retired) of Educational Leadership at Fordham University Graduate School of Education. He has written or edited more than 30 books and 250 articles on education, including on educational politics and reform.

College & University | 26
ransitioningSeventeen higher education insti-tutions in Ohio converted from quarter to semester systems in 01–1 (Farkas 01, Pyle 009, Pyle 01). Other institutions and systems that have un-dergone similar transitions include the Rochester In-stitute of Technology, California State University–Los Angeles, Auburn University, the University of Minnesota system, the Utah State system, and Northeastern Univer-sity (Mayberry 009). The decision to convert to a se-mester system is typically multifaceted (see Quann 1998), with rationales ranging from the financial to student
transfer and curriculum, to name a few. The University System of Ohio (01) identifies credit transfers as the greatest factor in the decision to
make the change. Those who believe that all higher educa-tion institutions in Ohio should operate according to the same academic calendar contend that the change to a se-mester calendar would enable students to transfer credits more easily to different institutions within the state (Fin-gerhut 010).
Despite the perceived benefits of converting to se-mesters, student motivation is rarely a primary focus of
A NUMBER OF U.S. HIGHER EDUCATION INSTITUTIONS ARE CONVERTING FROM QUARTER- TO SEMESTER-BASED
ACADEMIC CALENDARS; IN FALL 2012, SEVENTEEN OHIO INSTITUTIONS DID SO. OVER A TWO-YEAR TIME PERIOD,
COLLEGE STUDENT SAMPLES WERE RECRUITED FROM A LARGE, PUBLIC, URBAN, MIDWESTERN UNIVERSITY
THAT WAS UNDERGOING A TRANSITION FROM A QUARTER-BASED TO A SEMESTER-BASED CALENDAR. RESULTS
INDICATE THAT DURING THEIR LAST YEAR ON THE QUARTER CALENDAR, MOST STUDENTS FAVORED THAT
SYSTEM AND PREDICTED LITTLE TO NO CHANGE IN THEIR MOTIVATION HEADING INTO SEMESTERS; BUT AFTER
THEIR FIRST YEAR ON THE SEMESTER CALENDAR, THEIR FAVORITISM OF QUARTERS DECREASED. THIS MIXED
METHODS STUDY ASSESSED COLLEGE
STUDENTS’ FAVORITISM OF QUARTERS AND
SEMESTERS; THEIR PREDICTED AND
PERCEIVED CHANGES TO THEIR MOTIVATED
BEHAVIORS; AND THEIR SELF-REPORTED
MOTIVATION. EVEN THOUGH MOST
STUDENTS PERCEIVED LITTLE TO NO
CHANGE IN THEIR MOTIVATION AFTER THE
CONVERSION TO THE SEMESTER CALENDAR,
THERE WAS A NOTICEABLE INCREASE IN
THE PERCENTAGE OF STUDENTS WHO
REPORTED HAVING ADOPTED
MALADAPTIVE BEHAVIORS AND BECOMING
DE-MOTIVATED. DESPITE THIS INCREASE, A
STATISTICAL INCREASE IN STUDENTS’ SELF-
EFFICACY TOWARD THEIR COURSEWORK
WAS ALSO OBSERVED. IMPLICATIONS OF
THESE FINDINGS AND DIRECTIONS FOR
FUTURE RESEARCH ARE DISCUSSED.
from Quarters to Semesters

College & University | 27
By Marcus Lee Johnson and Jessica L. Kestler
decision making about such a conversion; yet research indicates that achievement motivation may greatly influ-ence students’ learning outcomes. Motivation is defined as the process whereby goal-directed actions are instigated and sustained (Schunk, Pintrich and Meece 01). There-fore, it is worth considering that an institution’s change of its academic calendar may alter its students’ “goal-directed actions.” The conversion from three ten-week quarters to two fifteen-week semesters has the potential to change how students manage their time and/or their confidence in their ability to maintain their energy and focus throughout a fifteen-week academic term. Students
who become fatigued (or de-motivated) as a result of the change may behave in a manner that is maladaptive to their learning and/or to the institution’s mission. At the same time, students who perceive that a fifteen-week se-mester will provide them with more time to master course content may adapt their learning strategies (e.g., time management, self-regulation, etc.) accordingly. Thus, even though the decision to convert from a quarter- to a semes-ter-based calendar may rest primarily on issues related to institutional finances, student transfer protocols, and/or curriculum changes, the decision can have significant im-plications for student-motivated behaviors.
CHANGES IN COLLEGE STUDENTS’ PREDICTED AND PERCEIVED MOTIVATION
ransitioningfrom Quarters to Semesters

College & University | 28
The literature suggests that faculty members favor semes-ters whereas students (undergraduates in particular) appear to favor quarters (Pyle 007, 009, 01). Explanations for the difference include the notion that undergraduates may favor quarters because they are shorter and provide more opportunities to quickly obtain grades to demonstrate their competence (i.e., employing performance orientations). Faculty may favor semesters over quarters because they al-low more time to delve deeply into content so that mastery can take place. (For more on how extended instructional time can be used to promote adaptive [mastery] goals, see Schunk, Pintrich and Meece, 01, p. 0.) Historically, opportunities to master course content have resulted in desirable learning outcomes for students (Anderman and Wolters 00) whereas a focus on grades, competition, and test performance has been associated with shallow cogni-tive processes (Sinha and Kumar 000).
In this mixed methods study, we investigate students’ favoritism toward semesters and quarters at an institution undergoing semester conversion in addition to the pre-dicted and perceived changes of their motivated behaviors (defined in this study as strategies and approaches to aca-demic work). Finally, we compare students’ self-reported motivation during their last year on the quarter system to that during their first year on the semester system.
LITERATURE REVIEW
Converting to Semesters
Semester calendars are more common than quarter cal-endars at U.S. higher education institutions (Smith 01). The vast majority of students who enroll in higher educa-tion in the United States experience a consistent academic calendar—typically a semester calendar. Nevertheless, one-third of undergraduates transfer from one institution to another at least once before earning a degree (Gonzalez 01); and some students transfer to institutions with dif-ferent academic calendars. For such students, the process of converting credit hours can be complicated, especially when required courses for a degree have incompatible credit hours. For example, a student who needs three credit hours of biology at an institution that operates ac-cording to a semester calendar will have satisfied only two-thirds of the required credit hours if he has taken biology at an institution on the quarter system; raising the ques-
tion of how the student should earn the last third of the credit hours he needs. (For more on definitions of credit conversion and credit hours, see Titus 01 as well as Uni-versity of Cincinnati 01c.)
As part of the University System of Ohio’s (01) ten-year strategic plan, seventeen of the state’s colleges and universities converted their academic calendars from three ten-week quarters to two fifteen-week semesters (exclud-ing summer sessions). As previously mentioned, this de-cision was allegedly made to facilitate students’ transfer to other institutions within the system (Fingerhut 010). Three guidelines for semester conversion were established:
W An institution’s semester calendar will not violate any accreditation regulation, federal guidelines, etc.
W An institution’s semester calendar will facilitate the at-tainment of the University System of Ohio goals, in-cluding the transfer process.
W A semester credit hour will mean the same throughout the University System of Ohio (Fingerhut 010, p. 1).
A semester is defined as no fewer than fifteen and no more than seventeen calendar weeks; Fingerhut (010) reports that an academic year shall be at least 0 weeks in length. Although three ten-week quarters is equivalent to 0 weeks, reducing the number of academic terms from three to two reduces the number of courses in which stu-dents enroll and thus increases the amount of time dedi-cated to a particular course ( Jokinen 01a). Ultimately, the amount of time necessary to complete a degree pro-gram and graduate1 should be the same, as should be the amount of required seat time (i.e., the number of minutes of formal instruction).
Faculty and staff at institutions undergoing calendar conversions were required to submit new syllabuses and curriculum reviews to verify their accommodation of the change. The University System of Ohio made its proceed-ings accessible online as part of the effort to keep faculty, staff, administrators, and students informed about the conversion process (Ohio Faculty Council 01). Many of the affected institutions launched websites that specifi-
1 Institutions that have recently undergone semester conversion have made pledges to their students that semester conversion would not delay their graduation or time to degree (see Wright State University 2014 for a sample pledge). Many administrators at the Ohio institutions that converted to semester calendars were optimistic about timely graduations and cited stu-dents’ planning with their academic advisors and visits to semester-conver-sion websites (see Jackson 2013, Pyle 2012).
College & University | 29
cally answered students’ frequently asked questions about the conversion (see Ohio State University 01, Univer-sity of Cincinnati 01a).
Numerous resources encouraged students who would experience the semester conversion to seek the help of an academic advisor in generating a plan to complete their coursework (see Reilly 011). Students were reminded that
The main academic advantage of the semester system is that it provides greater opportunities for collaborative re-search and for in-depth teaching and classroom projects. A semester calendar facilitates study-abroad options, student teaching, and other forms of experiential learning (Uni-versity of Cincinnati, 01b). From a motivation stand-point, “greater opportunities…for in-depth teaching and classroom projects” includes students’ engaging in course materials, mastering key concepts, and making meaning-ful connections with relevant course information during a fifteen-week rather than a ten-week term. Additionally, increased time for instruction allows students to engage more deeply in the content while simultaneously allocating more time for instructors to thoroughly teach, and review the material with their students. Schunk, Pintrich, and Meece (01) suggest that increasing the amount of time in a course may promote mastery strategies that students can use to set goals, timetables, and make autonomous decisions, which in turn can result in desirable learning outcomes (also see Slavin 00). Despite the advantages of extended instructional time that result from the shift from a ten-week to a fifteen-week term, approximately 8 percent of undergraduate students still expressed favorit-ism toward quarters after their university announced that it would transition to semesters in 01–1 (Pyle 007).
MASTERY-ORIENTED BEHAVIORS
Anderman and Anderman (009) encourage educators to give students ample time to gain mastery of important topics and skills. According to Achievement Goal Theory (AGT), a social cognitive theory of motivation, efforts to learn or gain competence are referred to as mastery-oriented goals whereas efforts to obtain a high grade and demonstrate competence (often in comparison to others) are referred to as performance-oriented goals (Ames 199, Linnenbrink and Pintrich 00a). Mastery orientations are often touted for being most associated with adaptive learning outcomes including achievement, deep cognitive
engagement, positive affect, and adaptive learning strategy use (Linnenbrink and Pintrich 00a, 00b; Peggy, Sul-livan and Guerra 007). Performance orientations have been associated with shallow processing strategy use, neg-ative affect following failure, maladaptive coping, and less prosocial behaviors ( Johnson and Nussbaum 01, Sinha and Kumar 000). This is not to say that performance ori-entations are entirely bad (see Durik, Lovejoy and Johnson 009); many AGT scholars have found performance ori-entations to be predictive of high achievement and recall memory (Barker, McInerney and Dowson 00; Kaplan, Gheen and Midgley 00). Nevertheless, Linnenbrink and Pintrich (00a, 00b) explain that learners who utilize a mastery orientation are more likely to use deep processing strategies that result in more meaningful learn-ing; performance-oriented students, by contrast, may use shallow processing (such as memorization) to complete a task and obtain a good grade or score. By converting from quarters to semesters, higher education institutions argu-ably foster a mastery-oriented learning environment.
PURPOSE OF THE PRESENT STUDY
In this mixed methods study, we assessed a sample of Midwestern university students’ favoritism toward quar-ters and semesters, the students’ predicted and perceived changes to their motivated behaviors, and their self-re-ported motivation/learning strategies during the conver-sion to a semester calendar. The research questions were:
W Does students’ favoritism of quarters or semesters change from their last year on quarters to the end of their first year on semesters?
W How do students on quarters predict their [motivated behaviors] strategies and approaches to their academic work will change when semesters begin; during their first year on semesters, how do students perceive their [motivated behaviors] strategies and approaches to their academic work to have changed from when they were on quarters?
W How do students in their last year on quarters and those in their first year on semesters compare in regard to their self-reported motivation/learning strategies?
Although this study is primarily qualitative, explor-atory, and descriptive in nature, we offer some hypotheses for our research questions. With regard to the first ques-

College & University | 30
tion, concerning students’ favoritism of quarters and se-mesters, we hypothesized that we would see a shift in their favoritism: Because Pyle (007) reported on students at an institution that was also facing conversion to a semes-ter calendar favored quarters, we expected that students in their last year on the quarter system would favor that cal-endar over a semester calendar. We also expected that after students experienced a year of a semester calendar, their favoritism would change. According to Jokinen (01a, 01b), administrators at many of the Ohio institutions that underwent semester conversion alleged that concerns about student enrollment and students’ attitudes toward semesters would moderate once faculty and students be-came familiar with, adjusted to, and experienced semes-ters. We therefore predicted that students would favor semesters by the end of their first year on the new system.
With regard to our second research question, con-cerning students’ predicted and perceived changes to their motivated behaviors during semester conversion, we hypothesized that students would demonstrate more mastery-oriented strategies/approaches to their academic work once they were on the semester calendar. We antici-pated that students would realize that semesters provide greater amounts of time to focus on mastery of course material. Finally, with regard to the third research ques-tion, about students’ self-reported motivated strategies, we expected to see differences as a result of the change to fifteen-week semesters. Peggy, Sullivan, and Guerra (007) as well as Linnenbrink and Pintrich (00a, 00b) reported that mastery orientations are strongly associated with adaptive learning strategy use (e.g., time management, self-regulation, effort management). Thus, with an expectation that fifteen-week semesters would result in greater mastery orientations, we expected to see differences in students’ self-reported motivation strategies as well as changes in the way they organized and managed their time as they adjusted to the new calendar.
The results of this study may have practical implica-tions for other higher education institutions contemplat-ing a transition from quarters to semesters. Results should inform administrators about the rate at which students begin to favor semesters over quarters. They should also inform student services personnel about how students will respond behaviorally and motivationally to a change in the academic calendar. Greater understanding of how stu-
dent motivation might change as a result of such a transi-tion should support the better preparation of students for similar transitions and/or determinations of whether mo-tivational interventions are needed. Undergraduates’ con-tinued favoring of quarters even after experiencing a year of semesters may encourage administrators and student ser-vices personnel to consider continued efforts to promote the mastery advantages of semesters. Alternatively, under-graduates’ adoption of mastery orientations within a year of a transition to semesters may encourage student services personnel to redirect their efforts toward maintaining rather than prompting students’ mastery orientations.
METHODS
Participants
We recruited student participants from a large, public, ur-ban, Midwestern university; all were enrolled in the same School of Education research subject pool. Four student samples (two from the final year on quarters and two from the first year on semesters) provided data. From the final year on quarters (Year 0), a sample of 11 undergraduates ( male, 9 female, 1 not specified) completed a question-naire concerning their favoritism of quarters or semesters and responded to a question concerning their predicted changes to their motivated behaviors. Also from Year 0, a sample of 10 undergraduates (1 male, 7 female) com-pleted the Motivated Strategies for Learning Question-naire (MSLQ) (described below). Both the university and the subject pool experienced enrollment decreases during the first year on the semester calendar (Year 1), resulting in 0 undergraduates (1 male, 9 female) completing the questionnaire; a sample of 8 undergraduates (1 male, female) completed the MSLQ.
All four samples were consistent in terms of partici-pants’ average age, cumulative grade point average, year in college, and ethnicity. The average age of participants in each sample ranged from 0. to 0.8 years, with an age range from 18 to 9 years. The mean grade point averages (GPAs) of the sample groups ranged from .8 to . on a .0 scale. The samples were, on average, 91 percent Cauca-sian, 1 percent Hispanic/Latino, 7 percent black/African American, and 1 percent not specified; this was consis-tent with previous studies that utilized the same subject pool. Students who were seniors in Year 0 were screened

College & University | 31
out of the data because it was less likely that they would experience the semester conversion. This resulted in the majority of Year 0 students being sophomores ( %), followed by juniors ( %) and freshmen ( %). Sopho-mores accounted for approximately 0 percent of the Year 1 samples, followed by 0 percent juniors, and 10 percent seniors; freshmen were excluded from participation in Year 1 because it was unlikely that they had experienced quarters at the college level.
MEASURES
Favoritism and Predicted/Perceived Motivated Behavior Changes
An investigator-generated questionnaire was utilized to as-sess students’ favoritism of quarters and semesters as well as their predicted and perceived motivation changes. The ques-tionnaire included both open- and closed-ended questions. Specifically, participants were asked whether they favored quarters or semesters. Also, they were asked to describe the advantages and disadvantages of the calendar they favored. Next, Year 0 participants were asked to describe how their strategies, test preparation, and general approaches to their academic work would change with the conversion to semes-ters; Year 1 participants were asked, “Did any of your behav-iors or approaches to your academic work change from last year as a result of semester conversion?”
Motivation Assessment
The Motivated Strategies for Learning Questionnaire (MSLQ) measures student motivational characteristics and learning strategy use (Duncan and McKeachie 00; Pintrich, Smith and Garcia 199). It consists of a total of 81 items divided into fifteen subscales for intrinsic [mas-tery] goal orientation, extrinsic [performance] goal orien-tation, task value, control of learning beliefs, self-efficacy for learning, test anxiety, rehearsal, elaboration, organiza-tion, critical thinking, metacognitive self-regulation, time management, effort regulation, peer learning, and help seeking. The first six subscales are considered motivation scales; the latter nine are considered learning strategies scales. For this study, participants were instructed to use a Likert scale ranging from one to seven to rate the degree to which they agreed each item represented their motivation and/or learning strategy use for their college coursework.
PROCEDUREIn an effort to minimize participants’ response bias, dif-ferent student samples were asked to complete each of the above-mentioned questionnaires separately. We wanted to guard against participants’ responding to MSLQ items in a “socially desirable” manner that would reflect their re-sponses to the first questionnaire (about which calendar system they favored). Furthermore, we were most interested in assessing students’ predicted and perceived changes to their motivated behaviors rather than the motivation and learning strategy item information provided in the MSLQ. All participants from Year 0 and Year 1 were recruited from the same research subject pool; and all Year 1 participants were recruited for participation late in the second semes-ter to ensure that they had all experienced as least one full semester. All participants were informed that the online questionnaire would take no more than 0 minutes to com-plete. Links to the questionnaires could be launched from the electronic subject pool website. Participants were asked to read an information sheet and to indicate their consent to participate by “entering” one of the questionnaires. All participants were thanked for their participation.
DATA ANALYSIS
This mixed methods study relied on quantitative and qualitative data. Average scores were calculated for each of the MSLQ subscales, and participants were coded by the year of their participation (Year 0 = 0; Year 1 = 1). Descrip-tive statistics, correlations, and independent sample t-tests were derived from the quantitative data. Chi-square analy-ses were utilized to assess favoritism toward quarters ver-sus semesters. Two raters coded the qualitative data about predicted and perceived motivation changes by analyzing themes. Both raters were blinded from knowing whether participants favored quarters or semesters; were familiar with the characteristics and assumptions of prominent motivation theories; and had coded qualitative themes of motivation for other studies.
RESULTS
Favoritism
In Year 0, approximately 77 percent of participants fa-vored quarters, χ² (1, 10) = 7.7, p < 0.00. Yet in Year 1, only percent of participants favored quarters while 8

College & University | 32
percent favored semesters, χ² (1, 0) = 0.08, p = 0.78; thus, toward the end of the first academic year on the semester calendar, students’ favoritism toward quarters and semes-ters was approximately equal. The decrease in the percent-age of students who favored quarters from Year 0 to Year 1 indicates a shift in students’ attitudes regarding the con-version to a semester calendar. (See Table 1 for students’ perceptions of the advantages and disadvantages of quar-ters and semesters.)
PREDICTED/PERCEIVED MOTIVATED BEHAVIOR CHANGES
All Year 0 participants were asked, “How are your strat-egies, test preparation, and general approaches to your
academic work going to change with the conver-sion to semesters?” Two raters used a sample of participants’ responses to generate a key for coding responses. Responses that identified more time and opportunity to learn and/or to go deeper into course materials were coded as mastery oriented; those that stressed performing well on exams/assign-ments and shallow learn-ing strategies (such as memorizing) were coded as performance oriented; those that identified be-coming more lazy, procras-tinating more, or studying less because assignments would be more spread out over a semester were coded as de-motivated; responses that expressed no antici-pated changes were coded as no change; and all oth-ers—for example, those that were ambiguous or expressed uncertainty re-
garding what change might occur were coded as “other.” After independently coding all responses with an interra-ter reliability score of 0.9, both raters met to justify their codings until 100 percent agreement was reached.
Approximately 7 percent of Year 0 students did not expect any of their strategies to change, 9 percent said they would likely adopt a mastery orientation, 18 percent thought they would want to focus more on their exam performance, 7 percent believed they would become more lazy and/or procrastinate more, and 8 percent provided other/ambiguous responses. The results indicated that many students did not expect to change their motivated strategies as a result of the change in academic calendar from quarters to semesters, χ² (, 19) = ., p < 0.00.
Table 1. Common Student Perceptions of the Advantages and Disadvantages of Quarters and Semesters.*
Advantages Disadvantages
Quarters ▶ “It’s easier to stay focused on a class when it only lasts ten weeks.”
▶ Quarters have a “faster pace.” ▶ Students have “a greater opportu-
nity to take more [diverse] classes.” ▶ Quarter classes have “a lot
less material to learn.” ▶ For struggling students, there is more
opportunity to turn things around. ▶ Should the institution have stuck
with quarters, course credits would not get “messed up.”**
▶ Students’ familiarity with quarters.
▶ Having to wait until June to be on sum-mer break while friends and colleagues at other institutions finish in May.
▶ Not being able to go as deep into material. ▶ Having to “start over three times and
[having] to get used to a new set of rules with different teachers.”
▶ Professors having “to rush through mate-rial due to time crunch . . . students don’t get to work with materials as much.”
▶ Having to purchase “more text-books each year.”
Semesters ▶ “Classes go a lot more in depth.” ▶ Having a “longer time to master the mate-
rials” and time “to improve a failing grade.” ▶ Students “only have to buy books
twice instead of 3 times.” ▶ “Getting out earlier” for the summer. ▶ Students can “transfer to other
Ohio schools easily.”
▶ Students who dislike a class/professor are “stuck with it for an extra 5 weeks.”
▶ It is “easier [for students] to lose interest” over a longer term.
▶ The school year “starts earlier.” ▶ “Less diversity in curriculum.” ▶ Having to wait an entire term or year
if there are “conflicts in scheduling.”
* For Year 0, 72 faculty/staff members also responded to a brief questionnaire concerning their favoritism toward quarters or semesters. Approximately 70 percent of faculty favored semesters; advantages included “help with student transfers,” going “more in depth” with content, allowing “graduate students to complete meaningful research projects,” and “providing a more appropriate amount of time for students to digest information.” Disadvantages included students’ disliking classes they feel stuck in, fewer opportunities to take diverse electives, “fewer opportunities [for struggling students] to raise their GPA,” and students’ getting bored/fatigued with the same instructor/course.
** Many Ohio administrators expressed concern about delays in graduation though students did not comment on this; a few students perceived quarters as advantageous in that they would not have to meet with an academic advisor in order to calculate or convert previously earned credits. Nevertheless, students who visited their institution’s semester conversion site and/or worked with an academic advisor during the transition were provided with information about how many courses to take each term so as to prevent any delays in graduation (see Ohio State University 2011).

College & University | 33
Yet the 9 percent who thought they might adopt mas-tery-oriented strategies should not be ignored. With the majority of Year 0 students favoring quarters, administra-tors should be reassured that students’ ability to acknowl-edge that semesters might be advantageous for employing mastery-oriented strategies suggests that they might not be entirely pessimistic toward the shift to a semester cal-endar. An unexpected finding is that 7 percent of student respondents thought they might become lazier and/or procrastinate more upon implementation of a semester calendar. This percentage is small, but student services personnel may want to research this population further to determine whether interventions could enhance their academic experiences. It is worth noting that 88 percent of this de-motivated Year 0 population favored quarters.
Data for Year 1 participants were coded in a similar fash-ion as those for Year 0 participants; however, participants who could be coded as having a mastery orientation were more specific about their use of time and adaptive learning strategies. Statements included “I got to know my profes-sors more and became more involved with my classmates,” “I understood more of the lessons that we were taught during the classes and also was able to receive one-on-one attention from my professors,” and “I did make sure I was much more organized with my notes and handouts so I could keep everything together.” None of the Year 1 partici-pants responded in a performance-oriented manner—i.e., in a way that stressed a greater desire to focus solely on get-ting high scores/grades. A far greater number of responses regarding Year 1 as opposed to Year 0 focused on adopt-ing maladaptive behaviors/characteristics: Statements in-cluded, “It is harder for me to stay focused…I’m checking out mentally,” “I have more time to procrastinate,” and “I skip more classes and dislike my classes exponentially more.” With the exception of not seeing any responses that could be coded as performance oriented, we maintained codes for mastery oriented, de-motivated, no change, and other.
Approximately percent of responses were coded “no change,” 9 percent “de-motivated,” percent “mas-tery,” and percent “other.” As for Year 0, the results for Year 1 indicate that many students experienced little to no change in their motivated behavior, χ² (, 8) = 1., p = 0.001. Although a sizable proportion of Year 1 par-ticipants stated that they adopted adaptive and mastery-oriented behaviors, the increase from 7 percent of Year 0
participants to 9 percent of Year 1 participants comment-ing on de-motivated behaviors/characteristics is dramatic, concerning, and unexpected—especially knowing that Year 1 participants favored semesters to a greater degree than did Year 0 participants. Note that of this Year 1 “de-motivated population,” 78. percent had favored quarters.
Self-Reported Motivation
Year 0 and Year 1 students’ self-reported motivation and learning strategy MSLQ scores were compared. Indepen-dent sample t-tests in which Year 0 and Year 1 were des-ignated as the grouping variable and average scores for all MSLQ subscales were designated as the dependent variables indicate a statistically significant difference between the self-efficacy of Year 0 and Year 1 students, t(18) = -.87, p = 0.00. Specifically, Year 1 students had significantly higher self-efficacy scores (M = .98, SD = 0.8) than did Year 0 students (M = ., SD = 0.9). No other significant differences on MSLQ subscales were observed. (See Table , on page , for all MSLQ means and standard deviations by year.)
DISCUSSION
In this mixed methods study, we assessed the favoritism toward quarter and semester academic calendars, pre-dicted/perceived changes to motivated behaviors, and self-reported motivation and learning strategy use by un-dergraduate students at a large, public, urban, Midwest-ern university undergoing semester conversion. We found that, consistent with Pyle (007), a greater percentage of students favored quarters over semesters prior to semester conversion. However, after experiencing a year on the se-mester calendar, the percentage of students who favored quarters was not significantly different from the percent-age who favored semesters. This finding indicates a shift in students’ attitudes toward the semester calendar after experiencing it for a year. Although many administrators, faculty, and staff might prefer a more significant shift to-ward favoring semesters, our finding provides important baseline information. Institutions considering semester conversion should be advised of the likely change in stu-dents’ favoritism of a semester calendar, of their perceived advantages and disadvantages of quarter and semester cal-endars, and of ways in which to market the conversion (for example, by promoting mastery benefits) to students.

College & University | 34
Greater percentages of students in Year 0 and Year 1 predicted and perceived no change in their motivation than did those that predicted and perceived adopting mastery orientations and becoming de-motivated. Our hypothesis that students would predict and perceive their adoption of mastery orientations was not supported, but the results are novel and informative nevertheless. In fact, despite the shift in favoritism, we were surprised by the increase in the percentage of students who predicted be-ing de-motivated in Year 0 to those who perceived being de-motivated in Year 1. Motivation literature suggests that lengthening the time of instruction from ten to fifteen weeks can yield mastery benefits (Anderman and Ander-man 009; Bude et al. 011; Schunk, Pintrich and Meece 01), but a sizable proportion of Year 1 students reported becoming bored, procrastinating more, and even skipping
classes occasionally. The majority of these de-moti-vated Year 1 students had favored quarters, which may indicate their protest against or at least their re-sistance to the conversion to semesters. Student ser-vices personnel at institu-tions considering semester conversion may want to consider strategies that promote students’ adop-tion of time management skills and effort regulation, especially for students who may show some resistance toward semester conver-sion.
Finally, with regard to differences between Year 0 and Year 1 students’ self-reported motivation and learning strategies, we believe that the results of our independent samples t-tests were also novel and informative. Specifically, we observed a statistical
difference only in Year 1 students’ higher self-efficacy to-ward their coursework as compared to Year 0 students’. This may indicate a positive change in students’ motiva-tion as self-efficacy has been reported to be one of the strongest predictors of academic achievement (see Pajares and Urdan 00, Usher and Pajares 008). Although we had hypothesized that differences in MSLQ subscales would indicate Year 1 students’ adopting mastery-oriented behaviors and strategies such as time management and intrinsic goals, the increase in self-efficacy is promising. After all, our hypothesis for this third and final research question was contingent on finding more Year 1 students perceiving that their academic motivation had shifted to-ward mastery orientations during their year on a semester calendar. Given that we did observe changes in perceived motivation such that de-motivated behaviors were more
Table 2. Means and Standard Deviations of MSLQ Subscales by Year
MSLQ Subscale
Year 0 (n = 105) Year 1 (n = 48) Cronbach’s AlphaM SD M SD
Intrinsic 4.97 1.09 4.97 1.24 0.82
Extrinsic 5.81 0.86 5.62 1.07 0.71
Task Value 5.67 1.04 5.60 1.16 0.90
Control Beliefs 5.69 0.81 5.68 0.89 0.71
Self-Efficacy 5.52 0.93 5.98 0.84 0.92
Test Anxiety 4.22 1.36 4.29 1.49 0.83
Rehearsal 5.04 0.92 4.83 1.24 0.57
Elaboration 4.75 0.94 5.03 1.09 0.75
Organization 4.54 1.19 4.76 1.40 0.73
Critical Thinking 4.09 1.17 4.31 1.26 0.82
Self-Regulation 4.52 0.79 4.67 0.82 0.76
Time Man-agement
4.96 0.85 5.13 0.93 0.72
Effort Regulation 4.99 1.06 5.18 1.11 0.68
Peer Learning 3.76 1.54 3.49 1.68 0.81
Help Seeking 3.82 1.30 3.60 1.25 0.66
Note: Some MSLQ items for learning strategy subscales were reverse coded according to Duncan and McKeachie (2005) prior to generating the average scores reported above.
College & University | 35
abundantly reported in Year 1 than in Year 0, it was sur-prising to see that the only MSLQ difference was between Year 1 and Year 0 students’ self-efficacy—and that it was Year 1 students who reported higher self-efficacy. With the increase in the proportion of de-motivated students, it could have very well turned out that Year 1 students re-ported lower ratings for things like intrinsic goals and/or time management.
According to Cao (01), procrastinating learners report high performance-avoidance goals, low mastery-approach goals, and low task values. Additionally, Cao cites the work of Wolters (00), who reported finding that procrastination, was negatively associated with self-efficacy. So our findings of an increased proportion of de-motivated (i.e., procrastinating) students in Year 1 and a higher reported mean for self-efficacy is unique. One explanation could be that despite becoming more easily bored and/or procrastinating more on their coursework, students’ experience of fifteen-week semesters rather than ten-week quarters promoted a sense that more time was available in which to achieve a desirable outcome. Stu-dents who performed well on the quarter system—perhaps cramming for exams and working on shorter timelines/deadlines—may have perceived the longer fifteen-week semester as less challenging. Another explanation is that course instructors may not have challenged their students adequately once the semester calendar was adopted—and/or they prolonged their instruction without chang-ing their syllabuses from a quarter to a semester timeline. Finally, it is also possible that these findings naturally oc-cur when an institution converts to semesters—or they may be a fluke. (This is unlikely, however, given that all other MSLQ scales and comparisons were consistent from Year 0 to Year 1.)
LIMITATIONS AND FUTURE DIRECTIONS
Very little research exists regarding the assessment of stu-dent motivation during semester conversion, yet many institutions across the United States have considered this transition (see Mayberry 009, Smith 01). For this rea-son, we believe that our novel findings may help establish a useful foundation for decision making at institutions con-sidering semester conversion. Of course, we recognize the limitations of this mixed methods study and offer recom-mendations for improving upon this line of research. The
generalizability of our findings is limited, so we encourage future researchers to assess larger and more diverse stu-dent populations (perhaps with varying academic majors, transfer status, demographic characteristics, and/or grade levels). Replicating our study is necessary to determine the temporal and ecological validity of our findings. We also encourage the assessment of faculty motivational and in-structional characteristics because such data can lend in-sight into how faculty might enhance students’ self-efficacy.
We decided early on to minimize response bias by re-cruiting different samples for our questionnaires; yet we suggest that future research collect data on students’ motivation using only one sample so that correlations be-tween favoritism and self-reported motivation and learn-ing strategy use can be analyzed. And although we were limited by identifying individual students with whom to follow up from Year 0 to Year 1, we encourage researchers to consider a more traditional longitudinal design. Finally, although it appears that more institutions are converting from quarters to semesters (Smith 01), we encourage researchers to seize on opportunities to assess students’ motivation during other calendar changes—perhaps from semesters to quarters or with altered start and end dates of the academic calendar.
IMPLICATIONS
The results of this mixed methods study have practical and theoretical implications for institutions considering or ex-periencing calendar conversions, specifically from quar-ters to semesters. From a theoretical standpoint, this study provides a foundation upon which future research can build; it thereby helps to ground a theory of student moti-vation during semester conversion. One of the advantages to semester conversion that the University of Cincinnati (01b) promoted was that semesters provide greater op-portunities for “in-depth teaching and classroom proj-ects.” Our findings not only support this but also confirm other perceived advantages and disadvantages of quarters as well as semesters. Our findings of an increased pro-portion of Year 1 students reporting being de-motivated yet also observing a statistically higher self-reported self-efficacy in Year 1 than Year 0 are significant. Literature concerning self-efficacy primarily touts its relationship to other adaptive learner characteristics (e.g., achievement, mastery orientations, etc.) (see Wolters 00). However,
College & University | 36
our results suggest that self-efficacy can remain high de-spite students’ perceived boredom and procrastination. Thus, self-efficacy theorists (see Bandura 01, Usher and Pajares 008) may consider taking note of our findings to explain rare circumstances in which self-efficacy and mal-adaptive characteristics like boredom can coexist.
Our findings have practical implications for those at institutions considering and/or experiencing semester conversion. The findings can be used to inform decision makers, administrators, public relations, and student services personnel of students’ favoritism and perceived advantages/disadvantages of quarters and semesters. An institution’s public relations department can utilize the advantages (see Table 1) to better tailor its resources to promote semester conversion. Student services person-nel can utilize the findings to inform the identification of better ways of preparing students for semester conversion and/or for the tailoring of strategies for fostering students’ adoption of time management, effort regulation, and self-regulatory skills once a semester calendar is implemented.
Many U.S. institutions may be considering converting from academic quarters to semesters. This study provides important information about student attitudes and mo-tivational characteristics during such a transition. Institu-tions planning to convert to semesters should be explicit and vocal about the mastery benefits of doing so; students may accept the transition more readily when mastery ben-efits are emphasized and when help from student services personnel facilitates their adoption of time management and self-regulatory skills that may aid in combating bore-dom and/or procrastination. Participants in the current study have completed a year on the semester calendar. Increases in the proportion of students favoring semesters and identifying increases in self-efficacy lead us to believe that the institution’s efforts and transition have been suc-cessful; students at this institution may reap even greater rewards in the form of higher academic achievement as it is well-documented that increased self-efficacy strongly pre-dicts adaptive learning outcomes (e.g., academic achieve-ment, mastery learning, etc.) (Usher and Pajares 008).
REFERENCESAmes, C. 199. Classrooms: Goals, structures, and student motivation.
Journal of Educational Psychology. 8(): 1–71.Anderman, E. M., and C. Wolters. 00. Goals, values, and affect. In
Handbook of Educational Psychology, edited by P. Alexander and P. Winne. Mahwah, NJ: Lawrence Erlbaum. 9–90.
Anderman, L. H., and E. M. Anderman. 009. Oriented towards mastery: Promoting positive motivational goals for students. In Handbook of Positive Psychology in the Schools, edited by R. Gilman, E. S. Heubner, and M. Furlong. New York, NY: Routledge. 11–17.
Bandura, A. 01. On the functional properties of perceived self-efficacy revisited. Journal of Management. 8(1): 9–.
Barker, K. L., D. M. McInerney, and M. Dowson. 00. Performance ap-proach, performance avoidance and depth of information processing: A fresh look at relations between students’ academic motivation and cognition. Educational Psychology: An International Journal of Experi-mental Educational Psychology. (): 71–89.
Bude, L., T. Imbos, M. W. van de Wiel, and M. P. Berger. 011. The effect of distributed practice on students’ conceptual understanding of statis-tics. Higher Education: The International Journal of Higher Education And Educational Planning. (1): 9–79.
Cao, L. 01. Examining “active” procrastination from a self-regulated learning perspective. Educational Psychology. (): 1–.
Duncan, T. G., and W. J. McKeachie. 00. The making of the motivated strategies for learning questionnaire. Educational Psychologist. 0(): 117–18.
Durik, A. M., C. M. Lovejoy, and S. J. Johnson. 009. A longitudinal study of achievement goals for college in general: Predicting cumula-tive GPA and diversity in course selection. Contemporary Educational Psychology. (): 11–119.
Farkas, K. 01. State universities, community colleges, switching from quarters to semesters. Retrieved June 18, 01 from: <www.cleveland.com/metro/index.ssf/01/0/state_universities_and_communi.html>.
Fingerhut, E. D. 01. Definition of Semester Credit Hours. Retrieved July 1, 01 from: <http://regents.ohio.gov/actions/documents/010/Dir010–01.pdf>.
Gonzalez, J. 01. A third of students transfer before graduating, and many head toward community colleges. The Chronicle of Higher Edu-cation. February 8. Retrieved January , 01 from: <http://chroni-cle.com/article/A-Third-of-Students-Transfer/109/>.
Jackson, S. 01. Ohio State’s semester switch effects still not fully real-ized. The Lantern. October 0. Retrieved January , 01 from: <http://thelantern.com/01/10/ohio-states-semester-switch-effects-still-fully-realized/>.
Johnson, M. L., and E. M. Nussbaum. 01. Achievement goals and cop-ing strategies: Identifying the traditional/nontraditional students who use them. Journal of College Student Development. (1): 1–.
Jokinen, B. L. 01a. Semester conversion tough on enrollment, schools tout diversity. The Lima News. October 1.
———. 01b. Semester preparation tough work, but going smoothly. The Lima News. August .
Kaplan, A., M. Gheen, and C. Midgley. 00. Classroom goal structure and student disruptive behaviour. British Journal of Educational Psy-chology. 7(): 191.
Linnenbrink, E.A., and P. R. Pintrich. 00a. Achievement goal theory and affect: An asymmetrical bidirectional model. Educational Psy-chologist. 7(): 9–78.
———. 00b. The role of motivational beliefs in conceptual change. In Reconsidering Conceptual Change: Issues in Theory and Practice, edited by M. Limon and L. Mason. Dordrecht: Kluwer Academic Publishers.
Mayberry, K. 009. Quarter-to-Semester Calendar Conversion. Roches-ter Institute of Technology. Retrieved March , 01 from: <www.rit.edu/conversion/media/documents/CalendarConversionReportby DrMayberry.pdf>.
Ohio Faculty Council. 01. Meeting minutes. OhioHigherEd. Retrieved July 1, 01, from <www.ohiohighered.org/ofc/minutes#.UAyB-KMcCSo>.
Ohio State University. 01. Semester Conversion. Ohio State University. Retrieved July 1, 01 from: <http://oaa.osu.edu/semesterconver-sion.html>.
College & University | 37
———. 011. Semester Conversion Resources. The Ohio State University, Mansfield. Retrieved January , 01 from: <http://mansfield.osu.edu/academics/011–07–0–1––11/semester-conversion>.
Pajares, R., and T. Urdan. 00. Adolescence and Education: Vol. 5. Self-Efficacy Beliefs of Adolescents. Greenwich, CT: Information Age.
Peggy, P., J. R. Sullivan, and N. S. Guerra. 007. A closer look at college students: Self-efficacy and goal orientation. Journal of Advanced Aca-demics 18(): –7.
Pintrich, P. R., D. A. F. Smith, and T. Garcia. 199. Reliability and predic-tive validity of the Motivated Strategies for Learning Questionnaire (MSLQ). Educational & Psychological Measurement. : 801–81.
Pyle, E. 01. Switch to semesters looms for college kids near graduation. The Columbus Dispatch. February . Retrieved June 18, 01 from: <www.dispatch.com/content/stories/local/01/0/0/switch-to-semesters-looms-for-college-kids-near-graduation.html>.
———. 009. Ohio State to switch to semesters. The Columbus Dispatch. March 1. Retrieved June 18, 01, from <www.dispatch.com/content/stories/local/009/0/1/OSU_semesters.html>.
———. 007. OU semester-quarter debate rolls on. High Beam. July . Retrieved June 18, 01 from: <www.highbeam.com/doc/1G1–1807.html>.
Quann, C. J. 1998. Converting from quarter to early-start semester: Ob-servations through a rear-view mirror. College and University. 7(1): 0–.
Reilly, M. B. 011. Semester conversion update: Curricular revisions, bridge courses, asking students to meet with advisors. UC News. January 18. Retrieved July 1, 01 from: <www.uc.edu/news/NR.aspx?id=1971>.
Schunk, D. H., P. R. Pintrich, and J. L. Meece. 01. Motivation in Educa-tion: Theory, Research, and Applications. Upper Saddle River, NJ: Pear-son Prentice Hall.
Sinha, S. P., and P. Kumar. 000. Parental inducement of self-regulation, learning/performance goal orientation and strategy use among school students. Journal of Psychological Researches. (1): –8.
Slavin, R. E. 00. Educational Psychology: Theory and Practice, 8th ed. Upper Saddle River, NJ: Pearson Prentice Hall.
Smith, M. 01. Strength in numbers. Inside Higher Ed. February 7. Retrieved November 1, 01 from: <www.insidehighered.com/news/01/0/07/colleges-increasingly-switching-quarters-semesters>.
Titus, G. 01. Semester vs. quarter: What you need to know when trans-ferring credits. Rasmussen College. September 7. Retrieved January , 01 from: <www.rasmussen.edu/student-life/blogs/career-services/Semester-vs-Quarter-Need-to-Know-When-Transferring-Credits/>.
University of Cincinnati. 01a. Ohio institutions converting to semes-ters. Semester Conversion. Retrieved July 1, 01, from <www.uc.edu/conversion/faqs/ohio_schools.html>.
———. 01b. General FAQ. Semester Conversion. Retrieved July 1, 01 from: <www.uc.edu/conversion/faqs/general.html#prepare>.
———. 01c. Glossary of semester terms. Semester Conversion. Re-trieved January , 01 from: <https://www.uc.edu/conversion/faqs/glossary.html>.
University System of Ohio. 01. Academic calendar conversion. Ohio-HigherEd. Retrieved July 1, 01 from: <www.ohiohighered.org/calendar-conversion#.UAxPbMcCSp>.
Usher, E. L., and F. Pajares. 008. Sources of self-efficacy in school: Criti-cal review of the literature and future directions. Review of Educational Research. 78(): 71–79.
Wolters, C.A. 00. Understanding procrastination from a self-regulated learning perspective. Journal of Educational Psychology. 9(1): 179–187.
Wright State University. 01. Semester transition advising: Pledge to students. Wright State University. Retrieved January , 01 from: <www.wright.edu/semesters-advising/maps-my-advising-plan/pledge-to-students>.
About the Authors
MARCUS LEE JOHNSON is an Assistant Professor of Educational Studies at the University of Cincinnati. His research focuses on “motivation in edu-cation.” Through the Developmental and Learning Sciences Research Center, Dr. Johnson works alongside his students and colleagues on research pursuits concerning developmental perspectives, cognitive neu-roscience, and student development in higher education.
JESSICA L. KESTLER is a doctoral student in the Educational Studies pro-gram at the University of Cincinnati. Her research focuses primarily on motivation, neuroimaging, and human development. Jessica currently works on research pursuits through the Developmental and Learning Sci-ences Research Center, as well as the Center of Imaging Research in the College of Medicine at the University of Cincinnati.
ACKNOWLEDGMENTS: We would like to thank Drs. Heather Dawson (Vir-ginia Commonwealth University) and Gale Sinatra (University of Southern California) for their support and encouragement of this study.

THIS ARTICLE FOCUSES ON THE RESEARCH BEING CONDUCTED BY CAMBRIDGE
INTERNATIONAL EXAMINATIONS (CAMBRIDGE) TO ENSURE THAT ITS INTERNATIONAL
ASSESSMENTS PREPARE STUDENTS AS WELL AS OTHER ACCELERATION PROGRAMS
FOR CONTINUED STUDY IN U.S. COLLEGES AND UNIVERSITIES. THE STUDY, WHICH
BUILDS ON PREVIOUS FRESHMAN GPA DATA MODELING WORK USING DATA
SUPPLIED BY FLORIDA STATE UNIVERSITY, IS DESIGNED TO INVESTIGATE THE IMPACT
OF THE CAMBRIDGE PROGRAM ON VARIOUS ASPECTS OF UNIVERSITY ENGAGEMENT.
Assessing the
Impact of the
on U.S. University Determinants of Success
A Multi-Level Modeling Approach
INTERNATIONAL ACCELER ATION PROGR AMCAMBRIDGE

College & University | 39
By Stuart Shaw, Jayne Warren, and Tim Gill
This study is part of an ongoing initiative to evaluate the predic-tive validity of the Cambridge ac-celeration program in the United States. Establishing predictive validity by relating high school performance to later academic performance has a long and estab-
lished heritage in U.S. educational research (see, e.g., Bur-ton and Ramist 001; Cohn, Manion and Morrison 007; Culpepper and Davenport 009; Kobrin et al. 008; Len-ning 197; Sadler and Sonnert 010). The long-term pur-pose of the Cambridge research agenda is to highlight the effectiveness of Cambridge assessments at predicting stu-dents’ preparedness for and continued academic success at U.S. universities as evidenced by first-year college and cu-mulative grade point average (GPA) as well as other perfor-mance outcomes. Tertiary-level academic success as used
here is determined by the persistence of a student with a specific GPA within the university.
The first phase of research used data collected from three cohorts of students enrolled at Florida State Uni-versity (Shaw and Bailey 011a, 011b). The data included information about each student’s performance at high school, ethnicity, gender, and first-year university GPA. Multi-level modeling was used to investigate the rela-tionships among the variables and to determine which were the best indicators of academic success at university while taking into account the effects of individual high schools. Findings suggested that the Cambridge accelera-tion program compared favorably with other acceleration programs in the United States, including Advanced Place-ment (AP) and the International Baccalaureate (IB).
This second phase of research, based on new data pro-vided by Florida State University (FSU), attempts to ad-dress the impact of the Cambridge and other acceleration
INTERNATIONAL ACCELER ATION PROGR AMCAMBRIDGE
College & University | 40
programs on various aspects of university engagement. Student participation in undergraduate research, for ex-ample, is one of several indicators of college success. The inclusion of research in the undergraduate curriculum has been widely endorsed by U.S. educators and policy makers (Boyer Commission 1998; Hu 01; Kuh 008). Undergraduate research is also associated with greater student retention/persistence (Banta 00; Craney et al. 011; Inkelas et al. 01; Lopatto 00; Russell, Hancock and McCullough 007). Consequently, this study en-tails expanding the freshman GPA data modeling work of Phase 1 to include a longitudinal study comparing degree completion by Cambridge, AP, and IB cohorts at FSU. The likelihood of students’ pursuing additional undergradu-ate educational, professional, and research opportunities is also modeled, and findings are compared across the AP, IB, and Cambridge cohorts.
U.S. ACCELERATION PROGRAMS AND THEIR IMPACT ON COLLEGE PERFORMANCE
The successful transition from high school to postsecond-ary study is contingent upon a student being college ready (Conley 010, 011; Camara 01). College readiness is receiving ever greater focus in the United States as college aspirations rise and public policy promotes college readi-ness for all (Duncan and Martin 010; U.S. Department of Education 00a, 00b, 010). U.S. students and uni-versities must consider all available indicators for success in higher education, including the offer of college-level coursework to high school students. High school accel-eration strategies thus are seen as one of the main policy mechanisms for increasing college enrollment and foster-ing tertiary-level success as they can have positive effects on cognitive strategies, content knowledge, and learning and behavioral skills and techniques.
HIGH SCHOOL ACCELERATION PROGRAMS
Advanced Placement
Since its inception in 19, Advanced Placement has be-come the most common and rapidly expanding accelera-tion mechanism in the United States. The College Board claims that the AP program can offer students advantages in terms of college success; that the program not only facili-tates the narrowing of achievement gaps but also enriches
students’ high school experiences; and that high schools prepared to offer AP can be thought of as ‘gold standard’ institutions (see Challenge Success [01] for an evaluation of the four College Board claims for AP). AP examinations are offered in 7 subjects across languages, science, and social science. Schools in all states and some schools out-side the United States offer AP courses. Between 00 and 009, the College Board (009) reported that the number of students taking AP courses increased dramatically—by almost 0 percent—to 1. million. There is every indication that the number will continue to increase. Recognition of this credential is almost universal among U.S. universities.
Impact on College Performance
Students who hold AP qualifications have been shown to outperform those who do not in both first-year college performance and college completion (Curry, MacDonald and Morgan, 1999; Dougherty, Mellor and Jian 00; Mat-tern, Shaw and Xiong 009; Morgan and Maneckshana 000; Morgan and Ramist 1998). After controlling for a number of background variables—including academic ability and prior course history and performance, Sadler and Sonnert (010) demonstrated that students who pass AP exams in the sciences earn significantly higher grades in biology, chemistry, or physics in college than those students who failed the exams. Two recent large-scale impact studies have examined the long-term impact of AP on measures of college success. Hargrove, Godin, and Dodd (008) examined the student performance data of AP students and a non-AP comparison group for five co-horts of Texas public high school graduates through to their fourth year of college. In total, data for ,89 stu-dents from a range of backgrounds attending a number of Texas universities were collected. Results revealed signifi-cant “evidence of benefits to students who participate in both AP courses and exams in terms of higher GPAs, credit hours earned, and four-year graduation rates” (Hargrove, Godin, and Dodd 008, p. 1). In a second, related study, Keng and Dodd (008) compared the performance of AP students to that of non-AP students on a number of col-lege outcome measures. Exams representing ten subject ar-eas were examined in this study of ,91 students in four entering classes at the University of Texas at Austin. Keng and Dodd (008) confirmed the findings of the Hargrove, Godin, and Dodd (008) study: AP students performed

College & University | 41
at least as well if not better than non-AP students on most college outcome measures. Students who had used their AP credits in order to embark upon advanced college courses achieved higher grades in those courses than those students who first took college introductory courses in-stead of any of the ten individual AP exams.
When the confounding effects of self-selection by stu-dents (with more able students joining AP programs) and inter-school differences (with better resourced schools more likely to adopt the AP program and to have it taught by more experienced teachers) are taken into account, however, the picture is more complex (Klopfenstein and Thomas 00; Paek, Ponte, Sigel, Braun, and Powers, 00). Klopfenstein and Thomas (009), for example, found no relationship between AP experience and either first-semester college grades or retention to the second year after controlling for these factors. Other studies have also attempted to control for a number of background variables, such as family income, socioeconomic factors, and parental education (Duffy 010; Geiser and Santelices 00; Klopfenstein and Thomas 00) and have reported no significant relationship between students’ having taken AP courses and students’ first-year performance.
International Baccalaureate
The International Baccalaureate (IB) Diploma originated outside the United States in the late 190s and has be-come prevalent in U.S. high schools in the past ten years (Bunnell 010). The program prepares students for ter-tiary study by developing their critical thinking skills, ability to learn independently and in groups, communi-cation skills, and sense of self-identity and culture. The curriculum comprises six core courses, each chosen from one of the following categories: primary language, second language, individuals and society, sciences, mathematics (within which computer science is an additional elective), and the arts. (See <www.ibo.org/diploma/curriculum/>.) Typically taught over a two-year period, the IB claims a program of learning and assessments that prepare eleventh and twelfth grade students for success at university and be-yond. The IB works with more than ,000 schools in more than 10 countries to offer IB programs to approximately one million students. The IB has gained recognition and respect from the world’s leading universities and now is recognized by U.S. universities as being similar to the AP.
Impact on College Performance
The efficacy of the IB as a pre-university acceleration pro-gram has been investigated by Panich (001). In a study of the university performance of IB students, Panich (001) matched three cohorts of IB graduates (1998 through 000) attending FSU with students entering with compa-rable SAT verbal and math scores. Comparing groups of students with no IB background, students with IB expe-rience, and students with an IB diploma, Panich (001) concluded that IB diploma students achieved the highest average first-year university GPA while students with IB experience but no diploma achieved the lowest. In a study designed to explore IB students’ postsecondary outcomes, Taylor and Porath (00) canvased the views of former IB students. These students had completed their secondary education at two public high schools in British Columbia between 199 and 000. Students believed that the critical thinking skills they learned in the IB course together with the development of non-cognitive study skills such as time management equipped them well for university studies. Duevel (1999) asked college registrars representing twelve universities to comment on IB students’ perseverance and attainment. Just over 90 percent of IB diploma holders earned bachelor’s degrees, and nearly as many earned their degrees in five or fewer years. In the same study, just over half of all IB graduates reported attending graduate school and claimed that their participation in the IB had a positive impact on their college experience. Investigating the ben-efits of the IB Extended Essay for University Studies at the University of Virginia (UVA), Inkelas et al. (01), using a mixed-methods case study approach, explored the ways in which the extended essay (up to ,000 words) helps to prepare students for their studies in terms of academic performance, retention, willingness to engage in more re-search, and future plans. Findings suggested that former IB students studying at UVA were significantly more likely than their AP counterparts to indicate preparedness for postsecondary coursework involving research.
A study of the Chicago inner-city IB program found that students who took the IB were more likely to attend a four-year college and demonstrated higher two-year per-sistence rates (Coca et al. 01). IB students reported that they felt academically prepared, but research uncovered a deficit in transition knowledge and skills that suggested that, in this area, the IB program had not compensated

College & University | 42
for the effects of students’ disadvantaged backgrounds. A second, related study of the Chicago program found that the IB increases high school graduation and college enroll-ment rates (Saavedra 011).
Cambridge International Advanced Level
Cambridge International Advanced Subsidiary Levels (AS Levels) and Advanced Levels (A Levels) are a global set of examinations administered by Cambridge Interna-tional Examinations (Cambridge). (See <www.cie.org.uk/qualifications/academic/uppersec/alevel>.) The levels develop learners’ knowledge, understanding, and skills in in-depth subject content and encourage independent, logical thinking. Cambridge offers a choice of subjects that schools can offer in almost any combination. Schools can build an individualized curriculum, and learners can choose whether to specialize in a particular subject area or to study a range of subjects. Cambridge International A Level is typically a two-year course, and Cambridge Inter-national AS Level is typically a one-year course.
Students can also earn a Cambridge AICE Diploma by passing a prescribed number of Cambridge International AS- and/or A-Level examinations, including one from each of three subject groups: mathematics and sciences; languages (foreign and first); and arts and humanities. In the United States, Cambridge AS- and A-Level examina-tions are sometimes referred to as ‘Cambridge AICE’ or ‘AICE’ examinations. The Cambridge AICE Diploma pro-gram was successfully piloted between 1997 and 000 in Florida, where it continues to receive legislative support and funding. Students who pass the AS- and A-Level ex-aminations may be awarded entry- or intermediate-level university course credit by examination. Yet recognition by U.S. universities is not universal. (As with IB, Cam-bridge is widely recognized outside the United States.)
Impact on College Performance
A comparative study of the effects of the AS/A-Level program on first-year GPA at FSU found that on average, students’ prior participation in acceleration programs re-sulted in better GPAs than their peers’ non-participation in any such programs (Shaw and Bailey 011a, 011b). In par-ticular, the study revealed that after controlling for gender, race, and SAT score, Cambridge students achieved a higher
GPA, on average, than IB students and students who had not previously earned college credit. On all of the models tested, there was no evidence of any statistical difference between Cambridge and AP students.
A growing body of qualitative evidence demonstrates the impact of the Cambridge International AS-and A-Level programs on teaching and learning (Shaw 011). Data have been collected using a range of impact elicita-tion techniques, including perceptual questionnaires, semi-structured interviews, focused discussion groups, and lesson observations. More than 700 Cambridge stu-dents and their teachers took part in the study at five high schools in Florida and West Virginia. In addition, opportu-nistic data from 17 former Cambridge students studying at universities in Florida and Minnesota were collected. The students were at various stages in their postsecondary pro-grams and were studying across a range of disciplines. The research provided evidence that the Cambridge program:
W is challenging, particularly when compared with other intellectually stimulating acceleration mechanisms;
W encourages good study habits; W includes courses that motivate and satisfy students be-cause of their focus and the range of relevant
▶ activities (particularly interactive, communicative ones), ▶ skills (particularly writing and speaking), and ▶ materials (inspired by the content of the Cambridge examination itself );
W fosters eclectic pedagogical and methodological ap-proaches;
W provides positive effects on pedagogic practice and course materials; and
W successfully prepares students for postsecondary pro-grams of study (particularly freshman studies).
The literature clearly addresses the broad claim that certain acceleration strategies establish a college-level standard in U.S. high schools. A second claim is that the standard promotes greater academic success and college graduation rates for those students who choose to utilize various acceleration strategies (including dual enrollment and early college enrollment). Even a cursory review of the literature suggests that much more research must be un-dertaken if such claims are to be fully substantiated.
College & University | 43
RESEARCH QUESTIONSThe questions underpinning this study focus on the Cam-bridge acceleration program. (The term ‘AICE’ is used here as a generic label for the Cambridge AS and/or A Levels.) The study was designed to determine answers to the fol-lowing questions:
W Is there a relationship between participation in AICE and university performance (as measured by cumula-tive FSU GPA) after accounting for attainment at the end of high school (as measured by SAT scores) and other background variables (e.g., gender, race, etc.)?
W Is there a relationship between participation in AICE and university engagement (as measured by participa-tion in extra programs such as directed individual stud-ies, honors program, honors in major, or study abroad) after accounting for attainment at the end of high school (as measured by SAT scores) and other back-ground variables (e.g., gender, race)?
W Is there a relationship between participation in AICE and retention rate after accounting for attainment at the end of high school (as measured by SAT scores) and other background variables (e.g., gender, race)?
DATA AND MEASUREMENT CONSIDERATIONS
Context: Florida State University
The research utilized a case-study approach using opportu-nistic data collected from Florida State University (FSU). FSU is one of the largest and oldest of the eleven institu-tions in the State University System of Florida. Founded in 181 and located in the state capital of Tallahassee, FSU is a comprehensive, national graduate research university with medical programs and very high research activity as determined by the Carnegie Foundation. FSU started the 010–11 academic year with a student population of approximately 0,000 (with more than 8,00 graduate students) and recognition as a major graduate research institution with an established international reputation. Admission to FSU is competitive and is based on graduat-ing from a regionally accredited high school with specific high school academic units, a cumulative weighted GPA, and test scores. The academic profile of the middle 0 per-cent of freshmen accepted in 01 was weighted GPA of .9 to .7; ACT composite score of to 0; and SAT total
score of 170 to 190. Up to semester hours of credit can be awarded on the basis of students’ achievement of qualifying scores on the AICE, AP, IB, or CLEP (College Level Examination Program).
Identifying and Accessing Data
The feasibility of identifying, collecting, and analyzing data in support of the claim that the Cambridge accel-eration program provides a solid grounding for continued study at U.S. colleges and universities requires careful con-sideration (Hawkey 00). The identification and acquisi-tion of data relevant to this study proved to be an iterative, protracted process requiring extensive dialogue between researchers and the FSU admissions team.
Table 1 (on page ) provides a list of generic data requirements with accompanying explanations. Table (on page ) lists all outcome variables and their defini-tions. The variables relating to the different acceleration programs measured the number of credit hours earned by each student undertaking the program. The number of hours earned depends on the subject and qualification, but it is usually three hours per qualification passed.
Table (on page ) shows the numbers of students in the Florida State University data set and their participa-tion in secondary school acceleration programs.
METHODOLOGY AND ANALYSIS
Initial analyses entailed an exploratory use of descriptive statistics in order to plot a number of distributions (e.g., FSU cumulative GPA, number of hours of credits earned in each acceleration program). However, descriptive data analysis takes no account of background factors that may have an impact on performance at FSU and participation in extra programs. To account for these, a series of multi-level regression models was undertaken to assess the impact of AICE (as well as AP and IB) on university performance and engagement. Multi-level modeling is a way of finding a line of regression through different groups, nests, or hierarchies of data. Multi-level models have been used in several pre-dictive validity studies to take into account the hierarchical structure of educational assessment data (see, for example, Bell and Dexter 000; Shaw and Bailey 011a, 011b).
The models used for this study have three levels, with students nested in years (of matriculation), nested in high
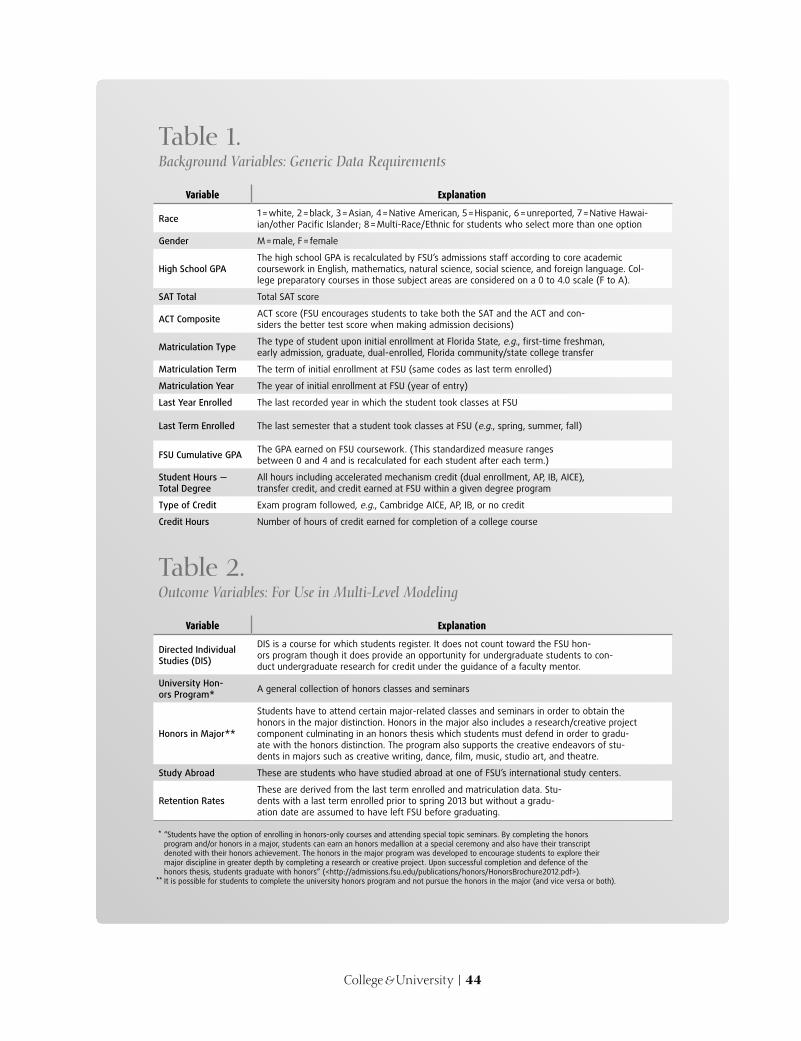
College & University | 44
Table 1. Background Variables: Generic Data Requirements
Variable Explanation
Race1 = white, 2 = black, 3 = Asian, 4 = Native American, 5 = Hispanic, 6 = unreported, 7 = Native Hawai-ian/other Pacific Islander; 8 = Multi-Race/Ethnic for students who select more than one option
Gender M = male, F = female
High School GPAThe high school GPA is recalculated by FSU’s admissions staff according to core academic coursework in English, mathematics, natural science, social science, and foreign language. Col-lege preparatory courses in those subject areas are considered on a 0 to 4.0 scale (F to A).
SAT Total Total SAT score
ACT CompositeACT score (FSU encourages students to take both the SAT and the ACT and con-siders the better test score when making admission decisions)
Matriculation TypeThe type of student upon initial enrollment at Florida State, e.g., first-time freshman, early admission, graduate, dual-enrolled, Florida community/state college transfer
Matriculation Term The term of initial enrollment at FSU (same codes as last term enrolled)
Matriculation Year The year of initial enrollment at FSU (year of entry)
Last Year Enrolled The last recorded year in which the student took classes at FSU
Last Term Enrolled The last semester that a student took classes at FSU (e.g., spring, summer, fall)
FSU Cumulative GPAThe GPA earned on FSU coursework. (This standardized measure ranges between 0 and 4 and is recalculated for each student after each term.)
Student Hours — Total Degree
All hours including accelerated mechanism credit (dual enrollment, AP, IB, AICE), transfer credit, and credit earned at FSU within a given degree program
Type of Credit Exam program followed, e.g., Cambridge AICE, AP, IB, or no credit
Credit Hours Number of hours of credit earned for completion of a college course
Table 2. Outcome Variables: For Use in Multi-Level Modeling
Variable Explanation
Directed Individual Studies (DIS)
DIS is a course for which students register. It does not count toward the FSU hon-ors program though it does provide an opportunity for undergraduate students to con-duct undergraduate research for credit under the guidance of a faculty mentor.
University Hon-ors Program*
A general collection of honors classes and seminars
Honors in Major**
Students have to attend certain major-related classes and seminars in order to obtain the honors in the major distinction. Honors in the major also includes a research/creative project component culminating in an honors thesis which students must defend in order to gradu-ate with the honors distinction. The program also supports the creative endeavors of stu-dents in majors such as creative writing, dance, film, music, studio art, and theatre.
Study Abroad These are students who have studied abroad at one of FSU’s international study centers.
Retention RatesThese are derived from the last term enrolled and matriculation data. Stu-dents with a last term enrolled prior to spring 2013 but without a gradu-ation date are assumed to have left FSU before graduating.
* “Students have the option of enrolling in honors-only courses and attending special topic seminars. By completing the honors program and/or honors in a major, students can earn an honors medallion at a special ceremony and also have their transcript denoted with their honors achievement. The honors in the major program was developed to encourage students to explore their major discipline in greater depth by completing a research or creative project. Upon successful completion and defence of the honors thesis, students graduate with honors” (<http://admissions.fsu.edu/publications/honors/HonorsBrochure2012.pdf>).
** It is possible for students to complete the university honors program and not pursue the honors in the major (and vice versa or both).

College & University | 45
schools. To fit the multi-level models, data based on the re-cords of 0,1 students nested in six different matriculation years (007 through 01) nested in 1,9 schools were used.
An indicator of whether a student dropped out before graduating was calculated from the data; students with a last term enrolled prior to spring 01 but without a grad-uation date were assumed to have left FSU before graduat-ing. With a few exceptions, the university confirmed this assumption. Students may skip one semester without hav-ing to re-enroll, so a few students with a last enrollment term of fall 01 returned in summer 01. These students were identified in the data and a correction was made. It should be noted that it was not possible to know students’ reasons for not completing their courses of study at FSU (some may have transferred elsewhere), but this measure nevertheless is likely to be a good proxy for dropping out.
A substantial number of students () had the same matriculation and last enrollment dates, suggesting that they only attended the university for one term. As such, their cumulative GPA may not be particularly reliable. (Further models, excluding these students, were run, but this had very little impact on the outcomes of the models, so the results are not presented here.)
FINDINGS
Six models were tested in response to the study’s three re-search questions. Model 1 relates to the first research ques-tion; Models through relate to the second research question; and Model relates to the third research question.
!Is there a relationship between participation in AICE and university performance?
Table (on page ) presents the parameter estimates for each variable in Model 1 (performance at FSU). The esti-mate column refers to the effect of the particular variable on the outcome measure. For continuous variables (e.g., SAT total, AICE hours), it is the change in the cumulative GPA associated with a one-unit increase in the variable in question. For categorical variables (e.g., race, gender), it is the impact of being in that particular category in com-parison to the reference category. The reference category is indicated in the table by having no values in the estimate column. Thus, according to this model, the effect of be-ing black rather than white is to reduce cumulative GPA by 0. (on average).
These effects are only estimated and are subject to some error that is quantified by the standard error column. The final column in the table (Probability) indicates the level of statistical significance. Its value denotes the probability that the estimated effect could have occurred by chance. A value of less than 0.0 indicates statistical significance. In each of the tables that follows, statistically significant effects are highlighted in bold type.
There is a significant positive effect for the AICE hours variable, meaning that there is an association between the number of AICE credit hours earned and performance at FSU. However, the effect is very small (0.0087). This means that an increase of ten AICE credit hours is associ-ated with an increase in FSU cumulative GPA of 0.087. In comparison, the effect of the AP hours variable was 0.01, meaning that an increase of ten AP credit hours is asso-ciated with an increase in FSU cumulative GPA of 0.1. An increase of ten IB credit hours is associated with an increase in FSU cumulative GPA of 0.09.
A further model was run, including an interaction term for AICE and AP hours, in order to determine whether students who took a mix of these two programs performed any differently. However, the interaction term was not statistically significant. This was the case for all of the models tested.
Table 3. Participation in Acceleration Program
Acceleration Program Number of Students
AICE only 148
AICE with AP 242
AP only 16,391
AP with IB 948
IB only 1,211
AICE + AICE with AP 390
AP + AP with AICE + AP with IB 17,581
IB + IB with AP 2,159
None 11,204
All 30,144
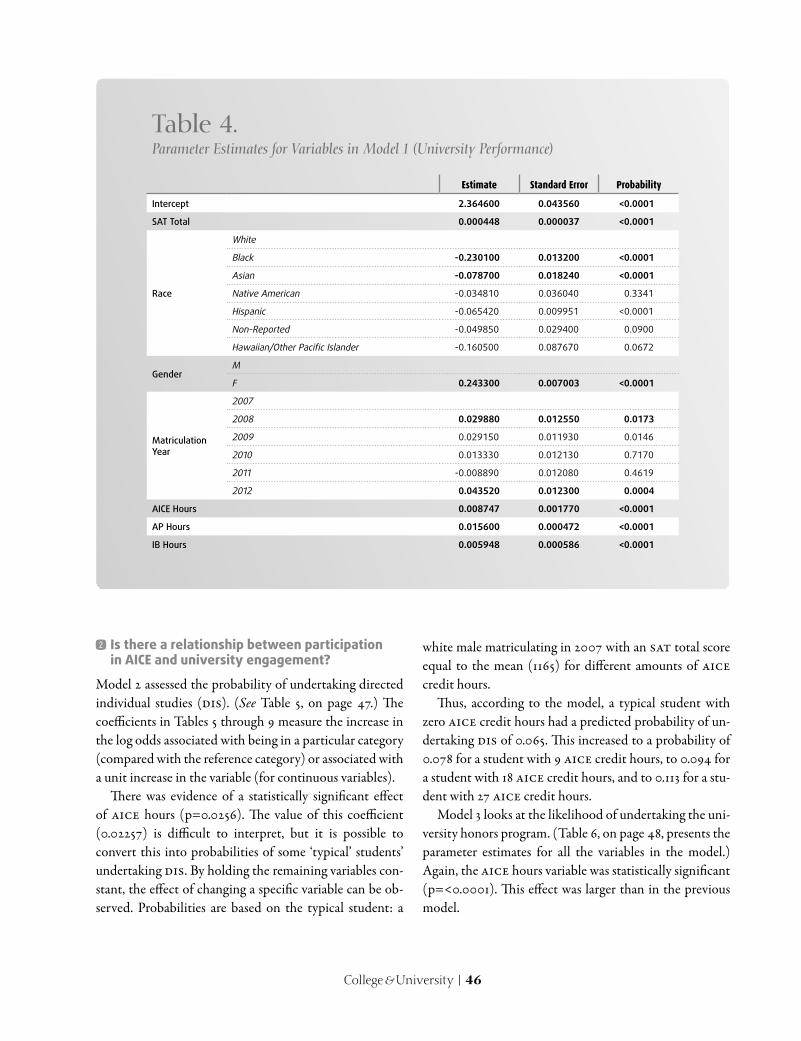
College & University | 46
@Is there a relationship between participation in AICE and university engagement?
Model assessed the probability of undertaking directed individual studies (DIS). (See Table , on page 7.) The coefficients in Tables through 9 measure the increase in the log odds associated with being in a particular category (compared with the reference category) or associated with a unit increase in the variable (for continuous variables).
There was evidence of a statistically significant effect of AICE hours (p=0.0). The value of this coefficient (0.07) is difficult to interpret, but it is possible to convert this into probabilities of some ‘typical’ students’ undertaking DIS. By holding the remaining variables con-stant, the effect of changing a specific variable can be ob-served. Probabilities are based on the typical student: a
white male matriculating in 007 with an SAT total score equal to the mean (11) for different amounts of AICE credit hours.
Thus, according to the model, a typical student with zero AICE credit hours had a predicted probability of un-dertaking DIS of 0.0. This increased to a probability of 0.078 for a student with 9 AICE credit hours, to 0.09 for a student with 18 AICE credit hours, and to 0.11 for a stu-dent with 7 AICE credit hours.
Model looks at the likelihood of undertaking the uni-versity honors program. (Table , on page 8, presents the parameter estimates for all the variables in the model.) Again, the AICE hours variable was statistically significant (p=<0.0001). This effect was larger than in the previous model.
Table 4. Parameter Estimates for Variables in Model 1 (University Performance)
Estimate Standard Error Probability
Intercept 2.364600 0.043560 <0.0001
SAT Total 0.000448 0.000037 <0.0001
Race
White
Black -0.230100 0.013200 <0.0001
Asian -0.078700 0.018240 <0.0001
Native American -0.034810 0.036040 0.3341
Hispanic -0.065420 0.009951 <0.0001
Non-Reported -0.049850 0.029400 0.0900
Hawaiian/Other Pacific Islander -0.160500 0.087670 0.0672
GenderM
F 0.243300 0.007003 <0.0001
MatriculationYear
2007
2008 0.029880 0.012550 0.0173
2009 0.029150 0.011930 0.0146
2010 0.013330 0.012130 0.7170
2011 -0.008890 0.012080 0.4619
2012 0.043520 0.012300 0.0004
AICE Hours 0.008747 0.001770 <0.0001
AP Hours 0.015600 0.000472 <0.0001
IB Hours 0.005948 0.000586 <0.0001

College & University | 47
There was a stronger relationship between AICE hours and undertaking the university honors program than there was between AICE and directed individual study. However, the probability for a student with zero AICE hours was lower. According to the model, a typical stu-dent with zero AICE credit hours had a predicted prob-ability of undertaking the university honors program of 0.00. This increased to 0.07 for a student with 9 AICE credit hours, 0.11 for a student with 18 AICE credit hours, and 0.170 for a student with 7 AICE credit hours.
Model evaluates the likelihood of undertaking hon-ors in the major. This model had difficulty converging, probably because of the very small numbers of students in this program. However, it was possible to get the model to converge by removing the multi-level structure. Table 7
(on page 8) presents the parameter estimates. Note that neither gender nor race was a significant effect, so the final model excluded these variables.
The AICE hours parameter estimate was very small and was non-significant, meaning that there was no evidence of a relationship between the number of AICE hours and the likelihood of undertaking honors in the major. Of the three acceleration programs, only AP showed a significant effect.
Model considered the likelihood of studying abroad. Table 8 (on page 0) presents the parameter estimates for this model. There was no statistically significant associa-tion between AICE hours and studying abroad. Indeed, of all the acceleration programs, only AP had a statistically significant effect, and this was small.
Table 5. Parameter Estimates for Variables in Model 2 (Directed Individual Studies)
Estimate Standard Error Probability
Intercept -4.374500 0.274600 <0.0001
SAT Total 0.001943 0.000232 <0.0001
Race
White
Black 0.109200 0.084760 0.1977
Asian 0.350000 0.101400 0.0006
Native American 0.408900 0.210000 0.0515
Hispanic 0.002639 0.062230 0.9662
Non-Reported 0.494100 0.156300 0.0016
Hawaiian/Other Pacific Islander -0.735700 0.748600 0.3257
GenderM
F 0.479600 0.045000 <0.0001
MatriculationYear
2007
2008 -0.195900 0.061120 0.0014
2009 -0.556900 0.061350 <0.0001
2010 -1.299800 0.072890 <0.0001
2011 -2.347100 0.097600 <0.0001
2012 -3.032500 0.130200 <0.0001
AICE Hours 0.022570 0.010110 0.0256
AP Hours 0.039750 0.002641 <0.0001
IB Hours 0.019140 0.002906 <0.0001

College & University | 48
Table 6. Parameter Estimates for Variables in Model 3 (University Honors Program)
Estimate Standard Error Probability
Intercept -13.077300 0.281400 <0.0001
SAT Total 0.008382 0.000234 <0.0001
Race
White
Black -0.183600 0.097860 0.0606
Asian -0.041660 0.102600 0.6847
Native American 0.222100 0.198300 0.2627
Hispanic -0.146600 0.059830 0.0143
Non-Reported -0.308200 0.165300 0.0623
Hawaiian/Other Pacific Islander -0.399700 0.592500 0.4990
GenderM
F 0.784900 0.042460 <0.0001
MatriculationYear
2007
2008 0.151100 0.079140 0.0564
2009 0.366900 0.073890 <0.0001
2010 -0.125400 0.075600 0.0974
2011 -0.457800 0.079540 <0.0001
2012 -0.378900 0.079580 <0.0001
AICE Hours 0.050280 0.008187 <0.0001
AP Hours 0.063400 0.002324 <0.0001
IB Hours 0.034710 0.002795 <0.0001
Table 7. Parameter Estimates for Variables in Model 4 (Honors in the Major)
Estimate Standard Error Probability
Intercept -11.187300 0.797100 <0.0001
SAT Total 0.004401 0.000652 <0.0001
MatriculationYear
2007
2008 1.467900 0.252400 <0.0001
2009 1.578100 0.245100 <0.0001
2010 0.862600 0.262100 0.0010
2011 -1.416100 0.441900 0.0014
2012 -3.289200 1.025800 0.0013
AICE hours -0.007890 0.033890 0.8160
AP hours 0.044980 0.005969 <0.0001
IB hours 0.010390 0.007235 0.1511
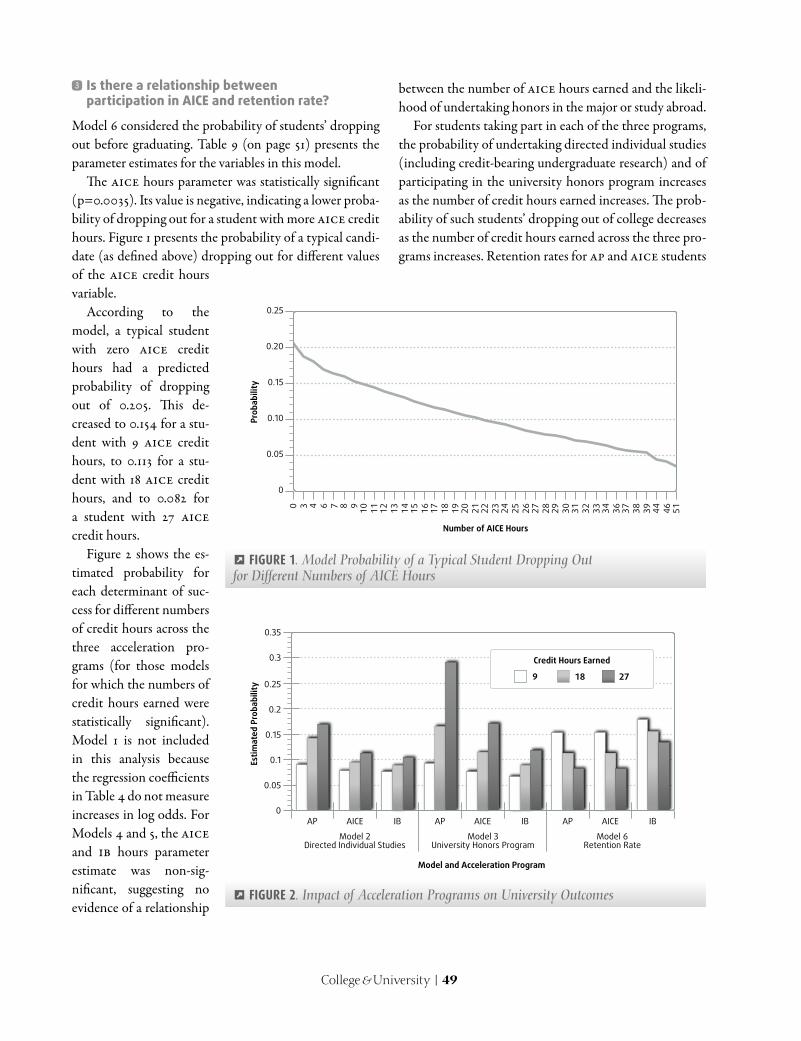
College & University | 49
#Is there a relationship between participation in AICE and retention rate?
Model considered the probability of students’ dropping out before graduating. Table 9 (on page 1) presents the parameter estimates for the variables in this model.
The AICE hours parameter was statistically significant (p=0.00). Its value is negative, indicating a lower proba-bility of dropping out for a student with more AICE credit hours. Figure 1 presents the probability of a typical candi-date (as defined above) dropping out for different values of the AICE credit hours variable.
According to the model, a typical student with zero AICE credit hours had a predicted probability of dropping out of 0.0. This de-creased to 0.1 for a stu-dent with 9 AICE credit hours, to 0.11 for a stu-dent with 18 AICE credit hours, and to 0.08 for a student with 7 AICE credit hours.
Figure shows the es-timated probability for each determinant of suc-cess for different numbers of credit hours across the three acceleration pro-grams (for those models for which the numbers of credit hours earned were statistically significant). Model 1 is not included in this analysis because the regression coefficients in Table do not measure increases in log odds. For Models and , the AICE and IB hours parameter estimate was non-sig-nificant, suggesting no evidence of a relationship
between the number of AICE hours earned and the likeli-hood of undertaking honors in the major or study abroad.
For students taking part in each of the three programs, the probability of undertaking directed individual studies (including credit-bearing undergraduate research) and of participating in the university honors program increases as the number of credit hours earned increases. The prob-ability of such students’ dropping out of college decreases as the number of credit hours earned across the three pro-grams increases. Retention rates for AP and AICE students
l FIGURE 1. Model Probability of a Typical Student Dropping Out for Different Numbers of AICE Hours
0
0.05
0.10
0.15
0.20
0.25
Prob
abili
ty
Number of AICE Hours
0 3 4 6 7 8 9 10 11 12 13 14 15 16 17 18 19 20 21 22 23 24 25 26 27 28 29 30 31 32 33 34 36 37 38 39 44 46 51
l FIGURE 2. Impact of Acceleration Programs on University Outcomes
Esti
mat
ed P
roba
bilit
y
Model and Acceleration Program
AP AICE IB AP AICE IB AP AICE IB
Credit Hours Earned
9 18 27
0
0.05
0.1
0.15
0.2
0.25
0.3
0.35
Model 2Directed Individual Studies
Model 3University Honors Program
Model 6Retention Rate

College & University | 50
are virtually identical whereas IB students have a greater risk of dropping out, irrespective of the number of credit hours earned. Students who had not participated in an acceleration program in high school were most likely to drop out of FSU. Descriptive statistics do not account for background factors, but descriptive analyses revealed that students who had taken AP courses blended with AICE or IB were the least likely to drop out of FSU. However, of those students who had taken only AP, AICE, or IB, AICE students were the least likely to discontinue their postsec-ondary studies.
DISCUSSION
This study afforded an opportunity to test whether, after accounting for attainment at the end of high school (as
measured by total SAT score) and other background vari-ables (such as gender and race), students who participate in AICE, AP, or IB acceleration programs:
W achieve a significantly higher FSU cumulative GPA than those who do not;
W increase their probability of undertaking study abroad; directed individual supervised studies; undergraduate research; and honors in a major; and
W decrease their likelihood of dropping out of college in accordance with increasing numbers of credit hours earned.
Main Messages
As with the Phase 1 study (Shaw and Bailey 011a), findings indicate that participation in an acceleration program re-
Table 8. Parameter Estimates for Variables in Model 5 (Study Abroad)
Estimate Standard Error Probability
Intercept -6.432800 0.505900 <0.0001
SAT Total 0.001903 0.000422 <0.0001
Race
White
Black -1.171200 0.239400 <0.0001
Asian -0.550000 0.257700 0.0328
Native American 0.164800 0.365700 0.6522
Hispanic 0.017540 0.106300 0.9868
Non-Reported 0.097000 0.289600 0.7377
Hawaiian/Other Pacific Islander 0.517400 0.735800 0.4819
GenderM
F 0.962000 0.089760 <0.0001
MatriculationYear
2007
2008 0.329000 0.124900 0.0085
2009 0.073550 0.125200 0.5579
2010 0.028910 0.127800 0.8211
2011 -0.284200 0.135700 0.0364
2012 -1.270300 0.184700 <0.0001
AICE Hours -0.006660 0.019830 0.7371
AP Hours 0.011370 0.004869 0.0196
IB Hours 0.003200 0.005951 0.5910
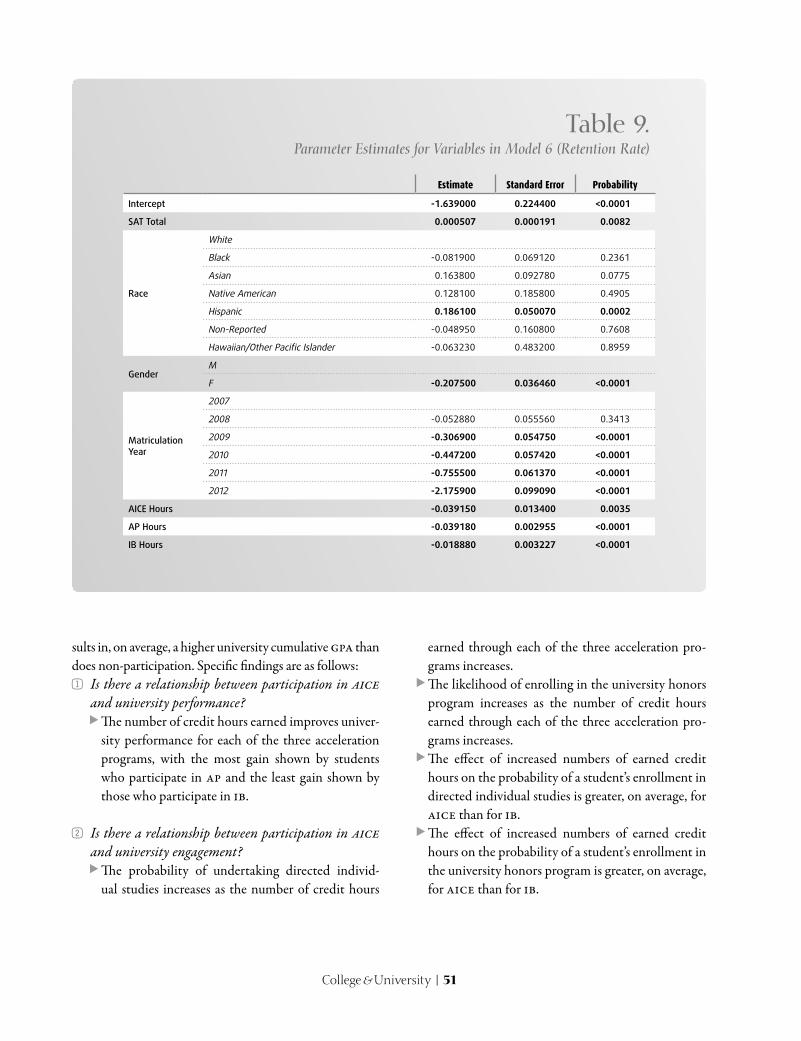
College & University | 51
sults in, on average, a higher university cumulative GPA than does non-participation. Specific findings are as follows:1.Is there a relationship between participation in AICE
and university performance? ▶ The number of credit hours earned improves univer-sity performance for each of the three acceleration programs, with the most gain shown by students who participate in AP and the least gain shown by those who participate in IB.
2.Is there a relationship between participation in AICE and university engagement?
▶ The probability of undertaking directed individ-ual studies increases as the number of credit hours
earned through each of the three acceleration pro-grams increases. ▶ The likelihood of enrolling in the university honors program increases as the number of credit hours earned through each of the three acceleration pro-grams increases. ▶ The effect of increased numbers of earned credit hours on the probability of a student’s enrollment in directed individual studies is greater, on average, for AICE than for IB. ▶ The effect of increased numbers of earned credit hours on the probability of a student’s enrollment in the university honors program is greater, on average, for AICE than for IB.
Table 9. Parameter Estimates for Variables in Model 6 (Retention Rate)
Estimate Standard Error Probability
Intercept -1.639000 0.224400 <0.0001
SAT Total 0.000507 0.000191 0.0082
Race
White
Black -0.081900 0.069120 0.2361
Asian 0.163800 0.092780 0.0775
Native American 0.128100 0.185800 0.4905
Hispanic 0.186100 0.050070 0.0002
Non-Reported -0.048950 0.160800 0.7608
Hawaiian/Other Pacific Islander -0.063230 0.483200 0.8959
GenderM
F -0.207500 0.036460 <0.0001
MatriculationYear
2007
2008 -0.052880 0.055560 0.3413
2009 -0.306900 0.054750 <0.0001
2010 -0.447200 0.057420 <0.0001
2011 -0.755500 0.061370 <0.0001
2012 -2.175900 0.099090 <0.0001
AICE Hours -0.039150 0.013400 0.0035
AP Hours -0.039180 0.002955 <0.0001
IB Hours -0.018880 0.003227 <0.0001
College & University | 52
▶ With the exception of credit hours earned through enrollment in AP courses, the number of credit hours earned does not appear to affect the likelihood of a student enrolling in honors in the major or studying abroad.
3.Is there a relationship between participation in AICE and retention rate?
▶ The likelihood that a student will drop out of college decreases as the number of credit hours earned through each of the three acceleration programs increases. ▶ AP and AICE students who earned the same number of credit hours are equally likely to continue their postsecondary studies whereas IB students who earned the same number of credit hours are more likely to discontinue their studies.
These findings suggest that the Cambridge acceleration program is a credible alternative to other more established acceleration programs in the United States in that it pre-pares students for a level of success in postsecondary edu-cation as measured by cumulative GPA as well as positive outcomes on a range of university performance indicators.
Sample Size Considerations
The three-level study was based on the academic records of more than 0,000 students nested in six matriculation years and from nearly ,000 schools. Snijders (00) ar-gues that the sample size at the highest level of a multi-level model is the main limiting characteristic of the design (p. ). The level-one sample size in this study is 0,1. Snijders (00) also implies that the average clus-ter sizes are not particularly important for the power of a test (p. ). He also suggests that for testing fixed regression coefficients (the focus of the analysis undertaken here), small cluster sizes are not problematic.
It should be noted that the number of students partici-pating in AICE is low relative to the number participating in AP, but the numbers are large enough to allow for mod-eling with confidence in the robustness of the outcomes.
Choice of University Success Measure
More a challenge than a limitation is the choice of univer-sity success measure. For example, a number of other dif-ferent university outcome measures could be investigated:
W number of courses passed/number of courses in which students excelled;
W GPA in certain courses, e.g., science/mathematics ver-sus humanities courses;
W university enrollment status (as of the second fall af-ter high school graduation);
W re-enrollment in a second year at the same institu-tion (Allen, Robbins, Casillas and Oh, 008);
W non-cognitive activities, e.g., greater propensity to participate in a non-curricular activity (Bowen, Ch-ingos and McPherson 009; Camara 00);
W psychological and social factors, e.g., peer relation-ships, personal fitness (physical and emotional), self-discipline, the ability to manage study and social time effectively (Harmston 00, Purcell and Clark 00, Tinto 1987);
W institutional factors, e.g., demographic features, geo-graphic location, proximity to home, student finan-cial support (Hamrick, Schuh and Shelley 00); or
W socioeconomic status, e.g., parental income, family education (Baum and McPherson 008, Geiser and Santelices 00, Sadler 010).
Time to degree completion is also cited as a measure of postsecondary success and can be influenced by cognitive as well as non-cognitive factors. Collecting data on aver-age time to degree completion was considered as a variable in this study but was abandoned given the disincentive at FSU to graduate early. The state of Florida awards the Flor-ida Bright Futures Scholarship to students who do well in high school, and virtually all students who attend FSU re-ceive this award. The scholarship is awarded for 10 credit hours and is not reduced by the number of accelerated credits that a student earns in high school. For example, if a student enrolls at FSU having already earned 0 hours of credit from accelerated programs, his scholarship will still cover 10 credit hours of study at FSU. This creates a disincentive to graduate early.
Ultimately, the choice of performance measure and the extent and scale of the research must account for a num-ber of practical matters, such as access to participants (in this case, provided by FSU’s Office of Admissions and Re-cords staff ) and data (particularly the feasibility of data retrieval); the interests of stakeholders; time, personnel, and financial resources, including available research ex-
College & University | 53
pertise; and the need to minimize any disruption of pro-grams and participants.
Controlling for Selection Bias
A common challenge in studies of this type is control-ling for selection bias. Students opting to participate in an acceleration program typically attend better-resourced schools, are taught by more experienced teachers, and live in socioeconomically advantaged communities. The selec-tion of a particular educational program is not necessarily random, and it is not altogether obvious what determines the choice of a specific acceleration mechanism. Shaw and Bailey (011a) ask, “Is choice of educational program influ-enced by type of high school, extrinsic and intrinsic motiva-tional aspects, institutional ethos, affective characteristics, parental status, socioeconomic constraints? Why do some students choose not to avail themselves of an acceleration programme” (p. 1)? More research needs to be undertaken in order to enlarge our understanding of why students choose to participate in a high school acceleration program.
Participation and Success: An Issue of Causality?
An issue that cannot be overlooked in studies of this kind relates to whether causal links actually exist between par-ticipation in an acceleration program and later academic success (Dougherty, Mellor and Jian 00; Hargrove, Godin and Dodd 008; Klopfenstein and Thomas 00; Paek et al. 00). Students are attracted to acceleration programs for a host of reasons. Quite apart from the ap-peal of earning college credit without having to pay college tuition to do so (MacVicar 1988), students who undertake an acceleration program are invariably a self-selecting group of highly motivated, able individuals (Breland et al. 00; Dougherty, Mellor and Jian 00).
In the models undertaken in this study, the only vari-able representing the effect of acceleration programs was the number of credit hours earned. This assumes that there is no effect of participation in the acceleration programs per se, regardless of the number of credit hours earned. A number of further models were run to investigate whether there is a separate effect of participation. Each model un-dertaken above was reproduced, adding in binary vari-ables indicating participation or non-participation in each program. For all but one of the models, there was no significant effect of AICE participation over and above
the number of credit hours earned. The one significant (though small) effect was on model , which predicted the probability of enrolling in the university honors program.
The issues around causality are multi-form and com-plex and require further investigation.
FUTURE WORK
This study, together with the freshman GPA data modeling work reported in Phase 1 (Shaw and Bailey 011a), sug-gests an empirical approach for future research:
W year-one performance measured by end-of-first-year-of-college GPA;
W number of degree completers/time to degree com-pletion;
W investigation of determinants of students’ success throughout the course of their university program.
It is hoped that this approach will serve as a template for other universities in Florida where significant numbers of former Cambridge students are known to be studying.
An extension of the research will involve eliciting data from a range of stakeholders, including undergraduate and postgraduate students, faculty, and university admis-sions staff.
Perceptual questionnaires and face-to-face interview techniques will be designed to elicit information about the Cambridge acceleration program in relation to:
W the perceptions of faculty members and their stu-dents;
W the attitudes and experiences of postsecondary ad-ministrators; and
W the wider impact of the Cambridge program in the United States and its effects on other administrative and academic systems.
REFERENCESAllen, J., Robbins, S. B., Casillas, A. and Oh, I. 008. Third-year college
retention and transfer: Effects of academic performance, motivation, and social connectedness. Research in Higher Education. 9: 7–.
Banta, T. W. 00. Assessing outcomes of undergraduate research pro-grams. Assessment Update. 1(): –1.
Baum, S., and M. McPherson. 008. Fulfilling the Committee: Recom-mendations for Reforming Federal Student Aid. New York, NY: College Board.
Bell, J.F. and Dexter, T. 000 Using ordinal multilevel models to assess the comparability of examinations. Multilevel Modelling Newsletter. 1(): –9. Available at: <www.bristol.ac.uk/cmm/learning/support/new1-.pdf>.
College & University | 54
Bowen, W. G., M. M. Chingos, and M. S. McPherson. 009. Crossing the Finish Line: Completing College at America’s Public Universities. Princ-eton, NJ: Princeton University Press.
Boyer Commission on Educating Undergraduates in the Research Uni-versity. 1998. Reinventing Undergraduate Education: A Blueprint for America’s Research Universities. Stony Brook, NY: State University of New York.
Breland, H., J. Maxey, R. Gernand, T. Cumming, and C Trapani. 00. Trends in College Admission 000. A Report of a National Survey of Undergraduate Admissions Policies, Practices, and Procedures. Retrieved from: <http://airweb.org/images/trendsreport.pdf>.
Bunnell, T. 010. The International Baccalaureate in the United States: From relative inactivity to imbalance. The Educational Forum. 7(1): –79. Retrieved from: <www.tandfonline.com/doi/pdf/10.1080/00117.010.8717>.
Burton, N. W., and L. Ramist. 001. Predicting Success in College: SAT Studies of Classes Graduating Since 1980. College Board Research Re-port No. 001–0. New York: College Entrance Examination Board.
Camara, W. 01. Defining and measuring college and career readiness: A validation framework. Educational Measurement: Issues and Practice. (): 1–7.
———. 00. Broadening predictors of college success. In Choosing Stu-dents: Higher Education Admissions Tools for the 21st Century, edited by W. J. Camara and E. W. Kimmel. New York: Routledge. 81–10.
Challenge Success. 01. The Advanced Placement Program: Living Up To Its Promise? Retrieved from: <www.challengesuccess.org/portals/0/docs/challengesuccess-advancedplacement-wp.pdf>.
Coca, V., T. Johnson, T. Kelley-Temple, M. Roderick, E. Moeller, N. Williams, and K. Moragne. 01. Working to My Potential: The Post-secondary Experiences of CPS Students in the International Baccalaure-ate Diploma Programme. Report from Chicago University. Retrieved from: <http://chicagotonight.wttw.com/sites/default/files/IB%0Report.pdf>.
Cohen, L., Manion, L., and Morrison, K. 007. Research Methods in Edu-cation (th ed.) Abingdon: Routledge.
Conley, D. T. 011. Exploring Innovative Schools and Policies That Prepare Students to Be College and Career Ready. AYPF Study Tour. Berkeley, California.
———. 010. College and Career Ready: Helping all Students Succeed Beyond High School. San. Francisco: Jossey-Bass.
Craney, C., T. McKay, A. Mazzeo, J. Morris, C. Prigodich, and R. de Groot. 011. Cross-discipline perceptions of the undergraduate re-search experience. Journal of Higher Education. 8(1): 9–11.
Culpepper, S. A., and E. C. Davenport. 009. Assessing differential pre-diction of college grades by race/ethnicity with a multi-level model. Journal of Educational Measurement. (): 0–.
Curry, W., W. MacDonald, and R. Morgan. 1999. The advanced place-ment programme: Access to excellence. The Journal of Secondary Gifted Education. XI(1): 17–. Available at: <http://joa.sagepub.com/con-tent/11/1/17.full.pdf+html>.
Dougherty, C., L. Mellor, and S. Jian. 00. The Relationship Between Ad-vanced Placement and College Graduation. NCEA Study Series Report 1. National Center for Educational Accountability. Retrieved from: <www.cgu.edu/PDFFiles/The_Relationship_between_Advanced_Placement_and_College_Graduation%000.pdf>.
Duevel, L. M. 1999. The International Baccalaureate experience: Univer-sity perseverance, attainment, and perspectives on the process. Ph.D. dissertation, Purdue University. Retrieved July 7, 009 from Disserta-tions & Theses: The Humanities and Social Sciences Collection. AAT 9919.
Duffy, W. R. 010. Persistence and performance at a four-year university: The relationship with advanced coursework during high school. In AP: A Critical Examination of the Advanced Placement Program, edited by P. M. Sadler, G. Sonnert, R. H. Tai, K. Klopfenstein. Cambridge, MA: Harvard University Press. 19–.
Duncan, A., and C. Martin. 010. A Blueprint for Reform. The Reautho-rization of the Elementary and Secondary Education Act. U.S. Depart-ment of Education.
Geiser, S., and V. Santelices. 00. The Role of Advanced Placement and Honors Courses in College Admissions. Berkeley, CA: Center for Stud-ies in Higher Education.
Hamrick, F. A., J. H. Schuh, and M. C. Shelley II. 00. Predicting higher education graduation rates from institutional characteristics and re-source allocation. Educational Policy Analysis Archives. 1 (19): 1–.
Harmston, M. T. 00. Cross-Validation of Persistence Models for Incoming Freshmen. AIR Professional File, Number 9. Tallahassee, FL: Associa-tion for Institutional Research.
Hargrove, L., D. Godin, and R. B. Dodd. 008. College Outcomes Com-parisons by AP and Non-AP High School Experiences. College Board Research Report No. 008–0. New York: College Board.
Hawkey, R. 00. The theory and practice of impact studies: Messages from studies of the IELTS Test and Progetto Lingue 000. Studies in Language Testing. . Cambridge: Cambridge ESOL and Cambridge University Press.
Hu, G. 01. Using the National Survey of Student Engagement to mea-sure undergraduate research participation. Council of Undergraduate Research Quarterly. (): 9–1.
Inkelas, K. K., A. K. Swan, J. Pretlow, and J. N. Jones. 01. Exploring the benefits of the International Baccalaureate Extended Essay for University Studies at the University of Virginia. Castle-HE. Center for Advanced Study of Teaching and Learning in Higher Education, Curry School of Education, University of Virginia.
Kobrin, J. L., B. F. Patterson, E. J. Shaw, K. D. Mattern, and S. M. Barbuti. 008. Validity of the SAT® for Predicting First-Year College Grade Point Average. Research Report No. 008–. New York: College Board.
Klopfenstein, K., and M. K. Thomas. 00. The Advanced Placement performance advantage: Fact or fiction? American Economic As-sociation. Retrieved from: <www.aeaweb.org/annual_mtg_pa-pers/00/0108_101_00.pdf>.
Klopfenstein, K., and M. K. Thomas. 009. The link between Advanced Placement experience and early college success. Southern Economic Journal. 7(): 87–91. Retrieved from: <www.freepatentsonline.com/article/Southern-Economic-Journal/19189.html>.
Kuh, G. 008. High-Impact Educational Practices: What They Are, Who Has Access to Them, and Why They Matter. Retrieved January , 01 from: <www.aacu.org/leap/hip.cfm>.
Lenning, O. T. 197. Predictive Validity of the ACT Tests at Selective Col-leges. Report No. 9. Iowa City, IA: American College Testing.
Lopatto, D. 00, Winter. Undergraduate research as a catalyst for liberal learning. Peer Review. 8(1): –.
MacVicar, R. 1988. Advanced Placement. Increasing Efficiency in High School-University Articulation. Distributed by ERIC Clearinghouse.
Morgan, R., and R. Maneckshana. 000. AP Students in College: An In-vestigation of Their Course-Taking Patterns and College Majors. Princ-eton, NJ: Educational Testing Service. Statistical Report no. 000–09.
Morgan, R., and L. Ramist. 1998. Advanced Placement Students in Col-lege: An Investigation of Course Grades at 21 Colleges. Princeton, NJ: Educational Testing Service.
Paek, P. L., E. Ponte, I. Sigel, H. Braun, and D. Powers. 00. A Portrait of Advanced Placement Teachers’ Practices. College Board Research Re-port No. 00–7. New York: The College Board.
Panich, C. 001. A study of the university performance of students with International Baccalaureate high school experience. Ed.D. dissertation, Duquesne University. Retrieved July 9, 009 from: Dissertations & Theses: The Humanities and Social Sciences Collection. Publication No. AAT 100.
Purcell, J., and A. Clark. 00. Assessing the life and times of first-semes-ter academic failures. Paper presented at the conference of the South-ern Association for Institutional Research, Baton Rouge, LA.

AmericAn AssociAtion of collegiAte registrArs And Admissions officers
To order this or other aacrao publications, go to www.aacrao.org/publications/publications_catalog.aspx or call (301) 490-7651.
In the age of globalization, the demand for multicultural educational experiences—from both scholars and the workplace—is on the rise, providing colleges and universities market-expanding opportunities both at home and abroad. Meeting these expectations requires both a solid foundation and the most up-to-date intelligence and methods in the field of international education. That’s why professionals across the country rely on The AACRAO International Guide. Its latest edition, authored by proven experts in the field, is a 23-chapter reference and how-to guide containing:
¡ compelling overviews of the current and future states of the field; ¡ analysis of core issues (such as international recruitment and enrollment management, technology, study abroad, undocumented students, fraudulent documents, and the Bologna Process); and ¡ practical guidance on vital concerns (such as international credential evaluation, office policies and procedures, undergraduate and graduate admissions questions, community college issues, student visas, and English proficiency assessment).
Education is on the move. Expand your global perspective with aacrao’s International Guide. order today!
of KnowledgeMobility
guiding the
Item #0129 | $110 | $80 (members)
Intl Guide Ad-2011.indd 1 8/24/11 5:44 PM

College & University | 56
Russell, S. H., M. P. Hancock, and J. McCullough. 007. Benefits of un-dergraduate research experiences. Science. 1: 8–9.
Saavedra, A. R. 011. The academic impact of enrollment in International Baccalaureate Diploma Programmes: A case study of Chicago public schools. Ed.D. thesis, Harvard University. Retrieved from: <http://search.proquest.com/docview/908987>.
Sadler, P. M. 010. Advanced high school coursework and college admis-sions decisions. In AP: A Critical Examination of the Advanced Place-ment Program, edited by P. M. Sadler, G. Sonnert, R. H. Tai, and K. Klopfenstein. Cambridge, MA: Harvard Education Press. –1.
Sadler, P. M., and G. Sonnert. 010. High school advanced placement and success in college in the sciences. In AP: A Critical Examination of the Advanced Placement Program, edited by P. M. Sadler, G. Sonnert, R. H. Tai, and K. Klopfenstein. Cambridge, MA: Harvard Education Press. 119–18.
Shaw, S. D. 011. Investigating the impact of Cambridge International As-sessments on U.S. stakeholders: Student and teacher perceptions. Col-lege and University. 87(): 1–.
Shaw, S. D., and C. Bailey. 011a. Success in the U.S.: Are Cambridge In-ternational Assessments good preparation for university study? Jour-nal of College Admission. 1: –1.
——— 011b. An American university case study approach to predictive validity: Exploring the issues. Research Matters. 1: 18–.
Snijders, Tom A.B. 00. Power and sample size in multilevel linear mod-els. In Encyclopedia of Statistics in Behavioral Science (Volume ), edited by B.S. Everitt and D.C. Howell. Hoboken, NJ: John Wiley & Sons, Inc. 170–17.
Taylor, M., and M. L. Porath. 00. Reflections on the International Baccalaureate Program: Graduates’ perspectives. Journal of Secondary Gifted Education. 17(): 19–18.
Tinto, V. 1987. Leaving College. Chicago, IL: University of Chicago Press.U.S. Department of Education. 010. A Blueprint for Reform: The Reau-
thorization of the Elementary and Secondary Education Act. Washing-ton, D.C.: U.S. Department of Education. Retrieved from: <www.ed.gov/policy/elsec/leg/blueprint>.
———. 00a. A Test of Leadership: Charting the Future of U.S. Higher Education. Washington, D.C.: U.S. Department of Education.
———. 00b. Action Plan for Higher Education: Improving Accessibil-ity, Affordability, and Accountability. Washington, D.C.: U.S. Depart-ment of Education.
About the Authors
STUART SHAW is the Principal Research Officer for Cambridge Interna-tional Examinations, Cambridge Assessment. Before leading a research team in the area of mainstream international examinations, Stuart worked on a range of Cambridge English (formerly Cambridge ESOL) products with specific skill responsibilities for Writing. He is particularly interested in demonstrating how Cambridge Assessment seeks to meet the demands of validity in their tests.
JAYNE WARREN is a member of the Recognitions Team at Cambridge International Examinations and works with universities to ensure accept-ability and suitability of Cambridge qualifications for progression from one phase of education to the next. A background in environmental management, Jayne obtained a BSc (Hons) in Countryside and Environ-mental Management from Harper Adams University, UK.
TIM GILL is a research officer in Cambridge Assessment’s Research Divi-sion, where he has worked for eight years. His main areas of interest are the application of multilevel models in analysing assessment data, and the analysis of patterns of uptake and attainment in schools and colleges in the UK. He has an MSc in Applied Statistics from Sheffield Hallam Uni-versity.
ACKNOWLEDGMENTS
We would like to thank John Barnhill (Assistant Vice President for Enroll-ment, Florida State University) and Megan Benson (Director, Technology Services, at Florida State University) for their continued enthusiasm and support of this research. We are particularly indebted to Jeff Bowman (Associate Director, Enrollment Management) and Matthew Bucior (Busi-ness Analyst) of the Office of Admissions and Records at Florida State University for their help in providing data and for their willingness to answer innumerable questions throughout the course of the project. The academic research community in Cambridge Assessment has been a source of great support. We especially thank Phineas Hodson and Sarah Hughes (Cambridge International Examinations, Cambridge Assessment) and Tom Benton (Assessment Research and Development, Cambridge Assessment) for their insightful and invaluable advice.

forumCommentary
College & University | 57
Be a Pine Tar RegistrarBy Richard Morrell
Early in my career as a registrar, my mentor, Charles E. Selden, then registrar of the University for Northern Colorado, cautioned me to never succumb to the dreaded ‘registrar’s disease’ that he called ‘a rule is a rule is a rule.’ Having seen me be hard-nosed with a student regarding a rule, he explained that the disease paralyzes the regis-trar’s effectiveness and can put him in a kind of quaran-tine such that no one at the university wants to associate with him. The disease is communicable: many who work in proximity to the registrar can catch it and come to dem-onstrate all the symptoms exhibited by the original carrier.
Registrars make exceptions to rules almost every day they are at work. The truly great men and women in our profession are perhaps best defined by their ability to make wise and timely exceptions to any particular rule. Make too many exceptions and you risk losing the confidence of those who make the rules. Make too few exceptions and you risk being stereotyped as inflexible and tyranni-cal. Make exceptions without consistency and risk being viewed as Machiavellian.
THE PINE TAR INCIDENT
Summer 01 marked the 0th anniversary of an event that should be noted by all registrars, regardless of whether
they are baseball fans. The incident deals substantially with the issue of rules and their exceptions.
On July , 198, George Brett of the Kansas City Roy-als hit a home run that was invalidated by Rule 1.10 (b). The rule states that no foreign substance can be applied and extend more than eighteen inches from the bottom of the bat. It was then (and is common now) for batters to ap-ply pine tar to the handle or lower portion of a baseball bat. Pine tar helps the batter grip the bat more tightly than would be possible otherwise. Rule 1.10 (b) was written to protect the very players who use the pine tar. The logic was that if the pine tar extended well above the handle of the bat onto the barrel—the area that normally makes contact with the ball—it would sully the ball. A ball with pine tar on it would be unbalanced and also would result in the pitcher having a better grip on the ball. Given those two advantages, the pitcher would throw better pitches—pitches that would be harder to hit. Note that the rule was developed to help the batter, not the pitcher.
On July , George Brett hit a home run that gave Kan-sas City the lead in a game against the storied New York Yankees. Just as Brett stepped on home plate, the Yankees’ manager protested the home run on the grounds that the bat was illegal because it had pine tar beyond the allowable
College & University | 58
eighteen inches. The home plate umpire, George McClel-land, laid Brett’s bat across the seventeen-inch-wide home plate and determined that the bat was illegal; he called Brett “out” and negated the home run. McClelland’s call was unequivocally ‘by the book.’
The Kansas City Royals’ representatives appealed Mc-Clelland’s ruling. A few days later, the president of the American League announced that he was reversing the ruling and allowing the home run to stand; the rest of the game would be replayed at a later date. His premise was that the ‘spirit’ rather than the ‘letter’ of the rule should be honored. He explained that the rule had been written to protect the batter, not the pitcher, and he reasoned that in this instance, the batter had garnered no advantage by the pine tar’s extending beyond the allowable eighteen inches.
What does this have to do with the work of the reg-istrar? Plenty. Registrars are in a unique position: They are regularly called upon to decide whether and when to make exceptions in a variety of circumstances involving both written and unwritten rules. It is incumbent upon us
to see the wisdom in the ruling issued 0 years ago by the president of the American League: He chose to follow the spirit rather than the letter of the rule.
Articulating some particular processes should help us understand the registrar’s role in making exceptions.
GUIDING PRINCIPLES
Understand the Rules
It is vitally important to know the rules of our institu-tions. Many are written or otherwise codified. Many more are likely to be long-standing practices with no written rules. Regardless, the registrar must know the rule and how it has been developed and applied.
When a student or other community member asks a registrar to make an exception, it is incumbent upon the registrar to become familiar with the rule (if she is not already). She needs to know why it was codified or oth-erwise placed into practice, regardless of whether it is writ-ten or unwritten.
www.aacrao.org/publications/
Now, that’s a smart catch.
With an expansive collection of quality
publications, AACRAO helps keep higher ed
administrators at their professional best.To reel in a new title any time, visit
www.aacrao.org/publications/.
strategic enrollment J admissions J international ed J legal J new technologies J recruitment J and more…
College & University | 59
Early in my career, I was charged with the task of making exceptions to graduation requirements. The minimum re-quirement for a degree was stated in our university catalog as 1 credit hours. A student requested that I waive the re-quirement because he had been misadvised; in my opinion, it was a clear case of university—not student—error. Fortu-nately, I asked my superior for advice before issuing a deci-sion. He informed me that to his knowledge, the university had never allowed an undergraduate to graduate with fewer than 1 credit hours. To allow this particular student to do so would not serve the student or the institution well.
At that institution, making exceptions to graduation re-quirements was an accepted practice, although no written policy governed it. Further, there was an understanding (again, not written anywhere) that no one could graduate having completed fewer than 1 hours. Fortunately, I was able to grasp the essence of the unwritten rule and to un-derstand the spirit underlying it. I denied the request. The clear mandate of the registrar is to know his institution’s written and unwritten rules.
Understand the Intent
It is not good enough to simply understand the rules as they are written. Intent underlies every rule. Registrars must understand the intent of rules if they are to make wise decisions regarding the granting of exceptions.
At another time, a student asked to delay his gradu-ation term by a semester and to be exempted from the requirement that he be continuously enrolled until the graduation date. He explained that his wife was gradu-ating the next semester and that he wanted to be able to invite both his and his wife’s families to the same gradu-ation ceremony because many would be traveling a great distance and could not make the trip twice.
The intent behind the continuous enrollment rule was to encourage and help students to remain on track for timely progress toward their degree. In this student’s situ-ation, the intent of the rule was simply not applicable. I granted the exception, and both the student and the insti-tution benefited.
Understand When an Exception Can Be Made
Often, a rule cannot be appealed—and there may be good reason for it. For example, students typically are permitted to choose only during the first part of the semester whether
to take a course pass/fail or for a grade. Making an exception to that rule during finals week clearly should not be allowed.
Understand Who is Permitted to Make the Exception
In the pine tar incident, the umpire made the call at home plate. Coaches and players argued the call, but the call stood—as was the tradition. That is, the call stood un-til the president of the American League reversed it. In the 01 World Series, an umpire’s call was reversed on the field. That was not the unwritten rule then, but it is now. The point is this: know who can issue exceptions and who can override them, and understand that previous as-sumptions may not stand indefinitely.
Often, institutional entities share responsibilities. In such situations, there are rules (unwritten, more often than not) concerning who is and who is not allowed to make exceptions. For example, I currently work at an in-stitution where exceptions to tuition and fees rules are handled by the registrar’s office for undergraduates and by the graduate school for graduate students. Interestingly, no written rules govern this process. It is simply a long–standing practice: it has been done that way for as long as anyone can remember. The better you understand the unwritten rules, the more effective you will be for your in-stitution. Another sage piece of advice is to codify as many of the unwritten rules as you possibly can.
Make the Decision by Following the Spirit of the Rule
I would add just one detail: Make the decision with wis-dom and confidence, but most important, make it in a timely manner. Do not fall prey to that other dread dis-ease, analysis paralysis. We’ll consider that another day.
Be a ‘pine tar’ registrar!
About the Author
RICHARD C. MORRELL is University Registrar at the University of Nebraska-Lincoln. He has 38 years of higher-education experience including thirteen years as the university registrar at the University of Kansas (KU). He recently completed duties as the vice president for stu-dent services at Khalifa University of Science, Technology and Research in the United Arab Emirates. Earlier in his career, he served as Associate Vice Provost for Student Success at KU and Vice President for Student Affairs at the University of Central Missouri. He earned his B.S.E. and M.S. degrees from Emporia State University (KS) and his Ph.D. from the Uni-versity of Northern Colorado where he also served as assistant and asso-ciate registrar.

Admissions’ Evolving RolE: FRom gAtEkEEpER to stRAtEgic pARtnER * thE AmERicAn WAy oF studEnt Aid * stAtE collEgE sAvings plAns And pREpAid tuition plAns: A REAppRAisAl And REviEW * AFFiRmAtivE Action: WhAt is nExt? * thE “insight REsumé:” oREgon stAtE univERsity’s AppRoAch to holistic AssEssmEnt * holistic mEthods oF AssEssmEnt: thE viEW FRom thE univERsity oF michigAn * smAll pRivAtE libERAl ARts collEgEs: RE-cRuiting chAllEngEs And oppoRtunitiEs * community collEgE Admis-sions: kEEping thE dooR opEn * tEchnology-EnhAncEd REcRuitmEnt communicAtions * intERActivE sERvicEs: stAying in tunE With A WEb-sAvvy gEnERAtion * FAculty’s RolE in REcRuitmEnt * loW-in-
comE studEnts: outREAch And REtEntion * AFRicAn-
AmERicAn studEnts: RE-cRuitmEnt And REtEntion *
hispAnic studEnts: REcRuit-mEnt And REtEntion * AsiAn
pAciFic AmERicAn studEnts: REcRuitmEnt And REtEntion
* indigEnous studEnts: RE-cRuitmEnt And REtEntion *
WomEn in EnginEERing: RE-cRuitmEnt And REtEntion *
REcRuitmEnt oF tRAnsFER studEnts * homEschoolEd
studEnts: bAckgRound And chAllEngEs * REcRuiting mil-
itARy studEnts * REAching thE Adult mARkEt * REcRuit-
ing lbgt studEnts * intERnA-tionAl studEnts: mARkEting
And REcRuitmEnt * thE nEW toEFl * thE dREAm Act And in-
stAtE tuition FoR undocu-mEntEd studEnts * dElivER-
ing outstAnding sERvicE in Admissions pRocEssing * dE-
vEloping A nEW xml stAndARd * pREdicting EnRollmEnts And
yiElds * EnhAncing AcAdEmic ExcEllEncE And divERsity *
pREdicting gRAduAting pER-FoRmAncE: gEoRgiA stAtE uni-
vERsity’s FREshmAn indEx * AdvAncEd plAcEmEnt pRogRAm:
its inFluEncE on AcAdEmics And Admissions dEcisionmAking *
thE intERnAtionAl bAccAlAu-
REAtE: pARt i—A pRogRAm pRim-
ER * thE intERnAtionAl bAccAlAuRE-AtE: pARt ii—An institutionAl pERspEctivE *
lAW schools * mEdicAl schools * hEAlth studiEs pRogRAms * gRAduAtE Admissions issuEs * studEnt dAtA:
thE RElAtionship bEtWEEn thE Admissions And REgistRAR’s oFFicEs * AccEssing ipEds dAtA to shApE mARkEting * tuition dis-
count RAtEs: using ipEds FoR compARAtivE AnAlysis * so you WAnt to bE A diREctoR oF Admissions? * cREAting A cAREER lAddER: motivAt-
ing And dEvEloping stAFF * EngAging thE gREAtER col-lEgE community * thE RolE oF thE REgistRAR: oRigins,
Evolution, And scopE * AcA- dEmic policy And thE REgis-tRAR * thE REgistRAR And cuRRiculum dEvElopmEnt * issuEs FoR REgistRARs At smAll collEgEs * mAnAg-ing thE REgistRAR’s oFFicE * pRojEct mAnAgEmEnt * implEmEntAtion oF stu- dEnt inFoRmAtion systEms
* REgistRAtion And REl At- Ed Functions * Ac AdEmic schEduling And cl A ss- Room util iz Ation * com-munic Ations With mul- tiplE constituEnciEs: cAlEn-dARs, cAtAloguEs, And much moRE * onE-stop shop And viRtuAl sERvicEs * AltERnAtE ids: liFE AFtER sociAl sE-cuRity numbERs * distAncE EducAtion issuEs: thE impAct on AcAdEmic RE-
coRds, FinAnciAl Aid, And EnRollmEnt * REcoRds REtEntion And disAstER REcovERy * cREdEntiAls FRAud, diplomA mills, And AccREditAtion mills *
cERtiFicAtions oF studEnt EnRollmEnt stAtus * cERtiFying AcAdEmic Eligibility oF studEnt AthlEtEs * dEpARtmEnt oF vEtERAns AFFAiRs:
EducAtionAl bEnEFits And cERtiFicAtion * dEgREE Audit * tRAns-FER And ARticulAtion * gRAduAtion, commEncEmEnt, And
diplomAs * pREpARing FoR AccREditAtion * study AbRoAd: AccREditAtion And
tRAnscRiption issuEs * Fi-nAnciAl Aid 101 * thE REgis-
tRAR And institutionAl RE-sEARch * FERpA—thE FAmily
EducAtionAl Rights And pRivAcy Act * thE solomon AmEndmEnt * En-
RollmEnt sERvicEs And thE community collEgE REgistRAR * issuEs FoR gRAduAtE
school REgistRARs * issuEs FoR lAW school REgis-tRARs * issuEs FoR mEdicAl school REgistRARs * thEologicAl institutions: spEciAl chAl-
lEngEs, spEciAl oppoRtunitiEs * pAsto-RAl AppRoAchEs to EnRollmEnt sERvicEs * budgEting in A RE-souRcE-lEAn EnviRon-mEnt * AAcRAo: A lEgAcy oF
How can you command greater long-term enrollment and institutional successes in a “do more with less” environment? How do you motivate campus units toward superior efficiencies and creative, new ideas? Add AACRAO’s complete enrollment management solution — The Registrar’s Guide and The College Admissions Officer’s Guide — to your executive bookshelf.
A combined seventy-nine chapters, this comprehensive knowledge base offers an analytical overview of enrollment management and registration’s core concepts, as well as contemporary, real-world solutions from leading campus professionals — in large, small, and specialized campus settings. Among the many key subjects are:
predicting enrollment and yields @targeted recruitment @identity protection @combating credentials fraud @shoe string budgeting with dwindling resources @student information system design and implementation @
Visit AACRAO online or call (301) 490-7651 to order today!
Paths to Distinction.
www.aacrao.org/publications
A Century of Excellence in Higher Education
American Association of Collegiate Registrars and Admissions Officers | One Dupont Circle NW, Suite 520, Washington, DC 20036
TheBigGuides.indd 1 11/17/09 11:39:25 PM

forumCampus Viewpoint
College & University | 61
By Jerry Ross, Lesley Cottrell, and Melanie Stimeling
Creating Traditions of Collaboration
Registrars have a special, evolving relationship with the curriculum. We often are the ones who enforce curricu-lum rules and certify students for graduation. Curriculum is the core of higher education. It is how we organize our universities so that faculty can teach and students can learn. We organize our universities around curriculum and divide ourselves into colleges, schools, and departments that often have certain traits in common. From a practical standpoint, completing a prescribed curriculum is how we determine whether a student has earned a designated de-gree. In addition, institutions, state agencies, and accredit-ing bodies use our curriculum to assess our effectiveness. Quite simply, curriculum is not just what we teach: It is a way to provide order to our work.
The roots of curricular change at an institution of higher education are various. Of course (and rightfully so), the faculty have responsibility for the curriculum and must act on changes. Yet changes in technology and pro-cess can inspire holistic review of a university’s curriculum both from a macro level (i.e., core requirements) and a mi-cro level (i.e., major and minor requirements). Registrar’s offices can play a variety of roles in curriculum. At many institutions, the registrar’s office certifies students for de-gree clearance and so interacts with curriculum “where the rubber meets the road.” Further, we work with faculty to
develop an approved curriculum into something that stu-dents (including prospective students) can understand in terms of degree requirements. Staff from registrar’s offices thus have a role in curriculum development and frequently sit as ex officio members of curriculum committees (or at least provide feedback to such committees). Last, through regular meetings with faculty and administration, we work with all stakeholders on curriculum issues from a strategic and technological standpoint.
Over the course of just a few years, West Virginia Univer-sity (WVU) revamped its technology, process, and policies related to curriculum. With the creation of an Office of the University Registrar (OUR) in 009, there was a unique op-portunity—and mandate— for change. The OUR quickly launched several projects that had an impact on curricu-lum. Even in that short period of time, the nature and mag-nitude of the OUR and faculty collaboration evolved.
Our approach to working with faculty to develop and implement curricular-based initiatives transformed into one that was mutually beneficial. Our most recent col-laboration, the focus of this article, was informed by ear-lier collaborations when we were less strategic. We had implemented in the recent past both a degree audit and a catalog management system. Although both projects were successful, each had challenges that influenced our revised
College & University | 62
process. In the earlier implementations, our process was much more self-contained in that we managed on the ba-sis of ad hoc feedback from relevant constituencies.
Even though we had received important feedback along the way, both earlier projects had been hampered by our not having formalized opportunities to interact with the people who would use the systems on a regular ba-sis. As a result, we made some strategic changes when we embarked on our most recent project. An active steering committee greatly improved the process and helped guide the project. We also made better use of pilot groups than we had in the implementation of the degree audit system.
The purpose of this article is to highlight the OUR-fac-ulty collaboration that improved WVU’s course develop-ment, approval, and implementation process. This joint effort resulted in a new way to approach projects at WVU and has created new opportunities for collaboration. It has allowed the registrar’s office to be a stronger voice on cam-pus as faculty members considering course and curricular issues now perceive it as a valuable resource. The OUR has gained a needed partner and resource in faculty as it works with them toward curricular improvements. Examination of our past project history and our new approach has in-spired a successful model for collaboration that we trust will continue to support strong initiatives in the future.
PREVIOUS PROJECT HISTORY
In 011–1, the OUR implemented an electronic catalog management system (CMS). The university purchased and implemented a CMS supported by a known vendor for three catalogs during the 011–1 academic year. During the implementation phase, OUR staff worked with part-ners in academic colleges and departments. This system significantly altered how we revised and updated our catalogs as well as how we presented the documents to the public. The system enabled us to utilize an electronic workflow rather than exchanging word-processing files in order to update the catalogs. Simply put, we focused less on the process and more on the content. Faculty quickly noted the value of the new system’s ability to provide data that could be used to better understand course utilization and patterns over time.
This broader orientation to the curriculum inventory inspired questions about how to obtain similar results in other areas of the process. For example, later in the
011–1 academic year, Faculty senate leadership sought the assistance of the OUR in streamlining the course ap-proval process. Historically, the process at WVU had been paper based and required approvals at multiple levels. As a result, it took a significant amount of time, requiring, on average, more than six months for a course to be approved. Not only would the new initiative enhance course offer-ings and strengthen the curriculum as a whole, but it also would increase the efficiency with which courses were re-viewed and approved. (The university had attempted pre-viously—though unsuccessfully—to create an in-house system.) The OUR had experience with the CMS vendor and identified a potential solution.
THE COLLABORATIVE APPROACH
We did not believe that a traditional project management model would prove effective. This was largely because of the different constituencies involved in the curriculum development process as well as the lessons learned from previous efforts to develop an electronic system. As we reflected on our experience implementing the electronic degree audit and CMS, we identified opportunities to in-corporate users of the course approval process into the development and implementation procedures. We hoped that doing so would increase ownership and involvement by those most directly affected.
After demonstrating the Course Inventory Manage-ment (CIM) software to the faculty senate leadership, we purchased the software. The OUR and faculty hoped it would better align the course approval and curriculum process with the academic catalogs and the degree audit system. It also might automate existing approval processes and increase efficiency.
A collaborative model was used to implement the CIM system. Demonstrations were held for faculty leadership, administration, and other representatives who were inte-gral to the curriculum review process. A steering commit-tee representing all stakeholders in the process—including each college/school, governance groups, and administra-tion—was developed. The steering committee was charged with outlining the best practice for implementing the sys-tem, identifying key individuals who should be involved in the process, and communicating system strengths and weaknesses once it was tailored to university procedures. This collaborative model engendered a mutual sense of
College & University | 63
ownership, which proved to be key in the implementation phases.
For our work to be effective, our conversations had to be intentional and highly collaborative. Implementing a technological solution to course and curriculum proposals and changes requires extensive conversations that are not typical of everyday work. Asking good questions proved an early and essential part of these conversations. As we began examining current practices, it quickly became ap-parent that while OUR representatives understood the ap-proval process, they were not as involved in the process as were the faculty. This helped OUR staff to identify ob-jective questions about the process. OUR staff also were knowledgeable about how other institutions managed the process and thus were able to help evaluate the effective-ness of the process at WVU; to identify areas where exist-ing procedures were inadequate; and to work with faculty members to offer new solutions and establish a new pro-cess. Faculty members who were highly engaged in the existing system were able to explain which elements were essential and needed to be maintained.
As mentioned above, the steering committee was crucial to the implementation and success of the effort. Several members—such as faculty senate leadership and associate provosts—were appointed on the basis of their functional responsibilities. We also asked the dean of each college and school to appoint a representative. In order to ensure a diverse group, we planned to review the member-ship once the names were put forth and to make any ad-justments that seemed necessary. In fact, we didn’t need to make any adjustments. The diverse voices of the associate deans, faculty, program directors, and administrative staff who served on the committee provided very different per-spectives at each meeting.
The steering committee met two or three times per se-mester during the implementation—often enough to be valuable but not so often as to burden the membership. Each meeting featured an update on progress since the last meeting, discussion, and decision making. A regis-trar’s office staff member facilitated each discussion, but we also allowed the discussion to help guide us. Steering committee members quickly became our ambassadors in the respective colleges and schools. For example, in order to launch the new system, we needed to determine which individuals in each department and college would have a
role in the approval process. Steering committee represen-tatives were empowered to aid in the collection of infor-mation used to determine the workflow. They also helped us identify pilot groups when we moved to that phase of the implementation.
IMPLEMENTATION
The CIM system was implemented in two phases: Phase I (01–1) involved the establishment of procedures for course adds/changes/deactivations; Phase II (01–1) addressed procedures related to significant curriculum changes. The success of the workflow process was a key as-pect of the system. Appropriate signature designees change frequently within and between academic years, making this one of the most problematic and fluid needs related to the efficiency goal. Members of the steering committee and individual units provided lists of names of individuals who would need to sign off on a course and encouraged their units to complete this task if it was delayed.
In January 01, three colleges tested the system by of-fering a series of courses that required approval. (Steering committee members had helped select these colleges on the basis of their knowledge of pending course and pro-gram changes.) The first course was approved in March 01. Faculty and staff who were involved in the approval process identified areas for improvement; these were dis-cussed as a group and were resolved with assistance from the vendor. Finally, the system and modified procedures were implemented campus-wide in May 01.
In fall 01, development work of Phase II began. Estab-lishing the system for approving curriculum changes had its own unique challenges, but our collaborative approach again proved effective. Having become accustomed to the OUR and faculty collaboration, our approach became more fluid. For example, naming a formal steering com-mittee did not prove necessary; instead, the OUR con-tinued to facilitate creation of the system and work with the vendor. Faculty and other administrators were called upon as needed to answer questions about current prac-tices, to confirm processes, and to evaluate the system as it developed. This was possible because of the strong founda-tion of collaboration that had been built during the devel-opment of CIM and because the relationship between the OUR and faculty continue to strengthen as we maintain the CIM system.
College & University | 64
MUTUAL BENEFITSProcesses and procedures related to our courses and cur-riculum have been strengthened. All parties have had to review what the curriculum actually is—not just what we thought it was. Given this more nuanced knowledge of the curriculum, we were able to document policy, processes, and procedures that previously had been incomplete or elusive. Changes to curriculum now are documented clearly, thus providing faculty, students, and administrators alike with access to the curricular knowledge they need to conduct university business. Furthermore, we have docu-mented these practices in a way that ensures their stability in the future. Shared resources, potential course conflicts, and greater efficiency within the approval process have al-ready been noted in the early implementation phase.
Some benefits extend well beyond the system’s func-tional aspects. For the first time, the course approval pro-cess is transparent and available for all faculty to review. Faculty members can emulate successful models as they begin their course proposals, allowing not only for a more effective process but also for creation of a stronger curricu-lum. The new system also provides faculty with a means to communicate about courses across unit lines and approval levels. This helps sustain the collaborative approach to curriculum. Faculty and administrators alike are now able to easily navigate the process, with the result that they can devote their energy to developing the curriculum rather than to determining what steps to take.
The biggest change was in philosophy: Now, the Of-fice of the University Registrar is a resource and a partner with faculty on issues related to curriculum. Roles and re-sponsibilities of faculty and administrators are better un-derstood. Faculty members still hold primary ownership of and responsibility for the curriculum, but they now appreciate the perspective and support that individuals in the OUR can provide. We frequently work with depart-ments before curriculum changes are introduced, and the dialogue has helped all parties. By being a part of the dis-cussions earlier in the process, we are able to help the gov-ernance groups ensure that what they want to accomplish can be managed successfully from a system perspective.
This new philosophy also has potential for high-level collaborations with faculty in the future. For example, these systems provide course and curriculum data that were not previously available; OUR and faculty can use
this information to inform their collaboration on other projects and scholarly work. They can partner as equals to consider new curriculum advances. Collaborations can begin from a point of shared understanding and apprecia-tion of what each partner can lend to the project at hand.
KEY FACTORS OF SUCCESS
OUR-faculty collaborations at West Virginia University have been cultivated for a comparatively brief period but have proven mutually beneficial. Initial experiences have served to develop approaches that have strengthened the OUR-faculty relationship and identified the OUR as an equal partner in curriculum development and mainte-nance. Our ability to reflect on previous attempts at col-laboration and process change was essential as it helped us understand past successes and failures and identify pos-sibilities for addressing future challenges.
Involving the right group of people is key. Establish-ing a broad yet targeted steering committee and series of pilot groups was essential to the development and plan-ning phases. Convening a diverse group of campus repre-sentatives ensured that the entire community was actively involved in the project and also helped increase the com-mitment to successfully completing the project. More important, we increased ownership of and stakeholder responsibility for the project. This will be integral to the sustainability of curriculum-related initiatives.
The elements of a true collaboration had to be created and nurtured. We had to possess a shared vision and com-mitment to improvement. We had to understand and appreciate different roles and perspectives related to cur-riculum change. Information, concerns, and optimism had to be shared openly, and we had to ensure that all stakeholders were heard. We had to be critical and then work together to find solutions to challenges.
We also had to acknowledge that even our best efforts as a steering committee could not create a system that could anticipate every possible challenge. The pilot groups pro-vided objective opportunities for various schools to test the initiative at the department, school, and higher lev-els. Select pilot groups represented large and more com-plex colleges. We worked together to improve the system. Once this phase was completed, the steering committee, the OUR, and faculty at large had evidence that the ini-tiative would be effective in other areas of the university;


College & University | 66
others joined us as they witnessed the success and respon-siveness of the new system.
CONCLUSION
Many may consider our experience unique—particularly at a university that had not had an established OUR prior to the collaborations. Unusual circumstances had contrib-uted to the establishment of the OUR and were crucial for faculty shared governance perspectives across the campus. Together, these contextual factors contributed to the re-lationship building that occurred between the OUR and faculty. Other factors that could be developed at any insti-tution were also evident. All institutions have needs that can be addressed and improvements that would benefit more than one group. Once a shared vision and commitment to improvement are established, collaboration is possible.
The evolved relationship between the OUR and faculty at WVU has replaced the previous faculty-centered and OUR-centered approaches for developing new initiatives. Identifying the mutual benefits of a single collaboration is an important but often overlooked step. It requires multiple perspectives and communication that may be difficult to generate. Involving all parties—particularly us-ers— early in the process and discussing how each group will benefit is crucial.
Whether this approach can be sustained remains to be seen. Fiscal, programmatic, and other resource limitations may challenge the maintenance of initiatives. OUR and faculty responsibilities for an initiative should be identi-
fied and discussed in the development phase as part of the effort to plan appropriately for the future. For example, the group may decide that the OUR manages and coor-dinates future steering committee meetings and other communication about program changes. Faculty represen-tatives may be charged with identifying other OUR-faculty collaboration opportunities as well as ways in which the OUR can be included in discussions of new initiatives or changes. Regardless, both parties should have shared and individual responsibilities for maintaining a philosophy of collaboration and dual ownership. Now that we are aware of both the dangers of working in isolation and the ben-efits of collaboration, we must be diligent in preventing a return to our silos.
About the Authors
JERRY ROSS, ED.D. is the University Registrar at Syracuse University. Pre-viously, he was an Associate Registrar at West Virginia University and worked at the University of Southern Mississippi where he earned three degrees.
MELANIE STIMELING is Assistant Registrar for Catalog and Curriculum at West Virginia University. She has previously worked in academic advising and adult education and has been an adjunct instructor at other institu-tions before returning to her home state. Now working in the Office of the University Registrar, she maintains the University’s academic catalogs and helps ensure that course and curriculum updates happen smoothly. She earned her M.A. from West Virginia University.
LESLEY COTTRELL, PH.D. is an Associate Professor in the Department of Pediatrics, School of Medicine at West Virginia University. She served as the University Faculty Senate Chair in 2010–2011 and continues to be an active representative.

forumCampus Viewpoint
College & University | 67
By Karl E. Burgher and Michael Snyder
Managing Chaos
“It’s snowing still,” said Eeyore gloomily.“So it is.”“And freezing.”“Is it?”“Yes,” said Eeyore. “However,” he said, brightening up a lit-tle, “we haven’t had an earthquake lately.” (Milne 198)
WELCOME TO CHAOS…
…and your new normal. It is overwhelming, overextended, fast-paced, foggy, and frantic. And make no mistake: It is the new normal. You must accept this and rise to the occasion. Otherwise, you will give up or constantly seek greener grass through new employment. Chaos has come to organizations in all sectors—private, government, and academic. Yet even Eeyore could see through the fog and have a good day at times. If he could, then you can. There is always something to do that is purposeful, and that is something to be grateful for.
Welcome to the new world—“the Internet of things”—or “everything is moving fast with no time to be sure that we are done.” This is the 1st century—CRM, NSA, “wired,” Caprican, post–financial, meltdown economy. It has brought more of the vague, the unknown, and the un-certain, and with it a pace unknown in recent decades—
and one that carries with it considerable risk. Welcome to chaos. Life has gotten messy.
The risk—moving at a pace that exceeds your organiza-tion’s abilities—is inherent in all decisions and practice. You may try to avoid risk, but oh, you must grab ahold of this beast right now or else continue to suffer in the unknown, unproductive world of work that is never fin-ished and continually mounting. Let us remind you again (though we are fairly certain you have heard this many times): It is not whether risk exists but whether it is man-aged that matters. The problem is no longer whether you can avoid chaos; it is whether you can learn how to thrive in it.
Managing chaos is hard and risky, but not managing chaos is much worse. If you choose to embrace the current paradigm, it can be filled with opportunity, excitement, and numerous rewards. But it is not for the faint of heart. You must be confident, strong, methodic, and deliberate. You must be willing to constantly change your work and plans as new information is presented. You must dive in and attack. If you fail to, your staff will be underwater by the lunch hour. But if you succeed (and we believe you can), then it is a golden opportunity for you to shine and for the weak to fall away. The opportunity for field promo-tion during the battle with chaos is enormous.

College & University | 68
What are the odds that you will actually change and embrace the chaos? They are low. Human beings are quite risk averse. But doesn’t it sound like more fun to crash a Corvette than to drive a Yugo through life? Can you even call the safe path a life—or one you want to live?
Teddy Roosevelt (1899) said, “Far better is it to dare mighty things, to win glorious triumphs, even though checkered by failure…than to rank with those poor spirits who neither enjoy nor suffer much, because they live in a gray twilight that knows not victory nor defeat.” Roos-evelt lived a phenomenal life, and you can too. Managers, it is time to live. It is time to really manage. It is time to assume risk, to lead, and to earn your pay.
We have spent much time in previous articles describing tools (white papers, charters, plans, etc.) to help you orga-nize and manage. Now we offer more qualitative guidance.
THE ILLUSION OF CATCHING UP, REVISITED
Before we describe the first steps toward managing a bet-ter you and a better office, we want to briefly revisit the ‘il-lusion of catching up,’ which we discussed several articles ago. It is a fallacy to think that one day you will get caught up with your work and that your life will get back to nor-mal. Chaos is the new normal. There is no one project, one stressful semester, or one new hire that, once completed, will suddenly return you to a less stressful, slower-paced time. Recall the following all-too-common statements:
W “That project will have to wait until I catch up.” W “Once I finish a few things, we will finally get orga-nized.”
W “Once we get over the top on this one, we will exam-ine your proposal.”
W “This time of year [applied to any time of year] is al-ways busy.”
W “Let’s have lunch…right after I get a few things off my plate.”
W “When I catch up at work, we’ll take that vacation I promised you.”
W “Once work slows down, I will start coming home earlier and we will [fill in the blank].”
Over time, the thought process that underlies these statements crushes morale and destroys workplace pro-ductivity—especially as it begins to take its toll at home. Be honest: Rarely do you ever feel you are caught up. And
if you do, how long does it typically last? For most manag-ers, working at 110 percent is the daily reality. Many strive to combat this reality by working more hours. (After all, being the last one out of the parking lot and saying that you worked all weekend have become badges of honor.) But consider this: Working all weekend means not only that employees are working ineffectively but also that they are being managed ineffectively. The longer the pattern continues, the more the stress builds, the more morale declines, the greater the risk of project blunders, and the greater the likelihood that good employees will feel that they are failing one another and becoming unproductive. This is burnout: It is real, and it results in poor work and poor physical health.
It is time to let go of the illusion of catching up. Give it up, managers. Admit, accept, and move on. It is time to embrace the race, choose to run, choose to start, define “done,” and deliver.
In this article, we discuss a number of concepts that provide a starting point for beginning to organize the chaos. The concepts include managing yourself; managing your people; managing your boss; and managing politics and deliverables.
MANAGING YOURSELF
Choose to Lead
Today we all must be leaders—of our subordinates, our peers, and our family and friends. In the workplace, you must remove a variety of burdens from your staff. One of the most important aspects of leadership is to protect yourself and your people from needless organizational time wasters and overload so that everyone remains effec-tive. Think of yourself as an offensive lineman protecting the quarterback: You need to protect your people from in-terruption and politics. Their time must be managed and prioritized so they can concentrate on their work, finish their work, and feel a sense of accomplishment. There is nothing worse for a team than day-in, day-out stress. This leads to inefficiencies, lost time, lost resources, and delayed schedules. In short, staff under constant stress worry; they do not work.
Managers are like traffic cops or dispatchers who watch for the problems and landmines of the day. Leaders then take action to see that none of their people steps on those

College & University | 69
landmines. The economy is too competitive to not pay at-tention to all things managerial. Each day, you must come in to the office, be strategic full time, and work. We urge you to also jump in, take responsibility, and lead.
Choose to be Healthy
To quote the vile Count Rugen from the movie The Prin-cess Bride, “If you haven’t got your health, you haven’t got anything.” In order to execute on the sections that follow, you must ensure that you are giving yourself the best chance to succeed. Each and every day you come to the office, you must be ‘on.’ You must bring your ‘A’ game. You must be clear headed, well rested, and in pretty good shape. Being physically and mentally fit will enable you to perform at your highest level. It will keep stress from overtaking you. It will reduce the chances of a life-altering health event or a nagging injury or condition. It will enable you to remem-ber more, to be more creative, and to stave off burnout. It also will send a good message to your team, your boss, your colleagues, and your customers. It may not be fair that people judge those who are in good shape and good spirits more kindly than they do those who are not, but life isn’t fair. Don’t compromise yourself with poor health. If you won’t take care of yourself for the sake of your own body, then do it for your team and your pocketbook.
Pay Attention to All Things, Big and Small
We cannot emphasize this enough: You must pay atten-tion to all things big and small. The environment has be-come too competitive to overlook anything anymore. You must look at your customers, at your leaders, and at your organization and constantly be evaluating how you fit in, how your team fits in, what is being said, what is not being said, and what is important. You must be able to ‘go broad and go deep,’ meaning that you must understand a wide ar-ray of subjects but also have intimate knowledge of at least some of them. And because what is important changes from month to month, you must be ready to adapt your-self and your team quickly. This means professional devel-opment (discussed in greater detail below) and reviewing and adjusting strategy, structure, and methods as neces-sary. We estimate that new college graduates will have to become ‘brand new again’ every ten to fifteen years or so. What is a career but a few years of learning, a few more of high productivity and contribution, and then a few years
of hanging in and hanging on (assuming you avoid some major organizational shake-up)? Avoid that last stage and instead find yourself renewed in your productive stage. So choose to actively pay attention to as much as you possibly can. Take continual stock of and reinvent yourself as op-portunity to do so arises; otherwise, you may find yourself miserable—or even miserable and unemployed. Learn to look for and read the signs, both obvious and implied. Pay attention, or prepare to be replaced by someone who does.
Quit your Whining
Doubtless you have seen the sign “No whining!” No one likes a whiner, yet how often do we deserve the label? It is as if we are wired that way. As Agent Smith suggests in The Matrix, humans require misery. Life is not fair. Bad things happen. Talking about unfair things pushes away the blame. But as a manager, whining is unacceptable. You do not have time for it: it is not constructive, it helps no one, and it sets a bad example for your team. Yes, sometimes you need to vent. But if at all possible, vent to your spouse, to friends, or to your dog. If you must vent at work, close the door and do it with someone you trust. Stop whining. Work, execute, and deliver in order to stay profitable and employed. Period.
The fact is, you are where you are. If you aren’t happy with the circumstances, then change something. Move; become a boss; change the world. Otherwise, accept what you have, embrace it, and make the best of it. If you do not enjoy today, no one will let you be in charge of tomorrow. Understand and accept that you live in chaos—and that chaos, understood, can be rewarding.
Organize
We urge you to utilize the organizational techniques ar-ticulated in our previous articles. You cannot afford to be the least bit disorganized. You must understand your team’s work. All work must be lined out and prioritized. You must know how many projects you have in motion, how many you are terminating, how long each is expected to take, who is working on what, and at what stage every project is currently at. You must know how much time is required for maintenance, how much for management, and how much for meetings. Start simply—with white papers—then move to work plans and toward under-standing how your resources are consumed. Always think

College & University | 70
in terms of resource balance and deliverables. Resources include your and your people’s hours, your money (bud-get), and your energy. Do not expend energy on things that are of no use.
Manage Time Like a Consultant
Come to work ready to deliver that ‘A’ game. Think as if ev-ery hour of your day must be productive, billable, and use-ful. Plan every hour deliberately. Otherwise, you cheat your customer—your organization, your team, and yourself. Do not misinterpret this as burying your head at your desk ev-ery moment of every day. Chats near the water cooler and casual visits can be useful for politics and moving work for-ward—or simply for the sake of a little break (recall that we do need to take time for restoration). Just be sure that they have purpose; if they don’t, move on after a friendly exchange or gesture. Neither consultants nor you can af-ford to allocate hours to non-billable or ‘not useful’ tasks.
Manage Professional Development
Learn something every day. Make it a point to read for at least an hour or two every day. How can you find that kind of time? Be purposeful. You may not be able to read quite that much every day, but at least attempt it on many days. Once you are organized in other areas, you can make time to read. It is important. It is too easy to let go of personal and professional development goals. But you must make them a priority. Plan your career as well as your strategic development. Know how you want to progress. Know how you want to grow your team, your knowledge and intellect, your career, and even knowledge for knowledge’s sake. Just as athletes continually train their minds and bodies in order to stay competitive, managers must train in order to hone their skills and stay employed.
Manage Confidence
You need confidence. Yet confidence can be oh-so-difficult to maintain. Although you may feel insecure at times, do not reveal your fears and doubts to your people, your bosses, or your competitors. Instead, manage your fears. Some may be legitimate, but often they are your own creations. In any event, do not be ruled by them. There is no reason to feel a lack of confidence if you have trained and prepared. Re-member and understand that what you do is work. And work is not life, your spouse or children, your tennis or golf
game. Work is not who we are (although many seem to be-lieve otherwise). It is what you do for pay; it is work. The point is not to take everything quite so personally.
You can help spread this confidence by empowering your people to take charge, allowing them to take the lead, and allowing them to help you. Your people need to be able to make decisions without fearing that their doing so will result in your becoming unfriendly and/or unstable. Too many of us have had a boss like that. By empowering your staff, you will give yourself the gift of time to train (professional development) and to be more productive.
MANAGE YOUR PEOPLE, UP AND DOWN
Actively Manage
Management is difficult—more difficult than in the past. It requires managing not only your people but also your bosses and, perhaps most difficult, yourself.
It is challenging to remain self-disciplined and self-strategic while not feeling stressed much of the time; at best, it puts you in a state of constant adjustment. It also can be very lonely. In fact, it has gotten a whole lot lone-lier because in order to be effective, middle managers must make many more decisions in isolation than ever before. There is no time to spare: You must evaluate alternatives quickly, gather cost-benefit data and information, make decisions, and move forward, and, as necessary, change course—quickly.
In managing subordinates, you need to make fast deci-sions while at the same time encouraging and protecting. Your employees need to stay focused and confident in the assurance that their work is purposeful and meaningful. A group hug may not always be appropriate to ensure that ev-eryone is on board. Shared governance is common practice in higher education, but there are many times and circum-stances when it may not be appropriate or competitive, es-pecially as external constituents and politics and the latest ‘big idea’ require a quick response. Even after big decisions are made, dozens of smaller decisions may be necessary to move an effort forward. (That said, be sure to avoid the over-planning that can doom a project before it begins.)
Managing Up
Long ago you may have been taught that a manager was misdirecting effort if she spent more than 0 percent of
College & University | 71
her time managing her subordinates. The other 80 percent needs to be spent managing stakeholders, customers, cli-ents, and the boss.
Helping the boss see her way to the right decision has always been an important part of being a good employee. A boss cannot and does not know all things. Teach, help, and provide enough information to facilitate good deci-sion making but not so much as to create confusion. Find the balance: Bring solutions to the meeting. Try not to be yet another problem for your supervisor.
If you cannot communicate your issue in five or fewer minutes (ideally, you will do so in two minutes or less), then you do not understand your problem well enough. You have not studied the issue sufficiently to communi-cate quickly, explain concisely, and identify solutions. Sometimes you may need to ask for advice. But keep that simple, as well. Provide a document and say, “I want your opinion.” Talk for a maximum of one minute and then ask, “How would you handle that?” Be brief, and request specific commentary about a specific subject so you can leave with a decision (or at least with some useful advice).
Frequent, brief, work-only, decision- and deliverable-oriented visits can help you get noticed. Help your boss make the right decisions day in and day out. Help him to be successful. As a result, you will be appreciated, you will learn, and perhaps you will even become the boss someday.
Protect
In the midst of chaos, you must ensure that your employ-ees feel protected so they will be free to excel, produce, and feel empowered and purposeful. How can you do this? Begin by managing yourself in such a way as to not burden your people with your own issues. Your employees have plenty to do without having to worry about manag-ing you and your problems or inefficiencies.
Next, protect your people from outside attacks or as-saults on their workload. (This is so important a concept that we include it under both leadership and manage-ment.) Make it clear to the outside world that your team is organized and working hard—that you have prioritized, scheduled, and planned. The world must know that you have good white papers and work plans and that your team delivers work efficiently. Those outside of your group must understand that you have your team under control and that the work flows through you. As manager, you are
the gatekeeper. You are the sentinel. No work is under-taken without it first being assessed by you, and no assign-ment is issued without your knowledge.
Be careful not to protect people from working hard—only protect them against overwhelming amounts of work. Your team must work hard and deliver a steady stream of high-quality projects. It must not be expected to deliver top-priority outcomes by the end of the semester.
Consider one more strategy as a tool for protection: throw some work under the bus. At times you will be un-able to hold back the crowd. Sometimes, for various rea-sons, you won’t be able to stop as much at the gate as you would like to, or you won’t be able to schedule, assign, and negotiate quickly enough. You cannot pile on work beyond the breaking point without jeopardizing both the quality of your work and related schedules. It is too easy to become a bastion of mediocrity. It is better to accomplish less well than to do everything poorly. When the quan-tity of work becomes overwhelming, consider strategic failure. Decide purposefully that some things will not be completed according to someone else’s plan. Throw the work under the bus of that vice president who can get the president’s attention; that attention might lead in turn to prioritization and perhaps even another person to help do the work. Or throw the work under the bus of the person with no power and whom no one likes. Whatever you de-cide, be strategic: having a poor or no outcome in one area should result in increased productivity in another area. This requires courage. Allow your team to let certain proj-ects wait until another day. You may have to pay a price for utilizing this strategy. You may suffer a consequence for de-prioritizing the wrong project. This is a cost of being the manager. Adverse consequences are not your team’s fault. You must take responsibility, deal with the conse-quences, and negotiate the fallout. If you don’t like it, then you may need to rethink your management track.
Coaching: Managing Isn’t What it Used to Be
Given the shift from an industrial society to one filled with knowledge workers (particularly so-sensitive millennials), considerable coaching is required. The coaching-manag-ing philosophy is no longer optional but rather an every-day prerequisite for success. Previously, managing meant lining out your people, stating objectives or outcomes, and then letting your people do the work. Now, people require

College & University | 72
continuous monitoring, contact, motivation, engagement, and a level of expressed gratitude not required previously. You need to encourage, communicate often, manage by walking around the office (and eating with your people), and let your people know that you know what they are ca-pable of and that you expect nothing less. You must know each of your people well, care about them as individuals, and make them understand and believe that you are there to help them succeed. In today’s workplace, teams need to be coached to victory.
Balance
Unless you have been working in a cave, you have read and heard much about work/ life balance. Most managers and employees rate it as important. Some of us even make a con-certed effort to make a few changes in order to attain bal-ance, but more often than not we soon find we are back to feeling overwhelmed and working longer hours. What can you do to improve your work/life balance? First, be a bit flexible; second, have clearly defined work plans. The bur-
den is on you as manager to assign the appropriate amount of work to your people. The burden is on you to ensure that work plans are robust, with milestones and delivery dates established with balance in mind. Don’t beat up your peo-ple. You will have to work them to 0 hours a week, week in and week out. That is the new norm. But give them the time to work with some flexibility. Not all will rise to the occasion, but the best folks will. Take care of them.
Some of your staff will not go home willingly. But go home they must. If necessary, get angry. Force them to go home. Force them to take days off. Working all weekend and never taking vacation is not a positive trait. Usually it is a sign that something is wrong. Either you are not managing correctly, or the employee has some other issue. Rather than demonstrating a willingness to work hard, working constantly demonstrates that the individual has no life apart from work, is inefficient, or is not delegating appropriately. Work is good, but rest fosters creativity and innovation. Humans are workers by nature, but like salt in
www.aacrao.org/bookstore
The CompleteSEM Solution.
strategic enrollment management know-how from the most respected leaders in the field
American Association of Collegiate Registrars and Admissions Officers
From complex theory to practical implementation advice to real-world case studies, our collection of knowledge helps enrollment managers learn and apply SEM principles that can elevate their campuses to a whole new level of efficiency and success! Choose from our wide array of reference books or inquire about AACRAO’s Consulting Services to deepen your understanding of this important subject. Visit our Web site to find out more.
College & University | 73
the blood stream, too much will kill a person…or at least make him miserable to be around.
Know that attaining balance all the time is nearly im-possible—but do aim for balance to 7 percent of the time. Work is often crazy, but don’t let “crazy” be the norm every day.
Rewards
Rewards are good, but they are only as good as they are scarce and sincere. Work isn’t third grade soccer camp where everyone gets a trophy for showing up. In trying to reward all for everything, you reward no one. Rewards need to be important; they need to be sincere; they need to be real. They are wonderful when used appropriately and horrible when they are not.
Reward only when work is great. Otherwise, keep the plaques in the drawer and wait for the day when you in-deed do have a winner. Long ago we had a student ask why no one in class got an A. Our response was that no one deserved an A. Teaching evaluations for that class were not too favorable, but that is life. Managing—like teach-ing—can require some dissatisfaction in order to do what is right. Think through your rewards carefully, and be sure that any recognition you offer has a purpose.
That said, when someone is deserving, do not miss the opportunity to immediately and loudly acknowledge her contribution. Single out the person who is an example for all to follow. The reward need not be big or expensive. Whether you grant a day off, lunch with the boss, or tick-ets to a ball game, an expression of gratitude goes a long way. Save it for when it is deserved, and then make it vis-ible and special.
Some argue that higher education has far too many re-wards. Give significant thought to what is appropriate in your individual workplace, and be sure that rewards are appropriate and meaningful. Note that a percent across the board pay increase is a cost of living allowance (or at best profit-sharing), not a merit raise. Do not call a pay increase a raise if it rewards all employees, good and bad, at the same level. This is destructive. That said, higher edu-cation allows far too little in the way of merit pay. But just because it is difficult to allocate does not mean that we shouldn’t try to help our organizations keep great people. If you cannot increase your staff members’ pay, then think of perks and recognition you can offer. You must differen-
tiate good from mediocre work and then reward the good as appropriately as you can.
MANAGING DELIVERABLES
Be a Solution Provider
You should have heard by now that you should bring only solutions —and not problems—to the boss. Be the person who delivers solutions. Show up with evidence that you have taken the time to think the problem through and that you are seeking approval of possible solutions, not throwing up your hands because you don’t have any idea of what to do. Communicate costs and benefits, pros and cons, and seek a decision that will move you forward. At worst, ask for guidance or advice; do not ask to be told what to do. And be careful about asking your boss if she wants A or B because she may say yes to both—particu-larly if A and B solve different problems. The objective is to advance progress, not to obtain more work. So deliver a solution. Deliver thought, a plan, and a close.
Deliver Loudly and Visibly
Be sure to position your delivery so all can see it. Deliver a show complete with an opening, a beta test, and a final solution; serve cookies and punch, food and liquor. Do whatever it takes for people to notice that you and your team delivered on time and on budget. This is politics and showmanship at its finest. It can be done with humility, but remember: it is show time; it is delivery time. Take ad-vantage of the fact that you and your team have done well. The team will get promoted, and everyone will get a little more at the end of the year—be it pay, a promotion, or an increased budget to do more excellent work the next year.
Celebrate Delivery
There will be times when your delivery can be neither loud nor visible. Even in such cases, you still need to celebrate with your team. Thank your staff for doing great work. Whether delivered over donuts and coffee or at a black-tie event, your thanks lets your people know that they have purpose and are appreciated. Have a party at the office; take them out to lunch; or give them gift cards. What you do doesn’t really matter. Just do and celebrate.
Remember: Delivery in all its forms should be visible, loud, and celebrated. Get what you can while you can. An-

College & University | 74
nounce your wins. Perhaps the Office of Registration and Records just celebrated its th consecutive upgrade with-out a hitch, or the 10,000th online transcript was printed, or the professional development software was implemented in record time. Is this playing politics? Yes. But it is also educational. If you do not tell the world what your team is doing, who will? Certainly not the other departments that are after your budget. Be strategic; be smart; deliver.
HOLDING TIGHT TO SATURDAY AND SUNDAY
We know that we are not inventing new concepts but rather synthesizing and summarizing ideas for managing your work force. Good management and good leadership concepts have been around for quite some time, but we all need a constant refresher. Further, these concepts need to be modified according to each generation’s attitudes and characteristics. The societal shift from industry to service and knowledge necessitates significant adjustment of man-agement concepts and practice. We must constantly re-mind ourselves that there is always more to read and learn.
We hope that our practical, deliberate delivery of the management concepts discussed here—concepts that have stood the test of time—will help you attain real change at your institution, in your group or unit, and in you.
WE ARE IN CHAOS
We are in an all-out competitive, war-like environment where everyone every moment is trying to out-do and out-compete everyone else. Education is now global; con-tent is global—and packets of data are flying around at the speed of light. As you sleep, someone somewhere is trying to steal your students and your way of life in order to bet-ter his own.
Because we have such unrestricted access to informa-tion—and, thus, to projects and initiatives—the supply of work to add to our chaos seems never-ending. Well, actually it is never-ending. We are an overworked, under-rested, accelerated “-Hour Energy Drink” society. There is no going back.
We need to learn to succeed, find balance, find faith today and in the future, hold on to hope, be human, and enjoy our children, spouses, and friends. We need to be in the business of execution and delivery in the most effi-cient manner possible. Close projects, provide service, and make money (okay, academics, budget surpluses). Most of the time we do not need fancy concepts or long-winded quantitative models and behavioral concepts. Rather, we need to get people to do good work in a safe and uninter-rupted workplace. Each of us works best when we feel as good about our place as we can and have some purpose and balance in our lives.
Commit to some light project management and some detailed people management. Take back your Saturdays and Sundays.
REFERENCESMilne, A. A. 198. The House at Pooh Corner. Retrieved March 17, 01
from: <www.winnie-pooh.org/house-pooh-corner.htm>.Roosevelt, T. R. 1899, April 10. Speech before the Hamilton Club. Chi-
cago, IL. Retrieved March 17, 01 from: <http://en.wikiquote.org/wiki/Theodore_Roosevelt>.
About the Authors
KARL E. BURGHER, PH.D., P.E. , is former Chief Strategy Officer and cur-rent Professor of the Built Environment at Indiana State University (ISU). Over the past four years, he managed the implementation of ISU’s strate-gic plan, overseeing 45 teams and more than 300 specifically defined projects in a PM-like matrix fashion. Karl learned PM techniques while working for ten years as an explosives engineer in the construction indus-try and as a contractor for the Department of Energy and US-EPA. He has managed many federal research and education projects as a center direc-tor and vice president of research. Karl earned a B.S. and an M.S. in min-ing engineering from Michigan Technological University and a B.S. in economics and a Ph.D. in mining engineering from the former University of Missouri–Rolla (now Missouri University of Science and Technology).
MICHAEL B. SNYDER, P.M.P. , is the Executive Director of Strategic Initia-tives at Indiana State University (ISU). Mike assumed ownership of the management of ISU’s strategic plan in January 2014. He has been a proj-ect manager for more than a dozen years, first in the Fortune 500 pri-vate-sector environment and then in higher education for the past six. His current focus is the maintenance and growth of ISU’s strategic plan and the hardening of the enterprise-wide use of ISU’s CRM via the man-agement of BI and IR. Recently, academic departments have very spe-cifically been brought into the strategic planning and implementation process. Mike earned his bachelor’s degree in computer science, special-izing in business systems, from Pacific Lutheran University. He completed his M.B.A. at ISU in May 2014.
forumResearch in Brief
College & University | 75
By Linda Serra Hagedorn and Jiayi Hu
Eastern Dreams: Alternative Pathways for Chinese Students Pursuing
Baccalaureate Degrees in the United States
The number of international students pursuing postsec-ondary degrees in the United States has increased consis-tently over the past several years (Institute of International Education 01, 01). In fact, the most recent report—for academic year 01–1—indicates that compared to the previous academic year, the number of international students at U.S. colleges and universities increased by 7. percent, to more than 800,000. Students from China lead this global trend, accounting for 8.7 percent of all international postsecondary students in the United States. Moreover, the number of Chinese students studying in the United States continues to increase, as demonstrated by the sharp increase (1. %) compared to the previous academic year (IIE 01, 01). All indications are that the number of Chinese students applying to U.S. colleges and universities will continue to increase, perhaps resulting in a need for enrollment professionals to examine current policies for relevance and fairness and to understand how students from China are preparing to enroll.
The surge in numbers may be traced to China’s his-torical and cultural emphasis on education, which has been augmented by the country’s one child policy and an increasingly large middle class. Together, these factors have produced a generation of parents with not only the highest expectations for their sole offspring but also the
resources to invest in an education they believe will help their children distinguish themselves from their peers. Many Chinese parents believe that a western education at an elite university will guarantee their children a bright future. Overseas degrees are highly valued in the Chinese job market, with U.S. degrees the most favored (Inside Higher Ed 01). The increase in the number of Chinese applicants to U.S. universities—particularly elite and Ivy League universities—has resulted in intense competition among Chinese students.
Yet the drastic increases in the number of Chinese col-lege students at U.S. colleges and universities is not univer-sally welcome. For example, there is evidence that some Americans believe that Chinese students displace U.S. students. The Chronicle of Higher Education reports that the increasing number of Chinese students has resulted in complaints that campuses have become “too Asian” (Ruse 010). Some Americans also believe that many Chinese students cheat on tests and academic work (Winn 01). These issues together have made the admission of Asian students—Chinese students, especially—increasingly controversial ( Jiang 011). Chinese high school students who dream of success must be even more competitive and must strive even more to distinguish themselves from their peers. (See Figure 1, a framework for understanding

College & University | 76
the nature of and the conflicts among “eastern dreams,” Chinese students’ need to distinguish themselves, and the perceptions of Asian students at western universities.)
In an effort to distinguish themselves from their peers and turn their dreams of a U.S. education into reality, Chinese students pursue additional coursework, intensive English language training, and alternative educational pathways. This article describes the various pathways avail-able to Chinese students who seek to prepare for a bacca-laureate education in the United States. For each pathway, we provide a description, a synopsis of its current status, and an overview of related challenges.
ALTERNATIVE PATHWAYS
Chinese students with eastern dreams must begin the process of distinguishing themselves from their peers long before they begin filling out college applications. In many cases, this process turns into a frenzy of additional train-ing, classes, alternative college credits, and working with education agents. Although students may participate in a full array of strategies designed to “win” the college admis-sions race, the actual criteria or ways that these activities are evaluated have never been researched or documented. Given the consequent lack of knowledge of what really works and a pervasive belief that “more is better,” eastern dreamers often pursue courses and activities that require significant commitments of time and money.
PATHWAY 1: EDUCATION AGENTS
What is an education agent?
The cloaked nature of how elite colleges choose whom to admit has inspired the rise of education agents who, for a price, promise assistance with and success in the col-lege application process. An education agent is a person, company, or organization that provides services for a fee to students seeking to earn a degree abroad. (The fee may be paid by the students, U.S. institutions, or both.) Agents may enroll students in special classes, assist with the col-lege application process, and/or help students obtain vi-sas. Zhang and Hagedorn (011) describe the burgeoning of agents as phenomenal.
The Current Status of Education Agents
According to Zinch China (Bergman, 01), 80 percent of Chinese undergraduate students employ an agent to as-sist in the filing of their college applications. While some agents operate scrupulously and provide helpful services to families with no prior experience of study overseas, others prey on the ignorance of students and their fami-lies and charge high prices, often for unnecessary services. Moreover, some agents write their clients’ personal state-ments, forge letters of recommendation, and may even produce fraudulent admission and/or English test scores (Hagedorn and Zhang 01).
l FIGURE 1. Factors Affecting “Eastern Dream” and “Western Reality”
Eastern Dream Western RealityDesire to Attend an
Elite Institution driven by… KOne-child policy KValue of all things Western KGrowing middle class KOverseas degree recognition
KIncreasing number of Chinese students KBacklash due to…
fUniversities becoming too “Asian” fAsian plagiarism fAsian admission cheating
College & University | 77
Challenges Related to Education Agents
Zinch China (Bergman 01) estimates that as many as 90 percent of recommendation letters in support of Chi-nese students’ U.S. college and university applications are fraudulent; 70 percent of such students’ college applica-tion essays are not written by the students; and half of all high school transcripts of Chinese applicants to U.S. institutions are falsified (Kwok 01). Students who gain admission to elite programs on the basis fraudulent means (e.g., cheating) may fail out and/or find themselves sub-ject to other negative outcomes subsequent to their enroll-ment (Bergman 01; Ma 01).
Some U.S. institutions work with specific agents to re-cruit international students. In some instances, the college or university may pay the agent a commission or finding fee. At present, no licensing or listing identifies agents who can be trusted or those who are suspected of engaging in fraudulent or otherwise questionable behaviors.
PATHWAY 2: SPECIAL COLLEGE PREPARATION PROGRAMS (CPPS)
What are special college preparation programs?
College preparation programs are relatively long-term (typically two- or three-year) programs that feature English proficiency, college preparatory, and study skills courses as well as application services. Most CPPs are con-ducted at Chinese high schools for students who plan to study abroad in English-speaking countries. Some pro-grams award transferable college credit. (Such programs are typically high cost and high stakes.)
Global Access Certificate. The Global Access Certifi-cate (GAC), a product of ACT Education Solutions, Lim-ited (a subsidiary of ACT Inc.), is a typical example of a college-credit-based preparation program. The GAC pro-gram is reported to provide students with the academic knowledge, learning skills, English language skills, and confidence to enter and successfully complete a bachelor’s degree program at a foreign university. The GAC program operates within Chinese high schools by offering courses during regular school hours. The courses are comparable to dual enrollment programs in the United States whereby students may earn college credit that can be transferred to a foreign university. Students who earn the GAC by com-pleting three levels of courses may transfer as many as 1
credits to any of at least U.S. colleges and universities. (The transfer credits are verified by the American Council on Education’s College Credit Recommendation Service.)
The GAC program has been offered in China since 000. In 008, approximately 0 GAC-approved teaching centers were in operation (New GAC Centers Opening in China, ACT Education Solutions 008). The China Cen-ter for International Education Exchange (01) reported that in 01, GAC centers were operating in China—with plans for more.
International Baccalaureate (IB) program. The Inter-national Baccalaureate program assists students who are contemplating studying abroad. Students take a series of college-level courses during their last two years of high school. The IB program comprises three core sections and six subject groups. A central part of the program is an ex-tended essay that requires independent research related to one of the IB subjects. In addition to the core courses, IB students must choose one subject from each of five groups: (1) language and literature, () additional language(s), () the social sciences, () the experimental sciences, and () mathematics and computer sciences. In addition, the stu-dent may choose either an arts subject from a sixth group (the arts) or a second subject from one of the other groups (1 through ).
What is the current status of special college preparation programs?
The number of students enrolled in special college prepa-ration programs in China is increasing rapidly. Consider Shenzhen, one of the developed cities in China, with al-most ,000 students decide to study abroad by avoiding National College Entrance Exam in China per year, ten public high schools have began to offer international col-lege preparation programs during the year 011 and 01 (Souhu Education Online 01). Take the capital city Bei-jing as an example, the report published by China Edu-cation Online (01) indicates that until 01, seventeen high-performance high schools in Beijing have established international college preparation programs. From 009 to 01, sixteen new international college preparation pro-grams have been established, with a doubled increase rate.
The first IB-authorized school in China was established in 1991 (IBO 01c, 01d). The IB Primary Years Pro-gramme (PYP), for students aged three to twelve years, fo-
College & University | 78
cuses on the development of the child as an inquirer, both in the classroom and in the world. The IB Middle Years Program, in operation since 199, is designed for students aged eleven to sixteen. The IB Diploma Program starting from 198, was designed, for students aged 1 to 19, to de-liver an academically challenging and balanced program of education with final examinations that prepare students for success at the postsecondary level and beyond. The lat-est statistics indicate that 7 IB world schools in China of-fer one or more of the three IB programs; 9 schools offer the primary years program; schools offer the middle years program; and schools offer the diploma program (Hagedorn and Hu [in press]).
What are the challenges related to special college preparation programs?
Despite the rapid growth of interest in CPPs, no regula-tions govern the marketing or establishment of such pro-grams in Chinese high schools. In addition to the two major CPPs described above, numerous individual pro-
grams operate in private Chinese high schools and other venues. No official listing or governing policy exists for businesses that purport to serve students and their families in attaining their dreams of international study. Most par-ents enroll their children in special high school programs without the benefit of full knowledge of other programs that offer similar services. Some programs may mislead parents by advertising—aggressively or even falsely—that they successfully enroll large percentages of students at top U.S. institutions.
Once a Chinese student enrolls in a special program whose curriculum differs significantly from that of a tradi-tional Chinese high school, he must opt out of taking the gaokao, the national college exams. CPPs prepare students to take the tests required for consideration for admission to U.S. institutions (e.g., the Test of English as a Foreign Language, or TOEFL, and the ACT). The gaokao require an entirely different preparation process. Thus, Chinese stu-dents who enroll in CPPs forego their eligibility for enroll-ment at Chinese universities. Once the decision is made
Our ever-expanding Web site is filled with timely information and
news for the growing community of registrars and admissions officers
in the United States and around the world. Association members
enjoy special benefits and exclusive access to AACRAO’s higher level
resources and news. Here’s a small sampling of what content areas
the site includes:
E AACRAO Transcript (An Online News Source)
E Jobs Online
E Webinars
E Transfer Credit Practices (TCP) Online
E Bookstore
E Self-Assessment
E Online Courses
and much more…
Pull up a chair and give us a visit today at www.aacrao.org!
Come see what AACRAO Online has to offer you…
A M E R I C A N A S S O C I A T I O N O F C O L L E G I A T E R E G I S T R A R S A N D A D M I S S I O N S O F F I C E R S
www.aacrao.org
College & University | 79
to prepare for international college admission, the door to postsecondary education in the home country is closed.
PATHWAY 3: INTERNATIONAL COLLABORATIVE DEGREE PROGRAMS
What are international collaborative degree programs?
In general, international collaborative degree programs serve Chinese college students who have taken a more tra-ditional path in high school, have taken the gaokao, and have been admitted to a Chinese university. The interna-tional collaborative degree program is the result of a part-nership between institutions that allows students to earn a U.S. baccalaureate degree as well as a Chinese degree. There are various types of collaborative degrees, including:
W Joint Degree: Two institutions (one American and the other Chinese) collaborate on the award of one degree. The diploma typically records both institutions’ names.
W Dual Degree: Two institutions award separate though articulated degrees.
W Single Degree: Students take courses in one country and transfer earned credits to an institution in another country; the degree is earned from the institution to which the credits are transfered.
Popular configurations of collaborative programs are the “1+” and the “+.” Students enrolled in a + pro-gram pursue half of the program requirements (two years’ worth) at their host country campus and the other half at the foreign institution with which their host campus has a collaborative degree agreement. This provides students with time both to improve their English language skills and to gain college experience prior to going abroad.
What is the current status of international collaborative programs?
Universities often hesitate to develop collaborative pro-grams because they require a close and carefully moni-tored relationship based on agreements specific to degree components. Collaborative programs may include agree-ments regarding tuition charges, transfer credit policies, and when and how to “double count” credits earned across both degrees.
Students and their families find collaborative degree programs attractive because of the versatility and utility of earning two university endorsements simultaneously. Having to spend less time in the United States also may result in some cost savings.
What are the challenges related to international collaborative programs?
Because participation in a collaborative program typically results in students’ spending less time in the United States than if they were enrolling outright in a U.S. baccalaureate degree program, students are likely to have a more limited international experience. Students enrolled in a collabora-tive program also may encounter some difficulties in relat-ing advanced courses in one country to the introductory courses they took in another country. Beyond differences in curriculum, teaching style, and assignments, social and cultural differences may hinder students’ success.
Another challenge for students participating in col-laborative programs relates to their lack of institutional choice. Chinese students admitted to a program cannot earn a degree from any other U.S. university than that stip-ulated in the cooperative agreement.
PATHWAY 4: “SWIRLING TRENDS”
What is the “swirling trend” as it relates to international students from China?
The term “swirl” was first used in 1990 by Maricopa County Community College officials to describe the non-linear paths forged by college students admitted to multiple colleges. A student may alternate enrollment between two- and four-year colleges or may attend both types of colleges concurrently, taking courses and earning credit at both institutions (Palmer 001). Like their peers in the United States, increasing numbers of international students are taking courses at more than one institution (Hu and Hagedorn [in press]). For example, it is not un-common for international university students to also take courses at community colleges. Students then transfer the credits from the two-year to the four-year institution.
What is the current status of swirling?
Swirling between two- and four-year institutions became increasingly common between 00 and 01 (Hagedorn

College & University | 80
and Hu [in press]). The reasons that underlie swirling include efforts to offset the high tuition at four-year in-stitutions and to decrease time to degree, seeking access to popular professors at two-year institutions, bypassing difficult courses at four-year institutions, and optimizing one’s course schedule (Hu and Hagedorn [in press]). Ac-cording to a case study at one midwestern U.S. research university, Chinese international students were most likely to enroll in language and literature courses at com-munity colleges.
What are the challenges related to swirling?
Unlike students who enroll in collaborative programs, students who ‘swirl’ negotiate multiple institutions’ re-quirements on their own. No cohesive guiding policy or regulations direct them to the correct courses for their degree programs. Students may find that certain course credits either do not transfer at all or may not count to-ward their graduation requirements. Students who enroll in online coursework may find they are less successful than they might have been in a traditional course. Students also may choose to enroll in certain courses at an alternative institution (such as a community college) because they anticipate that the course will be less rigorous than at their primary institution. For the four-year institution, the trend of international students ‘swirling’ is likely to result in a loss of tuition revenue.
PATHWAY 5: INTERNATIONAL SUMMER SCHOOL
What is international summer school?
This pathway is unique in that it targets students who have already completed at least one year of postsecondary coursework at a U.S. college or university. International summer schools are independent educational entities that enroll students during the summer while they are in their home country (e.g., China). They offer students the opportunity (1) to decrease either the time to degree or their course load during the regular academic year and () to continue their studies throughout the summer. Inter-national summer school programs advertise that credits earned will transfer to the U.S. colleges or universities at which students are regularly enrolled and will apply to-ward their degrees.
What is the current status of international summer school?
The SIE International Summer School is the most promi-nent program of this type, having partnered with some of China’s best universities—including East China Normal University (Shanghai), University of International Busi-ness and Economics (Beijing), Beijing Normal University, Nanjing University, and Sun Yat-Sen University (Guang-zhou) (SIE International Summer School 01). Since its founding in 009, it has enrolled more than 1,00 students and has reported helping them save millions of dollars of college tuition while offering a U.S. university-level educa-tion (SIE International Summer School—Undergraduates 01). According to an SIE International Summer School administrator, the program was begun by a Wabash Col-lege graduate who saw the need for Chinese students to return home during the summer and to earn college credit while there. SIE’s mission is to be the pioneer and leader in establishing international summer school programs in China and to provide the opportunity to earn U.S. univer-sity–level transfer credits.
By 01, most competitor organizations had gone out of business. At the time of this writing, SIE is the only in-ternational summer school operating in China.
What are the challenges related to international summer school programs?
Enrolling in an international summer school may seem an opportune way for students to utilize their time and save money, but the effectiveness of ISS courses has not been tested. Moreover, there is no guarantee that a particular U.S. college or university will accept such credits for trans-fer. In fact, because the credit transfer system has not been standardized, some U.S. institutions—for example, Mich-igan State University and Indiana University at Bloom-ington—refuse to accept credits from programs like the Chinese International Summer School (McMurhrie and Farrar 01).
RECENT REFORMS OF CHINESE COLLEGE ADMISSION
For China, the rapidly growing numbers of its students pursuing international study is troubling. Concerns about “brain drain” and about fewer students taking the gaokao have prompted new policies. Policy makers in China un-derstand that many students choose to study abroad so
College & University | 81
they can bypass the fierce competition of the gaokao. Ac-cording to Zhang and Hagedorn (011), the gaokao is a “typical example of large-scale selective exams with fierce competitions and extremely high stakes. It has been the most important and the most influential exam in China” (p. 10). A student’s scores on the gaokao are the solitary determinant not only of what university the student is eli-gible to enter but also whether he can enter any Chinese university. The pressure is tremendous—particularly as a student may take the gaokao only once.
At the October 01 Third Plenary Session of the 18th Communist Party of China, the Central Committee rec-ommended reforms to the gaokao in order to eliminate many of its most devastating disadvantages (including its sole assessment standard, sole selection method, and sole college entrance channel). The Ministry of Education sub-sequently developed a set of reform measures: First, the college admission standard will be modified to focus not only on students’ gaokao scores but also on their academic performance and high school social activities. A formative assessment that quantifies a student’s current academic capabilities as well as his potential will replace the sum-mative assessment, and the measurement focus will shift from test scores to the whole learning process. The new assessment standards assign levels from A to F rather than specific scores. In the past, students could miss by a mere point the opportunity to enroll at the university of their choice. It is expected that the levels (A to F) will assess student capabilities more fairly. These changes will make college admission more objective, accurate, and effective in the assessment of student capabilities.
Second, the gaokao will be offered multiple times a year. Some subjects, such as English, will be tested mul-tiple times a year, allowing students to prepare according to their own schedules. In the past, students had to pre-pare for all subjects at the same time and took all of the exams during an appointed period of time. In contrast, the gaokao reform will allow students to take subject-specific exams upon completion of intensive study of just that subject. Thus, students will have the flexibility to sched-ule their study of specific subjects over a longer time span and so will be able to devote their attention to one or two subjects at a time.
Third, colleges will have more freedom to recruit stu-dents in accordance with their own objectives. They will
be able to organize exams that test the learning capabilities they particularly value.
Fourth, although the Chinese central government will continue to manage the college admission process, it has expressed a desire to lessen its oversight of certain areas and to allow education authorities to exercise greater re-sponsibility.
College admission in China seems to be becoming more flexible, expanding opportunities for students to en-ter Chinese universities. Such changes may relieve some of the pressure that in recent years has significantly increased the number of Chinese students studying abroad.
CONCLUSION AND IMPLICATIONS
U.S. higher education remains the envy of the world. It is no surprise that Chinese students and their families dream of undertaking postsecondary study in the west. The dream typically features an Ivy League university, but in fact, all forms of U.S. postsecondary instruction are considered prime. The number of preparatory high school programs suggests that the surge of students from China will not abate anytime soon. (A related trend is the rise of programs and intensive English instruction for el-ementary and even preschool students in China.) These numbers cannot be ignored. U.S. colleges and universities must respond thoughtfully with policy that will balance opportunities for access among its citizens and its admir-ers. Moreover, they must also develop policy related to al-ternative means to earning a college degree domestically and internationally. Agents, special programs, and swirl-ing are not uniquely Chinese issues but are contemporary global trends. Such innovations are developing more rap-idly than policies for managing them.
Confucius, in his doctrine of the golden mean, stated that “too much is as bad as too little” (Dorter 00). To-day’s Chinese student dreams of a U.S. college education and is bombarded with many alternatives and pressure to achieve more. U.S. institutions must seek to develop policy that will delicately balance international students’ desire to study in America, the goals of globalization, and the need to maintain appropriate access. In short, U.S. in-stitutions need to seek their own golden mean.
REFERENCESBergman, J. 01. Forged transcripts and fake essays: How unscrupu-
lous agents get Chinese students into U.S. schools. Time. Available

College & University | 82
at: <http://world.time.com/01/07//forged-transcripts-and-fake-essays-how-unscrupulous-agents-get-chinese-students-into-u-s-schools/>.
China Center for International Exchange. 01. Project of Global Access.China Education Online. 01. 01年出国留学趋势详细数据报告.
Available at: <www.kentrexs.cn/usadaxue/guwen/0100819_.html>.
CCIEE. See China Center for International Exchange.Dorter, K. 00. The Concept of The Mean in Confucius and Plato. Jour-
nal of Chinese Philosophy. 9(): 17–.Jiang, X. 011. Selecting the right Chinese students. The Chronicle of
Higher Education. Available at: <http://chronicle.com/article/Select-ing-the-Right-Chinese/191/>.
Hagedorn, L. S., and J. Hu. In press. Earning American college credits in China: New model of transfer college credit programs. Journal of In-terdisciplinary Studies in Education.
Hagedorn, L. S., and Y. Zhang. 01. Applying to U.S. institutions: The Chinese student dilemma. International Briefs for Higher Education Leaders. 01(1): 0–.
IBO. See International Baccalaureate Organization.Inside Higher Ed. 01. Questions in China on value of foreign degrees.
Available at: <www.insidehighered.com/quicktakes/01/01/0/questions-china-value-foreign-degrees>.
Institute of International Education. 01. Open Doors 2012: International Students in the United States. Washington, D.C.: IIE.
———. 01. Open Doors 2013: International Students in the United States. Washington, D.C.: IIE.
International Baccalaureate Organization. 01a. Four Programmes at a Glance. Available at: <www.ibo.org/programmes>.
———. 01b. Professional Development. Available at: <www.ibo.org/programmes/pd/>.
———. 01c. IB World School Statistics. Retrieved January 01 from: <www.ibo.org/facts/schoolstats/>.
———. 01d. Information for China. Available at: <www.ibo.org/coun-try/CN/>.
Kwok, Y. 01. Codes of ethics for overseas education agents. The New York Times. Available at: <www.nytimes.com/01/0/07/world/europe/07iht-educside07.html>.
Ma, J. 01. College apps cheating scandal is a learning moment for China. Forbes. Available at: <www.forbes.com/sites/jasonma/01/0/1/how-to-stop-chinese-kids-from-cheating-on-college-apps/>.
ACT Education Solutions. 008. New GAC centers opening in China. Available at: <www.actinternationalservices.com/en/news/index.html?p=197>.
Ruse, M. 010. Too Asian? The Chronicle of Higher Education. Decem-ber 19. Available at: <http://chronicle.com/blogs/brainstorm/too-asian/018>.
Souhu Education Online. 01. 深圳至少四千高三生出国留学,不挤高考“独木桥”. Available at: <http://goabroad.sohu.com/0100/n809.shtml>.
Winn, P. 01. Elite Asian students cheat like mad on U.S. college ap-plications. Globalpost. January . Available at: <www.globalpost.com/dispatch/news/regions/asia-pacific/thailand/1010/US-college-ap-plication-fraud-asia-elite-economy-china>.
Zhang, Y., and L. S. Hagedorn. 011. College application with or without assistance of an education agent: Experience of international Chinese undergraduates in the U.S. Journal of College Admission. 1: –1.
Zhang, Y. 011. The Use of Agents in Applying to the U.S. Higher Educa-tion: Experience of Chinese Undergraduate Students. Iowa State Uni-versity. Doctoral Dissertation.
About the Authors
LINDA SERRA HAGEDORN, PH.D. , is Associate Dean of Undergraduate Programs, International Programs, and Student Services and Professor in the School of Education at Iowa State University.
JIAYI HU is a doctoral student in the School of Education at Iowa State University.

forumBook Reviews
College & University | 83
PAYING FOR THE PARTY: HOW COLLEGE MAINTAINS INEQUALITY
ARMSTRONG, E. A., AND L. T. HAMILTON. 2013. PAYING FOR THE PARTY: HOW COLLEGE MAINTAINS INEQUALITY. CAMBRIDGE: HARVARD UNIVER-SITY PRESS. 326 PP.
Reviewed by Matthew Fifolt
In Paying for the Party, authors Armstrong and Hamilton depict “the growing mismatch between what public in-stitutions provide and what students in higher education need” (xiii) by describing a social environment and aca-demic infrastructure that “systematically disadvantage” all but the most affluent students (). Through descriptive ac-counts of student experiences, Armstrong and Hamilton demonstrate how college transitions and class trajectories seem to diverge according to social upbringing, family re-sources, and embedded privilege. The authors note that in the college setting, even the smallest class differences are magnified, and these differences can either foster or inhibit success.
The research that informs Paying for the Party is a lon-gitudinal, ethnographic case study at a flagship public university in the midwest United States. Armstrong and Hamilton and their team of graduate and undergraduate researchers spent a year observing and interacting with the female residents of one floor of a reputed “party dorm” at
“Midwest University” (MU) in order to develop a deep un-derstanding of the lives of these students. After their initial year of onsite engagement, Armstrong and Hamilton con-ducted a series of five annual interviews with the students to follow their academic and career trajectories through the university system and one year post-graduation.
To frame the discussion and illustrate students’ prog-ress through the university, the authors created a table and theoretical model based on their findings. The items and interactions that comprise the table and model include: (a) class projects (individual agendas); (b) college path-ways (social and academic structures of the institution); (c) organizational imperatives (institutional needs); (d) class background; (e) orientation to college; (f ) college experiences; and (g) class trajectories beyond college. The authors assert that, despite the illusion of choice, “at most schools there is an elaborate process of sorting that moves people onto distinct pathways” (). Armstrong and Hamilton identify three distinct pathways that students tend to follow: the party pathway, the mobility pathway, and the professional pathway.
In describing class differences, the authors observe that “more affluent students approach college primed to ‘meet people’ and see the expansion of social networks as a central part of college” (p. ). Conversely, they report that many
College & University | 84
working class students, especially individuals from small or rural towns, find college to be an isolating experience, and leaving home results in “potentially severing deep and meaningful ties to their communities” (p. ). The authors observe that these differences in orientation are amplified in the college setting. Further, the disparity in financial and other class-based resources seems to have a cumulative, multiplier effect—positive and negative—over time.
To illustrate institutional dynamics and power, Arm-strong and Hamilton provide compelling evidence that the Greek system at MU wields significant influence in campus life. Although only 17 percent of the undergradu-ate student body are members of the Greek system, the prominence of fraternities and sororities has come to de-fine MU as an institution that places greater value on the social than on the academic aspects of college life.
For many of the women in this study, an inextricable feature of the Greek system—and, therefore, access to the party pathway—was sorority rush, a highly competitive process of sorting and screening. Armstrong and Hamil-ton note that sororities recruit women based on innocu-ous attributes such as “personality” and “fit”; however, these terms and other actions clearly signal to prospective new members their standing among their peers.
Further, sorority rush, while designed to avoid outward discrimination, tends to exclude individuals who deviate from the “norm”—namely “nonwhite students, those not born in the United States, older students, those with chil-dren, lesbians, others with unconventional gender styles, or individuals with disabilities” (p. 78). Finally, the au-thors suggest that significant membership fees and other expenses reinforce the status quo by excluding students who are economically disadvantaged or who lack the sup-port system necessary to maintain a certain lifestyle.
According to Armstrong and Hamilton, “[t]he sorority recruitment process…sorted almost perfectly along class lines” (p. 97) for the women who lived on this specific floor of the party dorm. Further, the authors observed that the more involved some individuals (mostly socially ambi-tious women) became with the process of sorority rush, the less visible others (usually more isolated students) ap-peared on the floor. The authors describe a system in which “dominants” seem to absorb energy from “subordinates” and the social dynamics of the floor dictate who is worthy of attention and who is not. Consistent with the litera-
ture on student attrition, social isolation led several of the women to experience problems with depression, drug and alcohol abuse, and academic disengagement, which often resulted in the students either transferring or leaving the university prior to graduation (Astin 198, 1999; Bean and Eaton 000; Tinto 1987, 199).
SOCIALITES
Study participants from upper- to upper–middle class backgrounds understood the language and customs of so-rority rush and therefore transitioned seamlessly into the Greek system. Bolstered by significant financial resources, these “socialites” enjoyed the benefits of the full college ex-perience and graduated on time with passable grades. Using networking and personal connections, socialites secured the most prestigious internships and entry-level positions, many of which were heavily subsidized by family wealth.
WANNABES
A second category of students, “wannabes,” also followed the party pathway at MU. However, unlike their well-heeled peers, the wannabes had no financial safety net upon grad-uation and quickly realized that the lifestyle they had en-joyed in college was unsustainable. While socialites’ futures seemed unaffected by GPA and major, wannabes experi-enced rejection and setbacks due to the downgraded ma-jors and modified career goals they established in order to maintain the party lifestyle. The authors reiterate that “the party pathway was a viable route to success for only a small, highly affluent segment of the MU population” (p. 17).
STRIVERS
The authors identify a third category of women as “striv-ers”: individuals from working- and lower–middle class backgrounds who relied heavily on part-time jobs and loans to make ends meet. Of this group, only one was selected by the university to participate in an academic enrichment program designed for students from disad-vantaged backgrounds. The program provided grants and other financial assistance in order to allow students to minimize their work hours and concentrate on their aca-demics. Armstrong and Hamilton note that this program served only a limited number of students, raising impor-tant questions about how institutional resources were al-located in support of student success.

College & University | 85
In addition to the need to work, strivers confronted a number of other challenges, including poor academic preparation, few social connections away from home, lack of exposure to or experience with diverse individuals (e.g., those of different religious backgrounds or sexual orienta-tion), and the need to gain immediate stability through early identification of financially secure mates. Within this group of students, the authors identify two distinct types of strivers: stayers and leavers.
Stayers. The authors determined that the stayers—those who remained at MU to finish their degrees—were, ironically, the least successful strivers because it often took them more than the typical four years to complete their chosen degrees, and the academic majors they selected of-ten were impractical given their actual interests. Moreover, stayers accumulated significant debt in their attempts to complete an academic degree.
Leavers. Leavers, on the other hand, fared far better than stayers—especially among those who transferred to less prestigious, regional campuses. In this new environ-ment, leavers were surrounded by individuals more like themselves and with whom they could more closely relate in terms of responsibilities and priorities. Transferring out of MU facilitated leavers’ selecting more pragmatic degrees and incurring fewer expenses.
ACHIEVERS
The authors define the final category of students as “achievers.” These students were generally less affluent than socialites but more affluent than strivers and were fiercely competitive for a limited number of top spots in the professional pathway. Achievers were primed for suc-cess; they were involved in relevant extracurricular ac-tivities, maintained strong GPAs, and had clearly aligned career goals and academic pursuits. Achievers worked to minimize distractions from their goal of degree comple-tion—even within the party school environment.
Underachievers. Conversely, underachievers failed to realize their professional pursuits upon graduation de-spite their earned academic credentials and ambition. Ac-cording to Armstrong and Hamilton, “the most common problem for underachievers was a never-resolved mis-match between their aspirations and their preferences and abilities” (p. 18). While success for this group of students was not necessarily dependent upon class, the authors note
that the more successful achievers in the study tended to have relationships with their parents that were marked by trust and open communication. Achievers’ realization of self-sufficiency upon graduation was heavily influenced by parental resources. Underachievers’ trajectories, however, were more frequently interrupted by divorce, remarriage, illness, and other significant life events.
IMPLICATIONS
College and university administrators could benefit from reflecting on the research findings reported in Paying for the Party: they provide compelling insight into the ways in which organizational infrastructures can dramatically influence how students experience college. These findings may be especially important for administrators consider-ing how best to meet the needs of students who “aspire to improve their circumstances” (p. ) but leave the uni-versity setting with significant debt and without an aca-demic degree. Debunking the myth that college is a class equalizer, Armstrong and Hamilton note that “the overall social organization of undergraduate life at MU mapped onto preexisting differences among the students and reproduced them” (p. 9). In this way, university infra-structures tended to reinforce class differences, if uninten-tionally and unknowingly.
As state funding has decreased, mid-tier, public institu-tions have relied increasingly on the tuition paid by afflu-ent, out-of-state students whose social skills are stronger than their academic backgrounds. Therefore, despite their suggestions for mitigating the problems associated with each of the pathways, Armstrong and Hamilton recognize that reforms likely would be opposed by influential con-stituents and thus would prove difficult to implement.
Institutions are investing tremendous financial re-sources in social aspects of college rather than academic instruction. This is occurring to the detriment of in-state students and their families, who are receiving a conse-quently lower-quality education and reaping only limited career options. Armstrong and Hamilton express the hope that institutional priorities will change. However, their re-search suggests that public higher education institutions will grow increasingly vulnerable as the stratification of social classes becomes more pronounced.
The authors develop a general theoretical model assum-ing that students’ college experiences and post-graduation

College & University | 86
success may be shaped substantially by the fit between in-dividual characteristics (e.g., financial wealth, orientation to college) and organizational characteristics (e.g., institu-tional structures, pathways). The authors provide ample evidence to support this assertion. However, whether these data merit the development of a theoretical model remains to be seen.
In my opinion, while the authors make a notable con-tribution to the related literature and knowledge base re-garding the lived experiences of university women, they may have over-reached by calling their conclusions a theo-retical model. The development of a theoretical model is premature and misaligned with the qualitative tradition of inquiry employed by the researchers (i.e., ethnogra-phy). The authors may have come to a more appropriate conclusion by providing a provisional theoretical model and recommending that the model be refined through the qualitative tradition of grounded theory. This approach would allow future researchers to test the relevance of the model through “constant comparison of data with emerg-ing themes and theoretical sampling of different groups to maximize the similarities and the differences of informa-tion” (Creswell 00, p. 1).
To their credit, however, Armstrong and Hamilton acknowledge that the model is limited to one set of data within one institutional context. They invite others to “extend and revise” (p. 7) the model by applying it to dif-ferent students at multiple institutional types. These rec-ommendations would have been more effectively situated nearer the end rather than the beginning of the book. By using the model as their lead, the authors suggest that their proposed theory is the singular lens through which readers should interpret the data and their interconnect-edness. These differences in qualitative approach to theory generation may seem relatively minor to some readers, but I contend that the authors’ use of ill-fitting methodologies and overstatement of the theory development may under-mine their presentation of evidence and the credibility of their findings. Such practices cast a shadow on what is, otherwise, a compelling and important investigation.
REFERENCESAstin, A. W. 198, 1999. Student involvement: A developmental theory
for higher education. Journal of College Student Development. 0(): 18–9.
Bean, J. P., and S. B. Eaton. 000. The psychology underlying successful retention practices. Journal of College Student Retention. (1): 7–89.
Creswell, J. W. 00. Research Design: Qualitative, Quantitative, and Mixed Methods Approaches, 2nd Edition. Thousand Oaks, CA: SAGE.
Tinto, V. 1987, 199. Leaving College: Rethinking the Causes and Cures of Student Attrition. Chicago: University of Chicago Press.
About the Author
MATTHEW FIFOLT, PH.D. , is Associate Director of the Evaluation and Assessment Unit at the University of Alabama at Birmingham.
THE COLLEGE FEAR FACTOR: HOW STUDENTS AND PROFESSORS MISUNDERSTAND ONE ANOTHER
COX, R. D. 2009. THE COLLEGE FEAR FACTOR: HOW STUDENTS AND PRO-FESSORS MISUNDERSTAND ONE ANOTHER. CAMBRIDGE, MA: HARVARD UNIVERSITY PRESS. 198 PP.
Reviewed by Matthew Fifolt
In her recent investigation of postsecondary education, Cox focuses her attention on the least selective and least presti-gious colleges in the country: community colleges. Com-munity colleges enroll approximately half of today’s college students and are the fastest-growing segment of higher edu-cation; yet their contributions frequently are overshadowed by those of four-year institutions. Community colleges have been largely understudied and poorly understood.
For many students, attending a community college is a cost-efficient option for accessing higher education. How-ever, there remains a “persistent gap between the faculty understanding of college-level coursework and the kind of work that students are prepared to do” (p. 9). The author notes that “being unprepared to meet certain expectations is not the same as being unable to meet them” (p. 11) but acknowledges that traditional structures and norms of higher education can impede access and opportunity.
Drawing upon instructor feedback and interview data from approximately 10 students who participated in four previous research studies, Cox utilizes an inside-out model of exploration to examine: (a) student goals, expectations, and orientation to college; (b) interactions between pro-fessors and students inside the classroom; and (c) academic literacy across classrooms. By examining student assump-tions, Cox suggests that students and faculty members could better understand one another and thereby close the expectations gap that currently separates them.

College & University | 87
FEAR AND ANXIETYAcross demographic characteristics (i.e., age, ethnicity, academic background, educational goals, path to college), students in this investigation expressed a tremendous amount of fear and anxiety about their educational trajec-tories and their ability to succeed in college. Frequently, student fears stemmed from past experiences of failure in school, which students viewed as “objective evidence of their academic inadequacy” (p. ). Their self-doubts were heightened because students recognized that com-munity college was the least discriminating level of higher education. Cox notes, “For fearful students, every interac-tion in the classroom and with their professors outside of class holds the potential to confirm their feelings of inad-equacy” (p. 1).
Cox states that, ironically, the fear of failure was so para-lyzing for some students that it became the source of their own undoing. In order to avoid the possibility of failure, students engaged in “passive strategies of disengagement” (p. 0) and self-defeating behaviors (e.g., not participating in class, avoiding certain exams, dropping classes before grades were posted).
Cox indicates that students were inclined to attribute feelings of confusion and making mistakes to their own academic deficiencies rather than to the sometimes dif-ficult process of learning new skills or information. Yet Piaget and others describe the process of resolving dis-crepancies between old and new knowledge as the way in which learning occurs (Kelehear and Heid 00). For students who were able to overcome their fears, academic performance often exceeded their own initial expectations and thereby provided evidence that they could, in fact, succeed in the classroom.
FINANCIAL MOTIVATION
With few exceptions, students identified their primary motivation for attending college as economic. Students sought greater occupational prospects and increased fi-nancial stability and therefore viewed college attendance as an investment in their future earning potential. Accord-ing to Cox, students were constantly engaged in a process of weighing short-term loss (opportunity costs) with the potential for long-term gain (greater stability, higher wages). These financial considerations often dictated whether and when students could attend college as well
as “how long to attend, what kind of degree to obtain, and how to earn a degree most efficiently” (p. 9).
Students who employed this cost-benefit analysis ap-proach to college frequently scaled back their academic goals in favor of educational credentials that potentially could provide more immediate financial benefits. Further, students assessed the value of courses on the courses’ abil-ity to contribute toward their immediate needs; students perceived courses not directly related to their career goals as a waste of both time and money.
STUDENT UNDERSTANDING OF LEARNING
Over the course of a semester, student attitudes toward their classes most frequently shifted from positive to nega-tive. Cox writes, “I found myself surprised by the extent of disappointment that students express and the frequency with which students moved from initial optimism to dis-illusionment” (p. 78). The ultimate pragmatists, students exerted more effort if they perceived a course to be worth-while or of practical value to their career aspirations. On the other hand, if students deemed the course objectives to be irrelevant, they would do the minimum required to pass. Cox observes that this “just get it over with” attitude “manifests itself in minimal effort, disengagement, and, most likely minimal learning” (p. 77).
According to Cox, “students’ understanding of what is worth learning—as well as how one goes about learning…is often incompatible with faculty members’ expectations of college students” (p. 8). She notes that community col-lege students’ ideas about what they should be learning are “not necessarily congruent with their professors’ assump-tions” (p. 8). These mismatched expectations frequently led to feelings of frustration and miscommunication and ultimately undermined the learning environment.
STUDENT AND FACULTY INTERACTIONS
Researchers have demonstrated the limitations of the teach-ing-as-telling (i.e., lecture) style of instruction (Prosser and Trigwell 1999, Ramsden 199), yet it continues to be the predominant method of instruction at the postsecondary level. Consequently, the lecture style of teaching persis-tently shapes the expectations of postsecondary students and faculty regarding the classroom experience.
In accordance with historical notions of the professor as the authority, students in this investigation expected

College & University | 88
instructors to “profess” their knowledge through tradi-tional classroom-style lectures; they viewed alternative methods (e.g., discussion, peer review) as “unworthy of college-level instruction” (p. 11). In other words, students equated the absence of a lecture with the absence of in-struction.
Students described “good instruction” as professors’ presenting their subject-matter expertise (which students would be expected to parrot), maintaining an orderly classroom, and controlling student participation. In turn, the students’ role was “to accept and passively consume” (p. 97). According to Cox, problems in the classroom cannot be attributed to “inadequate teaching techniques, unprepared students, or weak course content” (p. 11). Rather, student anger and frustration with active learning and engagement activities are rooted in their deeply held beliefs about what college-level instruction should entail.
BRIDGING THE GAP
According to Cox, faculty members who are able to di-vorce themselves from the lecture-style format and achieve learning outcomes exhibited specific characteristics, in-cluding an ability to demonstrate subject-matter mastery and explain concepts in sufficient detail for students to understand; a focus on interpersonal relationships; and expectations that students will perform rigorous academic work. One student described such an instructor as being “highly educated but much less threatening than a typical professor” (p. 10).
Perceived by students as content experts, such instruc-tors also were “engaged in strategies aimed at alleviating students’ anxieties and provided students with constant encouragement” (p. 17). For example, instructors en-couraged students to “participate in low-stakes writing ex-ercises during class sessions” so they could provide positive feedback and gauge students’ writing skills prior to grad-ing their first assigned essay (p. 18). Students responded well to such informal writing assignments because they counted toward the overall grade in the course (as partici-pation) but were not assigned a specific grade.
These observations are consistent with Lang’s (01) recommendations that students should be given multiple opportunities to demonstrate learning and to develop competencies through low-stakes assessments and in-class activities. Cox notes that short writing assignments pro-
vide opportunities for instructors and students to build rapport with one another and to address issues in such a way that students do not feel “belittled, overwhelmed, and demoralized” by instructor feedback (p. 1). She concludes that for students—particularly those with the greatest fears—success “depended on and consisted of gaining confidence” in their ability to succeed in college (p. 1).
BEYOND THE CLASSROOM
Cox suggests that community colleges could do more to introduce students to the expectations and culture of higher education. She notes that academic culture is based on “particular habits of thinking, acting, speaking, and writing that are often incomprehensible and alienating to people outside academia” (p. 10). Additionally, many students encounter difficulties in moving away from the strategies that helped them in high school (e.g., memoriza-tion, rote learning) and toward those that professors ex-pect college students to utilize, such as applying concepts to new situations (i.e., critical thinking).
Cox further notes that, in general, institutions focus more attention on “regulating students’ entrances and exits” (p. 1) than on investigating root causes of stu-dents’ struggles in the classroom. Institutional strategies for improvement include “(a) changing the entry-level assessment tool, (b) adjusting the cutoff scores for place-ment in remedial courses, and (c) developing exit tests for writing courses” (p. 1). Cox suggests, however, that these adjustments are only exercises in maintaining standards and thereby filter out students who do not meet the stan-dards. She advocates for reframing the situation to assess the extent to which courses address actual student needs; reviewing classroom practices that promote student suc-cess; and conducting a comprehensive audit to better un-derstand the reasons for student withdrawal and failure.
Finally, Cox notes that “tweaking the curriculum has allowed colleges both to attend to college instruction in a symbolic way and to negotiate compromises among in-terested stakeholders, all without addressing what really happens inside college classrooms” (p. 18). In essence, to truly address student learning, educators must adopt a more sophisticated vision of teaching and learning. This new vision would supplant the classical notion of the professional model in which classroom environments are

aacr
aoed
ge.a
acra
o.or
gA
me
ric
An
As
so
ciA
tio
n o
f c
oll
eg
iAte
re
gis
trA
rs
An
d A
dm
iss
ion
s o
ffic
er
sVisit http://aacraoedge.aacrao.org to subscribe,or emAil questions to [email protected].
We’ve Been Busy Researching theWorld’s Education Systems …So You Don’t Have To!
AAcrAo ElEctronic DatabasE for Global EDucation
In an increasingly globalized higher ed market, credential evaluators need ways to assess multinational applicants quickly and accurately. That’s why we created AACRAO EDGE—home to the most comprehensive collection of data on worldwide postsecondary education systems available on the Web today.
EDGE, an annual subscription service, presents up-to-date profiles of more than 200 education systems across the globe and covers the educational backgrounds of nearly
every type of international student entering U.S. schools. Maintained by AACRAO’s team of experts, the profiles feature:
* historical overviews * education ladder(s) * grading system(s) * sample credentials * placement recommendations * lists of postsecondary institutions
Simplify your evaluation process and start your AACRAO EDGE subscription today!
TM
EDGE_fpb_2011_FIN.indd 2 5/25/12 5:42 PM

College & University | 90
designed specifically for lecture-style courses and faculty members are rewarded for “professing” with a relational model in which faculty members are encouraged to de-velop a rich understanding of student expectations and preconceptions about college in order to apply pedagogi-cal strategies that more effectively meet students’ ever-growing learning needs.
SUMMARY
The College Fear Factor may be especially relevant for fac-ulty members and community college administrators who are interested in developing a deeper understanding of community college student behaviors and decision-mak-ing processes. Cox provides a nuanced perspective regard-ing student perceptions of faculty, noting a distinction between “excellent professors” and “professors who relate.” Accordingly, “excellent professors” focus on subject-mat-ter expertise whereas “professors who relate” demonstrate subject-matter expertise but focus on interpersonal rela-tions. Cox proposes that “professors who relate” are better able to “come down to students’ level” and at the same time command respect and maintain high levels of academic rigor (p. 118), all of which match student expectations.
Cox provides rich, descriptive details about student challenges and successes in the community college setting. She utilizes sound qualitative research techniques, includ-ing extensive interviewing and prolonged engagement in the field (Butler-Kisber 010). While not overgeneraliz-
ing her findings, Cox provides well-informed insights and observations that could easily be translated to other com-munity college settings and beyond.
Cox offers clear and compelling evidence of the ob-stacles that students in her sample faced, but she offers few potential remedies for institutions working to im-prove teaching and learning in the classroom or for those striving to more effectively align professors’ and students’ expectations for learning. Toward the end of the final chapter, however, Cox does discuss an emerging body of research on teaching that she refers to as the scholarship of teaching and learning. A more descriptive account of this research as well as a call to action may have made this thoughtful and provocative work even more effective.
REFERENCESButler-Kisber, L. 010. Qualitative Inquiry: Thematic, Narrative and Arts-
informed Perspectives. Thousand Oaks, CA: Sage.Kelehear, Z., and K. A. Heid. 00. Mentoring in the art classroom. Stud-
ies in Art Education. (1): 7–78.Lang, J. M. 01. Cheating Lessons: Learning from Academic Dishonesty.
Cambridge, MA: Harvard University Press.Prosser, M, and K. Trigwell. 1999. Understanding Learning and Teaching.
The Experience in Higher Education. Buckingham: Open University Press.
Ramsden, P. 199. Learning to Teach in Higher Education. New York: Routledge.
About the Author
MATTHEW FIFOLT, PH.D. , is Associate Director of the Evaluation and Assessment Unit at the University of Alabama at Birmingham.

To fi nd or post a job, visit
jobs.aacrao.org or
e-mail us at [email protected]
A M E R I C A N A SS O C I AT I O N O F CO L L EG I AT E R EG I S T R A R S A N D A D M I SS I O N S O F F I C E R S
AACRAO Jobs Online is
the only employment
site specialized for
admissions, enrollment
management,
student service and
other higher education
administration professionals.
Jobs Online
jobs.aacrao.org

Amer
ican
Ass
ocia
tion
of C
olle
giat
e Re
gist
rars
and
Adm
issi
ons
Offic
ers
One
Dupo
nt C
ircle
, NW
, Sui
te 5
20W
ashi
ngto
n, D
C 20
036–
1135
C&U
CO
LLEG
E an
d UN
IVER
SITY
Educ
atin
g th
e M
oder
n H
ighe
r Ed
ucat
ion
Adm
inis
trat
ion
Prof
essi
onal