american caresource holdings
TRANSCRIPT

American CareSource Holdings, Inc.
Investor Presentation
March 2016

Safe Harbor Statement
2
Any statements that are not historical facts contained in this presentation (including, but not limited to statements that contain words
such as “will,” “believes,” “plans,” “anticipates,” “expects,” and “estimates”), including with respect to the Company’s plans, objectives
and expectations for future operations, projections of the Company’s future operating results or financial condition, and expectations regarding the healthcare
industry and economic conditions, are forward-looking statements. Substantial risks and uncertainties could cause actual results or future events to differ
materially from those indicated by such forward-looking statements, including, but not limited to, our ability to attract and maintain patients, clients and
providers and achieve our financial results; our ability to raise additional capital to meet our liquidity needs; changes in national healthcare policy, federal and state
regulation, including without limitation the impact of the Patient Protection and Affordable Care Act, the Health Care and Educational Affordability Reconciliation Act
and medical loss ratio regulations; our intent to consummate the Medac Asset Acquisition; our ability to complete the disposition of our ancillary network business
to HealthSmart; general economic conditions, including economic downturns and increases in unemployment; our ability to successfully implement our growth
strategy for the urgent and primary care business; our ability to identify, acquire and integrate target urgent and primary care centers; increased competition in the
urgent and primary care market; our ability to recruit and retain qualified physicians and other healthcare professionals; reduction in reimbursement rates from
governmental and commercial payors; lower than anticipated demand and other risk factors detailed from time to time in the Company’s filings with the Securities
and Exchange Commission (the “SEC”). Except as otherwise required by law, the Company undertakes no obligation to update or revise these forward-looking
statements to reflect events or circumstances after the date of this presentation.
Because this presentation is a summary, it does not contain all of the information you should consider before investing in our common stock. Before you invest, you
should carefully read the preliminary prospectus, the registration statement and any other documents incorporated by reference therein for more complete
information about us and this proposed public offering before investing in our common stock. You may obtain these documents free of charge by searching the SEC
online database (EDGAR) on the SEC web site at http://www.sec.gov.

Presenter
3
• Adam Winger – President & CEO − Past Interim CFO, VP of Acquisitions, and General Counsel − CPA, JD – KPMG & Baker, Donelson Law Firm − 6+ years in the urgent care industry − Over 25 urgent care transactions completed
Executive Summary
4
• Urgent Care Business
− Owner and operator of convenient, affordable, and comprehensive medical care centers
− Patient-centered care for busy families and employers − Retail approach to medical care − After hours, 7 days a week, 360 days a year, with no appointment − High-growth strategy in large, fragmented industry
Opportunity
5
• Publicly-traded, pure-play urgent care consolidator − Exiting legacy business
• Aggressive development and acquisition strategy planned − 51 centers by end of 2017
• Expansive, fragmented, and growing industry − ~ 9,000 urgent care centers in U.S. in 2013 − 71% of 2012 operators owned 1-2 centers
• Attractive arbitrage opportunity − $550K investment in new center can yield $3.2mil of enterprise value − Acquisition targets of small operators @ 4x-5x EBITDA multiples − Recent large operator purchase @multiples between 10x-15x EBITDA
• Committed Board and Investor Base

Model Clinic Profile
6
Model Clinic P&L
Net Revenue $ 1,403,000
Fixed Costs (salaries, wages and rent) (743,000)
Other Operating Expense (338,000)
EBITDA $ 323,000
Profit Margin 23%
• Key Assumptions − 33 patients per day − Clinic open 360 days per year − Net reimbursement rate of ~$118 per patient
Model
7
Year # of
Centers
Per-Center
EBITDA
Total
EBITDA
Corp
Overhead
Total
EBITDA
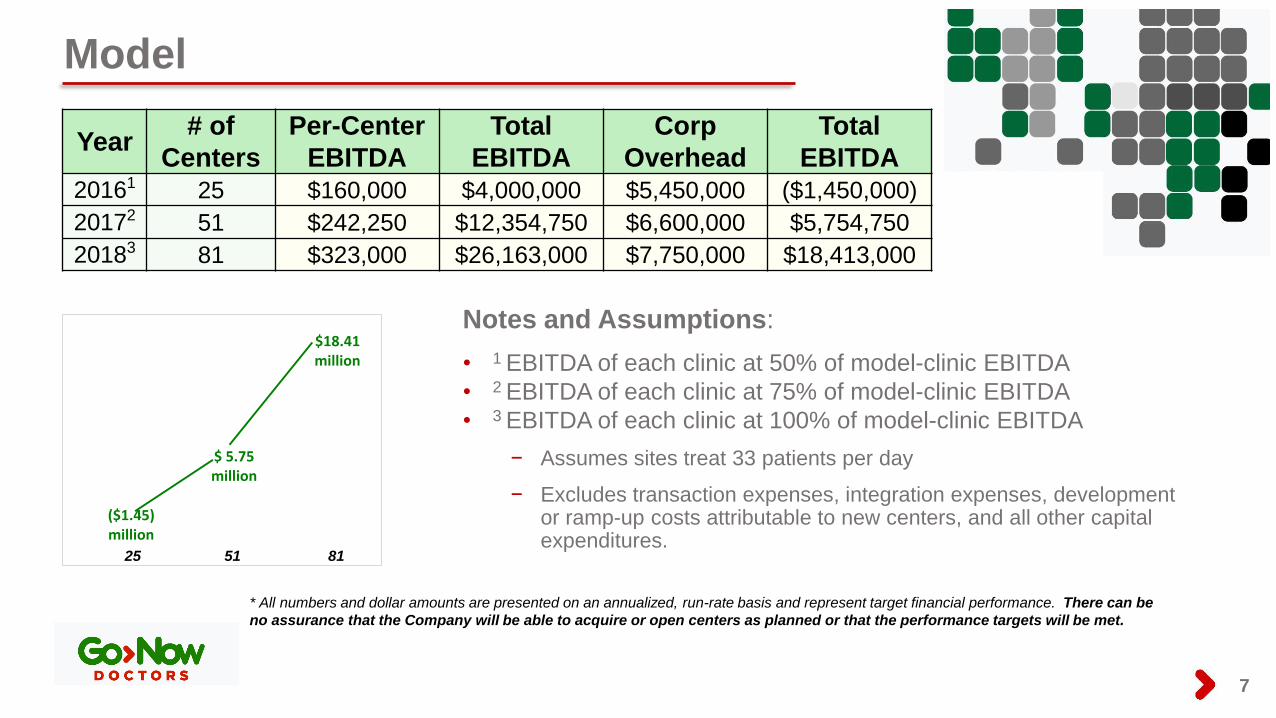
20161 25 $160,000 $4,000,000 $5,450,000 ($1,450,000)
20172 51 $242,250 $12,354,750 $6,600,000 $5,754,750
20183 81 $323,000 $26,163,000 $7,750,000 $18,413,000
($1.45) million
$ 5.75 million
$18.41million
Notes and Assumptions:
• 1 EBITDA of each clinic at 50% of model-clinic EBITDA
• 2 EBITDA of each clinic at 75% of model-clinic EBITDA
• 3 EBITDA of each clinic at 100% of model-clinic EBITDA
− Assumes sites treat 33 patients per day
− Excludes transaction expenses, integration expenses, development or ramp-up costs attributable to new centers, and all other capital expenditures.
* All numbers and dollar amounts are presented on an annualized, run-rate basis and represent target financial performance. There can be
no assurance that the Company will be able to acquire or open centers as planned or that the performance targets will be met.
25 51 81

Expansive, Fragmented & Growing Industry
8
− Over 9,000 centers in 2013, with approximately 12,000 centers projected by 2018
− In 2013, the four largest operators accounted for 1% of industry
revenue − In 2012, 71% of centers are owned by operators with two or fewer sites − Ripe for well-capitalized roll-up
Growth of the Urgent Care Sector
$7,188$8,014
$8,865$9,359
$10,096$11,143
$11,915 $12,287$13,012
$13,689$14,332
$15,149$15,996
$16,806$17,936
5,6875,989
6,5026,995
7,6088,066
8,3968,700
9,0229,428
9,89910,434
10,90311,350
11,714
3,000
4,000
5,000
6,000
7,000
8,000
9,000
10,000
11,000
12,000
$5,000
$7,000
$9,000
$11,000
$13,000
$15,000
$17,000
2003 2004 2005 2006 2007 2008 2009 2010 2011 2012 2013 2014 2015 2016 2017
Revenue ($mm) Sites
Revenue Sites
Compound Annual Growth Rate of Revenue 6.3% since 2003
Sources: Urgent Care Association of America; IBISWorld Industry Report 2013

Competitive Advantages
9
• Advantages Over the Emergency Room − Shorter wait times − More affordable − More conveniently located − Organizational focus on patient experience
• Advantages Over Traditional Primary Care − Immediate access – no appointment − Extended hours – open evenings, weekends, holidays − More conveniently located
Emergency Room Urgent Care
Total Time in Facility 4 hours 1 hour*
Gross Cost of Care $922 $215
*90% of patients wait less than 30 minutes to see a Physician

Our Locations
10
• Southeastern Focus
• 13 Convenient Locations − Alabama = 3 − Florida = 2 − Georgia = 2 − North Carolina = 4 − Virginia = 2
• Locally Clustered Clinics − Promotes staffing efficiencies − Marketing economies of scale − Developed through de novo expansion
Our Services & Customers
11
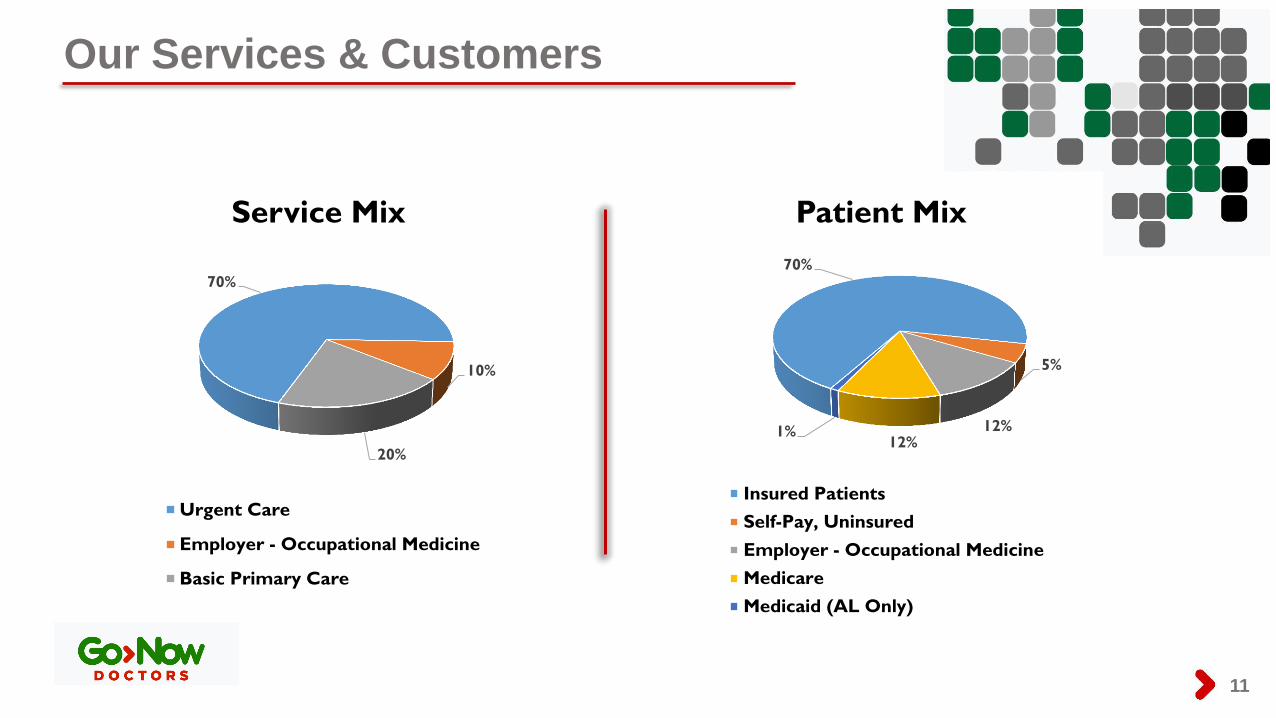
70%
10%
20%
Service Mix
Urgent Care
Employer - Occupational Medicine
Basic Primary Care
70%
5%
12% 12%
1%
Patient Mix
Insured Patients
Self-Pay, Uninsured
Employer - Occupational Medicine
Medicare
Medicaid (AL Only)
Growth Strategy
12
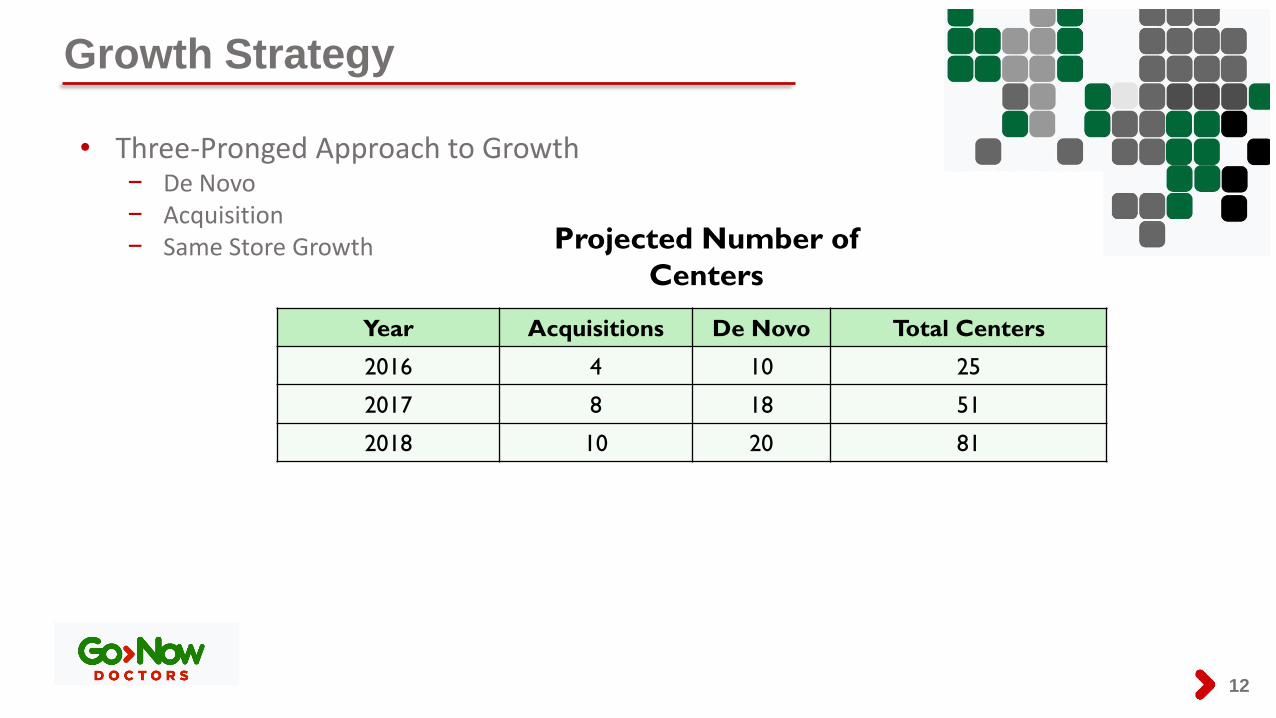
• Three-Pronged Approach to Growth − De Novo − Acquisition − Same Store Growth
Year Acquisitions De Novo Total Centers
2016 4 10 25
2017 8 18 51
2018 10 20 81
Projected Number of
Centers
De Novo Strategy
13
Target De Novo • Site Selection
− Complementary locations in existing markets − Access to extensive database of urgent care competitors − Numerous sites already under review
• Target Retail Space
− Free standing, build-to-suit construction − End cap strip mall location − High visibility, ease of access, high traffic counts − “Moms” pass the site multiple times per week
De Novo Strategy
14
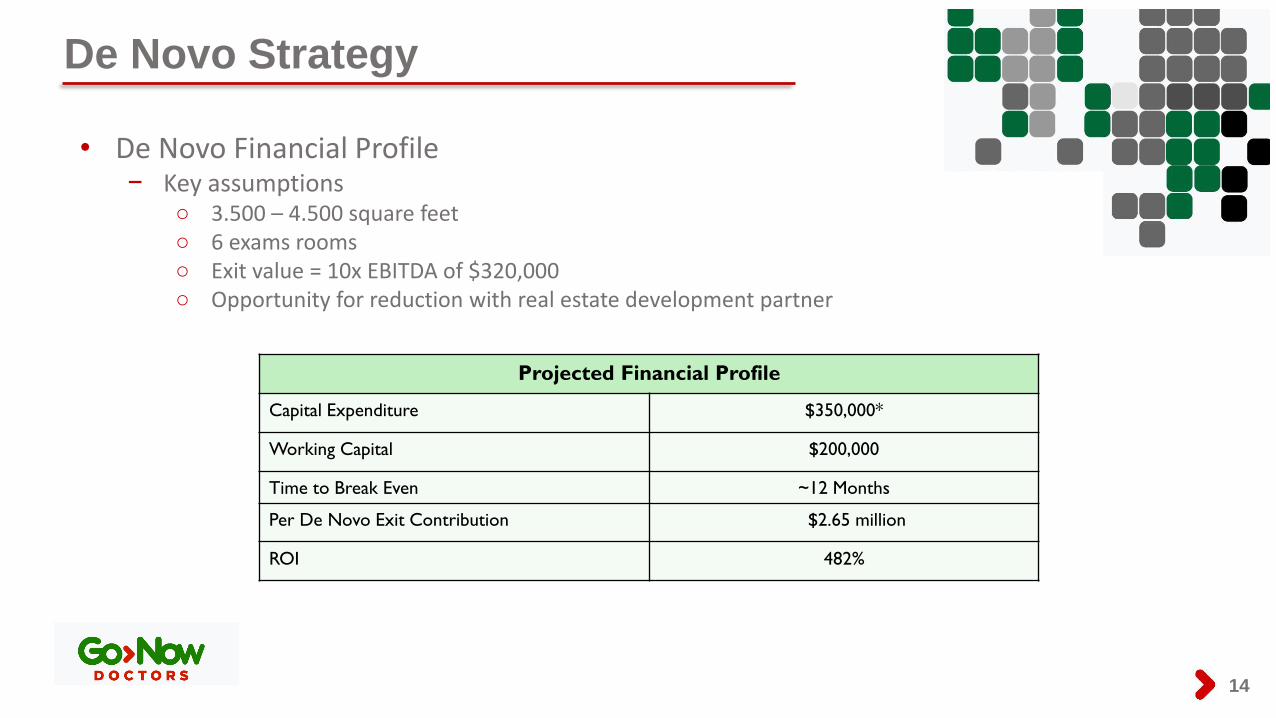
• De Novo Financial Profile − Key assumptions
○ 3.500 – 4.500 square feet ○ 6 exams rooms ○ Exit value = 10x EBITDA of $320,000 ○ Opportunity for reduction with real estate development partner
Projected Financial Profile
Capital Expenditure $350,000*
Working Capital $200,000
Time to Break Even ~12 Months
Per De Novo Exit Contribution $2.65 million
ROI 482%
Acquisition Strategy
15
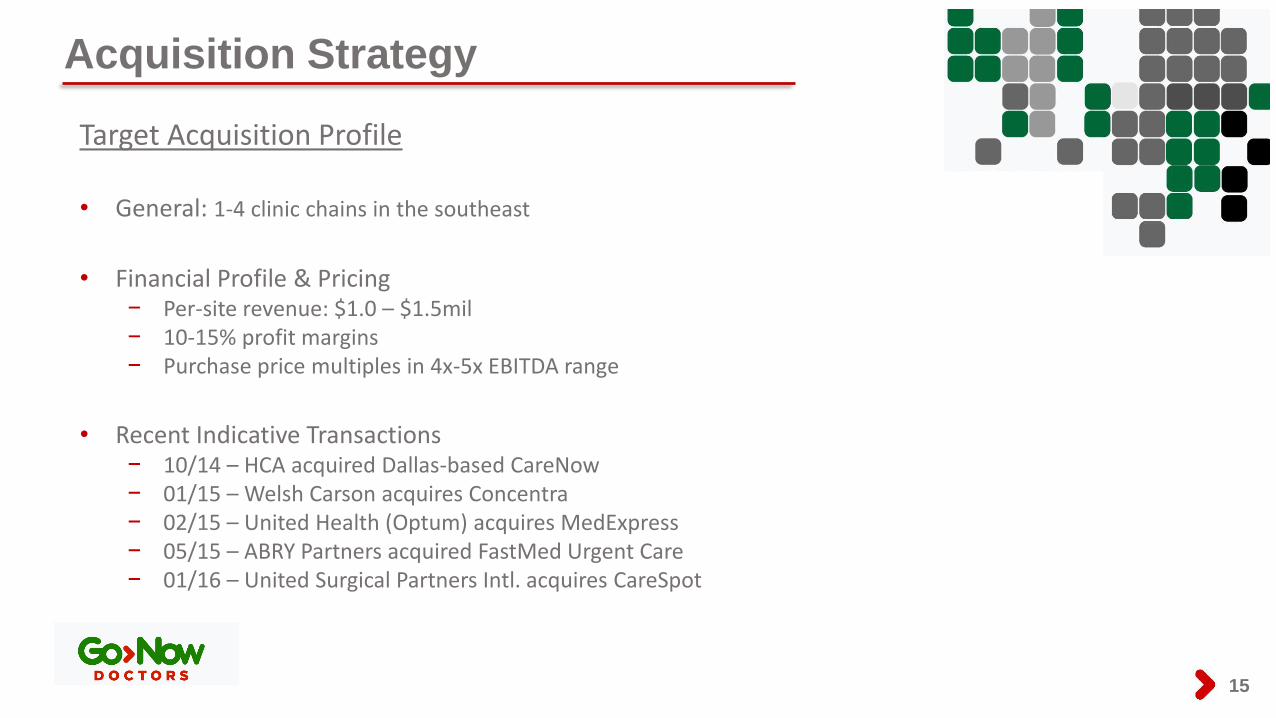
Target Acquisition Profile • General: 1-4 clinic chains in the southeast
• Financial Profile & Pricing
− Per-site revenue: $1.0 – $1.5mil − 10-15% profit margins − Purchase price multiples in 4x-5x EBITDA range
• Recent Indicative Transactions
− 10/14 – HCA acquired Dallas-based CareNow − 01/15 – Welsh Carson acquires Concentra − 02/15 – United Health (Optum) acquires MedExpress − 05/15 – ABRY Partners acquired FastMed Urgent Care − 01/16 – United Surgical Partners Intl. acquires CareSpot
Same Store Organic Growth
16
Same Store Organic Growth • Targeted marketing and advertising
• Broaden service offerings
• Increase insurance reimbursement • Improved physician recruitment
• Implement best practices across platform
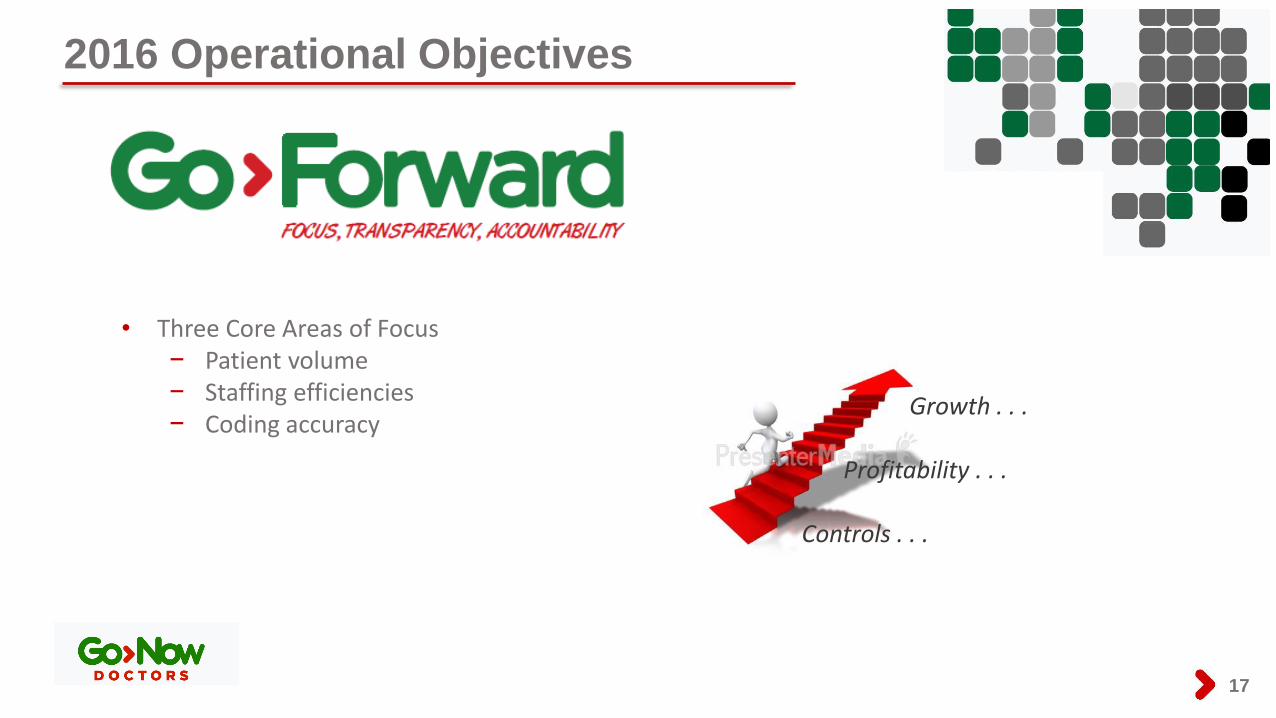
2016 Operational Objectives
17
• Three Core Areas of Focus − Patient volume − Staffing efficiencies − Coding accuracy
Growth . . . Profitability . . . Controls . . .
2016 Financial Goals
18
• $1.7 million clinic-level EBITDA • Over $2 million reduction in corporate overhead • Growth:
− De Novos: 8-10 centers − Acquisitions: 4-6 centers − Estimated capital need: $13-$15 million
• Break even on a run-rate basis by year-end

Selected Financials
19
All
data
in (
$000’s)
1 2015 figures presented on a pro forma basis, including the effects of the Medac Asset Acquisition.
2 The first and fourth quarters are typically our higher patient volume quarters as winter months see a higher occurrence of influenza, bronchitis, pneumonia and similar illnesses
3 Unaudited
1,107
2,325 2,672
2,354 2,225
1,980 2,063
3,303
-
500
1,000
1,500
2,000
2,500
3,000
3,500
4,000
4,500
5,000
5,500
6,000
09/30/2014 12/31/2014 03/31/2015 06/30/2015 9/30/2015
Urgent Care Net Revenues1,2,3
Medac GNOW
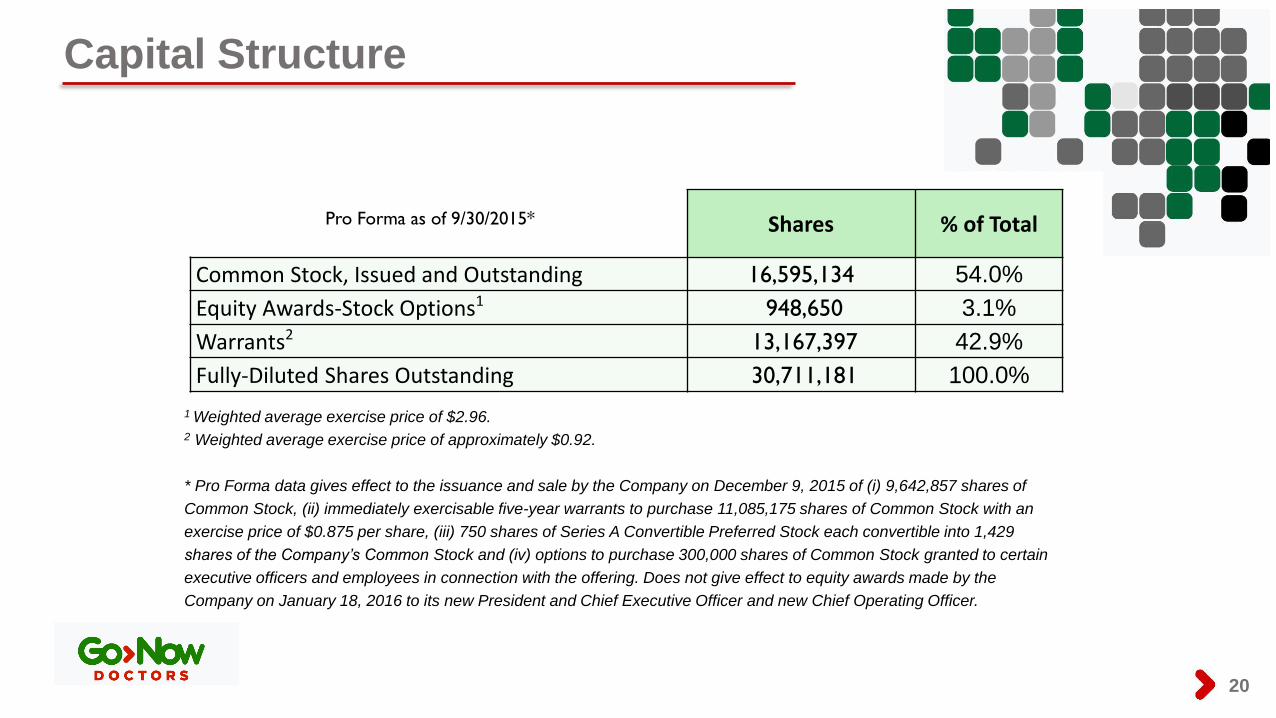
Pro Forma as of 9/30/2015*
Capital Structure
20
1 Weighted average exercise price of $2.96. 2 Weighted average exercise price of approximately $0.92.
* Pro Forma data gives effect to the issuance and sale by the Company on December 9, 2015 of (i) 9,642,857 shares of
Common Stock, (ii) immediately exercisable five-year warrants to purchase 11,085,175 shares of Common Stock with an
exercise price of $0.875 per share, (iii) 750 shares of Series A Convertible Preferred Stock each convertible into 1,429
shares of the Company’s Common Stock and (iv) options to purchase 300,000 shares of Common Stock granted to certain
executive officers and employees in connection with the offering. Does not give effect to equity awards made by the
Company on January 18, 2016 to its new President and Chief Executive Officer and new Chief Operating Officer.
Shares % of Total
Common Stock, Issued and Outstanding 16,595,134 54.0%
Equity Awards-Stock Options1 948,650 3.1%
Warrants2 13,167,397 42.9%
Fully-Diluted Shares Outstanding 30,711,181 100.0%
Summary
21
• Only publicly-traded, pure-play urgent care company
• Aggressive de novo and acquisition strategy
• Highly attractive arbitrage opportunity
• Experienced board and management team