american electric power 2019 eei esg/sustainability report for … · 2020-04-20 ·...
TRANSCRIPT

American Electric Power2019 EEI ESG/Sustainability
Report for Investors

ContentsIntroduction Innovating for a Clean Energy Future — Progress at a Glance 3
Section I: Qualitative Report — Governance, Risk Management & Strategy ESG Governance 4 Managing Risk 5 ESG/Sustainability Strategy 6 Additional Resources 10
Section II: Quantitative Report American Electric Power 11 Appalachian Power 15 Kentucky Power 19 Indiana Michigan Power 23 Public Service Company of Oklahoma 27 Southwestern Electric Power Company 31 Key & Notes 35 Appendix 36
Contacts 54
AEP 2019 EEI ESG/Sustainability Report 2

IntroductionToday’s age of technology, innovation and disruption is transforming the electric industry. As we transition to a clean energy future, AEP is modernizing the grid to
enable all resources and technologies, ensure universal access to reliable, secure power, reduce our environmental footprint, and support sustainable economic
growth for our communities. At American Electric Power (NYSE: AEP), we have a strong foundation for growth to achieve this, focused on operational excellence,
financial strength and workforce readiness.
For decades, we have engaged with and listened to many different stakeholders about their expectations of AEP for reducing carbon emissions. In 2018, we set new
carbon reduction goals – a 60 percent reduction by 2030 and 80 percent by 2050 – both from a 2000 baseline. In 2018, AEP’s CO2 emissions reached 59 percent
below 2000 levels. As a result, we are accelerating our 2030 goal to 70 percent below our 2000 baseline. We are also confident that we will exceed our 80 percent
target in 2050 and our aspiration is zero. We will continue to review these targets annually as public policies, regulations and advancing technologies change.
AEP envisions a future where beneficial electrification across industry sectors creates new opportunities for
growth, fewer carbon emissions economy-wide, greater transportation mobility, and a modern grid that enables
two-way flows of energy and data. Our generation, transmission and distribution investments directly affect
customers and shareholders, and must coexist with regulation and policy considerations, such as environmental
rules and affordability. As we move to a clean energy future, we are reshaping our asset base in a reliable and
affordable way for customers while managing the financial risk for shareholders and reducing our carbon footprint.
Innovating for a Clean Energy Future — Progress at a Glance
AEP has retired more than
8,600MWof coal-fueled generating
capacity since 2011
Approximately
11,900MWof renewable generation
interconnected across the U.S. via AEP’s transmission
system today
AEP has
5,272MWof renewable generation
(regulated & competitive)
59%reduction in CO2 emissions,
2000 — 2018
AEP’s energy efficiency programs saved more than
1M MWhin 2018 and avoided
more than 525,000 metric tons of CO2
AEP 2019 EEI ESG/Sustainability Report 3
AEP’s Carbon Emissions Reduction Goals
70% by 2030
80% by 2050(both from a 2000 baseline)

SECTION I: QUALITATIVE REPORT Governance, Risk Management & StrategyESG GovernanceThe integration of environmental, social and governance (ESG) performance with AEP’s policies and principles that govern our company reflects its importance
for our ability to create long-term value. Our commitment to effective and strong governance is strengthened by our belief in doing the right thing every time for our
customers, each other and our future. We believe good governance ensures transparency, fairness and accountability, and gives us a structured way to manage the
challenges of a changing society. Guided by our Principles of Business Conduct, we demand uncompromising integrity and the highest ethical standards. In addition
to a robust internal governance structure, AEP leverages its extensive stakeholder engagement process to seek the insights of our many stakeholders.
Sustainability governance at AEP is multi-layered and extends from the Board of Directors and senior management to an executive-level Enterprise Sustainability
Council and a dedicated Corporate Sustainability team. The Board’s Committee on Directors and Corporate Governance actively monitors AEP’s ESG performance.
This includes an annual review of AEP’s Corporate Accountability Report and issuance of a Board statement, supporting AEP’s commitment to sustainable business
development and performance accountability. In addition, the Lead Director of the Board conducts an annual
outreach to AEP’s largest institutional investors on important ESG matters, including climate risk and governance.
In addition to Board oversight, AEP’s Enterprise Sustainability Council (ESC), which represents all aspects of
AEP’s business, serves as strategic ambassadors, providing guidance and support to ensure the success of
AEP’s sustainable development strategy. They do this by enabling cross-functional integration of sustainability
across the enterprise. The ESC also provides a forum for sharing work, best practices, and identifying trends and
emerging issues that could affect AEP financially and/or operationally. The combined governance from the Board
of Directors and the ESC helps to ensure AEP’s disclosure undergoes a disciplined review and validation process.
Executive sponsors of the ESC include the Chairman, President & CEO; Executive Vice President, External
Affairs; and Executive Vice President, General Counsel & Corporate Secretary.
Environmental policies can have a significant impact on AEP’s strategy. The Board’s Committee on Directors
and Corporate Governance receives regular updates about AEP’s environmental performance, which includes
discussion about climate risk. In addition, the Board’s Policy Committee (which comprises the entire Board) invites
speakers to share varying viewpoints on a variety of topics. In 2019, the Board heard from an outside climate expert.
AEP 2019 EEI ESG/Sustainability Report 4
Executive Management
AEP Board of Directors
Enterprise Sustainability Council
Corporate Sustainability & Investor Relations
AEP’S ESG SUSTAINABILITY GOVERNANCE STRUCTURE

Stakeholders often ask us about climate risk and oversight, including the Board’s expertise in climate change. Through regular updates to the Board on AEP’s
environmental performance, which includes climate change, Board oversight is strong. Our directors are elected based on providing a diverse mix of viewpoints, skills
and experience relevant to managing a large corporation, including long-term changes in investment strategy, operations and technology, and all of our directors have
considerable expertise in these areas.
Managing RiskAEP’s Enterprise Risk & Resiliency team proactively identifies and mitigates risks in collaboration with business units and operating companies, including our
ability to respond to and recover from a disruptive event. Significant ESG issues, including climate change impacts, are identified, assessed, and mitigation plans
are developed through AEP’s Enterprise Risk Management process. In 2019, ESG, climate change and wildfires were formally identified as additional risks we are
monitoring. To the extent that significant risks exist, AEP will appropriately assess and mitigate these risks as it does other enterprise level risks.
AEP has received requests to conduct scenario analysis
consistent with international goals to limit global warming to
2 degrees Celsius (and potentially 1.5 degrees Celsius).
This is a complex process with many differing recommendations,
methodologies and tools. AEP has not conducted a 2-degree
scenario analysis because we believe the uncertainties —
from new and unknown technologies and other externalities
— are so significant they would render potential outcomes and
recommendations as misguided.
Changes in regulation, technology, economic growth, and
customer preferences have been present throughout AEP’s
history and will continue to provide uncertainty in business
planning and strategy. To explore different outcomes,
AEP does review and test planning assumptions through
the use of informative scenarios that encompass all relevant
factors that may influence our operations in the future,
including technology, public policy, regulation, market shifts and
customer preferences.
AEP 2019 EEI ESG/Sustainability Report 5
AEP’S RISK MANAGEMENT PROCESS

AEP’s 2018 “American Electric Power: Strategic Vision for a Clean Energy Future” report helps guide stakeholders on how we manage climate risk, but conversations
with investors and other stakeholders have identified additional opportunities for disclosure. For example, we are frequently asked about the alignment of AEP’s
ESG disclosure with other frameworks and standards, such as the Task Force for Financial-related Climate Disclosures (TCFD). In fact, AEP’s disclosure aligns with
the majority of TCFD’s recommendations. To make it easier for investors to see this linkage, we have mapped our disclosure to the TCFD framework and posted it on
our Investor Relations website.
In addition, we have made it easier for investors to find AEP’s ESG disclosure by posting all of our ESG-related reports on our Investor Relations website and our
sustainability website. In response to requests from several stakeholders, starting in 2019, AEP’s EEI ESG/Sustainability Report includes quantitative metrics at the
operating company level as well as the aggregate parent company data.
ESG/Sustainability StrategyAt AEP, our vision for a sustainable, clean energy future includes an “all of the above” strategy that combines fuel resources with transmission and distribution,
energy efficiency, advanced technologies, such as battery storage, and data analytics. At the center of this is our commitment to deliver an exceptional
customer experience and value to our shareholders.
As we advance our business model, our first
obligation is to serve customers with safe, reliable,
reasonably priced and increasingly cleaner electricity.
Our business strategy and resource plans reflect
a comprehensive and diverse approach to meeting
those needs cost-effectively and efficiently. Our
plan includes:
• Near-term investments in renewable energy within
and outside of our service territory
• Energy efficiency and savings through technology,
energy management and conservation programs —
on both sides of the customer meter
• Technology deployment
• Demand response programs
AEP 2019 EEI ESG/Sustainability Report 6

• Modernization of the grid to optimize all resources and technologies with significant investments in our transmission and distribution systems
• Increased integration of distributed resources, including community and large-scale renewables
• Increased use of low-carbon-emitting generation resources, such as natural gas
• Optimization of our existing generating fleet
• Advancement of our integrated resource plans with regulators
• Support for advancing low-carbon fossil technologies
In 2018, AEP set new carbon reduction goals for 2030 and 2050 (from a 2000 baseline). We have already made significant progress toward reducing our carbon
footprint and increasing the clean energy serving our customers. As a result, we are accelerating our 2030 goal to 70 percent from a 2000 baseline. In 2018, we
announced the closure of two coal-fueled facilities by the end of 2020 for economic reasons. A combination of factors gives us confidence in meeting these targets,
including an aging coal fleet, our growing investments in clean energy and the potential of new and emerging technologies that will make the power system more
efficient, more decentralized, fully integrated and digitized.
AEP 2019 EEI ESG/Sustainability Report 7

AEP 2019 EEI ESG/Sustainability Report 8
AEP’s 2019 acquisition of Sempra Renewables accelerated a planned investment of $2.2 billion between 2019 and 2023 in contracted renewables and expanded
our total renewable portfolio to 16 percent. On the regulated side, resource plans are projecting the addition of up to 3,766 MW of solar energy and 5,050 MW
of wind energy between 2020 and 2030. These capital investments provide universal access to clean energy for all customers while enhancing earning opportunities
for shareholders.

While climate change is often framed as a risk for electric utilities, there are also many opportunities. Electrification is one example that is more cost-effective and
achieves the significant carbon emission reductions customers, investors and society are seeking.
Electric transportation presents the biggest opportunity for electrification. Today, transportation is the largest contributor to carbon emissions in the U.S. — surpassing
the electric power sector. AEP is advocating for electric vehicle (EV) adoption as well as electrification of other end-use technologies in industry and buildings.
Through workplace charging programs, fleet conversion efforts, EV tariffs, and charging infrastructure incentives, we are actively engaged in addressing the
challenges and opportunities that EVs will present.
As we modernize and strengthen the electric power grid to meet the needs of customers today and in the future, we are creating a smarter, cleaner and more
sophisticated system. We continually strive to find the right mix of projects and technologies while maintaining affordability and reliability for customers. Having the
right public policies and regulations in place directly impacts our ability to achieve these goals and we have ongoing discussions with regulators and legislators on
these issues.
Learn more about AEP’s strategy for growth and carbon reduction strategies and goals.
AEP 2019 EEI ESG/Sustainability Report 9
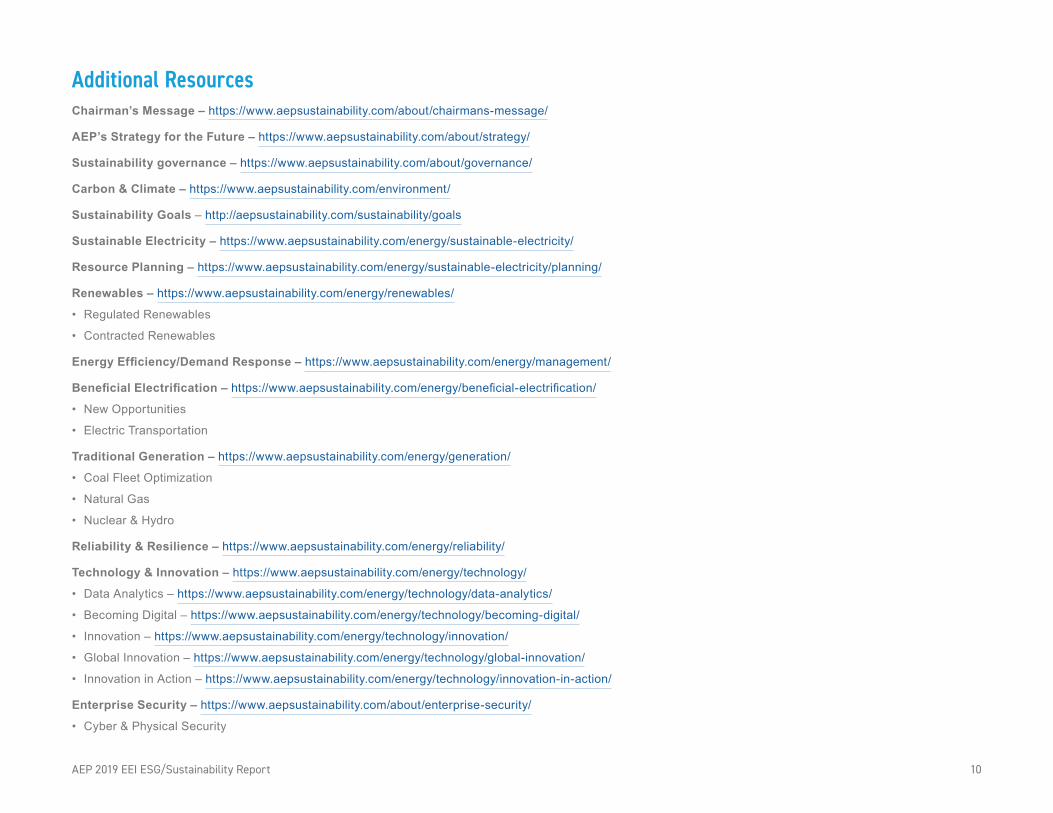
Additional ResourcesChairman’s Message – https://www.aepsustainability.com/about/chairmans-message/
AEP’s Strategy for the Future – https://www.aepsustainability.com/about/strategy/
Sustainability governance – https://www.aepsustainability.com/about/governance/
Carbon & Climate – https://www.aepsustainability.com/environment/
Sustainability Goals – http://aepsustainability.com/sustainability/goals
Sustainable Electricity – https://www.aepsustainability.com/energy/sustainable-electricity/
Resource Planning – https://www.aepsustainability.com/energy/sustainable-electricity/planning/
Renewables – https://www.aepsustainability.com/energy/renewables/
• Regulated Renewables
• Contracted Renewables
Energy Efficiency/Demand Response – https://www.aepsustainability.com/energy/management/
Beneficial Electrification – https://www.aepsustainability.com/energy/beneficial-electrification/
• New Opportunities
• Electric Transportation
Traditional Generation – https://www.aepsustainability.com/energy/generation/
• Coal Fleet Optimization
• Natural Gas
• Nuclear & Hydro
Reliability & Resilience – https://www.aepsustainability.com/energy/reliability/
Technology & Innovation – https://www.aepsustainability.com/energy/technology/
• Data Analytics – https://www.aepsustainability.com/energy/technology/data-analytics/
• Becoming Digital – https://www.aepsustainability.com/energy/technology/becoming-digital/
• Innovation – https://www.aepsustainability.com/energy/technology/innovation/
• Global Innovation – https://www.aepsustainability.com/energy/technology/global-innovation/
• Innovation in Action – https://www.aepsustainability.com/energy/technology/innovation-in-action/
Enterprise Security – https://www.aepsustainability.com/about/enterprise-security/
• Cyber & Physical Security
AEP 2019 EEI ESG/Sustainability Report 10

Baseline Last Year Current Year Ref. No. American Electric Power 2000 2017 2018
1 Owned Nameplate Generation Capacity at end of year (MW) 37,369 28,804 28,462
1.1 Coal 25,556 14,506 14,056
1.2 Natural Gas 8,195 7,853 7,809
1.3 Nuclear 2,740 2,278 2,278
1.4 Petroleum 36 0 0
1.5 Total Renewable Energy Resources 842 4,167 4,319
1.5.1 • Biomass/Biogas 0 0 0
1.5.2 • Geothermal 0 0 0
1.5.3 • Hydroelectric 842 964 933
1.5.4 • Solar 0 26 200
1.5.5 • Wind 0 3,177 3,186
1.6 Other 0 0 0
2 Net Generation for the data year (MWh) 196,942,749 108,631,253 104,375,491
2.1 Coal 160,080,902 69,405,395 63,001,348
2.2 Natural Gas 26,388,802 11,959,828 13,318,616
2.3 Nuclear 9,745,654 17,592,001 17,610,815
2.4 Petroleum 44 20,335 0
2.5 Total Renewable Energy Resources 727,347 9,653,694 10,444,712
2.5.1 • Biomass/Biogas 0 0 0
2.5.2 • Geothermal 0 0 0
2.5.3 • Hydroelectric 727,347 775,636 1,160,659
2.5.4 • Solar 0 37,828 33,795
2.5.5 • Wind 0 8,840,230 9,250,258
2.6 Other 0 0 0
SECTION II: QUANTITATIVE REPORT
AEP 2019 EEI ESG/Sustainability Report 11

Baseline Last Year Current Year Ref. No. American Electric Power 2000 2017 2018
3 Investing in the Future: Capital Expenditures, Energy Efficiency (EE), & Smart Meters
3.1 Total Annual Capital Expenditures (nominal dollars) — $6,045,000,000 $5,959,000,000
3.2 Incremental Annual Electricity Savings from EE Measures (MWh) — 1,032,000 1,022,257
3.3 Incremental Annual Investment in Electric EE Programs — $185,000,000 $165,000,000 (nominal dollars)
3.4 Percent of Total Electric Customers with Smart Meters (at end of year) — 34% 47%
4 Retail Electric Customer Count (at end of year)
4.1 Commercial — 708,000 713,000
4.2 Industrial — 36,000 42,500
4.3 Residential — 5,402,000 5,437,000
5 GHG Emissions: Carbon Dioxide (CO2) & Carbon Dioxide Equivalent (CO2e)
5.1 Owned Generation 1, 2, 3
5.1.1 • Carbon Dioxide (CO2)
5.1.1.1 – Total Owned Generation CO2 Emissions (MT) 167,100,561 72,109,609 68,732,609
5.1.1.2 – Total Owned Generation CO2 Emissions Intensity (MT/Net MWh) 0.848 0.727 0.725
5.1.2 • Carbon Dioxide Equivalent (CO2e)
5.1.2.1 – Total Owned Generation CO2e Emissions (MT) 168,470,786 72,813,962 69,614,180
5.1.2.2 – Total Owned Generation CO2e Emissions Intensity (MT/Net MWh) 0.855 0.734 0.734
5.2 Purchased Power 4
5.2.1 • Carbon Dioxide (CO2)
5.2.1.1 – Total Purchased Generation CO2 Emissions (MT) 0 227,681 0
5.2.1.2 – Total Purchased Generation CO2 Emissions Intensity (MT/Net MWh) 0.000 0.024 0.000
5.2.2 • Carbon Dioxide Equivalent (CO2e)
5.2.2.1 – Total Purchased Generation CO2e Emissions (MT) 0 251,231 0
5.2.2.2 – Total Purchased Generation CO2e Emissions Intensity (MT/Net MWh) 0.000 0.027 0.000
AEP 2019 EEI ESG/Sustainability Report 12

Baseline Last Year Current Year Ref. No. American Electric Power 2000 2017 2018
5.3 Owned Generation + Purchased Power
5.3.1 • Carbon Dioxide (CO2)
5.3.1.1 – Total Owned + Purchased Generation CO2 Emissions (MT) 167,100,561 72,337,290 68,732,609
5.3.1.2 – Total Owned + Purchased Generation CO2 Emissions Intensity 0.848 0.666 0.659 (MT/Net MWh)
5.3.2 • Carbon Dioxide Equivalent (CO2e)
5.3.2.1 – Total Owned + Purchased Generation CO2e Emissions (MT) 168,470,786 73,065,193 69,614,180
5.3.2.2 – Total Owned + Purchased Generation CO2e Emissions Intensity 0.855 0.673 0.667 (MT/Net MWh)
5.4 Non-Generation CO2e Emissions
5.4.1 • Fugitive CO2e emissions of sulfur hexafluoride (MT) 5 123,140 189,810 163,408
5.4.2 • Fugitive CO2e emissions from natural gas distribution (MT) 6 0 0 0
6 Nitrogen Oxide (NOx), Sulfur Dioxide (SO2), Mercury (Hg)
6.1 Total Generation basis for calculation 7
6.2 Nitrogen Oxide (NOx)
6.2.1 • Total NOx Emissions (MT) 417,826 47,552 45,281
6.2.2 • Total NOx Emissions Intensity (MT/Net MWh) 0.002122 0.000479 0.000478
6.3 Sulfur Dioxide (SO2)
6.3.1 • Total SO2 Emissions (MT) 929,796 68,652 62,274
6.3.2 • Total SO2 Emissions Intensity (MT/Net MWh) 0.004721 0.000692 0.000657
6.4 Mercury (Hg)
6.4.1 • Total Hg Emissions (kg) 4,289.0 206.5 189.1
6.4.2 • Total Hg Emissions Intensity (kg/Net MWh) 0.000022 0.000002 0.000002
AEP 2019 EEI ESG/Sustainability Report 13
Total

Baseline Last Year Current Year Ref. No. American Electric Power 2000 2017 2018
7.1 Total Number of Employees 19,998 17,666 17,582
7.2 Total Number on Board of Directors/Trustees 11 12 12
7.3 Total Women on Board of Directors/Trustees 2 3 3
7.4 Total Minorities on Board of Directors/Trustees 1 2 2
7.5 Employee Safety Metrics
7.5.1 • Recordable Incident Rate 2.35 0.80 0.67
7.5.2 • Lost-time Case Rate 0.60 0.32 0.31
7.5.3 • Days Away, Restricted, and Transfer (DART) Rate 0.96 0.51 0.39
7.5.4 • Work-related Fatalities 1 2 1
8 Fresh Water Resources
8.1 Water Withdrawals — Consumptive (Billions of Liters/Net MWh) — 0.0000017 0.0000015
8.2 Water Withdrawals — Non-Consumptive (Billions of Liters/Net MWh) — 0.0000594 0.0000054
9 Waste Products
9.1 Amount of Hazardous Waste Manifested for Disposal — 55.6 21.90
9.2 Percent of Coal Combustion Products Beneficially Used — 41% 38%
AEP 2019 EEI ESG/Sustainability Report 14

AEP 2019 EEI ESG/Sustainability Report 15
Last Year Current Year
Ref. No. Appalachian Power 2017 2018
Portfolio
1 Owned Nameplate Generation Capacity at end of year (MW) 6,660 6,629
1.1 Coal 4,250 4,250
1.2 Natural Gas 1,594 1,594
1.3 Nuclear 0 0
1.4 Petroleum 0 0
1.5 Total Renewable Energy Resources 816 785
1.5.1 • Biomass/Biogas 0 0
1.5.2 • Geothermal 0 0
1.5.3 • Hydroelectric 816 785
1.5.4 • Solar 0 0
1.5.5 • Wind 0 0
1.6 Other 0 0
2 Net Generation for the data year (MWh) 26,816,965 25,968,691
2.1 Coal 21,039,583 18,694,736
2.2 Natural Gas 4,143,800 4,949,093
2.3 Nuclear 0 0
2.4 Petroleum 0 0
2.5 Total Renewable Energy Resources 1,633,582 2,324,862
2.5.1 • Biomass/Biogas 0 0
2.5.2 • Geothermal 0 0
2.5.3 • Hydroelectric 668,275 1,028,940
2.5.4 • Solar 0 0
2.5.5 • Wind 965,307 1,295,922
2.6 Other 0 0

AEP 2019 EEI ESG/Sustainability Report 16
Last Year Current Year Ref. No. Appalachian Power 2017 2018
2.i Owned Net Generation for the data year (MWh) 25,685,811 24,383,779
2.1.i Coal 21,039,583 18,694,736
2.2.i Natural Gas 4,143,800 4,949,093
2.3.i Nuclear 0 0
2.4.i Petroleum 0 0
2.5.i Total Renewable Energy Resources 502,428 739,950
2.5.1.i • Biomass/Biogas 0 0
2.5.2.i • Geothermal 0 0
2.5.3.i • Hydroelectric 502,428 739,950
2.5.4.i • Solar 0 0
2.5.5.i • Wind 0 0
2.6.i Other 0 0
2.ii Purchased Net Generation for the data year (MWh) 1,131,154 1,584,912
2.1.ii Coal 0 0
2.2.ii Natural Gas 0 0
2.3.ii Nuclear 0 0
2.4.ii Petroleum 0 0
2.5.ii Total Renewable Energy Resources 1,131,154 1,584,912
2.5.1.ii • Biomass/Biogas 0 0
2.5.2.ii • Geothermal 0 0
2.5.3.ii • Hydroelectric 165,847 288,990
2.5.4.ii • Solar 0 0
2.5.5.ii • Wind 965,307 1,295,922
2.6.ii Other 0 0

AEP 2019 EEI ESG/Sustainability Report 17
Last Year Current Year Ref. No. Appalachian Power 2017 2018
Emissions
5 GHG Emissions: Carbon Dioxide (CO2) & Carbon Dioxide Equivalent (CO2e)
5.1 Owned Generation 1, 2, 3
5.1.1 • Carbon Dioxide (CO2)
5.1.1.1 – Total Owned Generation CO2 Emissions (MT) 21,631,295 19,793,293
5.1.1.2 – Total Owned Generation CO2 Emissions Intensity (MT/Net MWh) 0.842 0.812
5.1.2 • Carbon Dioxide Equivalent (CO2e)
5.1.2.1 – Total Owned Generation CO2e Emissions (MT) 21,823,706 19,962,684
5.1.2.2 – Total Owned Generation CO2e Emissions Intensity (MT/Net MWh) 0.850 0.819
5.2 Purchased Power 4
5.2.1 • Carbon Dioxide (CO2)
5.2.1.1 – Total Purchased Generation CO2 Emissions (MT) 0 0
5.2.1.2 – Total Purchased Generation CO2 Emissions Intensity (MT/Net MWh) 0.000 0.000
5.2.2 • Carbon Dioxide Equivalent (CO2e)
5.2.2.1 – Total Purchased Generation CO2e Emissions (MT) 0 0
5.2.2.2 – Total Purchased Generation CO2e Emissions Intensity (MT/Net MWh) 0.000 0.000
5.3 Owned Generation + Purchased Power
5.3.1 • Carbon Dioxide (CO2)
5.3.1.1 – Total Owned + Purchased Generation CO2 Emissions (MT) 21,631,295 19,793,293
5.3.1.2 – Total Owned + Purchased Generation CO2 Emissions Intensity 0.807 0.762 (MT/Net MWh)
5.3.2 • Carbon Dioxide Equivalent (CO2e)
5.3.2.1 – Total Owned + Purchased Generation CO2e Emissions (MT) 21,823,706 19,962,684
5.3.2.2 – Total Owned + Purchased Generation CO2e Emissions Intensity 0.814 0.769 (MT/Net MWh)

AEP 2019 EEI ESG/Sustainability Report 18
Last Year Current Year Ref. No. Appalachian Power 2017 2018
5.4 Non-Generation CO2e Emissions
5.4.1 • Fugitive CO2e emissions of sulfur hexafluoride (MT) 5 44,009 37,888
5.4.2 • Fugitive CO2e emissions from natural gas distribution (MT) 6 0 0
6 Nitrogen Oxide (NOx), Sulfur Dioxide (SO2), Mercury (Hg)
6.1 Generation basis for calculation 7
6.2 Nitrogen Oxide (NOx)
6.2.1 • Total NOx Emissions (MT) 8,974 8,361
6.2.2 • Total NOx Emissions Intensity (MT/Net MWh) 0.000335 0.000322
6.3 Sulfur Dioxide (SO2)
6.3.1 • Total SO2 Emissions (MT) 8,988 7,494
6.3.2 • Total SO2 Emissions Intensity (MT/Net MWh) 0.000335 0.000289
6.4 Mercury (Hg)
6.4.1 • Total Hg Emissions (kg) 48.4 47.0
6.4.2 • Total Hg Emissions Intensity (kg/Net MWh) 0.000002 0.000002
Total

AEP 2019 EEI ESG/Sustainability Report 19
Last Year Current Year Ref. No. Kentucky Power 2017 2018
Portfolio
1 Owned Nameplate Generation Capacity at end of year (MW) 1,453 1,453
1.1 Coal 1,173 1,173
1.2 Natural Gas 280 280
1.3 Nuclear 0 0
1.4 Petroleum 0 0
1.5 Total Renewable Energy Resources 0 0
1.5.1 • Biomass/Biogas 0 0
1.5.2 • Geothermal 0 0
1.5.3 • Hydroelectric 0 0
1.5.4 • Solar 0 0
1.5.5 • Wind 0 0
1.6 Other 0 0
2 Net Generation for the data year (MWh) 6,045,647 5,106,138
2.1 Coal 5,481,940 4,535,334
2.2 Natural Gas 563,707 624,804
2.3 Nuclear 0 0
2.4 Petroleum 0 0
2.5 Total Renewable Energy Resources 0 0
2.5.1 • Biomass/Biogas 0 0
2.5.2 • Geothermal 0 0
2.5.3 • Hydroelectric 0 0
2.5.4 • Solar 0 0
2.5.5 • Wind 0 0
2.6 Other 0 0

AEP 2019 EEI ESG/Sustainability Report 20
Last Year Current Year Ref. No. Kentucky Power 2017 2018
2.i Owned Net Generation for the data year (MWh) 6,045,647 5,160,138
2.1.i Coal 5,481,940 4,535,334
2.2.i Natural Gas 563,707 624,804
2.3.i Nuclear 0 0
2.4.i Petroleum 0 0
2.5.i Total Renewable Energy Resources 0 0
2.5.1.i • Biomass/Biogas 0 0
2.5.2.i • Geothermal 0 0
2.5.3.i • Hydroelectric 0 0
2.5.4.i • Solar 0 0
2.5.5.i • Wind 0 0
2.6.i Other 0 0
2.ii Purchased Net Generation for the data year (MWh) 0 0
2.1.ii Coal 0 0
2.2.ii Natural Gas 0 0
2.3.ii Nuclear 0 0
2.4.ii Petroleum 0 0
2.5.ii Total Renewable Energy Resources 0 0
2.5.1.ii • Biomass/Biogas 0 0
2.5.2.ii • Geothermal 0 0
2.5.3.ii • Hydroelectric 0 0
2.5.4.ii • Solar 0 0
2.5.5.ii • Wind 0 0
2.6.ii Other 0 0

AEP 2019 EEI ESG/Sustainability Report 21
Last Year Current Year Ref. No. Kentucky Power 2017 2018
Emissions
5 GHG Emissions: Carbon Dioxide (CO2) & Carbon Dioxide Equivalent (CO2e)
5.1 Owned Generation 1, 2, 3
5.1.1 • Carbon Dioxide (CO2)
5.1.1.1 – Total Owned Generation CO2 Emissions (MT) 5,605,773 4,838,061
5.1.1.2 – Total Owned Generation CO2 Emissions Intensity (MT/Net MWh) 0.927 0.938
5.1.2 • Carbon Dioxide Equivalent (CO2e)
5.1.2.1 – Total Owned Generation CO2e Emissions (MT) 5,655,272 4,879,814
5.1.2.2 – Total Owned Generation CO2e Emissions Intensity (MT/Net MWh) 0.935 0.946
5.2 Purchased Power 4
5.2.1 • Carbon Dioxide (CO2)
5.2.1.1 – Total Purchased Generation CO2 Emissions (MT) 0 0
5.2.1.2 – Total Purchased Generation CO2 Emissions Intensity (MT/Net MWh) 0.000 0.000
5.2.2 • Carbon Dioxide Equivalent (CO2e)
5.2.2.1 – Total Purchased Generation CO2e Emissions (MT) 0 0
5.2.2.2 • Total Purchased Generation CO2e Emissions Intensity (MT/Net MWh) 0.000 0.000
5.3 Owned Generation + Purchased Power
5.3.1 • Carbon Dioxide (CO2)
5.3.1.1 – Total Owned + Purchased Generation CO2 Emissions (MT) 5,605,773 4,838,061
5.3.1.2 – Total Owned + Purchased Generation CO2 Emissions Intensity 0.927 0.947 (MT/Net MWh)
5.3.2 • Carbon Dioxide Equivalent (CO2e)
5.3.2.1 – Total Owned + Purchased Generation CO2e Emissions (MT) 5,655,272 4,879,814
5.3.2.2 – Total Owned + Purchased Generation CO2e Emissions Intensity 0.935 0.956 (MT/Net MWh)

Last Year Current Year Ref. No. Kentucky Power 2017 2018
5.4 Non-Generation CO2e Emissions
5.4.1 • Fugitive CO2e emissions of sulfur hexafluoride (MT) 5 9,501 8,179
5.4.2 • Fugitive CO2e emissions from natural gas distribution (MT) 6 0 0
6 Nitrogen Oxide (NOx), Sulfur Dioxide (SO2), Mercury (Hg)
6.1 Generation basis for calculation 7
6.2 Nitrogen Oxide (NOx)
6.2.1 • Total NOx Emissions (MT) 3,561 2,728
6.2.2 • Total NOx Emissions Intensity (MT/Net MWh) 0.000589 0.000534
6.3 Sulfur Dioxide (SO2)
6.3.1 • Total SO2 Emissions (MT) 4,310 4,036
6.3.2 • Total SO2 Emissions Intensity (MT/Net MWh) 0.000713 0.000790
6.4 Mercury (Hg)
6.4.1 • Total Hg Emissions (kg) 10.9 9.3
6.4.2 • Total Hg Emissions Intensity (kg/Net MWh) 0.000002 0.000002
AEP 2019 EEI ESG/Sustainability Report 22
Total

Last Year Current Year Ref. No. Indiana Michigan Power 2017 2018
Portfolio
1 Owned Nameplate Generation Capacity at end of year (MW) 4,505 4,505
1.1 Coal 2,227 2,227
1.2 Natural Gas 0 0
1.3 Nuclear 2,278 2,278
1.4 Petroleum 0 0
1.5 Total Renewable Energy Resources 36 36
1.5.1 • Biomass/Biogas 0 0
1.5.2 • Geothermal 0 0
1.5.3 • Hydroelectric 20 20
1.5.4 • Solar 16 16
1.5.5 • Wind 0 0
1.6 Other 0 0
2 Net Generation for the data year (MWh) 28,411,719 29,144,068
2.1 Coal 9,284,926 10,109,541
2.2 Natural Gas 0 0
2.3 Nuclear 17,592,001 17,610,815
2.4 Petroleum 0 0
2.5 Total Renewable Energy Resources 1,534,792 1,423,712
2.5.1 • Biomass/Biogas 0 0
2.5.2 • Geothermal 0 0
2.5.3 • Hydroelectric 107,361 115,114
2.5.4 • Solar 24,219 20,747
2.5.5 • Wind 1,403,212 1,287,851
2.6 Other 0 0
AEP 2019 EEI ESG/Sustainability Report 23

Last Year Current Year Ref. No. Indiana Michigan Power 2017 2018
2.i Owned Net Generation for the data year (MWh) 27,008,507 27,856,217
2.1.i Coal 9,284,926 10,109,541
2.2.i Natural Gas 0 0
2.3.i Nuclear 17,592,001 17,610,815
2.4.i Petroleum 0 0
2.5.i Total Renewable Energy Resources 131,580 135,861
2.5.1.i • Biomass/Biogas 0 0
2.5.2.i • Geothermal 0 0
2.5.3.i • Hydroelectric 107,361 115,114
2.5.4.i • Solar 24,219 20,747
2.5.5.i • Wind 0 0
2.6.i Other 0 0
2.ii Purchased Net Generation for the data year (MWh) 1,403,212 1,287,851
2.1.ii Coal 0 0
2.2.ii Natural Gas 0 0
2.3.ii Nuclear 0 0
2.4.ii Petroleum 0 0
2.5.ii Total Renewable Energy Resources 1,403,212 1,287,851
2.5.1.ii • Biomass/Biogas 0 0
2.5.2.ii • Geothermal 0 0
2.5.3.ii • Hydroelectric 0 0
2.5.4.ii • Solar 0 0
2.5.5.ii • Wind 1,403,212 1,287,851
2.6.ii Other 0 0
AEP 2019 EEI ESG/Sustainability Report 24

Last Year Current Year Ref. No. Indiana Michigan Power 2017 2018
Emissions
5 GHG Emissions: Carbon Dioxide (CO2) & Carbon Dioxide Equivalent (CO2e)
5.1 Owned Generation 1, 2, 3
5.1.1 • Carbon Dioxide (CO2)
5.1.1.1 – Total Owned Generation CO2 Emissions (MT) 8,809,565 9,608,170
5.1.1.2 – Total Owned Generation CO2 Emissions Intensity (MT/Net MWh) 0.326 0.345
5.1.2 • Carbon Dioxide Equivalent (CO2e)
5.1.2.1 – Total Owned Generation CO2e Emissions (MT) 8,891,406 9,695,220
5.1.2.2 – Total Owned Generation CO2e Emissions Intensity (MT/Net MWh) 0.329 0.348
5.2 Purchased Power 4
5.2.1 • Carbon Dioxide (CO2)
5.2.1.1 – Total Purchased Generation CO2 Emissions (MT) 0 0
5.2.1.2 – Total Purchased Generation CO2 Emissions Intensity (MT/Net MWh) 0.000 0.000
5.2.2 • Carbon Dioxide Equivalent (CO2e)
5.2.2.1 – Total Purchased Generation CO2e Emissions (MT) 0 0
5.2.2.2 – Total Purchased Generation CO2e Emissions Intensity (MT/Net MWh) 0.000 0.000
5.3 Owned Generation + Purchased Power
5.3.1 • Carbon Dioxide (CO2)
5.3.1.1 – Total Owned + Purchased Generation CO2 Emissions (MT) 8,809,565 9,608,170
5.3.1.2 – Total Owned + Purchased Generation CO2 Emissions Intensity 0.310 0.330 (MT/Net MWh)
5.3.2 • Carbon Dioxide Equivalent (CO2e)
5.3.2.1 – Total Owned + Purchased Generation CO2e Emissions (MT) 8,891,406 9,695,220
5.3.2.2 – Total Owned + Purchased Generation CO2e Emissions Intensity 0.313 0.333 (MT/Net MWh)
AEP 2019 EEI ESG/Sustainability Report 25

Last Year Current Year Ref. No. Indiana Michigan Power 2017 2018
5.4 Non-Generation CO2e Emissions
5.4.1 • Fugitive CO2e emissions of sulfur hexafluoride (MT) 5 18,439 15,874
5.4.2 • Fugitive CO2e emissions from natural gas distribution (MT) 6 0 0
6 Nitrogen Oxide (NOx), Sulfur Dioxide (SO2), Mercury (Hg)
6.1 Generation basis for calculation 7
6.2 Nitrogen Oxide (NOx)
6.2.1 • Total NOx Emissions (MT) 8,683 6,740
6.2.2 • Total NOx Emissions Intensity (MT/Net MWh) 0.000306 0.000231
6.3 Sulfur Dioxide (SO2)
6.3.1 • Total SO2 Emissions (MT) 16,026 16,379
6.3.2 • Total SO2 Emissions Intensity (MT/Net MWh) 0.000564 0.000562
6.4 Mercury (Hg)
6.4.1 • Total Hg Emissions (kg) 51.3 52.8
6.4.2 • Total Hg Emissions Intensity (kg/Net MWh) 0.000002 0.000002
AEP 2019 EEI ESG/Sustainability Report 26
Total

Last Year Current Year Ref. No. Public Service Company of Oklahoma 2017 2018
Portfolio
1 Owned Nameplate Generation Capacity at end of year (MW) 3,934 3,893
1.1 Coal 574 574
1.2 Natural Gas 3,360 3,319
1.3 Nuclear 0 0
1.4 Petroleum 0 0
1.5 Total Renewable Energy Resources 0 0
1.5.1 • Biomass/Biogas 0 0
1.5.2 • Geothermal 0 0
1.5.3 • Hydroelectric 0 0
1.5.4 • Solar 0 0
1.5.5 • Wind 0 0
1.6 Other 0 0
2 Net Generation for the data year (MWh) 9,359,221 11,757,218
2.1 Coal 2,620,147 3,246,459
2.2 Natural Gas 2,592,949 4,203,473
2.3 Nuclear 0 0
2.4 Petroleum 0 0
2.5 Total Renewable Energy Resources 4,146,125 4,307,286
2.5.1 • Biomass/Biogas 0 0
2.5.2 • Geothermal 0 0
2.5.3 • Hydroelectric 0 0
2.5.4 • Solar 0 0
2.5.5 • Wind 4,146,125 4,307,286
2.6 Other 0 0
AEP 2019 EEI ESG/Sustainability Report 27

Last Year Current Year Ref. No. Public Service Company of Oklahoma 2017 2018
2.i Owned Net Generation for the data year (MWh) 5,213,096 7,449,932
2.1.i Coal 2,620,147 3,246,459
2.2.i Natural Gas 2,592,949 4,203,473
2.3.i Nuclear 0 0
2.4.i Petroleum 0 0
2.5.i Total Renewable Energy Resources 0 0
2.5.1.i • Biomass/Biogas 0 0
2.5.2.i • Geothermal 0 0
2.5.3.i • Hydroelectric 0 0
2.5.4.i • Solar 0 0
2.5.5.i • Wind 0 0
2.6.i Other 0 0
2.ii Purchased Net Generation for the data year (MWh) 4,146,125 4,307,286
2.1.ii Coal 0 0
2.2.ii Natural Gas 0 0
2.3.ii Nuclear 0 0
2.4.ii Petroleum 0 0
2.5.ii Total Renewable Energy Resources 4,146,125 4,307,286
2.5.1.ii • Biomass/Biogas 0 0
2.5.2.ii • Geothermal 0 0
2.5.3.ii • Hydroelectric 0 0
2.5.4.ii • Solar 0 0
2.5.5.ii • Wind 4,146,125 4,307,286
2.6.ii Other 0 0
AEP 2019 EEI ESG/Sustainability Report 28

Last Year Current Year Ref. No. Public Service Company of Oklahoma 2017 2018
Emissions
5 GHG Emissions: Carbon Dioxide (CO2) & Carbon Dioxide Equivalent (CO2e)
5.1 Owned Generation 1, 2, 3
5.1.1 • Carbon Dioxide (CO2)
5.1.1.1 – Total Owned Generation CO2 Emissions (MT) 3,996,189 5,713,127
5.1.1.2 – Total Owned Generation CO2 Emissions Intensity (MT/Net MWh) 0.767 0.767
5.1.2 • Carbon Dioxide Equivalent (CO2e)
5.1.2.1 – Total Owned Generation CO2e Emissions (MT) 4,022,684 5,747,920
5.1.2.2 – Total Owned Generation CO2e Emissions Intensity (MT/Net MWh) 0.772 0.772
5.2 Purchased Power 4
5.2.1 • Carbon Dioxide (CO2)
5.2.1.1 – Total Purchased Generation CO2 Emissions (MT) 0 0
5.2.1.2 – Total Purchased Generation CO2 Emissions Intensity (MT/Net MWh) 0.000 0.000
5.2.2 • Carbon Dioxide Equivalent (CO2e)
5.2.2.1 – Total Purchased Generation CO2e Emissions (MT) 0 0
5.2.2.2 – Total Purchased Generation CO2e Emissions Intensity (MT/Net MWh) 0.000 0.000
5.3 Owned Generation + Purchased Power
5.3.1 • Carbon Dioxide (CO2)
5.3.1.1 – Total Owned + Purchased Generation CO2 Emissions (MT) 3,996,189 5,713,127
5.3.1.2 – Total Owned + Purchased Generation CO2 Emissions Intensity 0.427 0.486 (MT/Net MWh)
5.3.2 • Carbon Dioxide Equivalent (CO2e)
5.3.2.1 – Total Owned + Purchased Generation CO2e Emissions (MT) 4,022,684 5,747,920
5.3.2.2 – Total Owned + Purchased Generation CO2e Emissions Intensity 0.430 0.489 (MT/Net MWh)
AEP 2019 EEI ESG/Sustainability Report 29

Last Year Current Year Ref. No. Public Service Company of Oklahoma 2017 2018
5.4 Non-Generation CO2e Emissions
5.4.1 • Fugitive CO2e emissions of sulfur hexafluoride (MT) 5 15,710 13,525
5.4.2 • Fugitive CO2e emissions from natural gas distribution (MT) 6 0 0
6 Nitrogen Oxide (NOx), Sulfur Dioxide (SO2), Mercury (Hg)
6.1 Generation basis for calculation 7
6.2 Nitrogen Oxide (NOx)
6.2.1 • Total NOx Emissions (MT) 3,543 6,067
6.2.2 • Total NOx Emissions Intensity (MT/Net MWh) 0.000379 0.000516
6.3 Sulfur Dioxide (SO2)
6.3.1 • Total SO2 Emissions (MT) 3,684 4,713
6.3.2 • Total SO2 Emissions Intensity (MT/Net MWh) 0.000394 0.000401
6.4 Mercury (Hg)
6.4.1 • Total Hg Emissions (kg) 16.9 21.3
6.4.2 • Total Hg Emissions Intensity (kg/Net MWh) 0.000002 0.000002
AEP 2019 EEI ESG/Sustainability Report 30
Total
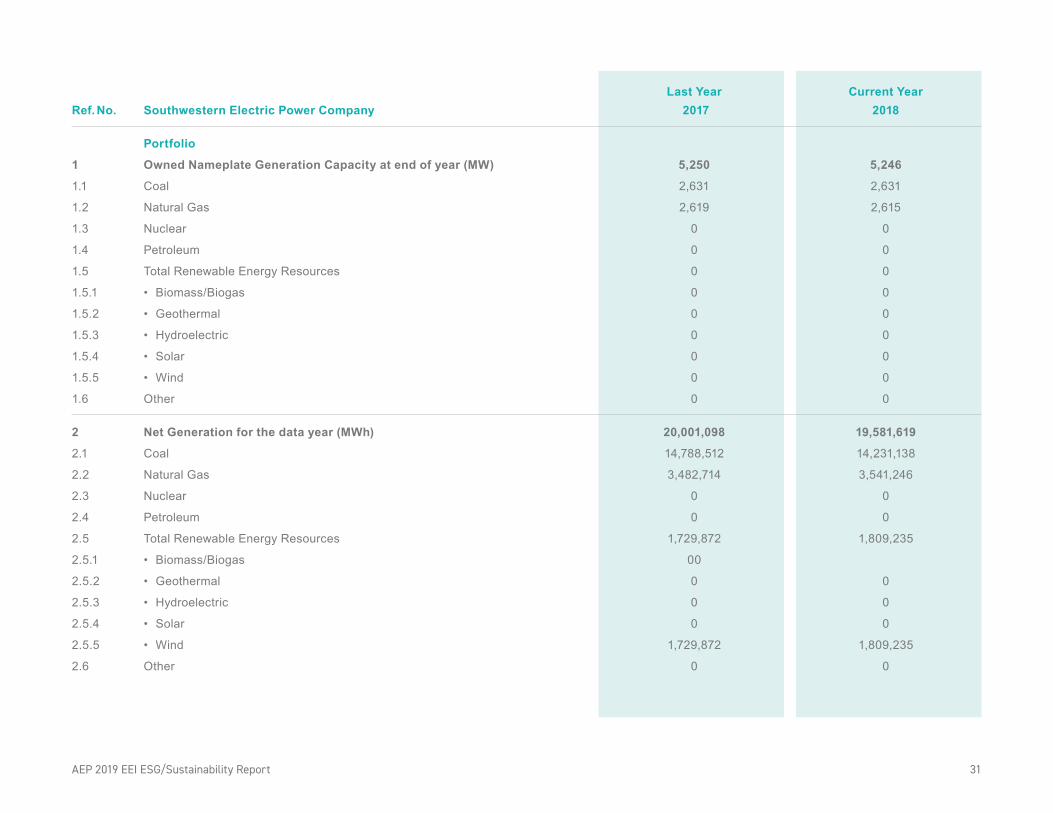
Last Year Current Year Ref. No. Southwestern Electric Power Company 2017 2018
Portfolio
1 Owned Nameplate Generation Capacity at end of year (MW) 5,250 5,246
1.1 Coal 2,631 2,631
1.2 Natural Gas 2,619 2,615
1.3 Nuclear 0 0
1.4 Petroleum 0 0
1.5 Total Renewable Energy Resources 0 0
1.5.1 • Biomass/Biogas 0 0
1.5.2 • Geothermal 0 0
1.5.3 • Hydroelectric 0 0
1.5.4 • Solar 0 0
1.5.5 • Wind 0 0
1.6 Other 0 0
2 Net Generation for the data year (MWh) 20,001,098 19,581,619
2.1 Coal 14,788,512 14,231,138
2.2 Natural Gas 3,482,714 3,541,246
2.3 Nuclear 0 0
2.4 Petroleum 0 0
2.5 Total Renewable Energy Resources 1,729,872 1,809,235
2.5.1 • Biomass/Biogas 00
2.5.2 • Geothermal 0 0
2.5.3 • Hydroelectric 0 0
2.5.4 • Solar 0 0
2.5.5 • Wind 1,729,872 1,809,235
2.6 Other 0 0
AEP 2019 EEI ESG/Sustainability Report 31

Last Year Current Year Ref. No. Southwestern Electric Power Company 2017 2018
2.i Owned Net Generation for the data year (MWh) 18,271,226 17,772,384
2.1.i Coal 14,788,512 14,231,138
2.2.i Natural Gas 3,482,714 3,541,246
2.3.i Nuclear 0 0
2.4.i Petroleum 0 0
2.5.i Total Renewable Energy Resources 0 0
2.5.1.i • Biomass/Biogas 0 0
2.5.2.i • Geothermal 0 0
2.5.3.i • Hydroelectric 0 0
2.5.4.i • Solar 0 0
2.5.5.i • Wind 0 0
2.6.i Other 0 0
2.ii Purchased Net Generation for the data year (MWh) 1,729,872 1,809,235
2.1.ii Coal 0 0
2.2.ii Natural Gas 0 0
2.3.ii Nuclear 0 0
2.4.ii Petroleum 0 0
2.5.ii Total Renewable Energy Resources 1,729,872 1,809,235
2.5.1.ii • Biomass/Biogas 0 0
2.5.2.ii • Geothermal 0 0
2.5.3.ii • Hydroelectric 0 0
2.5.4.ii • Solar 0 0
2.5.5.ii • Wind 1,729,872 1,809,235
2.6.ii Other 0 0
AEP 2019 EEI ESG/Sustainability Report 32

Last Year Current Year Ref. No. Southwestern Electric Power Company 2017 2018
Emissions
5 GHG Emissions: Carbon Dioxide (CO2) & Carbon Dioxide Equivalent (CO2e)
5.1 Owned Generation 1, 2, 3
5.1.1 • Carbon Dioxide (CO2)
5.1.1.1 – Total Owned Generation CO2 Emissions (MT) 16,410,462 16,547,542
5.1.1.2 – Total Owned Generation CO2 Emissions Intensity (MT/Net MWh) 0.898 0.931
5.1.2 • Carbon Dioxide Equivalent (CO2e)
5.1.2.1 – Total Owned Generation CO2e Emissions (MT) 16,536,987 16,672,476
5.1.2.2 – Total Owned Generation CO2e Emissions Intensity (MT/Net MWh) 0.905 0.938
5.2 Purchased Power 4
5.2.1 • Carbon Dioxide (CO2)
5.2.1.1 – Total Purchased Generation CO2 Emissions (MT) 0 0
5.2.1.2 – Total Purchased Generation CO2 Emissions Intensity (MT/Net MWh) 0.000 0.000
5.2.2 • Carbon Dioxide Equivalent (CO2e)
5.2.2.1 – Total Purchased Generation CO2e Emissions (MT) 0 0
5.2.2.2 – Total Purchased Generation CO2e Emissions Intensity (MT/Net MWh) 0.000 0.000
5.3 Owned Generation + Purchased Power
5.3.1 • Carbon Dioxide (CO2)
5.3.1.1 – Total Owned + Purchased Generation CO2 Emissions (MT) 16,410,462 16,547,542
5.3.1.2 – Total Owned + Purchased Generation CO2 Emissions Intensity 0.820 0.845 (MT/Net MWh)
5.3.2 • Carbon Dioxide Equivalent (CO2e)
5.3.2.1 – Total Owned + Purchased Generation CO2e Emissions (MT) 16,536,987 16,672,476
5.3.2.2 – Total Owned + Purchased Generation CO2e Emissions Intensity 0.827 0.851 (MT/Net MWh)
AEP 2019 EEI ESG/Sustainability Report 33

Last Year Current Year Ref. No. Southwestern Electric Power Company 2017 2018
5.4 Non-Generation CO2e Emissions
5.4.1 • Fugitive CO2e emissions of sulfur hexafluoride (MT) 5 22,172 19,088
5.4.2 • Fugitive CO2e emissions from natural gas distribution (MT) 6 0 0
6 Nitrogen Oxide (NOx), Sulfur Dioxide (SO2), Mercury (Hg)
6.1 Generation basis for calculation 7
6.2 Nitrogen Oxide (NOx)
6.2.1 • Total NOx Emissions (MT) 11,542 11,968
6.2.2 • Total NOx Emissions Intensity (MT/Net MWh) 0.000577 0.000611
6.3 Sulfur Dioxide (SO2)
6.3.1 • Total SO2 Emissions (MT) 20,818 19,900
6.3.2 • Total SO2 Emissions Intensity (MT/Net MWh) 0.001041 0.001016
6.4 Mercury (Hg)
6.4.1 • Total Hg Emissions (kg) 36.1 35.5
6.4.2 • Total Hg Emissions Intensity (kg/Net MWh) 0.000002 0.000002
AEP 2019 EEI ESG/Sustainability Report 34
Total

Key
MT = metric tons
1 lb. = 453.59 grams
1 tonne = 1,000,000.00 grams
1 metric ton = 1.1023 short tons
Total output-based emissions factor = (insert emissions factor and source)
Notes 1 Generation and emissions are adjusted for equity ownership share to reflect the percentage of output owned by reporting entity.2 CO2 and CO2e emissions intensity should be reported using total system generation (net MWh) based on GHG worksheet.3 As reported to EPA under the mandatory GHG Reporting Protocols (40 CFR Part 98, Subparts C and D).4 Purchased power emissions should be calculated using the most relevant and accurate of the following methods:
• For direct purchases, such as PPAs, use the direct emissions data as reported to EPA.
• For market purchases where emissions are unknown, use applicable regional or national emissions rate:
– ISO/RTO-level emission factors
– Climate Registry emission factors
– E-Grid emission factors5 As reported to EPA under the mandatory GHG Reporting Protocols (40 CFR Part 98, Subpart DD).6 As reported to EPA under the mandatory GHG Reporting Protocols (40 CFR Part 98, Subpart W).7 Indicate the generation basis for calculating SO2, NOx, and Hg emissions and intensity:
• Fossil: Fossil Fuel Generation Only
• Total: Total System Generation
• Other: Other (please specify in comment section)
Total CO2e is calculated using the following global warming potentials from the IPCC Fourth Assessment Report:
CO2 = 1
CH4 = 25
N2O = 298
SF6 = 22,800
AEP Ohio and AEP Texas are “wires-only” companies and therefore are not featured in the Operating Company breakdown portion of this report.
AEP 2019 EEI ESG/Sustainability Report 35

Units TimeRef. No. Metric Name Definition Reported in Period Reference to Source
Portfolio 1 Owned Nameplate Generation Capacity at end of year (MW)
1.1 Coal
1.2 Natural Gas
Provide generation capacity data that is consistent with other external reporting by your company. The alternative default is to use the summation of the nameplate capacity of installed owned generation in the company portfolio, as reported to the U.S. Energy Information Administration (EIA) on Form 860 Generator Information. Note that data should be provided in terms of equity ownership for shared facilities. Nameplate capacity is defined as the maximum rated output of a generator, prime mover, or other electric power production equipment under specific conditions designated by the manufacturer. Installed generator nameplate capacity is commonly expressed in megawatts (MW) and is usually indicated on a nameplate physically attached to the generator.
Nameplate capacity of generation resources that produce electricity through the combustion of coal (a readily combustible black or brownish-black rock whose composition, including inherent moisture, consists of more than 50 percent by weight and more than 70 percent by volume of carbonaceous material. It is formed from plant remains that have been compacted, hardened, chemically altered, and metamorphosed by heat and pressure over geologic time).
Nameplate capacity of generation resources that produce electricity through the combustion of
Appendix
AEP 2019 EEI ESG/Sustainability Report 36
Megawatt End of Year (MW): One million watts of electricity.
MW End of Year
MW End of Year
U.S. Energy Information Administration, Online Glossary, https://www.eia.gov/tools/glossary/. Form 860 instructions available at: www.eia.gov/survey/form/eia_860/instructions.pdf.
U.S. Energy Information Administration, Online Glossary, https://www.eia.gov/tools/glossary/.
U.S. Energy Information Administration, Online

Units TimeRef. No. Metric Name Definition Reported in Period Reference to Source
1.3 Nuclear
1.4 Petroleum
1.5 Total Renewable Energy Resources
1.5.1 Biomass/Biogas
1.5.2 Geothermal
natural gas (a gaseous mixture of hydrocarbon compounds, the primary one being methane).
Nameplate capacity of generation resources that produce electricity through the use of thermal energy released from the fission of nuclear fuel in a reactor.
Nameplate capacity of generation resources that produce electricity through the combustion of petroleum (a broadly defined class of liquid hydrocarbon mixtures. Included are crude oil, lease condensate, unfinished oils, refined products obtained from the processing of crude oil, and natural gas plant liquids).
Energy resources that are naturally replenishing but flow-limited. They are virtually inexhaustible in duration but limited in the amount of energy that is available per unit of time. Renewable energy resources include biomass, hydro, geothermal, solar, wind, ocean thermal, wave action, and tidal action.
Nameplate capacity of generation resources that produce electricity through the combustion of biomass (an organic nonfossil material of biological origin constituting a renewable energy source).
Nameplate capacity of generation resources that produce electricity through the use of thermal energy released from hot water or steam extracted from geothermal reservoirs in the earth’s crust.
AEP 2019 EEI ESG/Sustainability Report 37
MW End of Year
MW End of Year
MW End of Year
MW End of Year
MW End of Year
Glossary, https://www.eia.gov/tools/glossary/.
U.S. Energy Information Administration, Online Glossary, https://www.eia.gov/tools/glossary/.
U.S. Energy Information Administration, Online Glossary, https://www.eia.gov/tools/glossary/.
U.S. Energy Information Administration, Online Glossary, https://www.eia.gov/tools/glossary/.
U.S. Energy Information Administration, Online Glossary, https://www.eia.gov/tools/glossary/.
U.S. Energy Information Administration, Online Glossary, https://www.eia.gov/tools/glossary/.

Units Time Ref. No. Metric Name Definition Reported in Period Reference to Source
1.5.3 Hydroelectric
1.5.4 Solar
1.5.5 Wind
1.6 Other
2 Net Generation for the data year (MWh)
Nameplate capacity of generation resources that produce electricity through the use of flowing water.
Nameplate capacity of generation resources that produce electricity through the use of the radiant energy of the sun, which can be converted into other forms of energy, such as heat or electricity.
Nameplate capacity of generation resources that produce electricity through the use of kinetic energy present in wind motion that can be converted to mechanical energy for driving pumps, mills, and electric power generators.
Nameplate capacity of generation resources that are not defined above.
Net generation is defined as the summation of the amount of gross generation less the electrical energy consumed at the generating station(s) for station service or auxiliaries. Data can be provided in terms of total, owned, and/or purchased, depending on how the company prefers to disseminate data in this template. Provide net generation data that is consistent with other external reporting by your company. The alternative default is to provide owned generation data as reported to EIA on Form 923 Schedule 3 and align purchased power data with the Federal Energy Regulatory Commission (FERC) Form 1 Purchased Power Schedule, Reference Pages
AEP 2019 EEI ESG/Sustainability Report 38
MW End of Year
MW End of Year
MW End of Year
MW End of Year
Megawatthour Annual (MWh): One thousand kilowatt-hours or one million watt-hours.
U.S. Energy Information Administration, Online Glossary, https://www.eia.gov/tools/glossary/.
U.S. Energy Information Administration, Online Glossary, https://www.eia.gov/tools/glossary/.
U.S. Energy Information Administration, Online Glossary, https://www.eia.gov/tools/glossary/.
U.S. Energy Information Administration, Online Glossary, https://www.eia.gov/tools/glossary/. Form 923 instructions available at: www.eia.gov/survey/form/eia_923/instructions.pdf.
Units Time Ref. No. Metric Name Definition Reported in Period Reference to Source
2.1 Coal
2.2 Natural Gas
2.3 Nuclear
2.4 Petroleum
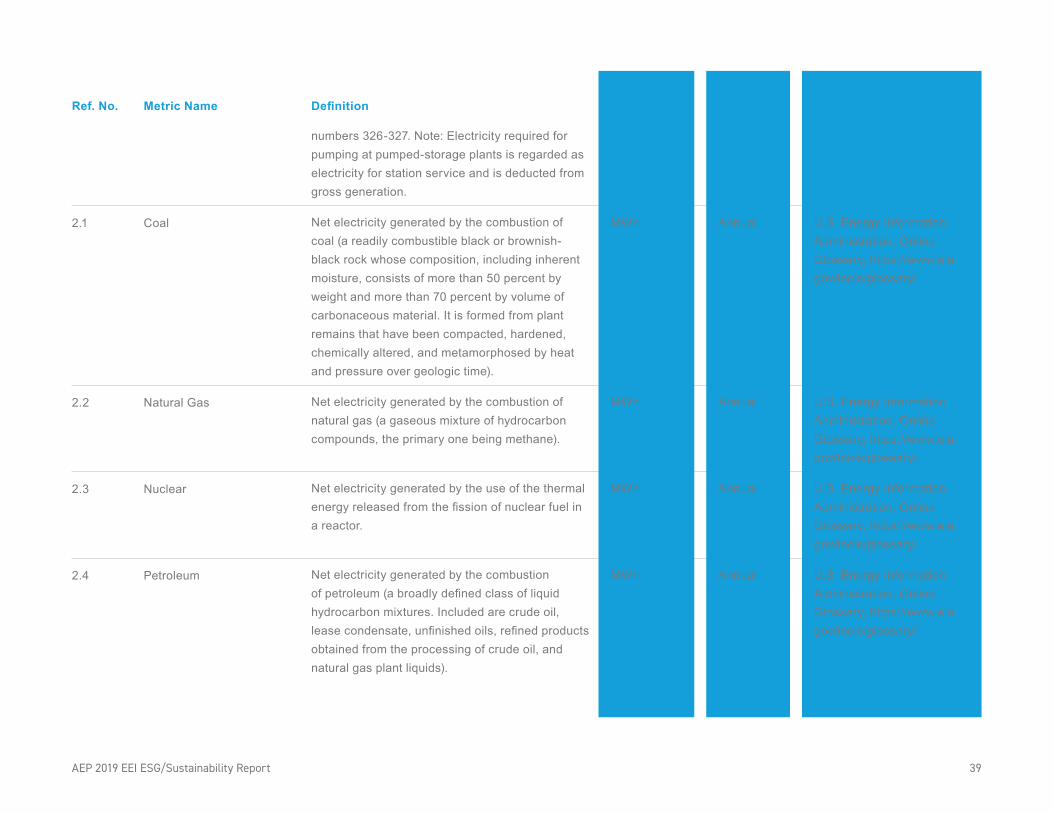
numbers 326-327. Note: Electricity required for pumping at pumped-storage plants is regarded as electricity for station service and is deducted from gross generation.
Net electricity generated by the combustion of coal (a readily combustible black or brownish-black rock whose composition, including inherent moisture, consists of more than 50 percent by weight and more than 70 percent by volume of carbonaceous material. It is formed from plant remains that have been compacted, hardened, chemically altered, and metamorphosed by heat and pressure over geologic time).
Net electricity generated by the combustion of natural gas (a gaseous mixture of hydrocarbon compounds, the primary one being methane).
Net electricity generated by the use of the thermal energy released from the fission of nuclear fuel in a reactor.
Net electricity generated by the combustion of petroleum (a broadly defined class of liquid hydrocarbon mixtures. Included are crude oil, lease condensate, unfinished oils, refined products obtained from the processing of crude oil, and natural gas plant liquids).
AEP 2019 EEI ESG/Sustainability Report 39
MWh Annual
MWh Annual
MWh Annual
MWh Annual
U.S. Energy Information Administration, Online Glossary, https://www.eia.gov/tools/glossary/.
U.S. Energy Information Administration, Online Glossary, https://www.eia.gov/tools/glossary/.
U.S. Energy Information Administration, Online Glossary, https://www.eia.gov/tools/glossary/.
U.S. Energy Information Administration, Online Glossary, https://www.eia.gov/tools/glossary/.

Units Time Ref. No. Metric Name Definition Reported in Period Reference to Source
2.5 Total Renewable Energy Resources
2.5.1 Biomass/Biogas
2.5.2 Geothermal
2.5.3 Hydroelectric
2.5.4 Solar
2.5.5 Wind
Energy resources that are naturally replenishing but flow-limited. They are virtually inexhaustible in duration but limited in the amount of energy that is available per unit of time. Renewable energy resources include biomass, hydro, geothermal, solar, wind, ocean thermal, wave action, and tidal action.
Net electricity generated by the combustion of biomass (an organic nonfossil material of biological origin constituting a renewable energy source).
Net electricity generated by the use of thermal energy released from hot water or steam extracted from geothermal reservoirs in the earth’s crust.
Net electricity generated by the use of flowing water.
Net electricity generated by the use of the radiant energy of the sun, which can be converted into other forms of energy, such as heat or electricity.
Net electricity generated by the use of kinetic energy present in wind motion that can be converted to mechanical energy for driving pumps, mills, and electric power generators.
AEP 2019 EEI ESG/Sustainability Report 40
MWh Annual
MWh Annual
MWh Annual
MWh Annual
MWh Annual
MWh Annual
U.S. Energy Information Administration, Online Glossary, https://www.eia.gov/tools/glossary/.
U.S. Energy Information Administration, Online Glossary, https://www.eia.gov/tools/glossary/.
U.S. Energy Information Administration, Online Glossary, https://www.eia.gov/tools/glossary/.
U.S. Energy Information Administration, Online Glossary, https://www.eia.gov/tools/glossary/.
U.S. Energy Information Administration, Online Glossary, https://www.eia.gov/tools/glossary/.
U.S. Energy Information Administration, Online Glossary, https://www.eia.gov/tools/glossary/.

Units Time Ref. No. Metric Name Definition Reported in Period Reference to Source
2.6 Other
3 Investing in the Future: Capital Expenditures, Energy Efficiency (EE), & Smart Meters
3.1 Total Annual Capital Expenditures
3.2 Incremental Annual Electricity Savings from EE Measures (MWh)
Net electricity generated by other resources that are not defined above. If applicable, this metric should also include market purchases where the generation resource is unknown.
Align annual capital expenditures with data reported in recent investor presentations. A capital expenditure is the use of funds or assumption of a liability in order to obtain physical assets that are to be used for productive purposes for at least one year. This type of expenditure is made in order to expand the productive or competitive posture of a business.
Incremental Annual Electricity Savings for the reporting year as reported to EIA on Form 861. Incremental Annual Savings for the reporting year are those changes in energy use caused in the current reporting year by: (1) new participants in DSM programs that operated in the previous reporting year, and (2) participants in new DSM programs that operated for the first time in the current reporting year. A “New program” is a program for which the reporting year is the first year the program achieved savings, regardless of when program development and expenditures began.
AEP 2019 EEI ESG/Sustainability Report 41
MWh Annual
Nominal Annual Dollars
MWh End of Year
Accounting Tools, Q&A, http://www.accountingtools.com/questions-and-answers/what-is-a-capital-expenditure.html
U.S. Energy Information Administration, Form EIA-861 Annual Electric Power Industry Report Instructions. Available at: www.eia.gov/survey/form/eia_861/instructions.pdf.

Units Time Ref. No. Metric Name Definition Reported in Period Reference to Source
3.3 Incremental Annual Investment in Electric EE Programs (nominal dollars)
3.4 Percent of Total Electric Customers with Smart Meters (at end of year)
4 Retail Electric Customer Count (at end of year)
4.1 Commercial
Total annual investment in electric energy efficiency programs as reported to EIA on Form 861.
Number of electric smart meters installed at end-use customer locations, divided by number of total electric meters installed at end-use customer locations. Smart meters are defined as electricity meters that measure and record usage data at a minimum, in hourly intervals, and provide usage data to both consumers and energy companies at least once daily. Align reporting with EIA Form 861 meter data, which lists all types of meter technology used in the system as well as total meters in the system.
Electric customer counts should be aligned with the data provided to EIA on Form 861 — Sales to Utility Customers.
An energy-consuming sector that consists of service-providing facilities and equipment of businesses; Federal, State, and local governments; and other private and public organizations, such
AEP 2019 EEI ESG/Sustainability Report 42
Nominal End of Year Dollars
Percent End of Year
Number of End of Year end-use retail customers receiving
U.S. Energy Information Administration, Form EIA-861 Annual Electric Power Industry Report Instructions. Available at: www.eia.gov/survey/form/eia_861/instructions.pdf.
U.S. Energy Information Administration, Online Glossary, https://www.eia.gov/tools/glossary/.
U.S. Energy Information Administration, Form EIA-861 Annual Electric Power Industry Report Instructions. Available at: www.eia.gov/survey/form/eia_861/instructions.pdf.
U.S. Energy Information Administration, Online Glossary, https://www.eia.gov/tools/glossary/.

Units Time Ref. No. Metric Name Definition Reported in Period Reference to Source
4.2 Industrial
as religious, social, or fraternal groups. The commercial sector includes institutional living quarters. It also includes sewage treatment facilities. Common uses of energy associated with this sector include space heating, water heating, air conditioning, lighting, refrigeration, cooking, and running a wide variety of other equipment. Note: This sector includes generators that produce electricity and/or useful thermal output primarily to support the activities of the above-mentioned commercial establishments.
An energy-consuming sector that consists of all facilities and equipment used for producing, processing, or assembling goods. The industrial sector encompasses the following types of activity manufacturing (NAICS codes 31-33); agriculture, forestry, fishing and hunting (NAICS code 11); mining, including oil and gas extraction (NAICS code 21); and construction (NAICS code 23). Overall energy use in this sector is largely for process heat and cooling and powering machinery, with lesser amounts used for facility heating, air conditioning, and lighting. Fossil fuels are also used as raw material inputs to manufactured products. Note: This sector includes generators that produce electricity and/or useful thermal output primarily to support the above-mentioned industrial activities. Various EIA programs differ in sectoral coverage.
AEP 2019 EEI ESG/Sustainability Report 43
electricity (individual homes and businesses count as one).
Number of End of Year end-use retail customers receiving electricity (individual homes and businesses count as one).
U.S. Energy Information Administration, Online Glossary, https://www.eia.gov/tools/glossary/.

Units Time Ref. No. Metric Name Definition Reported in Period Reference to Source
4.3 Residential
Emissions 5 GHG Emissions: Carbon Dioxide (CO2) & Carbon Dioxide Equivalent (CO2e)
5.1 Owned Generation
5.1.1 Carbon Dioxide (CO2)
5.1.1.1 Total Owned Generation CO2 Emissions
5.1.1.2 Total Owned Generation CO2 Emissions Intensity
5.1.2 Carbon Dioxide Equivalent (CO2e)
5.1.2.1 Total Owned Generation CO2e Emissions
An energy-consuming sector that consists of living quarters for private households. Common uses of energy associated with this sector include space heating, water heating, air conditioning, lighting, refrigeration, cooking, and running a variety of other appliances. The residential sector excludes institutional living quarters. Note: Various EIA programs differ in sectoral coverage.
Total direct CO2 emissions from company equity-owned fossil fuel combustion generation in accordance with EPA’s GHG Reporting Program (40 CFR, part 98, Subpart C — General Stationary Fuel Combustion and Subpart D — Electricity Production), using a continuous emission monitoring system (CEMS) or other approved methodology.
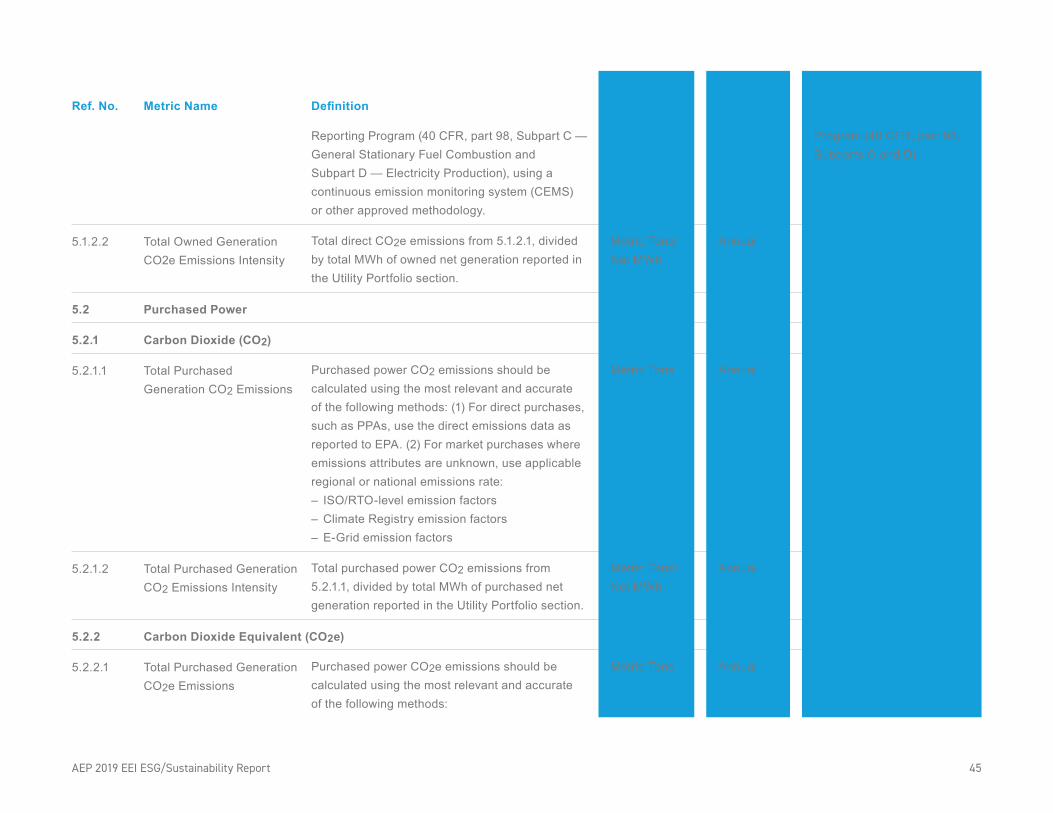
Total direct CO2 emissions from 5.1.1.1, divided by total MWh of owned net generation reported in the Utility Portfolio section.
Total direct CO2e emissions (CO2, CH4, & N2O) from company equity-owned fossil fuel combustion generation in accordance with EPA’s GHG
AEP 2019 EEI ESG/Sustainability Report 44
Number of End of Year end-use retail customers receiving electricity (individual homes and businesses count as one).
Metric Tons Annual
Metric Tons/ Annual Net MWh
Metric Tons Annual
U.S. Energy Information Administration, Online Glossary, https://www.eia.gov/tools/glossary/.
U.S. Environmental Protection Agency, Greenhouse Gas Reporting Program (40 CFR, part 98, Subparts C and D).
U.S. Environmental Protection Agency, Greenhouse Gas Reporting
Units Time Ref. No. Metric Name Definition Reported in Period Reference to Source
5.1.2.2 Total Owned Generation CO2e Emissions Intensity
5.2 Purchased Power
5.2.1 Carbon Dioxide (CO2)
5.2.1.1 Total Purchased Generation CO2 Emissions
5.2.1.2 Total Purchased Generation CO2 Emissions Intensity
5.2.2 Carbon Dioxide Equivalent (CO2e)
5.2.2.1 Total Purchased Generation CO2e Emissions
Reporting Program (40 CFR, part 98, Subpart C — General Stationary Fuel Combustion and Subpart D — Electricity Production), using a continuous emission monitoring system (CEMS) or other approved methodology.
Total direct CO2e emissions from 5.1.2.1, divided by total MWh of owned net generation reported in the Utility Portfolio section.
Purchased power CO2 emissions should be calculated using the most relevant and accurate of the following methods: (1) For direct purchases, such as PPAs, use the direct emissions data as reported to EPA. (2) For market purchases where emissions attributes are unknown, use applicable regional or national emissions rate: – ISO/RTO-level emission factors – Climate Registry emission factors – E-Grid emission factors
Total purchased power CO2 emissions from 5.2.1.1, divided by total MWh of purchased net generation reported in the Utility Portfolio section.
Purchased power CO2e emissions should be calculated using the most relevant and accurate of the following methods:
AEP 2019 EEI ESG/Sustainability Report 45
Metric Tons/ Annual Net MWh
Metric Tons Annual
Metric Tons/ Annual Net MWh
Metric Tons Annual
Program (40 CFR, part 98, Subparts C and D).

Units Time Ref. No. Metric Name Definition Reported in Period Reference to Source
5.2.2.2 Total Purchased Generation CO2e Emissions Intensity
5.3 Owned Generation + Purchased Power
5.3.1 Carbon Dioxide (CO2)
5.3.1.1 Total Owned + Purchased Generation CO2 Emissions
5.3.1.2 Total Owned + Purchased Generation CO2 Emissions Intensity
5.3.2 Carbon Dioxide Equivalent (CO2e)
5.3.2.1 Total Owned + Purchased Generation CO2e Emission
5.3.2.2 Total Owned + Purchased Generation CO2e Emissions Intensity
(1) For direct purchases, such as PPAs, use the direct emissions data as reported to EPA. (2) For market purchases where emissions attributes are unknown, use applicable regional or national emissions rate: – ISO/RTO-level emission factors – Climate Registry emission factors – E-Grid emission factors
Total purchased power CO2e emissions from 5.2.2.1, divided by total MWh of purchased net generation reported in the Utility Portfolio section.
Sum of total CO2 emissions reported under 5.1.1.1 and 5.2.1.1.
Total emissions from 5.3.1.1, divided by total MWh of owned and purchased net generation reported in the Utility Portfolio section.
Sum of total CO2e emissions reported under 5.1.2.1 and 5.2.2.1.
Total emissions from 5.3.2.1, divided by total MWh of owned and purchased net generation reported in the Utility Portfolio section.
AEP 2019 EEI ESG/Sustainability Report 46
Metric Tons/ Annual Net MWh
Metric Tons Annual
Metric Tons/ Annual Net MWh
Metric Tons Annual
Metric Tons/ Annual Net MWh

Units Time Ref. No. Metric Name Definition Reported in Period Reference to Source
5.4 Non-Generation CO2e Emissions
5.4.1 Fugitive CO2e emissions ofsulfurhexafluoride
5.4.2 Fugitive CO2e emissions fromnaturalgasdistribution
6 Nitrogen Oxide (NOx), Sulfur Dioxide (SO2), Mercury (Hg)
6.1 Generationbasisfor calculation
6.2 Nitrogen Oxide (NOx)
6.2.1 Total NOx Emissions
6.2.2 Total NOx Emissions Intensity
Total fugitive CO2e emissions of sulfur hexafluoride in accordance with EPA’s GHG Reporting Program (40 CFR Part 98, Subpart DD).
Total fugitive CO2e emissions from natural gas distribution in accordance with EPA’s GHG Reporting Program (40 CFR Part 98, Subpart W
Indicate the generation basis for calculating SO2, NOx, and Hg emissions and intensity. Fossil: Fossil Fuel Generation Only Total: Total System Generation Other: Other (please specify in comment section)
Total NOx emissions from company equity-owned fossil fuel combustion generation. In accordance with EPA’s Acid Rain Reporting Program (40 CFR, part 75) or regulatory equivalent.
Total from above, divided by the MWh of generation basis as indicated in 6.1.
AEP 2019 EEI ESG/Sustainability Report 47
Metric Tons Annual
Metric Tons Annual
Metric Tons Annual
Metric Tons/ Annual Net MWh
U.S. Environmental Protection Agency, Greenhouse Gas Reporting Program (40 CFR, part 98, Subpart DD).
U.S. Environmental Protection Agency, Greenhouse Gas Reporting Program (40 CFR, part 98, Subpart W).
U.S. Environmental Protection Agency, Acid Rain Reporting Program (40 CFR, part 75).

Units Time Ref. No. Metric Name Definition Reported in Period Reference to Source
6.3 Sulfur Dioxide (SO2)
6.3.1 Total SO2 Emissions
6.3.2 Total SO2 Emissions Intensity
6.4 Mercury (Hg)
6.4.1 Total Hg Emissions
6.4.2 Total Hg Emissions Intensity
Resources 7 Human Resources
7.1 Total Number of Employees
Total SO2 emissions from company equity-owned fossil fuel combustion generation. In accordance with EPA’s Acid Rain Reporting Program (40 CFR, part 75) or regulatory equivalent.
Total from above, divided by the MWh of generation basis as indicated in 6.1.
Total Mercury emissions from company equity-owned fossil fuel combustion generation. Preferred methods of measurement are performance-based, direct measurement as outlined in the EPA Mercury and Air Toxics Standard (MATS). In the absence of performance-based measures, report value aligned with Toxics Release Inventory (TRI) or regulatory equivalent for international operations.
Total from above, divided by the MWh of generation basis as indicated in 6.1.
Average number of employees over the year. To calculate the annual average number of employees: (1) Calculate the total number of employees your establishment paid for all periods. Add the number of employees your establishment paid in every pay period during the data year. Count all employees that you paid at any time during the
AEP 2019 EEI ESG/Sustainability Report 48
Metric Tons Annual
Metric Tons/ Annual Net MWh
Kilograms Annual
Kilograms/ Annual Net MWh
Number of Annual Employees
U.S. Environmental Protection Agency, Acid Rain Reporting Program (40 CFR, part 75).
EPRI, Metrics to Benchmark Electric Power Company Sustainability Performance, 2018 Technical Report.
U.S. Department of Labor, Bureau of Labor Statistics, Steps to estimate annual average number of employees, www.bls.gov/respondents/iif/annualavghours.htm.
Units Time Ref. No. Metric Name Definition Reported in Period Reference to Source
7.2 Total Number of Board of Directors/Trustees
7.3 Total Women on Board of Directors/Trustees
7.4 Total Minorities on Board of Directors/Trustees
year and include full-time, part-time, temporary, seasonal, salaried, and hourly workers. Note that pay periods could be monthly, weekly, bi-weekly, and so on. (2) Divide the total number of employees (from step 1) by the number of pay periods your establishment had in during the data year. Be sure to count any pay periods when you had no (zero) employees. (3) Round the answer you computed in step 2 to the next highest whole number.
Average number of employees on the Board of Directors/Trustees over the year.
Total number of women (defined as employees who identify as female) on Board of Directors/Trustees
Total number of minorities on Board of Directors/Trustees. Minority employees are defined as “the smaller part of a group. A group within a country or state that differs in race, religion or national origin from the dominant group. Minority is used to mean four particular groups who share a race, color or national origin.” These groups are: “(1) American Indian or Alaskan Native. A person having origins in any of the original peoples of North America, and who maintain their culture through a tribe or
AEP 2019 EEI ESG/Sustainability Report 49
Number of Annual Employees
Number of Annual Employees
Number of Annual Employees
EPRI, Metrics to Benchmark Electric Power Company Sustainability Performance, 2018 Technical Report.
U.S. Equal Employment Opportunity Commission, EEO Terminology, www.archives.gov/eeo/terminology.html. EPRI, Metrics to Benchmark Electric Power Company Sustainability Performance, 2018 Technical Report.
U.S. Equal Employment Opportunity Commission, EEO Terminology, www.archives.gov/eeo/terminology.html. EPRI, Metrics to Benchmark Electric Power Company Sustainability Performance, 2018 Technical Report.

Units Time Ref. No. Metric Name Definition Reported in Period Reference to Source
7.5 Employee Safety Metrics
7.5.1 Recordable Incident Rate
community; (2) Asian or Pacific Islander. A person having origins in any of the original people of the Far East, Southeast Asia, India, or the Pacific Islands. These areas include, for example, China, India, Korea, the Philippine Islands, and Samoa; (3) Black (except Hispanic). A person having origins in any of the black racial groups of Africa; (4) Hispanic. A person of Mexican, Puerto Rican, Cuban, Central or South American, or other Spanish culture or origin, regardless of race.”
Number of injuries or illnesses x 200,000/Number of employee labor hours worked. Injury or illness is recordable if it results in any of the following: death, days away from work, restricted work or transfer to another job, medical treatment beyond first aid, or loss of consciousness. You must also consider a case to meet the general recording criteria if it involves a significant injury or illness diagnosed by a physician or other licensed health care professional, even if it does not result in death, days away from work, restricted work or job transfer, medical treatment beyond first aid, or loss of consciousness. Record the injuries and illnesses of all employees on your payroll, whether they are labor, executive, hourly, salary, part-time, seasonal, or migrant workers. You also must record the recordable injuries and illnesses that occur to employees who are not on your payroll if you supervise these employees on a day-to-
AEP 2019 EEI ESG/Sustainability Report 50
Percent Annual
U.S. Department of Labor, Occupational Health and Safety Administration, OSHA Recordable Incidents. EPRI, Metrics to Benchmark Electric Power Company Sustainability Performance, 2018 Technical Report.

Units Time Ref. No. Metric Name Definition Reported in Period Reference to Source
7.5.2 Lost-time Case Rate
7.5.3 Days Away, Restricted, & Transfer (DART) Rate
day basis. If your business is organized as a sole proprietorship or partnership, the owner or partners are not considered employees for recordkeeping purposes. For temporary employees, you must record these injuries and illnesses if you supervise these employees on a day-to-day basis. If the contractor’s employee is under the day-to-day supervision of the contractor, the contractor is responsible for recording the injury or illness. If you supervise the contractor employee’s work on a day-to-day basis, you must record the injury or illness.
Calculated as: Number of lost-time cases x 200,000/Number of employee labor hours worked. Only report for employees of the company as defined for the “recordable incident rate for employees” metric. A lost-time incident is one that resulted in an employee’s inability to work the next full work day.
Calculated as: Total number of DART incidents x 200,000/Number of employee labor hours worked. A DART incident is one in which there were one or more lost days or one or more restricted days, or one that resulted in an employee transferring to a different job within the company.
AEP 2019 EEI ESG/Sustainability Report 51
Percent Annual Percent Annual
U.S. Department of Labor, Occupational Health and Safety Administration, OSHA Recordable Incidents. EPRI, Metrics to Benchmark Electric Power Company Sustainability Performance, 2018 Technical Report.
U.S. Department of Labor, Occupational Health and Safety Administration, OSHA Recordable Incidents. EPRI, Metrics to Benchmark Sustainability Performance for the Electric Power Industry, 2018 Technical Report.

Units Time Ref. No. Metric Name Definition Reported in Period Reference to Source
7.5.4 Work-related Fatalities
8 Fresh Water Resources
8.1 Water Withdrawals — Consumptive (Billions of Liters/Net MWh)
8.2 Water Withdrawals — Non-Consumptive (Billions of Liters/Net MWh)
Total employee fatalities. Record for all employees on your payroll, whether they are labor, executive, hourly, salary, part-time, seasonal, or migrant workers. Include fatalities to those that occur to employees who are not on your payroll if you supervise these employees on a day-to-day basis. For temporary employees, report fatalities if you supervise these employees on a day-to-day basis.
Rate of freshwater consumed for generation. “Freshwater” includes water sourced from fresh surface water, groundwater, rain water, and fresh municipal water. Do NOT include recycled, reclaimed, or gray water. Water consumption is defined as water that is not returned to the original water source after being withdrawn, including evaporation to the atmosphere. Divide billions of liters by equity-owned total net generation from all electric generation as reported under Metric 2, Net Generation for the data year (MWh).
Rate of fresh water withdrawn, but not consumed, for generation.“Freshwater” includes water sourced from fresh surface water, groundwater, rain water, and fresh municipal water. Do NOT include recycled, reclaimed, or gray water. Information on organizational water withdrawal may be drawn from water meters, water bills, calculations derived from other available water data or (if neither water meters nor bills or reference data exist) the organization’s own estimates. Divide billions of
AEP 2019 EEI ESG/Sustainability Report 52
Number of Annual Employees
Billions Annual of Liters/ Net MWh
Billions Annual of Liters/ Net MWh
U.S. Department of Labor, Occupational Health and Safety Administration, OSHA Recordable Incidents. EPRI, Metrics to Benchmark Electric Power Company Sustainability Performance, 2018 Technical Report.
Partially sourced from EPRI, Metrics to Benchmark Electric Power Company Sustainability Performance, 2018 Technical Report
Partially sourced from EPRI, Metrics to Benchmark Electric Power Company Sustainability Performance,2018 Technical Report.

Units Time Ref. No. Metric Name Definition Reported in Period Reference to Source
9 Waste Products
9.1 Amount of Hazardous Waste Manifested for Disposal
9.2 Percent of Coal Combustion Products BeneficiallyUsed
liters by equity-owned total net generation from all electric generation as reported under Metric 2, Net Generation for the data year (MWh).
Tons of hazardous waste, as defined by the Resource Conservation and Recovery Act (RCRA), manifested for disposal at a Treatment Storage and Disposal (TSD) facility. Methods of disposal include disposing to landfill, surface impoundment, waste pile, and land treatment units. Hazardous wastes include either listed wastes (F, K, P and U lists) or characteristic wastes (wastes which exhibit at least one of the following characteristics — ignitability, corrosivity, reactivity, toxicity).
Percent of coal combustion products (CCPs) — fly ash, bottom ash, boiler slag, flue gas desulfurization materials, scrubber bi-product — diverted from disposal into beneficial uses, including being sold. Include any CCP that is generated during the data year and stored for beneficial use in a future year. Only include CCP generated at company equity-owned facilities. If no weight data are available, estimate the weight using available information on waste density and volume collected, mass balances, or similar information.
AEP 2019 EEI ESG/Sustainability Report 53
Metric Tons Annual
Percent Annual
Partially sourced from EPRI, Metrics to Benchmark Electric Power Company Sustainability Performance, 2018 Technical Report
Partially sourced from EPRI, Metrics to Benchmark Electric Power Company Sustainability Performance, 2018 Technical Report.

CONTACTS
Bette Jo RozsaManaging Director, Investor Relations
American Electric Power614-716-2840
Sandy NessingManaging Director, Corporate Sustainability
American Electric Power614-716-2570
AEP 2019 EEI ESG/Sustainability Report 54