american international reinsurance company, ltd. and ... · reinsurance company, ltd. and its...
TRANSCRIPT

American International Reinsurance Company, Ltd. and Subsidiary
Audited GAAP Consolidated Financial Statements
December 31, 2018 and 2017

1
American International Reinsurance Company, Ltd. and Subsidiary Table of Contents
Page
FINANCIAL STATEMENTS
Report of Independent Auditors 2
Consolidated Balance Sheets at December 31, 2018 and 2017 3
Consolidated Statements of Income for the years ended December 31, 2018 and 2017 4
Consolidated Statements of Comprehensive Income (Loss) for the years ended December 31, 2018 and 2017 5
Consolidated Statements of Shareholder’s Equity for the years ended December 31, 2018 and 2017 6
Consolidated Statements of Cash Flows for the years ended December 31, 2018 and 2017 7
Notes to Consolidated Financial Statements
NOTE 1. Basis of Presentation 8
NOTE 2. Summary of Significant Accounting Policies 8
NOTE 3. Fair Value Measurements 13
NOTE 4. Investments 19
NOTE 5 Variable Interest Entities 28
NOTE 6. Deferred Policy Acquisition Costs 29
NOTE 7. Reinsurance 30
NOTE 8. Insurance Liabilities 32
NOTE 9. Income Taxes 46
NOTE 10. Related Party Transactions 48
NOTE 11. Share-based and Other Compensation Plans 49
NOTE 12. Defined Benefit Pension Plans 50
NOTE 13. Derivative Financial Instruments 52
NOTE 14. Accumulated Other Comprehensive Income 54
NOTE 15. Statutory Financial Data and Restrictions 54
NOTE 16. Commitments and Contingencies 55
NOTE 17. Subsequent Events 55

PricewaterhouseCoopers LLP, PricewaterhouseCoopers Center, 300 Madison Avenue, New York, NY 10017 T: (646) 471 3000, F: (813) 286 6000, www.pwc.com/us
Report of Independent Auditors To the Board of Directors of American International Reinsurance Company, Ltd. We have audited the accompanying consolidated financial statements of American International Reinsurance Company, Ltd. and its subsidiary (the “Company”), which comprise the consolidated balance sheets as of December 31, 2018 and 2017, and the related consolidated statements of income (loss), comprehensive income, shareholder’s equity and cash flows for the years then ended. Management's Responsibility for the Consolidated Financial Statements Management is responsible for the preparation and fair presentation of the consolidated financial statements in accordance with accounting principles generally accepted in the United States of America; this includes the design, implementation, and maintenance of internal control relevant to the preparation and fair presentation of consolidated financial statements that are free from material misstatement, whether due to fraud or error. Auditors’ Responsibility Our responsibility is to express an opinion on the consolidated financial statements based on our audits. We conducted our audits in accordance with auditing standards generally accepted in the United States of America. Those standards require that we plan and perform the audit to obtain reasonable assurance about whether the consolidated financial statements are free from material misstatement. An audit involves performing procedures to obtain audit evidence about the amounts and disclosures in the consolidated financial statements. The procedures selected depend on our judgment, including the assessment of the risks of material misstatement of the consolidated financial statements, whether due to fraud or error. In making those risk assessments, we consider internal control relevant to the Company's preparation and fair presentation of the consolidated financial statements in order to design audit procedures that are appropriate in the circumstances, but not for the purpose of expressing an opinion on the effectiveness of the Company's internal control. Accordingly, we express no such opinion. An audit also includes evaluating the appropriateness of accounting policies used and the reasonableness of significant accounting estimates made by management, as well as evaluating the overall presentation of the consolidated financial statements. We believe that the audit evidence we have obtained is sufficient and appropriate to provide a basis for our audit opinion. Opinion In our opinion, the consolidated financial statements referred to above present fairly, in all material respects, the financial position of American International Reinsurance Company, Ltd. and its subsidiary as of December 31, 2018 and 2017, and the consolidated results of their operations and their cash flows for the years then ended in accordance with accounting principles generally accepted in the United States of America.

2 of 2
Emphasis of Matter As discussed in the notes to the consolidated financial statements, the Company is a member of a group of affiliated companies and has entered into significant transactions with members of the group. Our opinion is not modified with respect to this matter. Other Matter
Accounting principles generally accepted in the United States of America require that insurance companies with short-duration insurance contracts present claims development information for the number of years for which claims incurred typically remain outstanding and paid claims to supplement the basic financial statements. Such information, although not part of the basic financial statements, is required by the Financial Accounting Standards Board who considers it to be an essential part of financial reporting for placing the basic financial statements in an appropriate operational, economic, or historical context. We have applied certain limited procedures to the required supplementary information in accordance with auditing standards generally accepted in the United States of America, which consisted of inquiries of management about the methods of preparing the information and comparing the information for consistency with management’s responses to our inquiries, the basic financial statements, and other knowledge we obtained during our audit of the basic financial statements. We do not express an opinion or provide any assurance on the information because the limited procedures do not provide us with sufficient evidence to express an opinion or provide any assurance.
New York, New York April 30, 2019

American International Reinsurance Company, Ltd. and Subsidiary Consolidated Balance Sheets
3
See accompanying Notes to Consolidated Financial Statements.
December 31, December 31,
(in millions) 2018 2017
Assets:
Investments:
Fixed maturity securities:
Bonds available for sale, at fair value (amortized cost: 2018 - $2,292; 2017 - $2,174) 2,373$ 2,356$
Other bond securities, at fair value (See Note 4) 43 56
Equity Securities:
Equity securities available for sale, at fair value (cost: 2017 - $5) - 14
Equity securities at fair value (See Note 4) 12 -
Mortgage and other loans receivable 5 -
Other invested assets 58 87
Short-term investments 263 157
Total investments 2,754 2,670
Cash 7 11
Accrued investment income 28 28
Premiums and insurance balances receivable, net of allowance 423 455
Reinsurance assets, net of allowance 2,152 3,039
Deferred income taxes 63 47
Deferred policy acquisition costs 246 168
Funds held by companies under reinsurance contracts 297 244
Other assets, including restricted cash of $10 in 2018 and $10 in 2017 667 712
Total assets 6,637$ 7,374$
Liabilities:
Liability for unpaid losses and loss adjustment expenses 1,899$ 2,029$
Unearned premiums 846 949
Future policy benefits for life and accident and health insurance contracts 1,106 1,184
Funds held under reinsurance treaties 852 929
Premiums and insurance balances payable 336 491
Other liabilities 727 824
Total liabilities 5,766$ 6,406$
Shareholder's equity:
Common stock, ($1 par value, 10,000,000 shares authorized, issued and
fully paid)10$ 10$
Additional paid-in capital 574 574
Retained earnings 166 198
Accumulated other comprehensive income 121 186
Total shareholder's equity 871$ 968$
Total liabilities and shareholder's equity 6,637$ 7,374$

American International Reinsurance Company, Ltd. and Subsidiary Consolidated Statements of Income
4
See accompanying Notes to Consolidated Financial Statements.
Years Ended December 31,
(in millions) 2018 2017
Revenues:
Premiums 1,310$ 943$
Net investment income 81 71
Net realized capital (losses) 13 (12)
Other income 26 32
Total revenues 1,430 1,034
Benefits, losses and expenses:
Policyholder benefits and losses incurred 921 602
Policy acquisition and other operating expenses 493 348
Total benefits, losses and expenses 1,414 950
Income from continuing operations before income taxes 16 84
Income tax expense 5 43
Net income 11$ 41$

American International Reinsurance Company, Ltd. and Subsidiary Consolidated Statements of Comprehensive Income (Loss)
5
See accompanying Notes to Consolidated Financial Statements.
Years Ended December 31,
(in millions) 2018 2017
Net income 11$ 41$
Other comprehensive income (loss), net of tax
Change in unrealized appreciation (depreciation) of investments (79) 19
Change in foreign currency translation adjustments 7 (18)
Change in retirement plan liability adjustments 14 1
Other comprehensive income (loss) (58) 2
Comprehensive income (loss) (47)$ 43$

American International Reinsurance Company, Ltd. and Subsidiary Consolidated Statements of Shareholder’s Equity
6
See accompanying Notes to Consolidated Financial Statements.
(in millions)
Common
Stock
Additional
Paid-in
Capital
Retained
Earnings
Accumulated
Other
Comprehensive
Income (Loss)
Total
Shareholder's
Equity
Balance, January 1, 2017 10$ 574$ 307$ 184$ 1,075$
Dividend to shareholder - - (150) - (150)
Net income - - 41 - 41
Other comprehensive income (loss) - - - 2 2
Balance, December 31, 2017 10$ 574$ 198$ 186$ 968$
Dividend to shareholder - - (50) - (50)
Net income - - 11 - 11
Cumulative effect of change in accounting - - 7 (7) -
Other comprehensive income (loss) - - - (58) (58)
Balance, December 31, 2018 10$ 574$ 166$ 121$ 871$

American International Reinsurance Company, Ltd. and Subsidiary Consolidated Statements of Cash Flows
7
See accompanying Notes to Consolidated Financial Statements.
Years Ended December 31,
(in millions) 2018 2017
Cash flows from operating activities:
Net income 11$ 41$
Adjustments to reconcile net income to net cash provided by (used in) operating activities:
Non-cash revenues, expenses, gains and losses included in income:
Net (gains) losses on sales of securities available for sale and other invested assets 14 (1)
Net unrealized (gains) losses on derivatives and other investments (27) 7
Losses from equity method investments 2 6
Amortization of deferred policy acquisition costs 296 256
Depreciation and other amortization 5 2
Changes in operating assets and liabilities:
Insurance reserves 14 324
Premiums and insurance balances receivable and payable, net (118) 8
Reinsurance assets and funds held under reinsurance treaties 430 (208)
Deferred policy acquisition costs (374) (251)
Accrued investment income 1 (2)
Current and deferred income taxes, net (16) 41
Commissions expenses and taxes payable (5) (19)
Other, net 104 80
Total adjustments 326 243
Net cash provided by (used in) operating activities 337$ 284$
Cash flows from investing activities:
Proceeds from (payments for):
Sales of fixed maturity securities available for sale 171$ 137$
Maturities of fixed maturity securities available for sale 344 313
Sales of other invested assets 11 12
Purchases of fixed maturity securities available for sale (678) (719)
Purchases of other securities (3) (56)
Maturities of other securities 11 -
Net additions to real estate, fixed assets and other assets (7) (3)
Net change in short-term investments (106) 29
Net change in derivative assets and liabilities (34) 8
Net cash provided by (used in) investing activities (291)$ (279)$
Cash flows from financing activities:
Cash dividend paid to shareholder (50)$ -$
Net cash provided by (used in) financing activities (50)$ -$
Change in cash (4)$ 5$
Cash at beginning of year 11 6
Cash at end of year 7$ 11$
Supplementary disclosure of cash flow information:
Cash 7$ 11$
Restricted cash included in other assets 10 10
Total cash and restricted cash shown in Consolidated Statement of Cash Flows 17$ 21$
Non-cash financing/investing activities:
Dividend of bonds available for sale -$ (150)$

American International Reinsurance Company, Ltd. and Subsidiary Notes to Consolidated Financial Statements
8
1. Basis of Presentation
American International Reinsurance Company, Ltd. ("AIRCO" or "the Company") is licensed in Bermuda as a Class 4 Insurer and a Class C Insurer. We are a wholly owned subsidiary of AIG Property Casualty International, LLC (“AIGPCIL” or “Parent”). AIGPCIL’s ultimate holding company is American International Group, Inc. ("AIG") which is an SEC-registered company incorporated in the state of Delaware, USA. Unless the context indicates otherwise, the terms “AIRCO”, “we”, “us” or “our” mean American International Reinsurance Company, Ltd. and its consolidated subsidiary.
We are primarily a reinsurer of general insurance and life insurance, including property and casualty, individual life, annuity and accident and health businesses. We also provide catastrophic liability solutions for excess casualty, financial lines and punitive damages, as well as risk management services to third party clients. The risk management services business consists of policies issued by or assumed by us that are subsequently ceded to the third party clients’ captive insurance company.
Effective January 1, 2015, we entered into a Managing General Agency Agreement (“MGA”) with a third party to develop and brand an assumed reinsurance platform. The platform mainly participates in property catastrophe reinsurance in targeted regions, as well as marine, casualty and aviation business. Effective January 1, 2019, the MGA agreement has been cancelled.
The consolidated financial statements include the accounts of AIRCO and its wholly owned subsidiary, American International Company Limited (“AICO”). The accompanying financial statements have been prepared in accordance with accounting principles generally accepted in the United States of America (“GAAP”). All material intercompany transactions have been eliminated.
AICO is the principal representative for certain Bermuda domiciled affiliated insurance entities and managed third party captives. AICO provides reinsurance administrative and management services to affiliated entities and third party companies. Additionally, AICO is the global employment company for AIG employees working outside of their home country on assignment.
USE OF ESTIMATES
The preparation of financial statements in conformity with GAAP requires the application of accounting policies that often involve a significant degree of judgment. Our accounting policies that are most dependent on the application of estimates and assumptions are those relating to the determination of:
• liability for unpaid losses and loss adjustment expenses (loss reserves);
• reinsurance assets;
• valuation of future policy benefit liabilities and timing and extent of loss recognition;
• recoverability of deferred policy acquisition costs;
• impairment charges, including other-than-temporary investment impairments on available for sale securities and impairments on other invested assets;
• liabilities for legal contingencies;
• fair value measurements of certain assets and liabilities; and
• income tax assets and liabilities, including recoverability of our net deferred tax asset and the predictability of future tax operating profitability of the character necessary to realize the net deferred tax asset and provisional estimates associated with the Tax Act.
These accounting estimates require the use of assumptions about matters, some of which are highly uncertain at the time of estimation. To the extent actual experience differs from the assumptions used, our consolidated financial condition, results of operations and cash flows could be materially affected.
2. Summary of Significant Accounting Policies
The following table identifies our significant accounting policies presented in other Notes to these Consolidated Financial Statements, with a reference to the Note where a detailed description can be found:
Note 4. Investments
• Fixed maturity and equity securities • Other invested assets • Short-term investments • Net investment income • Net realized capital gains (losses) • Other-than-temporary impairments Note 5. Variable Interest Entities
Note 6. Deferred Policy Acquisition Costs

American International Reinsurance Company, Ltd. and Subsidiary Notes to Consolidated Financial Statements
9
• Deferred policy acquisition costs • Amortization of deferred policy acquisition costs Note 7. Reinsurance
• Reinsurance assets – net of allowance Note 8. Insurance Liabilities
• Liability for unpaid losses and loss adjustment expenses • Future policy benefits Note 9. Income Taxes
Note 13. Derivative Financial Instruments
• Derivative assets and liabilities, at fair value Note 16. Commitments and Contingencies
• Legal contingencies
OTHER SIGNIFICANT ACCOUNTING POLICIES
Premiums for short-duration contracts are recorded as written on the inception date of the policy. Premiums for direct and assumed
short duration contracts are earned on a pro rata basis over the term of the related coverage. The reserve for unearned premiums includes the portion of premiums written and other considerations relating to the unexpired terms. Premiums for long duration insurance products and life contingent annuities are recognized as revenues when due. Estimates for premiums due but not yet collected are accrued.
Reinsurance premiums ceded for prospective reinsurance contracts are recognized as a reduction of premiums earned over the period the reinsurance coverage is provided.
Other income primarily consists of agency income of $18 million in 2018 and $18 million in 2017 for fees earned for arranging and
administering reinsurance programs, which are recognized as service is rendered. Agency income fees included $7 million and $7 million from affiliated companies for the years ended December 31, 2018 and 2017, respectively.
Cash consists of cash on hand and non-interest bearing demand deposits.
Short-term Investments consist of interest bearing equivalents, time deposits and investments with original maturities within one year
from the date of purchase. Short term investments are carried at amortized cost, which approximates fair value.
Premiums and insurance balances receivable, net of allowance consists of premium balances due from agents, brokers and
insureds. There was an allowance for doubtful accounts amount of $4 million at December 31, 2018. There was no allowance for doubtful accounts at December 31, 2017.
Deposit contracts: Risk transfer requirements must be met in order for insurance or reinsurance accounting to apply. If risk transfer
requirements are not met, the contract is accounted for as a deposit, resulting in the recognition of cash flows under the contract through a deposit asset or liability and not as revenue and related expense. To meet risk transfer requirements, a reinsurance contract must include insurance risk, consisting of both underwriting and timing risk, and provide a reasonable possibility of a significant loss for the assuming entity. Insurance contracts or assumed contracts that do not pass risk transfer are accounted for as deposit assets and liabilities.
We have entered into modified coinsurance agreements with an unaffiliated company which are accounted for on a deposit accounting basis. Deposit assets of $48 million and $54 million at December 31, 2018 and 2017, respectively, are included in Other assets. Deposit liabilities of $48 million and $54 million at December 31, 2018 and 2017, respectively, are included in Other liabilities. As amounts are paid in accordance with the underlying contracts, the deposit liability is reduced.
Funds held by companies under reinsurance contracts consist primarily of a balance due from insurance companies under
reinsurance agreements. Under the terms of the agreement, the insurance companies retained certain assets that would have been otherwise paid to us.
Other assets consist primarily of derivative assets (see Note 13), deposit assets, other fixed assets, capitalized software costs, related
party receivables and miscellaneous third party receivables. The cost of furniture and equipment is depreciated principally on the straight-line basis over its estimated useful lives (maximum of 10 years). Capitalized software costs, which represent costs directly related to obtaining, developing or upgrading internal use software, are capitalized and amortized using the straight-line method over a period generally not exceeding five years. Fixed assets and other long-lived assets are assessed for impairment when impairment indicators exist.
Funds held under reinsurance treaties consist primarily of a balance due to an affiliated insurance company under a retrocession

American International Reinsurance Company, Ltd. and Subsidiary Notes to Consolidated Financial Statements
10
agreement. Under the terms of the agreement, we retained the premium that would have been paid to the affiliated company which is to be used for the payment of claims under the original reinsurance arrangement. See Note 7 for additional information.
Premiums and insurance balances payable consist of premium balances due to reinsurers and unpaid loss and loss adjustment
expenses.
Other liabilities consist of derivative liabilities (see Note 13), a payable to AIG related to an AIG sponsored pension plan (see Note
12), deposit liabilities, post-retirement benefits, management expenses payable, salaries payable and other payables.
Payroll liabilities: We are the global employment company for AIG employees working outside of their home country on assignment.
We act as a payroll agent for affiliates of AIG. We paid payroll costs on behalf of certain affiliated companies of $82 million and $104 million in 2018 and 2017, respectively. Such amounts were reimbursed by the affiliated companies. Payroll liabilities are included in Other liabilities.
Foreign currency: Financial statement accounts expressed in foreign currencies are translated into US dollars. Functional currency
assets and liabilities are translated into US dollars generally using rates of exchange prevailing at the balance sheet date and the related translation adjustments are recorded as a separate component of accumulated other comprehensive income (loss), net of any related taxes, in total shareholder's equity. Income statement accounts expressed in functional currencies are translated using average exchange rates during the period. Financial statement accounts expressed in currencies other than the functional currency of a consolidated entity are remeasured into that entity's functional currency resulting in exchange gains or losses recorded in income.
ACCOUNTING STANDARDS ADOPTED DURING 2018
Revenue Recognition
In May 2014, the FASB issued an accounting standard that supersedes most existing revenue recognition guidance. The standard excludes from its scope the accounting for insurance contracts, leases, financial instruments, and certain other agreements that are governed under other GAAP guidance, but could affect the revenue recognition for certain of our other activities. We adopted the standard using the modified retrospective approach on its required effective date of January 1, 2018. Our analysis of revenues indicated that substantially all of our revenues were from sources excluded from the scope of the standard. For those revenue sources within the scope of the standard, there were no material changes in the timing or measurement of revenues based upon the guidance. As substantially all of our revenue sources were excluded from the scope of the standard, the adoption of the standard did not have a material impact on our reported consolidated financial condition, results of operations, cash flows or required disclosures. Recognition and Measurement of Financial Assets and Financial Liabilities
In January 2016, the FASB issued an accounting standard that requires equity investments that do not follow the equity method of accounting or are not subject to consolidation to be measured at fair value with changes in fair value recognized in earnings, while financial liabilities for which fair value option accounting has been elected, changes in fair value due to instrument-specific credit risk are presented separately in other comprehensive income. The standard allows the election to record equity investments without readily determinable fair values at cost, less impairment, adjusted for subsequent observable price changes with changes in the carrying value of the equity investments recorded in earnings. The standard also updates certain fair value disclosure requirements for financial instruments carried at amortized cost. We adopted the standard on its effective date of January 1, 2018 using the modified retrospective approach. The impact of the adoption is primarily related to the reclassification of unrealized gains of equity securities resulting in a net decrease to beginning Accumulated other comprehensive income and a corresponding net increase to beginning Retained earnings of $10 million. Classification of Certain Cash Receipts and Cash Payments
In August 2016, the FASB issued an accounting standard that addresses diversity in how certain cash receipts and cash payments are presented and classified in the statement of cash flows. The amendments provide clarity on the treatment of eight specifically defined types of cash inflows and outflows. We adopted the standard retrospectively on its effective date of January 1, 2018. The standard addresses presentation in the statement of cash flows only and did not have a material impact on our reported consolidated financial condition, results of operations or required disclosures. Intra-Entity Transfers of Assets Other than Inventory
In October 2016, the FASB issued an accounting standard that requires an entity to recognize the income tax consequences of an intra-entity transfer of an asset other than inventory when the transfer occurs, rather than when the asset is sold to a third party.
American International Reinsurance Company, Ltd. and Subsidiary Notes to Consolidated Financial Statements
11
We adopted the standard on its effective date of January 1, 2018 using a modified retrospective approach. The adoption of this standard did not have a material impact on our reported consolidated financial condition, results of operations, cash flows or required disclosures. Restricted Cash
In November 2016, the FASB issued an accounting standard that provides guidance on the presentation of restricted cash in the Consolidated Statement of Cash Flows. Entities are required to explain the changes during a reporting period in the total of cash, cash equivalents and amounts generally described as restricted cash or restricted cash equivalents in the consolidated statement of cash flows. We adopted the standard retrospectively on its effective date of January 1, 2018. The standard addresses presentation of restricted cash in the Consolidated Statement of Cash Flows only and had no impact on our reported consolidated financial condition, results of operations or required disclosures. Improving the Presentation of Net Periodic Pension and Postretirement Benefit Cost
In March 2017, the FASB issued an accounting standard that requires entities to report the service cost component of net periodic pension and postretirement benefit costs in the same line item as other compensation costs arising from services rendered by the pertinent employees during the period. The other components of net periodic benefit costs are required to be separately presented in the income statement. The amendments also allow only the service cost component to be eligible for capitalization when applicable. We adopted this standard on its effective date of January 1, 2018. The standard primarily addresses the presentation of the service cost component of net periodic benefit costs in the income statement. The standard did not have a material impact on our reported consolidated financial condition, results of operations, cash flows or required disclosures. Modification of Share-Based Payment Awards
In May 2017, the FASB issued an accounting standard that provides guidance about which changes to the terms or conditions of a share-based payment award require an entity to apply modification accounting. We prospectively adopted this standard on its effective date of January 1, 2018 and the standard did not have a material impact on our reported consolidated financial condition, results of operations, cash flows or required disclosures. Reclassification of Certain Tax Effects from Accumulated Other Comprehensive Income
In February 2018, the FASB issued an accounting standard that allows the optional reclassification of stranded tax effects within accumulated other comprehensive income to retained earnings that arise due to the enactment of the Tax Cuts and Jobs Act of 2017 (“Tax Act”). The amount of the reclassification would reflect the impact of the change in the US federal corporate income tax rate on the gross deferred tax amounts and related valuation allowances, if any, at the date of enactment of the Tax Act and other income tax effects of the Tax Act on items remaining in accumulated other comprehensive income. We adopted the standard effective January 1, 2018. The impact of the adoption of the standard resulted in an increase to beginning accumulated other comprehensive income and a corresponding decrease to beginning retained earnings of $3 million. For more information on the adoption of the Tax Act, see Note 9. FUTURE APPLICATION OF ACCOUNTING STANDARDS Leases
In February 2016, the FASB issued an accounting standard that will require lessees with lease terms of more than 12 months to recognize a right of use asset and a corresponding lease liability on their balance sheets. For income statement purposes, the FASB retained a dual model, requiring leases to be classified as either operating leases or finance leases. Lessor accounting remained largely the same, with the exception of certain specified changes. The standard is effective for annual periods beginning after December 15, 2018, and interim periods within those years, using a modified retrospective approach, and provides for certain practical expedients in transition. During 2018, the FASB issued several amendments and targeted improvements to ease with the application of the standard, including the addition of a transition approach that gives the Company the option of applying the standard at either the beginning of the earliest comparative period presented or the beginning of the period of adoption. We plan to adopt the standard on its effective date of January 1, 2019, by recognizing a cumulative-effect adjustment to the opening balance of retained earnings for leases existing at the date of adoption. We will also elect certain practical expedients that allow us not

American International Reinsurance Company, Ltd. and Subsidiary Notes to Consolidated Financial Statements
12
to reassess existing leases under the new guidance. We do not expect the standard to have a material effect on our reported consolidated financial condition, results of operations, cash flows or required disclosures. Financial Instruments - Credit Losses
In June 2016, the FASB issued an accounting standard that will change how entities account for credit losses for most financial assets, trade receivables and reinsurance receivables. The standard will replace the existing incurred loss impairment model with a new current expected credit loss model that generally will result in earlier recognition of credit losses. The standard will apply to financial assets subject to credit losses, including loans measured at amortized cost, reinsurance receivables and certain off-balance sheet credit exposures. Additionally, the impairment of available-for-sale debt securities, including purchased credit deteriorated securities, are subject to the new guidance and will be measured in a similar manner, except that losses will be recognized as allowances rather than reductions in the amortized cost of the securities. The standard will also require additional information to be disclosed in the footnotes. We plan to adopt the standard on its effective date of January 1, 2020. We are continuing to develop our implementation plan to adopt the standard and are assessing the impact of the standard on our reported consolidated financial condition, results of operations, cash flows and required disclosures. While we expect an increase in our allowances for credit losses for the financial instruments within scope of the standard, given the objective of the new standard, the amount of any change will be dependent on our portfolios’ composition and quality at the adoption date as well as economic conditions and forecasts at that time. Premium Amortization on Purchased Callable Debt Securities
In March 2017, the FASB issued an accounting standard that shortens the amortization period for certain callable debt securities held at a premium by requiring the premium to be amortized to the earliest call date. The standard does not require an accounting change for securities held at a discount, which continue to be amortized to maturity. We plan to adopt the standard retrospectively on its effective date of January 1, 2019. We do not expect the standard to have a material impact on our reported consolidated financial condition, results of operations, cash flows or required disclosures. Derivatives and Hedging
In August 2017, the FASB issued an accounting standard that improves and expands hedge accounting for both financial and commodity risks. The provisions of the amendment are intended to better align the accounting with an entity’s risk management activities, enhance the transparency on how the economic results are presented in the financial statements and the footnote, and simplify the application of hedge accounting treatment. The standard is effective on January 1, 2019, with early adoption permitted. We adopted the standard on its effective date. The standard’s impact is not material to our reported consolidated financial condition, results of operations, cash flows and required disclosures. Targeted Improvements to the Accounting for Long-Duration Contracts
In August 2018, the FASB issued an accounting standard update with the objective of making targeted improvements to the existing recognition, measurement, presentation, and disclosure requirements for long-duration contracts issued by an insurance entity. The standard prescribes significant and comprehensive changes to recognition, measurement, presentation and disclosure as summarized below:
• Requires the review and if necessary update of future policy benefit assumptions at least annually for traditional and limited pay long duration contracts, with the recognition and separate presentation of any resulting re-measurement gain or loss (except for discount rate changes as noted below) in the income statement.
• Requires the discount rate assumption to be updated at the end of each reporting period using an upper medium grade (low-credit risk) fixed income instrument yield that maximizes the use of observable market inputs and recognizes the impact of changes to discount rates in other comprehensive income.
• Simplifies the amortization of deferred acquisition costs (“DAC”) to a constant level basis over the expected term of the related contracts with adjustments for unexpected terminations, but no longer requires an impairment test.
• Requires the measurement of all market risk benefits associated with deposit (or account balance) contracts at fair value through the income statement with the exception of instrument-specific credit risk changes, which will be recognized in other comprehensive income.

American International Reinsurance Company, Ltd. and Subsidiary Notes to Consolidated Financial Statements
13
• Increased disclosures of disaggregated roll-forwards of policy benefits, account balances, market risk benefits, separate account liabilities and information about significant inputs, judgments and methods used in measurement and changes thereto and impact of those changes.
We plan to adopt the standard on its effective date of January 1, 2021. We are evaluating the method of adoption and impact of the standard on our reported consolidated financial condition, results of operations, cash flows and required disclosures. The adoption of this standard is expected to have a significant impact on our consolidated financial condition, results of operations, cash flows and required disclosures, as well as systems, processes and controls.
3. Fair Value Measurements
FAIR VALUE MEASUREMENTS ON A RECURRING BASIS
We carry certain of our financial instruments at fair value. We define the fair value of a financial instrument as the amount that would be received from the sale of an asset or paid to transfer a liability in an orderly transaction between market participants at the measurement date. We are responsible for the determination of the value of the investments carried at fair value and the supporting methodologies and assumptions. The degree of judgment used in measuring the fair value of financial instruments generally inversely correlates with the level of observable valuation inputs. We maximize the use of observable inputs and minimize the use of unobservable inputs when measuring fair value. Financial instruments with quoted prices in active markets generally have more pricing observability and less judgment is used in measuring fair value. Conversely, financial instruments for which no quoted prices are available have less observabil ity and are measured at fair value using valuation models or other pricing techniques that require more judgment. Pricing observability is affected by a number of factors, including the type of financial instrument, whether the financial instrument is new to the market and not yet established, the characteristics specific to the transaction, liquidity and general market conditions.
Fair Value Hierarchy Assets and liabilities recorded at fair value in the Consolidated Balance Sheets are measured and classified in accordance with a fair value hierarchy consisting of three “levels” based on the observability of valuation inputs:
• Level 1: Fair value measurements based on quoted prices (unadjusted) in active markets that we have the ability to access for
identical assets or liabilities. Market price data generally is obtained from exchange or dealer markets. We do not adjust the quoted price for such instruments.
• Level 2: Fair value measurements based on inputs other than quoted prices included in Level 1 that are observable for the asset
or liability, either directly or indirectly. Level 2 inputs include quoted prices for similar assets and liabilities in active markets, quoted prices for identical or similar assets or liabilities in markets that are not active, and inputs other than quoted prices that are observable for the asset or liability, such as interest rates and yield curves that are observable at commonly quoted intervals.
• Level 3: Fair value measurements based on valuation techniques that use significant inputs that are unobservable. Both
observable and unobservable inputs may be used to determine the fair values of positions classified in Level 3. The circumstances for using these measurements include those in which there is little, if any, market activity for the asset or liability. Therefore, we must make certain assumptions about the inputs a hypothetical market participant would use to value that asset or liability.
In certain cases, the inputs used to measure fair value may fall into different levels of the fair value hierarchy. In such cases, the level in the fair value hierarchy within which the fair value measurement in its entirety falls is determined based on the lowest level input that is significant to the fair value measurement in its entirety.
The following is a description of the valuation methodologies used for instruments carried at fair value. These methodologies are applied to assets and liabilities across the levels discussed above, and it is the observability of the inputs used that determines the appropriate level in the fair value hierarchy for the respective asset or liability.
VALUATION METHODOLOGIES OF FINANCIAL INSTRUMENTS MEASURED AT FAIR VALUE Incorporation of Credit Risk in Fair Value Measurements
• Our own credit Risk Fair value measurements for certain liabilities incorporate our own credit risk by determining the explicit
cost for each counterparty to protect against its net credit exposure to us at the balance sheet date by reference to observable AIG CDS or cash bond spreads. We calculate the effect of credit spread changes using discounted cash flow techniques that

American International Reinsurance Company, Ltd. and Subsidiary Notes to Consolidated Financial Statements
14
incorporate current market interest rates. A derivative counterparty’s net credit exposure to us is determined based on master netting agreements, when applicable, which take into consideration all derivative positions with us, as well as collateral we post with the counterparty at the balance sheet date
• Counterparty Credit Risk Fair value measurements for freestanding derivatives incorporate counterparty credit by
determining the explicit cost for us to protect against our net credit exposure to each counterparty at the balance sheet date by reference to observable counterparty CDS spreads, when available. When not available, other directly or indirectly observable credit spreads will be used to derive the best estimates of the counterparty spreads. Our net credit exposure to a counterparty is determined based on master netting agreements, which take into consideration all derivative positions with the counterparty, as well as collateral posted by the counterparty at the balance sheet date.
Fair values for fixed maturity securities based on observable market prices for identical or similar instruments implicitly incorporate counterparty credit risk. Fair values for fixed maturity securities based on internal models incorporate counterparty credit risk by using discount rates that take into consideration cash issuance spreads for similar instruments or other observable information. For fair values measured based on internal models, the cost of credit protection is determined under a discounted present value approach considering the market levels for single name CDS spreads for each specific counterparty, the mid-market value of the net exposure (reflecting the amount of protection required) and the weighted average life of the net exposure. CDS spreads are provided to us by an independent third party. We utilize an interest rate based on the benchmark London Interbank Offered Rate (LIBOR) curve to derive our discount rates. While this approach does not explicitly consider all potential future behavior of the derivative transactions or potential future changes in valuation inputs, we believe this approach provides a reasonable estimate of the fair value of the assets and liabilities, including consideration of the impact of non-performance risk. Fixed Maturity Securities Whenever available, we obtain quoted prices in active markets for identical assets at the balance sheet date to measure fixed maturity securities at fair value. Market price data is generally obtained from dealer markets.
We employ independent third-party valuation service providers to gather, analyze, and interpret market information to derive fair value estimates for individual investments, based upon market-accepted methodologies and assumptions. The methodologies used by these independent third-party valuation service providers are reviewed and understood by management, through periodic discussion with and information provided by the independent third-party valuation service providers. In addition, as discussed further below, control processes are applied to the fair values received from independent third-party valuation service providers to ensure the accuracy of these values.
Valuation service providers typically obtain data about market transactions and other key valuation model inputs from multiple sources and, through the use of market-accepted valuation methodologies, which may utilize matrix pricing, financial models, accompanying model inputs and various assumptions, provide a single fair value measurement for individual securities. The inputs used by the valuation service providers include, but are not limited to, market prices from completed transactions for identical securities and transactions for comparable securities, benchmark yields, interest rate yield curves, credit spreads, prepayment rates, default rates, recovery assumptions, currency rates, quoted prices for similar securities and other market-observable information, as applicable. If fair value is determined using financial models, these models generally take into account, among other things, market observable information as of the measurement date as well as the specific attributes of the security being valued, including its term, interest rate, credit rating, industry sector, and when applicable, collateral quality and other security or issuer-specific information. When market transactions or other market observable data is limited, the extent to which judgment is applied in determining fair value is greatly increased.
We have control processes designed to ensure that the fair values received from independent third-party valuation service providers are accurately recorded, that their data inputs and valuation techniques are appropriate and consistently applied and that the assumptions used appear reasonable and consistent with the objective of determining fair value. We assess the reasonableness of individual security values received from independent third-party valuation service providers through various analytical techniques, and have procedures to escalate related questions internally and to the independent third-party valuation service providers for resolution. To assess the degree of pricing consensus among various valuation service providers for specific asset types, we conduct comparisons of prices received from available sources. We use these comparisons to establish a hierarchy for the fair values received from independent third-party valuation service providers to be used for particular security classes. We also validate prices for selected securities through reviews by members of management who have relevant expertise and who are independent of those charged with executing investing transactions.
When our independent third-party valuation service providers are unable to obtain sufficient market observable information upon which to estimate the fair value for a particular security, fair value is determined either by requesting brokers who are knowledgeable about these securities to provide a price quote, which is generally non-binding, or by employing market accepted valuation models. Broker

American International Reinsurance Company, Ltd. and Subsidiary Notes to Consolidated Financial Statements
15
prices may be based on an income approach, which converts expected future cash flows to a single present value amount, with specific consideration of inputs relevant to particular security types. For structured securities, such inputs may include ratings, collateral types, geographic concentrations, underlying loan vintages, loan delinquencies and defaults, loss severity assumptions, prepayments, and weighted average coupons and maturities. When the volume or level of market activity for a security is limited, certain inputs used to determine fair value may not be observable in the market. Broker prices may also be based on a market approach that considers recent transactions involving identical or similar securities. Fair values provided by brokers are subject to similar control processes to those noted above for fair values from independent third-party valuation service providers, including management reviews. For those corporate debt instruments (for example, private placements) that are not traded in active markets or that are subject to transfer restrictions, valuations reflect illiquidity and non-transferability, based on available market evidence. When observable price quotations are not available, fair value is determined based on discounted cash flow models using discount rates based on credit spreads, yields or price levels of comparable securities, adjusted for illiquidity and structure. Fair values determined internally are also subject to management review to ensure that valuation models and related inputs are reasonable. The methodology above is relevant for all fixed maturity securities including residential mortgage backed securities (“RMBS”), commercial mortgage backed securities (“CMBS”), collateralized debt obligations (“CDO”), other asset backed securities (“ABS”) and fixed maturity securities issued by government sponsored entities, government and corporate entities.
Equity Securities Traded in Active Markets Whenever available, we obtain quoted prices in active markets for identical assets at the balance sheet date to measure equity securities at fair value. Market price data generally is obtained from exchange or dealer markets.
Short-term Investments For short-term investments that are measured at amortized cost, the carrying amounts of these assets approximate fair values because of the relatively short period of time between origination and expected realization, and their limited exposure to credit risk.
Other Invested Assets
We initially estimate the fair value of investments in certain private equity funds and other investment partnerships by reference to the transaction price. Subsequently, we generally obtain the fair value of these investments from net asset value information provided by the general partner or manager of the investments, the financial statements of which are generally audited annually. We consider observable market data and perform certain control procedures to validate the appropriateness of using the net asset value as a fair value measurement. The fair values of other investments carried at fair value, such as direct private equity holdings, are initially determined based on transaction price and are subsequently estimated based on available evidence such as market transactions in similar instruments, other financing transactions of the issuer and other available financial information for the issuer, with adjustments made to reflect illiquidity as appropriate.
Freestanding Derivatives – Other Assets and Other Liabilities Derivative assets and liabilities are traded over-the-counter (“OTC”). OTC derivatives are valued using market transactions and other market evidence whenever possible, including market based inputs to models, model calibration to market clearing transactions, broker or dealer quotations or alternative pricing sources with reasonable levels of price transparency. When models are used, the selection of a particular model to value an OTC derivative depends on the contractual terms of, and specific risks inherent in, the instrument, as well as the availability of pricing information in the market. We generally use similar models to value similar instruments. Valuation models require a variety of inputs, including contractual terms, market prices and rates, yield curves, credit curves, measures of volatility, prepayment rates and correlations of such inputs. For OTC derivatives that trade in liquid markets, such as generic forwards, swaps and options, model inputs can generally be corroborated by observable market data by correlation or other means, and model selection does not involve significant management judgment.

American International Reinsurance Company, Ltd. and Subsidiary Notes to Consolidated Financial Statements
16
ASSETS AND LIABILITIES MEASURED AT FAIR VALUE ON A RECURRING BASIS
The following table presents information about assets and liabilities measured at fair value on a recurring basis and indicate the level of the fair value measurement based on the levels of the inputs used:
December 31, 2018
(in millions) Level 1 Level 2 Level 3 Total
Assets:
Bonds available for sale:
US government and US government sponsored entities -$ -$ -$ -$ -$
Non US governments - 234 - - 234
Corporate debt - 1,598 - - 1,598
CDO/ABS - 106 24 - 130
RMBS - 114 150 - 264
CMBS - 103 44 - 147
Total bonds available for sale - 2,155 218 - 2,373
Other bond securities:
CDO/ABS - 14 - - 14
RMBS - - 2 - 2
CMBS - 22 5 - 27
Total other bonds securities - 36 7 - 43
Equity securities(b):
Mutual funds 12 - - - 12
Total equity securities 12 - - - 12
Short term investments 263 - - - 263
Other invested assets - 20 - - 20
Derivative assets - 549 - (523) 26
Total 275$ 2,760$ 225$ (523)$ 2,737$
Liabilities:
Total derivative liabilities -$ (156)$ -$ (156)$ -$
Counterparty
Netting and Cash
Collateral (a)

American International Reinsurance Company, Ltd. and Subsidiary Notes to Consolidated Financial Statements
17
(a) Counterparty netting represents netting of derivative exposures covered by a qualifying master netting agreement. See Note 13 for additional information.
(b) As a result of the adoption of the Recognition and Measurement of Financial Assets and Financial Liabilities standard on January 1, 2018 (Financial Instruments Recognition and Measurement Standard), equity securities are no longer classified and accounted for as available for sale securities.
TRANSFERS OF LEVEL 1 AND LEVEL 2 ASSETS AND LIABILITIES Our policy is to record transfers assets and liabilities between Level 1 and Level 2 at their fair values as of the end of each reporting period, consistent with the date of the determination of the fair value. Assets are transferred out of Level 1 when they are no longer transacted with sufficient frequency and volume in an active market. We had $3 million and no transfers from Level 1 to Level 2 during the years ended December 31, 2018 and 2017, respectively. Conversely, assets are transferred from Level 2 to Level 1 when transaction volume and frequency are indicative of an active market. We had no transfers from Level 2 to Level 1 during the years ended December 31, 2018 and 2017.
December 31, 2017
(in millions) Level 1 Level 2 Level 3 Total
Assets:
Bonds available for sale:
US government and US government sponsored entities -$ -$ -$ -$ -$
Non US governments 3 284 - - 287
Corporate debt - 1,571 - - 1,571
CDO/ABS - 127 10 - 137
RMBS - 127 110 - 237
CMBS - 124 - - 124
Total bonds available for sale 3 2,233 120 - 2,356
Other bond securities:
CDO/ABS - 17 - - 17
RMBS - - 2 - 2
CMBS - 37 - - 37
Total other bonds securities - 54 2 - 56
Equity securities available for sale:
Mutual funds 14 - - - 14
Total equity securities available for sale 14 - - - 14
Short term investments 157 - - - 157
Other invested assets - 48 - - 48
Derivative assets - 643 - (632) 11
Total 174$ 2,978$ 122$ (632)$ 2,642$
Liabilities:
Total derivative liabilities -$ (193)$ -$ (193)$ -$
Counterparty
Netting and Cash
Collateral (a)

American International Reinsurance Company, Ltd. and Subsidiary Notes to Consolidated Financial Statements
18
CHANGES IN LEVEL 3 RECURRING FAIR VALUE MEASUREMENTS The following tables present changes during the years ended December 31, 2018 and 2017 in Level 3 assets measured at fair value on a recurring basis, and the realized and unrealized gains (losses) related to the Level 3 assets in the Consolidated Balance Sheets at December 31, 2018 and 2017:
Transfers of Level 3 Assets We record transfers of assets into or out of Level 3 at their fair values as of the end of each reporting period, consistent with the date of the determination of fair value. There were transfers in of $24 million and transfers out of $1 million during the year ended December 31, 2018. There were transfers in of $11 million and transfers out of $92 million during the year ended December 31, 2017.
December 31, 2018
(in millions)
Fair Value
Beginning
of Year
Net Realized
and Unrealized
Gains (Losses)
Included in
Income
Other
Comprehensive
Income (Loss)
Purchases, Sales,
Issuances and
Settlements, Net
Gross
Transfers In
Gross
Transfers Out
Fair Value
End of Year
Changes in
Unrealized Gains
(Losses)
Included in
Income on
Instruments Held
at End of Year
Assets:
Bonds available for sale:
Corporate debt -$ -$ -$ 1$ -$ (1)$ -$ -$
RMBS 110 - (5) 45 - - 150 -
CMBS - - - 25 19 - 44 -
CDO/ABS 10 - - 14 - - 24 -
Total bonds available for sale 120 - (5) 85 19 (1) 218 -
Other bond securities:
RMBS 2 - - - - - 2 -
CMBS - - - - 5 - 5 -
Total other bond securities 2 - - - 5 - 7 -
Total 122$ -$ (5)$ 85$ 24$ (1)$ 225$ -$
December 31, 2017
(in millions)
Fair Value
Beginning
of Year
Net Realized
and Unrealized
Gains (Losses)
Included in
Income
Other
Comprehensive
Income (Loss)
Purchases, Sales,
Issuances and
Settlements, Net
Gross
Transfers In
Gross
Transfers Out
Fair Value
End of Year
Changes in
Unrealized Gains
(Losses)
Included in
Income on
Instruments Held
at End of Year
Assets:
Bonds available for sale:
RMBS 48$ 9$ 4$ 38$ 11$ -$ 110$ -$
CMBS 5 - - - - (5) - -
CDO/ABS - - - 10 - - 10 -
Total bonds available for sale 53 9 4 48 11 (5) 120 -
Other bond securities:
RMBS - - - 2 - - 2 -
CMBS - - 2 22 - (24) - 2
Total other bond securities - - 2 24 - (24) 2 2
Other invested assets 63 - - - - (63) - -
Total 116$ 9$ 6$ 72$ 11$ (92)$ 122$ 2$

American International Reinsurance Company, Ltd. and Subsidiary Notes to Consolidated Financial Statements
19
QUANTITATIVE INFORMATION ABOUT LEVEL 3 FAIR VALUE MEASUREMENTS The table below presents information about the significant unobservable inputs used for recurring fair value measurements for certain Level 3 instruments, and includes only those instruments for which information about the inputs is reasonably available to us, such as data from independent third-party valuation service providers and from internal valuation models. Because input information from third-parties with respect to certain Level 3 instruments (primarily CDO/ABS) may not be reasonably available to us, balances shown below may not equal total amounts reported for such Level 3 assets:
a) Information received from third-party valuation service providers. The ranges of the unobservable inputs for constant prepayment rate, loss severity and constant default rate relate to each of the individual underlying mortgage loans that comprise the entire portfolio of securities in the RMBS and CDO securitization vehicles and not necessarily to the securitization vehicle bonds (tranches) purchased by us. The ranges of these inputs do not directly correlate to changes in the fair values of the tranches purchased by us, because there are other factors relevant to the fair values of specific tranches owned by us including, but not limited to, purchase price, position in the waterfall, senior versus subordinated position and attachment points. Represents discount rates, estimates and assumptions that we believe would be used by market participants when valuing these assets and liabilities.
FAIR VALUE MEASUREMENTS ON A NON-RECURRING BASIS We have no assets measured at fair value on a non-recurring basis during the years ended December 31, 2018 and 2017.
4. Investments
FIXED MATURITY AND EQUITY SECURITIES
Bonds held to maturity are carried at amortized cost when we have the ability and positive intent to hold these securities until maturity. When we do not have the ability or positive intent to hold bonds until maturity, these securities are classified as available for sale or are measured at fair value at our election. None of our bonds met the criteria for held to maturity classification at December 31, 2018 or 2017.
On January 1, 2018, we adopted ASU 2016-01, the Financial Instruments Recognition and Measurement standard for equity securities which eliminates the available for sale classification and treatment for equity securities. As a result, equity securities that do not follow the equity method of accounting, are measured at fair value with changes in fair value recognized in earnings. Prior to the adoption of this standard, unrealized gains and losses from available for sale investments in fixed maturity and equity securities carried at fair value were reported as a separate component of Accumulated other comprehensive income, net of deferred income taxes, in shareholder’s equity. Realized and unrealized gains and losses from fixed maturity and equity securities measured at
(in millions)
Assets
RMBS(a) 97$ Discounted cash flow Constant prepayment rate 4.82 %-11.82 % (8.32 %)
Constant default rate 0.77 %-6.22 % (3.49 %)
Severity 31.70 %-83.55 % (57.62 %)
Yield 2.89 % - 4.87 % (3.88 %)
CDO/ABS(a) 24$ Discounted cash flow Yield 3.76 % - 4.61 % (4.18 %)
Fair Value at
December 31, 2018 Valuation Technique Unobservable Input(b) Range (Weighted Average)
(in millions)
Assets
RMBS(a) 93$ Discounted cash flow Constant prepayment rate 5.1 %-11.3 % (8.20 %)
Constant default rate 1.08 %-8.16 % (4.62 %)
Severity 29.22 %-78.22 % (54.11 %)
Yield 2.08 % - 4 % (3.04 %)
CDO/ABS(a) 10 Discounted cash flow Yield 3.42 % - 4.41 % (3.91 %)
Fair Value at
December 31, 2017 Valuation Technique Unobservable Input(b) Range (Weighted Average)
American International Reinsurance Company, Ltd. and Subsidiary Notes to Consolidated Financial Statements
20
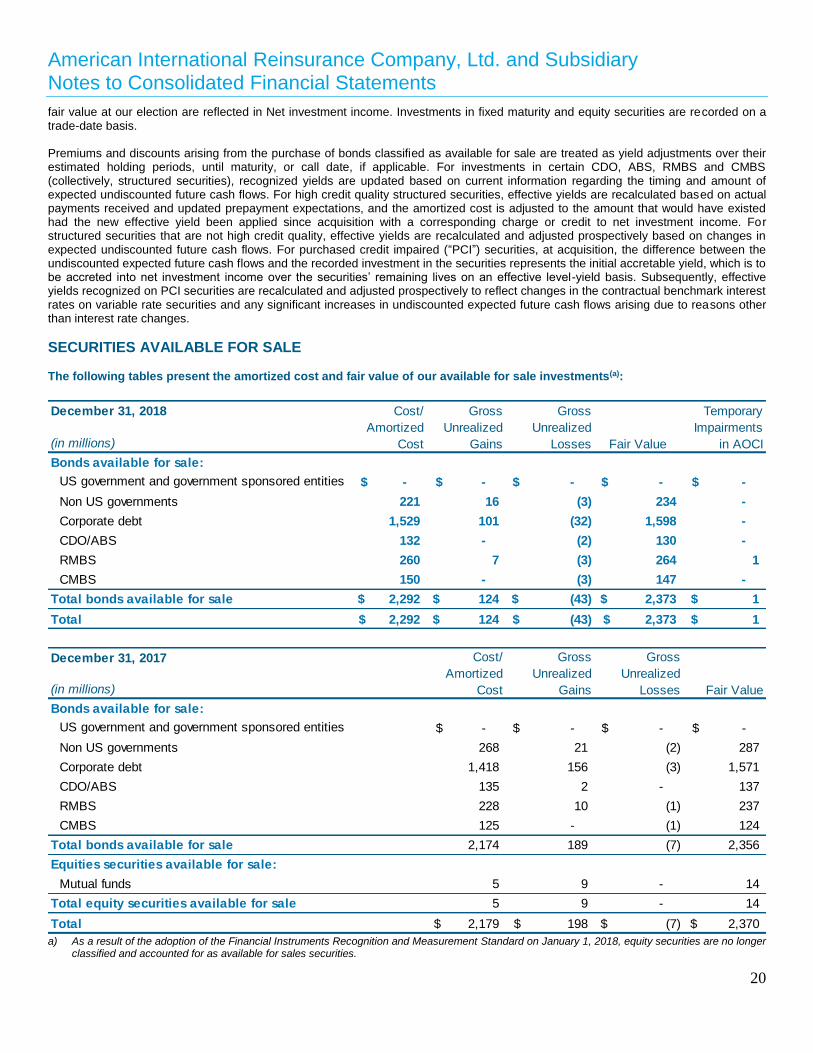
fair value at our election are reflected in Net investment income. Investments in fixed maturity and equity securities are recorded on a trade-date basis. Premiums and discounts arising from the purchase of bonds classified as available for sale are treated as yield adjustments over their estimated holding periods, until maturity, or call date, if applicable. For investments in certain CDO, ABS, RMBS and CMBS (collectively, structured securities), recognized yields are updated based on current information regarding the timing and amount of expected undiscounted future cash flows. For high credit quality structured securities, effective yields are recalculated based on actual payments received and updated prepayment expectations, and the amortized cost is adjusted to the amount that would have existed had the new effective yield been applied since acquisition with a corresponding charge or credit to net investment income. For structured securities that are not high credit quality, effective yields are recalculated and adjusted prospectively based on changes in expected undiscounted future cash flows. For purchased credit impaired (“PCI”) securities, at acquisition, the difference between the undiscounted expected future cash flows and the recorded investment in the securities represents the initial accretable yield, which is to be accreted into net investment income over the securities’ remaining lives on an effective level-yield basis. Subsequently, effective yields recognized on PCI securities are recalculated and adjusted prospectively to reflect changes in the contractual benchmark interest rates on variable rate securities and any significant increases in undiscounted expected future cash flows arising due to reasons other than interest rate changes.
SECURITIES AVAILABLE FOR SALE The following tables present the amortized cost and fair value of our available for sale investments(a):
a) As a result of the adoption of the Financial Instruments Recognition and Measurement Standard on January 1, 2018, equity securities are no longer
classified and accounted for as available for sales securities.
December 31, 2018
(in millions)
Bonds available for sale:
US government and government sponsored entities -$ -$ -$ -$ -$
Non US governments 221 16 (3) 234 -
Corporate debt 1,529 101 (32) 1,598 -
CDO/ABS 132 - (2) 130 -
RMBS 260 7 (3) 264 1
CMBS 150 - (3) 147 -
Total bonds available for sale 2,292$ 124$ (43)$ 2,373$ 1$
Total 2,292$ 124$ (43)$ 2,373$ 1$
Fair Value
Cost/
Amortized
Cost
Gross
Unrealized
Gains
Gross
Unrealized
Losses
Other-Than-
Temporary
Impairments
in AOCI
December 31, 2017
(in millions)
Bonds available for sale:
US government and government sponsored entities -$ -$ -$ -$
Non US governments 268 21 (2) 287
Corporate debt 1,418 156 (3) 1,571
CDO/ABS 135 2 - 137
RMBS 228 10 (1) 237
CMBS 125 - (1) 124
Total bonds available for sale 2,174 189 (7) 2,356
Equities securities available for sale:
Mutual funds 5 9 - 14
Total equity securities available for sale 5 9 - 14
Total 2,179$ 198$ (7)$ 2,370$
Cost/
Amortized
Cost
Gross
Unrealized
Gains
Gross
Unrealized
Losses Fair Value

American International Reinsurance Company, Ltd. and Subsidiary Notes to Consolidated Financial Statements
21
Certain assets are subject to a security agreement between us and a third party which support our obligations in relation to a closed block of deferred annuities assumed by us from that third party. Under the terms of the agreement, the subject assets are assigned as security for payment and discharge of all obligations from us to the third party. The total assets subject to this agreement were $849 million and $925 million as of December 31, 2018 and 2017, respectively. See Note 7 for additional information.
Securities Available for Sale in a Loss Position
The following table summarizes the fair value and gross unrealized losses on our available for sale securities, aggregated by major investment category and length of time that individual securities have been in a continuous unrealized loss position(a):
a) As a result of the adoption of the Financial Instruments Recognition and Measurement Standard on January 1,2018, equity securities are no longer
classified and accounted for as available for sale securities.
At December 31, 2018, we held 371 individual bonds available for sale that were in an unrealized loss position, of which 94 individual bonds available for sale were in an unrealized loss position for a continuous period of 12 months or longer. At December 31, 2017, we held 291 individual bonds available for sale that were in an unrealized loss position, of which 23 individual bonds available for sale were in an unrealized loss position for a continuous period of 12 months or longer. We did not recognize the unrealized losses on these bonds available for sale in earnings for the years ended December 31, 2018 or 2017, because management neither intends to sell the securities nor does it believe that it is more likely than not that it will be required to sell these securities before recovery of their amortized cost or cost basis. Furthermore, management expects to recover the entire amortized cost basis of these securities. In performing this evaluation, management considered the recovery periods for securities in previous periods of broad market declines. For bonds available for sale with significant declines, management performed fundamental credit analysis on a security-by-security basis, which included consideration of credit enhancements, expected defaults on underlying collateral, review of relevant industry analyst reports and forecasts and other available market data. At December 31, 2017, there were no equity securities available for sale that were in an unrealized loss position.
(in millions) Fair Value
Gross
Unrealized
Losses Fair Value
Gross
Unrealized
Losses
Fair
Value
Gross
Unrealized
Losses
December 31, 2018
Bonds available for sale:
Non US governments 56$ (2)$ 33$ (1)$ 89$ (3)$
CDO/ABS 88 (2) 18 - 106 (2)
RMBS 86 (2) 61 (1) 147 (3)
CMBS 22 - 94 (3) 116 (3)
Corporate debt 506 (13) 269 (19) 775 (32)
Total bonds available for sale 758 (19) 475 (24) 1,233 (43)
Total 758$ (19)$ 475$ (24)$ 1,233$ (43)$
12 Months or Less More than 12 Months Total
(in millions) Fair Value
Gross
Unrealized
Losses Fair Value
Gross
Unrealized
Losses
Fair
Value
Gross
Unrealized
Losses
December 31, 2017
Bonds available for sale:
Non US governments 22$ -$ 55$ (2)$ 77$ (2)$
CDO/ABS 25 - - - 25 -
RMBS 61 (1) 18 - 79 (1)
CMBS 122 (1) 1 - 123 (1)
Corporate debt 385 (3) 4 - 389 (3)
Total bonds available for sale 615 (5) 78 (2) 693 (7)
Total 615$ (5)$ 78$ (2)$ 693$ (7)$
12 Months or Less More than 12 Months Total

American International Reinsurance Company, Ltd. and Subsidiary Notes to Consolidated Financial Statements
22
Contractual Maturities of Bonds Available for Sale
The following tables present the amortized cost and fair value of bonds available for sale by contractual maturity:
Actual maturities may differ from contractual maturities because certain borrowers have the right to call or prepay certain obligations with or without call or prepayment penalties. The following table presents the gross realized gains and gross realized losses from sales or maturities of our available for sale securities:
For the years ended December 31, 2018 and 2017 the aggregate fair value of available for sale securities sold was $171 million and $137 million, which resulted in net realized capital gains (losses) of $(2) million and $1 million, respectively.
December 31, 2018
(in millions) Amortized Cost Fair Value Amortized Cost Fair Value
Due in one year or less 119$ 121$ 40$ 40$
Due after one year through five years 807 816 427 419
Due after five years through ten years 507 517 359 338
Due after ten years 859 919 450 436
Total available for sale 2,292$ 2,373$ 1,276$ 1,233$
Total Bonds Available for Sale
Securities
Total Bonds Available for Sale
Securities in a Loss Position
December 31, 2017
(in millions) Amortized Cost Fair Value Amortized Cost Fair Value
Due in one year or less 281$ 287$ 60$ 60$
Due after one year through five years 615 637 187 184
Due after five years through ten years 427 467 162 161
Due after ten years 851 965 291 288
Total available for sale 2,174$ 2,356$ 700$ 693$
Total Bonds Available for Sale
Securities in a Loss Position
Total Bonds Available for Sale
Securities
(in millions)
Gross
Realized
Gains
Gross
Realized
Losses
Gross
Realized
Gains
Gross
Realized
Losses
Fixed maturity securities -$ (2)$ 1$ -$
Equity securities - - - -
Total -$ (2)$ 1$ -$
20172018
Years Ended December 31,

American International Reinsurance Company, Ltd. and Subsidiary Notes to Consolidated Financial Statements
23
OTHER SECURITIES MEASURED AT FAIR VALUE
The following table presents the fair value of other securities measured at fair value based on our election of the fair value option:
OTHER INVESTED ASSETS
The following table summarizes the carrying amounts of other invested assets:
a) Equity method includes private equity funds. b) Net of accumulated depreciation of $54 million and $53 million in 2018 and 2017, respectively.
Other Invested Assets Carried at Fair Value Certain private equity funds and other investment partnerships for which we have elected the fair value option are reported at fair value with changes in fair value recognized in Net investment income. Prior to January 1, 2018, other investments in private equity funds and other investment partnerships in which we do not hold aggregate interests sufficient to exercise more than minor influence over the respective partnerships were reported at fair value with changes in fair value recognized as a component of Accumulated other comprehensive income. These investments were subject to other-than- temporary impairment evaluations. There was no gross unrealized loss recorded in Accumulated other comprehensive income on such investments at December 31, 2017. Effective January 1, 2018, upon the adoption of the Financial Instruments Recognition and Measurement standard, these investments are no longer accounted for as available for sale securities. The new standard requires these investments to be measured at fair value with the change in fair value recognized in earnings. As a result, beginning in 2018, these investments are no longer subject to the other-than-temporary impairment evaluation.
Other Invested Assets – Equity Method Investments We account for private equity funds and other investment partnerships using the equity method of accounting unless our interest is so minor that we may have virtually no influence over partnership operating and financial policies, or we have elected the fair value option. Under the equity method of accounting, our carrying amount generally is our share of the net asset value of the funds or the partnerships, and changes in our share of the net asset values are recorded in Net investment income. In applying the equity method of accounting, we consistently use the most recently available financial information provided by the general partner or manager of each of
December 31,
(in millions) Fair Value Percent of Total Fair Value Percent of Total
Assets:
Other bond securities:
ABS 14$ 25% 17$ 30%
CMBS 27 49% 37 66%
RMBS 2 4% 2 4%
Total mortgage-backed, asset-backed and collaterized 43$ 78% 56$ 100%
Total other bond securities 43 78% 56 100%
Equity securities 12 22% - 0%
Total 55$ 100% 56$ 100%
20172018
December 31,
(in millions) 2018 2017
Equity method investments (a) 20$ 48$
Investment real estate(b) 38 39
Total 58$ 87$

American International Reinsurance Company, Ltd. and Subsidiary Notes to Consolidated Financial Statements
24
these investments, which is one to three months prior to the end of our reporting period. The financial statements of these investees are generally audited annually. Summarized Financial Information of Equity Method Investees The following is the aggregated summarized financial information of our equity method investees, including those for which the fair value option has been elected:
The following table presents the carrying amount and ownership percentage of equity method investments at December 31, 2018 and 2017:
Summarized financial information for these equity method investees may be presented on a lag, due to the unavailability of information for the investees at our respective balance sheet dates, and is included for the periods in which we held an equity method ownership interest.
OTHER INVESTMENTS Also included in other invested assets is property classified as a real estate investment which is reported at cost, less depreciation. We periodically assess the carrying amount of the real estate investment for purposes of determining any asset impairment. The real estate investment is assessed for impairment when impairment indicators exist.
NET INVESTMENT INCOME
Net investment income represents income primarily from the following sources: • Interest income and related expenses, including amortization of premiums and accretion of discounts with changes in the timing and
the amount of expected principal and interest cash flows reflected in yield, as applicable. • Dividend income from equity securities. • Realized and unrealized gains and losses from investments in other securities and investments for which we elected the fair value
option. • Earnings from alternative investments. • Rental income of $2 million and zero related to office space leased to an affiliate for the years ended December 31, 2018 and 2017,
respectively.
Years Ended December 31,
(in millions) 2018 2017
Operating results:
Total revenues 23$ (54)$
Total expenses (1) (14)
Net income 22$ (68)$
At December 31,
(in millions) 2018 2017
Balance sheet:
Total assets 277$ 470$
Total liabilities (78)$ (96)$
(in millions)
Carrying
Value
Ownership
Percentages
Carrying
Value
Ownership
Percentages
Equity method investments 20$ Various 48$ Various
2018 2017

American International Reinsurance Company, Ltd. and Subsidiary Notes to Consolidated Financial Statements
25
The following table presents the components of net investment income:
NET REALIZED CAPITAL GAINS AND LOSSES
Net realized capital gains and losses are determined by specific identification. The net realized capital gains and losses are generated primarily from the following sources: • Sales or full redemptions of available for sale fixed maturity securities, equity securities, real estate and other alternative investments. • Reductions to the amortized cost basis of available for sale fixed maturity securities, equity securities and certain other invested
assets for other-than-temporary impairments. • Changes in fair value of derivatives except for those instruments that are designated as hedging instruments when the change in the
fair value of the hedged item is not reported in Net realized capital gains (losses). • Exchange gains and losses resulting from foreign currency transactions.
The following table presents the components of net realized capital gains (losses):
CHANGE IN UNREALIZED APPRECIATION (DEPRECIATION) OF INVESTMENTS
The following table presents the increase (decrease) in net unrealized appreciation of our available for sale investments:
a) As a result of the adoption of the Financial Instruments Recognition and Measurement Standard on January 1, 2018, equity securities are no longer accounted for as available for sale securities.
Years Ended December 31,
(in millions) 2018 2017
Bonds available for sale, including short-term investments 71$ 82$
Other invested assets - partnerships (2) (6)
Other investments 12 (4)
Total investment income 81 72
Investment expenses - (1)
Net investment income 81$ 71$
Years Ended December 31,
(in millions) 2018 2017
Sales of bonds available for sale (2)$ 1$
Foreign exchange transactions 16 19
Derivative instruments (15) (7)
Embedded derivative 26 (25)
Other invested assets (12) -
Net realized capital gains (losses) 13$ (12)$
Years Ended December 31,
(in millions) 2018 2017
Increase in unrealized appreciation (depreciation) of investments:
Bonds available for sale (101)$ 15$
Equity securities available for sale (a) - 2
Increase in unrealized appreciation (depreciation) of investments (101)$ 17$

American International Reinsurance Company, Ltd. and Subsidiary Notes to Consolidated Financial Statements
26
EVALUATING INVESTMENTS FOR OTHER-THAN-TEMPORARY IMPAIRMENTS
Fixed Maturity Securities
If we intend to sell fixed maturity securities or it is more likely than not that we will be required to sell fixed maturity securities before recovery of its amortized cost basis and the fair value of the security is below amortized cost, an other-than-temporary impairment has occurred and the amortized cost is written down to current fair value, with a corresponding charge to realized capital losses. When assessing our intent to sell fixed maturity securities, or whether it is more likely than not that we will be required to sell fixed maturity securities before recovery of its amortized cost basis, management evaluates relevant facts and circumstances including, but not limited to, decisions to reposition our investment portfolio, sales of securities to meet cash flow needs and sales of securities to take advantage of favorable pricing.
For fixed maturity securities for which a credit impairment has occurred, the amortized cost is written down to the estimated recoverable value with a corresponding charge to realized capital losses. The estimated recoverable value is the present value of cash flows expected to be collected, as determined by management. The difference between fair value and amortized cost that is not related to a credit impairment is presented in unrealized appreciation (depreciation) of fixed maturity securities on which other-than-temporary credit impairments were recognized (a separate component of accumulated other comprehensive income).
When estimating future cash flows for structured fixed maturity securities (e.g., RMBS, CMBS, CDO, ABS) management considers historical performance of underlying assets and available market information as well as bond-specific structural considerations, such as credit enhancement and priority of payment structure of the security. In addition, the process of estimating future cash flows includes, but is not limited to, the following critical inputs, which vary by asset class:
• Current delinquency rates;
• Expected default rates and the timing of such defaults;
• Loss severity and the timing of any recovery; and
• Expected prepayment speeds.
For corporate, municipal and sovereign fixed maturity securities determined to be credit impaired, management considers the fair value as the recoverable value when available information does not indicate that another value is more relevant or reliable. When management identifies information that supports a recoverable value other than the fair value, the determination of a recoverable value considers scenarios specific to the issuer and the security, and may be based upon estimates of outcomes of corporate restructurings, political and macroeconomic factors, stability and financial strength of the issuer, the value of any secondary sources of repayment and the disposition of assets.
We consider severe price declines in our assessment of potential credit impairments. We may also modify our model inputs when we determine that price movements in certain sectors are indicative of factors not captured by the cash flow models. In periods subsequent to the recognition of an other-than-temporary impairment charge for available for sale fixed maturity securities that is not foreign exchange related, we prospectively accrete into earnings the difference between the new amortized cost and the expected undiscounted recoverable value over the remaining expected holding period of the security.
The following table presents Other-Than-Temporary Impairments of our bond investments:
Equity Securities On January 1, 2018, we adopted the Financial Instruments Recognition and Measurement standard for equity securities. The new standard requires equity securities to be measured at fair value with changes in fair value recognized in earnings each reporting period. As a result of the new standard, equity securities with readily determinable fair values are no longer required to be evaluated for other-than-temporary-impairment. Prior to the adoption of the Recognition and Measurement standard on January 1, 2018, we evaluated our available for sale equity securities for impairment by considering such securities as candidates for other-than-temporary impairment if they meet any of the following criteria:
Years Ended December 31,
(in millions) 2018 2017
Bonds:
Non US governments 1$ -$
Corporate debt - 1
Total Other-Than-Temporary Impairment 1$ 1$

American International Reinsurance Company, Ltd. and Subsidiary Notes to Consolidated Financial Statements
27
• The security has traded at a significant (25 percent or more) discount to cost for an extended period of time (nine consecutive months or longer);
• A discrete credit event has occurred resulting in (i) the issuer defaulting on a material outstanding obligation; (ii) the issuer seeking
protection from creditors under the bankruptcy laws or any similar laws intended for court-supervised reorganization of insolvent enterprises; or (iii) the issuer proposing a voluntary reorganization pursuant to which creditors are asked to exchange their claims for cash or securities having a fair value substantially lower than the par value of their claims; or
• We have concluded that we may not realize a full recovery on our investment, regardless of the occurrence of one of the foregoing
events. The determination that an equity security was other-than-temporarily impaired required the judgment of management and consideration of the fundamental condition of the issuer, its near-term prospects and all the relevant facts and circumstances. In addition to the above criteria, all equity securities that have been in a continuous decline in value below cost over 12 months are impaired. We also considered circumstances of a rapid and severe market valuation decline (50 percent or more) discount to cost, in which we could not reasonably assert that the impairment period would be temporary (severity losses).
Other Invested Assets Our equity method investments in private equity funds and other entities are evaluated for impairment each reporting period. Such evaluation considers market conditions, events and volatility that may impact the recoverability of the underlying investments within these private equity funds and are based on the nature of the underlying investments and specific inherent risks. Such risks may evolve based on the nature of the underlying investments.
Purchased Credit Impaired (“PCI”) Securities We purchase certain RMBS securities that have experienced deterioration in credit quality since their issuance. We determine whether it is probable at acquisition that we will not collect all contractually required payments for these PCI securities, including both principal and interest. At acquisition, the timing and amount of the undiscounted future cash flows expected to be received on each PCI security is determined based on our best estimate using key assumptions, such as interest rates, default rates and prepayment speeds. At acquisition, the difference between the undiscounted expected future cash flows of the PCI securities and the recorded investment in the securities represents the initial accretable yield, which is accreted into Net investment income over their remaining lives on an effective yield basis. Additionally, the difference between the contractually required payments on the PCI securities and the undiscounted expected future cash flows represents the non-accretable difference at acquisition. The accretable yield and the nonaccretable difference will change over time, based on actual payments received and changes in estimates of undiscounted expected future cash flows, which are discussed further below. On a quarterly basis, the undiscounted expected future cash flows associated with PCI securities are re-evaluated based on updates to key assumptions. Declines in undiscounted expected future cash flows due to further credit deterioration as well as changes in the expected timing of the cash flows can result in the recognition of an other-than-temporary impairment charge, as PCI securities are subject to our policy for evaluating investments for other-than-temporary impairment. Changes to undiscounted expected future cash flows due solely to the changes in the contractual benchmark interest rates on variable rate PCI securities will change the accretable yield prospectively. Significant increases in undiscounted expected future cash flows for reasons other than interest rate changes are recognized prospectively as adjustments to the accretable yield. The following tables present information on our PCI securities, which are included in bonds available for sale:
* Represents undiscounted expected cash flows, including both principal and interest.
(in millions) At Date of Acquisition
Contractually required payments (principal and interest) 93$
Cash flows expected to be collected* 84
Recorded investment in acquired securities 62

American International Reinsurance Company, Ltd. and Subsidiary Notes to Consolidated Financial Statements
28
The following table presents activity for the accretable yield on PCI securities:
PLEDGED INVESTMENTS
Insurance-Statutory and Other Deposits
The total carrying value of cash and securities under requirements of regulatory authorities or other insurance-related arrangements and certain reinsurance treaties, was $1,219 million and $1,012 million at December 31, 2018 and 2017, respectively.
Securities lending arrangement
Securities borrowed under the security lending arrangement may be sold or repledged. The collateral that we post can be cash or noncash. Collateral levels are monitored and are generally maintained at an agreed-upon percentage of the fair value of the loaned securities during the life of the transactions. At the termination of the transactions, both parties are obliged to return the collateral provided and securities transferred. We treat this arrangement as secured borrowings, whereby the receivable related to the funds exchanged is included in other assets. We enter into a security lending agreement with an affiliated company to borrow securities required to meet third party collateral requirements for a reinsurance arrangement. In return, we will post eligible US Dollar cash and US Dollar fixed income securities (Permitted Collateral) to an affiliated company as collateral for an amount equal to the value of loaned securities of Great British Pound (“GBP”) fixed income securities for standard market fees. The fair value of securities pledged from counterparties under securities lending agreements were $389 million and $425 million as of December 31, 2018 and 2017, respectively.
5. Variable Interest Entities
A variable interest entity (“VIE”) is a legal entity that does not have sufficient equity at risk to finance its activities without additional subordinated financial support or is structured such that equity investors lack the ability to make significant decisions relating to the entity’s operations through voting rights or do not substantively participate in the gains and losses of the entity. Consolidation of a VIE by its primary beneficiary is not based on majority voting interest, but is based on other criteria discussed below.
We enter into various arrangements with VIEs in the normal course of business and consolidate the VIEs when we determine we are the primary beneficiary. This analysis includes a review of the VIE’s capital structure, related contractual relationships and terms, nature of the VIE’s operations and purpose, nature of the VIE’s interests issued and our involvement with the entity. When assessing the need to consolidate a VIE, we evaluate the design of the VIE as well as the related risks the entity was designed to expose the variable interest holders to.
The primary beneficiary is the entity that has both (1) the power to direct the activities of the VIE that most significantly affect the entity’s economic performance and (2) the obligation to absorb losses or the right to receive benefits that could be potentially significant to the VIE. While also considering these factors, the consolidation conclusion depends on the breadth of our decision-making ability and the ability to influence activities that significantly affect the economic performance of the VIE. We are not the primary beneficiary of any VIE.
(in millions)
December 31,
2018
December 31,
2017
Outstanding principal balance 69$ 66$
Amortized cost 48 44
Fair value 53 49
Years Ended December 31,
(in millions) 2018 2017
Balance, beginning of year 22$ 17$
Newly purchased PCI securities 1 6
Accretion (3) (3)
Effect of changes in interest rate indices 1 -
Net reclassification from (to) non-accretable difference, including effects of prepayments - 2
Balance, end of year 21$ 22$

American International Reinsurance Company, Ltd. and Subsidiary Notes to Consolidated Financial Statements
29
We calculate the maximum exposure to loss to be (i) the amount invested in the debt or equity of the VIE, (ii) the notional amount of VIE assets or liabilities where we have also provided credit protection to the VIE with the VIE as the referenced obligation, and (iii) other commitments and guarantees to the VIE. Interest holders in VIEs sponsored by us generally have recourse only to the assets and cash flows of the VIEs and do not have recourse to us, except in limited circumstances when we have provided a guarantee to the VIE’s interest holders.
BALANCE SHEET CLASSIFICATION AND EXPOSURE TO LOSS
The following table presents total assets of unconsolidated VIEs in which we hold a variable interest, as well as our maximum exposure to loss associated with these VIEs:
6. Deferred Policy Acquisition Costs
Deferred policy acquisition costs (“DAC”) represent those costs that are incremental and directly related to the successful acquisition of new or renewal of existing insurance contracts. We defer incremental costs that result directly from, and are essential to, the acquisition or renewal of an insurance contract. Such deferred policy acquisition costs generally include agent or broker commissions and bonuses, premium taxes, and medical and inspection fees that would not have been incurred if the insurance contract had not been acquired or renewed. Each cost is analyzed to assess whether it is fully deferrable. We partially defer costs, including certain commissions, when we do not believe that the entire cost is directly related to the acquisition or renewal of insurance contracts. Short-duration insurance contracts: Policy acquisition costs are deferred and amortized over the period in which the related
premiums written are earned, generally 12 months. DAC is grouped consistent with the manner in which the insurance contracts are acquired, serviced and measured for profitability and is reviewed for recoverability based on the profitability of the underlying insurance contracts. Investment income is anticipated in assessing the recoverability of DAC. We assess the recoverability of DAC on an annual basis or more frequently if circumstances indicate an impairment may have occurred. This assessment is performed by comparing recorded net unearned premiums and anticipated investment income on in-force business to the sum of expected losses and loss adjustment expenses incurred, unamortized DAC and maintenance costs. If the sum of these costs exceeds the amount of recorded net unearned premiums and anticipated investment income, the excess is recognized as an offset against the asset established for DAC. This offset is referred to as a premium deficiency charge. Increases in expected losses and loss adjustment expenses incurred can have a significant impact on the likelihood and amount of a premium deficiency charge.
The following table presents a rollforward of deferred policy acquisition costs:
There were no impairments as a result of our assessment of the recoverability of deferred policy acquisition costs for the year ended December 31, 2018 or 2017.
(in millions)Total VIE
Assets
On-Balance
Sheet
Off-Balance
SheetTotal
December 31, 2018
Real Estate and investment entities 121$ 20$ -$ 20$
Total 121$ 20$ -$ 20$
December 31, 2017
Real Estate and investment entities 495$ $ 48 1$ 49$
Total 495$ $ 48 1$ 49$
Maximum Exposure to Loss
Years Ended December 31,
(in millions) 2018 2017
Balance at beginning of year 168$ 173$
Increase due to acquisition costs deferred 374 251
Decrease due to amortization expense (296) (256)
Balance at end of year 246$ 168$

American International Reinsurance Company, Ltd. and Subsidiary Notes to Consolidated Financial Statements
30
7. Reinsurance
In the ordinary course of business, we may use both treaty and facultative reinsurance to minimize our net loss exposure to any single catastrophic loss event or to an accumulation of losses from a number of smaller events or to provide greater diversification of our businesses. In addition, we assume reinsurance from other insurance companies. We determine the portion of the incurred but not reported (“IBNR”) loss that will be recoverable under our reinsurance contracts by reference to the terms of the reinsurance protection purchased. This determination is necessarily based on the estimate of IBNR and accordingly, is subject to the same uncertainties as the estimate of IBNR. Reinsurance assets include the balances due from reinsurance and insurance companies under the terms of our reinsurance agreements for paid and unpaid losses and loss adjustment expenses incurred, ceded unearned premiums and ceded future policy benefits for life and accident and health insurance contracts and benefits paid and unpaid. We remain liable to the extent that our reinsurers do not meet their obligation under the reinsurance contracts, and as such, we regularly evaluate the financial condition of our reinsurers and monitor concentration of our credit risk. The estimation of the allowance for doubtful accounts requires judgment for which key inputs typically include historical trends regarding uncollectible balances, disputes and credit events as well as specific reviews of balances in dispute or subject to credit impairment. The allowance for doubtful accounts on reinsurance assets was $4 million and $1 million at December 31, 2018 and 2017, respectively. Changes in the allowance for doubtful accounts on reinsurance assets are reflected in Policyholder benefits and losses incurred within the Consolidated Statements of Income. The following tables present supplemental information for reserves, gross and net of ceded reinsurance:
SHORT-DURATION REINSURANCE Short-duration reinsurance is effected under reinsurance treaties and by negotiation on individual risks. Certain of these reinsurance arrangements consist of excess of loss contracts that protect us against losses above stipulated amounts. Ceded premiums are considered prepaid reinsurance premiums and are recognized as a reduction of premiums earned over the contract period the reinsurance coverage is provided. Amounts recoverable from reinsurers on short-duration contracts are estimated in a manner consistent with the claims liabilities associated with the reinsurance and presented as a component of Reinsurance assets. Reinsurance premiums for assumed business are estimated based on information received from brokers, ceding companies and reinsurers. Any subsequent differences arising on such estimates are recorded in the periods in which they are determined. Assumed reinsurance premiums are earned primarily on a pro-rata basis over the terms of the reinsurance contracts and the portion of premiums relating to the unexpired terms of coverage is included in the reserve for unearned premiums. For both ceded and assumed reinsurance, risk transfer requirements must be met for reinsurance accounting to apply. If risk transfer requirements are not met, the contract is accounted for as a deposit, resulting in the recognition of cash flows under the contract through a deposit asset or liability and not as revenue or expense. To meet risk transfer requirements, a reinsurance contract must include both insurance risk, consisting of both underwriting and timing risk, and a reasonable possibility of a significant loss for the assuming entity. Similar risk transfer criteria are used to determine whether directly written insurance contracts should be accounted for as insurance or as a deposit.
December 31, 2018 As Net of
(in millions) Reported Reinsurance
Liability for unpaid losses and loss adjustment expenses 1,899$ 849$
Unearned premiums 846 783
Future policy benefits for life and accident and health insurance contracts 1,106 72
December 31, 2017 As Net of
(in millions) Reported Reinsurance
Liability for unpaid losses and loss adjustment expenses 2,029$ 651$
Unearned premiums 949 544
Future policy benefits for life and accident and health insurance contracts 1,184 25

American International Reinsurance Company, Ltd. and Subsidiary Notes to Consolidated Financial Statements
31
Short-Duration Reinsurance Short-duration insurance premiums written and earned among related and unrelated parties were comprised of the following:
Ceded premium to unrelated parties includes $8 million and $11 million of cessions to captive reinsurers for the years ended December 31, 2018 and 2017, respectively.
Cessions to Affiliated Entities
We have a reinsurance agreement with a third party insurer, under which we assume accident and health business on a quota share basis from that insurer. Effective January 1, 2012, we retroceded 100% of the obligations associated with the aforementioned business to an affiliated company. As of December 31, 2017, we have ceded loss reserves of $218 million, respectively, associated with this retrocession contract. Effective January 1, 2018, this retrocession agreement was cancelled for all obligations existing at this date as well as obligations arising subsequent to that date.
We have an 85% quota share treaty placement (net of all other reinsurance) ceded to an affiliate for certain excess casualty, financial lines, and punitive damages risks. As of December 31, 2018 and 2017, there are ceded loss reserves of $789 million and $755 million, respectively. There is also an excess of loss reinsurance agreement on certain excess casualty business with an affiliated company. As of December 31, 2018 and 2017, there are ceded loss reserves of zero and $18 million, respectively. In addition, we have a quota share treaty placement ceded to an affiliate for excess casualty risks. As of December 31, 2018 and 2017, there are ceded reserves of $6 million and $19 million, respectively. We have an excess of loss reinsurance agreement ceded to an affiliate covering all property business and relating to losses arising from a catastrophe. As of December 31, 2018 and 2017, there are ceded loss reserves of $41 million and $75 million, respectively.
Year Ended December 31, 2018
(in millions)
Premiums Written:
Direct -$ 113$ 113$
Assumed 80 1,274 1,354
Ceded 176 (80) 96
Net 256$ 1,307$ 1,563$
Premiums Earned:
Direct -$ 126$ 126
Assumed 272 1,167 1,439
Ceded (206) (49) (255)
Net 66$ 1,244$ 1,310$
Related PartiesUnrelated
PartiesTotal
Year Ended December 31, 2017
(in millions)
Premiums Written:
Direct -$ 137$ 137$
Assumed 527 1,058 1,585
Ceded (738) (15) (753)
Net (211)$ 1,180$ 969$
Premiums Earned:
Direct -$ 138$ 138$
Assumed 558 958 1,516
Ceded (633) (78) (711)
Net (75)$ 1,018$ 943$
Related PartiesUnrelated
PartiesTotal

American International Reinsurance Company, Ltd. and Subsidiary Notes to Consolidated Financial Statements
32
Reinsurance of Deferred Annuities and Retrocession to Affiliate We assumed a closed block of deferred annuities through a reinsurance agreement with a third party. As security for the reinsurance obligations, we are required to hold assets under the terms of a security agreement. Under the terms of the agreement, the assets subject to the agreement are assigned as security for payment and discharge of all obligations of ours to the third party. As of December 31, 2018 and 2017, we had assigned assets of $849 million and $925 million, respectively. See Note 4 for additional information. As of December 31, 2018 and 2017, future policy benefits associated with this business were $1,034 million and $1,159 million, respectively. We made an accounting policy election to designate GBP as the functional currency related to the closed block of deferred annuities. We translate the financial balances from the functional currency designated for these operations, generally the currency of the primary economic environment in which that operation does its business (i.e., in Great Britain Pounds) into US dollars. Assets and liabilities are translated into US dollars at period-end exchange rates, while income and expenses are translated using average rates for the period. Translation adjustments are recorded as a separate component of accumulated other comprehensive income, net of tax, to the extent applicable. Total assets and total liabilities exposed to the foreign currency translation risk are GBP 665 million and GBP 811 million respectively as of December 31, 2018.
Effective in 2010, we entered into a retrocession agreement to retrocede 100% of the obligation associated with this business to an affiliate. Under the contractual arrangement, we retained the premium that would have been paid to be used for payment of the reinsurance liability. This retained premium is recorded as funds held under reinsurance treaties. Under the terms of the contractual arrangement the realized and unrealized investment gains and losses and net investment income related to a specified underlying investment portfolio, used to collateralize the IBNR fund balance, inures to the benefit of the affiliate insurer. As of December 31, 2018 and 2017, the balance of funds held under insurance treaties due to affiliate was $849 million and $925 million, respectively.
Under the terms of the retrocession, the funds held balance contains an embedded derivative. The features of this embedded derivative are deemed similar to a total return swap on the specified underlying investment portfolio. The fair value of the embedded derivative is included in funds held under insurance treaties, with changes in the fair value of the embedded derivative recorded in net realized capital gains (losses). The fair value of the embedded derivative liability was $53 million and $107 million as of December 31, 2018 and 2017, respectively.
REINSURANCE SECURITY
Our reinsurance arrangements do not relieve us from our direct obligation to our insureds in the event of default of the reinsurer. Thus, a credit exposure exists with respect to reinsurance ceded to the extent that any reinsurer fails to meet the obligations assumed under any reinsurance agreement. The reinsurance asset is net of an allowance of less than $4 million and $1 million at December 31, 2018 and 2017, respectively. We evaluate the financial condition of our reinsurers and establishes limits per reinsurer. Although we have significant exposure to a few reinsurers, we are not exposed to significant risks.
8. Insurance Liabilities Loss reserves represent the accumulation of estimates of unpaid claims, including estimates for claims incurred but not reported and loss adjustment expenses (IBNR). We regularly review and update the methods used to determine loss reserve estimates. Any adjustments resulting from this review are reflected currently in pre-tax income. Because these estimates are subject to outcome of future events, changes in estimates are common given that loss trends vary and time is often required for changes in trend to be recognized and confirmed. Reserve changes that increase previous estimates of ultimate cost are referred to as unfavorable or adverse development or reserve strengthening. Reserve changes that decrease previous estimates of ultimate cost are referred to as favorable development.

American International Reinsurance Company, Ltd. and Subsidiary Notes to Consolidated Financial Statements
33
LIABILITY FOR UNPAID LOSSES AND LOSS ADJUSTMENT EXPENSES (LOSS RESERVES)
The following table presents the roll-forward of activity in Loss Reserves:
Although we regularly review the adequacy of the established reserves for unpaid losses and loss adjustment expenses, there can be no assurance that our ultimate liability for unpaid losses and loss adjustment expenses will not develop adversely and materially exceed our current liability for unpaid losses and loss adjustment expenses. Estimation of ultimate net losses, loss adjustment expenses and the liability for unpaid losses and loss adjustment expenses, is a complex process for certain long-tail casualty lines of business, which include excess and umbrella liability, directors’ and officers’ liability, professional liability, workers compensation, general liability, and related classes. Generally, actual historical loss development factors are used to project future loss development. However, there can be no assurance that future loss development patterns will be the same as in the past. Moreover, any deviation in loss cost t rends or in loss development factors might not be discernible for an extended period of time subsequent to the recording of the initial loss reserve estimates for any accident year. Thus, there is the potential for reserves with respect to a number of years to be significantly affected by changes in loss cost trends or loss development factors that were relied upon in setting the reserves. These changes in loss cost trends or loss development factors could be attributable to changes in inflation, in labor and material costs or in the judicial environment, or in other social or economic phenomena affecting claims.
For the year ended December 31, 2018, we recognized $36 million of net unfavorable prior year development. US & Canada Excess Casualty and China Accident & Health had $16 million and $33 million of unfavorable development, due to higher than expected loss emergence; offset by Ireland Healthcare $24 million of favorable development due to lower than expected loss emergence. Lastly, some of the smaller segments had a total of $11 million of unfavorable development due to higher than expected claims emergence and unfavorable development. For the year ended December 31, 2017, we recognized $10 million of net favorable prior year development due to lower than expected loss emergence mainly within US and Canada financial lines and Worldwide property via managing general agent (MGA).
Years Ended December 31,
(in millions) 2018 2017
Liability for unpaid losses and loss adjustment expenses, beginning of year 2,029$ 1,873$
Reinsurance recoverable (1,378) (1,368)
Net Liability for unpaid losses and loss adjustment expenses, beginning of year 651 505
Foreign exchange effect (25) 20
Losses and loss adjustment expenses incurred:
Current year 883 612
Prior years 36 (10)
Total losses and loss adjustment expenses incurred 919 602
Losses and loss adjustment expenses paid:
Current year (406) (287)
Prior years (290) (189)
Total losses and loss adjustment expenses paid (696) (476)
Liability for unpaid losses and loss adjustment expenses, end of year:
Net liability for unpaid losses and loss adjustment expenses 849 651
Reinsurance recoverable 1,050 1,378
Total 1,899$ 2,029$

American International Reinsurance Company, Ltd. and Subsidiary Notes to Consolidated Financial Statements
34
The table below presents the reconciliation of the liability for unpaid losses and loss adjustment expenses to Loss Reserves in the Consolidated Balance Sheets for the year ended December 31, 2018:
Loss Development Information
The following is information about incurred and paid loss developments as of December 31, 2018, net of reinsurance. The cumulative number of reported claims, the total of IBNR liabilities and expected development on reported loss included within the net incurred loss amounts are presented in the following section.
Reserving Methodology
We use a combination of methods to project ultimate losses for both long-tail and short-tail exposures, which include:
• Paid Development method: The Paid Development method estimates ultimate losses by reviewing paid loss patterns and selecting
paid ultimate loss development factors. These factors are then applied to paid losses by applying them to accident years, with further expected changes in paid loss. Since the method does not rely on case reserves, it is not directly influenced by changes in the adequacy of case reserves.
• Incurred Development method: The Incurred Development method is similar to the Paid Development method, but it uses case
incurred losses instead of paid losses. Since this method uses more data (case reserves in addition to paid losses) than the Paid Development method, the incurred development patterns may be less variable than paid development patterns.
• Expected Loss Ratio method: The Expected Loss Ratio method multiplies premiums by an expected loss ratio to produce ultimate
loss estimates for each accident year. This method may be useful if loss development patterns are inconsistent, losses emerge very slowly, or there is relatively little loss history from which to estimate future losses.
• Bornhuetter-Ferguson method: The Bornhuetter-Ferguson method using earned premiums and paid losses is a combination of the
Paid Development method and the Expected Loss Ratio method where the weights given to each method is the reciprocal of the loss development factor. This method normally determines expected loss ratios similar to the method used for the Expected Loss Ratio method. The Bornhuetter-Ferguson method using premiums and incurred losses is similar to the Bornhuetter-Ferguson method using premiums and paid losses except that it uses case incurred losses.
• Cape Cod method: The Cape Cod method is mechanically similar to the Bornhuetter-Ferguson method with the difference being
that the Expected Loss Ratio estimates are determined based on a weighting of the loss estimates that come from the Paid/Incurred Development Methods. This method may be more responsive to recent loss trend than Bornhuetter-Ferguson method.
(in millions)
US and Canada Excess Casualty 88$ 664$ 752$
US and Canada Financial Lines 50 295 345
Japan Excess Casualty 11 8 19
Japan Primary Casualty 23 - 23
Worldwide Property via MGA 111 48 159
Japan Personal Lines Auto 42 - 42
Japan Personal Accident and Health 31 - 31
China Accident and Health 290 - 290
Ireland Healthcare 136 - 136
Total 782$ 1,015$ 1,797$
Reconciling Items
Other Product Lines 98
Unallocated loss adjustment expenses 4
Total Loss Reserves 1,899$
Net liability for unpaid
losses and loss
adjustment expenses as
presented in the
disaggregated tables
below
Reinsurance recoverable
on unpaid losses and
loss adjustment
expenses included in the
disaggregated tables
below
Gross liability for unpaid
losses and loss
adjustment expenses

American International Reinsurance Company, Ltd. and Subsidiary Notes to Consolidated Financial Statements
35
In updating the loss reserve estimates, we considered and evaluated inputs from many sources, including actual claims data, the performance of prior reserve estimates, observed industry trends, internal peer review processes, including challenges and recommendations from Enterprise Risk Management group, and where applicable the views of third party actuarial firms on similar classes of business written by affiliated companies. We use these inputs to improve our evaluation techniques, and to analyze and assess the change in estimated ultimate loss for each accident year by product line. Our analyses produce a range of indications from various methods, from which we select our best estimate.
In determining the actual carried loss reserves, we considered both the internal actuarial best estimate and numerous other internal and external factors, including:
• An assessment of economic conditions, including real GDP growth, inflation, employment rates or unemployment duration, stock market volatility and changes in corporate bond spreads;
• Changes in the legal, regulatory, judicial and social environment, including changes in road safety, public health and cleanup standards;
• Changes in medical cost trends (inflation, intensity and utilization of medical services) and wage inflation trends;
• Underlying policy pricing, terms and conditions including attachment points and policy limits;
• Claims handling processes and enhancements;
• Third-party claims reviews that are periodically performed for key classes of claims such as toxic tort, environmental and other complex casualty claims;
• Third-party actuarial reviews that are periodically performed for key classes of business written by affiliated companies similar to classes of business written by us:
• Input from underwriters on pricing, terms, and conditions and market trends; and
• Changes in our reinsurance program, pricing and commutations.
The following factors are relevant to the loss development information Included in the tables below:
• Table Organization: The tables are organized by accident year and include policies written on an occurrence and claims-made
basis. The tables are grouped to distinguish expected claim emergence from: a. Claims made (financial lines) and occurrence (liability/casualty lines).
b. Short tail lines (primarily property, personal auto, accident and health) and long tail lines (primary and excess casualty lines).
• Groupings: The groupings have homogenous risk characteristics with similar development patterns and would generally be subject
to similar trends.
• Reinsurance: The reinsurance program varies by exposure type and may change from year to year. This may affect the
comparability of the data presented in the our tables.
• Incurred but not reported liabilities (IBNR): We include development from past reported losses in IBNR.
• Data excluded from tables: Information with respect to accident years older than ten years is excluded from the development
tables. Unallocated loss adjustment expenses are also excluded.
• Foreign exchange: The loss development for operations outside of the US is presented for all accident years using the current
exchange rate at December 31, 2018. Although this approach requires restating all prior accident year information, the changes in exchange rates do not impact incurred and paid loss development trends.
• Claim counts: Reported claims are considered to be one claim for each claimant or feature for each loss occurrence. Claims
relating to losses that are 100 percent reinsured are excluded from the reported claims in the tables below. Reported claims for losses from third party assumed reinsurance contracts are not disclosed when the claim count provided is incomplete.
• There are limitations that should be considered on the reported claim count data in the tables below, including: - Claim counts are presented only on a reported (not an ultimate) basis; - The tables below include lines of business and geographies at a certain aggregated level which may indicate different frequency
and severity trends and characteristics, and may not be as meaningful as the claim count information related to the individual products within those lines of business and geographies;
- Certain lines of business are more likely to be subject to occurrences involving multiple claimants and features, which can distort measures based on the reported claim counts in the table below; and
- Reported claim counts are not adjusted for ceded reinsurance, which may distort the measure of frequency or severity.
Supplemental Information: The information about incurred and paid loss development for all periods preceding year ended December
31, 2018 and the related historical claims payout percentage disclosure is unaudited and is presented as supplementary information.

American International Reinsurance Company, Ltd. and Subsidiary Notes to Consolidated Financial Statements
36
The following tables present undiscounted, incurred and paid losses and allocated loss adjustment expenses by accident year, on a net basis after reinsurance, for 10 years:
US and Canada Excess Casualty
US and Canada Excess Casualty is coverage for Fortune 500 sized companies.
Reserving Process and Methodology
The business is excess casualty coverage for Fortune 500 sized companies. The typical minimum attachment point for a policy is $100 million and can be higher for certain classes of business, which causes the loss development pattern to be lagged significantly. Many of the claims notified to the excess layers are closed without payment because the claims never reach our layer as a result of high deductibles and other underlying coverages, the claims that reach our layer and close with payment can be large and highly variable in terms of reported timing and amount. The underlying primary policies are sometimes issued by other insurance companies, which can limit our access to relevant information to help inform its judgments as the loss events evolve and mature. We generally use a combination of paid and incurred loss development, paid and incurred Bornhuetter-Ferguson, and Expected loss ratio methods for excess casualty product lines. In general, expected loss ratio methods are given more weight in the more recent accident years, and loss development methods are given more weight in more mature accident years. A generalized Cape Cod method is used to derive the expected loss ratios for the Bornhuetter–Ferguson method. An expected loss ratio, which considers both rate and loss trend changes, is applied to the current accident year. Mass tort claims in particular may develop over an extended period of time and impact multiple accident years when they emerge. The significant increase in reported claim count for accident year 2016 is attributable to multiple claimants filed against one insured.
2009 $ 14 $ 18 $ 18 $ 15 $ 11 $ 11 $ 17 $ 17 $ 16 $ 16 $ 3 55
2010 28 28 22 15 15 13 12 13 5 2 78
2011 14 21 17 16 13 10 10 9 2 40
2012 13 12 15 20 19 18 22 5 57
2013 11 11 9 6 6 3 3 83
2014 11 10 8 7 6 6 35
2015 9 20 22 32 7 53
2016 9 9 9 8 652
2017 9 24 1 25
2018 8 8 11
Total $ 134
(54)
8
$ 88 Liabilities for losses and loss adjustment expenses and prior year loss development, net of reinsurance
Cumulative Paid Losses and Allocated Loss Adjustment Expenses, Net of Reinsurance from the table below
20182015 2016 20172012 2013 2014
Liabilities for losses and loss adjustment expenses and prior year development before 2009, net of reinsurance
Accident
Year
Incurred Losses and Allocated Loss Adjustment Expenses, Undiscounted and Net of Reinsurance
Unaudited
Years Ended December 31, (amount in millions) December 31, 2018
2009 2010 2011
Total of IBNR
Liabilities Plus
Expected
Development on
Reported
Losses
Cumulative
Number of
Reported
Claims
Accident
Year 2009 2010 2011 2012 2013 2014 2015 2016 2017 2018
2009 $ - $ - $ - $ 3 $ 5 $ 5 $ 13 $ 13 $ 13 $ 13
2010 - - 3 3 3 3 3 3 3
2011 - - - - 6 6 6 6
2012 - - 7 7 7 14 18
2013 - - - - - -
2014 - - - - -
2015 - - 2 14
2016 - - -
2017 - -
2018 -
Total $ 54
Cumulative Paid Losses and Allocated Loss Adjustment Expenses, Net of Reinsurance
Years Ended December 31, (amount in millions)
Unaudited

American International Reinsurance Company, Ltd. and Subsidiary Notes to Consolidated Financial Statements
37
US and Canada Financial Lines
US and Canada Excess Financial Lines is coverage for Fortune 500 sized companies.
Reserving Process and Methodology
The business consists of excess directors and officers liability (“D&O”), excess employment practices liability (“EPLI”), and excess errors and omissions liability (“E&O”). This includes cyber coverages, which has been a growing and evolving portion of this portfolio. These product lines are predominantly claims-made in nature, losses are characterized by low frequency and high severity, and results are often significantly impacted by external economic conditions.
We generally use a combination of paid and incurred loss development, paid and incurred Bornhuetter-Ferguson, paid and incurred Cape Cod methods and expected loss ratio methods for D&O, E&O, and EPLI. In general, expected loss ratio methods are given more weight in the more recent accident years, and loss development methods are given more weight in more mature accident years. A generalized Cape Cod method is used to derive the expected loss ratios for the Bornhuetter–Ferguson method. An expected loss ratio, which considers both rate and loss trend changes, is applied to the current accident year. The loss development factors for the different segments differ significantly in some cases, based on specific coverage characteristics and other factors such as industry group, attachment points, and limits offered. Individual claims projections for accident years ended over eighteen months prior are also reviewed for the analysis.
2009 $ 16 $ 11 $ 11 $ 10 $ 10 $ 10 $ 9 $ 10 $ 12 $ 13 $ 1 46
2010 10 10 10 11 5 5 6 7 6 1 54
2011 10 11 12 7 5 3 3 3 - 59
2012 10 10 10 9 7 7 8 2 68
2013 10 9 9 7 3 2 2 61
2014 9 10 12 9 9 2 53
2015 8 9 9 7 7 87
2016 8 7 7 7 47
2017 6 6 5 95
2018 5 5 188
Total $ 66
$ (20)
$ 4
$ 50 Liabilities for losses and loss adjustment expenses and prior year loss development, net of reinsurance
Total of IBNR
Liabilities Plus
Expected
Development on
Reported
Losses
Cumulative
Number of
Reported
Claims
Cumulative Paid Losses and Allocated Loss Adjustment Expenses, Net of Reinsurance from the table below
2016 2017 2018
Accident
Year
Liabilities for losses and loss adjustment expenses and prior year development before 2009, net of reinsurance
Unaudited
Incurred Losses and Allocated Loss Adjustment Expenses, Undiscounted and Net of Reinsurance
Years Ended December 31, (amount in millions) December 31, 2018
2009 2010 2011 2012 2013 2014 2015
Accident
Year 2009 2010 2011 2012 2013 2014 2015 2016 2017 2018
2009 $ - $ - $ 1 $ 2 $ 6 $ 6 $ 7 $ 10 $ 10 $ 10
2010 - - - - - - 3 3 3
2011 - - - - 1 1 1 1
2012 - - 2 2 2 2 2
2013 - - - - - -
2014 - 2 4 4 4
2015 - - 2 -
2016 - - -
2017 - -
2018 -
Total $ 20
Cumulative Paid Losses and Allocated Loss Adjustment Expenses, Net of Reinsurance
Years Ended December 31, (amount in millions)
Unaudited

American International Reinsurance Company, Ltd. and Subsidiary Notes to Consolidated Financial Statements
38
Japan Excess Casualty
Japan Excess Casualty consists of business assumed from affiliated companies in Japan under a quota share agreement. The quota share contract was terminated as of January 1, 2018.
Reserving Process and Methodology
Japan excess casualty policies attach above underlying policies, which causes the loss development pattern to be lagged significantly. Many of the claims notified to the excess layers are closed without payment because the claims are settled within underlying policy limits and do not reach our layer. Claims that reach our layer and close with payment can be large and highly variable in terms of reported timing and amount. For approximately half of this business, the underlying primary policies are issued by other insurance companies, which may limit our access to relevant information in a timely manner to help inform our judgments as the loss events evolve and mature. We generally use a combination of paid and incurred loss development methods and paid and incurred Bornhuetter-Ferguson methods for excess casualty product lines. The prior expected loss ratios used for recent accident years in the Bornhuetter Ferguson methods are based on a combination of the projected ultimate loss ratios for older years and budget loss ratios which take into consideration rate changes and loss trend. Mass tort claims in particular may develop over an extended period of time and impact multiple accident years when they emerge.
2009 $ 1 $ 1 $ - $ - $ - $ - $ - $ - $ - $ - $ - 3
2010 1 - - - 1 1 1 1 1 - 7
2011 - - - 1 9 8 8 8 - 5
2012 - - - 8 8 8 8 - 1
2013 - 1 8 8 8 8 - 7
2014 1 10 15 15 15 - 22
2015 1 - 1 - - 36
2016 1 - - - 2
2017 1 1 1 -
2018 - - -
Total $ 41
$ (30)
$ 11 Liabilities for losses and loss adjustment expenses and prior year loss development, net of reinsurance
Total of IBNR
Liabilities Plus
Expected
Development on
Reported
Losses
Cumulative
Number of
Reported
Losses
Cumulative Paid Losses and Allocated Loss Adjustment Expenses, Net of Reinsurance from the table below
2016 2017 2018
Accident
Year
Unaudited
Incurred Losses and Allocated Loss Adjustment Expenses, Undiscounted and Net of Reinsurance
Years Ended December 31, (amount in millions) December 31, 2018
2009 2010 2011 2012 2013 2014 2015
Accident
Year 2009 2010 2011 2012 2013 2014 2015 2016 2017 2018
2009 $ - $ - $ - $ - $ - $ - $ - $ - $ - $ -
2010 - - - - - - - - -
2011 - - - 1 1 1 5 8
2012 - - - - - 7 8
2013 - - - - 1 6
2014 - - 6 7 8
2015 - - - -
2016 - - -
2017 - -
2018 -
Total $ 30
Cumulative Paid Losses and Allocated Loss Adjustment Expenses, Net of Reinsurance
Years Ended December 31, (amount in millions)
Unaudited

American International Reinsurance Company, Ltd. and Subsidiary Notes to Consolidated Financial Statements
39
Japan Primary Casualty
Japan Primary Casualty consists of general liability and workers’ compensation business assumed from affiliated companies in Japan under a quota share agreement. The quota share contract was partially terminated as of January 1, 2018.
Reserving Process and Methodology
Japan workers’ compensation and general liability are guaranteed cost contracts. Loss emergence patterns for these classes in Japan tend to be more like short-tailed lines as compared to other jurisdictions like the US. The claims are handled by AIG Japan claims adjusters and the loss development patterns are relatively consistent from one accident year to the next. Generally, a combination of both paid and incurred loss development and paid and incurred Bornhuetter-Ferguson methods are employed for both workers’ compensation and general liability.
In general, loss development for Japan Primary Casualty has been very stable, with only modest changes in the initial selected loss ratios for this business.
2009 $ 30 $ 31 $ 32 $ 32 $ 32 $ 32 $ 31 $ 31 $ 31 $ 31 $ - 36,508
2010 30 29 28 29 29 30 30 30 30 - 42,258
2011 33 32 31 32 31 31 31 31 - 35,790
2012 29 30 30 30 29 29 29 - 34,571
2013 31 32 32 30 30 30 - 34,272
2014 34 33 32 32 32 - 34,345
2015 34 29 30 31 - 33,179
2016 29 29 29 1 31,940
2017 33 31 3 31,417
2018 18 4 15,912
Total $ 292
$ (269)
$ 23 Liabilities for losses and loss adjustment expenses and prior year loss development, net of reinsurance
Total of IBNR
Liabilities Plus
Expected
Development on
Reported
Losses
Cumulative
Number of
Reported
Losses
Cumulative Paid Losses and Allocated Loss Adjustment Expenses, Net of Reinsurance from the table below
2016 2017 2018
Accident
Year
Unaudited
Incurred Losses and Allocated Loss Adjustment Expenses, Undiscounted and Net of Reinsurance
Years Ended December 31, (amount in millions) December 31, 2018
2009 2010 2011 2012 2013 2014 2015
Accident
Year 2009 2010 2011 2012 2013 2014 2015 2016 2017 2018
2009 $ 18 $ 27 $ 29 $ 30 $ 31 $ 31 $ 31 $ 31 $ 31 $ 31
2010 17 24 26 27 29 29 29 30 30
2011 17 27 29 30 30 30 31 31
2012 17 25 26 27 28 28 29
2013 16 26 27 28 29 29
2014 17 26 28 29 30
2015 16 25 26 28
2016 16 24 26
2017 16 25
2018 10
Total $ 269
Cumulative Paid Losses and Allocated Loss Adjustment Expenses, Net of Reinsurance
Years Ended December 31, (amount in millions)
Unaudited

American International Reinsurance Company, Ltd. and Subsidiary Notes to Consolidated Financial Statements
40
Worldwide Property via MGA
Worldwide Property consists of property catastrophe reinsurance written on an occurrence basis. The below table only represents four years of activity as the MGA agreement was effective January 1, 2015. The contract terminated on December 31, 2018.
Reserving Process and Methodology
Property classes cover exposures to natural catastrophes for medium to high layers on a US nationwide basis or a non US basis.
The exposure is predominately individual natural catastrophic events. Claim department estimates for each of the events are used in developing the appropriate loss reserve estimate. Frequency/severity methods, loss development methods, and IBNR factor methods may also be used in combination with the claim department estimate to set reserves for short-tail classes such as property. IBNR factor methods are used when the nature of losses is low frequency/high severity. The IBNR factors, when applied to earned premium, generate the ultimate expected losses (or other exposure measure) yet to be reported. The factors are determined based on prior accident quarters’ loss costs adjusted to reflect current cost levels and the historical emergence of those loss costs. The factors are continually reevaluated to reflect emerging claim experience, rate changes or other factors that could affect the adequacy of the IBNR factor being employed. There was an increase in net incurred losses in 2017 due to the significant catastrophe activity during the year in the US.
Accident
Year
2015 $ 9 $ 3 $ 5 $ 5 $ - 34
2016 $ 28 $ 21 $ 24 11 56
2017 122 122 2 122
2018 87 47 54
Total $ 238
$ (127)
$ 111 Liabilities for losses and loss adjustment expenses and prior year loss development, net of reinsurance
Total of IBNR
Liabilities Plus
Expected
Development on
Reported
Losses
Cumulative
Number of
Reported
Claims
Cumulative Paid Losses and Allocated Loss Adjustment Expenses, Net of Reinsurance from the table below
2016 2017 2018
Unaudited
Incurred Losses and Allocated Loss Adjustment Expenses, Undiscounted and Net of Reinsurance
Years Ended December 31, (amount in millions) December 31, 2018
2015
Accident
Year 2015 2016 2017 2018
2015 $ - $ 1 $ 2 $ 2
2016 1 5 $ 8
2017 18 99
2018 18
Total $ 127
Cumulative Paid Losses and Allocated Loss Adjustment Expenses, Net of Reinsurance
Years Ended December 31, (amount in millions)
Unaudited

American International Reinsurance Company, Ltd. and Subsidiary Notes to Consolidated Financial Statements
41
Japan Personal Lines Auto
Japan Personal Line Auto consists of business assumed from affiliated companies in Japan under a quota share agreement. The quota share contract was partially terminated as of January 1, 2018.
Reserving Process and Methodology
Japan personal auto insurance includes collision, comprehensive and liability coverage. Personal auto in Japan is generally short-tail in nature.
The analysis is performed for physical damage and liability separately. Frequency/severity methods, loss development methods, Bornhuetter-Ferguson, and IBNR factor methods are used alone or in combination to set reserves for short-tail product lines such as personal auto.
Frequency/severity methods are often utilized for personal auto classes. Claim counts emerge quickly for personal auto. Frequency/severity methods allow for more immediate analysis of resulting loss trends as well as comparison to industry and other diagnostic metrics. IBNR factor methods are also used when the nature of losses is high frequency and stable severity. The IBNR factors, when applied to earned premium generate the ultimate expected losses yet to be reported. The factors are determined based on prior accident quarters’ loss costs adjusted to reflect current cost levels and the historical emergence of those loss costs. The factors are continually reevaluated to reflect emerging claim experience, rate changes or other factors that could affect the adequacy of the IBNR factor being employed. In general, loss development for Japan personal automobile has been very stable, with only modest changes in the initial selected loss ratios for this business.
2009 $ 109 $ 110 $ 112 $ 112 $ 112 $ 112 $ 112 $ 112 $ 113 $ 113 $ - 188,316
2010 111 114 114 114 115 115 115 115 115 - 219,278
2011 103 105 106 106 105 106 106 106 - 186,309
2012 105 106 106 105 105 105 105 - 174,869
2013 95 95 95 96 96 96 - 159,798
2014 89 90 89 89 89 - 153,188
2015 87 88 89 90 - 148,117
2016 82 85 85 1 136,118
2017 74 73 2 118,812
2018 39 2 56,143
Total $ 911
(870)
Liabilities for losses and loss adjustment expenses and prior year development before 2009, net of reinsurance 1
$ 42
Incurred Losses and Allocated Loss Adjustment Expenses, Undiscounted and Net of Reinsurance
Years Ended December 31, (amount in millions) December 31, 2018
2009 2010 2011 2012 2013 2014 2015
Liabilities for losses and loss adjustment expenses and prior year loss development, net of reinsurance
Total of IBNR
Liabilities Plus
Expected
Development on
Reported
Losses
Cumulative
Number of
Reported
Claims
Cumulative Paid Losses and Allocated Loss Adjustment Expenses, Net of Reinsurance from the table below
2016 2017 2018
Accident
Year
Unaudited
Accident
Year 2009 2010 2011 2012 2013 2014 2015 2016 2017 2018
2009 $ 77 $ 97 $ 104 $ 108 $ 109 $ 111 $ 112 $ 112 $ 113 $ 113
2010 78 99 106 109 112 113 113 114 114
2011 72 92 97 100 103 104 105 105
2012 71 91 97 101 103 104 105
2013 64 82 87 91 93 94
2014 59 76 82 85 87
2015 57 74 81 84
2016 54 71 77
2017 49 63
2018 28
Total $ 870
Cumulative Paid Losses and Allocated Loss Adjustment Expenses, Net of Reinsurance
Years Ended December 31, (amount in millions)
Unaudited

American International Reinsurance Company, Ltd. and Subsidiary Notes to Consolidated Financial Statements
42
Japan Personal Accident & Health
Japan Personal Accident & Health consists of business assumed from affiliated companies in Japan under a quota share agreement. The quota share contract was terminated as of January 1, 2018,
Reserving Process and Methodology
Japan personal accident insurance includes voluntary and sponsor-paid personal accident and supplemental health products for individuals, employees, associations and other organizations as well as a broad range of travel insurance products and services for leisure and business travelers. Personal accident insurance is generally short-tail in nature.
Frequency/severity methods, loss development methods, Bornhuetter-Ferguson, and IBNR factor methods are used alone or in combination to set reserves for short-tail product lines such as personal accident.
Frequency/severity methods are often utilized for personal accident products. Claim counts emerge quickly for most personal accident classes. Frequency/severity methods allow for more immediate analysis of resulting loss trends as well as comparison to industry and other diagnostic metrics. IBNR factor methods are also used when the nature of losses is high frequency and stable severity. The IBNR factors, when applied to earned premium generate the ultimate expected losses yet to be reported. The factors are determined based on prior accident quarters’ loss costs adjusted to reflect current cost levels and the historical emergence of those loss costs. The factors are continually reevaluated to reflect emerging claim experience, rate changes or other factors that could affect the adequacy of the IBNR factor being employed. In general, loss development for Japan personal accident insurance has been very stable generally, with only modest decreases in the initial selected loss ratios for this business.
2009 $ 111 $ 107 $ 107 $ 107 $ 107 $ 107 $ 107 $ 107 $ 107 $ 108 $ - 511,968
2010 114 109 110 110 109 109 110 110 110 - 589,393
2011 132 132 131 131 131 131 131 131 - 515,876
2012 107 102 102 102 102 102 102 - 523,575
2013 96 97 97 97 97 97 - 510,951
2014 95 92 92 92 92 - 525,662
2015 88 85 86 86 - 519,934
2016 84 82 83 1 532,049
2017 85 83 1 514,552
2018 40 3 185,731
Total $ 932
(901)
$ 31
Incurred Losses and Allocated Loss Adjustment Expenses, Undiscounted and Net of Reinsurance
Years Ended December 31, (amount in millions) December 31, 2018
2009 2010 2011 2012 2013 2014 2015
Liabilities for losses and loss adjustment expenses and prior year loss development, net of reinsurance
Total of IBNR
Liabilities Plus
Expected
Development on
Reported
Losses
Cumulative
Number of
Reported
Claims
Cumulative Paid Losses and Allocated Loss Adjustment Expenses, Net of Reinsurance from the table below
2016 2017 2018
Accident
Year
Unaudited
Accident
Year 2009 2010 2011 2012 2013 2014 2015 2016 2017 2018
2009 $ 56 $ 98 $ 104 $ 106 $ 106 $ 107 $ 107 $ 107 $ 107 $ 108
2010 61 101 107 108 109 109 110 110 110
2011 70 121 128 129 130 131 131 131
2012 54 92 98 100 101 102 102
2013 51 87 93 95 96 96
2014 46 83 88 90 91
2015 44 77 82 84
2016 42 74 78
2017 43 75
2018 26
Total $ 901
Cumulative Paid Losses and Allocated Loss Adjustment Expenses, Net of Reinsurance
Years Ended December 31, (amount in millions)
Unaudited

American International Reinsurance Company, Ltd. and Subsidiary Notes to Consolidated Financial Statements
43
China Personal Accident and Health
China Personal Accident & Health consists of business assumed under a 40% quota share agreement. Prior to 2018, the China Personal Accident and Health business was retroceded 100% to an affiliate company. In 2018, the reinsurance obligation between us and the affiliate company was terminated via a commutation.
(a) The cumulative number of reported claim counts as relates to the total reported losses have not been disclosed in the table above. This is assumed
reinsurance portfolio and the full complement of historical claim counts were not provided to AIRCO. Disclosing incomplete claim count data would produce a distorted view of average severities.
Reserving Process and Methodology
China personal accident insurance includes group and individual personal accident and supplemental health products for individuals, employees, associations and other organizations. Personal accident insurance is generally short-tail in nature.
Frequency/severity methods, loss development methods, and Bornhuetter-Ferguson methods are used alone or in combination to set reserves for short-tail product lines such as personal accident. In general, the loss development for China personal accident insurance has been very stable with only a modest increase in the initial selected loss ratios for this business. This being the case, the Bornhuetter-Ferguson and incurred loss development methods were utilized in determining the ultimate claims liabilities.
2009 $ 103 $ 112 $ 112 $ 112 $ 112 $ 112 $ 112 $ 112 $ 112 $ 112 $ - -
2010 91 94 94 94 94 93 93 93 93 - -
2011 73 92 92 92 90 89 89 89 - -
2012 113 116 118 117 114 114 114 - -
2013 160 167 171 171 169 169 - -
2014 189 197 198 197 197 - -
2015 218 223 226 228 - -
2016 246 253 266 2 -
2017 302 320 21 -
2018 436 181 -
Total $ 2,024
(1,734)
$ 290 Liabilities for losses and loss adjustment expenses and prior year loss development, net of reinsurance
Total of IBNR
Liabilities Plus
Expected
Development on
Reported
Losses
Cumulative
Number of
Reported
Claims
Cumulative Paid Losses and Allocated Loss Adjustment Expenses, Net of Reinsurance from the table below
2015 2016 2017 2018
Unaudited
Incurred Losses and Allocated Loss Adjustment Expenses, Undiscounted and Net of Reinsurance
Years Ended December 31, (amount in millions) December 31, 2018
Accident
Year 2009 2010 2011 2012 2013 2014
Accident
Year 2009 2010 2011 2012 2013 2014 2015 2016 2017 2018
2009 $ 68 $ 102 $ 109 $ 111 $ 111 $ 111 $ 112 $ 112 $ 112 $ 112
2010 58 84 90 93 94 93 93 93 94
2011 46 80 86 89 90 89 89 89
2012 59 98 109 115 113 113 114
2013 98 146 163 167 168 168
2014 102 170 187 193 195
2015 113 196 217 223
2016 137 226 255
2017 170 276
2018 208
Total $ 1,734
Cumulative Paid Losses and Allocated Loss Adjustment Expenses, Net of Reinsurance
Years Ended December 31, (amount in millions)
Unaudited

American International Reinsurance Company, Ltd. and Subsidiary Notes to Consolidated Financial Statements
44
Ireland Healthcare
Healthcare consists of Irish medical expense business assumed under a quota share agreement. Effective January 1, 2017, we changed the participation percentage of the quota share agreement for this business from 35% to 50%. The below table only represents three years of activity as the agreement was effective January 1, 2016.
(a) The cumulative number of reported claim counts as relates to the total reported losses have not been disclosed in the table above. Inpatient claims,
which represent the bulk of the claims activity, were the only claim counts provided to AIRCO. Disclosing incomplete claim count data would produce a distorted view of average severities.
Reserving Process and Methodology
Healthcare consists of medical expense policies, for in hospital admissions, outpatient services and other services. Medical expense business is generally short-tail in nature.
Paid loss development method and paid Bornhuetter-Ferguson are used alone or in combination to set reserves for short-tail product lines such as healthcare as individual case reserves are not typically established. Loss emergence for healthcare has been relatively stable with only a modest change in the initial selected loss ratio.
2016 $ 104 $ 103 $ 104 $ 4 -
2017 246 220 13 -
2018 316 119 -
Total $ 640
Cumulative Paid Losses and Allocated Loss Adjustment Expenses, Net of Reinsurance from the table below $ (504)
$ 136
Accident
Year 2016 2017
Liabilities for losses and loss adjustment expenses and prior year loss development, net of reinsurance
2018
Unaudited
Incurred Losses and Allocated Loss Adjustment Expenses, Undiscounted and Net of Reinsurance
Years Ended December 31, (amount in millions) December 31, 2018
Total of IBNR
Liabilities Plus
Expected
Development on
Reported Losses
(a)Cumulative
Number of
Reported
Claims
Accident
Year 2016 2017 2018
2016 $ 51 $ 97 $ 100
2017 139 207
2018 197
Total $ 504
Cumulative Paid Losses and Allocated Loss Adjustment Expenses, Net of Reinsurance
Years Ended December 31, (amount in millions)
Unaudited

American International Reinsurance Company, Ltd. and Subsidiary Notes to Consolidated Financial Statements
45
Claims Payout Patterns The following table presents the historical average annual percentage claims payout on an accident year basis at the same level of disaggregation as presented in the claims development table.
Due to less than 10 years of experience available for presentation, the cumulative percentage payout of Incurred losses will not be appropriate for Worldwide Property and Ireland Healthcare. For Excess classes, the low frequency and high severity nature of the losses lead to results that may not be indicative of the expected payout percentages on future claims.
Future Policy Benefits for Life and Accident and Health Insurance Contracts
Future policy benefits primarily include reserves for traditional life and annuity payout contracts, which represent an estimate of the present value of future benefits less the present value of future net premiums. Included in Future policy benefits are liabil ities for annuities issued in structured settlement arrangements whereby a claimant has agreed to settle a general insurance claim in exchange for fixed payments over a fixed determinable period of time with a life contingency feature.
The following table presents the components of the future policy benefits:
(a) We have entered into a retrocession agreement to retrocede 100% of the obligation associated with this business to an affiliate. See Note 7 for additional information.
The closed block of deferred annuities was issued in conjunction with the termination of occupational pension programs in the U.K. Insofar as annuitization at retirement is required, they are treated as “limited-payment contacts”. The liability for future policy benefits is computed using mortality tables and assumptions for mortality improvement published by the Faculty of Actuaries in the U.K. Present values are calculated at an interest rate of 3.34% and 3.34% as of December 31, 2018 and 2017, respectively.
The liability for future life policy benefits is computed using mortality tables and assumptions for mortality improvement as determined by our appointed actuary. Present values are calculated using an interest rate of 3.90% and 3.32% as of December 31, 2018 and 2017, respectively.
In 2018, we entered into a reinsurance arrangement with an affiliate to assume death in service pension liability which is an annuity payable to the designated beneficiary. The annuity period is usually lifetime for a spouse and until ages 21-23 for a minor dependent.
Average Annual Percentage Payout of Incurred Losses by Age, Net of Reinsurance (unaudited)
Year 1 2 3 4 5 6 7 8 9 10
US and Canada Excess Casualty 0.0% 0.2% 11.3% 8.2% 14.1% 7.6% 14.6% 2.5% 0.3% 0.4%
US and Canada Financial Lines 0.2 2.0 12.6 (1.3) 12.5 0.1 10.5 6.3 - -
Japan Excess Casualty - 0.2 5.2 2.7 3.3 31.9 15.2 11.7 - -
Japan Primary Casualty 54.4 29.2 5.5 3.9 2.9 1.6 0.6 0.2 0.2 0.2
Worldwide Property via MGA 10.4 35.4 10.1 5.3 - - - - - -
Japan Personal Lines Auto 66.9 19.0 6.1 3.5 2.1 1.1 0.6 0.4 0.5 0.1
Japan Personal Accident and Health 54.0 38.8 5.7 1.7 0.8 0.5 0.2 0.2 0.1 -
China Accident and Health 53.7 33.0 8.5 3.0 0.4 (0.2) 0.2 0.2 0.3 0.2
Ireland Healthcare 58.1 37.8 2.9 - - - - - - -
As at December 31,
(in millions) 2018 2017
Future policy benefits:
Closed block of deferred annuities (a) 1,034$ 1,159$
Long duration life insurance contracts 11 11
Accident and health insurance contracts 14 14
Immediate annuities 47 -
Total future policy benefits $1,106$ 1,184$

American International Reinsurance Company, Ltd. and Subsidiary Notes to Consolidated Financial Statements
46
9. Income Taxes
We made an election to be treated as a United States corporation for purposes of imposing United States tax under section 953(d) of the Internal Revenue Code. A $10 million letter of credit was secured for the benefit of the Internal Revenue Service (“IRS”) that may be drawn upon in the event that we do not pay tax in accordance with the terms of the statement of notice and demand. See Note 16 for additional information. We file a consolidated US federal income tax return with AIG. We are allocated US federal income taxes based upon a tax payment allocation agreement with AIG, effective January 1, 2018 and approved by our Board of Directors. This agreement provides that we shall accrue taxes that would have been paid by us if we had filed a separate federal income tax return and AIG shall reimburse us for certain tax benefits, with limited exceptions. Additionally, while the agreement described above governs the current and deferred tax recorded in the income tax provision, the amount of cash that will be paid or received for US federal income taxes may at times be different. The terms of this agreement are based on principles consistent with the allocation of income tax expense or benefit on a separate company basis, except that:
• Our separate company taxable income shall include net capital gains as reported in consolidated taxable income and any separate return limitation year (“SRLY”) loss carryovers as set forth in Treas. Reg. §1.1502-21(c) that would have been absorbed on a separate return basis.
• We have a reinsurance treaty in place with an AIG affiliate that also files a consolidated US federal income tax return with AIG. Any taxable income or loss attributable to that treaty is excluded from our separate company taxable income.
• Our separate company taxable income shall exclude charitable contributions, carryovers or carrybacks attributable to net operating losses (other than SRLY loss carryovers), net capital losses and dividends received from companies included in the consolidated return.
• The sections of the Internal Revenue Code relating to the Base Erosion Anti-abuse Tax ("BEAT") are applied, but only if the AIG consolidated group is subject to BEAT in the Consolidated Tax Liability.
AIG agrees to reimburse us for any tax benefit arising out of the use in the consolidated return of any of our charitable contributions, carryovers or carrybacks attributable to net operating losses (other than SRLY loss carryovers), net capital losses, tax credits and dividends received deduction to the extent not used to offset other income of ours as calculated on a separate return basis and for an amount by which, but for such benefit, the federal income tax liability of AIG’s consolidated group would have been greater. Once we are compensated for such benefit, it cannot use such benefits in the calculation of our tax liability under the separate return basis. Federal income taxes payable under the payment allocation agreement at December 31, 2018 and 2017 were $2 million.
US Tax Reform Overview
On December 22, 2017, the United States enacted Public Law 115-97, known as the Tax Cuts and Jobs Act (“the Tax Act”). The Tax Act reduces the statutory rate of US federal corporate income tax to 21 percent and enacts numerous other changes impacting us.
During December 2017, the Securities and Exchange Commission staff issued Staff Accounting Bulletin 118 (“SAB 118”), which provides guidance on accounting for the tax effects of the Tax Act. SAB 118 addresses situations where accounting for certain income tax effects of the Tax Act under ASC 740 may be incomplete upon issuance of an entity’s financial statements and provides a one-year measurement period from the enactment date to complete the accounting under ASC 740. In accordance with SAB 118, a company must reflect the following:
• Income tax effects of those aspects of the Tax Act for which accounting under ASC 740 is complete;
• Provisional estimate of income tax effects of the Tax Act to the extent accounting is incomplete but a reasonable estimate is determinable; and
• If a provisional estimate cannot be determined, ASC 740 should still be applied on the basis of tax law provisions that were in effect immediately before the enactment of the Tax.
At December 31, 2017, we originally recorded a provisional estimate of income tax effects of the Tax Act of $32 million attributable to the reduction in the US corporate income tax rate. Our provisional estimate was based in part on a reasonable estimate of the effects of the statutory income tax rate reduction on existing deferred tax balances and of certain provisions of the Tax Act. We filed our 2017 consolidated US income tax return and have completed our review of the primary impact of the Tax Act provisions on our deferred taxes. As a result, we consider the accounting for the effects of the rate change on deferred tax balances to be complete and no material measurement period changes were recorded for this item. As further guidance is issued by the US tax authority, any resulting changes in our estimates will be treated in accordance with the relevant accounting guidance.
The Tax Act includes provisions for Global Intangible Low-Taxed Income (“GILTI”), under which taxes on foreign income are imposed on the excess of a deemed return on tangible assets of foreign corporations and for Base Erosion and Anti-Abuse Tax (“BEAT”), under which taxes are imposed on certain base eroding payments to affiliated foreign companies. There are substantial uncertainties in the interpretation of BEAT and GILTI and while certain formal guidance was issued by the US tax authority, there are still aspects of the

American International Reinsurance Company, Ltd. and Subsidiary Notes to Consolidated Financial Statements
47
Tax Act that remain unclear and additional guidance is expected in 2019. Such guidance may result in changes to the interpretations and assumptions we made and actions we may take, which may impact amounts recorded with respect to international provisions of the Tax Act, possibly materially. Consistent with accounting guidance, we treat BEAT as a period tax charge in the period the tax is incurred and have made an accounting policy election to treat GILTI taxes in a similar manner. No provision for income tax related to GILTI or BEAT was recorded as of December 31, 2018.
Tax Effects for Which a Reasonable Estimate Can Be Determined
Provisions Impacting Property and Casualty Insurance Companies
The Tax Act modified computations of insurance reserves for property and casualty insurance companies. Specifically, the Act extends the discount period for certain long-tail lines of business from 10 years to 24 years and increases the discount rate, replacing the applicable federal rate for a higher-yield corporate bond rate, and eliminates the election allowing companies to use their historical loss payment patterns for loss reserve discounting. Adjustments related to the differences in insurance reserves balances computed historically versus the Tax Act have to be taken into income over eight years. Accordingly, at December 31, 2017, these changes gave rise to a new deferred tax liability. We have recorded a reasonable estimate of $2 million with respect to this deferred tax liability. This increase in deferred tax liabilities is offset by an increase in the deferred tax asset related to loss reserves as a result of applying the new provisions of the Tax Act.
As of December 31, 2018, we have completed our review of the tax reserve computations and recorded offsetting increases of less than $1 million to both our deferred tax liabilities and deferred tax assets.
Provisions Impacting Projections of Taxable Income and Admissibility of Deferred Tax Assets
Certain provisions of the Tax Act impact the projections of future taxable income used in analyzing realizability of the deferred tax assets. In certain instances, provisional estimates have been included in the future taxable income projections for these specific provisions to reflect application of the new tax law. We do not currently anticipate that the reliance on provisional estimates would have a material impact on our determination of realizability of our deferred tax assets.
Tax Effects for Which No Estimate Can Be Determined
The Tax Act may affect the results in certain investments and partnerships in which we are a non-controlling interest owner. At December 31, 2017, the information needed to determine a provisional estimate was not available (such as for interest deduction limitations in those entities and the changed definition of a US Shareholder), and accordingly, no provisional estimates were recorded. We have since completed our review of these investments and partnerships. We consider the accounting for this item to be complete and no measurement period change was recorded.
US Tax Reform – SAB 118 Measurement Period Completion
As of December 31, 2018, we have fully completed our accounting for the tax effects of the Tax Act. Although the prescribed measurement period has ended, there are aspects of the Tax Act that remain unclear and additional guidance from the US tax authority is pending. As further guidance is issued by the US tax authority, any resulting changes in our estimates will be treated in accordance with the relevant accounting guidance.
Total Income Tax Expense
The tax provision from continuing operations differs from the amount that would be computed by taking the pretax income from continuing operations and multiplying it by the US statutory tax rate primarily because of the statutory rate differential from income earned in Bermuda.
The following table presents the income tax expense attributable to pre-tax income from continuing operations:
Years Ended December 31,
(in millions) 2018 2017
Income tax expense attributable to income from continuing operations:
Current - $ -
Deferred 5 43
Total 5$ 43$

American International Reinsurance Company, Ltd. and Subsidiary Notes to Consolidated Financial Statements
48
Deferred Taxes As of December 31, 2018 and 2017, we had gross deferred tax assets of $164 million and $159 million and gross deferred tax liabilities of $101 million and $112 million, respectively. As of December 31, 2018 and 2017, we had net deferred tax assets of $63 million and $47 million, respectively, resulting in a $16 million change overall. The significant components of this balance include deferred tax items relating to temporary differences associated with loss reserves, unearned premiums, deferred acquisition costs, unrealized gains on investments, and net operating losses. We had no valuation allowance as of December 31, 2018 and 2017. See the section “Valuation Allowance on Deferred Tax Assets” below for further details. As of December 31, 2018, we had federal net operating loss carry forwards of $434 million which were generated by the Company, a foreign operation, prior to making the election to be taxed as a US domestic corporation. The losses were generated through operations effectively connected to US related business, the use of which is limited to future income generated by our US Tax Filing Group and subject to utilization limitations under the IRS’ SRLY rules. The federal net operating loss carry forwards expire by 2029.
As of December 31, 2018, we had federal capital loss carryforwards of $1 million. Pursuant to our tax sharing agreement, any capital losses that are not expected to be utilized on the consolidated tax return will be carried forward until such time that they can be utilized. The capital loss carry forwards will expire by 2023.
Valuation Allowance on Deferred Tax Assets
We evaluate the recoverability of deferred tax assets and establish a valuation allowance, if necessary, to reduce the deferred tax asset to an amount that is more likely than not to be realized (a likelihood of more than 50 percent).
The evaluation of the recoverability of the deferred tax asset and the need for a valuation allowance requires us to weigh all positive and negative evidence to reach a conclusion that it is more likely than not that all or some portion of the deferred tax asset will not be realized. The weight given to the evidence is commensurate with the extent to which it can be objectively verified. The more negative evidence that exists, the more positive evidence is necessary and the more difficult it is to support a conclusion that a valuation allowance is not needed.
Our framework for assessing the recoverability of deferred tax assets requires consideration of all available evidence, including:
• The nature, frequency, and severity of cumulative financial reporting losses in recent years;
• The predictability of future operating profitability of the character necessary to realize the net deferred tax asset;
• The carry forward periods for the net operating loss, capital loss and foreign tax credit carry forwards, including the effect of reversing taxable temporary differences; and
• Prudent and feasible tax planning strategies that would be implemented, if necessary, to protect against the loss of the deferred tax asset.
For the years ended December 31, 2018 and December 31, 2017, management believes that it is more likely than not that these assets will be realized, therefore, we have not recorded a valuation allowance against our deferred tax assets.
Accounting for Uncertainty in Income Taxes
At December 31, 2018 and December 31, 2017, we have no accrued reserves for uncertain tax positions, and we do not believe that there will be a significant change within the next twelve months.
The US is the only major tax jurisdiction of the Company. The statute of limitations for all tax years prior to 2000 has expired for the consolidated federal income tax return. We are currently under examination for the tax years 2000 through 2013 and open to examination through 2017.
10. Related Party Transactions
Reinsurance
Reinsurance transactions with related parties are shown in Note 7 – Reinsurance.
Affiliated Services
AIG and its subsidiaries provide various services to us pursuant to written cost sharing arrangements that we are party to, and for which we are charged various fees. Such charges are not necessarily indicative of what we would have incurred if we were a separate, stand-alone entity from AIG. The amount of such affiliated charges included in the Consolidated Income Statements was $2 million and $2 million for the years ended December 31, 2018 and 2017, respectively.
Additionally, AIG incurs certain cost on our behalf for which is recharged to us. During 2018 and 2017, amounts of $35 million and $17 million, respectively, were recognized as expenses by us.

American International Reinsurance Company, Ltd. and Subsidiary Notes to Consolidated Financial Statements
49
Balance Due To / From Related Parties
In addition to the amounts described elsewhere in these financial statements, the Consolidated Balance Sheets also include the following balances with related parties:
Derivative Agreements
We have derivatives agreements with an affiliate. See Note 13 for additional information.
Return of Capital and Dividends
In the ordinary course of business, we issued a cash dividend to our parent for $50 million in March 2018.
In the ordinary course of business, we issued a dividend comprised of bonds available for sale to our parent for $150 million in March 2017.
11. Share-based and Other Compensation Plans
AIG sponsors Long Term Incentive Plans (“LTIP”) that provide for annual awards to certain employees, including senior executive officers and other highly compensated employees that may be comprised of performance share units (“PSUs”), restricted stock units (“RSUs”), and/or stock options.
The number of PSUs issued on the grant date (the target) provides the opportunity for the LTIP participant to receive shares of AIG Common Stock based on AIG achieving specified performance goals at the end of a three-year performance period. These performance goals are pre-established by AIG’s Compensation and Management Resources Committee for each annual grant and may differ from year to year. The actual number of PSUs earned can vary from zero to 200 percent of the target for the 2018 and 2017 awards, or zero to 150 percent of the target for the 2013 through 2016 awards, depending on AIG’s performance relative to a specified peer group or against pre-established financial goals, as applicable. RSUs are earned based on continued service by the participant.
Vesting occurs on January 1 of the year immediately following the end of the three-year performance period. For awards granted prior to 2017, vesting occurs in three equal installments beginning on January 1 of the year immediately following the end of a performance period and January 1 of each of the next two years. Recipients must be employed at each vesting date to be entitled to share delivery, except upon the occurrence of an accelerated vesting event, such as an involuntary termination without cause, disability, retirement eligibility or death during the vesting period.
LTI awards granted in 2015 and thereafter accrue dividend equivalent units (“DEUs”) in the form of additional PSUs and/or RSUs whenever a cash dividend is declared on shares of AIG Common Stock; the DEUs are subject to the same vesting terms and conditions as the underlying unit.
We get an allocation from AIG for these expenses. We recognized compensation expense of $77 million and $65 million as of December 31, 2018 and 2017, respectively, based on the value of AIG’s common stock on the date of grant.
Prior to 2014, some of our officers and key employees were granted restricted stock units and stock appreciation rights that provide for cash settlement linked to the value of AIG common stock if certain requirements were met. We recorded expenses of $4 million for these awards at December 31, 2017, to reflect changes in the value of AIG common stock. There were no expenses recorded at December 31, 2018.
As at December 31,
(in millions) 2018 2017
Non-insurance balances receivable 550$ 589$
Premium and insurance balances receivable - 120
Reinsurance assets 1,877 2,297
Funds held by companies under reinsurance contracts asset 41 -
Non-insurance balances payable 95 84
Reinsurance balances payable 105 81
Premium and insurance balances payable 62 259
Funds held under reinsurance treaties liability 849 925

American International Reinsurance Company, Ltd. and Subsidiary Notes to Consolidated Financial Statements
50
Modification of LTI awards
During the fourth quarter of 2017, AIG modified certain outstanding LTI awards by concurrently issuing service-based RSUs and canceling some previously granted PSUs. The modification applied to most recipients who participate in the 2016 and 2017 LTI awards, excluding certain of our senior executives. In addition, AIG also issued supplemental RSU grants to certain active employees, which vest in installments over a period of up to three years. We did not incur any material incremental compensation expense as a result of these actions.
12. Defined Benefit Pension Plans
Employees of AIG, its subsidiaries and certain affiliated companies, are generally covered under various pension plans. US salaried employees who are employed by a participating company on or before December 1, 2014 and who have completed 12 months of continuous service are eligible to participate in the plan. AIG, as sponsor, is ultimately responsible for the maintenance of these plans in compliance with applicable laws. We are not directly liable for obligations under these plans; our obligation results from AIG’s allocation of our share of expenses from the plans based on participants’ earnings for the pension plans and on estimated claims less contributions from participants for the postretirement plans.
Effective January 1, 2016, the US defined benefit pension plans were frozen. Consequently, these plans are closed to new participants and current participants no longer earn benefits. However, interest credits continue to accrue on the existing cash balance accounts and participants are continuing to accrue years of service for purposes of vesting and early retirement eligibility and subsidies as they continue to be employed by AIG and its subsidiaries.
We have participants in each of the following AIG employee retirement plans:
Postretirement Benefit Plans
The Postretirement Benefit plan provides postretirement medical care and life insurance benefits in the US and in certain non-US countries. Our employees covered in this plan are for the Mobile Overseas Personnel (“MOPS”) which are US citizens stationed abroad. Eligibility in the various plans is generally based upon completion of a specified period of eligible service and attaining a specified age. Overseas, benefits vary by geographic location. Our allocated share of net expense for the postretirement plan was $1 million and $1 million for the years ended December 31, 2018 and 2017, respectively.
Bermuda Postretirement Benefit Plan
In addition, we provide a postretirement plan in Bermuda for our local employees. Employees hired prior to January 1, 2007 are eligible for normal or early retirement with medical benefits after attaining the age of 55 with five years of service. Employees hired on or after January 1, 2007 are eligible for early retirement with medical benefits after the earlier of attaining age 50 with 20 years of service or age 65 with 15 years of service. Employees hired on or after February 1, 2009 are not eligible for postretirement medical benefits. The postretirement expense for the local plan was $3 million and $4 million for the years ended December 31, 2018 and 2017, respectively.

American International Reinsurance Company, Ltd. and Subsidiary Notes to Consolidated Financial Statements
51
The following table presents the funded status of the plans reconciled to the amount reported in the Consolidated Balance Sheets. The measurement date for the post retirement plan is December 31, consistent with the fiscal year end of the sponsoring company.
The following table presents the components of net periodic benefit cost with respect to pensions and other postretirement benefits:
The estimated amortization from accumulated other comprehensive income for net gain (loss) that will be amortized into net periodic benefit cost over the next fiscal year will be zero.
Assumptions
The following table summarizes the weighted average assumptions used to determine the benefit obligations:
As of or for the Years Ended December 31,
(in millions) 2018 2017
Change in projected benefit obligation:
Benefit obligation at beginning of year 51$ 50$
Service cost 1 1
Interest cost 2 2
Actuarial loss (gain) (14) (2)
Projected benefit obligation at end of year 40 51
Change in plan assets:
Employer direct benefit payments 1 (1)
Direct benefit payments (1) 1
Fair value of plan assets at end of year - -
Funded status at end of year 40 51
Amounts recognized in the balance sheet:
Liabilities 40 51
Pre-tax amounts recognized in accumulated other comprehensive income:
Net gain (loss) 4 (10)
Total amounts recognized 4$ (10)$
As at December 31,
(in millions) 2018 2017
Components of net periodic benefit cost
Service cost 1$ 1$
Interest cost 2 2
Net periodic benefit cost 3 3
Total recognized in accumulated other comprehensive loss (income) (14) (2)
Total recognized in net periodic benefit cost and other comprehensive loss (11)$ 1$
As at December 31, 2018 2017
Discount rate 4.22% 3.61%
Rate of compensation increase N/A N/A

American International Reinsurance Company, Ltd. and Subsidiary Notes to Consolidated Financial Statements
52
The following table summarizes assumed health care cost trend rates:
A one percent point change in the assumed healthcare cost trend rate would have the following effect on our postretirement benefit obligations:
The following table presents the weighted average assumptions used to determine the net periodic benefit costs:
(a) Effective Febuary 1, 2009, the Bermuda Postretirement Benefit plan was frozen.
Defined Contribution Plans AIG sponsors a 401(k) plan which provides for pre-tax salary reduction contributions by its US employees. AIG made matching contributions of 100 percent of the first six percent of eligible compensation contributed by a participant on a pre-tax and/or Roth after-tax basis and also provides a non-elective, non-discretionary Company contribution of 3% of eligible compensation up to the Internal Revenue Service (“IRS”) maximum employee compensation limit. Effective January 1, 2016, AIG provides participants in the AIG Incentive Savings Plan an additional fully vested, non-elective, non-discretionary employer contribution equal to three percent of the participant’s annual base compensation for the plan year, paid each pay period regardless of whether the participant currently contributes to the plan and subject to the IRS-imposed limitations. Pre-tax expenses associated with these plans were $1 million and $1 million in 2018 and 2017, respectively.
13. Derivative Financial Instruments
Derivative financial instruments are financial arrangements among two or more parties with returns linked to or “derived” from some underlying equity, debt, commodity or other asset, liability, or foreign exchange rate or other index or the occurrence of a specified payment event. Derivative payments may be based on interest rates, exchange rates, prices of certain securities, commodities, or financial or commodity indices or other variables. Derivatives are reflected at fair value in the accompanying Consolidated Balance Sheets in other assets or other liabilities.
We use derivatives and other instruments as part of our financial risk management programs. Interest rate derivatives (such as interest rate swaps) are used to manage interest rate risk associated with our investments in fixed income securities, and other interest rate sensitive assets and liabilities. In addition, foreign exchange derivatives (principally cross currency swaps and forwards) are used to reduce the risk from fluctuations in foreign exchange rates associated with non-US dollar denominated investments and net capital exposures. Changes in value are reported in realized capital gains and losses.
We have engaged in derivative transactions with an affiliate under an International Swaps and Derivatives Association, Inc. (“ISDA”) Master Agreement, which also includes Credit Support Annex (“CSA”) provisions. Collateral posted by us for derivative transactions was $35 million and $40 million at December 31, 2018 and December 31, 2017, respectively. Collateral provided to us for derivative transactions was $402 million and $479 million at December 31, 2018 and December 31, 2017, respectively. Collateral can be in the form of cash or US government obligations. We have elected to present all derivative receivables and derivative payables, and the related cash collateral received and paid, on a net basis on our Consolidated Balance Sheets when a legally enforceable ISDA Master Agreement exists.
We are party to derivative contracts with an affiliate, which are specifically related to the closed block of deferred annuities. We are under this contract party to interest rate swaps and cross currency swaps. We use these interest rate swaps on this business to drive
As at December 31, 2018 2017
Immediate trend rate 6.31% 6.58%
Ultimate trend rate 4.50% 4.50%
Year that the rate reaches ultimate trend rate 2038 2038
As at December 31,
(in millions) 2018 2017
One percent increase 9 12
One percent decrease (7) (8)
As at December 31, 2018 2017
Discount rate 3.61% 4.15%
Rate of compensation increase (a) N/A N/A
Expected return on assets N/A N/A

American International Reinsurance Company, Ltd. and Subsidiary Notes to Consolidated Financial Statements
53
the effective duration of the liability and the assets to zero, for protection against interest rate volatility and the cross currency swaps to reduce volatility attributed to foreign currency exchange rates.
Under the terms of a retrocession agreement, an affiliated reinsurance company is entitled to gains and losses associated with the aforementioned interest rate swaps and foreign currency derivatives. As such, an equal and opposite position to the net derivative asset as of December 31, 2018 and December 31, 2017 has been recorded in the balance sheet as a liability to the affiliated reinsurance company. See Note 7 for additional information.
During 2016, we entered into a derivative with an affiliate as a fair value hedge of an available for sale investment security. The fair value hedge is a cross currency swap designated as a hedge of the change in fair value of a foreign currency denominated available for sale security attributable to changes in foreign exchange rates.
The following table presents the fair value of derivative positions held by us:
a) Notional amount represents a standard of measurement of the volume of derivatives business. Notional amount is generally not a quantification of market risk or credit risk and is not recorded on the Consolidated Balance Sheets. Notional amounts generally represent those amounts used to calculate contractual cash flows to be exchanged and are not paid or received, except for certain contracts such as currency swaps.
b) Represents netting of derivative exposures covered by a qualifying master netting agreement. c) Represents cash collateral posted and received that is eligible for netting.
December 31, 2018
(in millions)
Derivatives designated as hedging instruments:
Foreign exchange contracts 76$ 2$ 16$ -$
Derivatives not designated as hedging instruments:
Foreign exchange contracts 803 16 75 48
Interest rate contracts 743 531 579 108
Total derivatives not designated as hedging instruments 1,546 547 654 156
Total derivatives, gross 1,622 549 670 156
Counterparty netting(b) - (156) - (156)
Cash Collateral(c) - (367) - -
Total derivatives, net 1,622$ 26$ 670$ -$
Gross Derivative Assets
Gross Derivative
Liabilities
Notional
Amount(a) Fair Value
Notional
Amount(a) Fair Value
December 31, 2017
(in millions)
Derivatives designated as hedging instruments:
Foreign exchange contracts -$ -$ 40$ 1$
Derivatives not designated as hedging instruments:
Foreign exchange contracts 43 - 427 54
Interest rate contracts 759 643 639 138
Total derivatives not designated as hedging instruments 802 643 1,066 192
Total derivatives, gross 802 643 1,106 193
Counterparty netting(b) - (193) - (193)
Cash Collateral(c) - (439) - -
Total derivatives, net 802$ 11$ 1,106$ -$
Gross Derivative Assets
Gross Derivative
Liabilities
Notional
Amount(a) Fair Value
Notional
Amount(a) Fair Value

American International Reinsurance Company, Ltd. and Subsidiary Notes to Consolidated Financial Statements
54
14. Accumulated Other Comprehensive Income The following table shows the components of accumulated other comprehensive income:
15. Statutory Financial Data and Restrictions
We prepare financial statements in accordance with statutory accounting practices prescribed or permitted by the Bermuda Monetary Authority (“BMA”). The principal difference between statutory financial statements and financial statements prepared in accordance with GAAP are that for statutory financial statements assets and liabilities are presented net of reinsurance and certain assets are non-admitted.
As of December 31, 2018 and 2017, our statutory net income was $11 million and $41 million and unconsolidated statutory capital and surplus was $985 million and $1,082 million, respectively.
Under Bermuda insurance law, we are permitted to pay shareholder dividends in any year, without prior approval from the BMA, in an amount less than 25% of prior year statutory capital and surplus and that does not reduce statutory capital by 15% or more.
(in millions)
Unrealized
Investment
Gains (Losses)
Foreign
Currency
Translation
Adjustments
Retirement
Plan Liability
Total Accumulated
Other
Comprehensive
Income (Loss)
Balance at December 31, 2016 175$ 17$ (8)$ 184$
Other comprehensive income (loss) 17 (18) 1 -
Other comprehensive income (loss) - tax 2 - - 2
Other comprehensive income (loss) net of tax 19 (18) 1 2
Balance at December 31, 2017 194$ (1)$ (7)$ 186$
(in millions)
Unrealized
Investment
Gains (Losses)
Foreign
Currency
Translation
Adjustments
Retirement
Plan Liability
Total Accumulated
Other
Comprehensive
Income (Loss)
Balance at December 31, 2017 194$ (1)$ (7)$ 186$
Cumulative effect of change in accounting (7) - - (7)
Other comprehensive income (loss) (101) 8 14 (79)
Other comprehensive income (loss) - tax 22 (1) - 21
Other comprehensive income (loss) net of tax (79) 7 14 (58)
Balance at December 31, 2018 108$ 6$ 7$ 121$
As of or for the Years Ended December 31, 2018
(in millions) AIRCO AICO Total
Statutory surplus $ 878 $ 107 $ 985
Statutory net income $ 12 $ (1) $ 11
As of or for the Years Ended December 31, 2017
(in millions) AIRCO AICO Total
Statutory surplus $ 991 $ 91 $ 1,082
Statutory net income $ 37 $ 4 $ 41

American International Reinsurance Company, Ltd. and Subsidiary Notes to Consolidated Financial Statements
55
16. Commitments and Contingencies
In the normal course of business, various commitments and contingent liabilities are entered into by us or our subsidiary. Contingent liabilities arising from litigation, income taxes and regulatory and other matters are not considered material in relation to our consolidated financial position, results of operations or cash flows.
Commitments
Pension related obligations – Maturity Annuity Fund (“MAF”) and Deposit Administration Fund (“DAF”)
AIG is a sponsor of an unfunded defined benefit plan (AIO Plan) for select third country nationals (“TCNs”) who are not US citizens and are, or have been, employed by an affiliate of ours. In November 2006, we executed a Letter of Agreement (the Agreement) with AIG to contractually bind us for the pension benefit obligation associated with TCNs who had retired in 2005 and prior. In addition we are also contractually obligated to pay certain annuity benefits for third party plans, in total (the MAF Liability). As of December 31, 2018 and 2017, the future policy benefits associated with the MAF Liabilities were $11 million and $11 million, respectively.
In regards to TCNs who were active or who retire post 2005, the Agreement established that the pension benefit obligation would remain with AIG and that we would only act as a service agent of AIG. In our role as service agent, we collect plan contributions, pays benefit payments and issues periodic statements showing the period movement for the DAF, including interest earned and expenses incurred. As of December 31, 2018 and 2017, the DAF balance is $10 million and $14 million, respectively, and is reflected by us as a liability to AIG in other liabilities.
Letters of Credit
We have directed a third party bank to issue a letter of credit in the amount of $10 million in favor of the IRS. See Note 9 for additional information. The letter of credit is a condition of the IRS in granting the 953(d) election and is collateralized by a $10 million time deposit. In the ordinary course of business, we have also directed two other third party banks to issue letter of credits totaling $61 million and $48 million in favor of third party insurers at December 31, 2018 and December 31, 2017, respectively.
AIG, as applicant, arranged with third party banks to issue standby letters of credit in the aggregate amount of $125 million in favor of us, as beneficiary, to be included as statutory capital. The aggregate amount as of the standby letters of credit as of December 31, 2018 and 2017 is $125 million.
Reinsurance Collateral
As referenced in Note 7, we maintain a custodial account with certain assets related to our assumption of a closed block of deferred annuities. However, we have retroceded to an affiliate our obligation to pledge or otherwise provide any additional collateral required to satisfy the contractual insufficiency. Therefore, the pledging of such collateral did not have a significant impact on our equity or net income.
Contingent Liabilities
We are sometimes involved in litigation and arbitration, both as a defendant and as a plaintiff. The litigation and arbitration ordinarily involves our activities as an insurer, employer or investor.
It is not feasible to predict or determine the ultimate outcome of all legal or arbitration proceedings or to provide reasonable ranges of potential losses. Based on current available information, management believes that the outcomes of litigation and arbitration matters are not likely, either individually or in aggregate, to have a material adverse effect on our consolidated financial condition. However, it is possible that the effect would be material to our results of operations for an individual reporting period.
17. Subsequent Events We evaluated the need to disclose events that occurred subsequent to the balance sheet date through April 30, 2019, the date these financial statements were available to be issued.
Effective January 1, 2019, new and renewal business will no longer be assumed from a third party insurer for China Personal Accident and Health business. After due consideration, it was agreed with our counterparty not to renew this reinsurance agreement which represented a significant portion of assumed premiums.
In the ordinary course of business, we issued a cash dividend of $50 million in March, 2019.
We have concluded that no other subsequent events have occurred that would require recognition or disclosure in the consolidated financial statements