american midstream partners, lp -...
TRANSCRIPT
UNITED STATESSECURITIES AND EXCHANGE COMMISSION
Washington, D.C. 20549
FORM 10-Qx QUARTERLY REPORT PURSUANT TO SECTION 13 OR 15(d) OF THE SECURITIES EXCHANGE ACT OF 1934
For the quarterly period ended June 30, 2017
or
¨ TRANSITION REPORT PURSUANT TO SECTION 13 OR 15(d) OF THE SECURITIES EXCHANGE ACT OF 1934
For the transition period from to
Commission File Number: 001-35257
AMERICAN MIDSTREAM PARTNERS, LP(Exact name of registrant as specified in its charter)
Delaware 27-0855785(State or other jurisdiction of
incorporation or organization)(I.R.S. Employer
Identification No.)
2103 CityWest Boulevard Building #4, Suite 800
Houston, TX 77042(Address of principal executive offices) (Zip code)
(346) 241-3400(Registrant’s telephone number, including area code)
Indicate by check mark whether the registrant (1) has filed all reports required to be filed by Section 13 or 15(d) of the Securities Exchange Act of 1934 during the preceding 12months (or for such shorter period that the registrant was required to file such reports), and (2) has been subject to such filing requirements for the past 90 days. ý Yes ¨ No
Indicate by check mark whether the registrant has submitted electronically and posted on its corporate Web site, if any, every Interactive Data File required to be submitted andposted pursuant to Rule 405 of Regulation S-T (§232.405 of this chapter) during the preceding 12 months (or for such shorter period that the registrant was required to submitand post such files). ý Yes ¨ No
Indicate by check mark whether the registrant is a large accelerated filer, an accelerated filer, a non-accelerated filer, a smaller reporting company or an emerging growthcompany. See the definitions of “large accelerated filer,” “accelerated filer,” “smaller reporting company” or an “emerging growth company” in Rule 12b-2 of the Exchange Act.(Check one):
Large accelerated filer ¨ Accelerated filer ý
Non-accelerated filer ¨ (Do not check if a smaller reporting company) Smaller reporting company ¨
Emerging growth company ¨
If an emerging growth company, indicate by check mark if the registrant has elected not to use the extended transition period for complying with any new or revisedfinancial accounting standards provided pursuant to Section 13(a) of the Exchange Act. ¨
Indicate by check mark whether the registrant is a shell company (as defined in Rule 12b-2 of the Exchange Act). ¨ Yes ý No
There were 51,759,787 common units, 10,400,213 Series A Units, 8,792,205 Series C Units and 2,333,333 Series D Units of American Midstream Partners, LPoutstanding as of August 3, 2017 . Our common units trade on the New York Stock Exchange under the ticker symbol “AMID.”
Table of Contents
Glossary of Terms
As generally used in the energy industry and in this Quarterly Report on Form 10-Q (the “ Quarterly Report ”), the identified terms have the following meanings:
Bbl Barrels: 42 U.S. gallons measured at 60 degrees Fahrenheit.
Bbl/d Barrels per day.
Btu British thermal unit; the approximate amount of heat required to raise the temperature of one pound of water by one degree Fahrenheit.
Condensate Liquid hydrocarbons present in casing head gas that condense within the gathering system and are removed prior to delivery to the natural gasplant. This product is generally sold on terms more closely tied to crude oil pricing.
/d Per day.
FERC Federal Energy Regulatory Commission.
Fractionation Process by which natural gas liquids are separated into individual components.
GAAP Generally Accepted Accounting Principles in the United States of America.
Gal Gallons.
Mgal/d Thousand gallons per day.
MBbl Thousand barrels.
MMBbl Million barrels.
MMBbl/day Million barrels per day.
MMBtu Million British thermal units.
Mcf Thousand cubic feet.
MMcf Million cubic feet.
MMcf/d Million cubic feet per day.
NGL or NGLs Natural gas liquid(s): The combination of ethane, propane, normal butane, isobutane and natural gasoline that, when removed from natural gas,become liquid under various levels of higher pressure and lower temperature.
Throughput The volume of natural gas and NGL transported or passing through a pipeline, plant, terminal or other facility during a particular period.
As used in this Quarterly Report, unless the context otherwise requires, “we,” “us,” “our,” the “Partnership” and similar terms refer to American MidstreamPartners, LP, together with its consolidated subsidiaries.
2
TABLE OF CONTENTS
Page
PART I. FINANCIAL INFORMATION 4Item 1. Financial Statements (Unaudited) 4
Condensed Consolidated Balance Sheets as of June 30, 2017 and December 31, 2016 (unaudited) 4 Condensed Consolidated Statements of Operations for the three and six months ended June 30, 2017 and 2016 (unaudited) 5
Condensed Consolidated Statements of Comprehensive Loss for the three and six months ended June 30, 2017 and 2016(unaudited)
6
Condensed Consolidated Statements of Changes in Partners’ Capital and Noncontrolling Interests as of and for the sixmonths ended June 30, 2017 and 2016 (unaudited) 7
Condensed Consolidated Statements of Cash flows for the six months ended June 30, 2017 and 2016 (unaudited) 8 Notes to Condensed Consolidated Financial Statements 10
Item 2. Management’s Discussion and Analysis of Financial Condition and Results of Operations 39 Forward Looking Statements 39 Overview 40 Recent Developments 41 Our Operations 44 How We Evaluate Our Operations 48 General Trends and Outlook 52 Results of Operations 52 Liquidity and Capital Resources 66 Critical Accounting Policies 70 Recent Accounting Pronouncements 70
Item 3. Quantitative and Qualitative Disclosures About Market Risk 70
Item 4. Controls and Procedures 71 PART II. OTHER INFORMATION 72
Item 1. Legal Proceedings 72Item 1A. Risk Factors 72Item 6. Exhibits 73
3
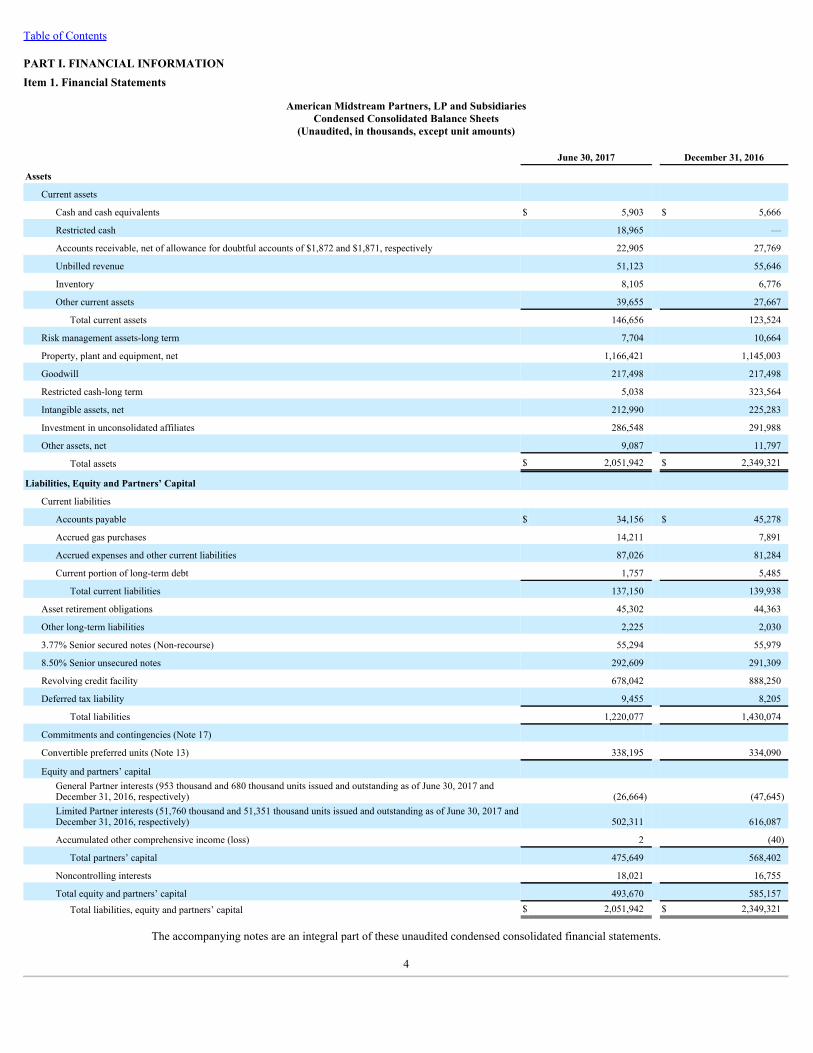
Table of Contents
PART I. FINANCIAL INFORMATIONItem 1. Financial Statements
American Midstream Partners, LP and SubsidiariesCondensed Consolidated Balance Sheets
(Unaudited, in thousands, except unit amounts)
June 30, 2017 December 31, 2016
Assets
Current assets
Cash and cash equivalents $ 5,903 $ 5,666
Restricted cash 18,965 —
Accounts receivable, net of allowance for doubtful accounts of $1,872 and $1,871, respectively 22,905 27,769
Unbilled revenue 51,123 55,646
Inventory 8,105 6,776
Other current assets 39,655 27,667
Total current assets 146,656 123,524
Risk management assets-long term 7,704 10,664
Property, plant and equipment, net 1,166,421 1,145,003
Goodwill 217,498 217,498
Restricted cash-long term 5,038 323,564
Intangible assets, net 212,990 225,283
Investment in unconsolidated affiliates 286,548 291,988
Other assets, net 9,087 11,797
Total assets $ 2,051,942 $ 2,349,321
Liabilities, Equity and Partners’ Capital
Current liabilities
Accounts payable $ 34,156 $ 45,278
Accrued gas purchases 14,211 7,891
Accrued expenses and other current liabilities 87,026 81,284
Current portion of long-term debt 1,757 5,485
Total current liabilities 137,150 139,938
Asset retirement obligations 45,302 44,363
Other long-term liabilities 2,225 2,030
3.77% Senior secured notes (Non-recourse) 55,294 55,979
8.50% Senior unsecured notes 292,609 291,309
Revolving credit facility 678,042 888,250
Deferred tax liability 9,455 8,205
Total liabilities 1,220,077 1,430,074
Commitments and contingencies (Note 17)
Convertible preferred units (Note 13) 338,195 334,090
Equity and partners’ capital General Partner interests (953 thousand and 680 thousand units issued and outstanding as of June 30, 2017 andDecember 31, 2016, respectively) (26,664) (47,645)Limited Partner interests (51,760 thousand and 51,351 thousand units issued and outstanding as of June 30, 2017 andDecember 31, 2016, respectively) 502,311 616,087
Accumulated other comprehensive income (loss) 2 (40)
Total partners’ capital 475,649 568,402
Noncontrolling interests 18,021 16,755
Total equity and partners’ capital 493,670 585,157Total liabilities, equity and partners’ capital $ 2,051,942 $ 2,349,321
The accompanying notes are an integral part of these unaudited condensed consolidated financial statements.
4
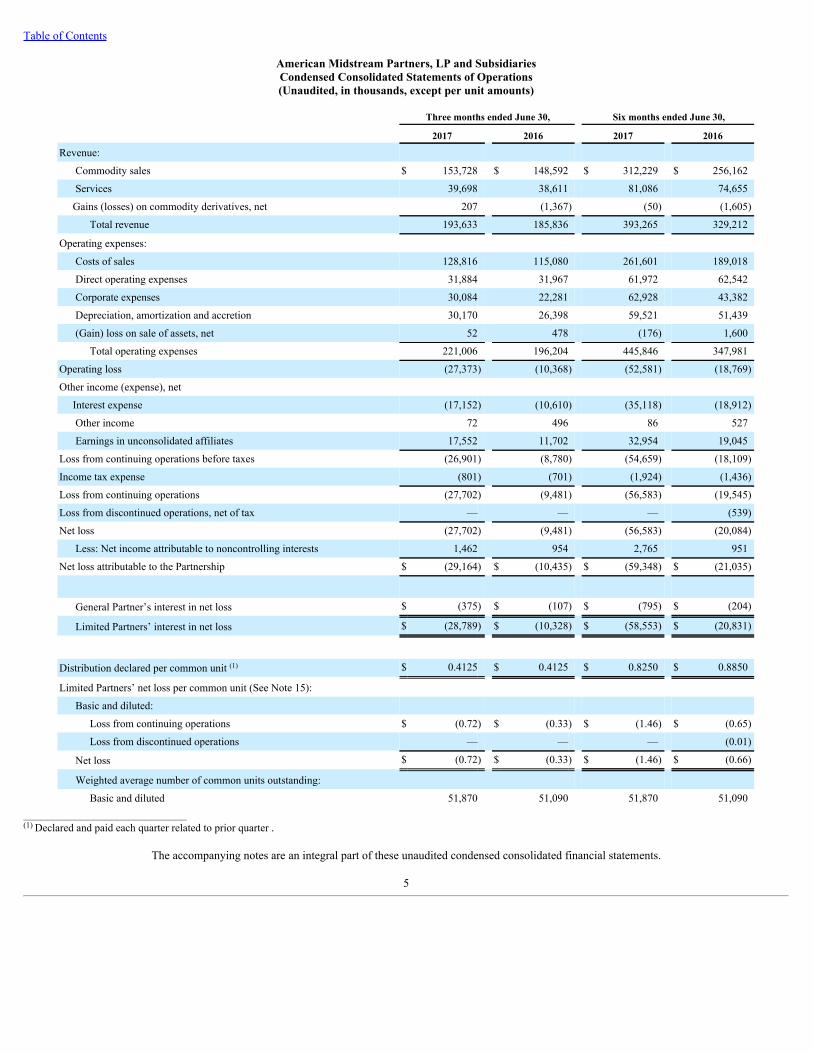
Table of Contents
American Midstream Partners, LP and SubsidiariesCondensed Consolidated Statements of Operations(Unaudited, in thousands, except per unit amounts)
Three months ended June 30, Six months ended June 30,
2017 2016 2017 2016
Revenue: Commodity sales $ 153,728 $ 148,592 $ 312,229 $ 256,162
Services 39,698 38,611 81,086 74,655
Gains (losses) on commodity derivatives, net 207 (1,367) (50) (1,605)
Total revenue 193,633 185,836 393,265 329,212
Operating expenses: Costs of sales 128,816 115,080 261,601 189,018
Direct operating expenses 31,884 31,967 61,972 62,542
Corporate expenses 30,084 22,281 62,928 43,382
Depreciation, amortization and accretion 30,170 26,398 59,521 51,439
(Gain) loss on sale of assets, net 52 478 (176) 1,600
Total operating expenses 221,006 196,204 445,846 347,981
Operating loss (27,373) (10,368) (52,581) (18,769)
Other income (expense), net Interest expense (17,152) (10,610) (35,118) (18,912)
Other income 72 496 86 527
Earnings in unconsolidated affiliates 17,552 11,702 32,954 19,045
Loss from continuing operations before taxes (26,901) (8,780) (54,659) (18,109)
Income tax expense (801) (701) (1,924) (1,436)
Loss from continuing operations (27,702) (9,481) (56,583) (19,545)
Loss from discontinued operations, net of tax — — — (539)
Net loss (27,702) (9,481) (56,583) (20,084)
Less: Net income attributable to noncontrolling interests 1,462 954 2,765 951
Net loss attributable to the Partnership $ (29,164) $ (10,435) $ (59,348) $ (21,035)
General Partner’s interest in net loss $ (375) $ (107) $ (795) $ (204)
Limited Partners’ interest in net loss $ (28,789) $ (10,328) $ (58,553) $ (20,831)
Distribution declared per common unit (1) $ 0.4125 $ 0.4125 $ 0.8250 $ 0.8850
Limited Partners’ net loss per common unit (See Note 15): Basic and diluted:
Loss from continuing operations $ (0.72) $ (0.33) $ (1.46) $ (0.65)
Loss from discontinued operations — — — (0.01)
Net loss $ (0.72) $ (0.33) $ (1.46) $ (0.66)
Weighted average number of common units outstanding: Basic and diluted 51,870 51,090 51,870 51,090
____________________________(1) Declared and paid each quarter related to prior quarter .
The accompanying notes are an integral part of these unaudited condensed consolidated financial statements.
5
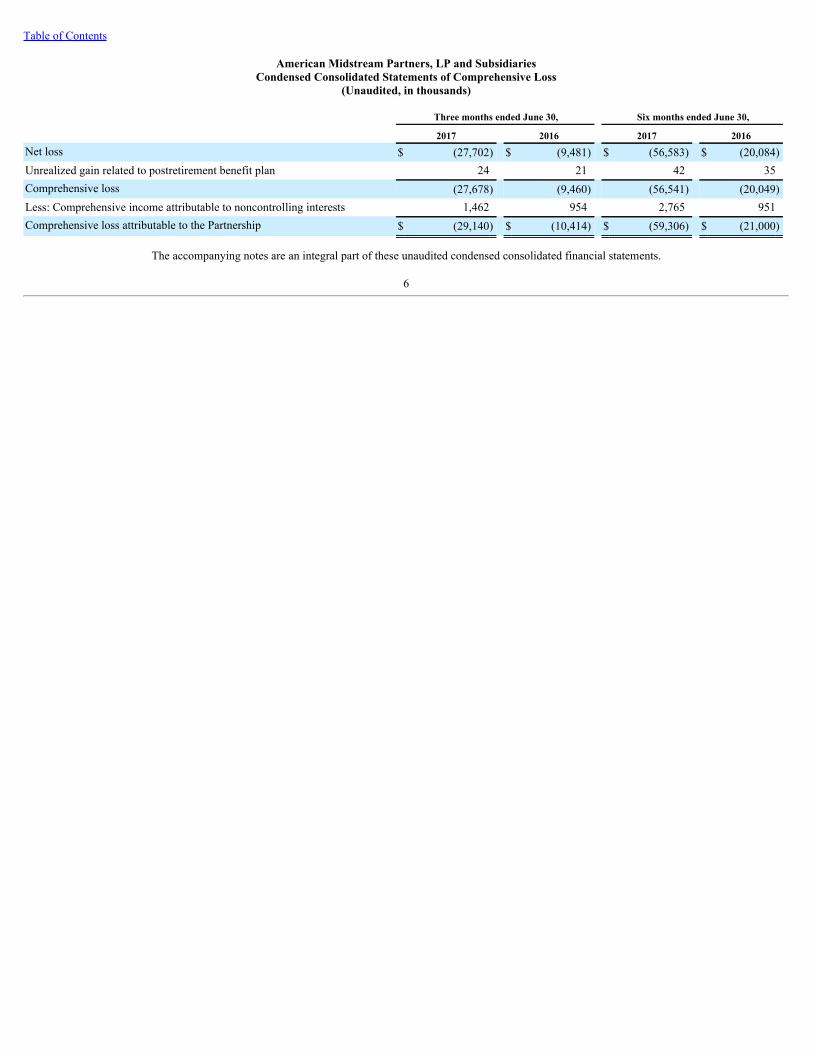
Table of Contents
American Midstream Partners, LP and SubsidiariesCondensed Consolidated Statements of Comprehensive Loss
(Unaudited, in thousands)
Three months ended June 30, Six months ended June 30,
2017 2016 2017 2016Net loss $ (27,702) $ (9,481) $ (56,583) $ (20,084)Unrealized gain related to postretirement benefit plan 24 21 42 35Comprehensive loss (27,678) (9,460) (56,541) (20,049)Less: Comprehensive income attributable to noncontrolling interests 1,462 954 2,765 951Comprehensive loss attributable to the Partnership $ (29,140) $ (10,414) $ (59,306) $ (21,000)
The accompanying notes are an integral part of these unaudited condensed consolidated financial statements.
6
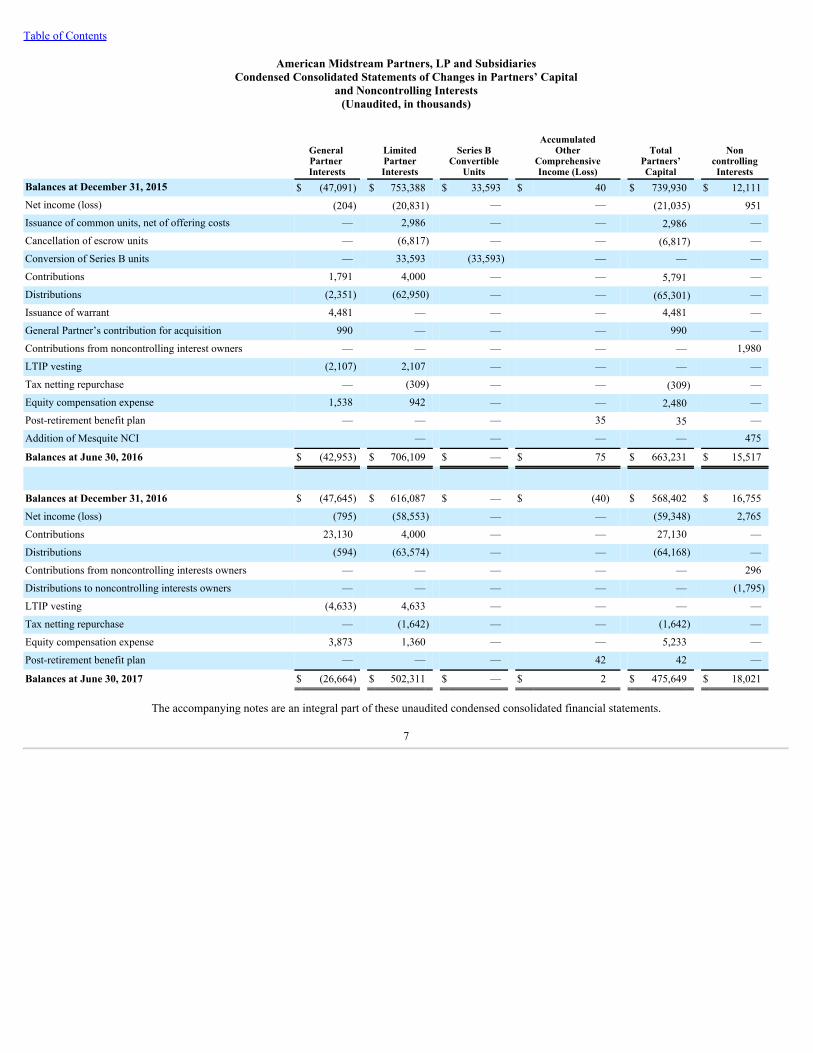
Table of Contents
American Midstream Partners, LP and SubsidiariesCondensed Consolidated Statements of Changes in Partners’ Capital
and Noncontrolling Interests(Unaudited, in thousands)
General Partner Interests
LimitedPartnerInterests
Series BConvertible
Units
AccumulatedOther
ComprehensiveIncome (Loss)
TotalPartners’Capital
NoncontrollingInterests
Balances at December 31, 2015 $ (47,091) $ 753,388 $ 33,593 $ 40 $ 739,930 $ 12,111Net income (loss) (204) (20,831) — — (21,035) 951Issuance of common units, net of offering costs — 2,986 — — 2,986 —
Cancellation of escrow units — (6,817) — — (6,817) —
Conversion of Series B units — 33,593 (33,593) — — —
Contributions 1,791 4,000 — — 5,791 —
Distributions (2,351) (62,950) — — (65,301) —
Issuance of warrant 4,481 — — — 4,481 —
General Partner’s contribution for acquisition 990 — — — 990 —
Contributions from noncontrolling interest owners — — — — — 1,980
LTIP vesting (2,107) 2,107 — — — —
Tax netting repurchase — (309) — — (309) —
Equity compensation expense 1,538 942 — — 2,480 —
Post-retirement benefit plan — — — 35 35 —
Addition of Mesquite NCI — — — — 475
Balances at June 30, 2016 $ (42,953) $ 706,109 $ — $ 75 $ 663,231 $ 15,517
Balances at December 31, 2016 $ (47,645) $ 616,087 $ — $ (40) $ 568,402 $ 16,755
Net income (loss) (795) (58,553) — — (59,348) 2,765
Contributions 23,130 4,000 — — 27,130 —
Distributions (594) (63,574) — — (64,168) —
Contributions from noncontrolling interests owners — — — — — 296
Distributions to noncontrolling interests owners — — — — — (1,795)
LTIP vesting (4,633) 4,633 — — — —
Tax netting repurchase — (1,642) — — (1,642) —
Equity compensation expense 3,873 1,360 — — 5,233 —
Post-retirement benefit plan — — — 42 42 —
Balances at June 30, 2017 $ (26,664) $ 502,311 $ — $ 2 $ 475,649 $ 18,021
The accompanying notes are an integral part of these unaudited condensed consolidated financial statements.
7
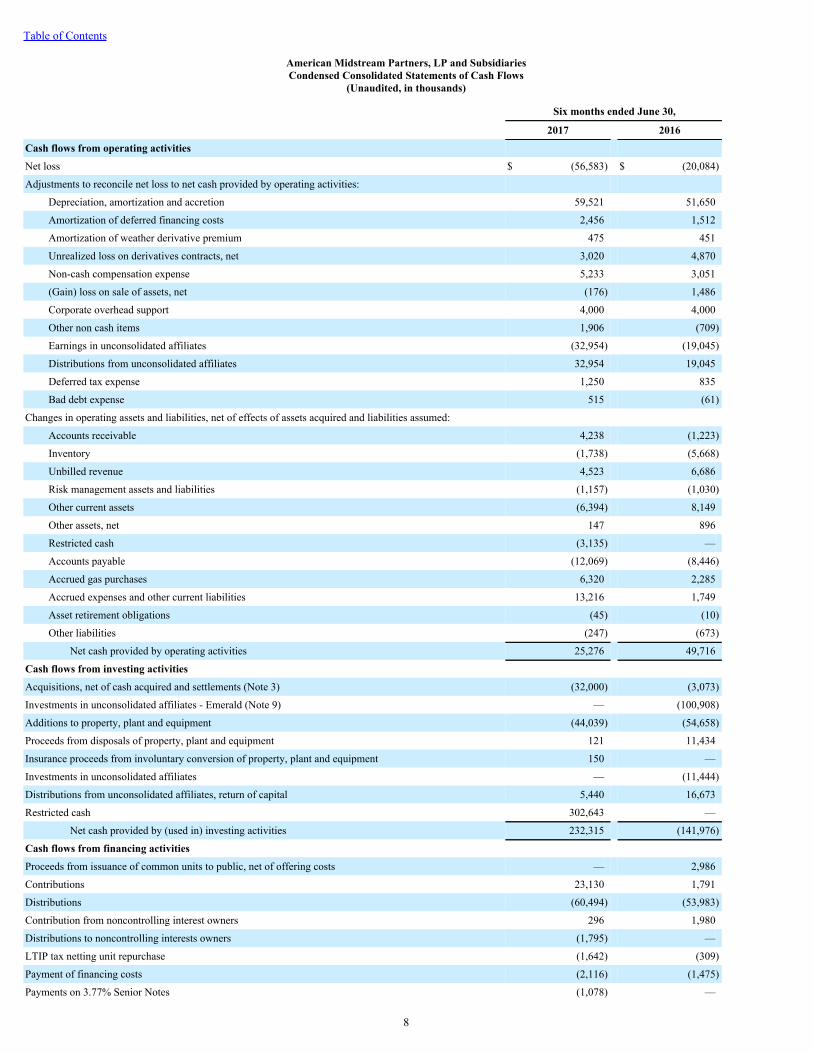
Table of Contents
American Midstream Partners, LP and SubsidiariesCondensed Consolidated Statements of Cash Flows
(Unaudited, in thousands)
Six months ended June 30,
2017 2016
Cash flows from operating activities Net loss $ (56,583) $ (20,084)
Adjustments to reconcile net loss to net cash provided by operating activities: Depreciation, amortization and accretion 59,521 51,650
Amortization of deferred financing costs 2,456 1,512
Amortization of weather derivative premium 475 451
Unrealized loss on derivatives contracts, net 3,020 4,870
Non-cash compensation expense 5,233 3,051
(Gain) loss on sale of assets, net (176) 1,486
Corporate overhead support 4,000 4,000
Other non cash items 1,906 (709)
Earnings in unconsolidated affiliates (32,954) (19,045)
Distributions from unconsolidated affiliates 32,954 19,045
Deferred tax expense 1,250 835
Bad debt expense 515 (61)
Changes in operating assets and liabilities, net of effects of assets acquired and liabilities assumed: Accounts receivable 4,238 (1,223)
Inventory (1,738) (5,668)
Unbilled revenue 4,523 6,686
Risk management assets and liabilities (1,157) (1,030)
Other current assets (6,394) 8,149
Other assets, net 147 896
Restricted cash (3,135) —
Accounts payable (12,069) (8,446)
Accrued gas purchases 6,320 2,285
Accrued expenses and other current liabilities 13,216 1,749
Asset retirement obligations (45) (10)
Other liabilities (247) (673)
Net cash provided by operating activities 25,276 49,716
Cash flows from investing activities Acquisitions, net of cash acquired and settlements (Note 3) (32,000) (3,073)
Investments in unconsolidated affiliates - Emerald (Note 9) — (100,908)
Additions to property, plant and equipment (44,039) (54,658)
Proceeds from disposals of property, plant and equipment 121 11,434
Insurance proceeds from involuntary conversion of property, plant and equipment 150 —
Investments in unconsolidated affiliates — (11,444)
Distributions from unconsolidated affiliates, return of capital 5,440 16,673
Restricted cash 302,643 —
Net cash provided by (used in) investing activities 232,315 (141,976)
Cash flows from financing activities Proceeds from issuance of common units to public, net of offering costs — 2,986
Contributions 23,130 1,791
Distributions (60,494) (53,983)
Contribution from noncontrolling interest owners 296 1,980
Distributions to noncontrolling interests owners (1,795) —
LTIP tax netting unit repurchase (1,642) (309)
Payment of financing costs (2,116) (1,475)
Payments on 3.77% Senior Notes (1,078) —
8

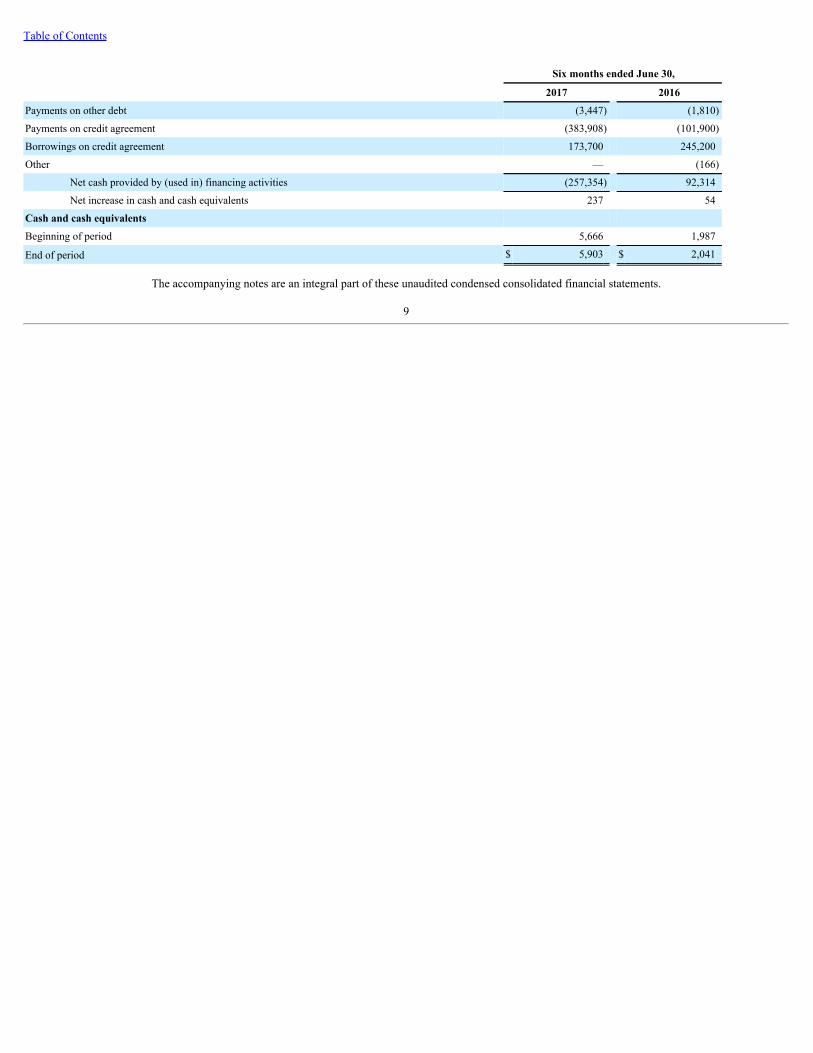
Table of Contents
Six months ended June 30,
2017 2016
Payments on other debt (3,447) (1,810)
Payments on credit agreement (383,908) (101,900)
Borrowings on credit agreement 173,700 245,200
Other — (166)
Net cash provided by (used in) financing activities (257,354) 92,314
Net increase in cash and cash equivalents 237 54
Cash and cash equivalents Beginning of period 5,666 1,987
End of period $ 5,903 $ 2,041
The accompanying notes are an integral part of these unaudited condensed consolidated financial statements.
9
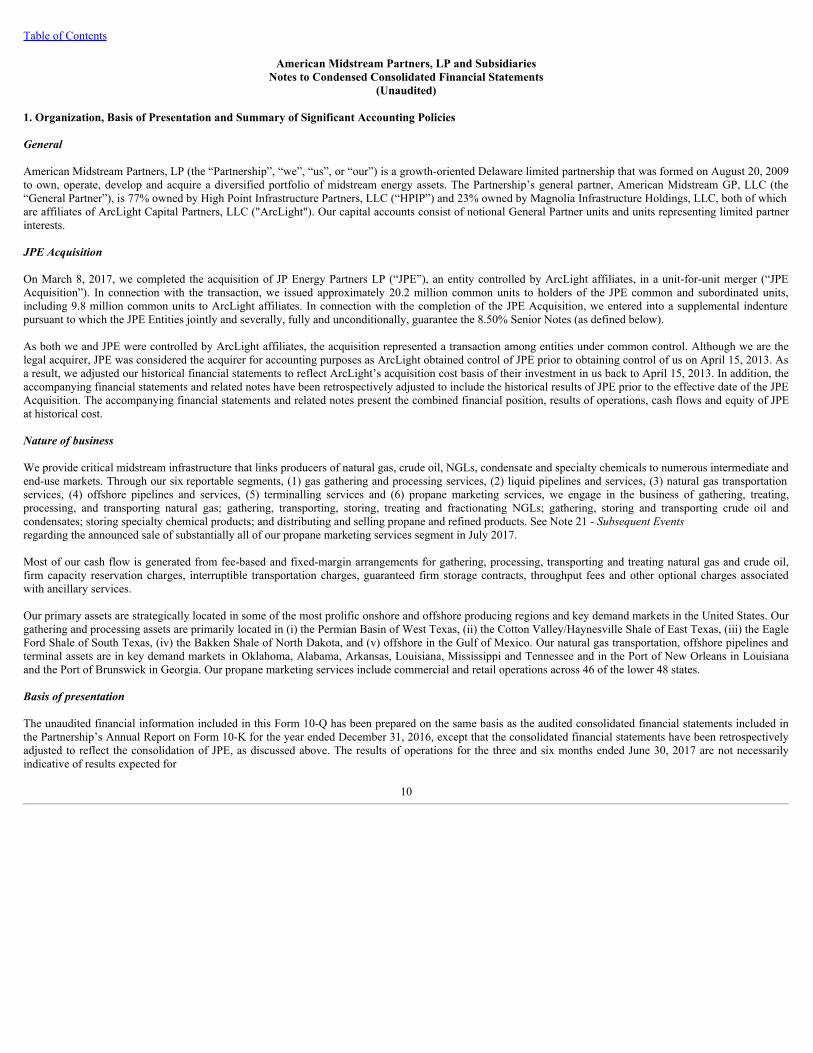
Table of Contents
American Midstream Partners, LP and SubsidiariesNotes to Condensed Consolidated Financial Statements
(Unaudited)
1. Organization, Basis of Presentation and Summary of Significant Accounting Policies
General
American Midstream Partners, LP (the “Partnership”, “we”, “us”, or “our”) is a growth-oriented Delaware limited partnership that was formed on August 20, 2009to own, operate, develop and acquire a diversified portfolio of midstream energy assets. The Partnership’s general partner, American Midstream GP, LLC (the“General Partner”), is 77% owned by High Point Infrastructure Partners, LLC (“HPIP”) and 23% owned by Magnolia Infrastructure Holdings, LLC, both of whichare affiliates of ArcLight Capital Partners, LLC ("ArcLight"). Our capital accounts consist of notional General Partner units and units representing limited partnerinterests.
JPE Acquisition
On March 8, 2017, we completed the acquisition of JP Energy Partners LP (“JPE”), an entity controlled by ArcLight affiliates, in a unit-for-unit merger (“JPEAcquisition”). In connection with the transaction, we issued approximately 20.2 million common units to holders of the JPE common and subordinated units,including 9.8 million common units to ArcLight affiliates. In connection with the completion of the JPE Acquisition, we entered into a supplemental indenturepursuant to which the JPE Entities jointly and severally, fully and unconditionally, guarantee the 8.50% Senior Notes (as defined below).
As both we and JPE were controlled by ArcLight affiliates, the acquisition represented a transaction among entities under common control. Although we are thelegal acquirer, JPE was considered the acquirer for accounting purposes as ArcLight obtained control of JPE prior to obtaining control of us on April 15, 2013. Asa result, we adjusted our historical financial statements to reflect ArcLight’s acquisition cost basis of their investment in us back to April 15, 2013. In addition, theaccompanying financial statements and related notes have been retrospectively adjusted to include the historical results of JPE prior to the effective date of the JPEAcquisition. The accompanying financial statements and related notes present the combined financial position, results of operations, cash flows and equity of JPEat historical cost.
Nature of business
We provide critical midstream infrastructure that links producers of natural gas, crude oil, NGLs, condensate and specialty chemicals to numerous intermediate andend-use markets. Through our six reportable segments, (1) gas gathering and processing services, (2) liquid pipelines and services, (3) natural gas transportationservices, (4) offshore pipelines and services, (5) terminalling services and (6) propane marketing services, we engage in the business of gathering, treating,processing, and transporting natural gas; gathering, transporting, storing, treating and fractionating NGLs; gathering, storing and transporting crude oil andcondensates; storing specialty chemical products; and distributing and selling propane and refined products. See Note 21 - Subsequent Eventsregarding the announced sale of substantially all of our propane marketing services segment in July 2017.
Most of our cash flow is generated from fee-based and fixed-margin arrangements for gathering, processing, transporting and treating natural gas and crude oil,firm capacity reservation charges, interruptible transportation charges, guaranteed firm storage contracts, throughput fees and other optional charges associatedwith ancillary services.
Our primary assets are strategically located in some of the most prolific onshore and offshore producing regions and key demand markets in the United States. Ourgathering and processing assets are primarily located in (i) the Permian Basin of West Texas, (ii) the Cotton Valley/Haynesville Shale of East Texas, (iii) the EagleFord Shale of South Texas, (iv) the Bakken Shale of North Dakota, and (v) offshore in the Gulf of Mexico. Our natural gas transportation, offshore pipelines andterminal assets are in key demand markets in Oklahoma, Alabama, Arkansas, Louisiana, Mississippi and Tennessee and in the Port of New Orleans in Louisianaand the Port of Brunswick in Georgia. Our propane marketing services include commercial and retail operations across 46 of the lower 48 states.
Basis of presentation
The unaudited financial information included in this Form 10-Q has been prepared on the same basis as the audited consolidated financial statements included inthe Partnership’s Annual Report on Form 10-K for the year ended December 31, 2016, except that the consolidated financial statements have been retrospectivelyadjusted to reflect the consolidation of JPE, as discussed above. The results of operations for the three and six months ended June 30, 2017 are not necessarilyindicative of results expected for
10
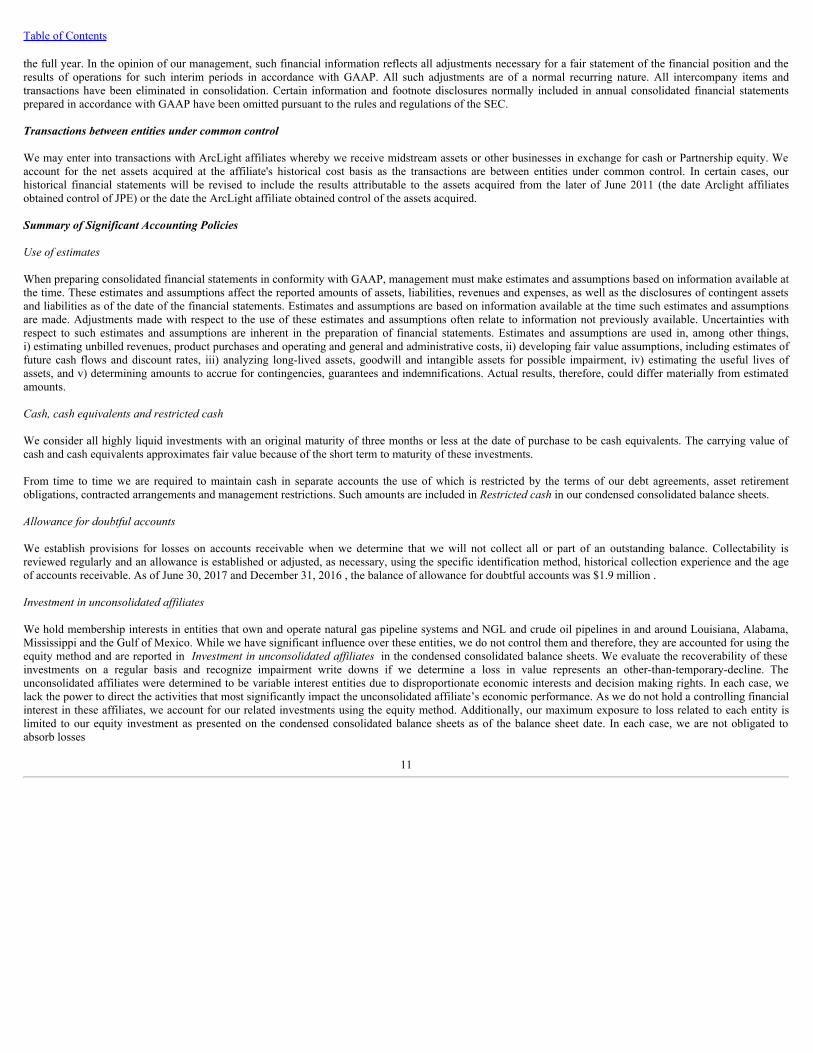
Table of Contents
the full year. In the opinion of our management, such financial information reflects all adjustments necessary for a fair statement of the financial position and theresults of operations for such interim periods in accordance with GAAP. All such adjustments are of a normal recurring nature. All intercompany items andtransactions have been eliminated in consolidation. Certain information and footnote disclosures normally included in annual consolidated financial statementsprepared in accordance with GAAP have been omitted pursuant to the rules and regulations of the SEC.
Transactions between entities under common control We may enter into transactions with ArcLight affiliates whereby we receive midstream assets or other businesses in exchange for cash or Partnership equity. Weaccount for the net assets acquired at the affiliate's historical cost basis as the transactions are between entities under common control. In certain cases, ourhistorical financial statements will be revised to include the results attributable to the assets acquired from the later of June 2011 (the date Arclight affiliatesobtained control of JPE) or the date the ArcLight affiliate obtained control of the assets acquired.
Summary of Significant Accounting Policies
Use of estimates
When preparing consolidated financial statements in conformity with GAAP, management must make estimates and assumptions based on information available atthe time. These estimates and assumptions affect the reported amounts of assets, liabilities, revenues and expenses, as well as the disclosures of contingent assetsand liabilities as of the date of the financial statements. Estimates and assumptions are based on information available at the time such estimates and assumptionsare made. Adjustments made with respect to the use of these estimates and assumptions often relate to information not previously available. Uncertainties withrespect to such estimates and assumptions are inherent in the preparation of financial statements. Estimates and assumptions are used in, among other things,i) estimating unbilled revenues, product purchases and operating and general and administrative costs, ii) developing fair value assumptions, including estimates offuture cash flows and discount rates, iii) analyzing long-lived assets, goodwill and intangible assets for possible impairment, iv) estimating the useful lives ofassets, and v) determining amounts to accrue for contingencies, guarantees and indemnifications. Actual results, therefore, could differ materially from estimatedamounts.
Cash, cash equivalents and restricted cash
We consider all highly liquid investments with an original maturity of three months or less at the date of purchase to be cash equivalents. The carrying value ofcash and cash equivalents approximates fair value because of the short term to maturity of these investments.
From time to time we are required to maintain cash in separate accounts the use of which is restricted by the terms of our debt agreements, asset retirementobligations, contracted arrangements and management restrictions. Such amounts are included in Restricted cash in our condensed consolidated balance sheets.
Allowance for doubtful accounts
We establish provisions for losses on accounts receivable when we determine that we will not collect all or part of an outstanding balance. Collectability isreviewed regularly and an allowance is established or adjusted, as necessary, using the specific identification method, historical collection experience and the ageof accounts receivable. As of June 30, 2017 and December 31, 2016 , the balance of allowance for doubtful accounts was $1.9 million .
Investment in unconsolidated affiliates
We hold membership interests in entities that own and operate natural gas pipeline systems and NGL and crude oil pipelines in and around Louisiana, Alabama,Mississippi and the Gulf of Mexico. While we have significant influence over these entities, we do not control them and therefore, they are accounted for using theequity method and are reported in Investment in unconsolidated affiliates in the condensed consolidated balance sheets. We evaluate the recoverability of theseinvestments on a regular basis and recognize impairment write downs if we determine a loss in value represents an other-than-temporary-decline. Theunconsolidated affiliates were determined to be variable interest entities due to disproportionate economic interests and decision making rights. In each case, welack the power to direct the activities that most significantly impact the unconsolidated affiliate’s economic performance. As we do not hold a controlling financialinterest in these affiliates, we account for our related investments using the equity method. Additionally, our maximum exposure to loss related to each entity islimited to our equity investment as presented on the condensed consolidated balance sheets as of the balance sheet date. In each case, we are not obligated toabsorb losses
11
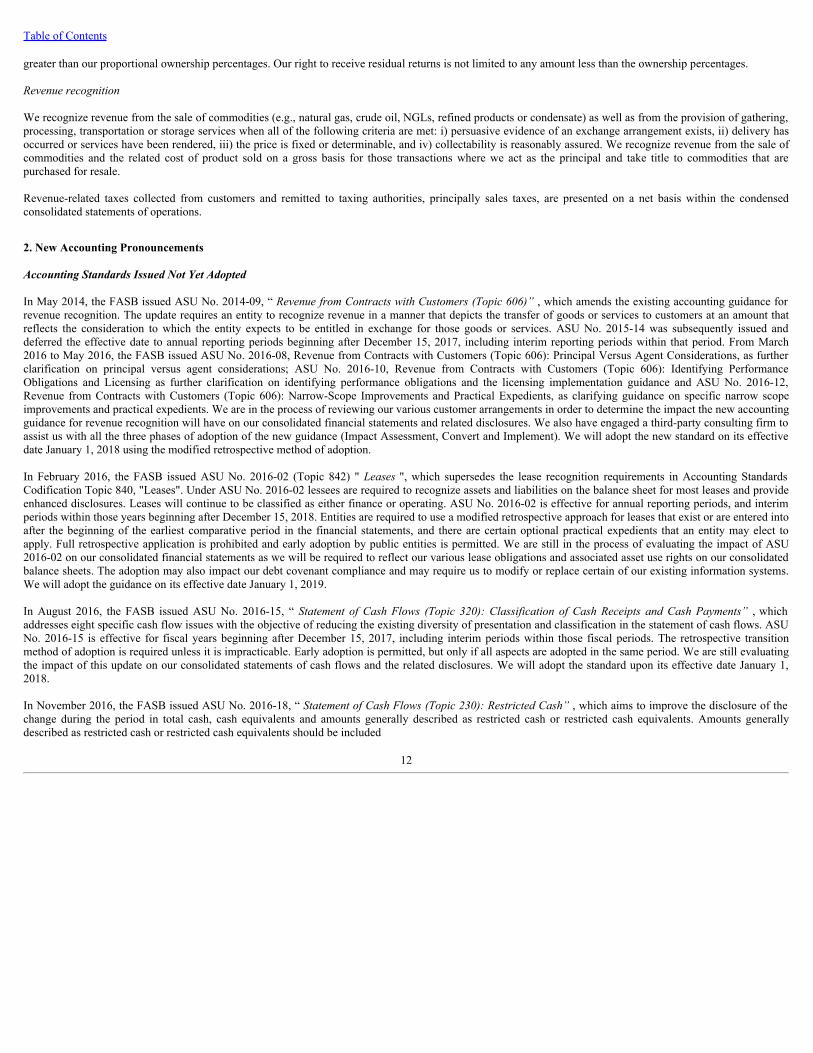
Table of Contents
greater than our proportional ownership percentages. Our right to receive residual returns is not limited to any amount less than the ownership percentages.
Revenue recognition
We recognize revenue from the sale of commodities (e.g., natural gas, crude oil, NGLs, refined products or condensate) as well as from the provision of gathering,processing, transportation or storage services when all of the following criteria are met: i) persuasive evidence of an exchange arrangement exists, ii) delivery hasoccurred or services have been rendered, iii) the price is fixed or determinable, and iv) collectability is reasonably assured. We recognize revenue from the sale ofcommodities and the related cost of product sold on a gross basis for those transactions where we act as the principal and take title to commodities that arepurchased for resale.
Revenue-related taxes collected from customers and remitted to taxing authorities, principally sales taxes, are presented on a net basis within the condensedconsolidated statements of operations.
2. New Accounting Pronouncements
Accounting Standards Issued Not Yet Adopted
In May 2014, the FASB issued ASU No. 2014-09, “ Revenue from Contracts with Customers (Topic 606)” , which amends the existing accounting guidance forrevenue recognition. The update requires an entity to recognize revenue in a manner that depicts the transfer of goods or services to customers at an amount thatreflects the consideration to which the entity expects to be entitled in exchange for those goods or services. ASU No. 2015-14 was subsequently issued anddeferred the effective date to annual reporting periods beginning after December 15, 2017, including interim reporting periods within that period. From March2016 to May 2016, the FASB issued ASU No. 2016-08, Revenue from Contracts with Customers (Topic 606): Principal Versus Agent Considerations, as furtherclarification on principal versus agent considerations; ASU No. 2016-10, Revenue from Contracts with Customers (Topic 606): Identifying PerformanceObligations and Licensing as further clarification on identifying performance obligations and the licensing implementation guidance and ASU No. 2016-12,Revenue from Contracts with Customers (Topic 606): Narrow-Scope Improvements and Practical Expedients, as clarifying guidance on specific narrow scopeimprovements and practical expedients. We are in the process of reviewing our various customer arrangements in order to determine the impact the new accountingguidance for revenue recognition will have on our consolidated financial statements and related disclosures. We also have engaged a third-party consulting firm toassist us with all the three phases of adoption of the new guidance (Impact Assessment, Convert and Implement). We will adopt the new standard on its effectivedate January 1, 2018 using the modified retrospective method of adoption.
In February 2016, the FASB issued ASU No. 2016-02 (Topic 842) " Leases ", which supersedes the lease recognition requirements in Accounting StandardsCodification Topic 840, "Leases". Under ASU No. 2016-02 lessees are required to recognize assets and liabilities on the balance sheet for most leases and provideenhanced disclosures. Leases will continue to be classified as either finance or operating. ASU No. 2016-02 is effective for annual reporting periods, and interimperiods within those years beginning after December 15, 2018. Entities are required to use a modified retrospective approach for leases that exist or are entered intoafter the beginning of the earliest comparative period in the financial statements, and there are certain optional practical expedients that an entity may elect toapply. Full retrospective application is prohibited and early adoption by public entities is permitted. We are still in the process of evaluating the impact of ASU2016-02 on our consolidated financial statements as we will be required to reflect our various lease obligations and associated asset use rights on our consolidatedbalance sheets. The adoption may also impact our debt covenant compliance and may require us to modify or replace certain of our existing information systems.We will adopt the guidance on its effective date January 1, 2019.
In August 2016, the FASB issued ASU No. 2016-15, “ Statement of Cash Flows (Topic 320): Classification of Cash Receipts and Cash Payments” , whichaddresses eight specific cash flow issues with the objective of reducing the existing diversity of presentation and classification in the statement of cash flows. ASUNo. 2016-15 is effective for fiscal years beginning after December 15, 2017, including interim periods within those fiscal periods. The retrospective transitionmethod of adoption is required unless it is impracticable. Early adoption is permitted, but only if all aspects are adopted in the same period. We are still evaluatingthe impact of this update on our consolidated statements of cash flows and the related disclosures. We will adopt the standard upon its effective date January 1,2018.
In November 2016, the FASB issued ASU No. 2016-18, “ Statement of Cash Flows (Topic 230): Restricted Cash” , which aims to improve the disclosure of thechange during the period in total cash, cash equivalents and amounts generally described as restricted cash or restricted cash equivalents. Amounts generallydescribed as restricted cash or restricted cash equivalents should be included
12
Table of Contents
with cash and cash equivalents when reconciling the beginning-of-period and end-of-period total amounts on the statement of cash flows. The update is effectivebeginning first quarter of 2018. Early adoption is permitted, but it must occur in the first interim period. Any adjustments required in early adoption of this updateshould be reflected as of the beginning of the fiscal year that includes the interim period and should be applied using a retrospective transition method to eachperiod. We have evaluated the impact of this update and believe it will have a material impact on our consolidated statement of cash flows and related disclosures,upon our effective date of adoption January 1, 2018.
In January 2017, the FASB issued ASU No. 2017-01 , “Business Combinations (Topic 805): Clarifying the Definition of a Business” The guidance providescriteria for use in determining when to conclude an integrated “set of assets and activities (as defined in the original guidance) being acquired or disposed in atransaction is not a business. Where the criteria are not met, more stringent screening has been provided to define a set as a business without an output, as morenarrowly defined within the guidance. ASU No. 2017-01 is effective for annual periods beginning after December 15, 2017, including interim periods within thoseperiods. The amendments should be applied prospectively on or after the effective date. Early adoption is permitted. We are still in the process of evaluating theguidance and can not determine the impact of this guidance on our consolidated financial statements and related disclosures. We will adopt ASU 2017-01 on itseffective date of January 1, 2018.
In January 2017, the FASB issued ASU No. 2017-04 , Intangibles - Goodwill and Other (Topic 350): Simplifying the Test for Goodwill Impairment , in which theguidance on testing for goodwill was updated by the elimination of Step 2 in the determination on whether goodwill should be considered impaired. The annualand/or interim assessments are still required to be completed. Further, the guidance eliminates the requirement to assess reporting units with zero or negativecarrying values, however, the carrying values for all reporting units must be disclosed. ASU No. 2017-04 is effective for annual or any interim goodwillimpairment tests beginning after December 15, 2019. Early adoption is permitted for interim or annual goodwill impairment tests performed on testing dates afterJanuary 1, 2017. We are currently evaluating the impact of this update on our consolidated financial statements and related disclosures and will adopt the guidanceon its effective date January 1, 2020 using the required prospective method
In May 2017, the FASB issued ASU No. 2017-09 , Compensation - Stock Compensation (Topic 718): Scope of Modification Accounting , to provide guidanceabout which changes to the terms or conditions of a share-based payment award require an entity to apply modification accounting. Pursuant to this ASU, an entityshould account for the effects of a modification unless all the following are met: (1) the fair value (or calculated value or intrinsic value, if such an alternativemeasurement method is used) of the modified award is the same as the fair value (or calculated value or intrinsic value, if such an alternative measurement methodis used) of the original award immediately before the original award is modified (if the modification does not affect any of the inputs to the valuation technique thatthe entity uses to value the award, the entity is not required to estimate the value immediately before and after the modification); (2) the vesting conditions of themodified award are the same as the vesting conditions of the original award immediately before the original award is modified; and (3) the classification of themodified award as an equity instrument or a liability instrument is the same as the classification of the original award immediately before the original award ismodified. ASU No. 2017-09 is effective for annual periods beginning after December 15, 2017, including interim periods within those periods. Early adoption ispermitted, including adoption in any interim period. This update should be applied prospectively to an award modified on or after the adoption date. ThePartnership is currently evaluating the impact of this update on our consolidated financial statements and related disclosures and will adopt the guidance on oureffective date January 1, 2018.
3. Acquisitions
JP Energy Partners LP
On March 8, 2017, we completed the acquisition of JPE, a legal entity controlled by ArcLight affiliates, in a unit-for-unit merger. In connection with thetransaction, each JPE common or subordinated unit held by investors not affiliated with ArcLight was converted into the right to receive 0.5775 of a Partnershipcommon unit, and each JPE common or subordinated unit held by ArcLight affiliates was converted into the right to receive 0.5225 of a Partnership common unit.We issued a total of 20.2 million of common units to complete the acquisition, including 9.8 million common units to ArcLight affiliates.
As both we and JPE were controlled by ArcLight affiliates, the acquisition represented a transaction among entities under common control. Although we were thelegal acquirer, JPE was considered the acquirer for accounting purposes as ArcLight obtained control of JPE prior to obtaining control of us on April 15, 2013. Asa result, we adjusted our historical financial statements to reflect ArcLight’s acquisition cost basis of us back to April 15, 2013. In addition, the accompanyingfinancial statements and related notes have been retrospectively adjusted to include the historical results of JPE prior to the effective date of the JPE acquisition.The accompanying financial statements and related notes present the combined financial position, results of operations, cash flows and equity of JPE at historicalcost.
13
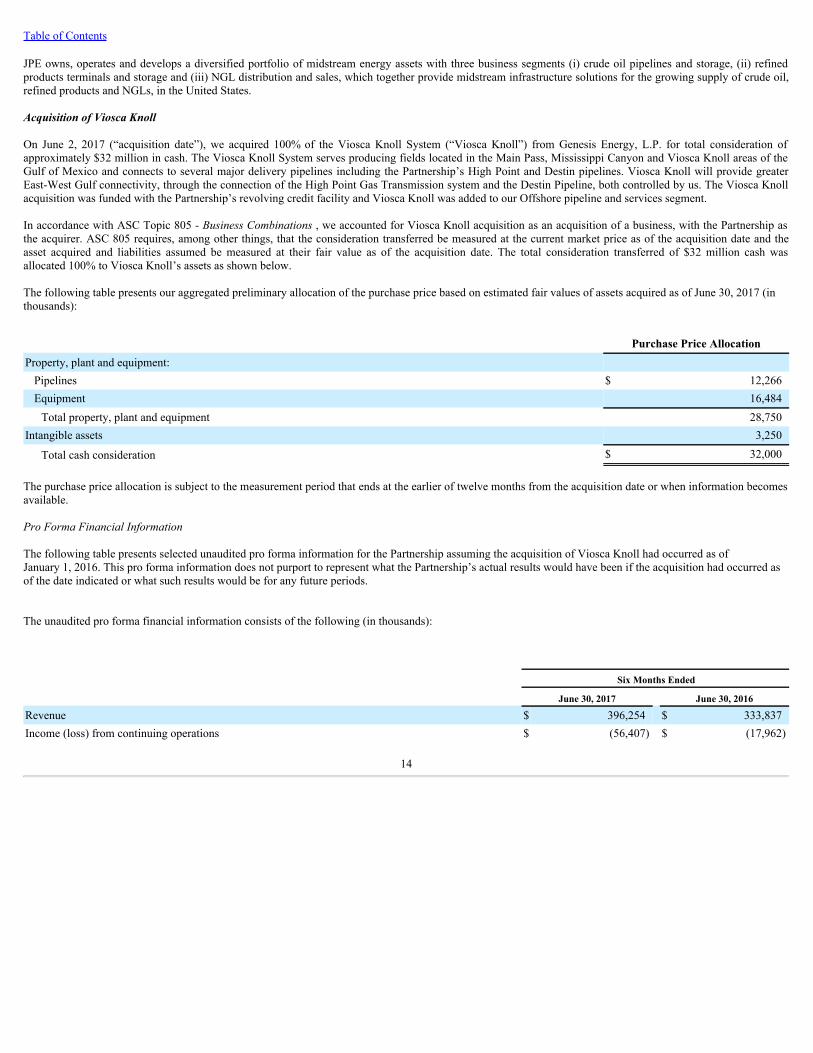
Table of Contents
JPE owns, operates and develops a diversified portfolio of midstream energy assets with three business segments (i) crude oil pipelines and storage, (ii) refinedproducts terminals and storage and (iii) NGL distribution and sales, which together provide midstream infrastructure solutions for the growing supply of crude oil,refined products and NGLs, in the United States.
Acquisition of Viosca Knoll
On June 2, 2017 (“acquisition date”), we acquired 100% of the Viosca Knoll System (“Viosca Knoll”) from Genesis Energy, L.P. for total consideration ofapproximately $32 million in cash. The Viosca Knoll System serves producing fields located in the Main Pass, Mississippi Canyon and Viosca Knoll areas of theGulf of Mexico and connects to several major delivery pipelines including the Partnership’s High Point and Destin pipelines. Viosca Knoll will provide greaterEast-West Gulf connectivity, through the connection of the High Point Gas Transmission system and the Destin Pipeline, both controlled by us. The Viosca Knollacquisition was funded with the Partnership’s revolving credit facility and Viosca Knoll was added to our Offshore pipeline and services segment.
In accordance with ASC Topic 805 - Business Combinations , we accounted for Viosca Knoll acquisition as an acquisition of a business, with the Partnership asthe acquirer. ASC 805 requires, among other things, that the consideration transferred be measured at the current market price as of the acquisition date and theasset acquired and liabilities assumed be measured at their fair value as of the acquisition date. The total consideration transferred of $32 million cash wasallocated 100% to Viosca Knoll’s assets as shown below.
The following table presents our aggregated preliminary allocation of the purchase price based on estimated fair values of assets acquired as of June 30, 2017 (inthousands):
Purchase Price AllocationProperty, plant and equipment:
Pipelines $ 12,266Equipment 16,484
Total property, plant and equipment 28,750Intangible assets 3,250
Total cash consideration $ 32,000
The purchase price allocation is subject to the measurement period that ends at the earlier of twelve months from the acquisition date or when information becomesavailable.
Pro Forma Financial Information
The following table presents selected unaudited pro forma information for the Partnership assuming the acquisition of Viosca Knoll had occurred as ofJanuary 1, 2016. This pro forma information does not purport to represent what the Partnership’s actual results would have been if the acquisition had occurred asof the date indicated or what such results would be for any future periods.
The unaudited pro forma financial information consists of the following (in thousands):
Six Months Ended
June 30, 2017 June 30, 2016
Revenue $ 396,254 $ 333,837Income (loss) from continuing operations $ (56,407) $ (17,962)
14
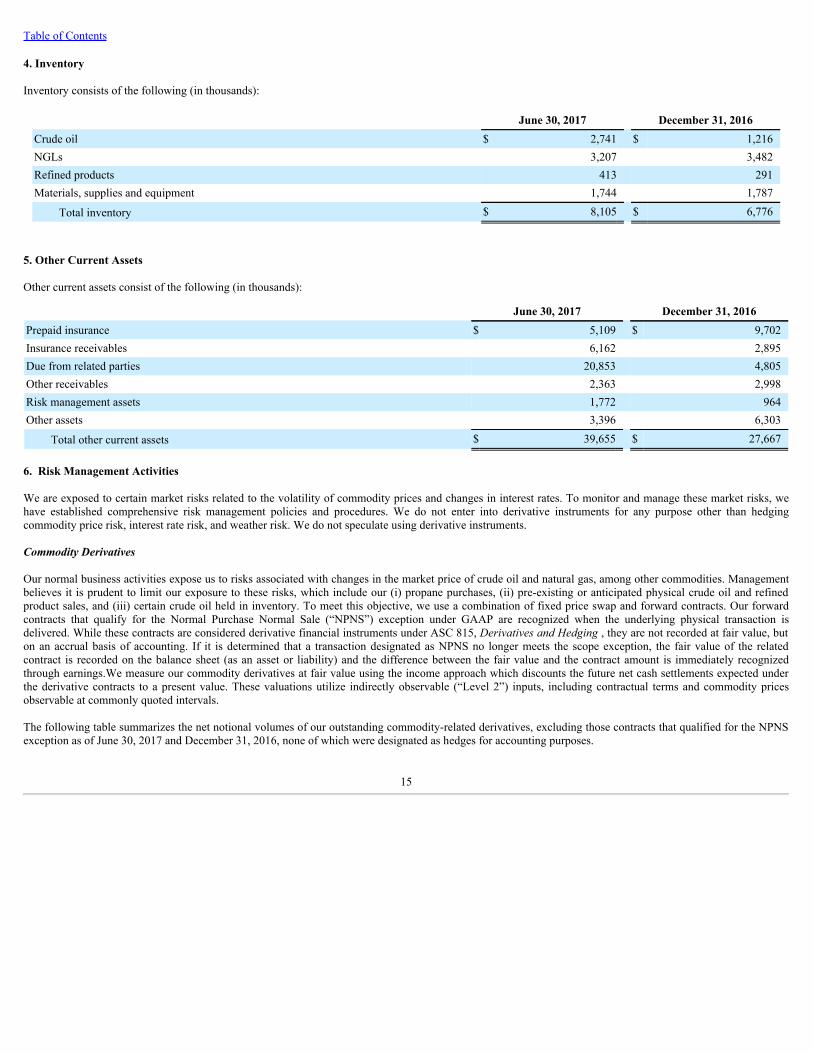
Table of Contents
4. Inventory
Inventory consists of the following (in thousands):
June 30, 2017 December 31, 2016Crude oil $ 2,741 $ 1,216NGLs 3,207 3,482Refined products 413 291Materials, supplies and equipment 1,744 1,787
Total inventory $ 8,105 $ 6,776
5. Other Current Assets
Other current assets consist of the following (in thousands):
June 30, 2017 December 31, 2016Prepaid insurance $ 5,109 $ 9,702Insurance receivables 6,162 2,895Due from related parties 20,853 4,805Other receivables 2,363 2,998Risk management assets 1,772 964Other assets 3,396 6,303
Total other current assets $ 39,655 $ 27,667
6. Risk Management Activities
We are exposed to certain market risks related to the volatility of commodity prices and changes in interest rates. To monitor and manage these market risks, wehave established comprehensive risk management policies and procedures. We do not enter into derivative instruments for any purpose other than hedgingcommodity price risk, interest rate risk, and weather risk. We do not speculate using derivative instruments.
Commodity Derivatives
Our normal business activities expose us to risks associated with changes in the market price of crude oil and natural gas, among other commodities. Managementbelieves it is prudent to limit our exposure to these risks, which include our (i) propane purchases, (ii) pre-existing or anticipated physical crude oil and refinedproduct sales, and (iii) certain crude oil held in inventory. To meet this objective, we use a combination of fixed price swap and forward contracts. Our forwardcontracts that qualify for the Normal Purchase Normal Sale (“NPNS”) exception under GAAP are recognized when the underlying physical transaction isdelivered. While these contracts are considered derivative financial instruments under ASC 815, Derivatives and Hedging , they are not recorded at fair value, buton an accrual basis of accounting. If it is determined that a transaction designated as NPNS no longer meets the scope exception, the fair value of the relatedcontract is recorded on the balance sheet (as an asset or liability) and the difference between the fair value and the contract amount is immediately recognizedthrough earnings.We measure our commodity derivatives at fair value using the income approach which discounts the future net cash settlements expected underthe derivative contracts to a present value. These valuations utilize indirectly observable (“Level 2”) inputs, including contractual terms and commodity pricesobservable at commonly quoted intervals.
The following table summarizes the net notional volumes of our outstanding commodity-related derivatives, excluding those contracts that qualified for the NPNSexception as of June 30, 2017 and December 31, 2016, none of which were designated as hedges for accounting purposes.
15
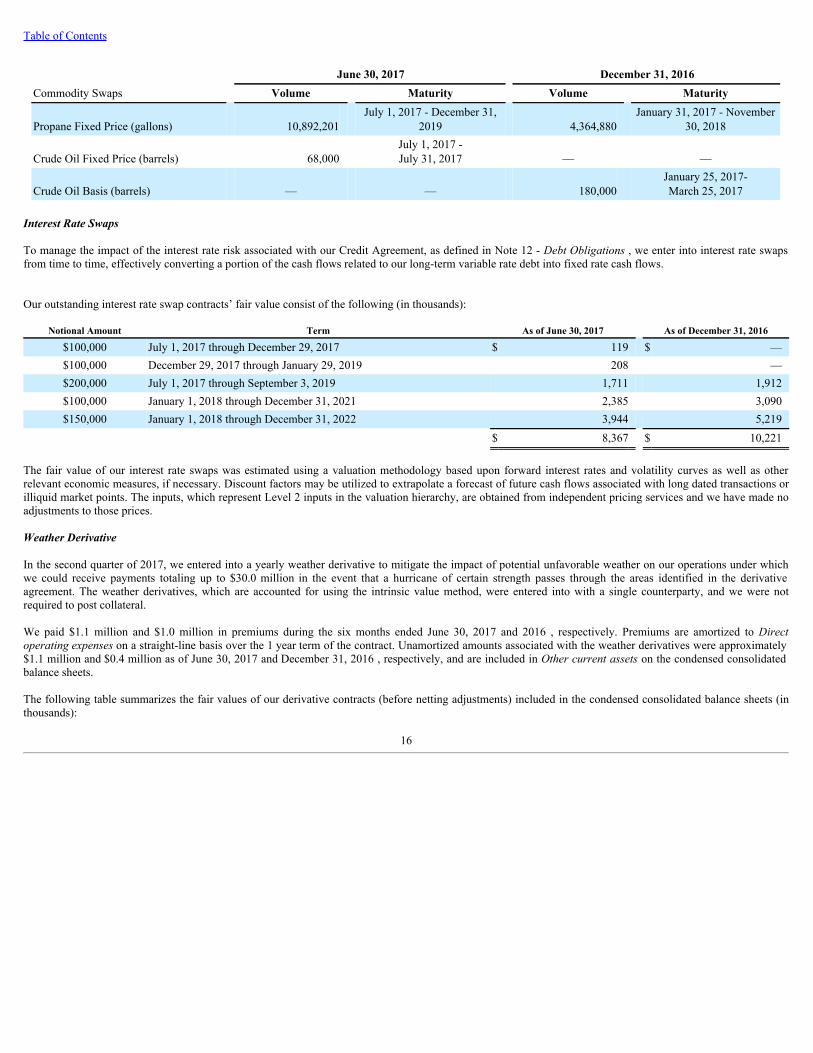
Table of Contents
June 30, 2017 December 31, 2016Commodity Swaps Volume Maturity Volume Maturity
Propane Fixed Price (gallons) 10,892,201 July 1, 2017 - December 31,
2019 4,364,880 January 31, 2017 - November
30, 2018
Crude Oil Fixed Price (barrels) 68,000 July 1, 2017 -July 31, 2017 — —
Crude Oil Basis (barrels) — — 180,000 January 25, 2017-March 25, 2017
Interest Rate Swaps
To manage the impact of the interest rate risk associated with our Credit Agreement, as defined in Note 12 - Debt Obligations , we enter into interest rate swapsfrom time to time, effectively converting a portion of the cash flows related to our long-term variable rate debt into fixed rate cash flows.
Our outstanding interest rate swap contracts’ fair value consist of the following (in thousands):
Notional Amount Term As of June 30, 2017 As of December 31, 2016
$100,000 July 1, 2017 through December 29, 2017 $ 119 $ —$100,000 December 29, 2017 through January 29, 2019 208 —$200,000 July 1, 2017 through September 3, 2019 1,711 1,912$100,000 January 1, 2018 through December 31, 2021 2,385 3,090$150,000 January 1, 2018 through December 31, 2022 3,944 5,219
$ 8,367 $ 10,221
The fair value of our interest rate swaps was estimated using a valuation methodology based upon forward interest rates and volatility curves as well as otherrelevant economic measures, if necessary. Discount factors may be utilized to extrapolate a forecast of future cash flows associated with long dated transactions orilliquid market points. The inputs, which represent Level 2 inputs in the valuation hierarchy, are obtained from independent pricing services and we have made noadjustments to those prices.
Weather Derivative
In the second quarter of 2017, we entered into a yearly weather derivative to mitigate the impact of potential unfavorable weather on our operations under whichwe could receive payments totaling up to $30.0 million in the event that a hurricane of certain strength passes through the areas identified in the derivativeagreement. The weather derivatives, which are accounted for using the intrinsic value method, were entered into with a single counterparty, and we were notrequired to post collateral.
We paid $1.1 million and $1.0 million in premiums during the six months ended June 30, 2017 and 2016 , respectively. Premiums are amortized to Directoperating expenses on a straight-line basis over the 1 year term of the contract. Unamortized amounts associated with the weather derivatives were approximately$1.1 million and $0.4 million as of June 30, 2017 and December 31, 2016 , respectively, and are included in Other current assets on the condensed consolidatedbalance sheets.
The following table summarizes the fair values of our derivative contracts (before netting adjustments) included in the condensed consolidated balance sheets (inthousands):
16
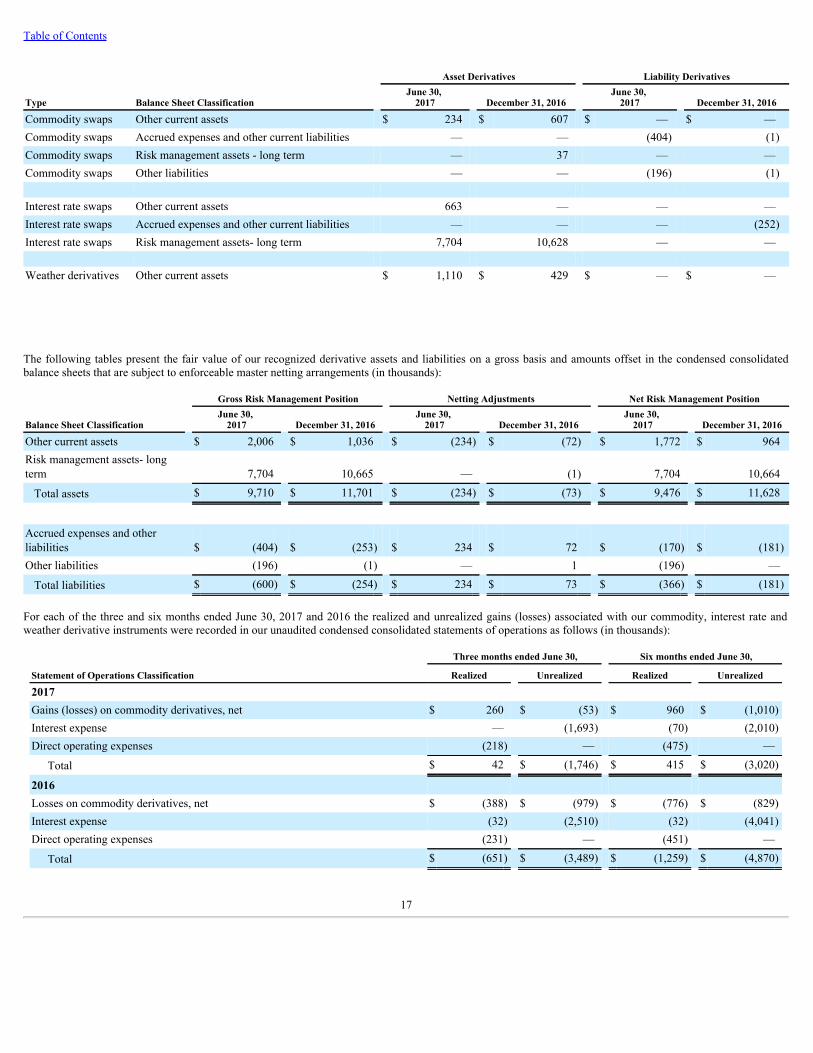
Table of Contents
Asset Derivatives Liability Derivatives
Type Balance Sheet Classification June 30,
2017 December 31, 2016 June 30,
2017 December 31, 2016
Commodity swaps Other current assets $ 234 $ 607 $ — $ —Commodity swaps Accrued expenses and other current liabilities — — (404) (1)Commodity swaps Risk management assets - long term — 37 — —Commodity swaps Other liabilities — — (196) (1) Interest rate swaps Other current assets 663 — — —Interest rate swaps Accrued expenses and other current liabilities — — — (252)Interest rate swaps Risk management assets- long term 7,704 10,628 — — Weather derivatives Other current assets $ 1,110 $ 429 $ — $ —
The following tables present the fair value of our recognized derivative assets and liabilities on a gross basis and amounts offset in the condensed consolidatedbalance sheets that are subject to enforceable master netting arrangements (in thousands):
Gross Risk Management Position Netting Adjustments Net Risk Management Position
Balance Sheet Classification June 30,
2017 December 31, 2016 June 30,
2017 December 31, 2016 June 30,
2017 December 31, 2016
Other current assets $ 2,006 $ 1,036 $ (234) $ (72) $ 1,772 $ 964Risk management assets- longterm 7,704 10,665 — (1) 7,704 10,664
Total assets $ 9,710 $ 11,701 $ (234) $ (73) $ 9,476 $ 11,628
Accrued expenses and otherliabilities $ (404) $ (253) $ 234 $ 72 $ (170) $ (181)Other liabilities (196) (1) — 1 (196) —
Total liabilities $ (600) $ (254) $ 234 $ 73 $ (366) $ (181)
For each of the three and six months ended June 30, 2017 and 2016 the realized and unrealized gains (losses) associated with our commodity, interest rate andweather derivative instruments were recorded in our unaudited condensed consolidated statements of operations as follows (in thousands):
Three months ended June 30, Six months ended June 30,
Statement of Operations Classification Realized Unrealized Realized Unrealized
2017 Gains (losses) on commodity derivatives, net $ 260 $ (53) $ 960 $ (1,010)Interest expense — (1,693) (70) (2,010)Direct operating expenses (218) — (475) —
Total $ 42 $ (1,746) $ 415 $ (3,020)
2016 Losses on commodity derivatives, net $ (388) $ (979) $ (776) $ (829)Interest expense (32) (2,510) (32) (4,041)Direct operating expenses (231) — (451) —
Total $ (651) $ (3,489) $ (1,259) $ (4,870)
17
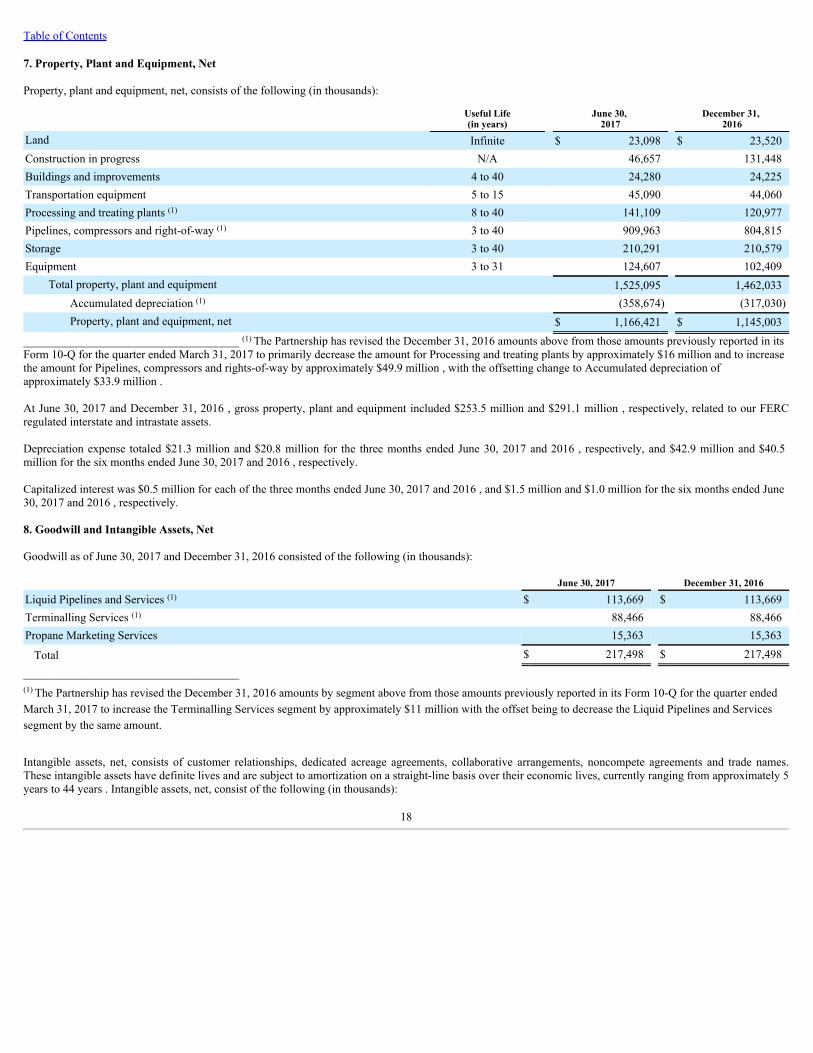
Table of Contents
7. Property, Plant and Equipment, Net
Property, plant and equipment, net, consists of the following (in thousands):
Useful Life(in years)
June 30, 2017
December 31, 2016
Land Infinite $ 23,098 $ 23,520Construction in progress N/A 46,657 131,448Buildings and improvements 4 to 40 24,280 24,225Transportation equipment 5 to 15 45,090 44,060Processing and treating plants (1) 8 to 40 141,109 120,977Pipelines, compressors and right-of-way (1) 3 to 40 909,963 804,815Storage 3 to 40 210,291 210,579Equipment 3 to 31 124,607 102,409
Total property, plant and equipment 1,525,095 1,462,033Accumulated depreciation (1) (358,674) (317,030)Property, plant and equipment, net $ 1,166,421 $ 1,145,003
_____________________________________ (1) The Partnership has revised the December 31, 2016 amounts above from those amounts previously reported in itsForm 10-Q for the quarter ended March 31, 2017 to primarily decrease the amount for Processing and treating plants by approximately $16 million and to increasethe amount for Pipelines, compressors and rights-of-way by approximately $49.9 million , with the offsetting change to Accumulated depreciation ofapproximately $33.9 million .
At June 30, 2017 and December 31, 2016 , gross property, plant and equipment included $253.5 million and $291.1 million , respectively, related to our FERCregulated interstate and intrastate assets.
Depreciation expense totaled $21.3 million and $20.8 million for the three months ended June 30, 2017 and 2016 , respectively, and $42.9 million and $40.5million for the six months ended June 30, 2017 and 2016 , respectively.
Capitalized interest was $0.5 million for each of the three months ended June 30, 2017 and 2016 , and $1.5 million and $1.0 million for the six months ended June30, 2017 and 2016 , respectively.
8. Goodwill and Intangible Assets, Net
Goodwill as of June 30, 2017 and December 31, 2016 consisted of the following (in thousands):
June 30, 2017 December 31, 2016
Liquid Pipelines and Services (1) $ 113,669 $ 113,669Terminalling Services (1) 88,466 88,466Propane Marketing Services 15,363 15,363
Total $ 217,498 $ 217,498_____________________________________(1) The Partnership has revised the December 31, 2016 amounts by segment above from those amounts previously reported in its Form 10-Q for the quarter endedMarch 31, 2017 to increase the Terminalling Services segment by approximately $11 million with the offset being to decrease the Liquid Pipelines and Servicessegment by the same amount.
Intangible assets, net, consists of customer relationships, dedicated acreage agreements, collaborative arrangements, noncompete agreements and trade names.These intangible assets have definite lives and are subject to amortization on a straight-line basis over their economic lives, currently ranging from approximately 5years to 44 years . Intangible assets, net, consist of the following (in thousands):
18
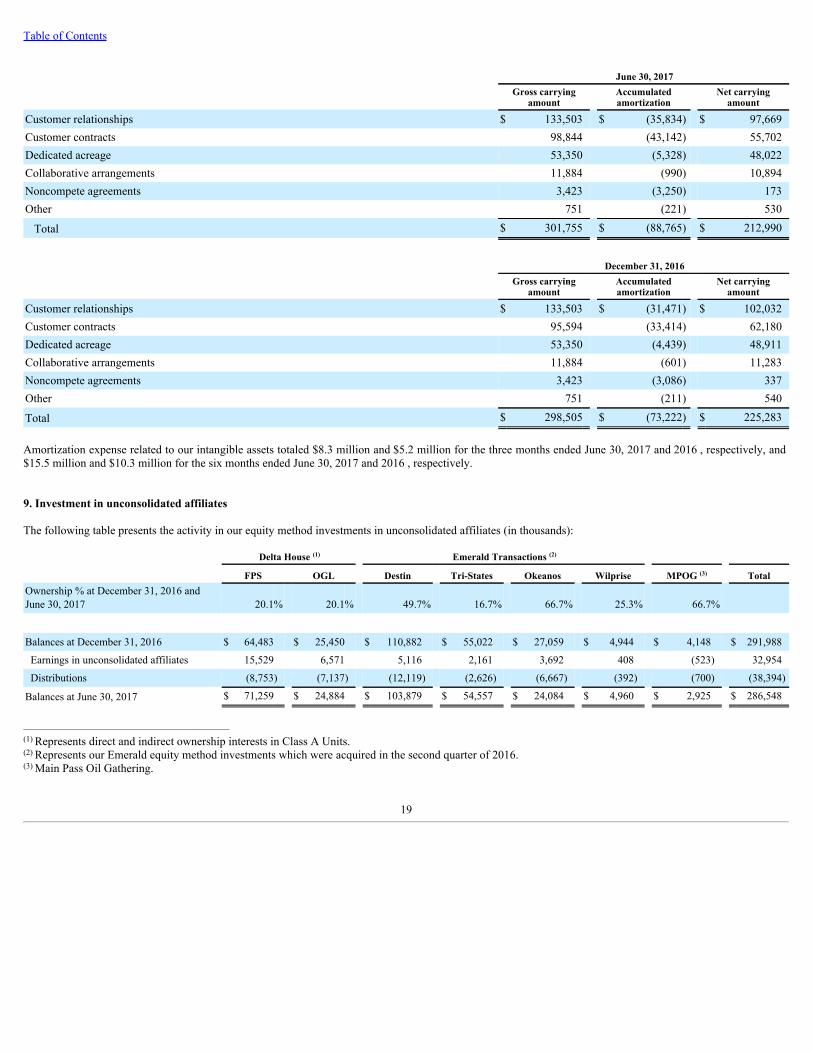
Table of Contents
June 30, 2017
Gross carrying
amount Accumulatedamortization
Net carryingamount
Customer relationships $ 133,503 $ (35,834) $ 97,669Customer contracts 98,844 (43,142) 55,702Dedicated acreage 53,350 (5,328) 48,022Collaborative arrangements 11,884 (990) 10,894Noncompete agreements 3,423 (3,250) 173Other 751 (221) 530
Total $ 301,755 $ (88,765) $ 212,990
December 31, 2016
Gross carrying
amount Accumulatedamortization
Net carryingamount
Customer relationships $ 133,503 $ (31,471) $ 102,032Customer contracts 95,594 (33,414) 62,180Dedicated acreage 53,350 (4,439) 48,911Collaborative arrangements 11,884 (601) 11,283Noncompete agreements 3,423 (3,086) 337Other 751 (211) 540
Total $ 298,505 $ (73,222) $ 225,283
Amortization expense related to our intangible assets totaled $8.3 million and $5.2 million for the three months ended June 30, 2017 and 2016 , respectively, and$15.5 million and $10.3 million for the six months ended June 30, 2017 and 2016 , respectively.
9. Investment in unconsolidated affiliates
The following table presents the activity in our equity method investments in unconsolidated affiliates (in thousands):
Delta House (1) Emerald Transactions (2) FPS OGL Destin Tri-States Okeanos Wilprise MPOG (3) TotalOwnership % at December 31, 2016 andJune 30, 2017 20.1% 20.1% 49.7% 16.7% 66.7% 25.3% 66.7%
Balances at December 31, 2016 $ 64,483 $ 25,450 $ 110,882 $ 55,022 $ 27,059 $ 4,944 $ 4,148 $ 291,988
Earnings in unconsolidated affiliates 15,529 6,571 5,116 2,161 3,692 408 (523) 32,954
Distributions (8,753) (7,137) (12,119) (2,626) (6,667) (392) (700) (38,394)
Balances at June 30, 2017 $ 71,259 $ 24,884 $ 103,879 $ 54,557 $ 24,084 $ 4,960 $ 2,925 $ 286,548
___________________________________________________ (1) Represents direct and indirect ownership interests in Class A Units.(2) Represents our Emerald equity method investments which were acquired in the second quarter of 2016.(3) Main Pass Oil Gathering.
19
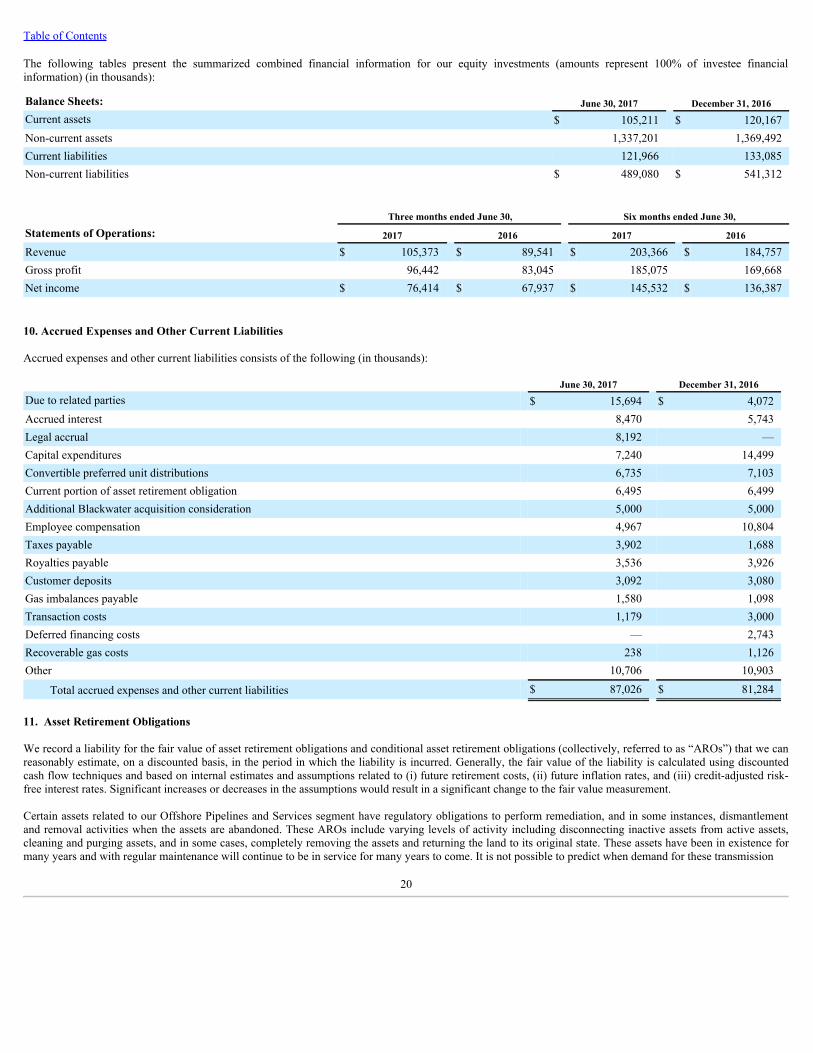
Table of Contents
The following tables present the summarized combined financial information for our equity investments (amounts represent 100% of investee financialinformation) (in thousands):
Balance Sheets: June 30, 2017 December 31, 2016Current assets $ 105,211 $ 120,167Non-current assets 1,337,201 1,369,492Current liabilities 121,966 133,085Non-current liabilities $ 489,080 $ 541,312
Three months ended June 30, Six months ended June 30,
Statements of Operations: 2017 2016 2017 2016
Revenue $ 105,373 $ 89,541 $ 203,366 $ 184,757Gross profit 96,442 83,045 185,075 169,668Net income $ 76,414 $ 67,937 $ 145,532 $ 136,387
10. Accrued Expenses and Other Current Liabilities
Accrued expenses and other current liabilities consists of the following (in thousands):
June 30, 2017 December 31, 2016Due to related parties $ 15,694 $ 4,072Accrued interest 8,470 5,743Legal accrual 8,192 —Capital expenditures 7,240 14,499Convertible preferred unit distributions 6,735 7,103Current portion of asset retirement obligation 6,495 6,499Additional Blackwater acquisition consideration 5,000 5,000Employee compensation 4,967 10,804Taxes payable 3,902 1,688Royalties payable 3,536 3,926Customer deposits 3,092 3,080Gas imbalances payable 1,580 1,098Transaction costs 1,179 3,000Deferred financing costs — 2,743Recoverable gas costs 238 1,126Other 10,706 10,903
Total accrued expenses and other current liabilities $ 87,026 $ 81,284 11. Asset Retirement Obligations
We record a liability for the fair value of asset retirement obligations and conditional asset retirement obligations (collectively, referred to as “AROs”) that we canreasonably estimate, on a discounted basis, in the period in which the liability is incurred. Generally, the fair value of the liability is calculated using discountedcash flow techniques and based on internal estimates and assumptions related to (i) future retirement costs, (ii) future inflation rates, and (iii) credit-adjusted risk-free interest rates. Significant increases or decreases in the assumptions would result in a significant change to the fair value measurement.
Certain assets related to our Offshore Pipelines and Services segment have regulatory obligations to perform remediation, and in some instances, dismantlementand removal activities when the assets are abandoned. These AROs include varying levels of activity including disconnecting inactive assets from active assets,cleaning and purging assets, and in some cases, completely removing the assets and returning the land to its original state. These assets have been in existence formany years and with regular maintenance will continue to be in service for many years to come. It is not possible to predict when demand for these transmission
20
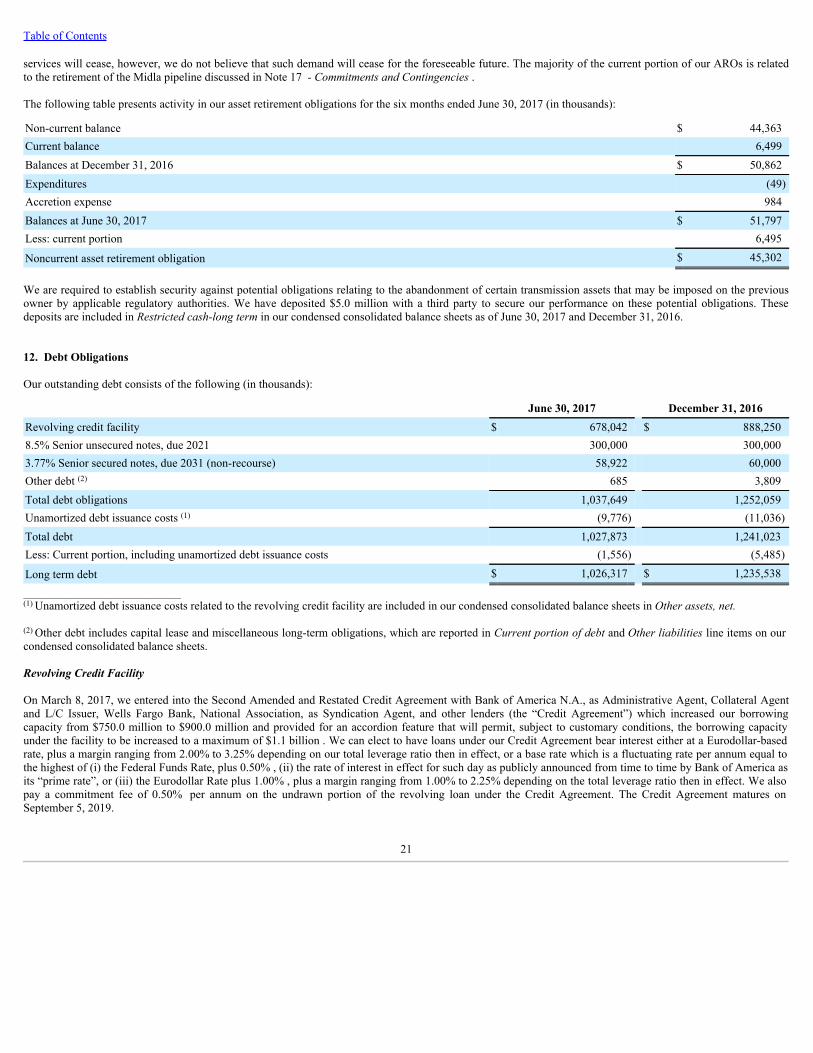
Table of Contents
services will cease, however, we do not believe that such demand will cease for the foreseeable future. The majority of the current portion of our AROs is relatedto the retirement of the Midla pipeline discussed in Note 17 - Commitments and Contingencies .
The following table presents activity in our asset retirement obligations for the six months ended June 30, 2017 (in thousands):
Non-current balance $ 44,363Current balance 6,499Balances at December 31, 2016 $ 50,862Expenditures (49)Accretion expense 984Balances at June 30, 2017 $ 51,797Less: current portion 6,495
Noncurrent asset retirement obligation $ 45,302
We are required to establish security against potential obligations relating to the abandonment of certain transmission assets that may be imposed on the previousowner by applicable regulatory authorities. We have deposited $5.0 million with a third party to secure our performance on these potential obligations. Thesedeposits are included in Restricted cash-long term in our condensed consolidated balance sheets as of June 30, 2017 and December 31, 2016.
12. Debt Obligations
Our outstanding debt consists of the following (in thousands):
June 30, 2017 December 31, 2016Revolving credit facility $ 678,042 $ 888,2508.5% Senior unsecured notes, due 2021 300,000 300,0003.77% Senior secured notes, due 2031 (non-recourse) 58,922 60,000Other debt (2) 685 3,809Total debt obligations 1,037,649 1,252,059Unamortized debt issuance costs (1) (9,776) (11,036)Total debt 1,027,873 1,241,023Less: Current portion, including unamortized debt issuance costs (1,556) (5,485)
Long term debt $ 1,026,317 $ 1,235,538___________________________(1) Unamortized debt issuance costs related to the revolving credit facility are included in our condensed consolidated balance sheets in Other assets, net.
(2) Other debt includes capital lease and miscellaneous long-term obligations, which are reported in Current portion of debt and Other liabilities line items on ourcondensed consolidated balance sheets.
Revolving Credit Facility
On March 8, 2017, we entered into the Second Amended and Restated Credit Agreement with Bank of America N.A., as Administrative Agent, Collateral Agentand L/C Issuer, Wells Fargo Bank, National Association, as Syndication Agent, and other lenders (the “Credit Agreement”) which increased our borrowingcapacity from $750.0 million to $900.0 million and provided for an accordion feature that will permit, subject to customary conditions, the borrowing capacityunder the facility to be increased to a maximum of $1.1 billion . We can elect to have loans under our Credit Agreement bear interest either at a Eurodollar-basedrate, plus a margin ranging from 2.00% to 3.25% depending on our total leverage ratio then in effect, or a base rate which is a fluctuating rate per annum equal tothe highest of (i) the Federal Funds Rate, plus 0.50% , (ii) the rate of interest in effect for such day as publicly announced from time to time by Bank of America asits “prime rate”, or (iii) the Eurodollar Rate plus 1.00% , plus a margin ranging from 1.00% to 2.25% depending on the total leverage ratio then in effect. We alsopay a commitment fee of 0.50% per annum on the undrawn portion of the revolving loan under the Credit Agreement. The Credit Agreement matures onSeptember 5, 2019.
21
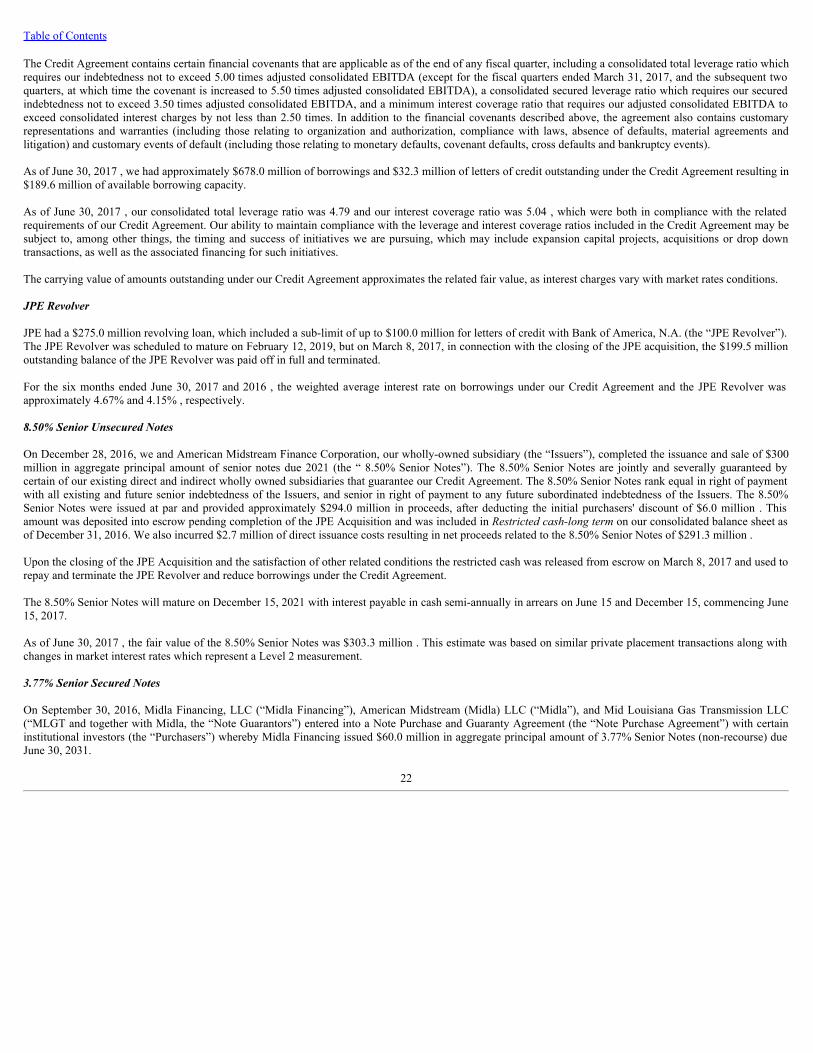
Table of Contents
The Credit Agreement contains certain financial covenants that are applicable as of the end of any fiscal quarter, including a consolidated total leverage ratio whichrequires our indebtedness not to exceed 5.00 times adjusted consolidated EBITDA (except for the fiscal quarters ended March 31, 2017, and the subsequent twoquarters, at which time the covenant is increased to 5.50 times adjusted consolidated EBITDA), a consolidated secured leverage ratio which requires our securedindebtedness not to exceed 3.50 times adjusted consolidated EBITDA, and a minimum interest coverage ratio that requires our adjusted consolidated EBITDA toexceed consolidated interest charges by not less than 2.50 times. In addition to the financial covenants described above, the agreement also contains customaryrepresentations and warranties (including those relating to organization and authorization, compliance with laws, absence of defaults, material agreements andlitigation) and customary events of default (including those relating to monetary defaults, covenant defaults, cross defaults and bankruptcy events).
As of June 30, 2017 , we had approximately $678.0 million of borrowings and $32.3 million of letters of credit outstanding under the Credit Agreement resulting in$189.6 million of available borrowing capacity.
As of June 30, 2017 , our consolidated total leverage ratio was 4.79 and our interest coverage ratio was 5.04 , which were both in compliance with the relatedrequirements of our Credit Agreement. Our ability to maintain compliance with the leverage and interest coverage ratios included in the Credit Agreement may besubject to, among other things, the timing and success of initiatives we are pursuing, which may include expansion capital projects, acquisitions or drop downtransactions, as well as the associated financing for such initiatives.
The carrying value of amounts outstanding under our Credit Agreement approximates the related fair value, as interest charges vary with market rates conditions.
JPE Revolver
JPE had a $275.0 million revolving loan, which included a sub-limit of up to $100.0 million for letters of credit with Bank of America, N.A. (the “JPE Revolver”).The JPE Revolver was scheduled to mature on February 12, 2019, but on March 8, 2017, in connection with the closing of the JPE acquisition, the $199.5 millionoutstanding balance of the JPE Revolver was paid off in full and terminated.
For the six months ended June 30, 2017 and 2016 , the weighted average interest rate on borrowings under our Credit Agreement and the JPE Revolver wasapproximately 4.67% and 4.15% , respectively.
8.50% Senior Unsecured Notes
On December 28, 2016, we and American Midstream Finance Corporation, our wholly-owned subsidiary (the “Issuers”), completed the issuance and sale of $300million in aggregate principal amount of senior notes due 2021 (the “ 8.50% Senior Notes”). The 8.50% Senior Notes are jointly and severally guaranteed bycertain of our existing direct and indirect wholly owned subsidiaries that guarantee our Credit Agreement. The 8.50% Senior Notes rank equal in right of paymentwith all existing and future senior indebtedness of the Issuers, and senior in right of payment to any future subordinated indebtedness of the Issuers. The 8.50%Senior Notes were issued at par and provided approximately $294.0 million in proceeds, after deducting the initial purchasers' discount of $6.0 million . Thisamount was deposited into escrow pending completion of the JPE Acquisition and was included in Restricted cash-long term on our consolidated balance sheet asof December 31, 2016. We also incurred $2.7 million of direct issuance costs resulting in net proceeds related to the 8.50% Senior Notes of $291.3 million .
Upon the closing of the JPE Acquisition and the satisfaction of other related conditions the restricted cash was released from escrow on March 8, 2017 and used torepay and terminate the JPE Revolver and reduce borrowings under the Credit Agreement.
The 8.50% Senior Notes will mature on December 15, 2021 with interest payable in cash semi-annually in arrears on June 15 and December 15, commencing June15, 2017.
As of June 30, 2017 , the fair value of the 8.50% Senior Notes was $303.3 million . This estimate was based on similar private placement transactions along withchanges in market interest rates which represent a Level 2 measurement.
3.77% Senior Secured Notes
On September 30, 2016, Midla Financing, LLC (“Midla Financing”), American Midstream (Midla) LLC (“Midla”), and Mid Louisiana Gas Transmission LLC(“MLGT and together with Midla, the “Note Guarantors”) entered into a Note Purchase and Guaranty Agreement (the “Note Purchase Agreement”) with certaininstitutional investors (the “Purchasers”) whereby Midla Financing issued $60.0 million in aggregate principal amount of 3.77% Senior Notes (non-recourse) dueJune 30, 2031.
22
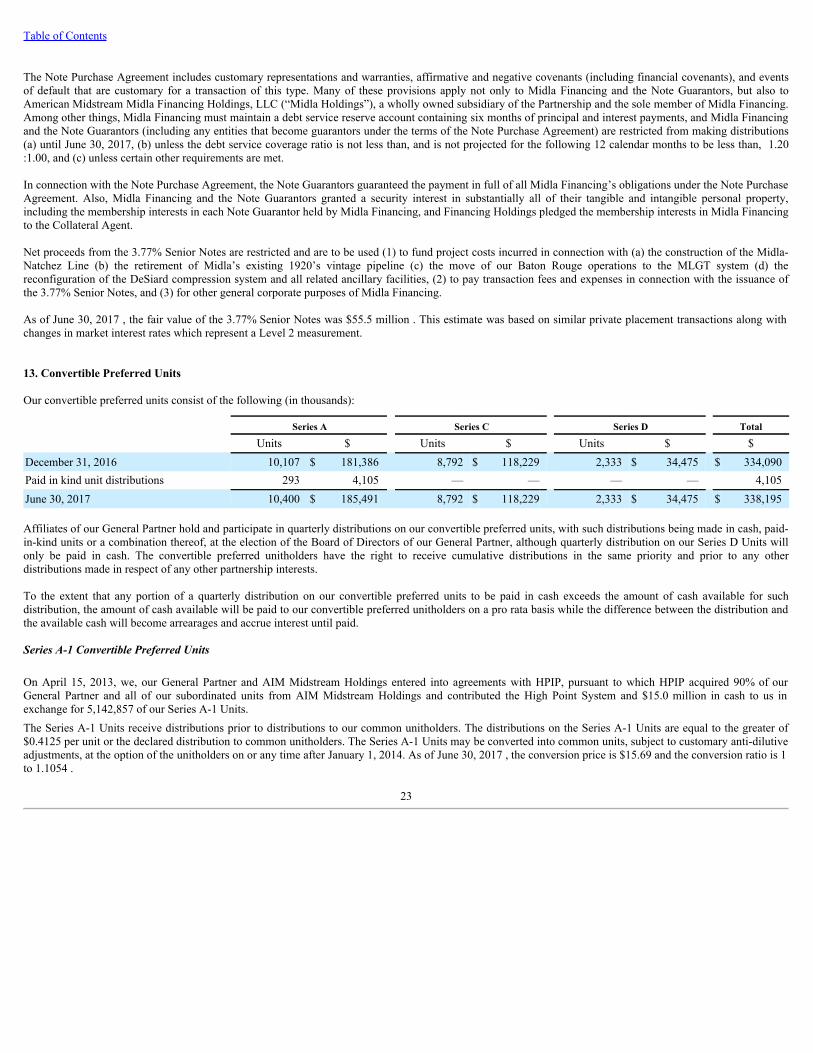
Table of Contents
The Note Purchase Agreement includes customary representations and warranties, affirmative and negative covenants (including financial covenants), and eventsof default that are customary for a transaction of this type. Many of these provisions apply not only to Midla Financing and the Note Guarantors, but also toAmerican Midstream Midla Financing Holdings, LLC (“Midla Holdings”), a wholly owned subsidiary of the Partnership and the sole member of Midla Financing.Among other things, Midla Financing must maintain a debt service reserve account containing six months of principal and interest payments, and Midla Financingand the Note Guarantors (including any entities that become guarantors under the terms of the Note Purchase Agreement) are restricted from making distributions(a) until June 30, 2017, (b) unless the debt service coverage ratio is not less than, and is not projected for the following 12 calendar months to be less than, 1.20:1.00, and (c) unless certain other requirements are met.
In connection with the Note Purchase Agreement, the Note Guarantors guaranteed the payment in full of all Midla Financing’s obligations under the Note PurchaseAgreement. Also, Midla Financing and the Note Guarantors granted a security interest in substantially all of their tangible and intangible personal property,including the membership interests in each Note Guarantor held by Midla Financing, and Financing Holdings pledged the membership interests in Midla Financingto the Collateral Agent.
Net proceeds from the 3.77% Senior Notes are restricted and are to be used (1) to fund project costs incurred in connection with (a) the construction of the Midla-Natchez Line (b) the retirement of Midla’s existing 1920’s vintage pipeline (c) the move of our Baton Rouge operations to the MLGT system (d) thereconfiguration of the DeSiard compression system and all related ancillary facilities, (2) to pay transaction fees and expenses in connection with the issuance ofthe 3.77% Senior Notes, and (3) for other general corporate purposes of Midla Financing.
As of June 30, 2017 , the fair value of the 3.77% Senior Notes was $55.5 million . This estimate was based on similar private placement transactions along withchanges in market interest rates which represent a Level 2 measurement.
13. Convertible Preferred Units
Our convertible preferred units consist of the following (in thousands):
Series A Series C Series D Total
Units $ Units $ Units $ $December 31, 2016 10,107 $ 181,386 8,792 $ 118,229 2,333 $ 34,475 $ 334,090Paid in kind unit distributions 293 4,105 — — — — 4,105June 30, 2017 10,400 $ 185,491 8,792 $ 118,229 2,333 $ 34,475 $ 338,195
Affiliates of our General Partner hold and participate in quarterly distributions on our convertible preferred units, with such distributions being made in cash, paid-in-kind units or a combination thereof, at the election of the Board of Directors of our General Partner, although quarterly distribution on our Series D Units willonly be paid in cash. The convertible preferred unitholders have the right to receive cumulative distributions in the same priority and prior to any otherdistributions made in respect of any other partnership interests.
To the extent that any portion of a quarterly distribution on our convertible preferred units to be paid in cash exceeds the amount of cash available for suchdistribution, the amount of cash available will be paid to our convertible preferred unitholders on a pro rata basis while the difference between the distribution andthe available cash will become arrearages and accrue interest until paid.
Series A-1 Convertible Preferred Units
On April 15, 2013, we, our General Partner and AIM Midstream Holdings entered into agreements with HPIP, pursuant to which HPIP acquired 90% of ourGeneral Partner and all of our subordinated units from AIM Midstream Holdings and contributed the High Point System and $15.0 million in cash to us inexchange for 5,142,857 of our Series A-1 Units.The Series A-1 Units receive distributions prior to distributions to our common unitholders. The distributions on the Series A-1 Units are equal to the greater of$0.4125 per unit or the declared distribution to common unitholders. The Series A-1 Units may be converted into common units, subject to customary anti-dilutiveadjustments, at the option of the unitholders on or any time after January 1, 2014. As of June 30, 2017 , the conversion price is $15.69 and the conversion ratio is 1to 1.1054 .
23
Table of Contents
Series A-2 Convertible Preferred Units
On March 30, 2015 and June 30, 2015, we entered into two Series A-2 Convertible Preferred Unit Purchase Agreements with Magnolia Infrastructure Partners("Magnolia") an affiliate of HPIP pursuant to which we issued, in separate private placements, newly-designated Series A-2 Units (the “Series A-2 Units”)representing limited partnership interests in the Partnership. As a result, the Partnership issued a total of 2,571,430 Series A-2 Units for approximately $45.0million in aggregate proceeds during the year ended December 31, 2015. The Series A-2 Units will participate in distributions of the Partnership along withcommon units in a manner identical to the existing Series A-1 Units (together with the Series A-2 Units, the "Series A Units"), with such distributions being madein cash or with paid-in-kind Series A Units at the election of the Board of Directors of our General Partner.
On July 27, 2015, we amended our Partnership Agreement to grant us the right (the “Call Right”) to require the holders of the Series A-2 Units to sell, assign andtransfer all or a portion of the then outstanding Series A-2 Units to us for a purchase price of $17.50 per Series A-2 Unit (subject to appropriate adjustment for anyequity distribution, subdivision or combination of equity interests in the Partnership). We may exercise the Call Right at any time, in connection with our or ouraffiliate’s acquisition of assets or equity from ArcLight Energy Partners Fund V, L.P., or one of its affiliates, for a purchase price in excess of $100 million . Wemay not exercise the Call Right with respect to any Series A-2 Units that a holder has elected to convert into common units on or prior to the date we haveprovided notice of our intent to exercise the Call Right, and we may also not exercise the Call Right if doing so would result in a default under any of our or ouraffiliates’ financing agreements or obligations. As of June 30, 2017 , the conversion price is $15.69 and the conversion ratio is 1 to 1.1054 .
As conversion is at the option of the holder and redemption is contingent upon a future event which is outside the control of the Partnership, the Series A-1 and A-2Units have been classified as mezzanine equity in the condensed consolidated balance sheets.
Third Amendment to Partnership Agreement
On March 8, 2017, the Partnership executed Amendment No. 3 to our Fifth Amended and Restated Partnership Agreement (as amended, the “PartnershipAgreement”), which amends the distribution payment terms of the Partnership’s outstanding Series A Preferred Units to provide for the payment of a number ofSeries A payment-in-kind (“PIK”) preferred units for the quarter (the “Series A Preferred Quarterly Distribution”) in which the JPE Acquisition is consummated(which is the quarter ended March 31, 2017) and each quarter thereafter equal to the quotient of (i) the greater of (a) $0.4125 and (b) the "Series A DistributionAmount," as such term is defined in the Partnership Agreement, divided by (ii) the Series A Adjusted Issue Price, as such term is defined in the PartnershipAgreement. However, in our General Partner’s discretion, which determination shall be made prior to the record date for the relevant quarter, the Series APreferred Quarterly Distribution may be paid as a combination (x) an amount in cash up to the greater of (1) $0.4125 and (2) the Series A Distribution Amount, and(y) a number of Series A Preferred Units equal to the quotient of (a) the remainder of (i) the greater of (I) $0.4125 and (II) the Series A Distribution Amount less(ii) the amount of cash paid pursuant to clause (x), divided by (b) the Series A Adjusted Issue Price. This calculation results in a reduced Series A PreferredQuarterly Distribution, which was previously calculated under the Partnership Agreement using $0.50 in place of $0.4125 in the preceding calculations.
Series C Convertible Preferred Units
On April 25, 2016, we issued 8,571,429 Series C Units to an ArcLight affiliate in connection with the purchase of membership interests in certain midstreamentities.
The Series C Units have voting rights that are identical to the voting rights of the common units and will vote with the common units as a single class on an asconverted basis, with each Series C Unit initially entitled to one vote for each common unit into which such Series C Unit is convertible. The Series C Units alsohave separate class voting rights on any matter, including a merger, consolidation or business combination, that adversely affects, amends or modifies any of therights, preferences, privileges or terms of the Series C Units. The Series C Units are convertible in whole or in part into common units at any time. The number ofcommon units into which a Series C Unit is convertible will be an amount equal to the sum of $14.00 plus all accrued and accumulated but unpaid distributions,divided by the conversion price. The sale of the Series C Units was exempt from registration under Securities Act pursuant to Rule 4(a)(2) under the Securities Act.
In the event that we issue, sell or grant any common units or convertible securities at an indicative per common unit price that is less than $14.00 per common unit(subject to customary anti-dilution adjustments), then the conversion price will be adjusted according to a formula to provide for an increase in the number ofcommon units into which Series C Units are convertible. As of June 30, 2017 , the conversion price is $13.79 and the conversion ratio is 1 to 1.0035 .
24
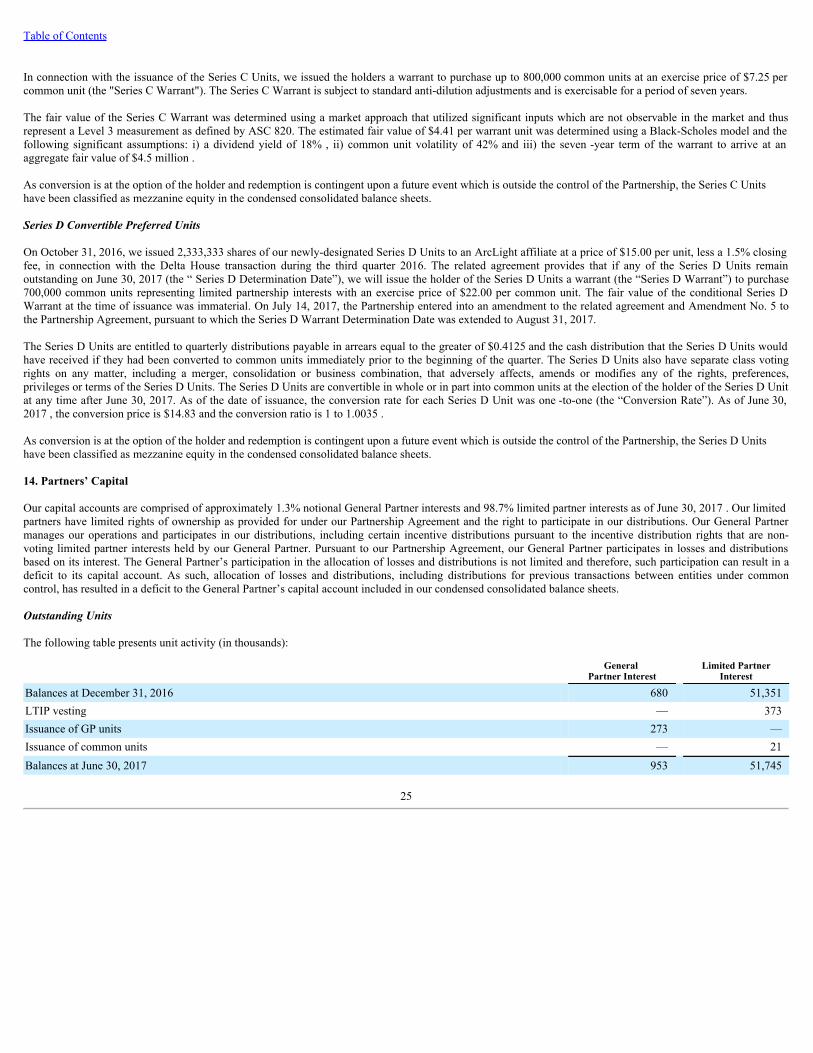
Table of Contents
In connection with the issuance of the Series C Units, we issued the holders a warrant to purchase up to 800,000 common units at an exercise price of $7.25 percommon unit (the "Series C Warrant"). The Series C Warrant is subject to standard anti-dilution adjustments and is exercisable for a period of seven years.
The fair value of the Series C Warrant was determined using a market approach that utilized significant inputs which are not observable in the market and thusrepresent a Level 3 measurement as defined by ASC 820. The estimated fair value of $4.41 per warrant unit was determined using a Black-Scholes model and thefollowing significant assumptions: i) a dividend yield of 18% , ii) common unit volatility of 42% and iii) the seven -year term of the warrant to arrive at anaggregate fair value of $4.5 million .
As conversion is at the option of the holder and redemption is contingent upon a future event which is outside the control of the Partnership, the Series C Unitshave been classified as mezzanine equity in the condensed consolidated balance sheets.
Series D Convertible Preferred Units
On October 31, 2016, we issued 2,333,333 shares of our newly-designated Series D Units to an ArcLight affiliate at a price of $15.00 per unit, less a 1.5% closingfee, in connection with the Delta House transaction during the third quarter 2016. The related agreement provides that if any of the Series D Units remainoutstanding on June 30, 2017 (the “ Series D Determination Date”), we will issue the holder of the Series D Units a warrant (the “Series D Warrant”) to purchase700,000 common units representing limited partnership interests with an exercise price of $22.00 per common unit. The fair value of the conditional Series DWarrant at the time of issuance was immaterial. On July 14, 2017, the Partnership entered into an amendment to the related agreement and Amendment No. 5 tothe Partnership Agreement, pursuant to which the Series D Warrant Determination Date was extended to August 31, 2017.
The Series D Units are entitled to quarterly distributions payable in arrears equal to the greater of $0.4125 and the cash distribution that the Series D Units wouldhave received if they had been converted to common units immediately prior to the beginning of the quarter. The Series D Units also have separate class votingrights on any matter, including a merger, consolidation or business combination, that adversely affects, amends or modifies any of the rights, preferences,privileges or terms of the Series D Units. The Series D Units are convertible in whole or in part into common units at the election of the holder of the Series D Unitat any time after June 30, 2017. As of the date of issuance, the conversion rate for each Series D Unit was one -to-one (the “Conversion Rate”). As of June 30,2017 , the conversion price is $14.83 and the conversion ratio is 1 to 1.0035 .
As conversion is at the option of the holder and redemption is contingent upon a future event which is outside the control of the Partnership, the Series D Unitshave been classified as mezzanine equity in the condensed consolidated balance sheets.
14. Partners’ Capital
Our capital accounts are comprised of approximately 1.3% notional General Partner interests and 98.7% limited partner interests as of June 30, 2017 . Our limitedpartners have limited rights of ownership as provided for under our Partnership Agreement and the right to participate in our distributions. Our General Partnermanages our operations and participates in our distributions, including certain incentive distributions pursuant to the incentive distribution rights that are non-voting limited partner interests held by our General Partner. Pursuant to our Partnership Agreement, our General Partner participates in losses and distributionsbased on its interest. The General Partner’s participation in the allocation of losses and distributions is not limited and therefore, such participation can result in adeficit to its capital account. As such, allocation of losses and distributions, including distributions for previous transactions between entities under commoncontrol, has resulted in a deficit to the General Partner’s capital account included in our condensed consolidated balance sheets.
Outstanding Units
The following table presents unit activity (in thousands):
General
Partner Interest Limited Partner
Interest
Balances at December 31, 2016 680 51,351LTIP vesting — 373Issuance of GP units 273 —Issuance of common units — 21Balances at June 30, 2017 953 51,745
25
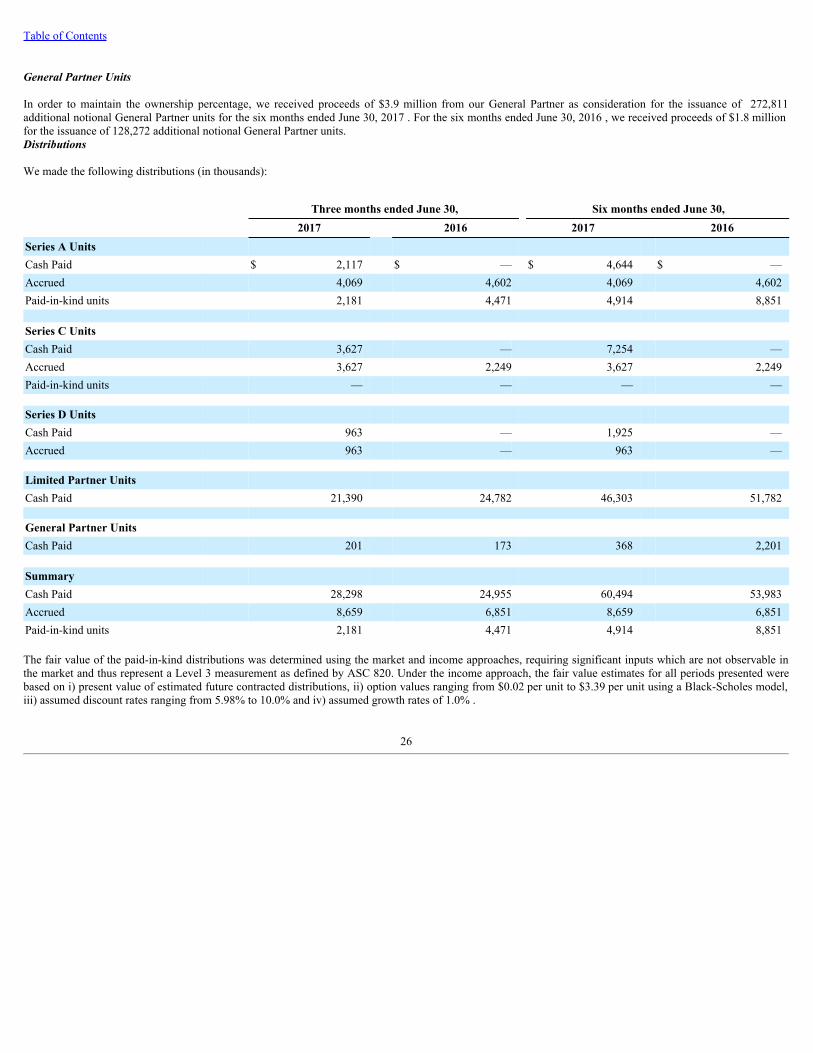
Table of Contents
General Partner Units
In order to maintain the ownership percentage, we received proceeds of $3.9 million from our General Partner as consideration for the issuance of 272,811additional notional General Partner units for the six months ended June 30, 2017 . For the six months ended June 30, 2016 , we received proceeds of $1.8 millionfor the issuance of 128,272 additional notional General Partner units.Distributions
We made the following distributions (in thousands):
Three months ended June 30, Six months ended June 30, 2017 2016 2017 2016Series A Units Cash Paid $ 2,117 $ — $ 4,644 $ —Accrued 4,069 4,602 4,069 4,602Paid-in-kind units 2,181 4,471 4,914 8,851 Series C Units Cash Paid 3,627 — 7,254 —Accrued 3,627 2,249 3,627 2,249Paid-in-kind units — — — — Series D Units Cash Paid 963 — 1,925 —Accrued 963 — 963 — Limited Partner Units Cash Paid 21,390 24,782 46,303 51,782 General Partner Units Cash Paid 201 173 368 2,201 Summary Cash Paid 28,298 24,955 60,494 53,983Accrued 8,659 6,851 8,659 6,851Paid-in-kind units 2,181 4,471 4,914 8,851
The fair value of the paid-in-kind distributions was determined using the market and income approaches, requiring significant inputs which are not observable inthe market and thus represent a Level 3 measurement as defined by ASC 820. Under the income approach, the fair value estimates for all periods presented werebased on i) present value of estimated future contracted distributions, ii) option values ranging from $0.02 per unit to $3.39 per unit using a Black-Scholes model,iii) assumed discount rates ranging from 5.98% to 10.0% and iv) assumed growth rates of 1.0% .
26
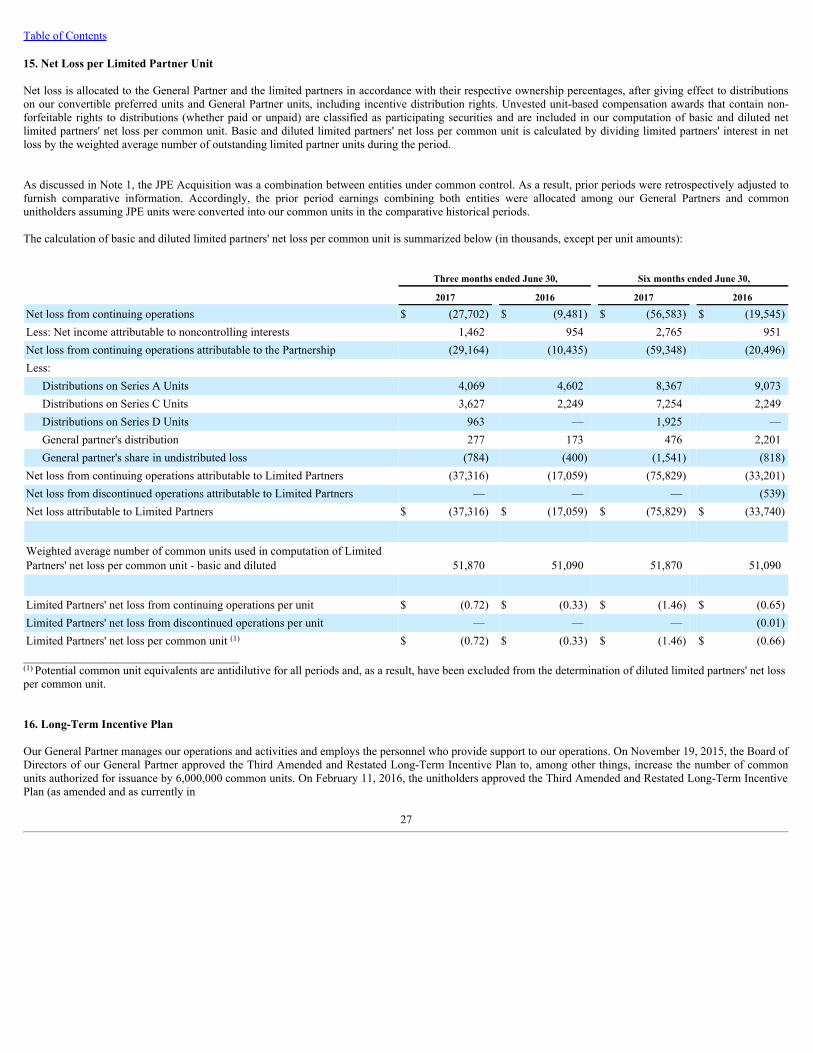
Table of Contents
15. Net Loss per Limited Partner Unit
Net loss is allocated to the General Partner and the limited partners in accordance with their respective ownership percentages, after giving effect to distributionson our convertible preferred units and General Partner units, including incentive distribution rights. Unvested unit-based compensation awards that contain non-forfeitable rights to distributions (whether paid or unpaid) are classified as participating securities and are included in our computation of basic and diluted netlimited partners' net loss per common unit. Basic and diluted limited partners' net loss per common unit is calculated by dividing limited partners' interest in netloss by the weighted average number of outstanding limited partner units during the period.
As discussed in Note 1, the JPE Acquisition was a combination between entities under common control. As a result, prior periods were retrospectively adjusted tofurnish comparative information. Accordingly, the prior period earnings combining both entities were allocated among our General Partners and commonunitholders assuming JPE units were converted into our common units in the comparative historical periods.
The calculation of basic and diluted limited partners' net loss per common unit is summarized below (in thousands, except per unit amounts):
Three months ended June 30, Six months ended June 30,
2017 2016 2017 2016
Net loss from continuing operations $ (27,702) $ (9,481) $ (56,583) $ (19,545)Less: Net income attributable to noncontrolling interests 1,462 954 2,765 951Net loss from continuing operations attributable to the Partnership (29,164) (10,435) (59,348) (20,496)Less:
Distributions on Series A Units 4,069 4,602 8,367 9,073Distributions on Series C Units 3,627 2,249 7,254 2,249Distributions on Series D Units 963 — 1,925 —General partner's distribution 277 173 476 2,201General partner's share in undistributed loss (784) (400) (1,541) (818)
Net loss from continuing operations attributable to Limited Partners (37,316) (17,059) (75,829) (33,201)Net loss from discontinued operations attributable to Limited Partners — — — (539)Net loss attributable to Limited Partners $ (37,316) $ (17,059) $ (75,829) $ (33,740)
Weighted average number of common units used in computation of LimitedPartners' net loss per common unit - basic and diluted 51,870 51,090 51,870 51,090
Limited Partners' net loss from continuing operations per unit $ (0.72) $ (0.33) $ (1.46) $ (0.65)Limited Partners' net loss from discontinued operations per unit — — — (0.01)Limited Partners' net loss per common unit (1) $ (0.72) $ (0.33) $ (1.46) $ (0.66)_____________________________________(1) Potential common unit equivalents are antidilutive for all periods and, as a result, have been excluded from the determination of diluted limited partners' net lossper common unit.
16. Long-Term Incentive Plan
Our General Partner manages our operations and activities and employs the personnel who provide support to our operations. On November 19, 2015, the Board ofDirectors of our General Partner approved the Third Amended and Restated Long-Term Incentive Plan to, among other things, increase the number of commonunits authorized for issuance by 6,000,000 common units. On February 11, 2016, the unitholders approved the Third Amended and Restated Long-Term IncentivePlan (as amended and as currently in
27
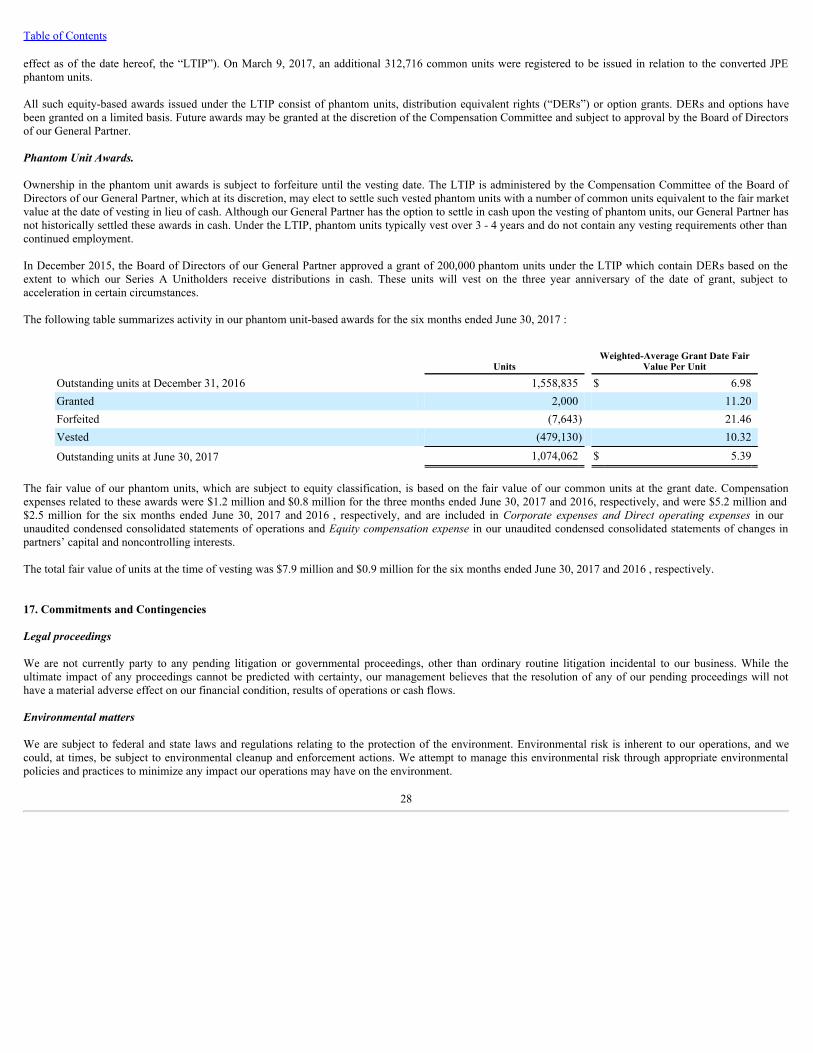
Table of Contents
effect as of the date hereof, the “LTIP”). On March 9, 2017, an additional 312,716 common units were registered to be issued in relation to the converted JPEphantom units.
All such equity-based awards issued under the LTIP consist of phantom units, distribution equivalent rights (“DERs”) or option grants. DERs and options havebeen granted on a limited basis. Future awards may be granted at the discretion of the Compensation Committee and subject to approval by the Board of Directorsof our General Partner.
Phantom Unit Awards.
Ownership in the phantom unit awards is subject to forfeiture until the vesting date. The LTIP is administered by the Compensation Committee of the Board ofDirectors of our General Partner, which at its discretion, may elect to settle such vested phantom units with a number of common units equivalent to the fair marketvalue at the date of vesting in lieu of cash. Although our General Partner has the option to settle in cash upon the vesting of phantom units, our General Partner hasnot historically settled these awards in cash. Under the LTIP, phantom units typically vest over 3 - 4 years and do not contain any vesting requirements other thancontinued employment.
In December 2015, the Board of Directors of our General Partner approved a grant of 200,000 phantom units under the LTIP which contain DERs based on theextent to which our Series A Unitholders receive distributions in cash. These units will vest on the three year anniversary of the date of grant, subject toacceleration in certain circumstances.
The following table summarizes activity in our phantom unit-based awards for the six months ended June 30, 2017 :
Units Weighted-Average Grant Date Fair
Value Per Unit
Outstanding units at December 31, 2016 1,558,835 $ 6.98Granted 2,000 11.20Forfeited (7,643) 21.46Vested (479,130) 10.32
Outstanding units at June 30, 2017 1,074,062 $ 5.39
The fair value of our phantom units, which are subject to equity classification, is based on the fair value of our common units at the grant date. Compensationexpenses related to these awards were $1.2 million and $0.8 million for the three months ended June 30, 2017 and 2016, respectively, and were $5.2 million and$2.5 million for the six months ended June 30, 2017 and 2016 , respectively, and are included in Corporate expenses and Direct operating expenses in ourunaudited condensed consolidated statements of operations and Equity compensation expense in our unaudited condensed consolidated statements of changes inpartners’ capital and noncontrolling interests.
The total fair value of units at the time of vesting was $7.9 million and $0.9 million for the six months ended June 30, 2017 and 2016 , respectively.
17. Commitments and Contingencies
Legal proceedings
We are not currently party to any pending litigation or governmental proceedings, other than ordinary routine litigation incidental to our business. While theultimate impact of any proceedings cannot be predicted with certainty, our management believes that the resolution of any of our pending proceedings will nothave a material adverse effect on our financial condition, results of operations or cash flows.
Environmental matters
We are subject to federal and state laws and regulations relating to the protection of the environment. Environmental risk is inherent to our operations, and wecould, at times, be subject to environmental cleanup and enforcement actions. We attempt to manage this environmental risk through appropriate environmentalpolicies and practices to minimize any impact our operations may have on the environment.
28
Table of Contents
Regulatory matters
On October 8, 2014, Midla reached an agreement in principle with its customers regarding the interstate pipeline that traverses Louisiana and Mississippi in orderto provide continued service to its customers while addressing safety concerns with the existing pipeline. On April 16, 2015, FERC approved the stipulation andagreement (the “Midla Agreement”) relating to the October 8, 2014 regulatory matter allowing Midla to retire the existing 1920’s pipeline and replace it with theMidla-Natchez Line to serve existing residential, commercial, and industrial customers. Under the Midla Agreement, customers not served by the new Midla-Natchez Line will be connected to other interstate or intrastate pipelines, other gas distribution systems, or offered conversion to propane service. On June 29,2015, we filed with FERC for authorization to construct the Midla-Natchez pipeline, which was approved on December 17, 2015. Construction commenced in thesecond quarter of 2016, and services commenced on March 31, 2017. Under the Midla Agreement, Midla executed long-term agreements seeking to recover itsinvestment in the Midla-Natchez Line.
Acquisition related costs
As part of the JPE Acquisition, management of JPE communicated to its employees a severance plan. The plan includes termination benefits in the form ofseverance and accelerated vesting of phantom units for employees who render service through their respective termination date. We have estimated the fair valueof the obligation to be approximately $0.9 million , which has been recorded as of June 30, 2017.
18. Related Party Transactions
In December 2013, we acquired Blackwater Midstream Holdings, LLC (“Blackwater”) from an affiliate of ArcLight. The acquisition agreement included aprovision whereby an ArcLight affiliate would be entitled to an additional $5.0 million of merger consideration based on Blackwater meeting certain operatingtargets. During the third quarter of 2016, we determined that it was probable the operating targets would be met in early 2017 and recorded a $5.0 million accrueddistribution to the ArcLight affiliate which is included in Accrued expense and other current liabilities in the accompanying condensed consolidated balance sheetsas of June 30, 2017 .
Employees of our General Partner are assigned to work for us or other affiliates of our General Partner. Where directly attributable, all compensation and relatedexpenses for these employees are charged directly by our General Partner to American Midstream, LLC, which, in turn, charges the appropriate subsidiary oraffiliate. Our General Partner does not record any profit or margin on the expenses charged to us.
In connection with the JPE Acquisition closing during the first quarter of 2017, our General Partner agreed to provide quarterly financial support up to a maximumof $25 million . The financial support will continue for eight ( 8 ) consecutive quarters following the closing of the acquisition, or if earlier, until $25 million insupport has been provided. We have utilized $15.1 million of the financial support mentioned above.
During the second quarter of 2017, the Partnership received $9.6 million from the General Partner as reimbursement of post-closing transition costs. Separate fromthe financial support described above, our General Partner also agreed to absorb $9.6 million corporate overhead expenses, which were incurred by us in the firstquarter of 2017, and subsequently paid the amount in the second quarter of 2017. These two cash amounts, and the $3.8 million received related to the GeneralPartner’s ownership percentage, totaled $23.1 million which was presented as part of the contribution line item on our condensed consolidated statements of cashflows.
Republic Midstream, LLC (“Republic”), is an entity owned by ArcLight in which we charge a monthly fee of approximately $0.1 million . The monthly feereduced the Corporate expenses in the condensed consolidated statements of operations by $0.3 million and $0.7 million for each of the three and six monthsended June 30, 2017 and June 30, 2016, respectively. As of June 30, 2017, we had a receivable balance due from Republic of $1.4 million , which is included inthe account Receivables from related parties which is part of Other current assets in the condensed consolidated balance sheets.
As of June 30, 2017 and December 31, 2016 , we had $2.3 million of payables balance, which is net of $15.6 million of account payables and $13.3 million ofaccount receivables, and $3.9 million of account payables, respectively, due to our General Partner, which has been recorded in Accrued expenses and othercurrent liabilities and relates primarily to compensation. This payable is generally settled on a quarterly basis related to the foregoing transactions.
29
Table of Contents
On November 1, 2016, we became operator of the Destin and Okeanos pipelines and entered into an operating and administrative management agreements underwhich the affiliates pay a monthly fee for general and administrative services provided by us. In addition, the affiliates reimburse us for certain transition relatedexpenses. For the six months ended June 30, 2017 , we recognized $1.2 million of management fee income. As of June 30, 2017 and December 31, 2016, we hadan outstanding account receivables balance of $5.8 million and $2.2 million , respectively, which is recorded in Receivables from related parties and is part ofOther current assets in the condensed consolidated balance sheets.
American Panther, LLC ("American Panther") is a 60% -owned subsidiary of ours which is consolidated for financial reporting purposes. Panther, a provider ofmidstream activities and services to the oil & gas industry in Texas, Louisiana and the Gulf Coast, is the 40% non-controlling interest owner of American Panther.Pursuant to a related party agreement which began in the second quarter of 2016, an affiliate of Panther, or Panther Offshore Gathering Systems, LLC, providesmanagement services to American Panther in exchange for related fees, which in 2016 totaled $0.8 million of Direct operating expenses and $0.4 million ofCorporate expenses in the unaudited condensed consolidated statements of operations. During the six months ended June 30, 2017, such management servicestotaled $0.5 million of Direct operating expenses and $0.3 million of Corporate expenses in the unaudited condensed consolidated statements of operations.
We enter into purchases and sales of natural gas and crude oil with a company whose chief financial officer is the brother of one of our executive officers. Duringthe three months ended June 30, 2017 , and 2016 , we recognized revenue of $1.8 million and $0.7 million , respectively, while purchases from this companytotaled $1.2 million , and $0.8 million , respectively. During the six months ended June 30, 2017, and 2016, we recognized revenue of $2.5 million and $1.6million , respectively, while purchases from this company totaled $2.6 million and $1.8 million , respectively.
JP Energy Development (“JP Development”), an affiliate owned by Arclight, had a pipeline transportation business that provided crude oil pipeline transportationservices to JPE’s discontinued Mid-Continent Business. As a result of utilizing JP Development’s pipeline transportation services, JPE incurred pipeline tariff feesof $0.4 million for the six months ended June 30, 2016, which have been included in net loss from discontinued operations in the condensed consolidatedstatements of operations. We combined the cash flows from the Mid-Continent Business with the cash flows from continuing operations for all periods presented inthe condensed consolidated statements of cash flows. As of December 31, 2015, we had a net receivable from JP Development of $7.9 million , primarily as theresult of the prepayments made in 2014 for the crude oil pipeline transportation services to be provided by JP Development. We recovered these amounts in full onFebruary 1, 2016.
On February 1, 2016, JPE sold certain trucking and marketing assets in the Mid-Continent area to JP Development in connection with JP Development’s sale of itsGSPP pipeline assets to a third party.
During the year ended December 31, 2016, JPE’s general partner agreed to absorb corporate overhead expenses incurred by us and not pass such expense throughto us. We record non-cash contributions for these expenses in the quarters subsequent to when they were incurred, which was $0 million and $4 million for thethree and six months ended June 30, 2017, respectively, and $1.5 million and $4.0 million for the three and six months ended June 30, 2016, respectively. JPE’sgeneral partner agreed to absorb $3.5 million and $5.0 million of such corporate overhead expenses in the three and six months ended June 30, 2016.
30
Table of Contents
19. Supplemental Cash Flow Information
Supplemental cash flows and non-cash transactions consist of the following (in thousands):
Six months ended June 30,
2017 2016
Supplemental non-cash information Investing Increase (decrease) in accrued property, plant and equipment purchases $ (7,259) $ 4,856Financing Contributions from an affiliate holding limited partner interests 4,000 4,000Issuance of Series C Units and Warrant in connection with the Emerald Transactions — 120,000Accrued distributions on convertible preferred units 8,659 6,851Paid-in-kind distributions on convertible preferred units 4,914 8,851Cancellation of escrow units — 6,817Accrued distribution from unconsolidated affiliates — 4,360
20. Reportable Segments
During the first quarter of 2017, as a result of the acquisition of JPE described in Note 1, we realigned the composition of our reportable segments. Accordingly,we have restated the items of segment information for the three and six months ended June 30, 2016 to reflect this new segment adjustment.
Our operations are located in the United States and are organized into six reportable segments: 1) Gas Gathering and Processing Services, 2) Liquid Pipelines andServices, 3) Natural Gas Transportation Services, 4) Offshore Pipelines and Services, 5) Terminalling Services, and 6) Propane Marketing Services.
• Gas Gathering and Processing Services . Our Gas Gathering and Processing Services segment provides “wellhead-to-market” services toproducers of natural gas and natural gas liquids, which include transporting raw natural gas from various receipt points through gatheringsystems, treating the raw natural gas, processing raw natural gas to separate the NGLs from the natural gas, fractionating NGLs, and selling ordelivering pipeline-quality natural gas and NGLs to various markets and pipeline systems.
• Liquid Pipelines and Services . Our Liquid Pipelines and Services segment provides transportation, purchase and sales of crude oil from variousreceipt points including lease automatic customer transfer (“LACT”) facilities and deliveries to various markets.
• Natural Gas Transportation Services . Our Natural Gas Transportation Services segment transports and delivers natural gas from producingwells, receipt points, or pipeline interconnects for shippers and other customers, which include local distribution companies (“LDCs”), utilitiesand industrial, commercial and power generation customers.
• Offshore Pipelines and Services . Our Offshore Pipelines and Services segment gathers and transports natural gas and crude oil from variousreceipt points to other pipeline interconnects, onshore facilities and other delivery points.
• Terminalling Services . Our Terminalling Services segment provides above-ground leasable storage operations at our marine terminals thatsupport various commercial customers, including commodity brokers, refiners and chemical manufacturers to store a range of products and alsoincludes crude oil storage in Cushing, Oklahoma and refined products terminals in Texas and Arkansas.
• Propane Marketing Services . Our Propane Marketing Services segment gathers, transports and sells natural gas liquids (NGLs). This isaccomplished through cylinder tank exchange, sales through retail, commercial and wholesale distribution and through a fleet of trucks operatingin the Eagle Ford and Permian basin areas.
31
Table of Contents
These segments are monitored separately by our chief operating decision maker (“CODM”) for performance and are consistent with our internal financialreporting. The CODM periodically reviews segment gross margin information for each segment to make business decisions. These segments have been identifiedbased on the differing products and services, regulatory environment and the expertise required for these operations.
We define total segment gross margin as the sum of the segment gross margins for our Gas Gathering and Processing Services,Liquid Pipelines and Services, Natural Gas Transportation Services, Offshore Pipelines and Services, Terminalling Services andPropane Marketing Services segments.
We define segment gross margin in our Gas Gathering and Processing Services segment as total revenue plus unconsolidated affiliate earnings less unrealizedgains or plus unrealized losses on commodity derivatives, construction and operating management agreement income and the cost of natural gas, crude oil andNGLs and condensate purchased.
We define segment gross margin in our Liquid Pipelines and Services segment as total revenue plus unconsolidated affiliate earnings less unrealized gains or plusunrealized losses on commodity derivatives and the cost of crude oil purchased in connection with fixed-margin arrangements. Substantially all of our grossmargin in this segment is fee-based or fixed-margin, with little to no direct commodity price risk.
We define segment gross margin in our Natural Gas Transportation Services segment as total revenue plus unconsolidated affiliate earnings less the cost of naturalgas purchased in connection with fixed-margin arrangements. Substantially all of our gross margin in this segment is fee-based or fixed-margin, with little to nodirect commodity price risk.
We define segment gross margin in our Offshore Pipelines and Services segment as total revenue plus unconsolidated affiliate earnings less the cost of natural gaspurchased in connection with fixed-margin arrangements. Substantially all of our gross margin in this segment is fee-based or fixed-margin, with little to no directcommodity price risk.
We define segment gross margin in our Terminalling Services segment as total revenue less direct operating expense which includes direct labor, general materialsand supplies and direct overhead.
We define segment gross margin in our Propane Marketing Services segment as total revenue less purchases of natural gas, NGLs and condensate excluding non-cash charges such as non-cash unrealized gains or plus unrealized losses on commodity derivatives.
32
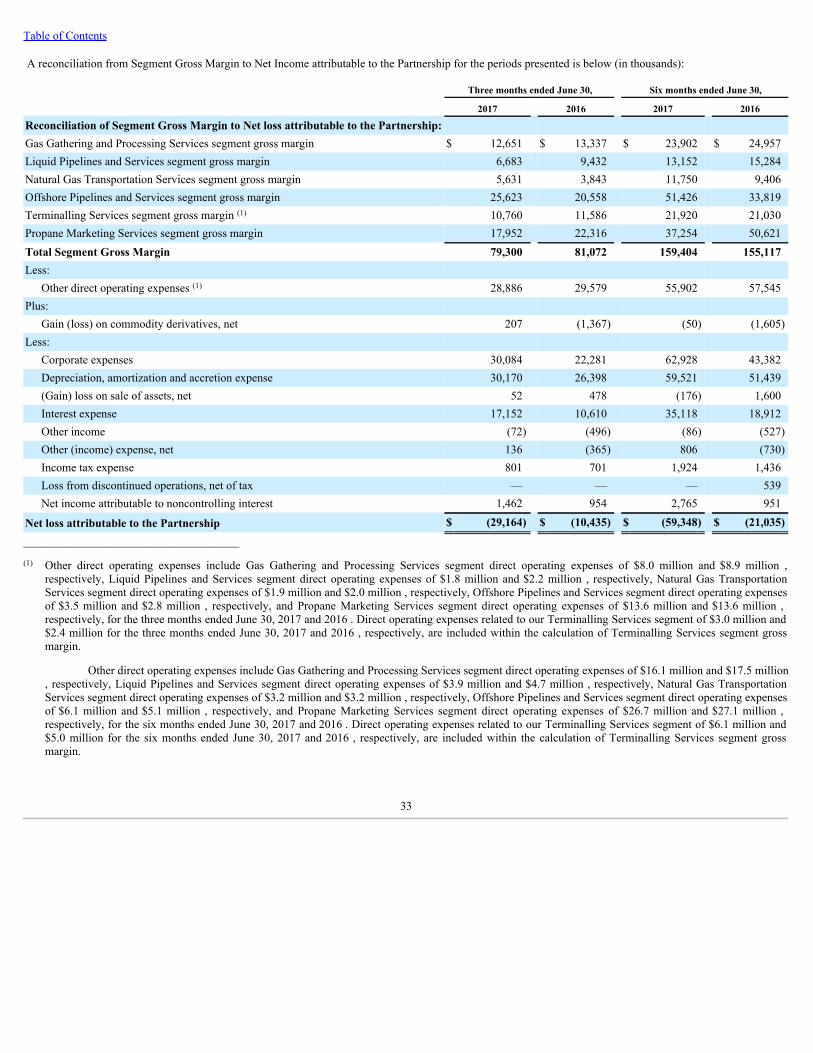
Table of Contents
A reconciliation from Segment Gross Margin to Net Income attributable to the Partnership for the periods presented is below (in thousands):
Three months ended June 30, Six months ended June 30,
2017 2016 2017 2016
Reconciliation of Segment Gross Margin to Net loss attributable to the Partnership: Gas Gathering and Processing Services segment gross margin $ 12,651 $ 13,337 $ 23,902 $ 24,957Liquid Pipelines and Services segment gross margin 6,683 9,432 13,152 15,284Natural Gas Transportation Services segment gross margin 5,631 3,843 11,750 9,406Offshore Pipelines and Services segment gross margin 25,623 20,558 51,426 33,819Terminalling Services segment gross margin (1) 10,760 11,586 21,920 21,030Propane Marketing Services segment gross margin 17,952 22,316 37,254 50,621Total Segment Gross Margin 79,300 81,072 159,404 155,117Less:
Other direct operating expenses (1) 28,886 29,579 55,902 57,545Plus:
Gain (loss) on commodity derivatives, net 207 (1,367) (50) (1,605)Less:
Corporate expenses 30,084 22,281 62,928 43,382Depreciation, amortization and accretion expense 30,170 26,398 59,521 51,439(Gain) loss on sale of assets, net 52 478 (176) 1,600Interest expense 17,152 10,610 35,118 18,912Other income (72) (496) (86) (527)Other (income) expense, net 136 (365) 806 (730)Income tax expense 801 701 1,924 1,436Loss from discontinued operations, net of tax — — — 539Net income attributable to noncontrolling interest 1,462 954 2,765 951
Net loss attributable to the Partnership $ (29,164) $ (10,435) $ (59,348) $ (21,035)_____________________________________
(1) Other direct operating expenses include Gas Gathering and Processing Services segment direct operating expenses of $8.0 million and $8.9 million ,respectively, Liquid Pipelines and Services segment direct operating expenses of $1.8 million and $2.2 million , respectively, Natural Gas TransportationServices segment direct operating expenses of $1.9 million and $2.0 million , respectively, Offshore Pipelines and Services segment direct operating expensesof $3.5 million and $2.8 million , respectively, and Propane Marketing Services segment direct operating expenses of $13.6 million and $13.6 million ,respectively, for the three months ended June 30, 2017 and 2016 . Direct operating expenses related to our Terminalling Services segment of $3.0 million and$2.4 million for the three months ended June 30, 2017 and 2016 , respectively, are included within the calculation of Terminalling Services segment grossmargin.
Other direct operating expenses include Gas Gathering and Processing Services segment direct operating expenses of $16.1 million and $17.5 million, respectively, Liquid Pipelines and Services segment direct operating expenses of $3.9 million and $4.7 million , respectively, Natural Gas TransportationServices segment direct operating expenses of $3.2 million and $3.2 million , respectively, Offshore Pipelines and Services segment direct operating expensesof $6.1 million and $5.1 million , respectively, and Propane Marketing Services segment direct operating expenses of $26.7 million and $27.1 million ,respectively, for the six months ended June 30, 2017 and 2016 . Direct operating expenses related to our Terminalling Services segment of $6.1 million and$5.0 million for the six months ended June 30, 2017 and 2016 , respectively, are included within the calculation of Terminalling Services segment grossmargin.
33
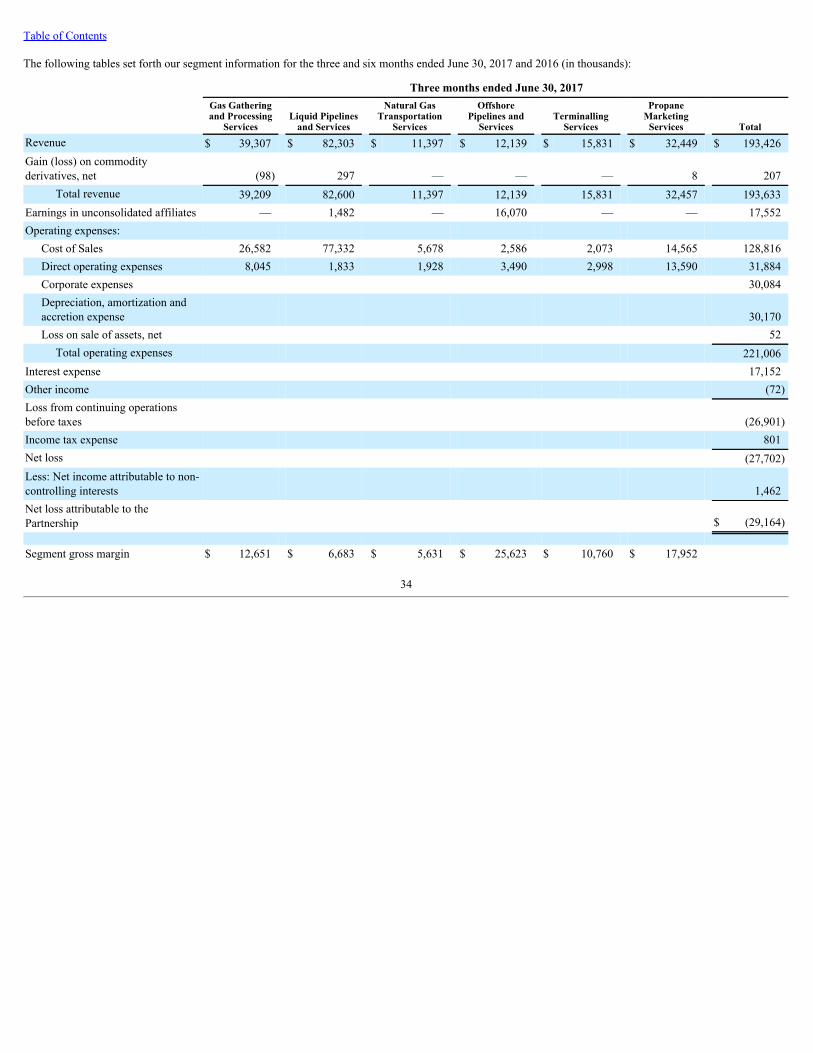
Table of Contents
The following tables set forth our segment information for the three and six months ended June 30, 2017 and 2016 (in thousands):
Three months ended June 30, 2017
Gas Gatheringand Processing
Services Liquid Pipelines
and Services
Natural GasTransportation
Services
OffshorePipelines and
Services Terminalling
Services
PropaneMarketing
Services TotalRevenue $ 39,307 $ 82,303 $ 11,397 $ 12,139 $ 15,831 $ 32,449 $ 193,426Gain (loss) on commodityderivatives, net (98) 297 — — — 8 207
Total revenue 39,209 82,600 11,397 12,139 15,831 32,457 193,633Earnings in unconsolidated affiliates — 1,482 — 16,070 — — 17,552Operating expenses:
Cost of Sales 26,582 77,332 5,678 2,586 2,073 14,565 128,816Direct operating expenses 8,045 1,833 1,928 3,490 2,998 13,590 31,884Corporate expenses 30,084Depreciation, amortization andaccretion expense 30,170Loss on sale of assets, net 52
Total operating expenses 221,006Interest expense 17,152Other income (72)Loss from continuing operationsbefore taxes (26,901)Income tax expense 801Net loss (27,702)Less: Net income attributable to non-controlling interests 1,462Net loss attributable to thePartnership $ (29,164)
Segment gross margin $ 12,651 $ 6,683 $ 5,631 $ 25,623 $ 10,760 $ 17,952
34
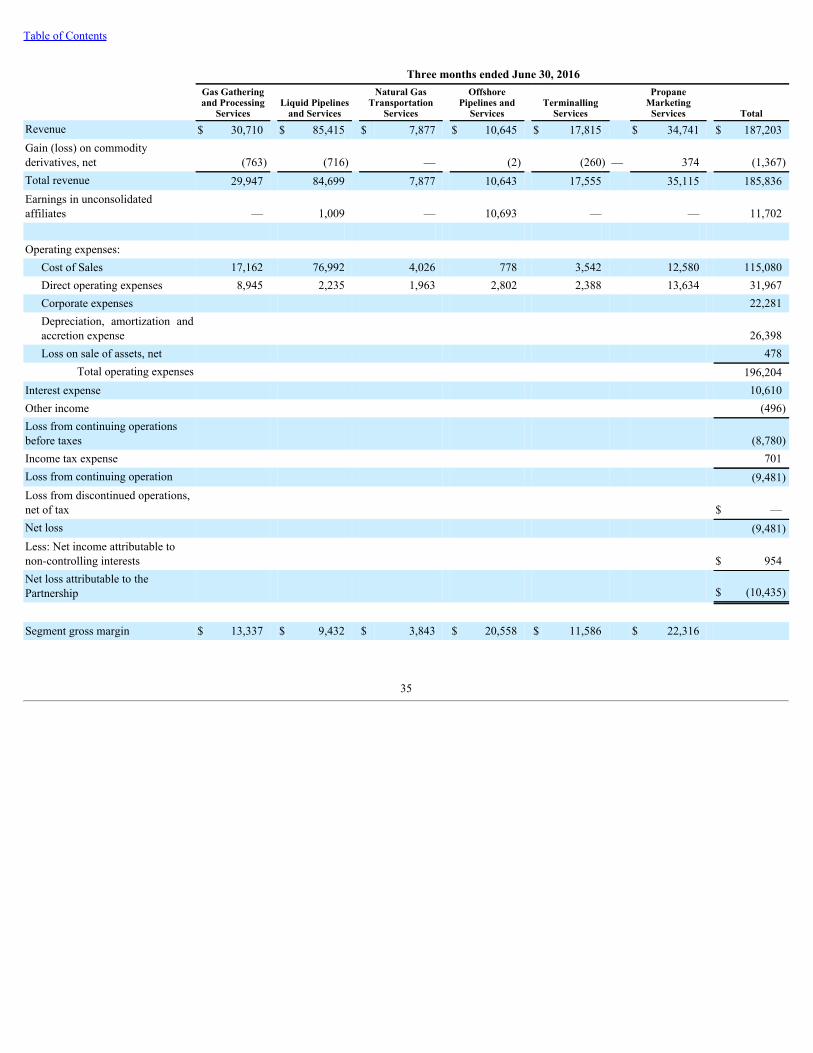
Table of Contents
Three months ended June 30, 2016
Gas Gatheringand Processing
Services Liquid Pipelines
and Services
Natural GasTransportation
Services
OffshorePipelines and
Services Terminalling
Services
PropaneMarketing
Services TotalRevenue $ 30,710 $ 85,415 $ 7,877 $ 10,645 $ 17,815 $ 34,741 $ 187,203Gain (loss) on commodityderivatives, net (763) (716) — (2) (260) — 374 (1,367)Total revenue 29,947 84,699 7,877 10,643 17,555 35,115 185,836Earnings in unconsolidatedaffiliates — 1,009 — 10,693 — — 11,702
Operating expenses:
Cost of Sales 17,162 76,992 4,026 778 3,542 12,580 115,080Direct operating expenses 8,945 2,235 1,963 2,802 2,388 13,634 31,967Corporate expenses 22,281Depreciation, amortization andaccretion expense 26,398Loss on sale of assets, net 478
Total operating expenses 196,204Interest expense 10,610Other income (496)Loss from continuing operationsbefore taxes (8,780)Income tax expense 701Loss from continuing operation (9,481)Loss from discontinued operations,net of tax $ —Net loss (9,481)Less: Net income attributable tonon-controlling interests $ 954Net loss attributable to thePartnership $ (10,435)
Segment gross margin $ 13,337 $ 9,432 $ 3,843 $ 20,558 $ 11,586 $ 22,316
35
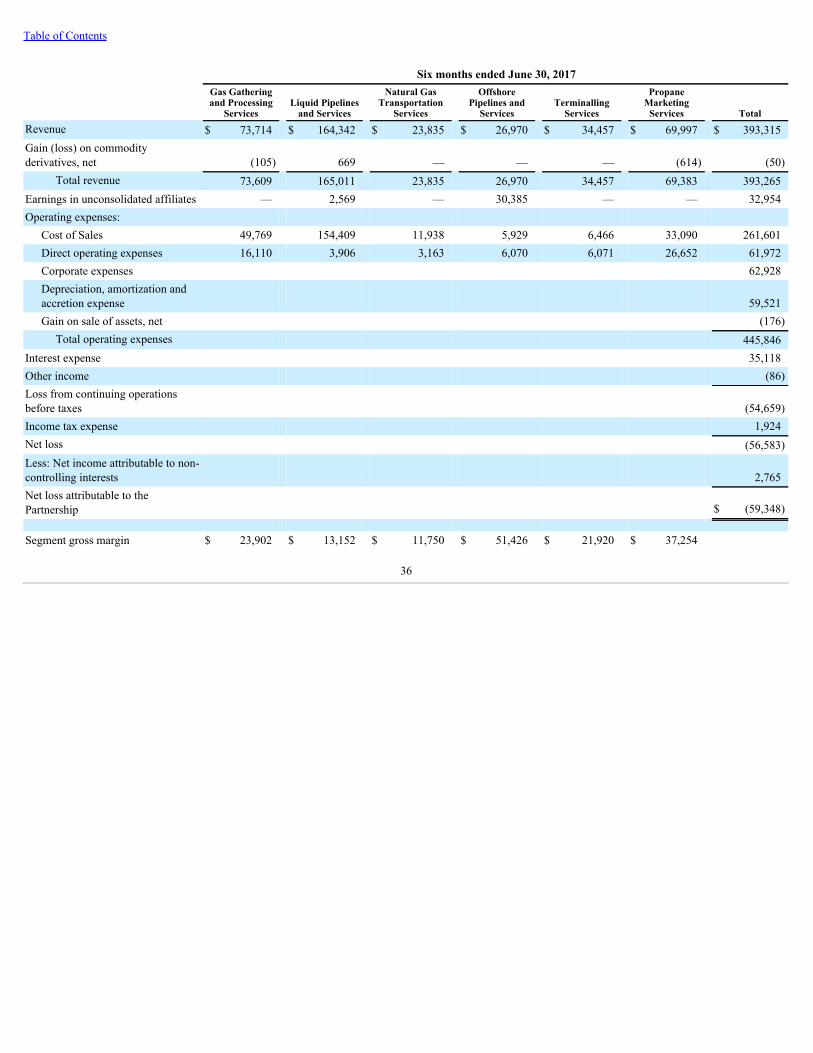
Table of Contents
Six months ended June 30, 2017
Gas Gatheringand Processing
Services Liquid Pipelines
and Services
Natural GasTransportation
Services
OffshorePipelines and
Services Terminalling
Services
PropaneMarketing
Services TotalRevenue $ 73,714 $ 164,342 $ 23,835 $ 26,970 $ 34,457 $ 69,997 $ 393,315Gain (loss) on commodityderivatives, net (105) 669 — — — (614) (50)
Total revenue 73,609 165,011 23,835 26,970 34,457 69,383 393,265Earnings in unconsolidated affiliates — 2,569 — 30,385 — — 32,954Operating expenses:
Cost of Sales 49,769 154,409 11,938 5,929 6,466 33,090 261,601Direct operating expenses 16,110 3,906 3,163 6,070 6,071 26,652 61,972Corporate expenses 62,928Depreciation, amortization andaccretion expense 59,521Gain on sale of assets, net (176)
Total operating expenses 445,846Interest expense 35,118Other income (86)Loss from continuing operationsbefore taxes (54,659)Income tax expense 1,924Net loss (56,583)Less: Net income attributable to non-controlling interests 2,765Net loss attributable to thePartnership $ (59,348)
Segment gross margin $ 23,902 $ 13,152 $ 11,750 $ 51,426 $ 21,920 $ 37,254
36
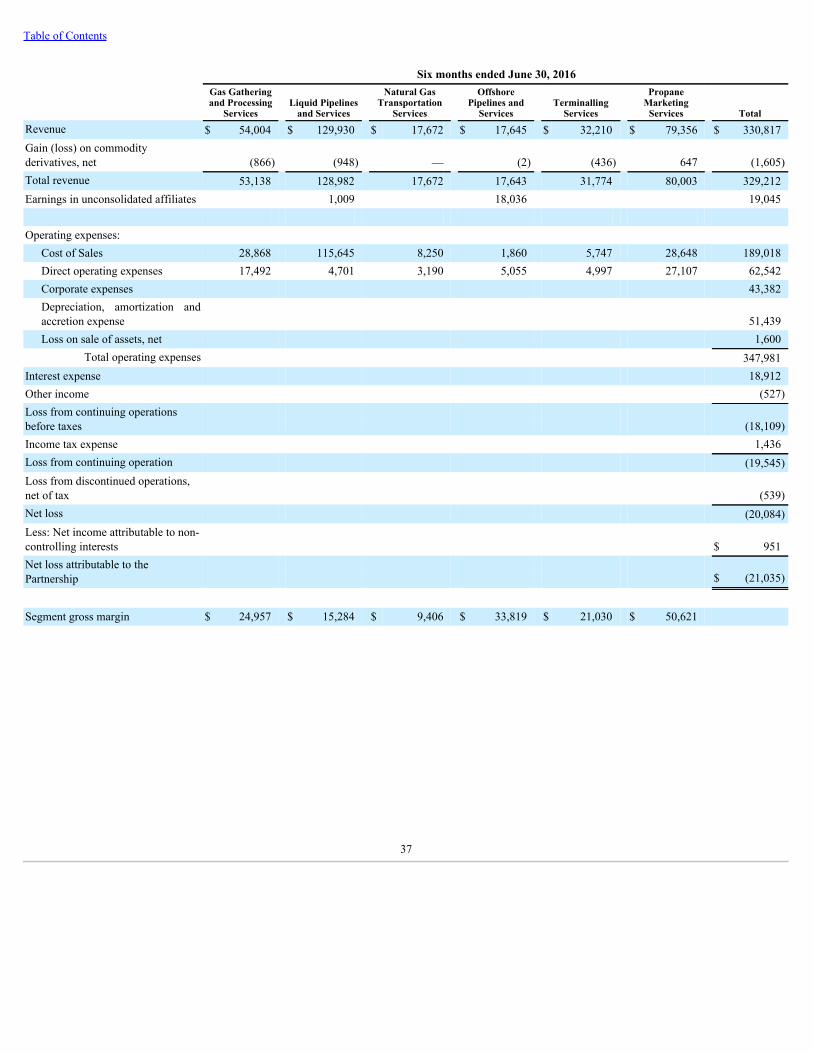
Table of Contents
Six months ended June 30, 2016
Gas Gatheringand Processing
Services Liquid Pipelines
and Services
Natural GasTransportation
Services
OffshorePipelines and
Services Terminalling
Services
PropaneMarketing
Services TotalRevenue $ 54,004 $ 129,930 $ 17,672 $ 17,645 $ 32,210 $ 79,356 $ 330,817Gain (loss) on commodityderivatives, net (866) (948) — (2) (436) 647 (1,605)Total revenue 53,138 128,982 17,672 17,643 31,774 80,003 329,212Earnings in unconsolidated affiliates 1,009 18,036 19,045
Operating expenses:
Cost of Sales 28,868 115,645 8,250 1,860 5,747 28,648 189,018Direct operating expenses 17,492 4,701 3,190 5,055 4,997 27,107 62,542Corporate expenses 43,382Depreciation, amortization andaccretion expense 51,439Loss on sale of assets, net 1,600
Total operating expenses 347,981Interest expense 18,912Other income (527)Loss from continuing operationsbefore taxes (18,109)Income tax expense 1,436Loss from continuing operation (19,545)Loss from discontinued operations,net of tax (539)Net loss (20,084)Less: Net income attributable to non-controlling interests $ 951Net loss attributable to thePartnership $ (21,035)
Segment gross margin $ 24,957 $ 15,284 $ 9,406 $ 33,819 $ 21,030 $ 50,621
37
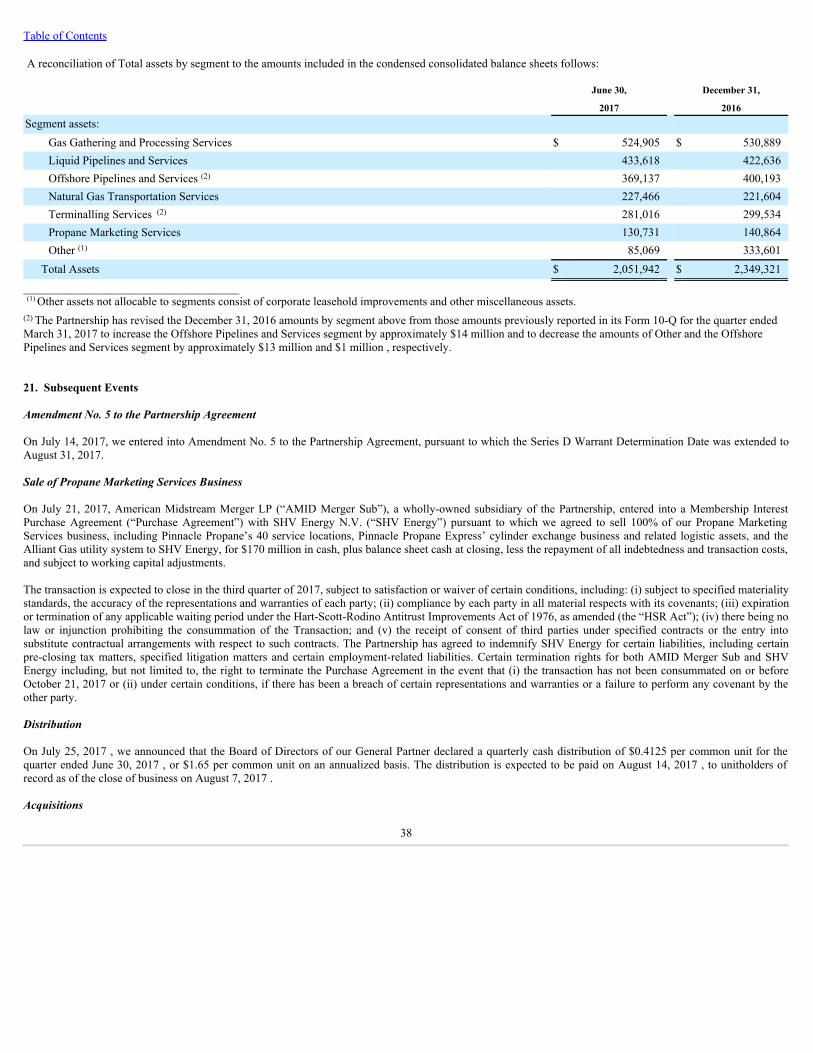
Table of Contents
A reconciliation of Total assets by segment to the amounts included in the condensed consolidated balance sheets follows:
June 30, December 31, 2017 2016Segment assets:
Gas Gathering and Processing Services $ 524,905 $ 530,889Liquid Pipelines and Services 433,618 422,636Offshore Pipelines and Services (2) 369,137 400,193Natural Gas Transportation Services 227,466 221,604Terminalling Services (2) 281,016 299,534Propane Marketing Services 130,731 140,864Other (1) 85,069 333,601
Total Assets $ 2,051,942 $ 2,349,321_____________________________________
(1) Other assets not allocable to segments consist of corporate leasehold improvements and other miscellaneous assets.(2) The Partnership has revised the December 31, 2016 amounts by segment above from those amounts previously reported in its Form 10-Q for the quarter endedMarch 31, 2017 to increase the Offshore Pipelines and Services segment by approximately $14 million and to decrease the amounts of Other and the OffshorePipelines and Services segment by approximately $13 million and $1 million , respectively.
21. Subsequent Events
Amendment No. 5 to the Partnership Agreement
On July 14, 2017, we entered into Amendment No. 5 to the Partnership Agreement, pursuant to which the Series D Warrant Determination Date was extended toAugust 31, 2017.
Sale of Propane Marketing Services Business
On July 21, 2017, American Midstream Merger LP (“AMID Merger Sub”), a wholly-owned subsidiary of the Partnership, entered into a Membership InterestPurchase Agreement (“Purchase Agreement”) with SHV Energy N.V. (“SHV Energy”) pursuant to which we agreed to sell 100% of our Propane MarketingServices business, including Pinnacle Propane’s 40 service locations, Pinnacle Propane Express’ cylinder exchange business and related logistic assets, and theAlliant Gas utility system to SHV Energy, for $170 million in cash, plus balance sheet cash at closing, less the repayment of all indebtedness and transaction costs,and subject to working capital adjustments.
The transaction is expected to close in the third quarter of 2017, subject to satisfaction or waiver of certain conditions, including: (i) subject to specified materialitystandards, the accuracy of the representations and warranties of each party; (ii) compliance by each party in all material respects with its covenants; (iii) expirationor termination of any applicable waiting period under the Hart-Scott-Rodino Antitrust Improvements Act of 1976, as amended (the “HSR Act”); (iv) there being nolaw or injunction prohibiting the consummation of the Transaction; and (v) the receipt of consent of third parties under specified contracts or the entry intosubstitute contractual arrangements with respect to such contracts. The Partnership has agreed to indemnify SHV Energy for certain liabilities, including certainpre-closing tax matters, specified litigation matters and certain employment-related liabilities. Certain termination rights for both AMID Merger Sub and SHVEnergy including, but not limited to, the right to terminate the Purchase Agreement in the event that (i) the transaction has not been consummated on or beforeOctober 21, 2017 or (ii) under certain conditions, if there has been a breach of certain representations and warranties or a failure to perform any covenant by theother party.
Distribution
On July 25, 2017 , we announced that the Board of Directors of our General Partner declared a quarterly cash distribution of $0.4125 per common unit for thequarter ended June 30, 2017 , or $1.65 per common unit on an annualized basis. The distribution is expected to be paid on August 14, 2017 , to unitholders ofrecord as of the close of business on August 7, 2017 .
Acquisitions
38
Table of Contents
On August 8, 2017, we announced two strategic transactions which will help to increase operating efficiency in our core areas as well as extending ourparticipation in the value chain of our core commodities.
Acquisition of PantherWe acquired 100% of the assets of Panther Asset Management LLC (“Panther”), who is our joint venture partner in both Ampan and MPOG for a totalconsideration of approximately $52 million , consisting of $39 million cash from borrowings under the Partnership’s revolving credit facility and common unitsrepresenting limited partner interests. The underlying assets acquired are highly complementary with our core Gulf of Mexico assets as a substantial portion ofPanther’s cash flows are generated by our joint ventures. Through the purchase, we will now acquire Panther’s 33.3% equity interests in MPOG, as well asPanther’s 40% equity interest in AmPan. As such, we will now own 100% of MPOG and AmPan. This transaction allows us to both consolidate several jointventures and moves us into an operator position for oil pipelines in the Gulf of Mexico.
Joint Venture with Targa Midstream Services, LLCWe entered into a joint venture agreement with Targa Midstream Services, LLC (“Targa”) creating Cayenne Pipeline, LLC (“Cayenne”). Cayenne will transportY-grade NGLs from the Targa-operated Venice Energy Services Company, LLC gas processing plant (“Venice”) to Enterprise Products’ pipeline at Toca,Louisiana, for delivery to Enterprise Products’ Norco Fractionator. As part of the Cayenne joint venture, we are contributing an underutilized natural gas pipelinethat will convert into high value, natural gas liquids service. The project is supported by a 15-year dedication for all NGL production from Targa’s 750 MMcf/dVenice plant with inlet from six offshore pipelines in the Gulf of Mexico, including the prolific deep-water Mississippi Canyon area. The pipeline will have initialcapacity of over 40,000 barrels per day with the ability to throughput more than 50,000 barrels per day. We and Targa will each have 50% economic interests and50% voting rights, respectively, with Targa serving as the operator of the venture. The costs of conversion and associated construction will be shared equally by usand Targa.
The pipeline is expected to be operational by the end of the 4th quarter of 2017.
Item 2. Management’s Discussion and Analysis of Financial Condition and Results of Operations
The following management’s discussion and analysis of our financial condition and results of operations should be read in conjunction with the unauditedcondensed consolidated financial statements and the related notes thereto included elsewhere in this Quarterly Report on Form 10-Q (“Quarterly Report”) andthe audited consolidated financial statements and notes thereto and management’s discussion and analysis of financial condition and results of operations as ofand for the year ended December 31, 2016 included in our Annual Report on Form 10-K (“Annual Report”) that was filed with the Securities and ExchangeCommission (“SEC”) on March 28, 2017. This discussion contains forward-looking statements that reflect management’s current views with respect to futureevents and financial performance. Our actual results may differ materially from those anticipated in these forward-looking statements or as a result of certainfactors such as those set forth below under the caption “Cautionary Statement About Forward-Looking Statements.” In addition, please read the Annual Report onForm 10-K for the year ended December 31, 2016 filed by JP Energy Partners, LP, which is not a part of this Quarterly Report or our Annual Report. We acquiredJP Energy Partners, LP on March 8, 2017.
Forward-Looking Statements
Our reports, filings and other public announcements may from time to time contain statements that do not directly or exclusively relate to historical facts. Suchstatements are “forward-looking statements”. You can typically identify forward-looking statements by the use of forward-looking words, such as “may,” “could,”“project,” “believe,” “anticipate,” “expect,” “estimate,” “potential,” “plan,” “forecast,” and other similar words.
All statements that are not statements of historical facts, including statements regarding our future financial position, business strategy, budgets, projected costs andplans and objectives of management for future operations, are forward-looking statements.These forward-looking statements reflect our intentions, plans, expectations, assumptions and beliefs about future events and are subject to risks, uncertainties andother factors, many of which are outside our control. Important factors that could cause actual results to differ materially from the expectations expressed orimplied in the forward-looking statements include known and unknown risks. Examples of these risks and uncertainties, many of which are beyond our control,include, but are not limited to, the following:
• our ability to generate sufficient cash from operations to pay distributions to unitholders;• our ability to maintain compliance with financial covenants and ratios in our Credit Agreement (as defined below);
39
Table of Contents
• our ability to timely and successfully identify, consummate and integrate our current and future acquisitions and complete strategic dispositions, includingthe realization of all anticipated benefits of any such transaction, which otherwise could negatively impact our future financial performance;
• the timing and extent of changes in natural gas, crude oil, NGLs, refined products and other commodity prices, interest rates and demand for our services;• our ability to access capital to fund growth, including new and amended credit facilities and access to the debt and equity markets, which will depend on
general market conditions;• severe weather and other natural phenomena, including their potential impact on demand for the commodities we sell and the operation of company-owned
and third party-owned infrastructure;• the level of creditworthiness of counterparties to transactions;• the level and success of natural gas and crude oil drilling around our assets and our success in connecting natural gas and crude oil supplies to our gathering
and processing systems;• the volumes of natural gas and crude oil that we gather, process, transport and store, the throughput volume at our refined products terminals and our NGL
sales volumes;• the fees that we receive for the natural gas, crude oil, refined products and NGL volumes we handle;• our success in risk management activities, including the use of derivative financial instruments to hedge commodity and interest rate risks;• changes in laws and regulations, particularly with regard to taxes, safety, regulation of over-the-counter derivatives market and entities, and protection of
the environment;• our failure or our counterparties’ failure to perform on obligations under commodity derivative and financial derivative contracts;• the performance of certain of our current and future projects and unconsolidated affiliates that we do not control;• the demand for natural gas, crude oil, NGL and refined products by the petrochemical, refining or other industries;• our dependence on a relatively small number of customers for a significant portion of our gross margin;• general economic, market and business conditions, including industry changes and the impact of consolidations and changes in competition;• our ability to renew our gathering, processing, transportation and terminal contracts;• our ability to successfully balance our purchases and sales of natural gas;• leaks or releases of hydrocarbons into the environment that result in significant costs and liabilities;• the adequacy of insurance to cover our losses;• our ability to grow through contributions from affiliates, acquisitions or internal growth projects;• our management's history and experience with certain aspects of our business and our ability to hire as well as retain qualified personnel to execute our
business strategy;• the cost and effectiveness of our remediation efforts with respect to the material weakness discussed in "Part II. Item 9A. Controls and Procedures" of our
Annual Report;• volatility in the price of our common units;• security threats such as military campaigns, terrorist attacks, and cybersecurity breaches, against, or otherwise impacting, our facilities and systems; and• the amount of collateral required to be posted from time to time in our transactions.
Although we believe that the assumptions underlying our forward-looking statements are reasonable, any of the assumptions could be inaccurate, and, therefore,we cannot assure you that the forward-looking statements included in this Quarterly Report will prove to be accurate. Some of these and additional risks anduncertainties that could cause actual results to differ materially from such forward-looking statements are more fully described in Part II, Item 1A of this QuarterlyReport under the caption “Risk Factors”, Part I, Item 1A of our Annual Report under the caption “Risk Factors” and elsewhere in this Quarterly Report and ourAnnual Report. The forward-looking statements in this report speak as of the filing date of this report. Except as may be required by applicable securities laws, weundertake no obligation to publicly update or advise of any change in any forward-looking statement, whether as a result of new information, future events orotherwise.
Overview
We are a growth-oriented Delaware limited partnership that was formed in August 2009 to own, operate, develop and acquire a diversified portfolio of midstreamenergy assets. We provide critical midstream infrastructure that links producers of natural gas, crude oil, NGLs, condensate and specialty chemicals to numerousintermediate and end-use markets. Through our six financial reporting segments, (i) gas gathering and processing services, (ii) liquid pipelines and services, (iii)natural gas transportation services, (iv) offshore pipelines and services, (v) terminalling services, and (vi) propane marketing services, we engage in the business ofgathering, treating, processing, and transporting natural gas; gathering, transporting, storing, treating and fractionating
40
Table of Contents
NGLs; gathering, storing and transporting crude oil and condensates; storing specialty chemical products; and distributing and selling propane and refinedproducts.
Our primary assets are strategically located in some of the most prolific onshore and offshore producing regions and key demand markets in the United States. Ourgathering and processing assets are primarily located in (i) the Permian Basin of West Texas, (ii) the Cotton Valley/Haynesville Shale of East Texas, (iii) the EagleFord Shale of South Texas, and (iv) offshore in the Gulf of Mexico. Our liquid pipelines, natural gas transportation and offshore pipelines and terminal assets arelocated in prolific producing regions and key demand markets in Alabama, Louisiana, Mississippi, North Dakota, Texas, Tennessee and in the Port of New Orleansin Louisiana and the Port of Brunswick in Georgia. Additionally, our Propane Marketing Services assets are located in 46 states in the U.S. as well we operate afleet of NGL gathering and transportation trucks in the Eagle Ford shale and the Permian Basin. See Recent Developments regarding the announced sale of ourPropane Marketing Services business in July 2017.
We own or have ownership interests in more than 4,100 miles of onshore and offshore natural gas, crude oil, NGL and saltwater pipelines across 17 gatheringsystems, six interstate pipelines and nine intrastate pipelines; eight natural gas processing plants; four fractionation facilities; an offshore semisubmersible floatingproduction system with nameplate processing capacity of 80 MMBbl/d of crude oil and 200 MMcf/d of natural gas; six marine terminal sites with approximately6.7 MMBbls of above-ground aggregate storage capacity for petroleum products, distillates, chemicals and agricultural products; and 97 transportation trucks.
A portion of our cash flow is derived from our investments in unconsolidated affiliates, including a 49.7% operated interest in Destin, a natural gas pipeline; a20.1% non-operated interest in the Class A Units of Delta House, which is a floating production system platform and related pipeline infrastructure; a 16.7% non-operated interest in Tri-States, an NGL pipeline; a 66.7% operated interest in Okeanos, a natural gas pipeline; a 25.3% non-operated interest in Wilprise, a NGLpipeline; and a 66.7% non-operated interest in MPOG, a crude oil gathering and processing system.
Recent Developments
Our business objectives continue to focus on maintaining stable cash flows from our existing assets and executing on growth opportunities to increase our long-term cash flows. We believe the key elements to stable cash flows are the diversity of our asset portfolio and our fee-based business which represents a significantportion of our estimated margins, the objective of which is to protect against downside risk in our cash flows.
On July 14, 2017, we entered into Amendment No. 5 to our Fifth Amended and Restated Partnership Agreement (as amended, the “Partnership Agreement”). Itwas provided previously that if any of the Series D Units remain outstanding on June 30, 2017 (the “ Series D Determination Date”), we will issue the holder of theSeries D Units a warrant (the “Series D Warrant”) to purchase 700,000 common units representing limited partnership interests with an exercise price of $22.00 percommon unit. The Partnership Agreement has extended the Series D Determination Date to August 31, 2017.
On July 21, 2017, we entered into a Membership Interest Purchase Agreement with SHV Energy N.V., pursuant to which we agreed to sell 100% of our PropaneMarketing Services business, including Pinnacle Propane’s 40 service locations, Pinnacle Propane Express’ cylinder exchange business and related logistic assets,and the Alliant Gas utility system to SHV Energy N.V., for $170 million in cash, plus balance sheet cash at closing, less the repayment of all indebtedness andtransaction costs, and subject to working capital adjustments. The transaction is expected to close in the third quarter of 2017.
Financial Highlights
Financial highlights for the three months ended June 30, 2017 , include the following:
• Net loss attributable to the Partnership increased to $29.2 million , as compared to net loss of $10.4 million in the same period in 2016, primarily due toan increase in corporate expenses relating to transition costs and a significant increase in interest expenses associated with the JPE Acquisition (as definedbelow), partially offset by a large increase in earnings from unconsolidated affiliates;
• Earnings in unconsolidated affiliates were $17.6 million , an increase of $5.9 million as compared to the same period in 2016, primarily due to theadditional Delta House investments in the second quarter and in the fourth quarter of 2016 and us having a full quarter of earnings in 2017 relating to theEmerald Transactions;
• Segment gross margin amounted to $79.3 million , or a decrease of $1.8 million as compared to the same period in 2016, primarily due to higher segmentgross margin in our Offshore Pipelines and Services segment, offset by a large decrease in the segment gross margin of our Propane Marketing Servicessegment;
41
Table of Contents
• Adjusted EBITDA decreased to $44.5 million , or a decrease of 18.2% as compared to the same period in 2016, primarily due to a larger loss in 2017, andlower distributions from our unconsolidated affiliates in 2017; and
• We distributed $21.4 million to our common unitholders, or $0.4125 per common unit, the 24th consecutive distribution since our initial public offering.
Operational highlights for the three months ended June 30, 2017 , include the following:
• Contracted capacity for our Terminalling Services segment averaged 5,139,367 Bbls, representing a 2.4% increase compared to the same period in 2016 ;
• Average condensate production totaled 79.8 Mgal/d, representing a 4.5Mgal/d or 5% decrease compared to the same period in 2016 ;
• Average gross NGL production totaled 398.8 Mgal/d, representing a 135.5 Mgal/d or 51% increase compared to the same period in 2016 ;
• Throughput volumes attributable to the Natural Gas Transportation Services and Offshore Pipelines and Services segments totaled 729 MMcf/d,representing a 152 MMcf/d or 17% decrease compared to the same period in 2016 ;
• Throughput volumes attributable to the Liquid Pipelines and Services segment totaled 32,957 Bbls/d, representing a 1,867 Bbls/d or 6% increasecompared to the same period in 2016;
• NGL and refined product sales attributable to our Propane Marketing Services segment totaled 151.6 Mgal/d, representing a decrease of 12.7 Mgal/d or8% compared to the same period in 2016, mainly due to warmer than normal temperatures during the winter; and
• The percentage of gross margin generated from fee based, fixed margin, firm and interruptible transportation contracts and firm storage contracts(excluding propane) was 93.2% representing a decrease of 8.8% as compared to the same period in 2016.
JPE Acquisition
On March 8, 2017, we completed the acquisition of JP Energy Partners LP (“JPE”), an entity controlled by affiliates of ArcLight Capital Partners, LLC(“ArcLight”), in a unit-for-unit merger (the “JPE Acquisition”). In connection with the transaction, each JPE common or subordinated unit held by investors notaffiliated with ArcLight was converted into the right to receive 0.5775 of a Partnership common unit, and each JPE common or subordinated unit held by ArcLightaffiliates was converted into the right to receive 0.5225 of a Partnership common unit. We issued a total of 20.2 million of common units to complete theacquisition, including 9.8 million common units to ArcLight affiliates.
As both we and JPE were controlled by ArcLight affiliates, the acquisition represented a transaction among entities under common control. Although we are thelegal acquirer, JPE was considered the acquirer for accounting purposes as ArcLight obtained control of JPE prior to obtaining control of us on April 15, 2013. Asa result, we adjusted our historical financial statements to reflect ArcLight’s acquisition cost basis back to April 15, 2013. In addition, the accompanying financialstatements and related notes have been retrospectively adjusted to include the historical results of JPE prior to the effective date of the JPE acquisition. Theaccompanying financial statements and related notes present the combined financial position, results of operations, cash flows and equity of JPE at historical cost.
JPE owns, operates and develops a diversified portfolio of midstream energy assets with three business segments (i) crude oil pipelines and storage, (ii) refinedproducts terminals and storage, and (iii) NGL distribution and sales, which together provide midstream infrastructure solutions for the growing supply of crude oil,refined products and NGLs, in the United States.
Third Amendment to Partnership Agreement
On March 8, 2017, we also executed Amendment No. 3 to our Fifth Amended and Restated Partnership Agreement (as amended, the “Partnership Agreement”),which amends the distribution payment terms of our outstanding Series A Preferred Units to provide for the payment of a number of Series A payment-in-kind(“PIK”) preferred units for the quarter (the “Series A Preferred Quarterly Distribution”) in which the JPE Acquisition was consummated (which is the quarterended March 31, 2017) and each quarter
42
Table of Contents
thereafter equal to the quotient of (i) the greater of (a) $0.4125 and (b) the "Series A Distribution Amount", as such term is defined in the Partnership Agreement,divided by (ii) the “Series A Adjusted Issue Price,” as such term is defined in the Partnership Agreement. However, in our General Partner’s discretion, whichdetermination shall be made prior to the record date for the relevant quarter, the Series A Preferred Quarterly Distribution may be paid as a combination of (x) anamount in cash up to the greater of (1) $0.4125 and (2) the Series A Distribution Amount, and (y) a number of Series A Preferred Units equal to the quotient of(a) the remainder of (i) the greater of (I) $0.4125 and (II) the Series A Distribution Amount less (ii) the amount of cash paid pursuant to clause (x), divided by(b) the Series A Adjusted Issue Price. This calculation results in a reduced Series A Preferred Quarterly Distribution, which was previously calculated under thePartnership Agreement using $0.50 in place of $0.4125 in the preceding calculations.
Second Amended and Restated Credit Agreement
On March 8, 2017, we and American Midstream, LLC, along with other of our subsidiaries (collectively, the “Borrowers”) entered into a Second Amended andRestated Credit Agreement with Bank of America, N.A., as Administrative Agent, Collateral Agent and L/C Issuer, Wells Fargo Bank, National Association, asSyndication Agent, and other lenders (the “Second Amended Credit Agreement”). By entering into the Second Amended Credit Agreement, we amended ourexisting credit facility to increase our borrowing capacity thereunder from $750 million to $900 million and to provide for an accordion feature that will permit,subjectto the customary conditions, the borrowing capacity under the facility to be increased to a maximum of $1.1 billion. The $900 million in lending commitmentsunder the Second Amended Credit Agreement includes a $30 million sublimit for borrowings by the Blackwater Borrower and a $100 million sublimit for standbyletters of credit, which was increased in this Second Amended Credit Agreement from $50 million. The Second Amended Credit Agreement matures on September5, 2019. The Second Amended Credit Agreement facilitates the joinder to the credit facility of certain surviving entities from the JPE Acquisition (the "JPEEntities") and adjusts certain covenants, representations and warranties under the credit facility to support the JPE Entities. All obligations under the SecondAmended Credit Agreement and the guarantees of those obligations are secured, subject to certain exceptions, by a first-priority lien on and security interest insubstantially all of the Borrowers’ assets and the assets of all, subject to certain exceptions, existing and future subsidiaries and all of the capital stock of thePartnership’s existing and future subsidiaries.
When we use the term “revolving credit facility” or “Credit Agreement,” we are referring to our First Amended and Restated Credit Facility and to our SecondAmended and Restated Credit Facility, as the context may require.
8.50% Senior Unsecured Notes
On December 28, 2016, we and American Midstream Finance Corporation, our wholly owned subsidiary (together with the Partnership, the “Issuers”) completedthe issuance and sale of $300 million in aggregate principal amount of senior notes due 2021 (the "8.50% Senior Notes"). Wells Fargo Securities, LLC served asthe representative of the initial purchasers, which included Merrill Lynch, Pierce, Fenner & Smith Incorporated, RBC Capital Markets, LLC, Citigroup GlobalMarkets Inc., SunTrust Robinson Humphrey, Inc., Natixis Securities Americas LLC, ABN AMRO Securities (USA) LLC, Capital One Securities, Inc., DeutscheBank Securities Inc., BNP Paribas Securities Corp., BMO Capital Markets Corp., Santander Investment Securities Inc. and BBVA Securities Inc. The 8.50%Senior Notes rank equal in right of payment with all existing and future senior indebtedness of the Issuers, and senior in right of payment to any futuresubordinated indebtedness of the Issuers. The 8.50% Senior Notes were issued at par and provided net proceeds of approximately $294.0 million, after deductingthe initial purchasers' discount of $6.0 million. This amount was deposited into escrow pending completion of the JPE Acquisition and is included in Restrictedcash-long term on the Partnership's consolidated balance sheet as of December 31, 2016. The Partnership also incurred $2.7 million of direct issuance costsresulting in net proceeds related to the 8.50% Senior Notes of $291.3 million. The notes were offered and sold to qualified institutional buyers in the United Statespursuant to Rule 144A under the Securities Act, and to persons, other than U.S. persons, outside the United States pursuant to Regulation S under the SecuritiesAct.
Upon the closing of the JPE Acquisition and the satisfaction of other related conditions, the restricted cash was released from escrow on March 8, 2017. ThePartnership used the net proceeds to repay and terminate JPE's revolving credit facility and to reduce borrowings under the Credit Agreement.
Commodity Prices
Average daily prices for NYMEX West Texas Intermediate crude oil ranged from a high of $54.45 per barrel to a low of $42.53 per barrel from January 1, 2017through July 31, 2017 . Average daily prices for NYMEX Henry Hub natural gas ranged from a high of $3.71 per MMBtu to a low of $2.44 per MMBtu fromJanuary 1, 2017 through July 31, 2017 .
43
Table of Contents
Fluctuations in energy prices can greatly affect the development of new crude oil and natural gas reserves. Further declines in commodity prices of crude oil andnatural gas could have a negative impact on exploration, development and production activity, and, if sustained, could lead to a material decrease in such activity.Sustained reductions in exploration or production activity in our areas of operation would lead to continued or further reduced utilization of our assets. We areunable to predict future potential movements in the market price for natural gas, crude oil and NGLs and thus, cannot predict the ultimate impact of commodityprices on our operations. Should commodity prices continue to remain depressed as they were in 2015 and in 2016, this could lead to reduced profitability and mayimpact our liquidity and compliance with financial covenants and ratios under our Credit Agreement, which include a maximum total leverage ratio which ismeasured on a quarterly basis. Reduced profitability could adversely affect our operations, our ability to pay distributions to our unitholders, and may result infuture impairments of our long-lived assets, goodwill, and intangible assets.
Capital Markets
Volatility in the capital markets continues to impact our operations in multiple ways, including limiting our producers’ ability to finance their drilling andworkover programs and limiting our ability to fund drop downs, organic growth projects and acquisitions.
Our Operations
We manage our business and analyze and report our results of operations through six reportable segments:
• Gas Gathering and Processing Services . Our Gas Gathering and Processing Services segment provides “wellhead-to-market” services toproducers of natural gas and natural gas liquids, which include transporting raw natural gas from various receipt points through gatheringsystems, treating the raw natural gas, processing raw natural gas to separate the NGLs from the natural gas, fractionating NGLs, and selling ordelivering pipeline-quality natural gas and NGLs to various markets and pipeline systems.
• Liquid Pipelines and Services . Our Liquid Pipelines and Services segment provides transportation, purchase and sales of crude oil from variousreceipt points including lease automatic customer transfer (“LACT”) facilities and deliveries to various markets.
• Natural Gas Transportation Services . Our Natural Gas Transportation Services segment transports and delivers natural gas from producingwells, receipt points or pipeline interconnects for shippers and other customers, which include local distribution companies (“LDCs”), utilitiesand industrial, commercial and power generation customers.
• Offshore Pipelines and Services . Our Offshore Pipelines and Services segment gathers and transports natural gas and crude oil from variousreceipt points to other pipeline interconnects, onshore facilities and other delivery points.
• Terminalling Services . Our Terminalling Services segment provides above-ground leasable storage operations at our marine terminals thatsupport various commercial customers, including commodity brokers, refiners and chemical manufacturers to store a range of products and alsoincludes crude oil storage in Cushing, Oklahoma and refined products terminals in Texas and Arkansas.
• Propane Marketing Services . Our Propane Marketing Services segment gathers, transports and sells natural gas liquids (NGLs). This isaccomplished through cylinder tank exchange, sales through retail, commercial and wholesale distribution and through a fleet of trucks operatingin the Eagle Ford and Permian basin areas.
Gas Gathering and Processing Services Segment
Results of operations from the Gas Gathering and Processing Services segment are determined primarily by the volumes of natural gas we gather, process andfractionate, the commercial terms in our current contract portfolio and natural gas, crude oil, NGL and condensate prices. We gather and process natural gasprimarily pursuant to the following arrangements:
• Fee-Based Arrangements. Under these arrangements, we generally are paid a fixed fee for gathering, processing and transporting natural gas.
• Fixed-Margin Arrangements. Under these arrangements, we purchase natural gas and off-spec condensate from producers or suppliers atreceipt points on our systems at an index price less a fixed transportation fee and
44
Table of Contents
simultaneously sell an identical volume of natural gas or off-spec condensate at delivery points on our systems at the same, undiscounted indexprice. By entering into back-to-back purchases and sales of natural gas or off-spec condensate, we are able to lock in a fixed margin on thesetransactions. We view the segment gross margin earned under our fixed-margin arrangements to be economically equivalent to the fee earned inour fee-based arrangements.
• Percent-of-Proceeds Arrangements (“POP”). Under these arrangements, we generally gather raw natural gas from producers at the wellhead orother supply points, transport it through our gathering system, process it and sell the residue natural gas, NGLs and condensate at market prices.Where we provide processing services at the processing plants that we own, or obtain processing services for our own account in connectionwith our elective processing arrangements, we generally retain and sell a percentage of the residue natural gas and resulting NGLs. However, wealso have contracts under which we retain a percentage of the resulting NGLs and do not retain a percentage of residue natural gas. Our POParrangements also often contain a fee-based component.
Gross margin earned under fee-based and fixed-margin arrangements is directly related to the volume of natural gas that flows through our systems and is notdirectly dependent on commodity prices. However, a sustained decline in commodity prices could result in a decline in throughput volumes from producers and,thus, a decrease in our fee-based and fixed-margin gross margin. These arrangements provide stable cash flows, but upside in higher commodity-priceenvironments is limited to an increase in throughput volumes from producers. Under our typical POP arrangement, our gross margin is directly impacted by thecommodity prices we realize on our share of natural gas and NGLs received as compensation for processing raw natural gas. However, our POP arrangementsoften contain a fee-based component, which helps to mitigate the degree of commodity-price volatility we could experience under these arrangements. We furtherseek to mitigate our exposure to commodity price risk through our hedging program. See the information set forth in Part I, Item 3 of this Quarterly Report underthe caption “ — Quantitative and Qualitative Disclosures about Market Risk — Commodity Price Risk.”
Liquid Pipelines and Services Segment
Results of operations from the Liquid Pipelines and Services segment are determined by the volumes of crude oil transported on the interstate and intrastatepipelines we own. Tariffs associated with our Bakken system are regulated by FERC for volumes gathered via pipeline and trucked to the AMID Truck facility inWatford City, North Dakota. Volumes transported on our Silver Dollar system are underpinned by long-term, fee-based contracts. Our transportation arrangementsare further described below:
• Firm Transportation Arrangements. Our obligation to provide firm transportation service means that we are obligated to transport crude oilnominated by the shipper up to the maximum daily quantity specified in the contract. In exchange for that obligation on our part, the shipperpays a specified reservation charge, whether or not the shipper utilizes the capacity. In most cases, the shipper also pays a variable-use chargewith respect to quantities actually transported by us.
• Uncommitted Shipper Arrangements. Our obligation to provide interruptible transportation service means that we are only obligated totransport crude oil nominated by the shipper to the extent that we have available capacity. For this service the shipper pays no reservation chargebut pays a variable-use charge for quantities actually shipped.
• Fee-Based Arrangements. Under these arrangements our operations are underpinned by long-term, fee-based contracts with leading producersin the Midland Basin. Some of these contracts also have minimum volume commitments as well as some have acreage dedications.
• Buy-Sell Arrangements. We enter into outright purchase and sales contracts as well as buy/sell contracts with counterparties, under whichcontracts we gather and transport different types of crude oil and eventually sell the crude oil to either the same counterparty or differentcounterparties. We account for such revenue arrangements on a gross basis. Occasionally, we enter into crude oil inventory exchangearrangements with the same counterparty which the purchase and sale of inventory are considered in contemplation of each other. Revenuesfrom such inventory exchange arrangements are recorded on a net basis.
45
Table of Contents
Natural Gas Transportation Services Segment
Results of operations from the Natural Gas Transportation Services segment are determined by capacity reservation fees from firm and interruptible transportationcontracts and the volumes of natural gas transported on the interstate and intrastate pipelines we own pursuant to interruptible transportation or fixed-margincontracts. Our transportation arrangements are further described below:
• Firm Transportation Arrangements. Our obligation to provide firm transportation service means that we are obligated to transport natural gasnominated by the shipper up to the maximum daily quantity specified in the contract. In exchange for that obligation on our part, the shipperpays a specified reservation charge, whether or not the shipper utilizes the capacity. In most cases, the shipper also pays a variable-use chargewith respect to quantities actually transported by us.
• Interruptible Transportation Arrangements. Our obligation to provide interruptible transportation service means that we are only obligated totransport natural gas nominated by the shipper to the extent that we have available capacity. For this service the shipper pays no reservationcharge but pays a variable-use charge for quantities actually shipped.
• Fixed-Margin Arrangements. Under these arrangements, we purchase natural gas from producers or suppliers at receipt points on our systemsat an index price less a fixed transportation fee and simultaneously sell an identical volume of natural gas at delivery points on our systems at thesame undiscounted index price. We view fixed-margin arrangements to be economically equivalent to our interruptible transportationarrangements.
Offshore Pipelines and Services
Results of operations from the Offshore Pipelines and Services segment are determined by capacity reservation fees from firm and interruptible transportationcontracts and the volumes of natural gas transported on the interstate and intrastate pipelines we own pursuant to interruptible transportation or fixed-margincontracts. Our transportation arrangements are further described below:
• Firm Transportation Arrangements. Our obligation to provide firm transportation service means that we are obligated to transport natural gasnominated by the shipper up to the maximum daily quantity specified in the contract. In exchange for that obligation on our part, the shipperpays a specified reservation charge, whether or not the shipper utilizes the capacity. In most cases, the shipper also pays a variable-use chargewith respect to quantities actually transported by us.
• Interruptible Transportation Arrangements. Our obligation to provide interruptible transportation service means that we are only obligated totransport natural gas nominated by the shipper to the extent that we have available capacity. For this service the shipper pays no reservationcharge but pays a variable-use charge for quantities actually shipped.
• Fixed-Margin Arrangements. Under these arrangements, we purchase natural gas from producers or suppliers at receipt points on our systemsat an index price less a fixed transportation fee and simultaneously sell an identical volume of natural gas at delivery points on our systems at thesame undiscounted index price. We view fixed-margin arrangements to be economically equivalent to our interruptible transportationarrangements.
Terminalling Services Segment
Our Terminalling Services segment provides above-ground leasable storage services at our marine terminals that support various commercial customers, includingcommodity brokers, refiners and chemical manufacturers to store a range of products, including petroleum products, distillates, chemicals and agriculturalproducts. We generally receive fee-based compensation on guaranteed firm storage contracts, throughput fees charged to our customers when their products areeither received or disbursed and other fee-based charges associated with ancillary services provided to our customers, such as excess throughput, truck weighing,etc. Our firm storage contracts are typically multi-year contracts with renewal options. Our refined products terminals have butane blending capabilities.
46
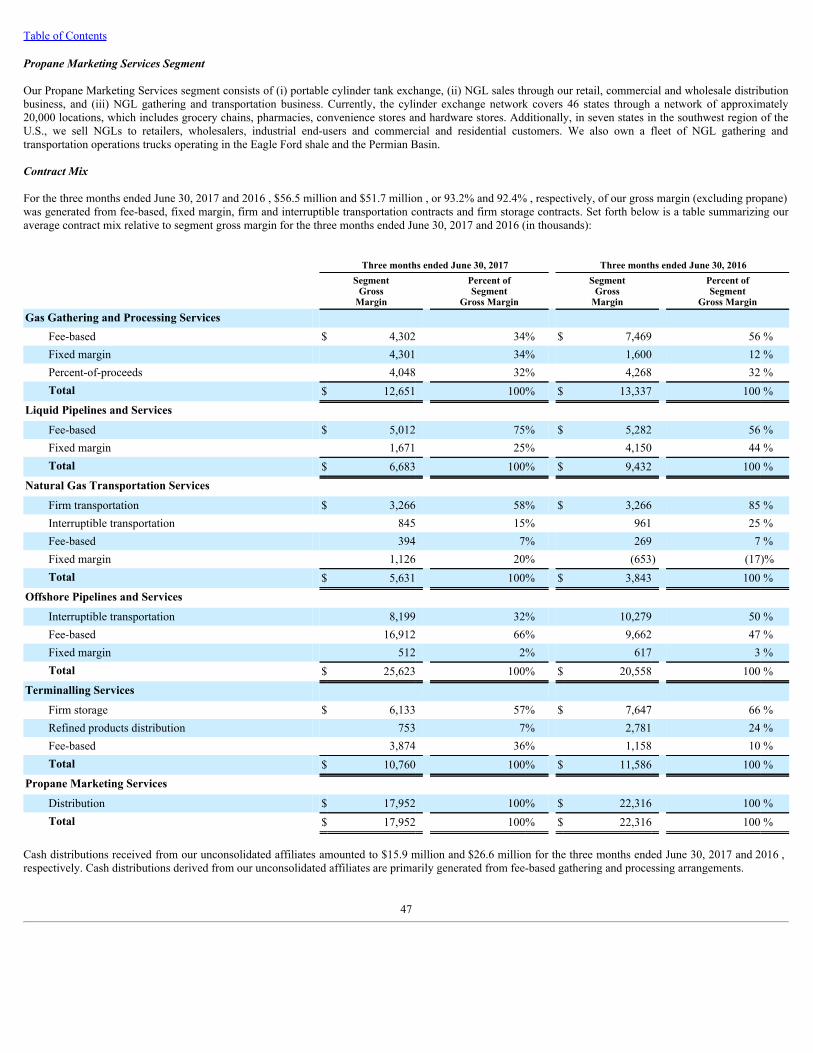
Table of Contents
Propane Marketing Services Segment
Our Propane Marketing Services segment consists of (i) portable cylinder tank exchange, (ii) NGL sales through our retail, commercial and wholesale distributionbusiness, and (iii) NGL gathering and transportation business. Currently, the cylinder exchange network covers 46 states through a network of approximately20,000 locations, which includes grocery chains, pharmacies, convenience stores and hardware stores. Additionally, in seven states in the southwest region of theU.S., we sell NGLs to retailers, wholesalers, industrial end-users and commercial and residential customers. We also own a fleet of NGL gathering andtransportation operations trucks operating in the Eagle Ford shale and the Permian Basin.
Contract Mix
For the three months ended June 30, 2017 and 2016 , $56.5 million and $51.7 million , or 93.2% and 92.4% , respectively, of our gross margin (excluding propane)was generated from fee-based, fixed margin, firm and interruptible transportation contracts and firm storage contracts. Set forth below is a table summarizing ouraverage contract mix relative to segment gross margin for the three months ended June 30, 2017 and 2016 (in thousands):
Three months ended June 30, 2017 Three months ended June 30, 2016
SegmentGross
Margin
Percent ofSegment
Gross Margin
SegmentGross
Margin
Percent ofSegment
Gross MarginGas Gathering and Processing Services
Fee-based $ 4,302 34% $ 7,469 56 %Fixed margin 4,301 34% 1,600 12 %Percent-of-proceeds 4,048 32% 4,268 32 %Total $ 12,651 100% $ 13,337 100 %
Liquid Pipelines and Services Fee-based $ 5,012 75% $ 5,282 56 %Fixed margin 1,671 25% 4,150 44 %Total $ 6,683 100% $ 9,432 100 %
Natural Gas Transportation Services Firm transportation $ 3,266 58% $ 3,266 85 %Interruptible transportation 845 15% 961 25 %Fee-based 394 7% 269 7 %Fixed margin 1,126 20% (653) (17)%Total $ 5,631 100% $ 3,843 100 %
Offshore Pipelines and Services Interruptible transportation 8,199 32% 10,279 50 %Fee-based 16,912 66% 9,662 47 %Fixed margin 512 2% 617 3 %Total $ 25,623 100% $ 20,558 100 %
Terminalling Services Firm storage $ 6,133 57% $ 7,647 66 %Refined products distribution 753 7% 2,781 24 %Fee-based 3,874 36% 1,158 10 %Total $ 10,760 100% $ 11,586 100 %
Propane Marketing Services Distribution $ 17,952 100% $ 22,316 100 %Total $ 17,952 100% $ 22,316 100 %
Cash distributions received from our unconsolidated affiliates amounted to $15.9 million and $26.6 million for the three months ended June 30, 2017 and 2016 ,respectively. Cash distributions derived from our unconsolidated affiliates are primarily generated from fee-based gathering and processing arrangements.
47
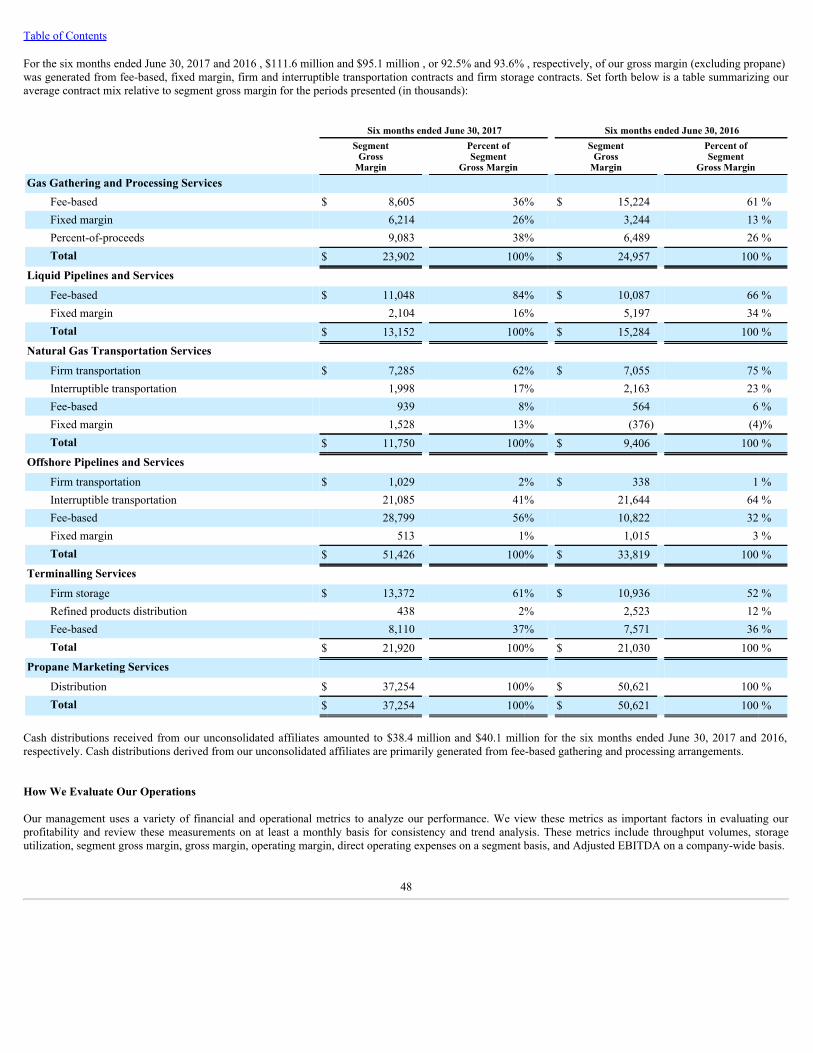
Table of Contents
For the six months ended June 30, 2017 and 2016 , $111.6 million and $95.1 million , or 92.5% and 93.6% , respectively, of our gross margin (excluding propane)was generated from fee-based, fixed margin, firm and interruptible transportation contracts and firm storage contracts. Set forth below is a table summarizing ouraverage contract mix relative to segment gross margin for the periods presented (in thousands):
Six months ended June 30, 2017 Six months ended June 30, 2016
SegmentGross
Margin
Percent ofSegment
Gross Margin
SegmentGross
Margin
Percent ofSegment
Gross MarginGas Gathering and Processing Services
Fee-based $ 8,605 36% $ 15,224 61 %Fixed margin 6,214 26% 3,244 13 %Percent-of-proceeds 9,083 38% 6,489 26 %Total $ 23,902 100% $ 24,957 100 %
Liquid Pipelines and Services Fee-based $ 11,048 84% $ 10,087 66 %Fixed margin 2,104 16% 5,197 34 %Total $ 13,152 100% $ 15,284 100 %
Natural Gas Transportation Services Firm transportation $ 7,285 62% $ 7,055 75 %Interruptible transportation 1,998 17% 2,163 23 %Fee-based 939 8% 564 6 %Fixed margin 1,528 13% (376) (4)%Total $ 11,750 100% $ 9,406 100 %
Offshore Pipelines and Services Firm transportation $ 1,029 2% $ 338 1 %Interruptible transportation 21,085 41% 21,644 64 %Fee-based 28,799 56% 10,822 32 %Fixed margin 513 1% 1,015 3 %Total $ 51,426 100% $ 33,819 100 %
Terminalling Services Firm storage $ 13,372 61% $ 10,936 52 %Refined products distribution 438 2% 2,523 12 %Fee-based 8,110 37% 7,571 36 %Total $ 21,920 100% $ 21,030 100 %
Propane Marketing Services Distribution $ 37,254 100% $ 50,621 100 %Total $ 37,254 100% $ 50,621 100 %
Cash distributions received from our unconsolidated affiliates amounted to $38.4 million and $40.1 million for the six months ended June 30, 2017 and 2016,respectively. Cash distributions derived from our unconsolidated affiliates are primarily generated from fee-based gathering and processing arrangements.
How We Evaluate Our Operations
Our management uses a variety of financial and operational metrics to analyze our performance. We view these metrics as important factors in evaluating ourprofitability and review these measurements on at least a monthly basis for consistency and trend analysis. These metrics include throughput volumes, storageutilization, segment gross margin, gross margin, operating margin, direct operating expenses on a segment basis, and Adjusted EBITDA on a company-wide basis.
48
Table of Contents
Throughput Volumes
In our Gas Gathering and Processing Services segment, we must continually obtain new supplies of natural gas, NGLs and condensate to maintain or increasethroughput volumes on our systems. Our ability to maintain or increase existing volumes of natural gas, NGLs and condensate is impacted by i) the level of work-overs or recompletions of existing connected wells and successful drilling activity of our significant producers in areas currently dedicated to or near our gatheringsystems, ii) our ability to compete for volumes from successful new wells in the areas in which we operate, iii) our ability to obtain natural gas, crude oil, NGLsand condensate that has been released from other commitments and iv) the volume of natural gas, NGLs and condensate that we purchase from connected systems.We actively monitor producer activity in the areas served by our gathering and processing systems to maintain current throughput volumes and pursue new supplyopportunities.
In our Liquid Pipelines and Services segment, the amount of revenue we generate from our crude oil pipelines business depends primarily on throughput volumes.We generate a portion of our crude oil pipeline revenues through long-term contracts containing acreage dedications or minimum volume commitments.Throughput volumes on our pipeline system are affected primarily by the supply of crude oil in the market served by our assets. The revenue generated from ourcrude oil supply and logistics business depends on the volume of crude oil we purchase from producers, aggregators and traders and then sell to producers, tradersand refiners as well as the volumes of crude oil that we gather and transport. The volume of our crude oil supply and logistics activities and the volumestransported by our crude oil gathering and transportation trucks are affected by the supply of crude oil in the markets served directly or indirectly by our assets.Accordingly, we actively monitor producer activity in the areas served by our crude oil supply and logistics business and other producing areas in the United Statesto compete for volumes from crude oil producers. Revenues in this business are also impacted by changes in the market price of commodities that we pass throughto our customers.
In our Natural Gas Transportation Services and Offshore Pipelines and Services segments, the majority of our segment gross margin is generated by firm capacityreservation charges and interruptible transportation services from throughput volumes on our interstate and intrastate pipelines. Substantially all of the segmentgross margin is generated under contracts with shippers, including producers, industrial companies, LDCs and marketers, for firm and interruptible natural gastransportation on our pipelines. We routinely monitor natural gas market activities in the areas served by our transmission systems to maintain current throughputvolumes and pursue new shipper opportunities.
In our Terminalling Services segment, we receive fee-based compensation on guaranteed firm storage contracts, throughput fees charged to our customers whentheir products are either received or disbursed, and other operational charges associated with ancillary services provided to our customers, such as excessthroughput, steam heating, and truck weighing at our marine terminals. The amount of revenue we generate from our refined products terminals depends primarilyon the volume of refined products that we handle. These volumes are affected primarily by the supply of and demand for refined products in the markets serveddirectly or indirectly by our refined products terminals. Our refined products terminals have butane blending capabilities. The volume of crude oil stored at ourcrude oil storage facility in Cushing, Oklahoma has no impact on the revenue generated by our crude oil storage business because we receive a fixed monthly feeper barrel of shell capacity that is not contingent on the usage of our storage tanks.
In our Propane Marketing Services segment the amount of revenue we generate depends on the gallons of NGLs we sell through our cylinder exchange and NGLsales businesses. In addition, our NGL transportation operations generate revenue based on the number of gallons of NGLs we gather and the distance we transportthose gallons for our customers. Revenues in this segment are also impacted by changes in the market price of commodities that we pass through to our customers.
Storage Utilization
Storage utilization is a metric that we use to evaluate the performance of our Terminalling Services segment. We define storage utilization as the percentage of thecontracted capacity in barrels compared to the design capacity of the tank.
Segment Gross Margin and Gross Margin
Segment gross margin and gross margin are metrics that we use to evaluate our performance.
We define segment gross margin in our Gas Gathering and Processing Services segment as total revenue plus unconsolidated affiliate earnings less unrealizedgains or plus unrealized losses on commodity derivatives, construction and operating management agreement income and the cost of natural gas, and NGLs andcondensate purchased.
49
Table of Contents
We define segment gross margin in our Liquid Pipelines and Services segment as total revenue plus unconsolidated affiliate earnings less unrealized gains or plusunrealized losses on commodity derivatives and the cost of crude oil purchased in connection with fixed-margin arrangements. Substantially all of our grossmargin in this segment is fee-based or fixed-margin, with little to no direct commodity price risk.
We define segment gross margin in our Natural Gas Transportation Services segment as total revenue plus unconsolidated affiliate earnings less the cost of naturalgas purchased in connection with fixed-margin arrangements. Substantially all of our gross margin in this segment is fee-based or fixed-margin, with little to nodirect commodity price risk.
We define segment gross margin in our Offshore Pipelines and Services segment as total revenue plus unconsolidated affiliate earnings less the cost of natural gaspurchased in connection with fixed-margin arrangements. Substantially all of our gross margin in this segment is fee-based or fixed-margin, with little to no directcommodity price risk.
We define segment gross margin in our Terminalling Services segment as total revenue less direct operating expense which includes direct labor, general materialsand supplies and direct overhead.
We define segment gross margin in our Propane Marketing Services segment as total revenue less purchases of natural gas, NGLs and condensate excluding non-cash charges such as non-cash unrealized gains or losses on commodity derivatives.
Gross margin is a supplemental non-GAAP financial measure that we use to evaluate our performance. We define gross margin as the sum of the segment grossmargins for our Gas Gathering and Processing Services, Liquid Pipelines and Services, Natural Gas Transportation Services, Offshore Pipelines and Services,Terminalling Services and Propane Marketing Services segments. The GAAP measure most directly comparable to gross margin is Net income (loss) attributableto the Partnership. For a reconciliation of gross margin to net income (loss), see “Non-GAAP Financial Measures” below.
Operating Margin
Operating margin is a supplemental non-GAAP financial metric that we use to evaluate our performance. We define operating margin as total segment grossmargin less other direct operating expenses. The GAAP measure most directly comparable to operating margin is net income (loss) attributable to the Partnership.For a reconciliation of Operating Margin to net income (loss), see “- Non-GAAP Financial Measures.”
Direct Operating Expenses
Our management seeks to maximize the profitability of our operations in part by minimizing direct operating expenses without sacrificing safety or theenvironment. Direct labor costs, insurance costs, ad valorem and property taxes, repair and non-capitalized maintenance costs, integrity management costs,utilities, lost and unaccounted for gas, and contract services comprise the most significant portion of our operating expenses. These expenses are relatively stableand largely independent of throughput volumes through our systems but may fluctuate depending on the activities performed during a specific period.
Adjusted EBITDA
Adjusted EBITDA is a supplemental non-GAAP financial measure used by our management and external users of our financial statements, such as investors,commercial banks, research analysts and others, to assess: the financial performance of our assets without regard to financing methods, capital structure orhistorical cost basis; the ability of our assets to generate cash flow to make cash distributions to our unitholders and our General Partner; our operating performanceand return on capital as compared to those of other companies in the midstream energy sector, without regard to financing or capital structure; and theattractiveness of capital projects and acquisitions and the overall rates of return on alternative investment opportunities.
We define Adjusted EBITDA as net income (loss) attributable to the Partnership, plus interest expense, income tax expense, depreciation, amortization andaccretion expense attributable to the Partnership, debt issuance costs paid during the period, distributions from investments in unconsolidated affiliates, transactionexpenses primarily associated with our JPE Acquisition, Delta House acquisition, certain non-cash charges such as non-cash equity compensation expense,unrealized (gains) losses on derivatives and selected charges that are unusual, less construction and operating management agreement income, other post-employment benefits plan net periodic benefit, earnings in unconsolidated affiliates, gains (losses) on the sale of assets, net, and selected gains that are unusual.The GAAP measure most directly comparable to our performance measure Adjusted EBITDA is net income (loss) attributable to the Partnership. For areconciliation of Adjusted EBITDA to net income (loss), see “Non-GAAP Financial Measures” below.
50
Table of Contents
Non-GAAP Financial Measures
Gross margin, segment gross margin, operating margin and Adjusted EBITDA are performance measures that are non-GAAP financial measures. Each hasimportant limitations as an analytical tool because they exclude some, but not all, items that affect the most directly comparable GAAP financial measures.Management compensates for the limitations of these non-GAAP measures as analytical tools by reviewing the comparable GAAP measures, understanding thedifferences between the measures and incorporating these data points into management’s decision-making process.
You should not consider gross margin, operating margin, or Adjusted EBITDA in isolation or as a substitute for, or more meaningful than analysis of, our results asreported under GAAP. Gross margin, operating margin and Adjusted EBITDA may be defined differently by other companies in our industry. Our definitions ofthese non-GAAP financial measures may not be comparable to similarly titled measures of other companies, thereby diminishing their utility.
The following tables reconcile the non-GAAP financial measures of segment gross margin, operating margin and Adjusted EBITDA used by management to Netloss attributable to the Partnership , their most directly comparable GAAP measure, for the three and six months ended June 30, 2017 and 2016 (in thousands):
Three months ended June 30, Six months ended June 30,
2017 2016 2017 2016Reconciliation of Segment Gross Margin to Net loss attributable to thePartnership: Gas Gathering and Processing Services segment gross margin $ 12,651 $ 13,337 $ 23,902 $ 24,957Liquid Pipelines and Services segment gross margin 6,683 9,432 13,152 15,284Natural Gas Transportation Services segment gross margin 5,631 3,843 11,750 9,406Offshore Pipelines and Services segment gross margin 25,623 20,558 51,426 33,819Terminalling Services segment gross margin (1) 10,760 11,586 21,920 21,030Propane Marketing Services segment gross margin 17,952 22,316 37,254 50,621Total Segment Gross Margin 79,300 81,072 159,404 155,117Less:
Other direct operating expenses (1) 28,886 29,579 55,902 57,545Plus:
Gain (loss) on commodity derivatives, net 207 (1,367) (50) (1,605)Less:
Corporate expenses 30,084 22,281 62,928 43,382Depreciation, amortization and accretion expense 30,170 26,398 59,521 51,439(Gain) loss on sale of assets, net 52 478 (176) 1,600Interest expense 17,152 10,610 35,118 18,912Other income (72) (496) (86) (527)Other (income) expense, net 136 (365) 806 (730)Income tax expense 801 701 1,924 1,436Loss from discontinued operations, net of tax — — — 539Net income attributable to noncontrolling interest 1,462 954 2,765 951
Net loss attributable to the Partnership $ (29,164) $ (10,435) $ (59,348) $ (21,035)_______________________(1) Other direct operating expenses include Gas Gathering and Processing Services segment direct operating expenses of $8.0 million and $8.9 million for the three
months ended June 30, 2017 and 2016, and $16.1 million and 17.5 million , for the six months ended June 30, 2017 and 2016, respectively, Liquid Pipelinesand Services segment direct operating expenses of $1.8 million and $2.2 million for the three months ended June 30, 2017 and 2016, and $3.9 million and $4.7million for the six months ended June 30, 2017 and 2016, respectively, Natural Gas Transportation Services segment direct operating expenses of $1.9 millionand $2.0 million for the three months ended June 30, 2017 and 2016, and $3.2 million and $3.2 million for the six months ended June 30, 2017 and 2016,respectively, Offshore Pipelines and Services segment direct operating expenses
51
Table of Contents
of $3.5 million and $2.8 million for the three months ended June 30, 2017 and 2016, and $6.1 million and $5.1 million for the six months ended June 30, 2017and 2016, respectively, and Propane Marketing Services segment direct operating expenses of $13.6 million and $13.6 million for the three months ended June30, 2017 and 2016, and $26.7 million and $27.1 million for the six months ended June 30, 2017 and 2016, respectively. Direct operating expenses related toour Terminalling Services segment of $3.0 million and $2.4 million for the three months ended June 30, 2017 and 2016 , respectively, as well as $6.1 millionand $5.0 million for the six months ended June 30, 2017 and 2016 are included within the calculation of Terminalling Services segment gross margin.
Three months ended June 30, Six months ended June 30,
2017 2016 2017 2016Reconciliation of Net loss attributable to the Partnership to AdjustedEBITDA:
Net loss attributable to the Partnership $ (29,164) $ (10,435) $ (59,348) $ (21,035)
Add: Depreciation, amortization and accretion expense 29,885 26,398 58,956 51,439Interest expense 13,900 9,800 28,835 17,400Debt issuance costs paid 714 1,152 2,116 1,475Unrealized loss on derivatives, net 1,748 3,488 3,021 4,870Non-cash equity compensation expense 1,195 1,408 5,233 3,051Transaction expenses 12,067 3,089 20,685 4,162Income tax expense 801 701 1,924 1,436Discontinued operations — (8) — 168Distributions from unconsolidated affiliates 15,900 26,562 38,394 40,077General Partner contribution for cost reimbursement 15,130 3,500 24,744 5,000
Deduct: Earnings in unconsolidated affiliates 17,552 11,702 32,954 19,045Other income (loss) 126 (24) 154 (47)OPEB plan net periodic benefit 10 (8) 10 (8)Gain (loss) on sale of assets, net (52) (478) 176 (1,600)
Adjusted EBITDA $ 44,540 $ 54,463 $ 91,266 $ 90,653
General Trends and Outlook
We expect our business to continue to be affected by the key trends discussed in Part II, Item 7 of our Annual Report under the caption “Management’s Discussionand Analysis of Financial Condition and Results of Operations — General Trends and Outlook.”
Results of Operations — Consolidated
Net loss attributable to the Partnership increased by $18.7 million for the three months ended June 30, 2017 , and increased by $38.2 million , for the six monthsended June 30, 2017 as compared to the same periods in 2016 .
For the three months ended June 30, 2017 , direct operating expenses decreased by $0.1 million primarily due to lower compressor rental costs. Corporate expensesincreased by $7.8 million , or 35.0% , due to an increase of $3.0 million of merger-related costs which include legal, consulting services and employee severancecosts; $3.0 million relating to a settlement of litigation claim; $1.1 million transition expenses related to affiliate assets; $0.8 million of share of legal costs relatedto right-of-way agreements; and $0.3 million due to increased office expense, partially offset by capitalized labor of $1.1 million associated with our capital projectto upgrade our accounting system and management fee income of $0.8 million. Interest expense increased by $6.5 million , or 61.7% , as a result of additionalborrowings to fund capital growth and acquisitions. Earnings from unconsolidated affiliates increased by $5.9 million , or 50.4% , as result of our investments inthe Emerald Transactions and the additional investments in Delta House occurring in Q2 and Q4 2016.
52
Table of Contents
For the six months ended June 30, 2017 , direct operating expenses decreased by $0.6 million primarily due to lower compressor rental costs. Corporate expensesincreased by $19.5 million , or 45.1% , due to an increase of $8.4 million of merger-related costs which include legal, consulting services and employee severancecosts; $3.0 million relating to a settlement of litigation claim; $2.3 million of transition expenses related to affiliate assets; $1.5 million of labor costs mainly due toincreased headcount and severance expense; $1.4 million of compensation relating to severance costs, $1.0 million of our share of legal costs related to right-of-way agreements; and higher contract labor costs and insurance premiums on offshore assets. Interest expense increased by $16.2 million , or 85.7% , as a result of$14.0 million increase of interest expense and additional borrowings to fund capital growth and acquisitions. Earnings from unconsolidated affiliates increased by$14.0 million , or 73.7% , as result of our investments in the Emerald Transactions and the additional investments in Delta House occurring in Q2 and Q4 2016.
Segment gross margin for the three months ended June 30, 2017 was $79.3 million and $159.4 million for the six months ended June 30, 2017 compared to $81.1million for the three months ended June 30, 2016 and $155.1 million for the six months ended June 30, 2016 . This decrease of $1.8 million for the three monthsended June 30, 2017 was primarily due to our Propane Marketing Services segment’s gross margin decrease of $ 4.3 million due to lower NGL sales as a result oflower oilfield services, expiration of short term marketing deals that expired in 2016 on crude oil supply logistics (“COSL”) for $2.7 million in our LiquidPipelines and Services segment, partially offset by an increase in our Offshore Pipelines and Services segment of $5.1 million as a result of higher earnings inunconsolidated affiliates. For the six months ended June 30, 2017 , the increase of $4.3 million was primarily due to higher segment gross margin in our OffshorePipelines and Services segment of $17.6 million as a result of increased earnings in unconsolidated affiliates and the American Panther system that was acquired inQ2 2016, and an increase in our Natural Gas Transportation Services segment of $2.3 million mostly due to higher throughput as a result of new firm transportationcontracts on our AlaTenn, MLGT, and Midla systems. These increases were partially offset by a decrease of $13.3 million related to our Propane MarketingServices segment primarily attributable to lower NGL sales as a result of the warmer winter temperatures and lower oilfield services.
For the three months ended June 30, 2017 , Adjusted EBITDA decreased $9.9 million , or 18.2% , compared to the same period in 2016 . The decrease is primarilyrelated to lower distributions from our unconsolidated affiliates of $10.7 million and a larger net loss for the quarter. For the six months ended June 30, 2017 ,Adjusted EBITDA increased $ 0.6 million, or 0.7% , compared to the same period in 2016 . The increase is primarily related to support from our General Partnerfor cost reimbursement and partially offset by higher earnings from our unconsolidated affiliates.
We distributed $21.4 million to holders of our common units, or $0.4125 per common unit, during the three months ended June 30, 2017 , and $46.3 million , or$0.8250 per common unit, during the six months ended June 30, 2017 .
53
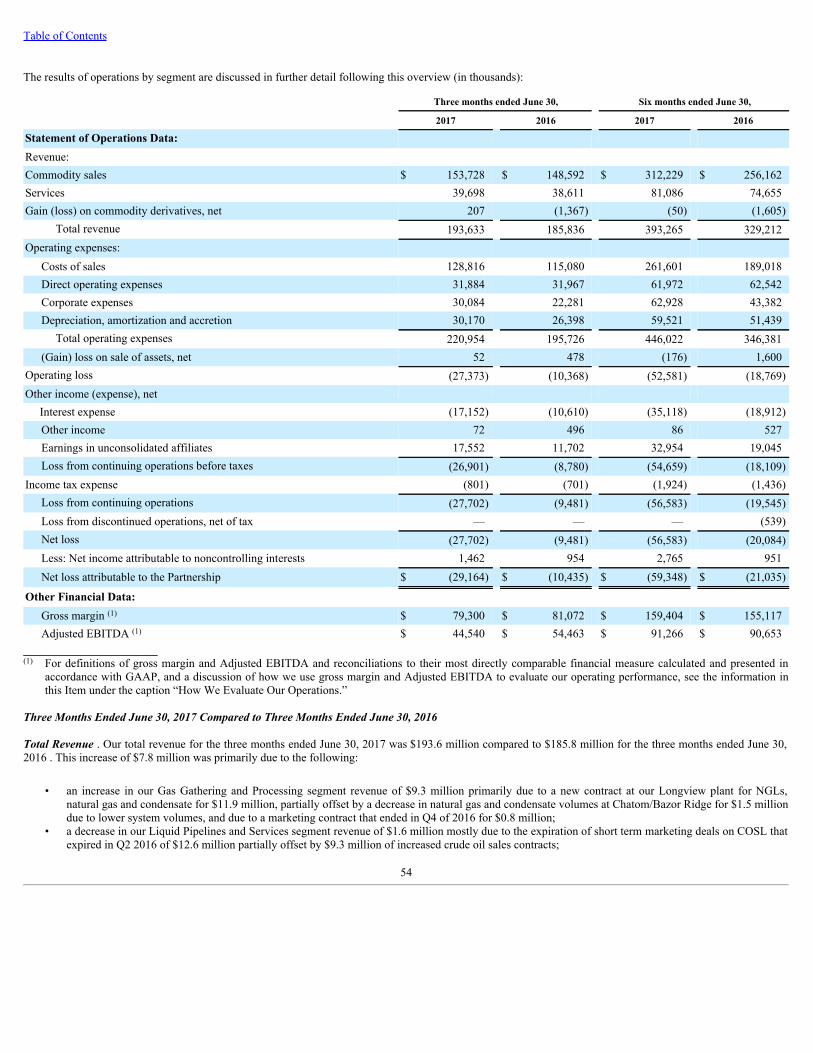
Table of Contents
The results of operations by segment are discussed in further detail following this overview (in thousands):
Three months ended June 30, Six months ended June 30,
2017 2016 2017 2016
Statement of Operations Data: Revenue: Commodity sales $ 153,728 $ 148,592 $ 312,229 $ 256,162Services 39,698 38,611 81,086 74,655Gain (loss) on commodity derivatives, net 207 (1,367) (50) (1,605)
Total revenue 193,633 185,836 393,265 329,212Operating expenses:
Costs of sales 128,816 115,080 261,601 189,018Direct operating expenses 31,884 31,967 61,972 62,542Corporate expenses 30,084 22,281 62,928 43,382Depreciation, amortization and accretion 30,170 26,398 59,521 51,439
Total operating expenses 220,954 195,726 446,022 346,381(Gain) loss on sale of assets, net 52 478 (176) 1,600
Operating loss (27,373) (10,368) (52,581) (18,769)Other income (expense), net Interest expense (17,152) (10,610) (35,118) (18,912)
Other income 72 496 86 527Earnings in unconsolidated affiliates 17,552 11,702 32,954 19,045Loss from continuing operations before taxes (26,901) (8,780) (54,659) (18,109)
Income tax expense (801) (701) (1,924) (1,436)Loss from continuing operations (27,702) (9,481) (56,583) (19,545)Loss from discontinued operations, net of tax — — — (539)Net loss (27,702) (9,481) (56,583) (20,084)Less: Net income attributable to noncontrolling interests 1,462 954 2,765 951Net loss attributable to the Partnership $ (29,164) $ (10,435) $ (59,348) $ (21,035)
Other Financial Data: Gross margin (1) $ 79,300 $ 81,072 $ 159,404 $ 155,117Adjusted EBITDA (1) $ 44,540 $ 54,463 $ 91,266 $ 90,653
_______________________(1) For definitions of gross margin and Adjusted EBITDA and reconciliations to their most directly comparable financial measure calculated and presented in
accordance with GAAP, and a discussion of how we use gross margin and Adjusted EBITDA to evaluate our operating performance, see the information inthis Item under the caption “How We Evaluate Our Operations.”
Three Months Ended June 30, 2017 Compared to Three Months Ended June 30, 2016
Total Revenue . Our total revenue for the three months ended June 30, 2017 was $193.6 million compared to $185.8 million for the three months ended June 30,2016 . This increase of $7.8 million was primarily due to the following:
• an increase in our Gas Gathering and Processing segment revenue of $9.3 million primarily due to a new contract at our Longview plant for NGLs,natural gas and condensate for $11.9 million, partially offset by a decrease in natural gas and condensate volumes at Chatom/Bazor Ridge for $1.5 milliondue to lower system volumes, and due to a marketing contract that ended in Q4 of 2016 for $0.8 million;
• a decrease in our Liquid Pipelines and Services segment revenue of $1.6 million mostly due to the expiration of short term marketing deals on COSL thatexpired in Q2 2016 of $12.6 million partially offset by $9.3 million of increased crude oil sales contracts;
54
Table of Contents
• an increase in our Natural Gas Transportation Services segment revenue of $3.5 million primarily due to an increase on the Magnolia system of $1.6million due to favorable pricing and additional revenues on our MLGT and Midla system for $1.2 million due to new firm transportation contracts;
• an increase in our Offshore Pipelines and Services segment revenue of $1.5 million due primarily to higher volumes and management fees from ouracquired American Panther system for $1.0 million;
• a decrease in our Terminalling Services segment revenue of $1.7 million mostly due to a decrease in sales of butane blending volumes due to timing of$2.6 million partially offset by a $0.7 million increase due to an expansion at our Harvey terminal; and
• a decrease in our Propane Marketing Services segment revenue of $2.7 million due to a reduction of NGL revenues due to lower propane sales resultingfrom lower volumes driven by continued overall warmer than normal temperatures during the winter and a decline in oilfield services.
Cost of Sales . Our purchases of natural gas, NGLs, condensate and crude for the three months ended June 30, 2017 was $128.8 million compared to $115.1million for the three months ended June 30, 2016 . This increase of $13.7 million was mostly due to higher NGL, natural gas and condensate purchases of $9.2million due to an increase in throughput at the Longview Plant, increase of $1.2 million due to additional throughput on the Gloria and Lafitte system and increasedpropane prices of $2.0 million compared to the same period last year.
Segment Gross Margin . Segment gross margin for the three months ended June 30, 2017 was $79.3 million compared to $81.1 million for the three months endedJune 30, 2016 . This decrease of $1.8 million was primarily due to our Propane Marketing Services segment of $4.4 million due to lower propane sales as a resultof a decline in oilfield services, expiration of short term deals that expired in Q2 2016 on COSL for $2.7 million partially offset by our Offshore Pipelines andServices segment of $5.1 million as a result of increased earnings in unconsolidated affiliates and the American Panther system that was acquired in Q2 2016.
Direct Operating Expenses . Direct operating expenses for the three months ended June 30, 2017 were $31.9 million compared to $32.0 million for the threemonths ended June 30, 2016 .
Corporate Expenses. Corporate expenses for the three months ended June 30, 2017 were $30.1 million compared to $22.3 million for the three months ended June30, 2016 . This increase of $7.8 million was primarily due to an increase of $3.0 million of merger related costs which include legal, consulting services andemployee severance costs; $3.0 million relating to the settlement of a litigation claim; $1.1 million transition expenses related to affiliate assets; $0.8 million ofshare of legal costs related to right-of-way agreements; and $0.3 million related to higher office expense, which was partially offset by capitalized labor of $1.1million and management fee income of $0.8 million.
Depreciation, Amortization and Accretion Expense . Depreciation, amortization and accretion expense for the three months ended June 30, 2017 was $30.2million compared to $26.4 million for the three months ended June 30, 2016 . This increase of $3.8 million was primarily due to the decrease in useful life ofcertain customer lists for $3.0 million and incremental depreciation of fixed assets acquired over the last 12 months.
Interest Expense . Interest expense for the three months ended June 30, 2017 was $17.2 million compared to $10.6 million for the three months ended June 30,2016 . The increase year over year of $6.5 million was primarily due to interest charges on the 8.5% and 3.77% Senior Notes which were issued in the second halfof 2016, and increased borrowings on our revolving credit facility to $678.0 million . This increase was partially offset by the write-off of remaining deferredfinancing fees associated with the JPE revolver in March 2017 due to the JPE revolver being paid off, which resulted in a reduced interest expense of $1.2 million. Earnings in Unconsolidated Affiliates. Earnings in unconsolidated affiliates for the three months ended June 30, 2017 was $17.6 million compared to $11.7million for the three months ended June 30, 2016 . This increase of $5.9 million was primarily due to incremental earnings of $4.2 million related to our investmentin Delta House and $1.6 million related to Destin and Okeanos, Emerald Transactions.
Six months ended June 30, 2017 Compared to Six months ended June 30, 2016
Total Revenue . Our total revenue for the six months ended June 30, 2017 was $393.3 million compared to $329.2 million for the six months ended June 30, 2016 .This increase of $64.1 million was primarily due to the following:
55
Table of Contents
• an increase in our Gas Gathering and Processing segment revenue of $20.5 million primarily due to increased revenue from sales of NGLs and condensateat the Longview Plant of $25.7 million due to three new contracts, two of which started in Q1 2017. This was partially offset by a decrease due tomarketing contracts that ended in Q4 of 2016 for $3.1 million and reduced NGL and condensate volumes at Chatom/Bazor Ridge for $1.1 million due tolower system volumes;
• an increase in our Liquid Pipelines and Services segment revenue of $34.4 million due to an increase in revenue of $20.2 million due to more favorablepricing for COSL, an increase of $14.0 million due to additional crude oil sales contracts, and an increase of $1.2 million due to new wells coming on lineon our Silver Dollar Pipeline;
• an increase in our Natural Gas Transportation Services segment revenue of $6.2 million primarily due to an increase on the Magnolia system of $3.5million due to favorable prices and additional revenues on our AlaTenn, MLGT, and Midla systems for $1.9 million due to new firm transportationcontracts;
• an increase in our Offshore Pipelines and Services segment revenue of $9.3 million due primarily to higher volumes and management fees from ouracquired American Panther system for $6.7 million, and increased volumes sold to the Alliance Refinery on our Gloria system for $3.1 million;
• an increase in our Terminalling Services segment revenue of $2.7 million mostly due to an expansion at our Harvey terminal for $2.1 million; and• a decrease in our Propane Marketing Services segment revenue of $10.6 million primarily due to a reduction in NGL revenues from lower propane sales
driven by a decline in volumes associated with oilfield services and continued overall warmer than normal temperatures during winter.
Cost of Sales . Our purchases of natural gas, NGLs, condensate and crude for the six months ended June 30, 2017 was $261.6 million compared to $189.0 millionfor the six months ended June 30, 2016 . This increase of $72.6 million was mostly due to higher NGL, natural gas and condensate purchases of $20.9 million dueto an increase in throughput at the Longview Plant, increased crude oil prices and volumes in our Liquid Pipelines and Services segment driven by the favorablemarket conditions resulting in increased producer activity for $38.8 million and higher propane prices in our Propane Marketing Services segment for $4.4 million.
Segment Gross Margin . Segment gross margin for the six months ended June 30, 2017 was $159.4 million compared to $155.1 million for the six months endedJune 30, 2016 . This increase of $4.3 million was primarily due to higher segment gross margin in our Offshore Pipelines and Services segment of $17.6 million asa result of increased earnings in unconsolidated affiliates and the American Panther system that was acquired in Q2 2016 and due to an increase in our Natural GasTransportation Services segment of $2.4 million mostly due to an increase in throughput as a result of new firm transportation contracts on our AlaTenn, MLGT,and Midla systems. These increases were partially offset by a decrease of $13.3 million related to our Propane Marketing Services segment primarily attributable tothe warmer winter temperatures and lower oilfield services.
Direct Operating Expenses . Direct operating expenses for the six months ended June 30, 2017 were $62.0 million compared to $62.5 million for the six monthsended June 30, 2016 . This decrease of $0.5 million was primarily due to decreased compressor rental expense of $0.7 million and other expenses.
Corporate Expenses. Corporate expenses for the six months ended June 30, 2017 were $62.9 million compared to $43.4 million for the six months ended June 30,2016 . This increase of $19.5 million was primarily due to an increase of $8.4 million of merger related costs which include legal, consulting services andemployee severance costs; $3.0 million relating to the settlement of a litigation claim; $2.3 million of transition expenses related to affiliate assets; $1.5 million oflabor costs mainly due to increased headcount and severance expense; $1.4 million of compensation relating to severance costs; $1.0 million of share of legal costsrelated to right-of-way agreements; $0.8 million in contract labor costs; $0.6 million higher insurance premiums on offshore assets; which was partially offset bycapitalized labor of $1.1 million.
Depreciation, Amortization and Accretion Expense . Depreciation, amortization and accretion expense for the six months ended June 30, 2017 was $59.5 millioncompared to $51.4 million for the six months ended June 30, 2016 . This increase of $8.1 million was primarily due to the decrease in useful life for certaincustomer lists for $5.3 million and incremental depreciation of fixed assets acquired in the last 12 months mainly related to our Midla project.
Interest Expense . Interest expense for the six months ended June 30, 2017 was $35.1 million compared to $18.9 million for the six months ended June 30, 2016 .This increase of $16.2 million was primarily due to interest on the 8.5% and 3.77% Senior Notes issued in the second half of 2016 increasing interest expense$14.0 million, increased borrowing on the Credit agreement $3.0 million and $1.3 million in associated financing costs, partially offset with the reduced interestexpense of $1.2 million related to the acceleration of deferred financing costs due to the settlement of the JPE debt in March 2017.
56
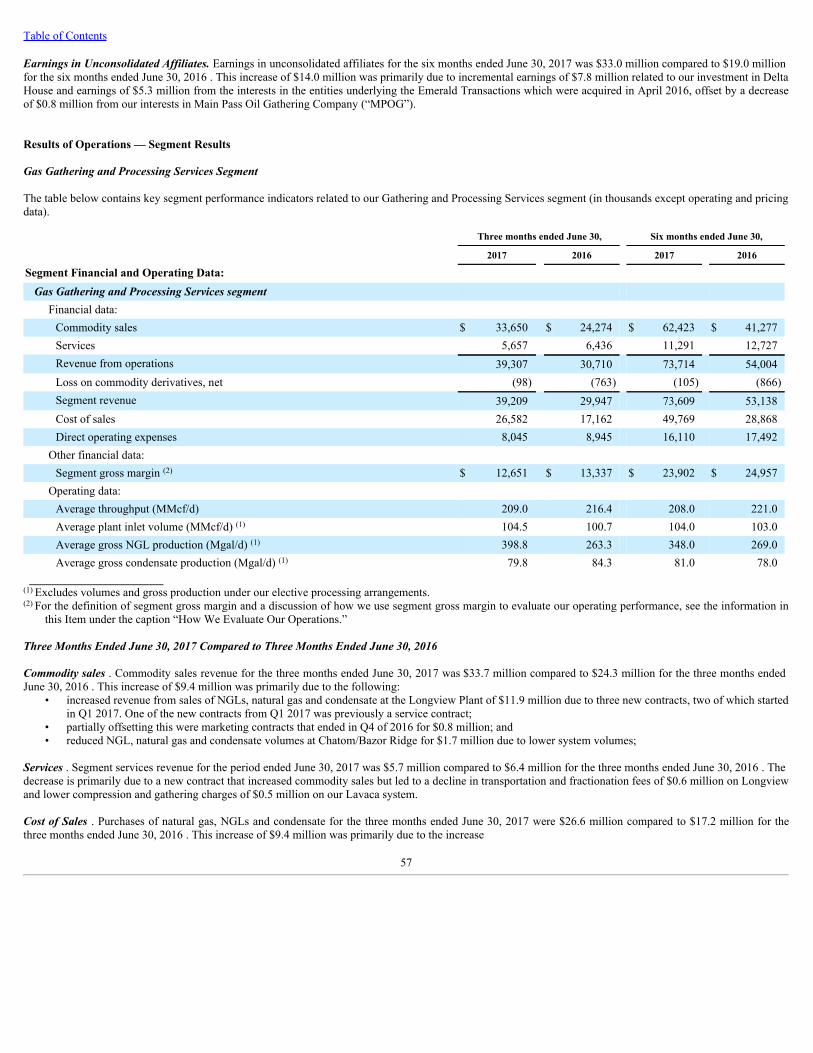
Table of Contents
Earnings in Unconsolidated Affiliates. Earnings in unconsolidated affiliates for the six months ended June 30, 2017 was $33.0 million compared to $19.0 millionfor the six months ended June 30, 2016 . This increase of $14.0 million was primarily due to incremental earnings of $7.8 million related to our investment in DeltaHouse and earnings of $5.3 million from the interests in the entities underlying the Emerald Transactions which were acquired in April 2016, offset by a decreaseof $0.8 million from our interests in Main Pass Oil Gathering Company (“MPOG”).
Results of Operations — Segment Results
Gas Gathering and Processing Services Segment
The table below contains key segment performance indicators related to our Gathering and Processing Services segment (in thousands except operating and pricingdata).
Three months ended June 30, Six months ended June 30,
2017 2016 2017 2016
Segment Financial and Operating Data: Gas Gathering and Processing Services segment
Financial data: Commodity sales $ 33,650 $ 24,274 $ 62,423 $ 41,277Services 5,657 6,436 11,291 12,727Revenue from operations 39,307 30,710 73,714 54,004Loss on commodity derivatives, net (98) (763) (105) (866)Segment revenue 39,209 29,947 73,609 53,138Cost of sales 26,582 17,162 49,769 28,868Direct operating expenses 8,045 8,945 16,110 17,492
Other financial data: Segment gross margin (2) $ 12,651 $ 13,337 $ 23,902 $ 24,957
Operating data: Average throughput (MMcf/d) 209.0 216.4 208.0 221.0Average plant inlet volume (MMcf/d) (1) 104.5 100.7 104.0 103.0Average gross NGL production (Mgal/d) (1) 398.8 263.3 348.0 269.0Average gross condensate production (Mgal/d) (1) 79.8 84.3 81.0 78.0
_______________________(1) Excludes volumes and gross production under our elective processing arrangements.(2) For the definition of segment gross margin and a discussion of how we use segment gross margin to evaluate our operating performance, see the information in
this Item under the caption “How We Evaluate Our Operations.”
Three Months Ended June 30, 2017 Compared to Three Months Ended June 30, 2016
Commodity sales . Commodity sales revenue for the three months ended June 30, 2017 was $33.7 million compared to $24.3 million for the three months endedJune 30, 2016 . This increase of $9.4 million was primarily due to the following:
• increased revenue from sales of NGLs, natural gas and condensate at the Longview Plant of $11.9 million due to three new contracts, two of which startedin Q1 2017. One of the new contracts from Q1 2017 was previously a service contract;
• partially offsetting this were marketing contracts that ended in Q4 of 2016 for $0.8 million; and• reduced NGL, natural gas and condensate volumes at Chatom/Bazor Ridge for $1.7 million due to lower system volumes;
Services . Segment services revenue for the period ended June 30, 2017 was $5.7 million compared to $6.4 million for the three months ended June 30, 2016 . Thedecrease is primarily due to a new contract that increased commodity sales but led to a decline in transportation and fractionation fees of $0.6 million on Longviewand lower compression and gathering charges of $0.5 million on our Lavaca system.
Cost of Sales . Purchases of natural gas, NGLs and condensate for the three months ended June 30, 2017 were $26.6 million compared to $17.2 million for thethree months ended June 30, 2016 . This increase of $9.4 million was primarily due to the increase
57
Table of Contents
of NGL, natural gas and condensate sales at the Longview Plant, as mentioned above. Additionally, there was also an increase in throughput on our rail andincreased freight charges due to new contracts.
Segment Gross Margin. Segment gross margin for the three months ended June 30, 2017 was $12.7 million compared to $13.3 million for the three months endedJune 30, 2016 for reasons discussed above.
Direct Operating Expenses. Direct operating expenses of $8.0 million for three months ended June 30, 2017 declined from $8.9 million for the three months endedJune 30, 2016 , mainly due to our ongoing cost savings initiatives reducing labor costs $0.5 million, $0.2 million of lower regulatory costs, $0.1 million due to thetiming of chemical purchases and costs related to measurement equipment, partially offset by increased contract services costs of $0.2 million.
Six months ended June 30, 2017 Compared to Six months ended June 30, 2016
Commodity sales . Commodity sales revenue for the six months ended June 30, 2017 was $62.4 million compared to $41.3 million for the six months ended June30, 2016 . This increase of $21.1 million was primarily due to the following:
• increased revenue from sales of NGLs and condensate at the Longview Plant of $25.7 million due to three new contracts, two of which started in Q12017. One of the new contracts from Q1 2017 had previously been a service contract;
• partially offsetting this was a decrease due to marketing contracts that ended in Q4 of 2016 for $3.1 million; and• reduced NGL and condensate volumes at Chatom/Bazor Ridge for $2.1 million due to lower system volumes.
Services . Segment services revenue for the six months ended June 30, 2017 was $11.3 million compared to $12.7 million for the six months ended June 30, 2016 .The decrease is primarily due to decline in compression and gathering charges by $1.5 million on our Lavaca system.
Cost of Sales . Purchases of natural gas, NGLs and condensate for the six months ended June 30, 2017 were $49.8 million compared to $28.9 million for the sixmonths ended June 30, 2016 . This increase of $20.9 million was primarily due to the increase of NGL, natural gas and condensate sales at the Longview Plant, asmentioned above. Additionally, there was also an decrease in throughput on our rail and increased freight charges due to new contracts.
Segment Gross Margin. Segment gross margin for the six months ended June 30, 2017 was $23.9 million compared to $25.0 million for the six months ended June30, 2016 as discussed above.
Direct Operating Expenses. Direct operating expenses of $16.1 million for six months ended June 30, 2017 declined from $17.5 million for the six months endedJune 30, 2016 , mainly due to our ongoing cost savings initiatives reducing compressor rentals and labor costs by $0.7 million and $0.6 million, respectively.Additionally we had $0.2 million lower regulatory costs, partially offset by higher contract services of $0.4 million.
58
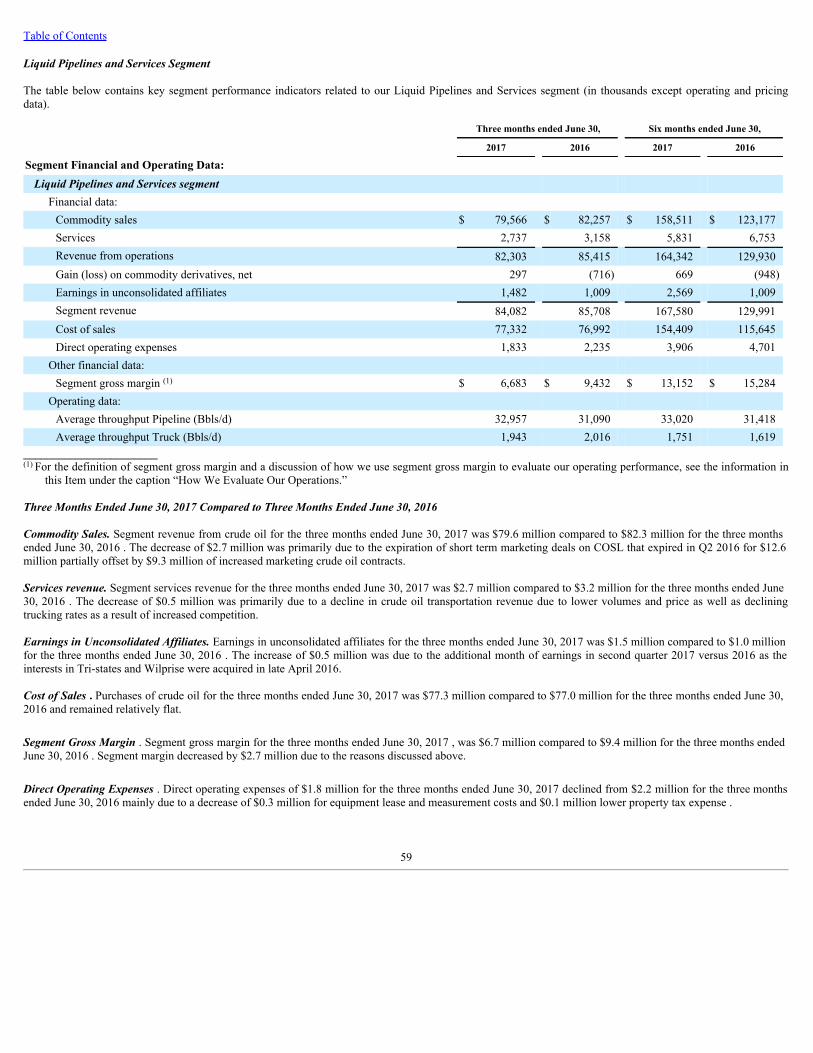
Table of Contents
Liquid Pipelines and Services Segment
The table below contains key segment performance indicators related to our Liquid Pipelines and Services segment (in thousands except operating and pricingdata).
Three months ended June 30, Six months ended June 30,
2017 2016 2017 2016
Segment Financial and Operating Data: Liquid Pipelines and Services segment
Financial data: Commodity sales $ 79,566 $ 82,257 $ 158,511 $ 123,177Services 2,737 3,158 5,831 6,753Revenue from operations 82,303 85,415 164,342 129,930Gain (loss) on commodity derivatives, net 297 (716) 669 (948)Earnings in unconsolidated affiliates 1,482 1,009 2,569 1,009Segment revenue 84,082 85,708 167,580 129,991Cost of sales 77,332 76,992 154,409 115,645Direct operating expenses 1,833 2,235 3,906 4,701
Other financial data: Segment gross margin (1) $ 6,683 $ 9,432 $ 13,152 $ 15,284
Operating data: Average throughput Pipeline (Bbls/d) 32,957 31,090 33,020 31,418Average throughput Truck (Bbls/d) 1,943 2,016 1,751 1,619
_______________________(1) For the definition of segment gross margin and a discussion of how we use segment gross margin to evaluate our operating performance, see the information in
this Item under the caption “How We Evaluate Our Operations.”
Three Months Ended June 30, 2017 Compared to Three Months Ended June 30, 2016
Commodity Sales. Segment revenue from crude oil for the three months ended June 30, 2017 was $79.6 million compared to $82.3 million for the three monthsended June 30, 2016 . The decrease of $2.7 million was primarily due to the expiration of short term marketing deals on COSL that expired in Q2 2016 for $12.6million partially offset by $9.3 million of increased marketing crude oil contracts.
Services revenue. Segment services revenue for the three months ended June 30, 2017 was $2.7 million compared to $3.2 million for the three months ended June30, 2016 . The decrease of $0.5 million was primarily due to a decline in crude oil transportation revenue due to lower volumes and price as well as decliningtrucking rates as a result of increased competition.
Earnings in Unconsolidated Affiliates. Earnings in unconsolidated affiliates for the three months ended June 30, 2017 was $1.5 million compared to $1.0 millionfor the three months ended June 30, 2016 . The increase of $0.5 million was due to the additional month of earnings in second quarter 2017 versus 2016 as theinterests in Tri-states and Wilprise were acquired in late April 2016.
Cost of Sales . Purchases of crude oil for the three months ended June 30, 2017 was $77.3 million compared to $77.0 million for the three months ended June 30,2016 and remained relatively flat.
Segment Gross Margin . Segment gross margin for the three months ended June 30, 2017 , was $6.7 million compared to $9.4 million for the three months endedJune 30, 2016 . Segment margin decreased by $2.7 million due to the reasons discussed above.
Direct Operating Expenses . Direct operating expenses of $1.8 million for the three months ended June 30, 2017 declined from $2.2 million for the three monthsended June 30, 2016 mainly due to a decrease of $0.3 million for equipment lease and measurement costs and $0.1 million lower property tax expense .
59
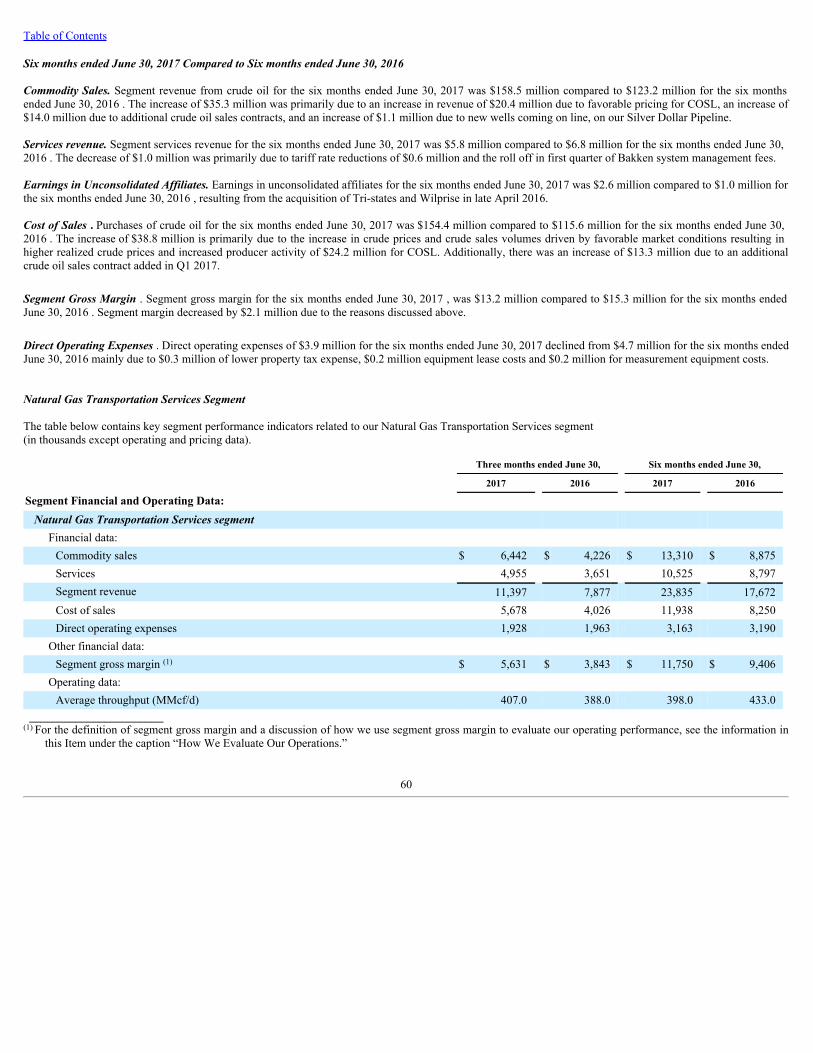
Table of Contents
Six months ended June 30, 2017 Compared to Six months ended June 30, 2016
Commodity Sales. Segment revenue from crude oil for the six months ended June 30, 2017 was $158.5 million compared to $123.2 million for the six monthsended June 30, 2016 . The increase of $35.3 million was primarily due to an increase in revenue of $20.4 million due to favorable pricing for COSL, an increase of$14.0 million due to additional crude oil sales contracts, and an increase of $1.1 million due to new wells coming on line, on our Silver Dollar Pipeline.
Services revenue. Segment services revenue for the six months ended June 30, 2017 was $5.8 million compared to $6.8 million for the six months ended June 30,2016 . The decrease of $1.0 million was primarily due to tariff rate reductions of $0.6 million and the roll off in first quarter of Bakken system management fees.
Earnings in Unconsolidated Affiliates. Earnings in unconsolidated affiliates for the six months ended June 30, 2017 was $2.6 million compared to $1.0 million forthe six months ended June 30, 2016 , resulting from the acquisition of Tri-states and Wilprise in late April 2016.
Cost of Sales . Purchases of crude oil for the six months ended June 30, 2017 was $154.4 million compared to $115.6 million for the six months ended June 30,2016 . The increase of $38.8 million is primarily due to the increase in crude prices and crude sales volumes driven by favorable market conditions resulting inhigher realized crude prices and increased producer activity of $24.2 million for COSL. Additionally, there was an increase of $13.3 million due to an additionalcrude oil sales contract added in Q1 2017.
Segment Gross Margin . Segment gross margin for the six months ended June 30, 2017 , was $13.2 million compared to $15.3 million for the six months endedJune 30, 2016 . Segment margin decreased by $2.1 million due to the reasons discussed above.
Direct Operating Expenses . Direct operating expenses of $3.9 million for the six months ended June 30, 2017 declined from $4.7 million for the six months endedJune 30, 2016 mainly due to $0.3 million of lower property tax expense, $0.2 million equipment lease costs and $0.2 million for measurement equipment costs.
Natural Gas Transportation Services Segment
The table below contains key segment performance indicators related to our Natural Gas Transportation Services segment(in thousands except operating and pricing data).
Three months ended June 30, Six months ended June 30,
2017 2016 2017 2016
Segment Financial and Operating Data: Natural Gas Transportation Services segment
Financial data: Commodity sales $ 6,442 $ 4,226 $ 13,310 $ 8,875Services 4,955 3,651 10,525 8,797Segment revenue 11,397 7,877 23,835 17,672Cost of sales 5,678 4,026 11,938 8,250Direct operating expenses 1,928 1,963 3,163 3,190
Other financial data: Segment gross margin (1) $ 5,631 $ 3,843 $ 11,750 $ 9,406
Operating data: Average throughput (MMcf/d) 407.0 388.0 398.0 433.0
_______________________(1) For the definition of segment gross margin and a discussion of how we use segment gross margin to evaluate our operating performance, see the information in
this Item under the caption “How We Evaluate Our Operations.”
60
Table of Contents
Three Months Ended June 30, 2017 Compared to Three Months Ended June 30, 2016
Commodity Sales . Segment sales of natural gas, NGLs and condensate for the three months ended June 30, 2017 were $6.4 million compared to $4.2 million forthe three months ended June 30, 2016 . The increase of $2.2 million is primarily due to an increase on the Magnolia system of $1.6 million as a result of favorableprices in Q2 2017 and marketing increases for $0.4 million.
Services revenue. Segment services revenue for the three months ended June 30, 2017 was $5.0 million compared to $3.7 million for the three months ended June30, 2016 . This increase of $1.3 million was mostly due to new firm transportation contracts on our MLGT system.
Cost of Sales . Purchases of natural gas, NGLs and condensate for the three months ended June 30, 2017 were $5.7 million as compared to $4.0 million for thethree months ended June 30, 2016 . This increase is primarily due to higher volumes and prices on Magnolia for $1.6 million.
Segment Gross Margin . Segment gross margin for the three months ended June 30, 2017 , was $5.6 million compared to $3.8 million for the three months endedJune 30, 2016 . This increase of $1.8 million was primarily due to reasons discussed above.
Direct Operating Expenses . Direct operating expenses remained flat at $1.9 million for the three months ended June 30, 2017 and 2016.
Six months ended June 30, 2017 Compared to Six months ended June 30, 2016
Commodity Sales . Segment sales of natural gas, NGLs and condensate for the six months ended June 30, 2017 were $13.3 million compared to $8.9 million forthe six months ended June 30, 2016 . The increase of $4.4 million is primarily due to an increase on the Magnolia system of $3.5 million as a result of favorableprices in 2017 and marketing increases for $1.0 million.
Services revenue. Segment services revenue for the six months ended June 30, 2017 was $10.5 million compared to $8.8 million for the six months ended June 30,2016 . This increase of $1.7 million was mostly due to new firm transportation contracts on our AlaTenn and MLGT systems.
Cost of Sales . Purchases of natural gas, NGLs and condensate for the six months ended June 30, 2017 were $11.9 million as compared to $8.3 million for the sixmonths ended June 30, 2016 This increase is primarily due to higher prices on Magnolia for $3.2 million and marketing activity of $0.6 million.
Segment Gross Margin . Segment gross margin for the six months ended June 30, 2017 , was $11.8 million compared to $9.4 million for the six months endedJune 30, 2016 . This increase of $2.4 million was primarily due to reasons discussed above.
Direct Operating Expenses . Direct operating expenses remained flat at $3.2 million for the six months ended June 30, 2017 and 2016. Offshore Pipelines and Services Segment
The table below contains key segment performance indicators related to our Offshore Pipelines and Services segment (in thousands except operating and pricingdata).
61
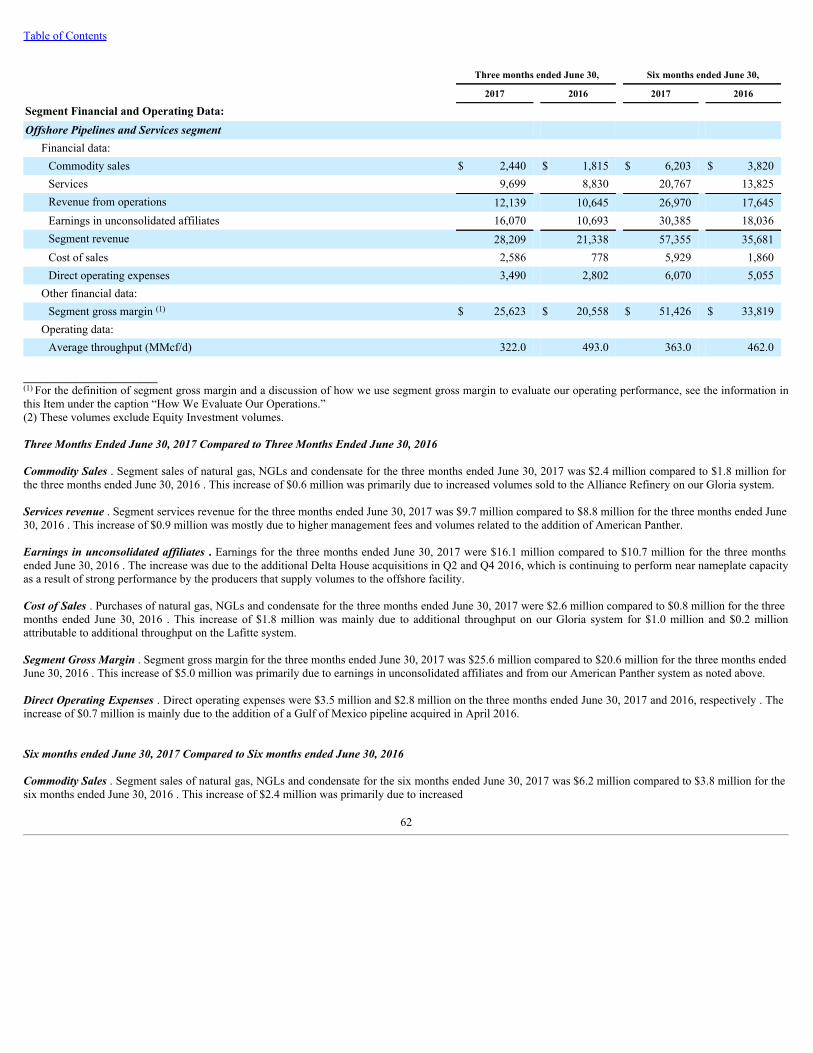
Table of Contents
Three months ended June 30, Six months ended June 30,
2017 2016 2017 2016
Segment Financial and Operating Data: Offshore Pipelines and Services segment
Financial data: Commodity sales $ 2,440 $ 1,815 $ 6,203 $ 3,820Services 9,699 8,830 20,767 13,825Revenue from operations 12,139 10,645 26,970 17,645Earnings in unconsolidated affiliates 16,070 10,693 30,385 18,036Segment revenue 28,209 21,338 57,355 35,681Cost of sales 2,586 778 5,929 1,860Direct operating expenses 3,490 2,802 6,070 5,055
Other financial data: Segment gross margin (1) $ 25,623 $ 20,558 $ 51,426 $ 33,819
Operating data: Average throughput (MMcf/d) 322.0 493.0 363.0 462.0
_______________________(1) For the definition of segment gross margin and a discussion of how we use segment gross margin to evaluate our operating performance, see the information inthis Item under the caption “How We Evaluate Our Operations.”(2) These volumes exclude Equity Investment volumes.
Three Months Ended June 30, 2017 Compared to Three Months Ended June 30, 2016
Commodity Sales . Segment sales of natural gas, NGLs and condensate for the three months ended June 30, 2017 was $2.4 million compared to $1.8 million forthe three months ended June 30, 2016 . This increase of $0.6 million was primarily due to increased volumes sold to the Alliance Refinery on our Gloria system.
Services revenue . Segment services revenue for the three months ended June 30, 2017 was $9.7 million compared to $8.8 million for the three months ended June30, 2016 . This increase of $0.9 million was mostly due to higher management fees and volumes related to the addition of American Panther.
Earnings in unconsolidated affiliates . Earnings for the three months ended June 30, 2017 were $16.1 million compared to $10.7 million for the three monthsended June 30, 2016 . The increase was due to the additional Delta House acquisitions in Q2 and Q4 2016, which is continuing to perform near nameplate capacityas a result of strong performance by the producers that supply volumes to the offshore facility.
Cost of Sales . Purchases of natural gas, NGLs and condensate for the three months ended June 30, 2017 were $2.6 million compared to $0.8 million for the threemonths ended June 30, 2016 . This increase of $1.8 million was mainly due to additional throughput on our Gloria system for $1.0 million and $0.2 millionattributable to additional throughput on the Lafitte system.
Segment Gross Margin . Segment gross margin for the three months ended June 30, 2017 was $25.6 million compared to $20.6 million for the three months endedJune 30, 2016 . This increase of $5.0 million was primarily due to earnings in unconsolidated affiliates and from our American Panther system as noted above.
Direct Operating Expenses . Direct operating expenses were $3.5 million and $2.8 million on the three months ended June 30, 2017 and 2016, respectively . Theincrease of $0.7 million is mainly due to the addition of a Gulf of Mexico pipeline acquired in April 2016.
Six months ended June 30, 2017 Compared to Six months ended June 30, 2016
Commodity Sales . Segment sales of natural gas, NGLs and condensate for the six months ended June 30, 2017 was $6.2 million compared to $3.8 million for thesix months ended June 30, 2016 . This increase of $2.4 million was primarily due to increased
62
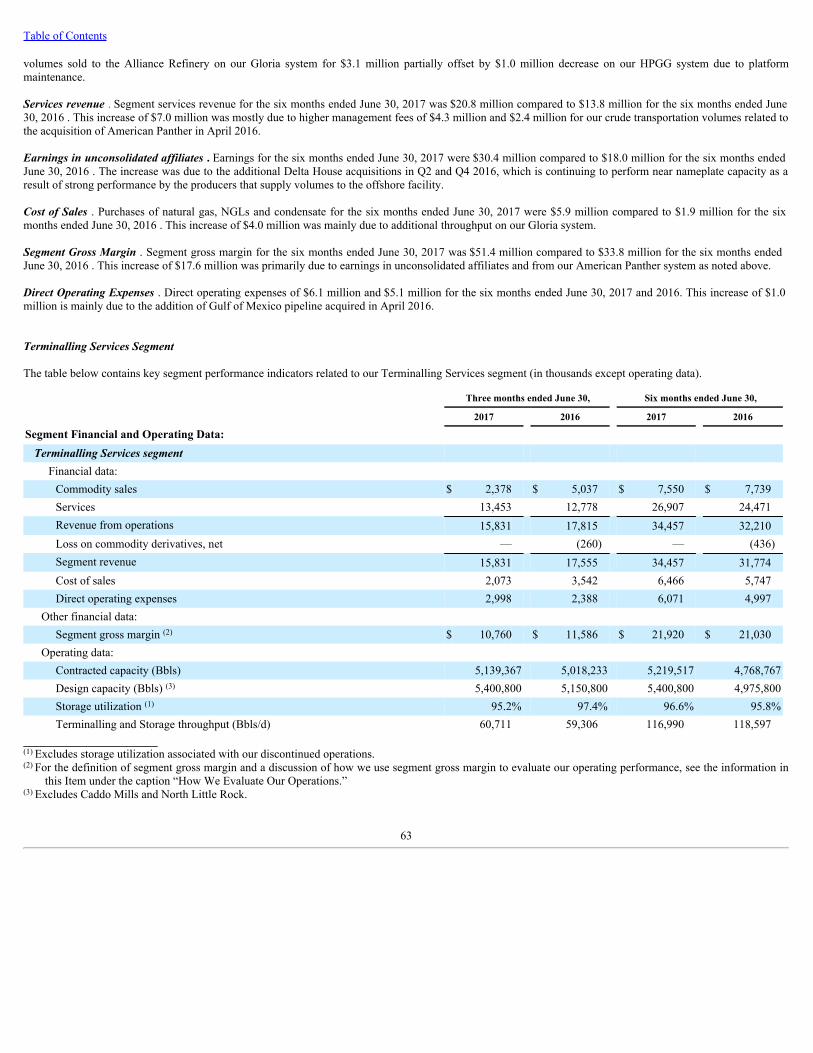
Table of Contents
volumes sold to the Alliance Refinery on our Gloria system for $3.1 million partially offset by $1.0 million decrease on our HPGG system due to platformmaintenance.
Services revenue . Segment services revenue for the six months ended June 30, 2017 was $20.8 million compared to $13.8 million for the six months ended June30, 2016 . This increase of $7.0 million was mostly due to higher management fees of $4.3 million and $2.4 million for our crude transportation volumes related tothe acquisition of American Panther in April 2016.
Earnings in unconsolidated affiliates . Earnings for the six months ended June 30, 2017 were $30.4 million compared to $18.0 million for the six months endedJune 30, 2016 . The increase was due to the additional Delta House acquisitions in Q2 and Q4 2016, which is continuing to perform near nameplate capacity as aresult of strong performance by the producers that supply volumes to the offshore facility.
Cost of Sales . Purchases of natural gas, NGLs and condensate for the six months ended June 30, 2017 were $5.9 million compared to $1.9 million for the sixmonths ended June 30, 2016 . This increase of $4.0 million was mainly due to additional throughput on our Gloria system.
Segment Gross Margin . Segment gross margin for the six months ended June 30, 2017 was $51.4 million compared to $33.8 million for the six months endedJune 30, 2016 . This increase of $17.6 million was primarily due to earnings in unconsolidated affiliates and from our American Panther system as noted above.
Direct Operating Expenses . Direct operating expenses of $6.1 million and $5.1 million for the six months ended June 30, 2017 and 2016. This increase of $1.0million is mainly due to the addition of Gulf of Mexico pipeline acquired in April 2016.
Terminalling Services Segment
The table below contains key segment performance indicators related to our Terminalling Services segment (in thousands except operating data).
Three months ended June 30, Six months ended June 30,
2017 2016 2017 2016
Segment Financial and Operating Data: Terminalling Services segment
Financial data: Commodity sales $ 2,378 $ 5,037 $ 7,550 $ 7,739Services 13,453 12,778 26,907 24,471Revenue from operations 15,831 17,815 34,457 32,210Loss on commodity derivatives, net — (260) — (436)Segment revenue 15,831 17,555 34,457 31,774Cost of sales 2,073 3,542 6,466 5,747Direct operating expenses 2,998 2,388 6,071 4,997
Other financial data: Segment gross margin (2) $ 10,760 $ 11,586 $ 21,920 $ 21,030
Operating data: Contracted capacity (Bbls) 5,139,367 5,018,233 5,219,517 4,768,767Design capacity (Bbls) (3) 5,400,800 5,150,800 5,400,800 4,975,800Storage utilization (1) 95.2% 97.4% 96.6% 95.8%Terminalling and Storage throughput (Bbls/d) 60,711 59,306 116,990 118,597
_______________________(1) Excludes storage utilization associated with our discontinued operations.(2) For the definition of segment gross margin and a discussion of how we use segment gross margin to evaluate our operating performance, see the information in
this Item under the caption “How We Evaluate Our Operations.”(3) Excludes Caddo Mills and North Little Rock.
63
Table of Contents
Three Months Ended June 30, 2017 Compared to Three Months Ended June 30, 2016
Commodity Sales. Segment commodity sales for the three months ended June 30, 2017 was $2.4 million compared to $5.0 million for the three months ended June30, 2016 . The decrease of $2.6 million relates to our refined products and is driven by the timing of our sale of butane blending volumes.
Services Revenue . Segment services revenue for the three months ended June 30, 2017 was $13.5 million compared to $12.8 million for the three months endedJune 30, 2016 . This increase is primarily driven by the increase in contracted capacity as a result of the expansion efforts at the Harvey terminal which started in2015.
Cost of Sales . Segment purchases of NGLs for the three months ended June 30, 2017 was $2.1 million compared to $3.5 million for the three months ended June30, 2016 . The decrease of $1.4 million is due to the decrease in sales of our butane blending volumes.
Segment Gross Margin . Segment gross margin for the three months ended June 30, 2017 was $10.8 million compared to $11.6 million for the three months endedJune 30, 2016 . The $0.8 million decrease in segment gross margin is mostly driven by the decrease in sale of butane blending volumes as noted above.
Direct Operating Expenses . Segment direct operating expense for the three months ended June 30, 2017 was $3.0 million compared to $2.4 million for the threemonths ended June 30, 2016 . This increase was mainly driven by higher operating costs related to our Harvey expansion.
Six months ended June 30, 2017 Compared to Six months ended June 30, 2016
Commodity Sales. Segment commodity sales for the six months ended June 30, 2017 was $7.5 million compared to $7.7 million for the six months ended June 30,2016 . The small decrease of $0.2 million relates to our refined products and is driven by a decrease in butane blending volumes.
Services Revenue . Segment services revenue for the six months ended June 30, 2017 was $26.9 million compared to $24.5 million for the six months ended June30, 2016 . The $2.4 million increase is primarily driven by a $2.1 million increase in contracted capacity and related ancillary services as a result of the expansionefforts at the Harvey terminal.
Cost of Sales . Segment purchases of NGLs for the six months ended June 30, 2017 was $6.5 million compared to $5.7 million for the six months ended June 30,2016 . The increase of $0.8 million is primarily due to the higher butane costs related to volumes sold.
Segment Gross Margin . Segment gross margin for the six months ended June 30, 2017 was $21.9 million compared to $21.0 million for the six months endedJune 30, 2016 . The $0.9 million increase in segment gross margin is mostly driven by the Harvey storage expansion as noted above.
Direct Operating Expenses . Segment direct operating expense for the six months ended June 30, 2017 was $6.1 million compared to $5.0 million for the sixmonths ended June 30, 2016 . This increase was mainly driven by higher operating costs related to our Harvey expansion.
Propane Marketing Services Segment
The table below contains key segment performance indicators related to our Propane Marketing Services segment (in thousands except operating data).
64
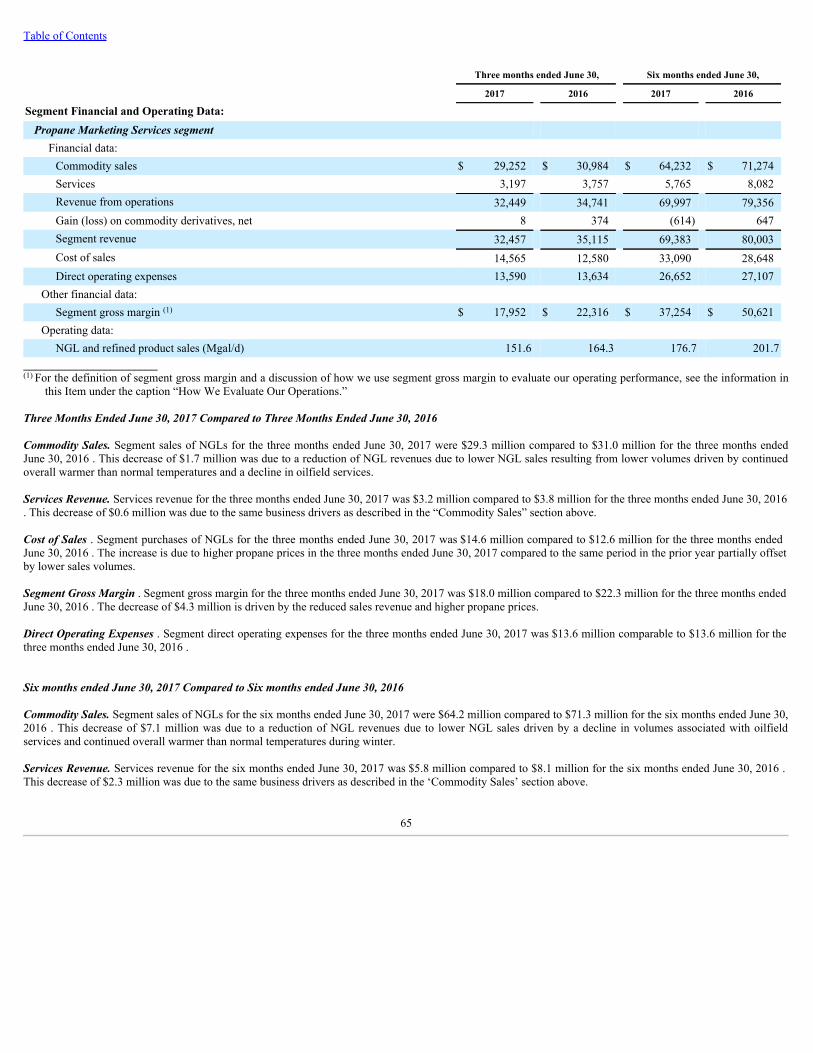
Table of Contents
Three months ended June 30, Six months ended June 30,
2017 2016 2017 2016
Segment Financial and Operating Data: Propane Marketing Services segment
Financial data: Commodity sales $ 29,252 $ 30,984 $ 64,232 $ 71,274Services 3,197 3,757 5,765 8,082Revenue from operations 32,449 34,741 69,997 79,356Gain (loss) on commodity derivatives, net 8 374 (614) 647Segment revenue 32,457 35,115 69,383 80,003Cost of sales 14,565 12,580 33,090 28,648Direct operating expenses 13,590 13,634 26,652 27,107
Other financial data: Segment gross margin (1) $ 17,952 $ 22,316 $ 37,254 $ 50,621
Operating data: NGL and refined product sales (Mgal/d) 151.6 164.3 176.7 201.7
_______________________(1) For the definition of segment gross margin and a discussion of how we use segment gross margin to evaluate our operating performance, see the information in
this Item under the caption “How We Evaluate Our Operations.”
Three Months Ended June 30, 2017 Compared to Three Months Ended June 30, 2016
Commodity Sales. Segment sales of NGLs for the three months ended June 30, 2017 were $29.3 million compared to $31.0 million for the three months endedJune 30, 2016 . This decrease of $1.7 million was due to a reduction of NGL revenues due to lower NGL sales resulting from lower volumes driven by continuedoverall warmer than normal temperatures and a decline in oilfield services.
Services Revenue. Services revenue for the three months ended June 30, 2017 was $3.2 million compared to $3.8 million for the three months ended June 30, 2016. This decrease of $0.6 million was due to the same business drivers as described in the “Commodity Sales” section above.
Cost of Sales . Segment purchases of NGLs for the three months ended June 30, 2017 was $14.6 million compared to $12.6 million for the three months endedJune 30, 2016 . The increase is due to higher propane prices in the three months ended June 30, 2017 compared to the same period in the prior year partially offsetby lower sales volumes.
Segment Gross Margin . Segment gross margin for the three months ended June 30, 2017 was $18.0 million compared to $22.3 million for the three months endedJune 30, 2016 . The decrease of $4.3 million is driven by the reduced sales revenue and higher propane prices.
Direct Operating Expenses . Segment direct operating expenses for the three months ended June 30, 2017 was $13.6 million comparable to $13.6 million for thethree months ended June 30, 2016 .
Six months ended June 30, 2017 Compared to Six months ended June 30, 2016
Commodity Sales. Segment sales of NGLs for the six months ended June 30, 2017 were $64.2 million compared to $71.3 million for the six months ended June 30,2016 . This decrease of $7.1 million was due to a reduction of NGL revenues due to lower NGL sales driven by a decline in volumes associated with oilfieldservices and continued overall warmer than normal temperatures during winter.
Services Revenue. Services revenue for the six months ended June 30, 2017 was $5.8 million compared to $8.1 million for the six months ended June 30, 2016 .This decrease of $2.3 million was due to the same business drivers as described in the ‘Commodity Sales’ section above.
65
Table of Contents
Cost of Sales . Segment purchases of NGLs for the six months ended June 30, 2017 was $33.1 million compared to $28.6 million for the six months ended June 30,2016 . The increase is due to higher propane prices in the six months ended June 30, 2017 compared to the same period in the prior year offset by lower salesvolumes.
Segment Gross Margin . Segment gross margin for the six months ended June 30, 2017 was $37.3 million compared to $50.6 million for the six months endedJune 30, 2016 . The decrease of $13.3 million is driven by the reduced sales revenue and higher propane prices.
Direct Operating Expenses . Segment direct operating expenses for the six months ended June 30, 2017 was $26.7 million compared to $27.1 million for the sixmonths ended June 30, 2016 . The decrease is driven by lower distribution costs as a result of lower volumes as well as improved fleet efficiencies.
Liquidity and Capital Resources
Our business is capital intensive and requires significant investment for the maintenance of existing assets and the acquisition and development of new systems andfacilities.
Our principal sources of liquidity include cash from operating activities, borrowings under our Credit Agreement (as defined herein), or through privatetransactions. In addition, we may seek to raise capital through the issuance of secured and unsecured senior notes. Given our historical success in accessing varioussources of liquidity, we believe that the sources of liquidity described above will be sufficient to meet our short-term working capital requirements, medium-termmaintenance capital expenditure requirements, and quarterly cash distributions for at least the next four quarters. In the event these sources are not sufficient, wewould pursue other sources of cash funding, including, but not limited to, additional forms of debt or equity financing. In addition, we would reduce non-essentialcapital expenditures, direct operating expenses and corporate expenses, as necessary, and our Partnership Agreement allows us to reduce or eliminate quarterlydistributions, if required to maintain ongoing operations. We plan to finance our growth capex mainly through additional forms of debt or equity financing, as wellas sale of non-core assets.
Changes in natural gas, crude oil, NGL and condensate prices and the terms of our contracts may have a direct impact on our generation and use of cash fromoperations due to their impact on net income (loss), along with the resulting changes in working capital. In the past, we mitigated a portion of our anticipatedcommodity price risk associated with the volumes from our gathering and processing activities with fixed price commodity swaps. For additional informationregarding our derivative activities, see the information provided under Part II, Item 7A of our Annual Report under the caption, “Quantitative and QualitativeDisclosures about Market Risk” and Part I, Item 3 of this Quarterly Report under the caption “Quantitative and Qualitative Disclosures about Market Risk”.
The counterparties to certain of our commodity swap contracts are investment-grade rated financial institutions. Under these contracts, we may be required toprovide collateral to the counterparties in the event that our potential payment exposure exceeds a predetermined collateral threshold. Collateral thresholds are setby us and each counterparty, as applicable, in the master contract that governs our financial transactions based on our and the counterparty’s assessment ofcreditworthiness. The assessment of our position with respect to the collateral thresholds is determined on a counterparty by counterparty basis, and is impacted bythe representative forward price curves and notional quantities under our swap contracts. Due to the interrelation between the representative natural gas and crudeoil forward price curves, it is not practical to determine a single pricing point at which our swap contracts will meet the collateral thresholds as we may transactmultiple commodities with the same counterparty. Depending on daily commodity prices, the amount of collateral posted can go up or down on a daily basis. As ofJune 30, 2017 , we have not been required to post collateral with our counterparties.
At-The-Market (“ATM”) Offering
On October 18, 2015, we filed a prospectus supplement related to the offer and sale from time to time of common units in an at-the-market offering. For the quarterended June 30, 2017 , we did not sell any common units under our ATM program and have approximately $96.8 million remaining available for sale under thePartnership’s ATM Equity Offering Sales Agreement.
Our Revolving Credit Facility
On March 8, 2017, we entered into the Second Amended and Restated Credit Agreement, with Bank of America N.A., as Administrative Agent, Collateral Agentand L/C Issuer, Wells Fargo Bank, National Association, as Syndication Agent, and other lenders or Credit Agreement, which increased our borrowing capacityfrom $750.0 million to $900.0 million and provided for an accordion feature that will permit, subject to customary conditions, the borrowing capacity under thefacility to be increased to a
66
Table of Contents
maximum of $1.1 billion. The $900 million in lending commitments under the Credit Agreement includes a $30 million sublimit for borrowings by the BlackwaterBorrower and a $100 million sublimit for standby letters of credit, which was increased in the Credit Agreement from $50 million. We can elect to have loansunder our Credit Agreement bear interest either at a Eurodollar-based rate, plus a margin ranging from 2.00% to 3.25% depending on our total leverage ratio thenin effect, or a base rate which is a fluctuating rate per annum equal to the highest of (i) the Federal Funds Rate, plus 0.50% , (ii) the rate of interest in effect forsuch day as publicly announced from time to time by Bank of America as its “prime rate”, or (iii) the Eurodollar Rate plus 1.00% , plus a margin ranging from1.00% to 2.25% depending on the total leverage ratio then in effect. We also pay a commitment fee of 0.50% per annum on the undrawn portion of the revolvingloan under the Credit Agreement.
Our obligations under the Credit Agreement and the guarantees of those obligations are secured, subject to certain exceptionsby a first-priority lien on and security interest in substantially all of our assets and the assets of all, subject to certain exceptions, existing and future subsidiariesand all of the capital stock of our existing and future subsidiaries. Advances made under the Credit Agreement are guaranteed on a senior unsecured basis bycertain of our subsidiaries (the “Guarantors”). These guarantees are full and unconditional and joint and several among the Guarantors. The terms of the CreditAgreement include covenants that restrict our ability to make cash distributions and acquisitions in some circumstances. The remaining principal balance of loansand any accrued and unpaid interest will be due and payable in full on the maturity date, which is September 5, 2019.
On September 30, 2016, in connection with the Note Purchase Agreement (as defined below), we entered into the Limited Waiver and Third Amendment to theCredit Agreement, which among other things, (i) allows Midla Holdings (as defined below), for so long as the 3.77% Senior Notes are outstanding, to be excludedfrom guaranteeing the obligations under the Credit Agreement and being subject to certain convents thereunder, (ii) releases the lien granted under the originalcredit agreement on D-Day’s equity interests in FPS Equity, and (iii) deems the FPS Equity excluded property under the Credit Agreement. All other terms underthe Credit Agreement remain the same.
For the six months ended June 30, 2017 and 2016 , the weighted average interest rate on borrowings under our Credit Agreement and the JPE Revolver (as definedbelow) was approximately 4.67% and 4.15% , respectively. At June 30, 2017 and December 31, 2016 , letters of credit outstanding under the Credit Agreementwere $32.3 million and $7.4 million , respectively. As of June 30, 2017 , we had approximately $678.0 million of borrowings and $32.3 million of letters of creditoutstanding under the Credit Agreement resulting in $189.6 million of available borrowing capacity.
As of June 30, 2017 , our consolidated total leverage ratio was 4.79 and our interest coverage ratio was 5.04 , which were both in compliance with the relatedrequirements of our Credit Agreement. Our ability to maintain compliance with the leverage and interest coverage ratios included in the Credit Agreement may besubject to, among other things, the timing and success of initiatives we are pursuing, which may include expansion capital projects, acquisitions, or drop downtransactions, as well as the associated financing for such initiatives. See Note 12 - Debt Obligations to our condensed consolidated financial statements included inItem 1 of Part I of this Quarterly Report for further discussion of the Credit Agreement.
We use the term “revolving credit facility” or “Credit Agreement,” we are referring to our First Amended and Restated Credit Facility and to our Second Amendedand Restated Credit Facility, as the context may require.
JPE Revolver
JPE had a $275.0 million revolving loan, which included a sub-limit of up to $100.0 million for letters of credit with Bank of America, N.A. (the “JPE Revolver”).The JPE Revolver was scheduled to mature on February 12, 2019, but on March 8, 2017, in connection with the closing of the JPE acquisition, the $199.5 millionoutstanding balance of the JPE Revolver was paid off in full and terminated. For the six months ended June 30, 2017 and 2016 , the weighted average interest rateon borrowings under our Credit Agreement and the JPE Revolver was approximately 4.67% and 4.15% , respectively.
67
Table of Contents
8.50% Senior Unsecured Notes
On December 28, 2016, the Issuers completed the issuance and sale of the 8.50% Senior Notes. The 8.50% Senior Notes rank equal in right of payment with allexisting and future senior indebtedness of the Issuers, and senior in right of payment to any future subordinated indebtedness of the Issuers. The 8.50% SeniorNotes were issued at par and provided approximately $294.0 million in proceeds, after deducting the initial purchasers' discount of $6.0 million. This amount wasdeposited into escrow pending completion of the JPE Acquisition and is included in Restricted cash-long term on our consolidated balance sheet as of December31, 2016. We also incurred $2.7 million of debt issuance costs resulting in net proceeds related to the 8.50% Senior Notes of $291.3 million. The 8.50% Seniornotes were offered and sold to qualified institutional buyers in the United States pursuant to Rule 144A under the Securities Act, and to persons, other than U.S.persons, outside the United States pursuant to Regulation S under the Securities Act.
Upon the closing of the JPE Acquisition and the satisfaction of other conditions related thereto, the proceeds were used to repay and terminate the JPE Revolverand reduce borrowings under our Credit Agreement.
The 8.50% Senior Notes will mature on December 15, 2021 with interest payable in cash semi-annually in arrears on June 15 and December 15, commencing June15, 2017. See Note 12 - Debt Obligations to our condensed consolidated financial statements included in Item 1 of Part I of this Quarterly Report for furtherdiscussion of the 8.50% Senior Notes.
3.77% Senior Secured Notes
On September 30, 2016, Midla Financing (“Midla Financing”) American Midstream (Midla) LLC (“Midla”), and Mid Louisiana Gas Transmission LLC (“MLGT”and together with Midla, the “Note Guarantors”) entered into the 3.77% Senior Note Purchase and Guaranty Agreement (the “Note Purchase Agreement”) with thepurchasers party thereto (the “Purchasers”). Pursuant to the Note Purchase Agreement, Midla Financing issued and sold $60.0 million in aggregate principalamount of 3.77% Senior Notes (non-recourse) due June 30, 2031 (the “3.77% Senior Notes”) to the Purchasers, which bear interest at an annual rate of 3.77% to bepaid quarterly. The average quarterly principal payment is approximately $1.1 million. Principal on the 3.77% Senior Notes will be paid on the last business day ofeach fiscal quarter end starting June 30, 2017. The 3.77% Senior Notes are payable in full on June 30, 2031. The 3.77% Senior Notes were issued at par andprovided net proceeds of approximately $49.8 million (after deducting related issuance costs). The proceeds are contractually restricted. The 3.77% Senior Notesare non-recourse to the Partnership.
In connection with the Note Purchase Agreement, the Note Guarantors guaranteed the payment in full of all Midla Financing’s obligations under the Note PurchaseAgreement. Also, Midla Financing and the Note Guarantors granted a security interest in substantially all of their tangible and intangible personal property,including the membership interests in each Note Guarantor held by Midla Financing, and Financing Holdings pledged the membership interests in Midla Financingto the Collateral Agent.
Net proceeds from the 3.77% Senior Notes are restricted and will be used (1) to fund project costs incurred in connection with (a) the construction of the Midla-Natchez Line (b) the retirement of Midla’s existing 1920’s vintage pipeline (c) the move of our Baton Rouge operations to the MLGT system (d) thereconfiguration of the DeSiard compression system and all related ancillary facilities, (2) to pay transaction fees and expenses in connection with the issuance ofthe 3.77% Senior Notes, and (3) for other general corporate purposes of Midla Financing. See Note 12 - Debt Obligations to our condensed consolidated financialstatements included in Item 1 of Part I of this Quarterly Report on further discussion of the 3.77% Senior Notes.
Acquisition Support and Reimbursement
In recognition of the historically warm weather that adversely impacted the Propane Marketing Services segment and the transition-related impacts of the JPEAcquisition during the quarter, affiliates of ArcLight, the owner of our general partner agreed to absorb $9.6 million corporate overhead expenses, which wereincurred by us in the first quarter of 2017 and subsequently paid the amount in the second quarter of 2017. This is incremental to the commitments made in thesupport agreement with the Partnership that was executed in conjunction with the JPE Acquisition.
Working Capital
Working capital is the amount by which current assets exceed current liabilities and is a measure of our ability to pay our liabilities as they become due. Ourworking capital requirements are primarily driven by changes in accounts receivable and accounts payable. These changes are impacted by changes in the prices ofcommodities that we buy and sell. In general, our working capital requirements increase in periods of rising commodity prices and decrease in periods of decliningcommodity prices. However, our working capital needs do not necessarily change at the same rate as commodity prices because both accounts receivable and
68
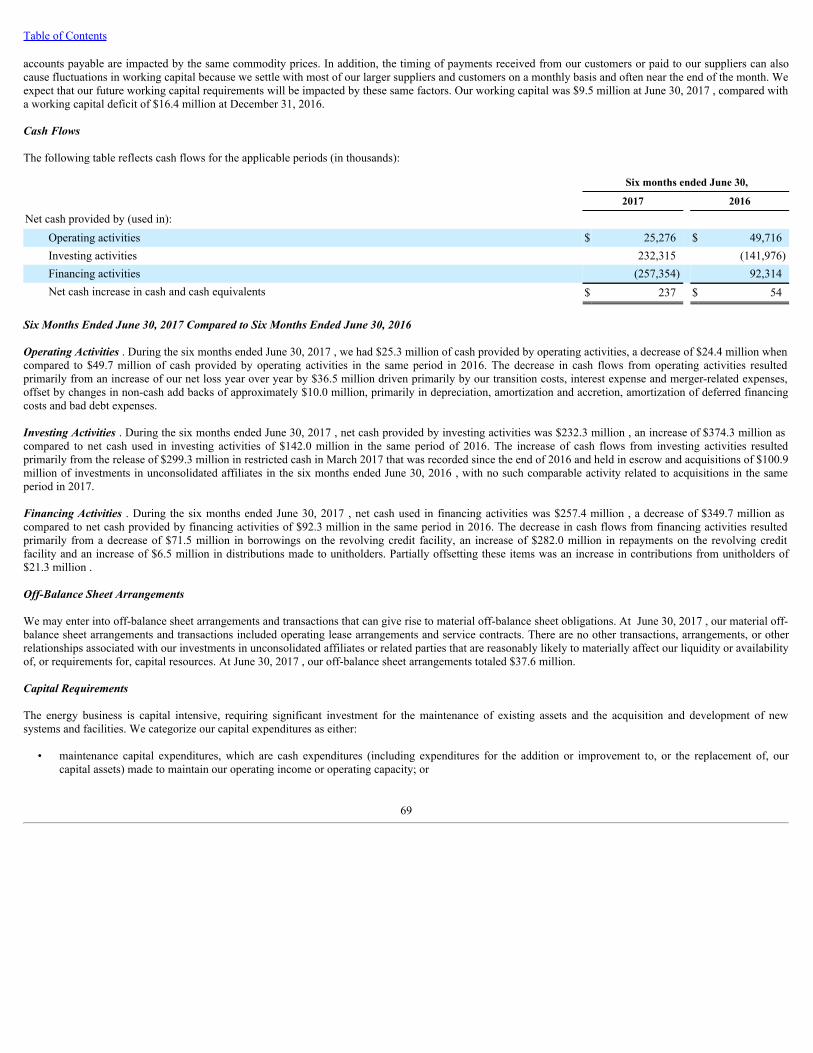
Table of Contents
accounts payable are impacted by the same commodity prices. In addition, the timing of payments received from our customers or paid to our suppliers can alsocause fluctuations in working capital because we settle with most of our larger suppliers and customers on a monthly basis and often near the end of the month. Weexpect that our future working capital requirements will be impacted by these same factors. Our working capital was $9.5 million at June 30, 2017 , compared witha working capital deficit of $16.4 million at December 31, 2016.
Cash Flows
The following table reflects cash flows for the applicable periods (in thousands):
Six months ended June 30,
2017 2016
Net cash provided by (used in): Operating activities $ 25,276 $ 49,716Investing activities 232,315 (141,976)Financing activities (257,354) 92,314Net cash increase in cash and cash equivalents $ 237 $ 54
Six Months Ended June 30, 2017 Compared to Six Months Ended June 30, 2016
Operating Activities . During the six months ended June 30, 2017 , we had $25.3 million of cash provided by operating activities, a decrease of $24.4 million whencompared to $49.7 million of cash provided by operating activities in the same period in 2016. The decrease in cash flows from operating activities resultedprimarily from an increase of our net loss year over year by $36.5 million driven primarily by our transition costs, interest expense and merger-related expenses,offset by changes in non-cash add backs of approximately $10.0 million, primarily in depreciation, amortization and accretion, amortization of deferred financingcosts and bad debt expenses.
Investing Activities . During the six months ended June 30, 2017 , net cash provided by investing activities was $232.3 million , an increase of $374.3 million ascompared to net cash used in investing activities of $142.0 million in the same period of 2016. The increase of cash flows from investing activities resultedprimarily from the release of $299.3 million in restricted cash in March 2017 that was recorded since the end of 2016 and held in escrow and acquisitions of $100.9million of investments in unconsolidated affiliates in the six months ended June 30, 2016 , with no such comparable activity related to acquisitions in the sameperiod in 2017.
Financing Activities . During the six months ended June 30, 2017 , net cash used in financing activities was $257.4 million , a decrease of $349.7 million ascompared to net cash provided by financing activities of $92.3 million in the same period in 2016. The decrease in cash flows from financing activities resultedprimarily from a decrease of $71.5 million in borrowings on the revolving credit facility, an increase of $282.0 million in repayments on the revolving creditfacility and an increase of $6.5 million in distributions made to unitholders. Partially offsetting these items was an increase in contributions from unitholders of$21.3 million .
Off-Balance Sheet Arrangements
We may enter into off-balance sheet arrangements and transactions that can give rise to material off-balance sheet obligations. At June 30, 2017 , our material off-balance sheet arrangements and transactions included operating lease arrangements and service contracts. There are no other transactions, arrangements, or otherrelationships associated with our investments in unconsolidated affiliates or related parties that are reasonably likely to materially affect our liquidity or availabilityof, or requirements for, capital resources. At June 30, 2017 , our off-balance sheet arrangements totaled $37.6 million.
Capital Requirements
The energy business is capital intensive, requiring significant investment for the maintenance of existing assets and the acquisition and development of newsystems and facilities. We categorize our capital expenditures as either:
• maintenance capital expenditures, which are cash expenditures (including expenditures for the addition or improvement to, or the replacement of, ourcapital assets) made to maintain our operating income or operating capacity; or
69
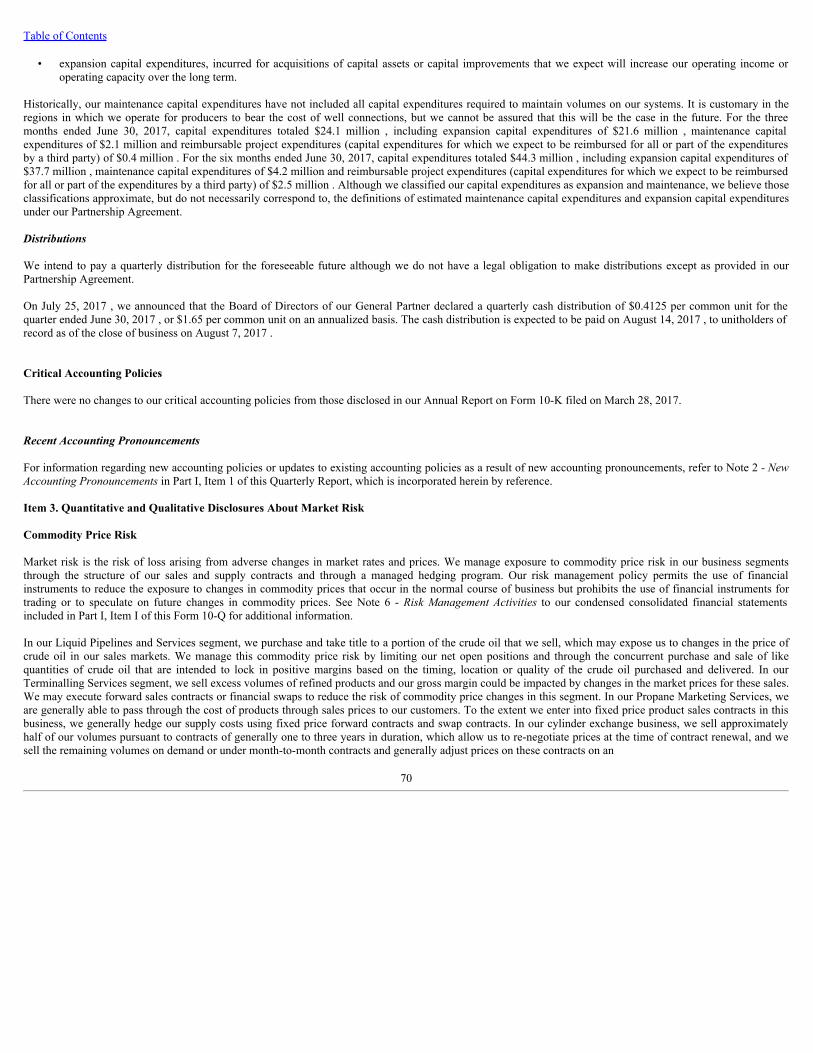
Table of Contents
• expansion capital expenditures, incurred for acquisitions of capital assets or capital improvements that we expect will increase our operating income oroperating capacity over the long term.
Historically, our maintenance capital expenditures have not included all capital expenditures required to maintain volumes on our systems. It is customary in theregions in which we operate for producers to bear the cost of well connections, but we cannot be assured that this will be the case in the future. For the threemonths ended June 30, 2017, capital expenditures totaled $24.1 million , including expansion capital expenditures of $21.6 million , maintenance capitalexpenditures of $2.1 million and reimbursable project expenditures (capital expenditures for which we expect to be reimbursed for all or part of the expendituresby a third party) of $0.4 million . For the six months ended June 30, 2017, capital expenditures totaled $44.3 million , including expansion capital expenditures of$37.7 million , maintenance capital expenditures of $4.2 million and reimbursable project expenditures (capital expenditures for which we expect to be reimbursedfor all or part of the expenditures by a third party) of $2.5 million . Although we classified our capital expenditures as expansion and maintenance, we believe thoseclassifications approximate, but do not necessarily correspond to, the definitions of estimated maintenance capital expenditures and expansion capital expendituresunder our Partnership Agreement.
Distributions
We intend to pay a quarterly distribution for the foreseeable future although we do not have a legal obligation to make distributions except as provided in ourPartnership Agreement.
On July 25, 2017 , we announced that the Board of Directors of our General Partner declared a quarterly cash distribution of $0.4125 per common unit for thequarter ended June 30, 2017 , or $1.65 per common unit on an annualized basis. The cash distribution is expected to be paid on August 14, 2017 , to unitholders ofrecord as of the close of business on August 7, 2017 .
Critical Accounting Policies
There were no changes to our critical accounting policies from those disclosed in our Annual Report on Form 10-K filed on March 28, 2017.
Recent Accounting Pronouncements
For information regarding new accounting policies or updates to existing accounting policies as a result of new accounting pronouncements, refer to Note 2 - NewAccounting Pronouncements in Part I, Item 1 of this Quarterly Report, which is incorporated herein by reference.
Item 3. Quantitative and Qualitative Disclosures About Market Risk
Commodity Price Risk
Market risk is the risk of loss arising from adverse changes in market rates and prices. We manage exposure to commodity price risk in our business segmentsthrough the structure of our sales and supply contracts and through a managed hedging program. Our risk management policy permits the use of financialinstruments to reduce the exposure to changes in commodity prices that occur in the normal course of business but prohibits the use of financial instruments fortrading or to speculate on future changes in commodity prices. See Note 6 - Risk Management Activities to our condensed consolidated financial statementsincluded in Part I, Item I of this Form 10-Q for additional information.
In our Liquid Pipelines and Services segment, we purchase and take title to a portion of the crude oil that we sell, which may expose us to changes in the price ofcrude oil in our sales markets. We manage this commodity price risk by limiting our net open positions and through the concurrent purchase and sale of likequantities of crude oil that are intended to lock in positive margins based on the timing, location or quality of the crude oil purchased and delivered. In ourTerminalling Services segment, we sell excess volumes of refined products and our gross margin could be impacted by changes in the market prices for these sales.We may execute forward sales contracts or financial swaps to reduce the risk of commodity price changes in this segment. In our Propane Marketing Services, weare generally able to pass through the cost of products through sales prices to our customers. To the extent we enter into fixed price product sales contracts in thisbusiness, we generally hedge our supply costs using fixed price forward contracts and swap contracts. In our cylinder exchange business, we sell approximatelyhalf of our volumes pursuant to contracts of generally one to three years in duration, which allow us to re-negotiate prices at the time of contract renewal, and wesell the remaining volumes on demand or under month-to-month contracts and generally adjust prices on these contracts on an
70
Table of Contents
annual basis. We hedge a majority of the forecasted volumes under our fixed-price contracts using financial swaps, and we may also use financial swaps to managecommodity price risk on our month-to-month contracts. At times we may also terminate or unwind hedges or a portion of hedges in order to meet cash flowobjectives or when the expected future volumes do not support the level of hedges. In our NGL transportation business, we do not take title to the products wetransport and therefore have no direct commodity price exposure.
Sensitivity analysis
The table below summarizes our commodity-related financial derivative instruments and fair values, as well as the effect on fair value of an assumed hypothetical10% change in the underlying price of the commodity.
Derivative Instrument Maturity Notional Volume Fair Value Asset
(Liability) Effect of Hypothetical +/-10%
change
Propane Fixed Price (gallons) July 1, 2017 - December 31, 2019 10,892,201 $(526) $632Crude Oil Fixed Price (barrels) July 1,2017 - July 31, 2017 68,000 $160 $—
Price-risk sensitivities were calculated by assuming a theoretical 10% change (increase or decrease) in price regardless of terms or historical relationships betweenthe contractual price of the instruments and the underlying commodity price. Results are presented in absolute terms and represent a potential gain or loss in netincome (loss). The preceding hypothetical analysis is limited because changes in prices may or may not equal 10% and actual results may differ.
Interest Rate Risk
Our revolving credit facility bears interest at a variable rate and exposes us to interest rate risk. From time to time, we may use certain derivative instruments tohedge our exposure to variable interest rates. Based on our unhedged interest rate exposure to variable rate debt outstanding as of June 30, 2017, a 1% increase ordecrease in interest rates would change annual interest expense by approximately $0.9 million.
We do not hold or purchase financial instruments or derivative financial instruments for trading purposes.
Credit risk
We are exposed to credit risk. Credit risk represents the loss that we would incur if a counterparty fails to perform under its contractual obligations. We manage ourexposure to credit risk associated with customers to whom we extend credit through analyzing the counterparties’ financial condition prior to entering into anagreement, establishing credit limits, monitoring the appropriateness of these limits on an ongoing basis and entering into netting agreements that allow foroffsetting counterparty receivable and payable balances for certain transactions, as deemed appropriate. We may request letters of credit, cash collateral,prepayments or guarantees as forms of credit support.
Item 4. Controls and Procedures
Evaluation of Disclosure Controls and Procedures
We maintain a system of disclosure controls and procedures that are designed to ensure that information required to be disclosed by us in the reports that we file orsubmit to the SEC under the Securities Exchange Act of 1934, as amended (the “Exchange Act”), is recorded, processed, summarized and reported within the timeperiods specified by the SEC’s rules and forms, and that such information is accumulated and communicated to the management of our General Partner, includingour General Partner’s principal executive and principal financial officers (whom we refer to as the “Certifying Officers”), as appropriate to allow timely decisionsregarding required disclosure.
71
Table of Contents
As of the end of the period covered by this report, we carried out an evaluation, under the supervision of the principal executive officer and principal financialofficer of our General Partner, of the effectiveness of the design and operation of our disclosure controls and procedures (as defined in Rules 13a-15(e) and 15d-15(e) of the Exchange Act). Based on our evaluation, our principal executive officer and principal financial officer concluded that the Partnership’s disclosurecontrols and procedures were not effective as of June 30, 2017 as a result of a material weakness as described below.
Based on its evaluation of internal control over financial reporting as described above, management concluded that the Partnership did not maintain a sufficientcomplement of resources with an appropriate level of accounting knowledge, expertise and training commensurate with its financial reporting requirements.Specifically, individuals within the Partnership’s financial accounting and reporting functions did not have the appropriate level of expertise to ensure thatcomplex, non-routine transactions of the Partnership were recorded appropriately. This control deficiency resulted in out-of-period adjustments recorded to theunaudited consolidated statement of operations in the fourth quarter of 2016 and a revision to the 2015 consolidated balance sheet and consolidated statement ofcash flows.
Despite the material weakness, our principal executive officer and principal financial officer have concluded that the financial statements included in this reportfairly present in all material respects our financial condition, results of operations and cash flows for the periods presented.
Material Weakness Remediation
Management is actively engaged in the planning for, and implementation of, remediation efforts to address the material weakness identified. Specifically, we aretaking numerous steps that we believe will address the underlying causes of the material weakness, primarily through the hiring of additional accounting personnelwith technical accounting and financial reporting experience, the enhancement of our training programs within our accounting department, and the enhancement ofour internal review procedures during the financial statement preparation process.
Changes in Internal Control Over Financial Reporting
There were no changes in internal control over financial reporting (as defined in Rules 13a-15(f) and 15d-15(f) under the Exchange Act) that occurred during thequarter ended June 30, 2017 that have materially affected, or are reasonably likely to materially affect, our internal control over financial reporting.
The certifications of our Certifying Officers pursuant to Exchange Act Rules 13a-14(a) and 15d-14(a) are filed with this Quarterly Report on Form 10-Q asExhibits 31.1 and 31.2. The certifications of our Certifying Officers pursuant to 18 U.S.C. 1350 are furnished with this Quarterly Report on Form 10-Q as Exhibits32.1 and 32.2.
PART II. OTHER INFORMATIONItem 1. Legal Proceedings
We are not currently party to any pending litigation or governmental proceedings, other than ordinary routine litigation incidental to our business. While theultimate impact of any proceedings cannot be predicted with certainly, our management believes that the resolution of any of our pending proceeds will not have amaterial adverse effect on our financial condition or results of operations.
Item 1A. Risk Factors
In addition to the information about our business, financial conditions and results of operations set forth in this Quarterly Report, careful consideration should begiven to the risk factors discussed under the caption “Risk Factors” in Part I, Item 1A of our Annual Report. Such risks are not the only risks we face. Additionalrisks and uncertainties not presently known to us or that we currently believe to be immaterial may also have a material adverse effect on our business or ouroperations.
72
Table of Contents
Item 6. Exhibits
ExhibitNumber Exhibit
3.1 Certificate of Limited Partnership of American Midstream Partners, LP (filed as Exhibit 3.1 to the Registration Statement on Form S-1(Commission File No. 333-173191) filed on March 31, 2011).
3.2 Fifth Amended and Restated Agreement of Limited Partnership of American Midstream Partners, LP, dated April 25, 2016 (filed as Exhibit 3.1to the Current Report on Form 8-K (Commission File No. 001-35257) filed on April 29, 2016).
3.3 First Amendment to Fifth Amended and Restated Agreement of Limited Partnership of American Midstream Partners, LP, dated June 21, 2016(filed as Exhibit 3.1 to the Current Report on Form 8-K (Commission File No. 001-35257) filed on June 22, 2016).
3.4 Amendment No. 2 to Fifth Amended and Restated Agreement of Limited Partnership of American Midstream Partners, LP, dated October 31,2016 (filed as Exhibit 3.1 to the Current Report on Form 8-K (Commission File No. 001-35257) filed on November 4, 2016).
3.5 Amendment No. 3 to Fifth Amended and Restated Agreement of Limited Partnership of American Midstream Partners, LP, dated March 8, 2017(filed as Exhibit 3.1 to the Current Report on Form 8-K (Commission File No. 001-35257) filed on March 8, 2017).
3.6 Amendment No. 4 to Fifth Amended and Restated Agreement of Limited Partnership of American Midstream Partners, LP, dated May 25, 2017(filed as Exhibit 3.1 to the Current Report on Form 8-K (Commission File No. 001-35257) filed on May 31, 2017).
3.7 Composite Agreement of Limited Partnership of American Midstream Partners, LP (filed as Exhibit 3.19 to the Annual Report on Form 10-K(Commission File No. 001-35257) filed on March 28, 2017).
3.8 Amendment No. 5 to Fifth Amended and Restated Agreement of Limited Partnership of American Midstream Partners, LP, dated June 30, 2017(filed as Exhibit 3.1 to the Current Report on Form 8-K (Commission File No. 001-35257) filed on July 14, 2017).
3.9 Certificate of Formation of American Midstream GP, LLC (filed as Exhibit 3.4 to the Registration Statement on Form S-1 (Commission FileNo. 333-173191) filed on March 31, 2011).
3.10 Third Amended and Restated Limited Liability Company Agreement of American Midstream GP, LLC (filed as Exhibit 3.1 to the CurrentReport on Form 8-K (Commission File No. 001-35257) filed on May 6, 2016).
31.1* Certification of Lynn L. Bourdon III, President and Chief Executive Officer of American Midstream GP, LLC, the General Partner of AmericanMidstream Partners, LP, for the June 30, 2017 Quarterly Report on Form 10-Q, pursuant to Section 302 of the Sarbanes-Oxley Act of 2002.
31.2* Certification of Eric T. Kalamaras, Senior Vice President & Chief Financial Officer of American Midstream GP, LLC, the General Partner ofAmerican Midstream Partners, LP, for the June 30, 2017 Quarterly Report on Form 10-Q, pursuant to Section 302 of the Sarbanes-Oxley Act of2002.
32.1* Certification of Lynn L. Bourdon III, President and Chief Executive Officer of American Midstream GP, LLC, the General Partner of AmericanMidstream Partners, LP, for the June 30, 2017 Quarterly Report on Form 10-Q, pursuant to Section 906 of the Sarbanes-Oxley Act of 2002.
32.2* Certification of Eric T. Kalamaras, Senior Vice President & Chief Financial Officer of American Midstream GP, LLC, the General Partner ofAmerican Midstream Partners, LP, for the June 30, 2017 Quarterly Report on Form 10-Q, pursuant to Section 906 of the Sarbanes-Oxley Act of2002.
**101.INS XBRL Instance Document**101.SCH XBRL Taxonomy Extension Schema Document**101.CAL XBRL Taxonomy Extension Calculation Linkbase Document**101.DEF XBRL Taxonomy Extension Definition Linkbase Document**101.LAB XBRL Taxonomy Extension Label Linkbase Document**101.PRE XBRL Taxonomy Extension Presentation Linkbase Document
* Filed herewith.** Furnished herewith.
73

Table of Contents
SIGNATURES
Pursuant to the requirements of the Securities Exchange Act of 1934, the registrant has duly caused this report to be signed on its behalf by the undersignedthereunto duly authorized.
Date: August 9, 2017
AMERICAN MIDSTREAM PARTNERS, LP
By: American Midstream GP, LLC, its General Partner
By: /s/ Lynn L. Bourdon III Lynn L. Bourdon III Chairman, President and Chief Executive Officer (Principal Executive Officer)
By: /s/ Eric T. Kalamaras Eric T. Kalamaras Senior Vice President and Chief Financial Officer (Principal Financial Officer)
74
Table of Contents
Exhibit Index
ExhibitNumber Exhibit
3.1 Certificate of Limited Partnership of American Midstream Partners, LP (filed as Exhibit 3.1 to the Registration Statement on Form S-1(Commission File No. 333-173191) filed on March 31, 2011).
3.2 Fifth Amended and Restated Agreement of Limited Partnership of American Midstream Partners, LP, dated April 25, 2016 (filed as Exhibit 3.1to the Current Report on Form 8-K (Commission File No. 001-35257) filed on April 29, 2016).
3.3 First Amendment to Fifth Amended and Restated Agreement of Limited Partnership of American Midstream Partners, LP, dated June 21, 2016(filed as Exhibit 3.1 to the Current Report on Form 8-K (Commission File No. 001-35257) filed on June 22, 2016).
3.4 Amendment No. 2 to Fifth Amended and Restated Agreement of Limited Partnership of American Midstream Partners, LP, dated October 31,2016 (filed as Exhibit 3.1 to the Current Report on Form 8-K (Commission File No. 001-35257) filed on November 4, 2016).
3.5 Amendment No. 3 to Fifth Amended and Restated Agreement of Limited Partnership of American Midstream Partners, LP, dated March 8,2017 (filed as Exhibit 3.1 to the Current Report on Form 8-K (Commission File No. 001-35257) filed on March 8, 2017).
3.6 Composite Agreement of Limited Partnership of American Midstream Partners, LP (filed as Exhibit 3.19 to the Annual Report on Form 10-K(Commission File No. 001-35257) filed on March 28, 2017).
3.7 Third Amended and Restated Limited Liability Company Agreement of American Midstream GP, LLC (filed as Exhibit 3.1 to the CurrentReport on Form 8-K (Commission File No. 001-35257) filed on May 6, 2016).
3.8 Certificate of Formation of American Midstream GP, LLC (filed as Exhibit 3.4 to the Registration Statement on Form S-1 (Commission FileNo. 333-173191) filed on March 31, 2011).
4.1 Supplemental Indenture, dated as of March 8, 2017, by and among American Midstream Partners, LP, the Guarantors party thereto and WellsFargo Bank, National Association, as trustee (filed as Exhibit 4.1 to the Current Report on Form 8-K (Commission File No. 001-35257) filed onMarch 14, 2017).
10.1 Second Amended and Restated Credit Agreement, dated as of March 8, 2017, by and among American Midstream, LLC, BlackwaterInvestments, Inc., American Midstream Partners, LP, Bank of America, N.A., Wells Fargo Bank, National Association, Bank of Montreal,Capital One National Association, Citibank, N.A., SunTrust Bank, Natixis New York Branch, ABN AMRO Capital USA LLC, Barclays BankPLC, Royal Bank of Canada, Santander Bank, N.A., Merrill, Lynch, Pierce, Fenner & Smith Incorporated, Wells Fargo Securities, LLC and thelenders party thereto (filed as Exhibit 10.1 to the Current Report on Form 8-K (Commission File No. 001-35257) filed on March 14, 2017).
31.1* Certification of Lynn L. Bourdon III, President and Chief Executive Officer of American Midstream GP, LLC, the General Partner of AmericanMidstream Partners, LP, for the June 30, 2017 Quarterly Report on Form 10-Q, pursuant to Section 302 of the Sarbanes-Oxley Act of 2002.
31.2* Certification of Eric T. Kalamaras, Senior Vice President & Chief Financial Officer of American Midstream GP, LLC, the General Partner ofAmerican Midstream Partners, LP, for the June 30, 2017 Quarterly Report on Form 10-Q, pursuant to Section 302 of the Sarbanes-Oxley Act of2002.
32.1* Certification of Lynn L. Bourdon III, President and Chief Executive Officer of American Midstream GP, LLC, the General Partner of AmericanMidstream Partners, LP, for the June 30, 2017 Quarterly Report on Form 10-Q, pursuant to Section 906 of the Sarbanes-Oxley Act of 2002.
32.2* Certification of Eric T. Kalamaras, Senior Vice President & Chief Financial Officer of American Midstream GP, LLC, the General Partner ofAmerican Midstream Partners, LP, for the June 30, 2017 Quarterly Report on Form 10-Q, pursuant to Section 906 of the Sarbanes-Oxley Act of2002.
**101.INS XBRL Instance Document**101.SCH XBRL Taxonomy Extension Schema Document**101.CAL XBRL Taxonomy Extension Calculation Linkbase Document**101.DEF XBRL Taxonomy Extension Definition Linkbase Document**101.LAB XBRL Taxonomy Extension Label Linkbase Document**101.PRE XBRL Taxonomy Extension Presentation Linkbase Document
* Filed herewith.** Furnished herewith.
75

EXHIBIT 31.1
CERTIFICATION PURSUANT TOSECTION 302 OF
THE SARBANES-OXLEY ACT OF 2002
I, Lynn L. Bourdon III, certify that:
1 I have reviewed this Quarterly Report on Form 10-Q of American Midstream Partners, LP;
2 Based on my knowledge, this report does not contain any untrue statement of a material fact or omit to state a material fact necessary to make thestatements made, in light of the circumstances under which such statements were made, not misleading with respect to the period covered by this report;
3 Based on my knowledge, the financial statements, and other financial information included in this report, fairly present in all material respects thefinancial condition, results of operations and cash flows of the registrant as of, and for, the periods presented in this report;
4 The registrant’s other certifying officer and I are responsible for establishing and maintaining disclosure controls and procedures (as defined inExchange Act Rules 13a-15(e) and 15d-15(e)) and internal control over financial reporting (as defined in Exchange Act Rules 13a-15(f) and 15d-15(f))for the registrant and have:
(a) Designed such disclosure controls and procedures, or caused such disclosure controls and procedures to be designed under our supervision, toensure that material information relating to the registrant, including its consolidated subsidiaries, is made known to us by others within thoseentities, particularly during the period in which this report is being prepared;
(b) Designed such internal control over financial reporting, or caused such internal control over financial reporting to be designed under oursupervision, to provide reasonable assurance regarding the reliability of financial reporting and the preparation of financial statements forexternal purposes in accordance with generally accepted accounting principles;
(c) Evaluated the effectiveness of the registrant’s disclosure controls and procedures and presented in this report our conclusions about theeffectiveness of the disclosure controls and procedures, as of the end of the period covered by this report based on such evaluation; and
(d) Disclosed in this report any change in the registrant’s internal control over financial reporting that occurred during the registrant’s most recentfiscal quarter (the registrant’s fourth fiscal quarter in the case of an annual report) that has materially affected, or is reasonably likely tomaterially affect, the registrant’s internal control over financial reporting; and
5 The registrant’s other certifying officer and I have disclosed, based on our most recent evaluation of internal control overfinancial reporting, to the registrant’s auditors and the audit committee of the registrant’s board of directors (or personsperforming the equivalent functions):
(a) All significant deficiencies and material weaknesses in the design or operation of internal control over financial reporting which are reasonablylikely to adversely affect the registrant’s ability to record, process, summarize and report financial information; and
(b) Any fraud, whether or not material, that involves management or other employees who have a significant role in the registrant’s internal controlover financial reporting.
Date: August 9, 2017 /s/ Lynn L. Bourdon III
Lynn L. Bourdon III President and Chief Executive Officer of American Midstream GP, LLC (the general partner of American Midstream Partners, LP)
EXHIBIT 31.2
CERTIFICATION PURSUANT TOSECTION 302 OF
THE SARBANES-OXLEY ACT OF 2002
I, Eric T. Kalamaras, certify that:
1 I have reviewed this Quarterly Report on Form 10-Q of American Midstream Partners, LP;
2 Based on my knowledge, this report does not contain any untrue statement of a material fact or omit to state a material fact necessary to make thestatements made, in light of the circumstances under which such statements were made, not misleading with respect to the period covered by this report;
3 Based on my knowledge, the financial statements, and other financial information included in this report, fairly present in all material respects thefinancial condition, results of operations and cash flows of the registrant as of, and for, the periods presented in this report;
4 The registrant’s other certifying officer and I are responsible for establishing and maintaining disclosure controls and procedures (as defined inExchange Act Rules 13a-15(e) and 15d-15(e)) and internal control over financial reporting (as defined in Exchange Act Rules 13a-15(f) and 15d-15(f))for the registrant and have:
(a) Designed such disclosure controls and procedures, or caused such disclosure controls and procedures to be designed under our supervision, toensure that material information relating to the registrant, including its consolidated subsidiaries, is made known to us by others within thoseentities, particularly during the period in which this report is being prepared;
(b) Designed such internal control over financial reporting, or caused such internal control over financial reporting to be designed under oursupervision, to provide reasonable assurance regarding the reliability of financial reporting and the preparation of financial statements forexternal purposes in accordance with generally accepted accounting principles;
(c) Evaluated the effectiveness of the registrant’s disclosure controls and procedures and presented in this report our conclusions about theeffectiveness of the disclosure controls and procedures, as of the end of the period covered by this report based on such evaluation; and
(d) Disclosed in this report any change in the registrant’s internal control over financial reporting that occurred during the registrant’s most recentfiscal quarter (the registrant’s fourth fiscal quarter in the case of an annual report) that has materially affected, or is reasonably likely tomaterially affect, the registrant’s internal control over financial reporting; and
5 The registrant’s other certifying officer and I have disclosed, based on our most recent evaluation of internal control overfinancial reporting, to the registrant’s auditors and the audit committee of the registrant’s board of directors (or personsperforming the equivalent functions):
(a) All significant deficiencies and material weaknesses in the design or operation of internal control over financial reporting which are reasonablylikely to adversely affect the registrant’s ability to record, process, summarize and report financial information; and
(b) Any fraud, whether or not material, that involves management or other employees who have a significant role in the registrant’s internal controlover financial reporting.
Date: August 9, 2017 /s/ Eric T. Kalamaras
Eric T. Kalamaras Senior Vice President & Chief Financial Officer American Midstream GP, LLC (the general partner of American Midstream Partners, LP)
EXHIBIT 32.1
CERTIFICATION PURSUANT TO18 U.S.C. SECTION 1350,
AS ADOPTED PURSUANT TOSECTION 906 OF THE SARBANES-OXLEY ACT OF 2002
In connection with the Quarterly Report of American Midstream Partners, LP (the “Registrant”) on Form 10-Q for the period ended June 30, 2017 as filedwith the Securities and Exchange Commission on the date hereof (the “Report”), I, Lynn L. Bourdon III, President and Chief Executive Officer of AmericanMidstream GP, LLC, the general partner of the Registrant, certify, pursuant to 18 U.S.C. § 1350, as adopted pursuant to § 906 of the Sarbanes-Oxley Act of 2002,that:
(1) The Report fully complies with the requirements of Section 13(a) or 15(d) of the Securities Exchange Act of 1934 (15 U.S.C. 78m or 78o(d)); and(2) The information contained in the Report fairly presents, in all material respects, the financial condition and results of operations of the Registrant.
Date: August 9, 2017 /s/ Lynn L. Bourdon III
Lynn L. Bourdon III President and Chief Executive Officer of American Midstream GP, LLC (the general partner of American Midstream Partners, LP)
The foregoing certification is being furnished solely pursuant to 18 U.S.C. Section 1350 and is not being filed as part of the Report or as a separate document. Asigned original of this written statement required by Section 906 of the Sarbanes-Oxley Act of 2002 has been provided to the Registrant and will be retained by theRegistrant and furnished to the Securities and Exchange Commission or its staff upon request.

EXHIBIT 32.2
CERTIFICATION PURSUANT TO18 U.S.C. SECTION 1350,
AS ADOPTED PURSUANT TOSECTION 906 OF THE SARBANES-OXLEY ACT OF 2002
In connection with the Quarterly Report of American Midstream Partners, LP (the “Registrant”) on Form 10-Q for the period ended June 30, 2017 as filedwith the Securities and Exchange Commission on the date hereof (the “Report”), I, Eric T. Kalamaras, Senior Vice President & Chief Financial Officer ofAmerican Midstream GP, LLC, the general partner of the Registrant, certify, pursuant to 18 U.S.C. § 1350, as adopted pursuant to § 906 of the Sarbanes-Oxley Actof 2002, that:
(1) The Report fully complies with the requirements of Section 13(a) or 15(d) of the Securities Exchange Act of 1934 (15 U.S.C. 78m or 78o(d)); and(2) The information contained in the Report fairly presents, in all material respects, the financial condition and results of operations of the Registrant.
Date: August 9, 2017 /s/ Eric T. Kalamaras
Eric T. Kalamaras Senior Vice President & Chief Financial Officer American Midstream GP, LLC (the general partner of American Midstream Partners, LP)
The foregoing certification is being furnished solely pursuant to 18 U.S.C. Section 1350 and is not being filed as part of the Report or as a separate document. Asigned original of this written statement required by Section 906 of the Sarbanes-Oxley Act of 2002 has been provided to the Registrant and will be retained by theRegistrant and furnished to the Securities and Exchange Commission or its staff upon request.