american sociological association - university of …cragin/wright.pdf · american sociological...
TRANSCRIPT

American Sociological Association
The American Class StructureAuthor(s): Erik Olin Wright, Cynthia Costello, David Hachen, Joey SpragueSource: American Sociological Review, Vol. 47, No. 6 (Dec., 1982), pp. 709-726Published by: American Sociological AssociationStable URL: http://www.jstor.org/stable/2095208 .Accessed: 18/09/2011 23:52
Your use of the JSTOR archive indicates your acceptance of the Terms & Conditions of Use, available at .http://www.jstor.org/page/info/about/policies/terms.jsp
JSTOR is a not-for-profit service that helps scholars, researchers, and students discover, use, and build upon a wide range ofcontent in a trusted digital archive. We use information technology and tools to increase productivity and facilitate new formsof scholarship. For more information about JSTOR, please contact [email protected].
American Sociological Association is collaborating with JSTOR to digitize, preserve and extend access toAmerican Sociological Review.
http://www.jstor.org
TIE AMERICAN CLASS STRUCTURE*
ERIK OLIN WRIGHT DAVID HACHEN
CYNTHIA COSTELLO JOEY SPRAGUE University of Wisconsin
This paper presents the first systematic investigation of the American class structure based on data gatheredfrom an explicitly Marxian, relational perspective. Classes in this research are not defined in terms of categories of occupations, but in terms of social relations of control over investments, decision making, other people's work, and one's own work. Data on these dimensions of social relations of production were gathered in a national survey of the U.S. working population. Four general results from the study are particularly important: (I) The working class is byfar the largest class in the American class structure. (2) Close to half of all locations within the class structure have a "contradictory character," that is, their class content is determined by more than one basic class. The American class structure cannot therefore be represented by any simple scheme of class polarization. (3) Lower status white-collar occupations are virtually as proletarianized as manual occupations. It therefore makes little sense to consider such occupations as part of the "middle class." (4) Women and blacks are considerably more proletarianized than white males. The result is that a sizable majority of the U.S. working class is composed of women and minorities.
The central objective of this paper, and of the larger research project of which this is a part, is to investigate rigorously the objective contours of the class structures of advanced capitalist societies within a Marxist frame- work.' The larger project will eventually in- volve systematic comparative analysis of a number of different countries using data gathered from identical questionnaires ad- ministered in each country.2 That data will be
used to explore a variety of specific problems: the differences in class distributions in the various countries; the relationship between the state and private employment within the class structure; the patterns of class and occu- pational mobility; class structure and the sex- ual division of labor in work and in the home; class structure and income inequality; the in- terrelationships between class structure, class location, and class consciousness. This paper will not broach most of these topics. Its focus is much more limited: to develop a satisfactory strategy for operationalizing a particular var- iant of the Marxian concept of class structure, and to use that operationalization to generate a series of descriptive analyses of salient fea- tures of the American class structure.
SPECIFYING A MARXIST CONCEPT OF CLASS
As anyone familiar with the recent history of Marxist thought will know, there is hardly a consensus among Marxists over any aspect of the concept of class. What defines a class con- cept as "Marxist" is probably less its fidelity to a set of substantive criteria than its use of a particular kind of language and its insertion into a particular terrain of debate. Thus, while all Marxist treatments of class revolve around
*Direct all correspondence to: Erik Olin Wright, Department of Sociology, University of Wisconsin, Madison, WI 53706.
This paper was supported in part by grants from the National Science Foundation (SES-7812189), from the Wisconsin Alumni Research Foundation, and by funds granted to the Institute for Research on Poverty by the Department of Health and Human Services pursuant to the terms of the Economic Op- portunity Act of 1964.
I While there have been a few Marxist studies which attempt to investigate statistically the class struc- ture as a whole, generally such research has been built on quite inadequate data. See in particular, Therborn (1972, 1981), Przeworski et al. (1980), Szymanski (1972), Loren (1977), and Westergaard and Resler (1975). For work on class structure out- side of a Marxist framework see Hunter (1979), Van- neman (1977), Kahl (1957), Gagliani (1981), and Breiger (1981).
2 The survey used in this project was initially developed in a pilot project conducted at the Univer- sity of Wisconsin in 1978. During the period 1978- 1980 proposals based on this initial project were submitted by researchers in several European coun- tries. As of late 1982, surveys have been completed in the United States, Finland, Sweden, Norway,
Australia, and surveys will be fielded in Canada, Britain, and Italy. Eventually, therefore, the analysis will involve systematic comparisons among at least eight countries. For details of the project, see Wright (1982c, d).
American Socological Review 1982, Vol. 47 (December:709-726 709

710 AMERICAN SOCIOLOGICAL REVIEW
concepts like exploitation, social relations of production, mode of production, property re- lations, and so on, there is little agreement on what precisely these concepts mean, on how they are interrelated or on how they bear on the central issues of class. What follows, therefore, is not in any sense a discussion of the Marxist concept of class structure. Rather, it is one stance within an ongoing debate.3
Since the strategy which we will propose has been elaborated in detail elsewhere (Wright, 1976, 1978: Chapter 2, 1979: Chapters 1 and 2, 1980a, b; Wright and Singelmann, 1982), only the essential points will be sketched out here. This strategy is based on a distinction between three kinds of locations within a class structure: basic class locations, contradictory locations within a mode of production, and contradictory locations between modes of pro- duction. The second and third of these can be grouped under a more general rubric, con- tradictorv locations within class relations. Let us examine each of these.
Within a given mode of production, basic class locations are defined by a complete polarization within the social relations of pro- duction. Within the capitalist mode of produc- tion, for example, the bourgeoisie is defined as that class which owns and controls the means of production and is thus able to exploit and dominate the activities of workers within the production process, whereas the working class is defined as that class which is dispossessed of the means of production and sells its labor power to capitalists and is thus exploited and dominated within production.4
Contradictory locations within a mode of production, on the other hand, specify situa- tions within which such a complete polariza- tion is absent. Managers, for example, domi- nate workers and are dominated by the bourgeoisie, and they may even directly exer- cise certain ownership rights and thus exploit workers, while at the same time being exploited by capital. They are thus in a sense simultaneously in two classes: they are work- ers in that they are exploited and dominated by capital; they are capitalists in that they domi- nate (and may also exploit) workers.
Contradictory locations between modes of production constitute the most complex situa- tion. Concrete capitalist societies always con- tain at least some noncapitalist forms of pro- duction relations. What is often termed "sim- ple commodity production," in which the di- rect producers own and control their own means of production and hire no wage labor, is the most obvious example. In some societies there may also be remnants of feudal produc- tion relations which continue to have some im- portance. And it is possible that the growth of forms of state-organized production should be seen as an emergent form of postcapitalist pro- duction. Concrete class structures are thus complicated by the fact that certain positions may be determined within these forms of non- capitalist class relations. They may also be complicated by the fact that even within capitalist firms and organizations, certain as- pects of these noncapitalist relations may con- tinue to have a structural presence. Wright (1982b) has termed such situations examples of the "interpenetration of modes of production." The class locations defined within such inter- penetrated relations constitute contradictory locations between modes of production. Two important examples are: (1) small employers, who should be understood as simultaneously petty bourgeois in that they own and use their own means of production (i.e., they are self- employed direct producers) and capitalist in that they employ workers and thus both exploit and dominate the labor of others; and (2) semiautonomous employees such as most professionals, who, like the petty bourgeoisie, have substantial control over the direction of their own activity within production, and yet are dispossessed of the means of production (nonowners within appropriation relations) and partially dominated.
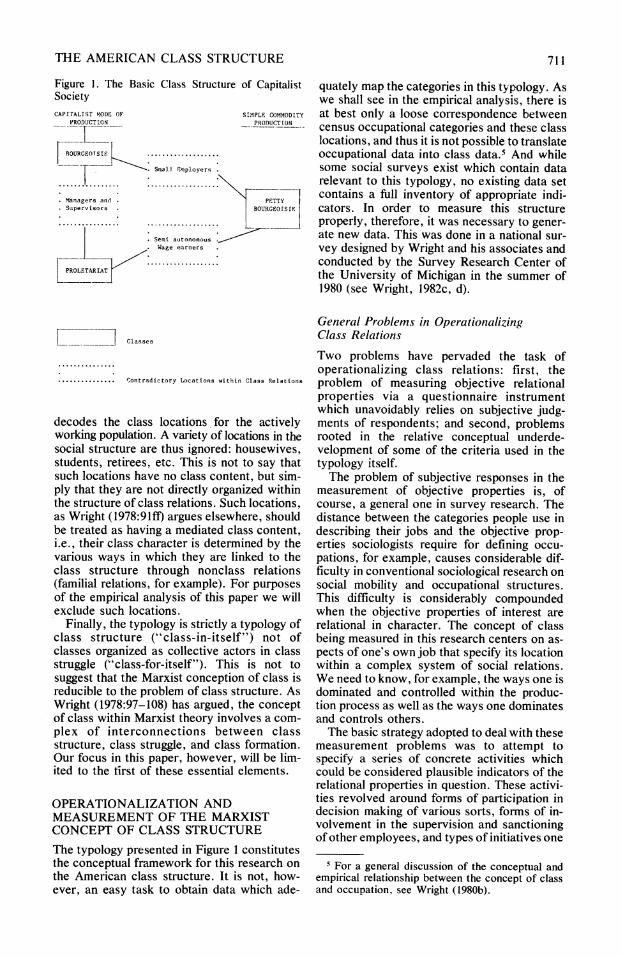
Taking these different kinds of class loca- tions together we have the general class map of capitalist society presented in Figure 1. Several comments on this picture need to be made. First, the spatial metaphor is somewhat mis- leading. The "contradictory locations" are not literally "between" classes, but rather repre- sent locations which are simultaneously within more than one class.
Secondly, the picture in Figure 1 must itself be seen as a simplification in that only capitalist relations of production and simple commodity production are included. Locations within the state have thus been merged with capitalist production proper. Although it is possible to defend such a procedure (Wright, 1978:94-96), in many ways it may be more fruitful eventually to separate. state production as a distinct form of production relations.
Thirdly, the typology presented here only
3For a general discussion of the alternative posi- tions within these debates on class structure,, see Wright (1980a).
4 Although we cannot develop the point here, it is important to note that analyses of the polarization of class relations do not assume that class is a unidi- mensional social relation. In particular, as Wright (1982a) has argued, the social relations of production must be understood as consisting simultaneously of relations of appropriation and domination. For a cri- tique by a Marxist of the relevance of domination for the definition of class relations, see Roemer (1982).
THE AMERICAN CLASS STRUCTURE 711
Figure 1. The Basic Class Structure of Capitalist Society CAPITALIST MODE) OF SIMPLE COMMODITY
PRODUCTION PRODUCTION
711L ROURGEOTSIF ..................
Sma].J Esployers
....... .... ..... ................. ...\
. Managers and PETTY
. Supervisors BOURGEOISIE
..... ......... ... ..............
. Semi autonomous . Wage earners
................... PROLETARIAT
Classes
............... . Contradictory Locations within Class Relations
decodes the class locations for the actively working population. A variety of locations in the social structure are thus ignored: housewives, students, retirees, etc. This is not to say that such locations have no class content, but sim- ply that they are not directly organized within the structure of class relations. Such locations, as Wright (1978:91ff) argues elsewhere, should be treated as having a mediated class content, i.e., their class character is determined by the various ways in which they are linked to the class structure through nonclass relations (familial relations, for example). For purposes of the empirical analysis of this paper we will exclude such locations.
Finally, the typology is strictly a typology of class structure ("class-in-itself") not of classes organized as collective actors in class struggle ("class-for-itself"). This is not to suggest that the Marxist conception of class is reducible to the problem of class structure. As Wright (1978:97-108) has argued, the concept of class within Marxist theory involves a com- plex of interconnections between class structure, class struggle, and class formation. Our focus in this paper, however, will be lim- ited to the first of these essential elements.
OPERATIONALIZATION AND MEASUREMENT OF THE MARXIST CONCEPT OF CLASS STRUCTURE
The typology presented in Figure 1 constitutes the conceptual framework for this research on the American class structure. It is not, how- ever, an easy task to obtain data which ade-
quately map the categories in this typology. As we shall see in the empirical analysis, there is at best only a loose correspondence between census occupational categories and these class locations, and thus it is not possible to translate occupational data into class data.5 And while some social surveys exist which contain data relevant to this typology, no existing data set contains a full inventory of appropriate indi- cators. In order to measure this structure properly, therefore, it was necessary to gener- ate new data. This was done in a national sur- vey designed by Wright and his associates and conducted by the Survey Research Center of the University of Michigan in the summer of 1980 (see Wright, 1982c, d).
General Problems in Operationalizing Class Relations
Two problems have pervaded the task of operationalizing class relations: first, the problem of measuring objective relational properties via a questionnaire instrument which unavoidably relies on subjective judg- ments of respondents; and second, problems rooted in the relative conceptual underde- velopment of some of the criteria used in the typology itself.
The problem of subjective responses in the measurement of objective properties is, of course, a general one in survey research. The distance between the categories people use in describing their jobs and the objective prop- erties sociologists require for defining occu- pations, for example, causes considerable dif- ficulty in conventional sociological research on social mobility and occupational structures. This difficulty is considerably compounded when the objective properties of interest are relational in character. The concept of class being measured in this research centers on as- pects of one's own job that specify its location within a complex system of social relations. We need to know, for example, the ways one is dominated and controlled within the produc- tion process as well as the ways one dominates and controls others.
The basic strategy adopted to deal with these measurement problems was to attempt to specify a series of concrete activities which could be considered plausible indicators of the relational properties in question. These activi- ties revolved around forms of participation in decision making of various sorts, forms of in- volvement in the supervision and sanctioning of other employees, and types of initiatives one
5 For a general discussion of the conceptual and empirical relationship between the concept of class and occupation, see Wright (1980b).

712 AMERICAN SOCIOLOGICAL REVIEW
could exercise on one's own. While these questions are not perfect, they should provide a reasonably satisfactory basis for measuring the relations which constitute the class structure.
The second problem in the present research lies in the conceptual criteria themselves. In these terms the most problematic case is the category "semiautonomous employee"'-class locations which involve genuine control or self-direction over one's own labor process without controlling the labor process of anyone else. It is not at all clear from this very abstract formulation which of the multitude of aspects of jobs are the pivotal ones for defining this "petty bourgeois" form of autonomy within capitalist production. And even if we decide on a particular dimension, it is not obvious how to avoid arbitrariness in specifying the class loca- tion since self-direction is clearly a continuous variable rather than a naturally dichotomous one.6
The general strategy adopted to deal with these kinds of problems has been first, to in- clude a variety of alternative indicators of the same theoretical dimension, so that different formal criteria can be compared in various ways, and second, to construct a series of class typologies employing criteria of different levels of restrictiveness in order to establish ranges for the distribution of the population into different locations.
Operationalizing Specific Classes
Table I presents the general logic of overall construction of the class typology. The distri- butions of respondents for the various concrete criteria used to operationalize this typology are given in Table 2.
I. The Bourgeoisie and Small Employers. Because of the nature of general population surveys, by necessity very few proper mem- bers of the bourgeoisie are ever actually in- cluded in national random samples. Because of this, relatively few questions were included in the survey to capture various kinds of varia- tions within this category. The bourgeois class is operationalized in this survey by two princi- pal criteria: (1) self-employment (Q.A7), and
(2) number of employees (Q.A9 and A10).7 The problem, of course, is to specify the appropri- ate number of employees to distinguish be- tween small employers-the contradictory lo- cation between the bourgeoisie and the petty bourgeoisie-and actual capitalists. Because of the relative arbitrariness in establishing such a criterion, we have adopted several alternative cutoff points for use in different analyses. In practical terms this is not such a serious issue since there are so few respondents with more than two or three employees. As a result, for many of the statistical analyses it becomes necessary to merge small employers with large employers into a more diffuse "employer" class category.8
2. Managers and Supervisors. The most complex part of the typology centers on the contradictory locations between the bourgeoisie and the working class. Three criteria were used to define these locations: Decision making, Authority, and Formal Hierarchical position.
a. Decision-making participation. Re- spondents were asked whether or not they participated in policy-making decisions in their work place (Q.D 1), and if they responded affirmatively, they were then asked specific questions about forms of participation in eight different types of decisions dealing with bud- gets and investment, products, and various as- pects of operation (Q.D2 and D3). On each of these decisions, respondents could get one of three codes: 1 = directly participates in making the policy
decision (i.e., they make the decision on their own authority, or they make it sub- ject to approval from above, or they are a voting member of a group which makes the decision),
6 To say that autonomy is a continuous variable does not imply that the concept of autonomy is gradational. Autonomy in the present context desig- nates a social relationship between supervisors and subordinates which structures the range of activities over which the subordinate has discretion. It is pos- sible to measure this range as a continuous variable while still regarding it as an indicator of the underly- ing social relation.
7 The letters and numbers in parentheses refer to questions on the questionnaire. Copies of the ques- tionnaire are available from the first author on re- quest.
8 It should be noted in the distributions given for the various categories of self-employed in Table 2 that the overall proportion of the respondents who are self-employed is considerably higher than is re- ported in census statistics. This is largely because the census has a completely nonsociological way of defining "self-employment." To be self-employed in the census one has to be unincorporated and not work for a wage or salary as well as being self- employed. Thus, if you are self-employed but sell a service and are paid by the hour (e.g., as a consul- tant), you are likely to be classified as a wage and salary worker. Similarly, if for tax purposes you were to incorporate your business and thus be "em- ployed by your own corporation," you would not be considered self-employed any longer. This makes the census criterion for self-employment virtually use- less in a class analysis.

'11"HIE AMERICAN CLASS STRUCTURE 713
0 0 0 U u
0 cn u .0 4-4 C 0
CZ
4*
11-4 4.
cl 0 C
: 0 0 0 "O C
>, ,
0 >-. CZ +J
cd 0 CZ CZ CZ
CZ u u
= 0 0 O t
In
0 ;..
= W .> CZ 4,
44 0 - E O (D + .-
"O0 u
0
cu
CZ
la 0
M C'S 0 0
cd
Q
4-40 cd 0
0 .- - cd
4-
:2 cd 0 cq el
cd 0 0 C4 E
to 0
cd cd 0 cd0 0 r. CZ cd - cd 'O cd u U 0 CZ 5 u "
CIO 0 CZ 0 0 cd > cd 0 " u E - u- 0 = 0
4- (4-4 W)Z W O (A
.4- cd cd . 0 9 "O 4-40 V C c 4)= W
O cd :a m C)
U cd 4-i .- .- +-.-
04 U cn C cd 4. CIS >, 0 cd 0 Ld0 LZ 0

714 AMERICAN SOCIOLOGICAL REVIEW
Table 2. Distributions of Criteria Used in Typology
A. Self-employment Self-employed 14.6% Employees 85.4
B. Number of employees (For self-employed
respondents only) Cumulative
0-1 employee 47.6% 2-5 employees 34.0 81.6% 6-10 employees 5.7 87.3 11-15 employees 6.4 93.7 16-30 employees 2.2 95.9 31-50 employees 2.0 97.9 51-100 employees 1.2 99.1 over 100 0.9 100.0
C. Decision making (For employee respondents only)
Participates directly in making at least one policy decision 17.8%
Provides advice but does not directly participate in making policy deci- sions 9.2
Non-decision maker 73.1 D. Authority
(For employee respondents only) Sanctioning supervisor 28.0Wo Task supervisor 8.8 Nominal supervisor 2.8 Nonsupervisor 60.4
E. Formal hierarchy (For employees only)
Top managerial position 3.2% Upper managerial 2.9 Middle managerial 5.0 Lower managerial 2.8 Supervisory 17.4 Nonmanagerial-
supervisory 68.6 F. Managerial location
(For employees only) Manager 14.4% Advisor-manager 5.3 Nonmanagerial decision
maker 3.3 Supervisor 15.0 Nonmanager/supervisor 62.1
G. Autonomy (For employees only)
High autonomy 12.8% Probably high 6.9 Moderate autonomy 12.3 Probably moderate 5.2 Low nominal autonomy 8.3 No autonomy 54.5
2 = provides advice to the decision makers, but does not directly participate in making the decision,
3 = neither provides advice nor participates.
The responses to the initial general question on decision making and these specific questions
were then aggregated into a simple three-value variaole:
DECISIONMAKING: 1 = participates directly in making at least one
decision, 2 = does not participate in any decisions, but
provides advice on at least one, 3 = non-decision maker.
For certain analyses we also make use of the specific kinds of decisions in which the re- spondent participates, but for the general class typology these distinctions are not included.
b. Authority. It turns out to be not so sim- ple to ask a proper authority question. The typical question used on surveys is something like: "Do you supervise anyone on your job?" or "Do you have any subordinates on your job?" The problem with these types of ques- tions is that they do not distinguish between someone who performs purely nominal super- visory functions, acting more as a transmitter of communications from above than as a wielder of even limited power, and positions which involve real authority. The head of a work team might answer "yes" to these ques- tions without really having any power over his/her subordinates. To avoid these problems we ask a number of detailed questions about authority relations to construct an authority variable. The result is a variable with four values with the following interpretations:
AUTHORITY: = sanctioning supervisor: a supervisor who
is able to impose positive and/or negative sanctions on subordinates (Q.C4-6),
2 = task supervisor: a supervisor who cannot impose sanctions, but does give orders of various kinds (C3),
3 = nominal supervisor: a supervisor who neither gives orders nor imposes sanc- tions,
4 = nonsupervisor: no subordinates of any sort, or supervises a single clerical subor- dinate (who in turn has no subordinates).
In the construction of class typologies, level 3 was generally combined with level 4 into a broader nonsupervisor category.
c. Position within the formal hierarchy. In addition to the questions about decision mak- ing and authority, respondents were asked whether the position they held was classified as a managerial position, a supervisory position or a nonmanagement position (Q.D4). Ini- tially this question was included in the survey as a kind of validation check on the supervi- sory questions, and indeed as expected there is a relatively close fit between positions which are called managerial or supervisory and actu-

THE AMERICAN CLASS STRUCTURE 715
ally being able to exercise supervisory powers, as is seen in Table 3. But the fit is not perfect, and thus we decided it was appropriate to in- clude the formal hierarchy variable in the oper- ational criteria for these class locations.
Once these different variables had been con- structed, the problem was then to combine them into a general managerial-supervisory location variable. Here a number of critical theoretical choices had to be made. If we wanted to be highly restrictive in our definition of managers, we could restrict the managerial category to those positions which were unam- biguously managerial on all three of these vari- ables, i.e., positions which made decisions, which had real supervisory capacities, and which were in the formal hierarchy. Similarly, the most restrictive definition of supervisors would be non-decision makers with real au- thority in the formal hierarchy. On the other hand, if we wanted to be unrestrictive, a man- ager would be anyone who made decisions re- gardless of how they scored on the other two variables, and a supervisor would be any non-decision maker with subordinates, re- gardless of how much real power was involved in the supervisory activity or whether the posi- tion was formally in the hierarchy or not.
In order to leave maximum flexibility, the strategy we adopted was to construct a general managerial location variable which contained all of these possibilities, and then to collapse this variable in different ways in order to ex- amine various problems using broad and nar- row definitions of these class locations. The full managerial location variable is given in the Appendix to this paper. The version of that variable which we will use in this paper in- volves the following definitions:
MANAGERIAL LOCATION: I = Manager: decision makers who are man-
agers or supervisors in the formal hierar- chy and/or have real authority (values of 1 or 2 on the authority variable);
2 = Advisor-managers: advisors to decision makers who are in the hierarchy and/or have real authority;
3 = Nonmanagerial decisionmakers: decision makers who are neither in the hierarchy nor have any authority;
4 = Supervisors: non-decision makers with sanctioning authority or with both task authority and a supervisor/manager loca- tion in the formal hierarchy;
5 = nonmanagers, nonsupervisors.
3. Semiautonomous Employees. While the actual construction of the variables to operationalize this class location is fairly sim- ple, there are probably more problems with the validity of the measures employed than in any of the other aspects of the typology. Of the various possible aspects of "self-direction" within the labor process, the one that seemed most salient for defining the petty bourgeois character of certain employee positions was the capacity of individuals to plan and design significant aspects of their work and put their own ideas into practice on the job. The ration- ale behind this was derived in part from the work of Harry Braverman (1973), who, build- ing on themes present in various works of Marx, argues that the essential logic of pro- letarianization is one of an increasing separa- tion of conception and execution within the labor process. In the classical independent ar- tisan, conception and execution are united; in the radically proletarianized operative on an assembly line, they are almost entirely sepa- rated. We therefore sought a measure of au- tonomy rooted in the extent to which concep- tion was a self-directed activity within work.
Our final approach was first to pose the fol- lowing very general question:
"Now we have some questions about vari- ous aspects of your present job. First, is yours a job in which you are required to design important aspects of your own work
Table 3. Authority by Formal Hierarchical Position (employees only)
Authority Position within the Total Formal Managerial Sanctioning Task No (column Hierarchy Authority Authority Authority Totala N percentages)
Top or upper manager 79.7% 2.1% 18.1% 100.0% 77 6.1% Middle manager 70.0 12.0 18.0 100.0 64 5.1 Lower manager 55.6 15.3 29.1 100.0 35 2.8 Supervisor 65.1 13.2 21.7 100.0 220 17.4 Nonmanagement
positions 9.7 8.0 82.3 100.0 867 68.6 Nb 353 113 798 1264 Total % 28.0 8.9 63.1 100.0 100.0
a Percentages sum horizontally. b The Ns are the weighted Ns used in calculating the distributions.

716 AMERICAN SOCIOLOGICAL REVIEW
and to put your ideas into practice? Or, is yours a job in which you are not required to design important aspects of your own work or put your ideas into practice, except perhaps in minor details?" (Q.B1) Those respondents who claimed that they
were required to design their own work were then asked to give a typical concrete example of this. The interviewer had instructions to probe for specific details. We then developed a fairly elaborate coding system to code the examples. The essential logic of the coding was to give people a score based on how much self-direction we felt the example indicated and how confident we were in our judgment.9 The scale thus had the following values:
AUTONOMY: I = HIGH autonomy: the example indicates
an ability to design broad aspects of the job, engage in nonroutine problem solving on a regular basis and to put one's ideas into practice in a regular and pervasive way;
2 = Probably HIGH autonomy; 3 = MODERATE autonomy: ability to design
limited aspects of the job, engage in rela- tively routine forms of problem solving and, within fairly well defined limits, put one's ideas into practice;
4 = Probably MODERATE autonomy; 5 = LOW autonomy: virtually no significant
ability to plan aspects of the job, problem solving a marginal part of the job, and only in unusual circumstances can one put one's ideas into practice;
6 = NO AUTONOMY: the individual re- sponds negatively to the initial filter ques- tion.
Our overall strategy for operationalizing the semiautonomous employee class location was thus to use these examples as a way of cor- recting for subjective distortions by respon- dents who overestimate their capacity for self-direction within work. The assumption was that people who really could plan and de- sign their work and put their ideas into practice would overwhelmingly say "yes" to the filter,
but that some people without such autonomy would also claim to be self-directed. The examples were designed to correct for this. Approximately 18 percent of respondents who claimed to have planning autonomy in the filter question were judged, on the basis of the example they provided, to have no real au- tonomy in their work. Our feeling is that we were fairly successful in that enterprise. We are not able, however, to correct for the other subjective distortion-people who understate their autonomy in the initial filter question.
Again, as in the managerial location variable, this autonomy scale enables us to adopt alter- native operationalizations by collapsing the scale in different ways. For most of the present analysis we will consider semiautonomous em- ployees to be people outside of the managerial structure who have levels 1-3 on the scale.
4. Petty Bourgeoisie. The pure petty bourgeoisie is defined as positions which own their own means of production (self- employed) and employ no one. As soon as a single person is employed in at all a regular way, the social relations of production are transformed, for now a relation of domination is introduced into the production system.
Unfortunately, in the questionnaire we de- veloped for this study we made a slight word- ing error in the question about number of em- ployees. The question was worded in the passive voice in the following manner: "How many people are employed in this business?" From the responses it is fairly clear that at least some of the respondents with no employees responded "one," meaning themselves. Since it is not possible to identify these people unam- biguously, we will define the petty bourgeoisie as self-employed individuals with one or no employees. In practical terms it is improbable that this will make any important substantive difference in our analysis.
5. The Working Class. In terms of the formal construction of the typology, the working class is a "residual" category. That is, all wage la- borers are in a sense initially defined as work- ers, and then the various criteria discussed above are applied to take respondents out of the working class and place them in various kinds of contradictory locations. After that procedure is completed, the remaining respon- dents are identified as workers. Since all of these criteria are interlocking, the size of the working class depends upon how restrictive or expansive a set of criteria is used to define the various non-working-class locations. When we discuss the results later in this paper we will present ranges for the size of the working class and other locations depending upon the kinds of criteria used.
Taking all of these various operationaliza-
9 In typological exercises such as this, there are typically two sorts of classification errors that one confronts: wrongfully including someone in a par- ticular category or wrongfully excluding someone. For certain specific analytical purposes one of these errors may be more problematic than the other. The explicit introduction of coding confidence judgments in our autonomy scale will enable us to create a "pure semiautonomous employee" category-i.e., one in which only the second kind of error has occurred-when this is important for particular analyses.

THE AMERICAN CLASS STRUCTURE 717
Table 4. Operational Typology for Class Structure
Self- Number of Managerial Class Employment Employees Locationa Autonomyb Bourgeoisie self-employed 10 xc X Small employer self-employed 2-9 X X Petty bourgeoisie self-employed 0-} X X Managers and supervisors employee X X X
Managers 1t " I X Advisory managers " to 2 X Supervisors " 4 X
Semiautonomous employees " I 3, 5d 1-3 Workers If " " 4-6
a The definition of the values in the managerial location variable is given on p. 715. b The definition of the autonomy variable is given on p. 716. c X = criterion not applicable. d "Nonmanagerial decision makers"-people who make decisions but have no subordinates and are
classified as "nonmanagement" in the formal hierarchy are merged with semiautonomous employees (if they are autonomous) or workers (if they are nonautonomous) throughout this paper. The number of cases involved is very small, less than 2% of the sample.
tions together, we get the operational typology for class relations presented in Table 4. The categories in this table provide the basis for the empirical analyses which follow.
The Survey
The data which we will discuss in the analysis below was gathered in a national telephone survey conducted by the Survey Research Center at the University of Michigan in the summer of 1980. The sample is a two-stage systematic cluster sample of telephone num- bers in the coterminous United States. The first stage consisted of sampling clusters of telephone numbers. In the second stage tele- phone numbers within clusters were randomly selected. Finally, within households eligible respondents were selected at random. A full description of this design can be found in Groves (1979). The final sample consisted of 1499 adults working in the labor force, 92 un- employed adults and 170 housewives not currently in the labor force. This represented a response rate of about 78 percent, a fairly typi- cal rate for this kind of survey. AUl of the pres- ent analyses will concern the actively working labor force sample (i.e., excluding unemployed and housewives).
A Note on Weights
For reasons which are not entirely clear, the marginal distributions in the sample for occu- pation and education deviate from the compa- rable distributions in the U.S. Census to a greater extent than is usual in telephone sur- veys. Our sample is overrepresented both in higher status occupations and in higher levels
of education.10 This overrepresentation will probably have relatively little affect in the various multivariate analyses of individual out- comes which we will pursue, but it almost cer- tainly could affect the more descriptive mac- rostructural investigations of overall class structure in this paper. We have therefore con- structed a post hoc system of weights based on the census occupation by education table for the employed population which, when applied to our sample, reproduces the census distribu- tions. Unless otherwise noted, throughout this paper we will use the weighted sample.
DATA ANALYSIS Overall Class Distributions
Table 5 presents the distribution of the eco- nomically active population (excluding unem- ployed) in the United States into classes ac- cording to the criteria defined in Table 4, along with the range of estimates for this distribution using the most restrictive and least restrictive criteria for each class.
10 Our best guess is that much of this bias is due to refusals. Among people who initially refused to par- ticipate in the survey, but after follow-up telephone calls agreed to participate (about 30 percent of the initial refusers and 9 percent of the sample), the education and occupation distributions are much closer to that of the CPS labor force sample. As- suming that converted refusers are likely to have characteristics intermediate between initial par- ticipators and unconverted refusers, this suggests that among the refusers to the survey there was a lower proportion of highly educated people than among the participants. We do not know, however, why less educated people were more likely to refuse to participate in this particular survey than in other surveys fielded by the Institute of Social Research.

718 AMERICAN SOCIOLOGICAL REVIEW
Table 5. Ranges for the Estimates of the Class Dis- tribution of the United States Labor Force, 1980
Best Class Location Estimate Minimum Maximum Petty bourgeoisie 6.8% Small employers 6.0 Employers/
bourgeoisie 1.8 All managers/
supervisors 29.6 21.1% 43.0W Managers 12.3 9.5 15.1 Advisor-
managers 4.5 2.6 7.8 Supervisors 12.8 9.0 20.2
Semiautonomous employees 9.5 2.3 16.6
Working class 46.3 35.2 56.7 Note: Ranges were based on following criteria:
Managers: Minimum = decision maker + sanctioning au-
thority + in formal hierarchy Maximum = decision maker
Advisor-manager: Minimum = advisor on decisions + sanction-
ing + in formal hierarchy Maximum = Advisor on decisions
Supervisor: Minimum = non-decision maker + sanction-
ing + in formal hierarchy Maximum = non-decision maker + sanctioning
or task authority or in hierarchy Semiautonomous employees:
Minimum = nonmanager/supervisor with minimum criteria for each cate- gory of managers + levels 1-2 on autonomy
Maximum = nonmanager/supervisor with minimum criteria for each cate- gory of managers + levels 1-4 on autonomy
Workers: Minimum = maximum criteria for managers
and semiautonomous employees Maximum = minimum criteria for managers and
semiautonomous employees
Several things are worth noting in this overall distribution. First, the working class is the largest single class location within this structure, approaching half of all positions, and 54 percent of employee positions. This means that nearly half of all people who work lack significant control over their own work, are excluded from all planning and decision- making activities within their place of work, and do not control the work of anyone else.
Second, there are nearly as many positions defined as contradictory locations within class relations-positions which are simultaneously located in more than one class-as there are basic class locations. Of these contradictory locations, approximately half-or about 20
percent of all positions-can be considered lo- cations within which the working class aspects are probably dominant (i.e., supervisors and semiautonomous employees). " This means that somewhere around 65-70 percent of the people in the sample are either working class or in positions with a significant working class aspect. The United States may be a "middle- class society" in certain cultural or ideological ways, but it remains structurally a class society within which the working class continues to have the greatest numerical weight.
Third, it is important to recognize that the estimates presented in Table 5 are fairly sensi- tive to theoretical decisions about precisely how to combine the various criteria in the typology. If, for example, we exclude from the working class those who indicate in their ques- tionnaires that they in any way supervise other people or that they have even very modest levels of autonomy, the size of the working class is reduced to 35 percent. If, on the other hand, we insist that to be a manager one must be unambiguously a manager on all of the criteria, that to be a supervisor one must both be in the formal hierarchy and have sanctioning authority, and to be semiautonomous one must have high levels of autonomy, then the size of the working class increases to 57 percent. What these figures suggest is that 35 percent of all positions are unambiguously working class, an additional 11 percent of positions are almost certainly working class, and a further 10 per- cent are possibly working class.'2 The opera- tional choices are thus not innocuous. Al- though throughout this analysis we will adopt the criteria which we feel to be the most sound theoretically (those used in Table 4), it is im- portant to understand the nature of the as- sumptions underlying these measures.
Class and Occupation
The status of the conceptual distinction be- tween class and occupation. Most sociological discussions of class either explicitly or im- plicitly view classes as essentially aggregations
" Because "contradictory locations" are class lo- cations which have a dual class content, the relative weight of specific class determinations varies across such contradictory locations. Most semiautonomous employees and supervisors are probably in locations within which the working class aspects are the pre- dominant ones.
12 It is unclear at this point if these ranges reflect what are essentially measurement problems, or if the ambiguities in the application of the criteria have a deeper structural meaning. At a minimum they may suggest that in addition to contradictory locations within class relations, we need a concept of "am- biguous" locations.

THE AMERICAN CLASS STRUCTURE 719
Table 6. Class Distributions within Occupations
(4) (5) (2) (3) Total Semi- (7)
(1) Advisor Super- Managerial Auton- (6) Petty (8) (9) (10) Managers Managers visors (I + 2 + 3) omous Workers Bourg. Employers Total Na
Professionals 21.1% 12.5% 18.3% 51.7% 20.1% 12.8% 9.3% 5.9%o 100 143 Technicians 20.6 13.3 16.2 50.1 18.5 24.2 1.8 5.4 100 44 Teachersb 18.3 3.7 5.1 27.1 64.3 7.2 1.4 0 100 51 Managers &
officials 39.0 5.8 9.8 54.6 3.3 4.8 9.5 27.7 100 174 Clerks 4.9 2.5 17.0 24.4 3.8 66.6 2.0 3.2 100 279 Sales 5.3 8.0 0.8 14.1 20.5 43.8 15.6 6.1 100 88 Skilled services 15.6 .6 24.0 40.2 8.2 36.8 4.0 10.8 100 79 Crafts 8.3 4.1 15.3 27.7 12.5 47.2 6.9 5.7 100 163 Foreman 30.4 11.9 51.2 93.5 4.7 1.7 0 0 100 29 Operatives &
transport 1.8 1.1 9.1 12.0 1.1 82.5 3.3 1.1 100 225 Laborersd 3.4 2.1 4.8 10.3 3.4 70.6 5.7 10.1 100 71 Unskilled
services 6.4 1.7 6.2 14.3 3.3 65.7 14.4 2.2 100 125 Farmers 0 6.8 0 6.8 0 0 33.5 59.7 100 22
a The Ns are the weighted Ns used in calculating the distributions. b Primary and secondary teachers. University teachers are included in professionals. e Includes occupations like barbers, airline cabin attendants, chefs, etc. I Includes farm laborers.
of occupational categories. Even where they disagree on the conceptual content of the con- cept of class, they agree that operationally classes can be identified as groups of occu- pations.
Marxists generally reject this conceptual conflation of class and occupation and insist that these two concepts designate qualitatively distinct dimensions of the social organization of work. Occupation broadly designates the technical content of jobs; class designates the social relations of domination and appropria- tion within which those technical activities are performed.'3 To be sure, there are some spe- cific jobs within which this distinction col- lapses since the actual activities of the job are defined by these relational properties. This is the case, for example, with the occupation "foreman," which explicitly designates job ac- tivities of supervision. But, Marxists argue, this is not the case for most occupations. A carpenter, for example, could easily be a worker, a semiautonomous employee, a man- ager or a petty bourgeois artisan. In each of these cases the technical content of the job remains largely the same (transforming lumber into buildings or whatever), but the social rela- tional content changes.
If the claim that class and occupation are different dimensions of social structure is cor- rect, then we would expect many occupations to be relatively heterogeneous in terms of their internal class distributions. While a systematic association between class and occupation would still be predicted, it would be expected that a substantial part of the population would fall outside of the primary (modal) class within given occupations. As we see in Table 6, this is indeed the case. If we attempted to define an individual's class by the most frequent class within that individual's occupational category, we would misclassify nearly 45 percent of the people in the sample.'4 Even if we radically simplified the class model into a simple worker vs nonworker structure, and classified people into one or the other of these "classes" on the basis of their being in an occupational category with a majority of workers or nonworkers, we would still misclassify 29 percent of the sam- ple. Therefore, if one adopts the operationali- zation employed here, class cannot be viewed simply as clusters of occupations.
There are two likely objections to these in- terpretations of the results in Table 6. First, it could be argued that the deviations from a
13 Systems of occupational classification are rarely constructed with any coherent theoretical purposes in mind, and as a result there is often a great deal of sloppiness in what kinds of concrete jobs are lumped together under a common occupational rubric. The claim that occupational titles designate the location of a job within a technical division of labor, there- fore, is somewhat of an idealization.
14 This figure is based on a collapsed version of Table 6 in which all managers and supervisors are combined into a single managerial-supervisory cate- gory, and petty bourgeois, small employers, and capitalists are combined into a single self-employed category. The amount of misclassification will obvi- ously increase if we insist on more refined distinc- tions within these broad class locations.

720 AMERICAN SOCIOLOGICAL REVIEW
perfect class-occupation association are the result of the crudeness of the occupational classification scheme in the table. If a fine enough set of distinctions were introduced, class could be empirically treated as an aggre- gation of occupations. It is undoubtedly true that the association of class and occupation would be improved using more refined occu- pational categories. If we increase the number of occupational categories in the present data from 13 to 27, the proportion of the sample falling outside of the primary class for a given occupation does drop from 45 percent to 37 percent, and with finer distinctions this would probably be improved upon still more. Yet, even with a very refined set of occupational categories, the fit between class and occupa- tion would still be far from perfect. The occu- pational group (aside from foremen to farmers) which is most homogeneous in class terms- operatives-still has 17.5 percent of its mem- bers outside of the working class, and it seems unlikely that finer divisions among operatives would eliminate these discrepancies.'
A second objection should be that the class- occupation association in Table 6 ignores the career structure of certain occupations. It could be, for example, that all of the profes- sionals who are workers are young profession- als in the early stages of their careers who have not yet been promoted into positions of au- thority. As Stewart et al. (1980) argue, occu- pations should not be viewed as static "slots" filled by incumbents, but as trajectories with a systematic temporal dimension.'6 Viewed as trajectories, occupations would be much more homogeneous in class terms than appears in Table 6.
Eventually, we will directly explore the re- lationship between class and occupation in the actual career trajectories of the respondents in the sample using work history data. For the moment we will rely on simpler data to see if the objection is plausible. Table 7 indicates the proportion of respondents in each of the major occupational categories who are workers and managers-supervisors in different age groups. If the deviations from a pure class-occupation association are the result of the career structures of occupations, then within those occupations which have career structures we would expect to find a higher proportion of workers in younger age groups than in older age groups.
The results in Table 7 indicate that there are some age differences in the distributions of classes within occupations, but that they are not consistent or strong enough to account for the class heterogeneity of occupations. Among professional occupations, except for the very youngest and oldest categories, between 9 and 13 percent of each age group is in the working class, with no discernible trend. Among tech- nicians the proportion in managerial positions does rise with age, but the proportion who are workers does not systematically decline (the main shift coming out of semiautonomous lo- cations). Among craft occupations, the pro- portion who are workers is lowest in middle age categories and the proportion who are managers/supervisors rises with age, probably reflecting a combination of career effects and cohort effects. And among less skilled manual occupations there is no systematic pattern of class distributions by age at all. Overall, then, the data in this study support the conceptual claim that class and occupation are distinct dimensions of social relations. While there is an important association between the two, the former cannot be considered simply an aggre- gation of the latter.
The class content of occupations. Let us now shift our attention from the deviations in the class-occupation relationship to the pat- tern of associations. There is a long tradition in sociology of arguing over whether or not lower white-collar jobs should be considered in the working class or the "middle class." 17 Usually it is assumed in such debates that occupations as such can appropriately be grouped into classes, the issue being where a specific occu- pation ought to be located. As we have argued above, if classes are conceptualized in rela- tional terms, this is not even the correct way to pose the problem. Instead, the empirical ques- tion is the extent of proletarianization within different occupational categories.
Table 8 transforms the data in Table 6 into the "standardized residuals" of the occupation-class relationship. The entries in this table are calculated as follows: for each cell in the table the expected number of people is calculated on the assumption that there is no relationship at all between class and occupa- tion (i.e, that they are completely indepen- dent). This number is then subtracted from the actual number of observations in the cell. This
15 See Griffin and Kalleberg (1981) for evidence showing that regardless of the detail of census occu- pational titles, they are incapable of being indicators of class.
16 A similar argument for classes is made by Ber- teaux (1977).
17 Recent examples of this debate are Vanneman (1977), who argues on the basis of lifestyle and asso- ciational data that lower white-collar occupations are typically working class, and Gagliani (1981), who insists that because of more pleasant working condi- tions and general status such position should be considered outside of the working class.

THE AMERICAN CLASS STRUCTURE 721
Table 7. Class Distributions within Occupational Categories by Age Groups
Age Group Occupational Under 65 & Category 25 25-34 35-44 45-54 55-64 Over Professionals
% who are workers 23.5 11.4 9.4 11.9 12.5 (19.8)8 % who are managers/supervisors 45.5 52.1 61.6 52.7 56.2 (0.0)
Technicians % who are workers 33.1 20.4 (29.8) (9.9) (27.8) % who are managers/supervisors 20.2 49.9 (65.8) (81.2) (44.5)
Teachers % who are workers (0.0) 2.7 (10.3) (19.1) (21.3) % who are managers/supervisors (25.6) 27.4 (38.4) (16.6) (28.9)
Managers & officials % who are workers 0.0 4.9 1.6 12.4 0.0 (12.3) % who are managers/supervisors 75.7 53.6 66.9 41.3 58.2 (7.3)
Clerks % who are workers 68.6 72.3 57.9 66.9 63.6 63.3 % who are managers/supervisors 23.5 23.1 27.4 22.9 30.0 16.9
Sales % who are workers 38.1 27.9 54.4 31.5 67.4 (75.6) % who are managers/supervisors 23.8 0.0 3.4 36.7 0.0 (24.4)
Crafts % who are workers 39.9 56.4 23.9 49.4 57.9 (100.0) % who are managers/supervisors 29.8 27.8 35.2 25.5 16.6 (0)
Foreman % who are workers (14.4) (0) (0) 0 (0) % who are managers/supervisors (85.6) (72.3) (100.0) 100.0 (100.0)
Crafts & foremen combined % who are workers 37.7 51.6 19.3 35.4 47.6 (100.0) % who are managers/supervisors 34.6 31.5 47.7 46.6 31.5 (0)
Operatives & transportation % who are workers 82.9 74.-2 86.9 85.8 82.5 100.0 % who are managers/supervisors 13.9 17.8 9.8 6.0 12.9 0.0
Laborers % who are workers 68.1 79.4 (40.6) 93.2 (47.0) (100.0) % who are managers/supervisors 25.8 4.4 (0.0) 0.0 (14.8) (0.0)
Skilled services % who are workers 42.0 19.8 34.8 (49.9) (53.6) (62.3) % who are managers/supervisors 48.5 67.3 19.2 (35.2) (28.0) (37.7)
Unskilled services % who are workers 68.5 73.8 67.6 72.3 73.0 28.6 % who are managers/supervisors 15.3 11.1 22.1 9.2 5.5 28.8
Farmers. % who are managers/supervisors (33.3) (0.0) (0.0) (0.0) (0.0) (0.0) a Percentages in parentheses are for age groups with a sample size of less than 10.
difference would be zero if in fact there was no association. The difference between observed and expected frequencies-the "residuals"-is then divided by the square root of the expected frequency in order to standardize the devia- tions. This makes possible both comparisons across cells of the table and formal tests of statistical significance (on the assumption that such standardized residuals are distributed normally).
The data in Table 8 indicate that there are four occupational categories which have a sig- nificantly disproportionate representation of workers within them: operatives, unskilled services, laborers, and clericals. With the ex- ception of laborers, these occupational groups
are also significantly underrepresented among managers (the test statistics fall just below the .05 level of significance for laborers). Six other occupational groups have significant underrep- resentations of workers: managers, techni- cians, teachers, professionals, farmers, and foremen. The remaining occupations- salespersons, crafts, and skilled services- have proportions of working-class positions within them that do not differ significantly from the sample as a whole.
These data, therefore, add considerable sup- port to the claim that lower level white-collar jobs have a working-class character. Clerical occupations have class profiles that are much closer to those of manual operatives and la-

722 AMERICAN SOCIOLOGICAL REVIEW
Table 8. Standardized Residuals for Occupation-Class Associationa
Class Categories Occupational Advisors Semi- Self- Categories Managers Managers Supervisors Autonomous Workers Employed Professionals 2.45* 5.07* 1.54 4.16* -6.43* .13 Technicians .93 1.32 .99 2.40* -2.17* -1.12 Teachers .18 -.50 -1.63 11.98* -3.71* -2.55* Managers & officials 10.02* .19 -1.42 -3.15* -8.45* 7.74* Clerks -4.16* - 1.99* 1.58 -3.32* 6.58* -4.10* Sales -1.59 1.12 -2.85* 2.33* -.24 2.03* Crafts - 1.99* .17 .74 1.15 .66 -.87 Foremen 2.55* 1.46 4.59* -1.11 -2.94* - 1.97* Operatives & transport -4.40* -2.45* -1.41 -4.12* 8.59* - 3.41* Laborers -1.84 -.85 -1.22 -1.33 2.76* .11 Skilled services .78 -1.54 2.50* -.32 -.83 -.60 Unskilled services -2.50* -1.31 -1.90 -1.72 4.04* -.09 Farmers -1.60 .15 -1.51 -1.37 -2.62* 8.45* G2 = 895 with 60 D.F.
a Entries are the standardized residuals in the loglinear model of independence for the class by occupation association. A positive entry indicates that there are more than the expected number of people in the cell under the assumption that there is no association between class and occupation; a negative entry indicates that there are fewer than the expected number of people.
* Significant at the .05 level. Given the assumptions of loglinear models, the residuals (O - E) have an asymptotic normal distribution with standard errors equal to the square root of E. Thus the standardized residuals [(O - E) / VE] are significant at the .05 level if their absolute value is greater than or equal to 1.96.
borers than to higher status white-collar posi- tions. Indeed, in terms of the proportion of working-class positions within the occu- pational category, clerical occupations are clearly more working class than are skilled manual occupations (crafts). This, it must be emphasized, is not a question of the incomes of incumbents of these positions, but of the social relations which characterize the actual jobs.
Class and Sex
In recent years considerable research has been devoted to understanding various aspects of the relationship between gender divisions and the labor market. Most of this work, however, has focused primarily on the problems of occu- pational segregation, status attainment and in- come inequality by sex. Relatively little di- rectly or indirectly deals with the problems of class differences by sex.'8 Our data enables us
to address this aspect of sexual stratification systematically.
Table 9 presents the distribution of class po- sitions for men and women taken separately. These data clearly indicate that women are more proletarianized than men: 54 percent of all women in the labor force occupy working class locations, compared to only 40 percent for men. If women were a small part of the labor force, this would not be such an impor- tant figure, but given that women's labor force participation rates are well over 40 percent, this higher level of female proletarianization in fact means that the majority of the working class in the United States consists of women (53.6 percent). It is worth noting in this con- text that if the manual/nonmanual distinction is used as the basis for defining the working class, this picture is radically different: only 32.7 per-
Table 9. Class Distributions by Sex
Class Categories Men Women
Managers-supervisors 35.0Wo 23.4% Managers 15.5 8.6 Advisors-managers 5.3 3.6 Supervisors 14.2 11.2
Semiautonomous employees 9.1 9.9
Workers 39.6 54.0 Self-employed 16.4 12.5
Petty bourgeoisie 6.3 7.4 Small employers 7.4 4.3 Capitalists 2.7 0.8
Total 100.0 100.0 N 809 685
18 Some of the relevant recent work on sex and occupational status includes Sewell et al. (1980), Featherman and Hauser (1976), and Treiman and Terrell (1975). Among the few studies which deal empirically with the problem of sex and authority (or power), and thus touch on questions of class, are Wolf and Fligstein (1979a, 1979b) and Robinson and Kelly (1979). The Marxist and Marxist-Feminist lit- erature on these issues has tended to be more preoc- cupied with theoretical issues than with systematic empirical investigation, although some empirical re- search is now being done. Some Marxist-Feminist discussions of sex and work include Beechey (1978), Barron and Norris (1976), West (1978), and Hartman (1979).

THE AMERICAN CLASS STRUCTURE 723
cent of workers are women in conventional sociological definitions, compared to 54 per- cent for the Marxist definition adopted in this research.
While women are overrepresented within the working class, they are underrepresented in all categories of managers and supervisors: 35 percent of all men are some kind of manager or supervisor, compared to only 23 percent of women. Furthermore, this underrepresenta- tion is greatest among full-fledged managers. If we calculate the ratio of the percentage of men who are in a given category to the percentage of women, we find that supervisors are over- represented among men relative to women by a ratio of 1.26, advisor-managers by 1.47, and proper managers by 1.80. If we further divide the managerial category into subcategories based on the kinds of decisions made by man- agers, we find that the overrepresentation of men increases to 2.25 for core managers (man- agers involved in investment and budgetary decisions).
The most striking underrepresentation of women is in the capitalist class. While women and men are almost equally represented among petty bourgeois producers, among employers of over 10 employees, men are nearly 3.4 times overrepresented relative to women.'9
It might be thought that this higher level of proletarianization of women relative to men and the consistent underrepresentation within managerial locations is the result of occu- pational choices by women (or occupational segregation): women end up in occupations with more workers and fewer managers, and this explains their class composition. Table 10 indicates that this is not a plausible explana- tion. In virtually every occupational category, women are considerably more proletarianized than men: 22 percent of women professionals are workers, compared to only 7 percent of men; 35 percent of women technicians are workers, compared to only 16 percent of men; 53 percent of women salespeople are workers, compared to 35 percent of men. Even in blue- collar occupations within which men are also highly proletarianized, the level of pro- letarianization is generally higher for women: over 90 percent of women operatives are workers, compared to just over 77 percent of men operatives. The only significant deviation from this pattern is for laborers, but the number of women in this category is so low that the results could be due simply to chance. Women are thus not more concentrated in the
Table 10. Occupational Proletarianization by Sex
Occupational % Who Are Workers Categories Men (N) Women (N) Professionals 7.1 (88) 22.0 (55) Technicians 16.3 (25) 35.4 (18) Teachers 4.8 (14) 8.1 (37) Managers 4.3 (121) 6.0 (53) Clerks 64.0 (38) 67.0 (241) Salespeople 34.8 (46) 53.4 (42) Foremen 1.9 (26) 0.0 (3) Crafts 47.2 (159) 44.4 (4) Operatives & transport 77.1 (140) 91.3 (84) Laborers 74.0 (54) 59.9 (17) Skilled services 36.1 (44) 37.7 (35) Unskilled services 69.9 (33) 63.7 (90) Farmers 0 (19) 0 (3)
Total 39.5 (807) 53.9 (683)
Note: Weighted N for the sex-occupation cate- gory.
working class then men primarily because of their occupational distributions, but because within given occupational settings they are differentially allocated to and kept in the working class.
While it is beyond the scope of this paper to analyze in any depth the actual process by which men and women are sorted into classes, we can get a first glimpse at the process by looking at the class distributions for men and women within age groups. As Table 11 indi- cates, the proportion of women who are working class varies relatively little across age groups. Excluding the oldest age group, the range is from 51 percent for women 25-34 to 59 percent for women 55-64. Among men, on the other hand, the proportion who are in the working class initially drops sharply, from 48 percent in the youngest age group to 25 percent in the 35-44 year old category, and then rises again to around 40 percent in the 45-54 and 55-64 age groups, and 63 percent for men over 65. What this suggests is that there are much higher rates of promotional mobility for men than for women out of working-class positions into managerial-supervisory positions during the first parts of careers. Of course, the pat- terns observed in Table 10 are a complex result of career patterns and structural changes in the class structure over time, and eventually we will try to disaggregate these two processes through an analysis of occupation and class work history data. But at least provisionally it seems that a substantial element in the dif- ferences between the class distributions of men and women centers on the processes of pro- motional mobility out of the working class.20 '9 It is conceivable that the sample restrictions in
the survey which exclude pure renters (e.g., a widowed stockholder living off dividends) may have exacerbated this disproportion.
20 Throughout this analysis we have treated indi- viduals as the incumbents of class positions. For

724 AMERICAN SOCIOLOGICAL REVIEW
Table 1. Distribution of Workers and Managers within Age-Sex Categories
% of Men and Women who are Workers Managers N
Age Groups Men Women Men Women Men Women Under 25 years 48.1 56.3 12.5 9.3 152 122 25-34 38.3 51.2 16.6 11.1 237 173 35-44 24.5 54.3 19.6 7.2 151 135 45-54 43.5 55.0 15.6 5.8 142 109 55-64 41.8 58.8 13.2 7.7 83 91 65 and over 62.5 44.1 2.1 15.8 31 36
Class and Race
Because of limitations in the sample size in this project it is not possible to explore questions of the relationship between class and race in great detail. Nevertheless, we can learn something on examination of the class by race cross- classification in Table 12.
While the overall pattern of class-race dis- tributions is similar to the class-sex patterns, the degree of racial differences in proletariani- zation is even greater than sex differences: 64 percent of all blacks are in the working class, compared to only 44 percent of whites (the sex differences were 54 percent vs 40 percent); only 7 percent of blacks are proper managers, compared to 14 percent of whites; and perhaps most striking of all, only 2.4 percent of blacks are petty bourgeois or employers, compared to 16 percent of whites.
If we examine the combined race-sex-class distributions, we see that black women are the most proletarianized of all: 65 percent of black women in the labor force are in the working class, compared to 64 percent for black men, 52 percent for white women, and only 38 per- cent for white men. In terms of managers, black men and white women have essentially the same proportions (8.0% and 9.4%), consid- erably higher than black women (6.1%) and lower than white men (17.0%).
Taking all of these data together we can make two strong conclusions. First of all, white males are, in class terms, a highly privileged category. Over 20 percent of all white men are either full-fledged managers or capitalists (employers of ten or more workers), that is, in class locations which are either
firmly part of the dominant class or within which the dominant class represents the prin- ciple element. This compares to 10 percent of white women, 8 percent of black men and only 6 percent of black women. If we include all positions within which the bourgeois element is present (i.e., all managers-supervisors, small employers, and capitalists), we see that nearly half (46.5%) of white males are in class loca- tions either fully or partially in the bourgeoisie, compared to only 30 percent of white women, 23.3 percent of black men, and 18.5 percent of black women.
Secondly, the American working class is predominantly composed of women and minorities. Over 60 percent of all working- class positions are filled by women and non- whites. If we add young white males-nen under 25 years of age-we find that about 70 percent of the U.S. working class is composed of women, minorities, and youth. The traditional image of the American worker as a white, male industrial worker is thus far from representative of the working class in the United States today.
CONCLUSION This paper has largely focused on elaborating the basic descriptive map of the American class structure viewed from a particular Marx- ist perspective. Several general features of this structure stand out:
1. The working class is the largest class within this structure of class relations, both in terms of proportion of workers as such in the labor force and in terms of the weight of the working class within various contradictory class locations.
2. Close to half of the locations within the class structure have a "contradictory charac- ter," that is, their class content is determined simultaneously by more than one basic class. The American class structure cannot plausibly be represented by a simple scheme of polarized class relations.
3. While the working class is disproportion- ately composed of relatively unskilled manual occupations, lower status white-collar occu- pations are also heavily proletarianized. In- deed, if one chooses to use occupations as the
certain purposes it may also make sense to treat families as such as the basic units of class. This would lead us to investigate the ways in which families are inserted into the system of production relations, thus opening up the possibilities of families as such being inserted in contradictory ways (when spouses participate in capitalist production in dif- ferent class positions). This has important implica- tions for analyzing the class structure for women. Since we do have data on the class of both spouses in families, we will eventually be able to analyze the problem of the location of families within the class structure.

THE AMERICAN CLASS STRUCTURE 725
Table 12. Class Distributions with Race-Sex Categories
Class White Black White Black Categories Whites Blacksa Males Males Females Females
Managers and supervisors 30.4% 20.0% 35.3% 23.3% 24.4% 17.2% Managers 13.6 7.0 17.0 8.0 9.4 6.1 Advisors-managers 4.8 1.3 5.4 1.8 4.1 0.8 Supervisors 12.0 11.7 12.9 13.5 10.9 10.3
Semiautonomous employees 9.5 13.6 9.7 9.4 9.3 16.4 Workers 43.9 64.0 37.5 63.6 51.9 65.0 Self-employed 16.1 2.4 17.6 3.6 14.4 1.3
Petty bourgeoisie 7.4 1.7 6.4 3.6 8.8 0.0 Employers & capitalists 8.7 0.7 11.2 0.0 5.6 1.3 a Other minorities have been excluded from this table (23 women and 36 men).
basis for assigning classes to individuals, fewer classification errors will be made by placing skilled manual occupations outside of the working class and lower status nonmanual jobs in the working class than vice versa.
4. The degree of proletarianization varies significantly across race-sex categories. In particular, the level of proletarianization is dramatically lower for white males than for women and blacks. As a result, a majority of the working class is composed of women and minorities.
These descriptions are important, but they are obviously only the first step in more com- prehensive- analysis. Future work will extend the analysis in two principal directions: First, the research will compare the results discussed here with parallel data from several other
countries. This will enable us to see the extent to which these patterns are general to ad- vanced capitalism or specific to the historical forms of development of American capitalism. Second, the research will link these mac- roanalyses to investigations of individual-level outcomes of various sorts (attitudes, political behavior, income, etc.). Ultimately we are not so much interested in studying class structures simply for their own sake, but because we feel class is a systematic determinant of macro-and microsocial outcomes.
REFERENCES
Barron, D. and G. M. Norris 1976 "Sexual divisions and the dual labor
market." Pp. 47-69 in Diana Leonard Barker and Sheila Allen (eds.), Dependence
APPENDIX THE FULL MANAGERIAL LOCATION VARIABLE
The full manageriallocation variablewhichwas thencollapsed in various waysfordifferentversions ofthe class typology was constructed as follows:
DECISION- INTERPRETATION MANAGERIAL MAKING FORMAL OF THE
LOCATION PARTICIPATION AUTHORITY HIERARCHY CATEGORY
I Direct Sanction or task In hierarchy Manager on all criteria 2 Nonmanagement Manager not in hierarchy 3 None In hierarchy Manager without authority 4 " " Nonmanagement Decision maker without
authority and outside of hierarchy
5 Advice only Sanction or task In hierarchy Advisor-manager on all criteria
6 " " Nonmanagement Adv-mgr not in hierarchy 7 " None In hierarchy Adv-mgr without authority 8 " " Nonmanagement Advisor without authority
and outside of hierarchy 9 None Sanction In hierarchy Supervisor: sanctions
10 " Task only In hierarchy Supervisor: tasks 11 Nominal In hierarchy Nominally in hierarchy 12 Sanctions Nonmanagement Supervisor: sanctions but
outside hierarchy 13 Tasks only Nonmanagement Task supervision outside of
hierarchy 14 None In hierarchy No subordinates at all but in
hierarchy 15 Nonmanagement Nonmanager/supervisor on
all criteria

726 AMERICAN SOCIOLOGICAL REVIEW
and Exploitation in Work and Marriage. New York: Longman.
Beechey, Veronica 1978 "Women and production: a critical analysis
of some sociological theories of women's work." Pp. 155-97 in Annette Kuhn and Ann Marie Wolpe (eds.), Feminism and Materialism. London: Routledge & Kegan Paul.
Berteaux, Daniel 1977 Destins Personnels et Structures de Classe.
Paris: Presse Universitaire de France. Braverman, Harry
1973 Labor and Monopoly Capital: The De- gradation of Work in the Twentieth Cen- tury. New York: Monthly Review Press.
Breiger, Ronald 1981 "The social class structure of occupational
mobility." American Journal of Sociology 87:578-611.
Featherman, David and Robert Hauser 1976 "Sexual inequalities and socioeconomic
achievement in the U.S., 1962-1973." American Sociological Review 41:462-83.
Gagliani, Giorgio 1981 "How many working classes?" American
Journal of Sociology 87:259-85. Griffin, Larry J. and Arne Kalleberg
1981 "Stratification and meritocracy in the United States: class and occupational re- cruitment patterns." British Journal of Sociology 32:1-38.
Groves, Robert M. 1979 "An empirical comparison of two telephone
sample designs." Journal of Marketing Re- search 15:622-31.
Hartman, Heidi 1979 "Capitalism, patriarchy and job segregation
by sex." Pp. 206-47 in Zillah R. Eisenstein (ed.), Capitalist Patriarchy and the Case for Socialist Feminism. New York: Monthly Review Press.
Hunter, Alfred 1979 "Studies of class, power and status." Pp.
59-86 in J. E. Curtis and W. G. Scott (eds.), Social Stratification: Canada, 2nd ed. Scar- borough: Prentice Hall of Canada.
Kahl, Joseph A. 1957 The American Class Structure. New York:
Holt, Rinehart & Winston. Loren, Charles
1977 Classes in the United States. Davis, CA: Cardinal Publishers.
Przeworski, Adam, Barnett R. Rubin and Ernest Underhill
1980 "Evaluation of the class structure of France, 1901-1968." Economic Develop- ment and Cultural Change 28:725-52.
Robinson, Robert V. and Jonathan Kelly 1979 "Class as conceived by Marx and Dahren-
dorf: effects on income inequality and poli- tics in the United States and Great Britain." American Sociological Review 44:38-58.
Roemer, John 1982 "New directions in the Marxist theory of
class and exploitation." Politics and Soci- ety, forthcoming.
Sewell, William H., Robert Hauser and Wendy Wolf
1980 "Sex, schooling and occupational status." American Journal of Sociology 86:551-83.
Stewart, Andrew, K. Prandy and R. M. Blackburn 1980 Social Stratification and Occupations. Lon-
don: MacMillan. Szymanski, Albert
1972 "Trends in the U.S. class structure." So- cialist Revolution #10:101-22.
Therborn, Goran 1972 "Klasserna i Sverige 1930-1980." In Zenit,
no. 28. 1981 Klasstrukturen i Sverige 1930-1980. Lund:
Zenit forlag. Treiman, Donald J., and Kermit Terrell
1975 "Sex and the process of status attainment: a comparison of working women and men." American Sociological Review 40:174-200.
Vanneman, Reeve 1977 "The occupational composition of Ameri-
can classes." American Journal of Sociol- ogy 82:783-808.
West, Jessica 1978 "Women, sex and class." Pp. 220-58 in
Annette Kuhn and Ann Marie Wolpe (eds.), Feminism and Materialism. London: Rout- ledge & Kegan Paul.
Westergaard, John and Henrietta Resler 1975 Class in a Capitalist Society. Har-
mondsworth: Penguin. Wolf, Wendy and Neil Fligstein
1979a "Sex and authority in the workplace: the causes of sexual inequality." American Sociological Review 44:235-52.
1979b "Sexual stratification: differences in power in the work setting." Social Forces 58:94- 107.
Wright, Erik Olin 1976 "Class boundaries in advanced capitalist
societies." New Left Review 98:3-41. 1978 Class, Crisis and the State. London: New
Left Books. 1979 Class Structure and Income Determination.
New York: Academic Press. 1980a "Varieties of Marxist conceptions of class
structure." Politics and Society 9:323-70. 1980b "Class and occupation." Theory and Soci-
ety 9:177-214. 1982a "The status of the political in the concept of
class." Politics and Society, forthcoming. 1982b "Capitalism's futures." Socialist Review,
forthcoming. 1982c "The comparative project on class structure
and class consciousness: an overview." Comparative Project on Class Structure and Class Consciousness Working Paper Series, #1. Department of Sociology, University of Wisconsin-Madison.
1982d "The questionnaire on class structure, class biography and class consciousness." Com- parative Project on Class Structure and Class Consciousness Working Paper Series, #2. Department of Sociology, University of Wisconsin-Madison.
Wright, Erik Olin and Joachim Singelmann 1982 "Proletarianization in the American class
structure." Available as Discussion Paper from the Institute for Research on Poverty. American Journal of Sociology, forthcom- ing.