american thoracic societv · american thoracic societv ... the diagnostic approach to acute deep...
TRANSCRIPT
American Thoracic SocietvMEDICAL SECTION OF THE AMERICAN LUNG ASSOCIATiON
The Diagnostic Approach to AcuteVenous ThromboembolismClinical Practice GuidelineTI~IS O~I.I(.IAI SIAII.MI.N I OF II~I: AMLIIICAN TIIOKAUC. SO~YLIY WA S AI~~I.EI~ HY THE A T S BOARI) ok DIKI~(.IOKS. FI~BKLIAKY 1009
CONTENTS
IntroductionThe Diagnostic Approach to Acute Deep Venous Thrombosis
BackgroundSymptoms and SignsContrast VenographyImpedance Plcthysmography
BackgroundPhysiology and TechniyueLimitations of lmpedancc PlethysmographyEarly Clinical Trials: Establishing Accuracy in
Symptomatic Acute Proximal DVTManagement Studies: Early Success and Later QuestionsImpedance Plethysmography in Asymptomatic PatientsRecurrent and Chronic Deep Venous Thrombosis
Compression IJltrasound with Venous ImagingBackgroundTechniqueLimitations of Compression Ultrasound with
Venous ImagingSymptomatic Acute Proximal Deep Venous ThrombosisAsymptomatic Acute Proximal Deep Venous ThrombosisAcute Calf Deep Venous ThrombosisRecurrent and Chronic Deep Venous ThrombosisIJppcr Extremity Deep Venous Thrombosis
Magnetic Resonance ImagingThe Diagnostic Approach to Acute Pulmonary Embolism
BackgroundSymptoms and SignsElectrocardiographyArterial Blood Gas AnalysisChest RadiographyD-DimerThe VentilationPerfusion Scan
The Effect of Prior Cardiopulmonary DiseaseThe Perfusion Scan AloneThe Nondiagnostic Ventilation-Perfusion Scan: Use of
Lower Extremity StudiesPulmonary AngiographySpiral (Helical) Computed TomographyMagnetic Resonance ImagingEchocardiography
The Diagnostic Approach to Acute Venous Thromboembo-lism: Final Summary and Recommendations
The Diagnostic Approach to Acute Pulmonary Embolism:Final Summary and Recommendations
The FutureReferences
Am J Respir Crit Care Med Vol 160. pp 1043-1066, 1999Internet address: www.atsjournals.org
INTRODUCTION
Venous thromboembolism (VTE) represents a spectrum ofdisease that includes both deep venous thrombosis (DVT) andpulmonary embolism (PE). Pulmonary embolism most com-monly results from DVT occurring in the deep veins of thelower extremities, proximal to and including the popliteal veins.Both DVT and PE are frequently clinically unsuspected, lead-ing to significant diagnostic and therapeutic delays and ac-counting for substantial morbidity and mortality. While thereare as many as 260,000 patients in the IJnitcd States in whomVTE is diagnosed and treated each year, more than half of thecases that actually occur are never diagnosed and as many as600,000 cases may therefore occur (1). Because of the magni-tude of the problem, and the variable diagnostic approachesthat are feasible, this official statement outlining acceptablediagnostic approaches to VTE is presented. The treatment ofacute VTE will not bc addressed.
To present a coherent position on the diagnostic approachto VTE, clinical trials evaluating the diagnostic approach toDVT and PE have been reviewed and are categorized as level1 or level 2 (2). Level 1 studies are those that incorporate thefollowing three criteria: (I) previous establishment of objec-tive diagnostic criteria for normal and abnormal diagnosticstudies, (2) independent comparison of the diagnostic resultwith contrast venography (CV) for DVT or with pulmonaryangiography for PE, with readers blinded to the other test re-sult, and (3) the prospective evaluation of patients who wereenrolled consecutively. A clinical trial was accepted as enroll-ing consecutive patients only if this was explicitly stated or ifthe study stated that patients were excluded only if they re-fused consent or could not tolerate the diagnostic procedure.Other clinical trials were considered to be level 2. It should beemphasized that CV and pulmonary angiography have beenestablished as gold standard diagnostic tests by default, so thatwhen other modalities are evaluated, this a priori assumptionexists (3). Relatively more data are presented for impedanceplethysmography (IPG) and for ultrasound (US) imaging thanfor other diagnostic modalities because the data involvingthese technologies are more extensive and complex. Morelevel I data exist for these techniques than for newer technol-ogy such as spiral computed tomography (CT) scanning ormagnetic resonance imaging (MRI). For DVT and PE, back-ground information is presented, followed by a discussion ofthe clinical diagnosis. Subseyuently, each diagnostic techniqueis addressed. Final guidelines are ultimately presented for thediagnostic approach to both DVT and PE. The recommenda-tions of the American Thoracic Society Clinical Practice Com-mittee (4) were reviewed as this statement was developed andour goal was to adhere to these guidelines. The committeepreparing this document was multidisciplinary, as recom-mended. Because different medical ccntcrs have differentresources, clinical flexibility was built into the recommenda-
1044 AMERICAN JOURNAL OF RESPIRATORY AND CRITICAL CARE MEDICINE VOL 160 1999
tions. The latter concept is of particular importance in the di-agnostic approach to venous thromboembolism because al-though level 1 studies have been performed at some medicalcenters, validated protocols or the specific technology is notavailable everywhere and the resulting data may not be appli-cable at other centers.
THE DlAGNOSTlC APPROACH TO ACUTEDEEP VENOUS THROMBOSIS
Background
The clinical diagnosis of DVT of the lower extremities cannotbc cstablishcd with certainty without objective testing. Con-trast vcnography is invasive, requires contrast media, and is nolonger appropriate as the initial diagnostic test for the evalua-tion of symptoms that suggest acute DVT. The proven utilityof noninvasive technology, including IPG and compressionUS. as well as increasing experience with MRI, have renderedCV much less popular. Nonetheless, venography remains thegold standard test. The availability of and familiarity with cer-tain technology may influence the diagnostic approach. Thespecific clinical scenario impacts on the diagnostic algorithmthat is chosen. For example, while IPG and US are reliable forthe diagnosis of symptomatic proximal DVT (involving thepopliteal and/or more proximal veins), they are much less reli-able for recognizing asymptomatic DVT. The sensitivity ofcertain diagnostic tests is influenced by thrombus location.Thrombi located between and including the popliteal and theiliac veins are the casicst to locate, and those above the iliacveins and in the calf veins are more elusive. The diagnosis ofrecurrent DVT remains a challenge. The D-dimer test hasbeen evaluated in the setting of both acute DVT and acute PEand is discussed in the section, Tm DIAGN~YIK APPROAC.H TO
Ac~lnr PIILMONAKY EMHOLISM. below. Currently available di-agnostic modalities are reviewed. followed by recommenda-tions for their USC. Diagnostic algorithms are then presented.The following clinical scenarios are considered in the contextof each diagnostic test: (I) symptomatic proximal DVT, (2)asymptomatic proximal DVT, (.?) calf DVT, (4) recurrent andchronic lower extremity DVT, and (5) upper extremity venousthrombosis.
Symptoms and Signs
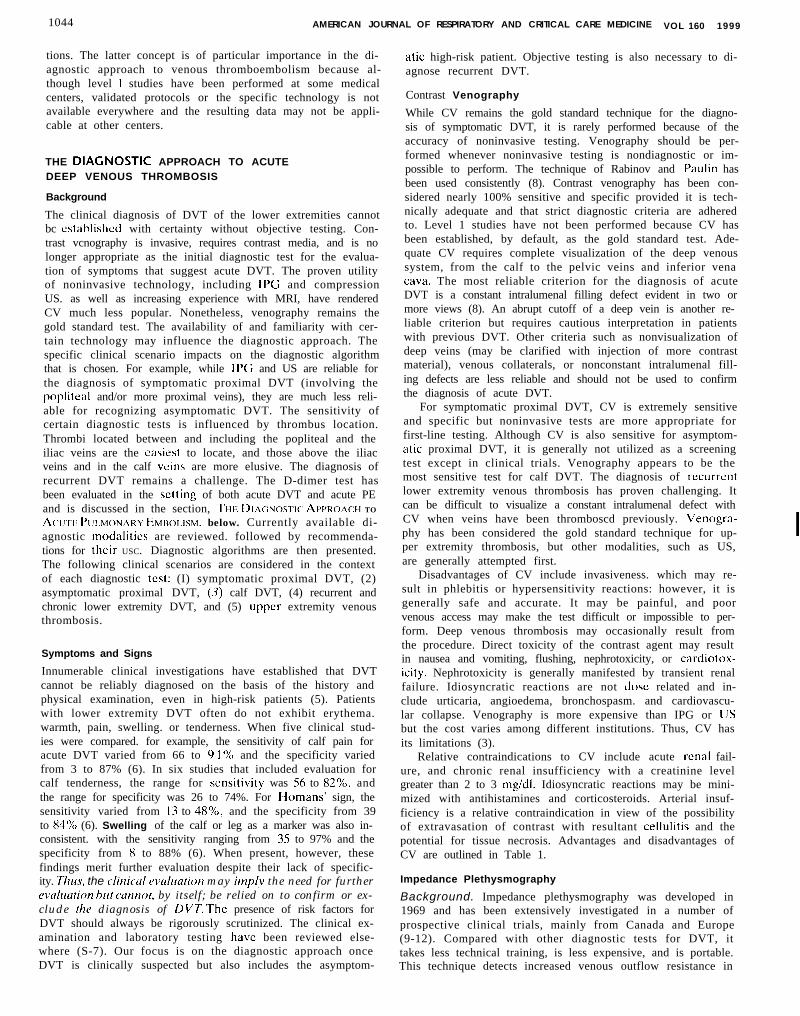
Innumerable clinical investigations have established that DVTcannot be reliably diagnosed on the basis of the history andphysical examination, even in high-risk patients (5). Patientswith lower extremity DVT often do not exhibit erythema.warmth, pain, swelling. or tenderness. When five clinical stud-ies were compared. for example, the sensitivity of calf pain foracute DVT varied from 66 to 0 1% and the specificity variedfrom 3 to 87% (6). In six studies that included evaluation forcalf tenderness, the range for sensitivity was 56 to 82%, andthe range for specificity was 26 to 74%. For Homans’ sign, thesensitivity varied from 13 to 48%, and the specificity from 39to 84% (6). Swelling of the calf or leg as a marker was also in-consistent. with the sensitivity ranging from 35 to 97% and thespecificity from X to 88% (6). When present, however, thesefindings merit further evaluation despite their lack of specific-ity. Tl~lrs, the clitliccrl evalurrtion may imp1.v the need for furtherevnlllution hul cutmot, by itself; be relied on to confirm or ex-clude the diagnosis of DVT. The presence of risk factors forDVT should always be rigorously scrutinized. The clinical ex-amination and laboratory testing have been reviewed else-where (S-7). Our focus is on the diagnostic approach onceDVT is clinically suspected but also includes the asymptom-
atic high-risk patient. Objective testing is also necessary to di-agnose recurrent DVT.
Contrast Venography
While CV remains the gold standard technique for the diagno-sis of symptomatic DVT, it is rarely performed because of theaccuracy of noninvasive testing. Venography should be per-formed whenever noninvasive testing is nondiagnostic or im-possible to perform. The technique of Rabinov and Pauhn hasbeen used consistently (8). Contrast venography has been con-sidered nearly 100% sensitive and specific provided it is tech-nically adequate and that strict diagnostic criteria are adheredto. Level 1 studies have not been performed because CV hasbeen established, by default, as the gold standard test. Ade-quate CV requires complete visualization of the deep venoussystem, from the calf to the pelvic veins and inferior venacava. The most reliable criterion for the diagnosis of acuteDVT is a constant intralumenal filling defect evident in two ormore views (8). An abrupt cutoff of a deep vein is another re-liable criterion but requires cautious interpretation in patientswith previous DVT. Other criteria such as nonvisualization ofdeep veins (may be clarified with injection of more contrastmaterial), venous collaterals, or nonconstant intralumenal fill-ing defects are less reliable and should not be used to confirmthe diagnosis of acute DVT.
For symptomatic proximal DVT, CV is extremely sensitiveand specific but noninvasive tests are more appropriate forfirst-line testing. Although CV is also sensitive for asymptom-atic proximal DVT, it is generally not utilized as a screeningtest except in clinical trials. Venography appears to be themost sensitive test for calf DVT. The diagnosis of recurrentlower extremity venous thrombosis has proven challenging. Itcan be difficult to visualize a constant intralumenal defect withCV when veins have been thromboscd previously. Venogra-phy has been considered the gold standard technique for up-per extremity thrombosis, but other modalities, such as US,are generally attempted first.
Disadvantages of CV include invasiveness. which may re-sult in phlebitis or hypersensitivity reactions: however, it isgenerally safe and accurate. It may be painful, and poorvenous access may make the test difficult or impossible to per-form. Deep venous thrombosis may occasionally result fromthe procedure. Direct toxicity of the contrast agent may resultin nausea and vomiting, flushing, nephrotoxicity, or cardiotox-icity. Nephrotoxicity is generally manifested by transient renalfailure. Idiosyncratic reactions are not dose related and in-clude urticaria, angioedema, bronchospasm. and cardiovascu-lar collapse. Venography is more expensive than IPG or LJSbut the cost varies among different institutions. Thus, CV hasits limitations (3).
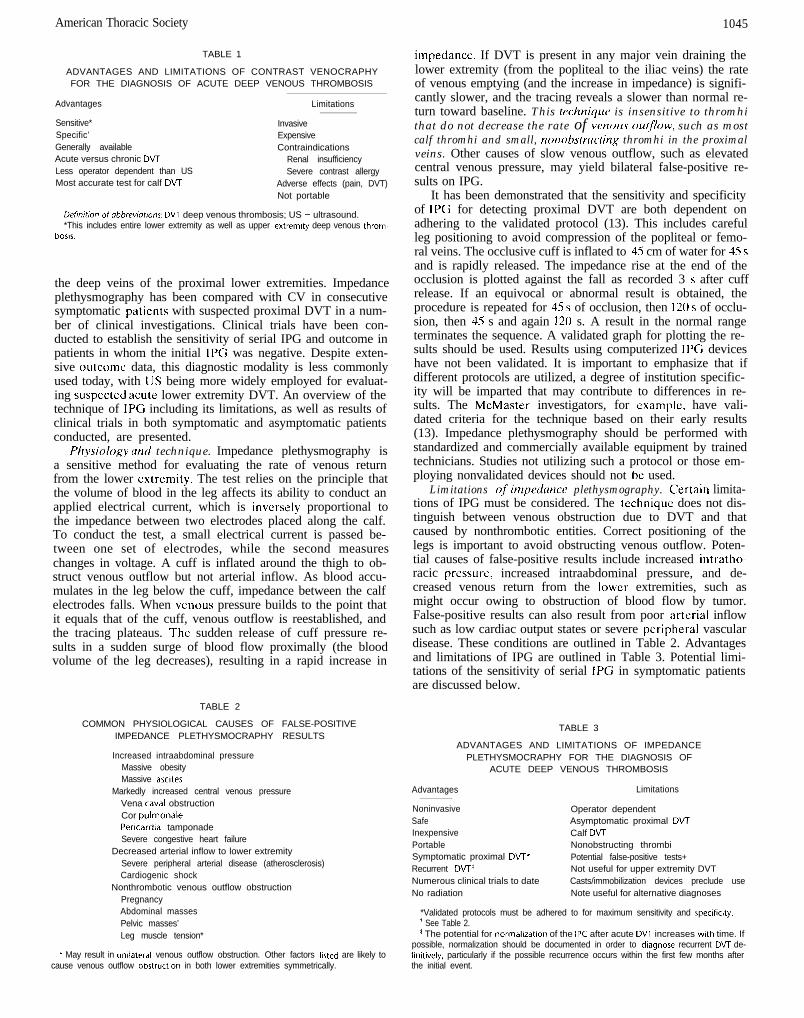
Relative contraindications to CV include acute renal fail-ure, and chronic renal insufficiency with a creatinine levelgreater than 2 to 3 mgidl. Idiosyncratic reactions may be mini-mized with antihistamines and corticosteroids. Arterial insuf-ficiency is a relative contraindication in view of the possibilityof extravasation of contrast with resultant cellulitis and thepotential for tissue necrosis. Advantages and disadvantages ofCV are outlined in Table 1.
Impedance Plethysmography
Background. Impedance plethysmography was developed in1969 and has been extensively investigated in a number ofprospective clinical trials, mainly from Canada and Europe(9-12). Compared with other diagnostic tests for DVT, ittakes less technical training, is less expensive, and is portable.This technique detects increased venous outflow resistance in
American Thoracic Society 1045
TABLE 1
ADVANTAGES AND LIMITATIONS OF CONTRAST VENOCRAPHYFOR THE DIAGNOSIS OF ACUTE DEEP VENOUS THROMBOSIS
Advantages
Sensitive*Specific’Generally availableAcute versus chronic DVTLess operator dependent than USMost accurate test for calf DVT
Limitations
InvasiveExpensiveContraindications
Renal insufficiencySevere contrast allergy
Adverse effects (pain, DVT)Not portable
Defimtion of abbrevmtmns: DVT deep venous thrombosis; US = ultrasound.*This includes entire lower extremity as well as upper extremity deep venous throm-
bow.
the deep veins of the proximal lower extremities. Impedanceplethysmography has been compared with CV in consecutivesymptomatic patients with suspected proximal DVT in a num-ber of clinical investigations. Clinical trials have been con-ducted to establish the sensitivity of serial IPG and outcome inpatients in whom the initial IPG was negative. Despite exten-sive outcome data, this diagnostic modality is less commonlyused today, with LJS being more widely employed for evaluat-ing suspected acute lower extremity DVT. An overview of thetechnique of IPG including its limitations, as well as results ofclinical trials in both symptomatic and asymptomatic patientsconducted, are presented.
Pkysio/ogy und technique. Impedance plethysmography isa sensitive method for evaluating the rate of venous returnfrom the lower extremity. The test relies on the principle thatthe volume of blood in the leg affects its ability to conduct anapplied electrical current, which is inversely proportional tothe impedance between two electrodes placed along the calf.To conduct the test, a small electrical current is passed be-tween one set of electrodes, while the second measureschanges in voltage. A cuff is inflated around the thigh to ob-struct venous outflow but not arterial inflow. As blood accu-mulates in the leg below the cuff, impedance between the calfelectrodes falls. When venous pressure builds to the point thatit equals that of the cuff, venous outflow is reestablished, andthe tracing plateaus. The sudden release of cuff pressure re-sults in a sudden surge of blood flow proximally (the bloodvolume of the leg decreases), resulting in a rapid increase in
TABLE 2
COMMON PHYSIOLOGICAL CAUSES OF FALSE-POSITIVEIMPEDANCE PLETHYSMOCRAPHY RESULTS
Increased intraabdominal pressureMassive obesityMassive ascites
Markedly increased central venous pressureVena caval obstructionCor pulmonalePerlcardial tamponadeSevere congestive heart failure
Decreased arterial inflow to lower extremitySevere peripheral arterial disease (atherosclerosis)Cardiogenic shock
Nonthrombotic venous outflow obstructionPregnancyAbdominal massesPelvic masses’Leg muscle tension*
* May result in unilateral venous outflow obstruction. Other factors llsted are likely tocause venous outflow obstructlon in both lower extremities symmetrically.
impedance. If DVT is present in any major vein draining thelower extremity (from the popliteal to the iliac veins) the rateof venous emptying (and the increase in impedance) is signifi-cantly slower, and the tracing reveals a slower than normal re-turn toward baseline. This tcchrliqlrr is insensitive to thromhithat do not decrease the rate of venors on<ftow, such as mostcalf thromhi and small, nonobstructing thromhi in the proximalveins. Other causes of slow venous outflow, such as elevatedcentral venous pressure, may yield bilateral false-positive re-sults on IPG.
It has been demonstrated that the sensitivity and specificityof IPG for detecting proximal DVT are both dependent onadhering to the validated protocol (13). This includes carefulleg positioning to avoid compression of the popliteal or femo-ral veins. The occlusive cuff is inflated to 45 cm of water for 45 sand is rapidly released. The impedance rise at the end of theocclusion is plotted against the fall as recorded 3 s after cuffrelease. If an equivocal or abnormal result is obtained, theprocedure is repeated for 45 s of occlusion, then 120 s of occlu-sion, then 45 s and again 120 s. A result in the normal rangeterminates the sequence. A validated graph for plotting the re-sults should be used. Results using computerized IPG deviceshave not been validated. It is important to emphasize that ifdifferent protocols are utilized, a degree of institution specific-ity will be imparted that may contribute to differences in re-sults. The McMaster investigators, for example, have vali-dated criteria for the technique based on their early results(13). Impedance plethysmography should be performed withstandardized and commercially available equipment by trainedtechnicians. Studies not utilizing such a protocol or those em-ploying nonvalidated devices should not bc used.
Limitations of impedance plethysmography. Certain limita-tions of IPG must be considered. The technique does not dis-tinguish between venous obstruction due to DVT and thatcaused by nonthrombotic entities. Correct positioning of thelegs is important to avoid obstructing venous outflow. Poten-tial causes of false-positive results include increased intratho-racic pressure, increased intraabdominal pressure, and de-creased venous return from the lower extremities, such asmight occur owing to obstruction of blood flow by tumor.False-positive results can also result from poor arterial inflowsuch as low cardiac output states or severe peripheral vasculardisease. These conditions are outlined in Table 2. Advantagesand limitations of IPG are outlined in Table 3. Potential limi-tations of the sensitivity of serial IPG in symptomatic patientsare discussed below.
TABLE 3
ADVANTAGES AND LIMITATIONS OF IMPEDANCEPLETHYSMOCRAPHY FOR THE DIAGNOSIS OF
ACUTE DEEP VENOUS THROMBOSIS
Advantages Limitations
Noninvasive Operator dependentSafe Asymptomatic proximal DVTInexpensive Calf DVTPortable Nonobstructing thrombiSymptomatic proximal DVT’ Potential false-positive tests+Recurrent DVT$ Not useful for upper extremity DVTNumerous clinical trials to date Casts/immobilization devices preclude useNo radiation Note useful for alternative diagnoses
*Validated protocols must be adhered to for maximum sensitivity and specificity.’ See Table 2.* The potential for normalwation of the IPC after acute DVT increases with time. If
possible, normalization should be documented in order to diagnose recurrent DVT de-flnitively, particularly if the possible recurrence occurs within the first few months afterthe initial event.
1046 AMERICAN JOURNAL OF RESPIRATORY AND CRITICAL CARE MEDICINE VOL 160 1999
TABLE 4
SENSITIVITY AND SPECIFICITY OF IMPEDANCE PLETHYSMOGRAPHY FORSUSPECTED SYMPTOMATIC PROXIMAL DEEP VENOUS THROMBOSIS*
Sensitivity Specificity Level of
Study Ref. No. (Oh) (Oh) Evidence
Hull and coworkers (1976) 9 1241133 (93) 3861397 (97) 1
Richards and coworkers (1976) 1 0 30/37 (81) 78190 (87) 2
Hull and coworkers (1977) 11 59/60 (98) 1 OS/l 14 (95) 1
Hull and coworkers (1978) 12 155/l 69 (92) 305/317 (96) 1
Flanigan and coworkers (1978) 14 52154 (96) 93198 (95) 2
Hull and coworkers (1981) 16 74178 (95) 1571160 (98) 1
Peters and coworkers (1982) 1 7 36/39 (92) 1151124 (93) 2
Prandoni and coworkers (1991) 18 113/124(91) 2821301 (94) 1
Ginsberg and coworkers (1994) 2 0 26/40 (65) 79185 (93) 2
Agnelli and coworkers (1990) 2 2 34135 (97) 46155 (84) 2
Heijboer and coworkers (1992)+ 2 3 27128 (96) 30136 (83) 1
Wells and coworkers (1995)+ 2 4 76199 (77) 330/354 (93) 1
Hamilton, Canada 46165 (71) 2771290 (95)
Padua, Italy 30/34 (88) 53/64 (83)
l All of these trials were prospective. Not all used contrast venography as the standard for comparison,’ These two studies prospectively compared impedance plethysmography and compression ultrasound In hospttalrred patients and out-
patrents, respectively.
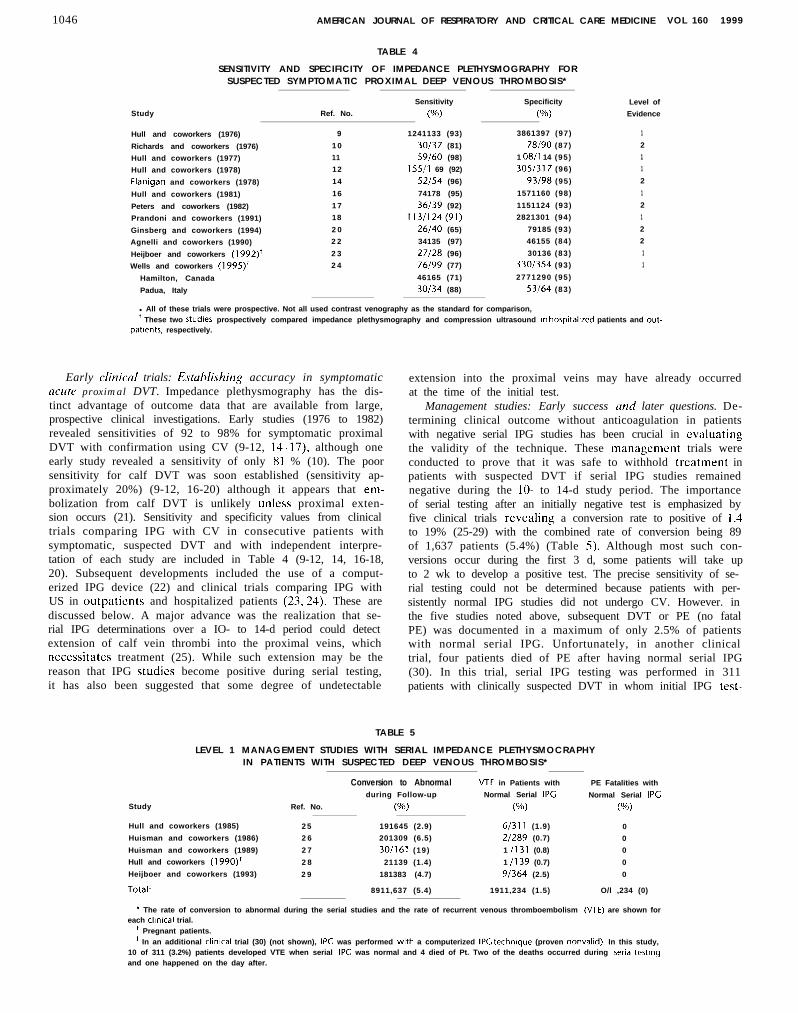
Early clirlical trials: E.stahlishing accuracy in symptomaticacute proximal DVT. Impedance plethysmography has the dis-tinct advantage of outcome data that are available from large,prospective clinical investigations. Early studies (1976 to 1982)revealed sensitivities of 92 to 98% for symptomatic proximalDVT with confirmation using CV (9-12, l4-l7), although oneearly study revealed a sensitivity of only X1 % (10). The poorsensitivity for calf DVT was soon established (sensitivity ap-proximately 20%) (9-12, 16-20) although it appears that em-bolization from calf DVT is unlikely unless proximal exten-sion occurs (21). Sensitivity and specificity values from clinicaltrials comparing IPG with CV in consecutive patients withsymptomatic, suspected DVT and with independent interpre-tation of each study are included in Table 4 (9-12, 14, 16-18,20). Subsequent developments included the use of a comput-erized IPG device (22) and clinical trials comparing IPG withUS in outpatients and hospitalized patients (23,24). These arediscussed below. A major advance was the realization that se-rial IPG determinations over a IO- to 14-d period could detectextension of calf vein thrombi into the proximal veins, whichnecessitates treatment (25). While such extension may be thereason that IPG studies become positive during serial testing,it has also been suggested that some degree of undetectable
extension into the proximal veins may have already occurredat the time of the initial test.
Management studies: Early success ctnd later questions. De-termining clinical outcome without anticoagulation in patientswith negative serial IPG studies has been crucial in evaluatingthe validity of the technique. These managcmcnt trials wereconducted to prove that it was safe to withhold treatment inpatients with suspected DVT if serial IPG studies remainednegative during the lo- to 14-d study period. The importanceof serial testing after an initially negative test is emphasized byfive clinical trials revealing a conversion rate to positive of 1.4to 19% (25-29) with the combined rate of conversion being 89of 1,637 patients (5.4%) (Table 5). Although most such con-versions occur during the first 3 d, some patients will take upto 2 wk to develop a positive test. The precise sensitivity of se-rial testing could not be determined because patients with per-sistently normal IPG studies did not undergo CV. However. inthe five studies noted above, subsequent DVT or PE (no fatalPE) was documented in a maximum of only 2.5% of patientswith normal serial IPG. Unfortunately, in another clinicaltrial, four patients died of PE after having normal serial IPG(30). In this trial, serial IPG testing was performed in 311patients with clinically suspected DVT in whom initial IPG test-
TABLE 5
LEVEL 1 MANAGEMENT STUDIES WITH SERIAL IMPEDANCE PLETHYSMOCRAPHYIN PATIENTS WITH SUSPECTED DEEP VENOUS THROMBOSIS*
Conversion to Abnormal VTE in Patients with PE Fatalities with
during Follow-up Normal Serial IPG Normal Serial IPG
Study Ref. No. (%) (Oh) (Oh)
Hull and coworkers (1985) 2 5 191645 (2.9) 6/311 (1.9) 0
Huisman and coworkers (1986) 2 6 201309 (6.5) 2/289 (0.7) 0
Huisman and coworkers (1989) 2 7 30/161 (19) 1 /131 (0.8) 0
Hull and coworkers (1990)+ 2 8 21139 (1.4) 1 /139 (0.7) 0
Heijboer and coworkers (1993) 2 9 181383 (4.7) 91364 (2.5) 0
Total* 8911,637 (5.4) 1911,234 (1.5) O/l ,234 (0)
* The rate of conversion to abnormal during the serial studies and the rate of recurrent venous thromboembolism (VIE) are shown foreach clrnical trial.
+ Pregnant patients.* In an additional clinrcal trial (30) (not shown), IPC was performed with a computerized 11% technrque (proven nonvalid). In this study,
10 of 311 (3.2%) patients developed VTE when serial IPG was normal and 4 died of Pt. Two of the deaths occurred during senal testtngand one happened on the day after.
American Thoracic Society 1047
ing was normal. Four patients (1.3%) developed fatal PE de-spite the normal serial tests. Thcrc are several possible expla-nations for the poor outcome (31 ). Thcsc investigators used aprotocol and a computerized dcvicc that differed from thatvalidated by the McMaster group. It is conceivable that cquip-ment or other technical I’actors may have played a role. Unval-idatcd protocols arc no1 acccpt;~hle and computerized IPG de-vices cannot hc considcrcd appropriate the present time. Itis also possible that the four deaths were chance occurrences.The sensitivity 01‘ IPCi in this study was X6%. Serial IPG stud-its have been compared with serial 1JS in patients with sus-pcctcd. symptomatic acute DV’I‘ and an initially negatives t u d y (.w, <‘~MI~I~SSI~N 111 I KASOII~~\;I) wrr~i VWOIIS IMA(;ING,lWl0W).
Additional concerns arose from the results of a retrospec-tivc clinical trial conducted by one of the McMastcr groups(Hondcrson (icncral Hospital), a group cxpericnced withIPG. Andes-son and associ;~tes (IY) performed CV ( o r c o m -pression ultrasound in a minority of patients) in patients withabnormal IPG results, in those with normal IPG testing inwhom DVT was highly suspected. and in those in whom serialIPCi testing would bc difficult. Impcdancc plethysmographywas abnormal in only 37 of 56 patients with confirmed DVI(sensitivity, 66%). Of the IY proximal DVT not dctccted byIPG. I2 (63%) wcrc occlusive and I I (58%) involved at leastthe poplitcal and supcrl’icial femoral veins. Thus, these investi-gators rcportcd a lower sensitivity for IPG at their center thanhad been previously reported in symptomatic outpatients. Al-though consccutivc patients had been cnrollcd. the study wasretrospcctivc. Further studies were indicated.
The same investigators, together with the group fromPadua, Italy. then prospcctivcly compared lPCi and lJS in 4YSsymptomatic outpatients with suspcctcd DVT. using CV asthe dcfinitivc answer (24). The prevalcncc of DVT was I.30 of3Y.5 (27%). Of these, IO!, of I30 (84%) were proximal. Over-all. the sensitivity of IPG was 77”/0 and the specificity was03%. cornpat-cd with YO and YX%, respectively, for US. Therewere significant dil’fcrcnccs in sensitivity and specificity bc-tween the two centers as a consequence of differences in sizeand location of thrombi. The majority of proximal thrombi notdctcctcd by IP<; arid (IS involved less than 5 cm of the distalhalf ol the poplitcal vein and most of these thrombi occurredat one center (Hamilton). Exclusion of these thrombi from theanalysis incrcascd the sensitivity of IJS for proximal thrombito X6 of X7 (YY%) and improved the sensitivity of IPG to 72 of79 (c)l %). The posilivc prcdictivc value of US was stronglyinflucnccd by the number of abnormal venous segments. Ahigher prevalence of patients with less extensive, less occlusivethrombi at the Hamilton center appcarcd to be a factor in thedifference in scnsitivitv.
G insberg mcl coll~agucs (20). another McMastcr group(Chcdokc-McMaster Hospital), also elected to reevaluateprospcctivcly the sensitivity of IP<i for proximal DVT as wellas to rclatc the location and si/c of thrombi to the IPG result.Clinically suspcctcd DV’I’ in I32 consecutive patients wascvaluatcd with IPG and I IX of these patients underwent CV.The other I4 patients undcrwcnt 17s and were felt to bc defin-itively diagnosed with proximal DVT. Of the 132 patients, 40(30%) had proximal DVT. 7 (5%)) had calf DVT, and 85(63%) did not have I>VT. The sensitivity of IPG for proximalDVT was 65% and the spccil’icity was 03%. Of the proximalveinII’<; dctectcd p o p l i t c a l t h r o m b i ( 2 3 % )not involving the supcrl’icial v e i n a n d 2 3 o f 2 7 t h r o m b i(85%) the superficial vein.patterns m a y have resulted i n morevcrcand smaller. o c c l u s i v e t h r o m b i b e i n g rc-
ferred (20). Potential explanations for the lower sensitivitysensitivities f r o m earlier
s t u d i e s s u c h a s r e p e a t e d I P G t e s t i n g p r i o r t o C V , a n d i n c l u -sion of patients with a known abnormal IPG in the study pop-ulat ion (31) . I t has been suggested that modern C V techniquesmay detect early thrombi that would have been previouslyoverlooked (32. 33). A shift in the referral pattern to patientswith less extensive. less occlusive thrombi as well as hcight-encd awareness of DVT and improved availability of testingfacilities are explanations that have been given substantial crc-dence (20, 24, 31, 32). Ginsberg and collcagues (20) recom-mended that, on the basis of their results, patients with a highclinical likelihood of DVT but a normal initial IPG should un-dergo US or CV instead of serial IPG. It has been argued that,on the basis of clinical outcome trials (34). the latter approachhas not been proved necessary.
lnlpt&nce plethysnwgruphy in asymptomrrtic patitwts. Thediagnostic accuracy of IPG in asymptomatic patients has beenevaluated in a number of clinical trials, predominantly in pa-tients undergoing total hip replacement or surgery for hipfracture (3542). The sensitivity for proximal DVT has rangedfrom I2 to 64% and was less than 30% in three of these stud-ies. In I06 asymptomatic patients undergoing [PG. US. andCV after total hip or total knee replacement, the sensitivity forIPG was 41.2% for proximal thrombi compared with 64.7%for US (42). Impedance plethysmography was also insensitiveto calf vein thrombi in these patients. The low sensitivity ofIPG in these asymptomatic patients may be attributed IO thefact that the thrombi are often smaller and less likely to be oc-clusive (43). Agnelli and associates (22) utilized serial comput-erized IPG in 246 asymptomatic patients with a negative ini-tial IPG undergoing elective total hip rcplacemcnt or surgeryfor hip fracture. The sensitivity and specificity for DVT were22 and 87% in the operated leg and I4 and 95% in the nonop-erated Icg. respectively. The same investigators (41) subse-quently determined that there was a significantly higher pro-portion of proximal DVT (p = O.OOl), a significantly higherMarder score (index of throm bus size) (p = 0.000 I ), and a sig-nificantly higher proportion of occlusive DVT (p = 0.001) insymptomatic patients than in asymptomatic patients. Scrren-irlg for D VT in usyrrlptomttic high-risk patients bus not pro vrdus&l (we COMIJKESSION IJL.IXASO~INI~ WIIII Vt-.NOIIS IMA(~IN(;,below).
Recurrent nnd chronic tiwp venous thromho.si.s. The clinicaldiagnosis of recurrent DVT is nonspecific (44,45). Impedanceplethysmography may be especially useful to diagnose recur-rence. since positive findings revert to normal as the DVT re-solves and/or collateral circulation dcvclops. Resolution ratesfor IPG-documented acute proximal DVT at 3.6, Y, and I2 mohave been found to be 67, X5, 92, and YS%, respectively (46).Thus, IPG appears to be reliable in diagnosing recurrent DVTwhen the previous episode is more remote. Impcdunw plcth-ysrmgrq~hy is rwt usqful for early rwwrcnws ~rr~lrss IPG uor-mdizntion hns hccrl rlocwmwtrrl.
Compression Ultrasound with Venous Imaging
Background. IJltrasound has been studied extensively in thesetting of suspected acute DVT as well as l’or screening as-ymptomatic patients deemed at high risk for acute D V T .Compression ultrasound with venous imaging (real-time B-modeimaging) is noninvasive, widely available. and has been provedaccurate for diagnosing acute. symptomatic proximal DVT. Incontrast to Doppler venous flow detection. which only offersinformation regarding blood flow, real-time sonography per-mits a two-dimensional cross-sectional representation of thelower extremity veins. The combination of these two techniques
1048 AMERICAN JOURNAL OF RESPIRATORY AND CRITICAL CARE MEDICINE V O L 1 6 0 1 9 9 9
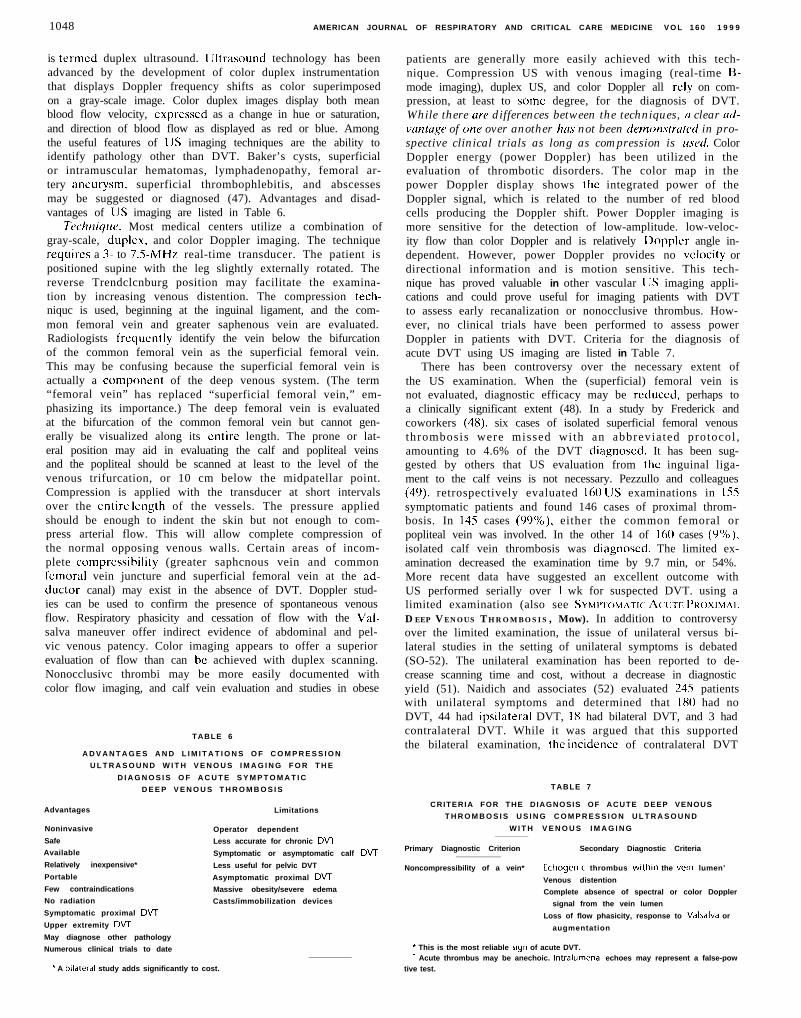
is termed duplex ultrasound. llltrasound technology has beenadvanced by the development of color duplex instrumentationthat displays Doppler frequency shifts as color superimposedon a gray-scale image. Color duplex images display both meanblood flow velocity, cxprcssed as a change in hue or saturation,and direction of blood flow as displayed as red or blue. Amongthe useful features of LJS imaging techniques are the ability toidentify pathology other than DVT. Baker’s cysts, superficialor intramuscular hematomas, lymphadenopathy, femoral ar-tery aneurysm, superficial thrombophlebitis, and abscessesmay be suggested or diagnosed (47). Advantages and disad-vantages of LJS imaging are listed in Table 6.
Technique. Most medical centers utilize a combination ofgray-scale, duplex, and color Doppler imaging. The techniquerequires a 3- to 7.5MHz real-time transducer. The patient ispositioned supine with the leg slightly externally rotated. Thereverse Trendclcnburg position may facilitate the examina-tion by increasing venous distention. The compression tech-niquc is used, beginning at the inguinal ligament, and the com-mon femoral vein and greater saphenous vein are evaluated.Radiologists frcqucntly identify the vein below the bifurcationof the common femoral vein as the superficial femoral vein.This may be confusing because the superficial femoral vein isactually a component of the deep venous system. (The term“femoral vein” has replaced “superficial femoral vein,” em-phasizing its importance.) The deep femoral vein is evaluatedat the bifurcation of the common femoral vein but cannot gen-erally be visualized along its entire length. The prone or lat-eral position may aid in evaluating the calf and popliteal veinsand the popliteal should be scanned at least to the level of thevenous trifurcation, or 10 cm below the midpatellar point.Compression is applied with the transducer at short intervalsover the entire length of the vessels. The pressure appliedshould be enough to indent the skin but not enough to com-press arterial flow. This will allow complete compression ofthe normal opposing venous walls. Certain areas of incom-plete compressibility (greater saphcnous vein and commonfemoral vein juncture and superficial femoral vein at the ad-ductor canal) may exist in the absence of DVT. Doppler stud-ies can be used to confirm the presence of spontaneous venousflow. Respiratory phasicity and cessation of flow with the Val-salva maneuver offer indirect evidence of abdominal and pel-vic venous patency. Color imaging appears to offer a superiorevaluation of flow than can be achieved with duplex scanning.Nonocclusivc thrombi may be more easily documented withcolor flow imaging, and calf vein evaluation and studies in obese
TABLE 6
A D V A N T A G E S A N D L I M I T A T I O N S O F C O M P R E S S I O N
U L T R A S O U N D W I T H V E N O U S I M A G I N G F O R T H E
D I A G N O S I S O F A C U T E S Y M P T O M A T I C
D E E P V E N O U S T H R O M B O S I S
Advantages
Noninvasive
Safe
Available
Relatively inexpensive*
Portable
Few contraindications
No radiation
Symptomatic proximal DVT
Upper extremity DVT
May diagnose other pathology
Numerous clinical trials to date
Limitations
Operator dependent
Less accurate for chronic DVI
Symptomatic or asymptomatic calf DVT
Less useful for pelvic DVT
Asymptomatic proximal DVT
Massive obesity/severe edema
Casts/immobilization devices
* A bilateral study adds significantly to cost.
patients are generally more easily achieved with this tech-nique. Compression US with venous imaging (real-time B-mode imaging), duplex US, and color Doppler all rely on com-pression, at least to some degree, for the diagnosis of DVT.While there me differences between the techniques, 11 clear rrd-vuntage of one over another bus not been demonstra~d in pro-spective clinical trials as long as compression is uscci. ColorDoppler energy (power Doppler) has been utilized in theevaluation of thrombotic disorders. The color map in thepower Doppler display shows the integrated power of theDoppler signal, which is related to the number of red bloodcells producing the Doppler shift. Power Doppler imaging ismore sensitive for the detection of low-amplitude. low-veloc-ity flow than color Doppler and is relatively Doppler angle in-dependent. However, power Doppler provides no velocity ordirectional information and is motion sensitive. This tech-nique has proved valuable in other vascular IJS imaging appli-cations and could prove useful for imaging patients with DVTto assess early recanalization or nonocclusive thrombus. How-ever, no clinical trials have been performed to assess powerDoppler in patients with DVT. Criteria for the diagnosis ofacute DVT using US imaging are listed in Table 7.
There has been controversy over the necessary extent ofthe US examination. When the (superficial) femoral vein isnot evaluated, diagnostic efficacy may be reduced, perhaps toa clinically significant extent (48). In a study by Frederick andcoworkers (48), six cases of isolated superficial femoral venousthrombosis were missed with an abbreviated protocol ,amounting to 4.6% of the DVT diagnosed. It has been sug-gested by others that US evaluation from the inguinal liga-ment to the calf veins is not necessary. Pezzullo and colleagues(49), retrospectively evaluated I60 IJS examinations in IS5symptomatic patients and found 146 cases of proximal throm-bosis. In 145 cases (99%), either the common femoral orpopliteal vein was involved. In the other 14 of I60 cases (9%),isolated calf vein thrombosis was diagnosed. The limited ex-amination decreased the examination time by 9.7 min, or 54%.More recent data have suggested an excellent outcome withUS performed serially over 1 wk for suspected DVT. using alimited examination (also see SYMYIOMAI-I(. A(,rl.rE PKOXIMALD EEP V ENOUS T HROMBOSIS , Mow). In addition to controversyover the limited examination, the issue of unilateral versus bi-lateral studies in the setting of unilateral symptoms is debated(SO-52). The unilateral examination has been reported to de-crease scanning time and cost, without a decrease in diagnosticyield (51). Naidich and associates (52) evaluated 245 patientswith unilateral symptoms and determined that I80 had noDVT, 44 had ipsilateral DVT, IX had bilateral DVT, and 3 hadcontralateral DVT. While it was argued that this supportedthe bilateral examination, the incidence of contralateral DVT
TABLE 7
CRITERIA FOR THE DIAGNOSIS OF ACUTE DEEP VENOUS
T H R O M B O S I S U S I N G C O M P R E S S I O N U L T R A S O U N D
W I T H V E N O U S I M A G I N G
Primary Diagnostic Criterion Secondary Diagnostic Criteria
Noncompressibility of a vein* Echogenlc thrombus withm the vein lumen’
Venous distention
Complete absence of spectral or color Doppler
signal from the vein lumen
Loss of flow phasicity, response to Valsalva or
augmentation
* This is the most reliable sign of acute DVT.’ Acute thrombus may be anechoic. lntralumenal echoes may represent a false-pow
tive test.
American Thoracic Society 1049
TABLE 8
DIAGNOSTIC CRITERIA THAT AID IN DISTINGUISHING BETWEENACUTE AND CHRONIC DEEP VENOUS THROMBOSIS*
Characteristic
Thrombus echogenicityVein lumen size+CompresstbilityCollateral veins
Acute
HypoechoicDistended
SpongyAbsent
Chronic
EchogenicNarrow, irregularRigid, incompressiblePresent
* Serial studies reveal that approximately 50% of patients with an acute episode ofDVT documented at ultrasound WIII have persistent sonographic changes such as in-complete compresslbillty at 6 to 12 mo follow-up (108, 109). Thus, caution IS impor-tant in interpreting lack of, or partlal, vein compressiblllty in a patient with previousDVT A new area of noncompressibility is evidence of new thrombosis.
+ VW- lumen size should be interpreted in the context of other findings (110).
was low (I %) and the presence of bilateral DVT has not beenproved to have more impact on outcome than unilateral DVT.
Liniitatiom of conlprrssion dtrasound with venous imag-in,g. Venous compressibility may be limited by patient charac-teristics such as obesity. edema, and tenderness as well as bycasts or immobilization devices that limit access to the extrem-ity. While there may be areas of focal noncompressibility inthese situations, these areas are generally bilaterally symmet-ric and color flow imaging will usually reveal venous filling.Other potential causes of false-positive results include extrin-sic compression of a vein by a pelvic mass or other perivascu-lar pathology (47) and thrombosis in the distal popliteal vein.False-negative studies may occur in the presence of calf DVT.with proximal DVT in asymptomatic (even high-risk) patients(S.3) or in the prcscncc of a thrombosed duplicated venoussegment. liltrasound techniques are unreliable in detectingDVT in the iliac veins; CV and MRI are much more reliable inthis setting (54-56). Finally, because US may not return tonormal after acute DVT has been diagnosed, it must be inter-pretcd with caution when attempting to diagnose recurrentDVT (Table 8). These limitations are discussed further in thefollowing two sections.
Syrnptonmic~ trcute proximal drep veno~~s thrombosis . Anumber of clinical trials have suggcstcd the accuracy of US in
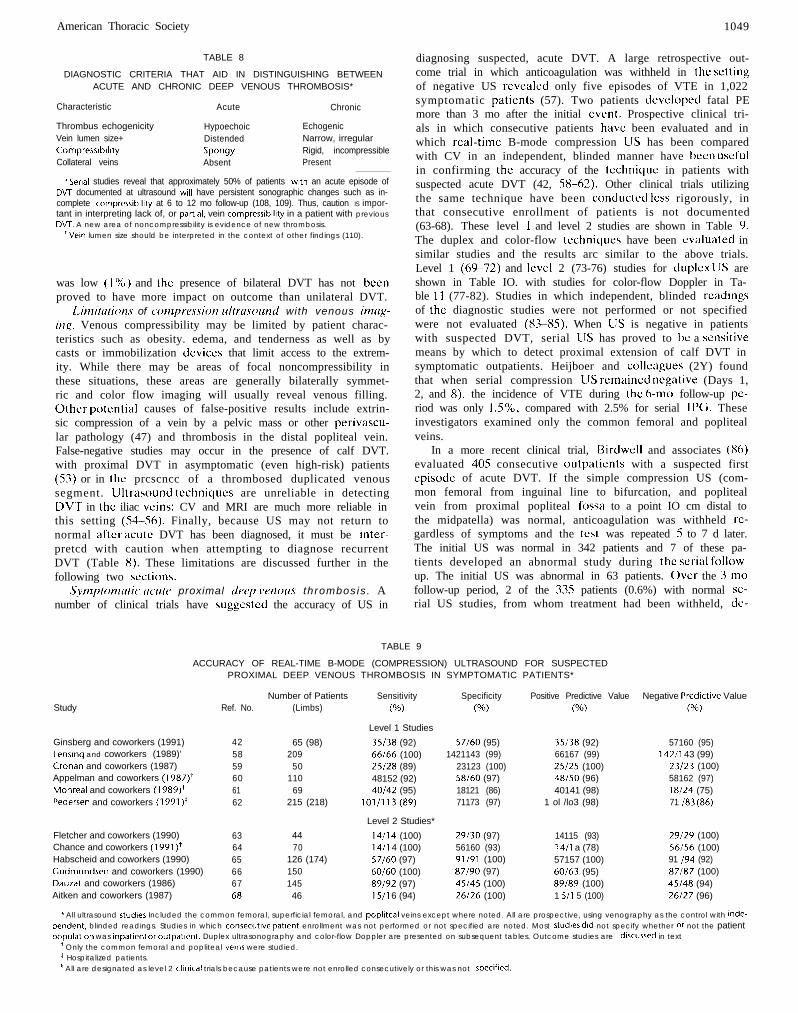
diagnosing suspected, acute DVT. A large retrospective out-come trial in which anticoagulation was withheld in the settingof negative US revealed only five episodes of VTE in 1,022symptomatic patients (57). Two patients developed fatal PEmore than 3 mo after the initial event. Prospective clinical tri-als in which consecutive patients have been evaluated and inwhich real-time B-mode compression LJS has been comparedwith CV in an independent, blinded manner have been usefulin confirming the accuracy of the tcchniquc in patients withsuspected acute DVT (42, 5X-62). Other clinical trials utilizingthe same technique have been conducted less rigorously, inthat consecutive enrollment of patients is not documented(63-68). These level 1 and level 2 studies are shown in Table 9.The duplex and color-flow techniques have been evaluated insimilar studies and the results arc similar to the above trials.Level 1 (6Y-72) and level 2 (73-76) studies for duplex LJS areshown in Table IO. with studies for color-flow Doppler in Ta-ble 11 (77-82). Studies in which independent, blinded readingsof the diagnostic studies were not performed or not specifiedwere not evaluated (83-85). When LJS is negative in patientswith suspected DVT, serial LJS has proved to bc a sensitivemeans by which to detect proximal extension of calf DVT insymptomatic outpatients. Heijboer and collcagues (2Y) foundthat when serial compression LJS remained negative (Days 1,2, and X), the incidence of VTE during the 6-mo follow-up pc-riod was only l.S%, compared with 2.5% for serial IPG. Theseinvestigators examined only the common femoral and poplitealveins.
In a more recent clinical trial, Birdwell and associates (X6)evaluated 405 consecutive outpatients with a suspected firstepisode of acute DVT. If the simple compression US (com-mon femoral from inguinal line to bifurcation, and poplitealvein from proximal popliteal fossa to a point IO cm distal tothe midpatella) was normal, anticoagulation was withheld rc-gardless of symptoms and the test was repeated 5 to 7 d later.The initial US was normal in 342 patients and 7 of these pa-tients developed an abnormal study during the serial follow-up. The initial US was abnormal in 63 patients. Over the 3-mofollow-up period, 2 of the 335 patients (0.6%) with normal sc-rial US studies, from whom treatment had been withheld, de-
TABLE 9
ACCURACY OF REAL-TIME B-MODE (COMPRESSION) ULTRASOUND FOR SUSPECTEDPROXIMAL DEEP VENOUS THROMBOSIS IN SYMPTOMATIC PATIENTS*
StudyNumber of Patients Sensitivity Specificity Positive Predictive Value Negative Predictive Value
Ref. No. (Limbs) (W (%) (%) (%)
Level 1 Studies
Ginsberg and coworkers (1991) 42 65 (98)Lensing and coworkers (1989)’ 58 209Cronan and coworkers (1987) 59 50Appelman and coworkers (1987)+ 60 110Monreal and coworkers (1989)+ 61 69Pedersen and coworkers (1991)* 62 215 (218)
35138 (92) 57/60 (95) 35/38 (92) 57160 (95)66/66 (100) 1421143 (99) 66167 (99) 142/l 43 (99)25128 (89) 23123 (100) 25/25 (100) 23123 (100)48152 (92) 58160 (97) 48/50 (96) 58162 (97)40/42 (95) 18121 (86) 40141 (98) i 8124 (75)
101/113(89) 71173 (97) 1 ol /lo3 (98) 71 /a3 (86)
Level 2 Studies*
Fletcher and coworkers (1990) 63 44 14114 (100) 29/30 (97) 14115 (93) 29129 (100)Chance and coworkers (1991)+ 64 70 14/l 4 (100) 56160 (93) i 4/i a (78) 56/56 (100)Habscheid and coworkers (1990) 65 126 (174) 57/60 (97) 91191 (100) 57157 (100) 91 I94 (92)Cudmundsen and coworkers (1990) 66 150 60/60 (100) 87190 (97) 60163 (95) 87187 (100)Dauzat and coworkers (1986) 67 145 89192 (97) 45145 (100) 89189 (100) 45148 (94)Aitken and coworkers (1987) 68 46 15/l 6 (94) 26/26 (100) 1 S/l 5 (100) 26127 (96)
* All ultrasound studies Included the common femoral, superficial femoral, and popllteal veins except where noted. All are prospective, using venography as the control with Inde-pendent, blinded readings. Studies in which consecutive patlent enrollment was not performed or not specified are noted. Most studies did not specify whether or not the patientpopulation was inpatIent or outpatlent. Duplex ultrasonography and color-flow Doppler are presented on subsequent tables. Outcome studies are discussed in text
’ Only the common femoral and popliteal veins were studied.’ Hospitalized patients.p All are designated as level 2 tllnical trials because patients were not enrolled consecutively or this was not specified.

1050 AMERICAN JOURNAL OF RESPIRATORY AND CRITICAL CARE MEDICINE VOL 160 1999
S t u d y
N u m b e r o f P a t i e n t s Sensit ivity Specif icity Posit ive Predictive Value
R e f . N o . ( L i m b s ) (Oh) (Oh) W)
L e v e l 1 S t u d i e s
6 9 5 0 22125 ( 8 8 ) 2 4 1 2 5 ( 9 6 ) 2 2 1 2 3 ( 9 6 )7 0 4 7 ( 5 2 ) 22/24 ( 9 2 ) 2 6 1 2 6 ( 1 0 0 ) 22/22 ( 1 0 0 )71 6 5 23124 ( 9 6 ) 28135 ( 8 0 ) 23129 ( 7 9 )7 2 1 6 5 75177 ( 9 7 ) 5 9 1 6 0 ( 9 8 ) 75176 ( 9 9 )
L e v e l 2 S t u d i e s
N e g a t i v e P r e d i c t i v e V a l u e
(%)
O ’ L e a r y a n d c o w o r k e r s ( 1 9 8 8 )
George and coworkers (1987)+
M i t c h e l l a n d c o w o r k e r s ( 1 9 9 1 )
Quintavalla a n d c o w o r k e r s ( 1 9 9 2 )
24127 ( 8 9 )
2 6 1 2 8 ( 9 3 )
2 8 1 2 9 ( 9 7 )
59161 ( 9 7 )
V o g e l a n d c o w o r k e r s (1987)* 7 3 5 0 19121 ( 9 2 ) 29129 ( 1 0 0 ) 19119 ( 1 0 0 ) 29131 ( 9 4 )
Mantoni a n d c o w o r k e r s (1989)* 7 4 9 0 34/35 ( 9 7 ) 48/50 ( 9 6 ) 34136 ( 9 4 ) 48149 ( 9 8 )
Elias a n d c o w o r k e r s (1987)$ 7 5 4 3 0 ( 8 5 4 ) 2 4 1 1 2 4 1 ( 1 0 0 ) 5 9 3 1 6 0 6 ( 9 8 ) 2 4 1 1 2 5 4 ( 9 5 ) 5 9 3 1 6 0 6 ( 9 8 )
Comerota a n d c o w o r k e r s ( 1 9 9 0 ) 7 6 6 5 37137 ( 1 0 0 ) 2 4 1 2 8 ( 8 6 ) 37137 ( 1 0 0 ) 2 4 1 2 5 ( 9 6 )
TABLE 10
ACCURACY OF DUPLEX ULTRASONOCRAPHY FOR PROXIMAL DEEPVENOUS THROMOSIS IN SYMPTOMATIC PATIENTS*
l All studies are prospective, using venography as the control with Independent, blinded readngs. Studies I” which consecutive patients were not enrolled or in which blindedreadings were not clearly stated are specified. All ultrasound studies included the common femoral, superficial femoral, and popliteal veins. The clinical trials listed include both ~npa-tient and outpatlent studies. Outcome studves are discussed in text.
’ Only the common femoral and popliteal veins were studied.t Designated as level 2 because of lack of enrollment of consecutive patients or the fact that this was not specified.* Designated as level 2 because it is not clear that investigators were blinded to cllnical and prior test information.
vcloped VTE while 4 of the 70 patients (5.4%) with either aninitially abnormal or subsequently abnormal study (treated)developed recurrent VTE. None of the patients in the studydied from acute PE.
Similarly. Cogo and colleagues (87) evaluated the safety ofwithholding anticoagulation in patients with suspected DVTwhen compression US was initially negative and remainednegative at rcpcat testing I wk later. A simplified compressionIJS procedure limited to the common femoral vein in thegroin and the popliteal vein down to the trifurcation of the calfveins was also performed in this study. Of the 1,702 patientsincluded. LJS was abnormal in 400 patients initially and in 12patients at 1 wk. Venous thromboembolic complications oc-curred in only one pat&t during the week of serial testingand in eight patients during the h-mo follow-up period. It isimportant to note that although the extended popliteal exami-nation did allow for the earlier identification of patients withproximal DVT. the procedure resulted in more false-positiveresults. The positive predictive value for the assessment of thecommon femoral vein and the popliteal vein in the poplitealfossa was Y8.5%, but dccrcascd to 79% for the distal poplitealregion. Thus. it appears safe to withhold anticoagulation in pa-tients in whom one or two serial US (including distal poplitealscanning) arc ncgativc over 5 to 7 d. The studies described
above (86, 87) suggest that a single repcat study at 5 to 7 d isadequate if the initial study includes the femoral vein, thepopliteal fossa, and scanning to 10 cm below the midpatella orto the trifurcation of the calf veins. Wherr putirnf,follow-up can-not he guaranteed or in centers in which US has not proved suf-jkiently reliable, these serial US protocols should not be utilized.
Asymptomatic acute proximal deep veno~~,s thrombosis. A sis the case with IPG, real-time B-mode US, duplex LJS, andcolor-flow Doppler US have been used as surveillance tech-niques to evaluate asymptomatic patients at high risk forDVT. They have proved insufficiently sensitive in this setting.Without prophylaxis, the risk of DVT is approximately 50%after total hip replacement and as high as 65% after total kneereplacement (89). Prospective clinical trials enrolling consecu-tive patients and using previously established objective crite-ria for CV and US with independent, blinded comparisons ofthe two techniques were assessed (level 1 trials) (43,68,90-98).Other studies were deemed level 2 (76, 99-102). Of the 1 Ilevel 1 studies, 5 used real-time B-mode US, 4 utilized duplexUS, and 2 were color Doppler studies. When level I studieswere considered, US had a sensitivity of 62% (OS of 144 pa-tients), a specificity of 97%, and a positive predictive value of66% for detecting proximal DVT. For level 2 studies, the sen-sitivity was 9S%, the specificity was lOO%, and the positive
TABLE 11
ACCURACY OF COLOR-FLOW DOPPLER ULTRASONOGRAPHY FOR PROXIMAL DEEPVENOUS THROMBOSIS IN SYMPTOMATIC PATIENTS*
S t u d y
Lewis a n d c o w o r k e r s ( 1 9 9 4 ) ’
R o s e a n d c o w o r k e r s ( 1 9 9 0 )
S c h i n d l e r a n d c o w o r k e r s ( 1 9 9 0 )
B a x t e r a n d c o w o r k e r s ( 1 9 9 0 )
B a x t e r a n d c o w o r k e r s (1992)$
M a t t o s a n d c o w o r k e r s ( 1 9 9 2 )
R e f . N o .
7 7
7 8
7 9
8 0
8 1
8 2
N u m b e r o f P a t i e n t s Sensit ivity
( L i m b s ) (%)
L e v e l 1 S t u d i e s
9 7 2 0 1 2 1 ( 9 5 )6 9 ( 7 5 ) 25126 ( 9 6 )
L e v e l 2 Studies*
9 7 5 4 1 5 5 ( 9 8 )4 0 11 /12 ( 9 2 )
4 0 15115 ( 1 0 0 )7 5 ( 7 7 ) 32132 ( 1 0 0 )
Specif icity Posit ive Predictive Value N e g a t i v e P r e d i c t i v e V a l u e
(Oh) (Oh) (“h)
75176 ( 9 9 ) 2 0 1 2 1 ( 9 5 ) 75176 ( 9 9 )
49149 ( 1 0 0 ) 25125 ( 1 0 0 ) 4 9 1 5 0 ( 9 8 )
39139 ( 1 0 0 ) 54/54 ( 1 0 0 ) 3 9 1 4 0 ( 9 8 )
26126 ( 1 0 0 ) llill ( 1 0 0 ) 2 6 1 2 7 ( 9 6 )
20/20 ( 1 0 0 ) 15115 ( 1 0 0 ) 20/20 ( 1 0 0 )
4 4 1 4 5 ( 9 8 ) 32133 ( 9 7 ) 44144 ( 1 0 0 )
* All studws are prospectwe, using venography as the control with independent, bl inded readings. Studies not enrolling consecutive patients are specified. All ultrasound studies III-eluded the common femoral, superficial femoral, and popliteal veins. The clinlcal tr ials l isted include both inpatient and outpatient studies. Outcome studies are dIscussed an text.
+ This study employed only color f low and did not uti l ize compression.t Designated as level 2 because of lack of enrollment of consecutwe patients or because this was not specified.p There were 50 patients initially enrolled but eight venographic and two ultrasound fai lures occurred.
American Thoracic Society 1051
predictive value was 100%. Asymptomatic patients undergo-ing orthopedic surgery have been scrutinized by metaanalysisand although duplex and color Doppler imaging may havetheoretical advantages compared with B-mode imaging, thishas not been clearly demonstrated (53). It is likely that thelower sensitivity of US in asymptomatic high-risk orthopedicpatients occurs because thrombi in asymptomatic patients aresmaller. fresh. and more easily compressible and nonocclusive.Outcome data evaluating US screening in these asymptomaticpatients arc now available. In one double-blind, randomized,controlled trial involving 1,024 clcctivc total hip or knee ar-throplasty patients receiving warl’arin prophylaxis (and asymp-tomatic for DVT). screening US was performed at discharge(103). In patients in whom DVT was detected, warfarin wascontinued at a therapeutic dose, while in those with negativestudies, it was discontinued. The total outcome event rate(venous thrombocmbolism plus bleeding) at 00 d was 1% foreach group. In a large, prospective, Canadian clinical trial ofI ,Y84 consecutive hip or knee arthroplasty patients receivingenoxaparin prophylaxis, predischarge compression US revealedonly 3 patients (0.15%) with DVT (104). These results suggestthat a screening US at dischurge in high-risk orthopedic putientsreceiving enoxaparin or wat$urin prophylaxis is unnecessury.
Acute co!f dray venous thrombosis. When acute DVT issuspcctcd, one or both lower extremities are evaluated. Asearch specifically for isolated calf DVT is not generally un-dertaken since the proximal lower extremity is also evaluatedin the setting of suspected calf DVT. However, it is useful todiscuss the sensitivity and specificity of US for calf DVT sincethis entity is either trcatcd or followed with serial noninvasivestudies. Contrast venography has been considered the mostaccurate diagnostic test for acute calf DVT. As is the case withIPG, IJS cannot be relied on to exclude calf vein thrombosis.As noted above, serial IJS (or IPG) is appropriate in patientswith symptoms of acute DVT and a negative initial study (86,87). and some of thcsc patients may have undetected calfDVT. which can be assessed (for possible extension) at follow-up. If, in a particular patient with suspected DVT, the initialUS (or IPG) is negative and follow-up with serial studies can-not be guaranteed, then CV would be appropriate. Ultra-sonography is specific for symptomatic acute calf vein DVT,and a positive test in this setting can usually be relied on.These recommendations are based on level 1 studies. Becausethe calf veins are smaller and characterized by slower flow,and because they arc more anatomically variable than theproximal lower extremity veins, LJS assessment is more diffi-cult. Technically inadequate studies result more commonlythan when the proximal veins are examined. In symptomaticpatients with isolated calf DVT, the sensitivity of US has beenshown to be 73% for compression US (65), 81% for duplexUS (71). and 87% with color-flow Doppler (78). In each ofthese prospcctivc studies, independent, blinded readings wereperformed for both lJS and CV. Except for the unclear ques-tion of consecutive enrollment in the compression US study(65). level I methodology was employed in these investiga-tions. When the calf veins can be adequately visualized, thesensitivity and specificity are improved and range from 88 to100% and from 83 to 10006, respectively (63, Xl, 10.5, 106). Be-cause of the above-described technical considerations, how-ever. the sensitivity is frequently much lower (67). The sensi-tivity of IJS for detecting isolated calf DVT in asymptomatichigh-risk patients is even lower, ranging from 33 to 58% (91,93. Y7, 107). Clinical investigations evaluating US techniquesfor calf DVT are both level 1 and level 2. While many of thelevel 2 studies arc othcrwisc well dcsigncd, frequently it is notexplicit that consccutivc patients were enrolled.
Recurrent and chronic deep venous thromhosi.s. Distin-guishing between acute and chronic DVT is crucial becauseafter several weeks thrombi become adherent to the wall ofthe vein and are not likely to embolize. When patients presentwith recurrent symptoms, some will have recurrent DVT andothers will have postphlebitic syndrome. Ultrasound tech-niques should not be considered reliable for recurrent DVTunless the test has been shown to normalize prior to the sus-pected recurrence. However, the rate of normalization of anabnormal US test after a first episode of acute DVT has beendetermined to be only 44 to 52% after 6 mo and 55% after 12mo in two prospective follow-up clinical investigations (108,100). Clot echogenicity does not accurately discriminate bc-tween acute and chronic DVT, but there does appear to be apositive correlation between venous distention and the age 01the thrombus (109). However, a study of Y7S legs of patientswith suspected DVT evaluated vein diameter in normal veinsand in those with acute and chronic thrombosis (1 IO). It wasconcluded that although veins involved by acute DVT tend tobe larger than normal veins, and veins with chronic changestend to be smaller than normal vessels, the mean differencesare small. The differences appear to be most useful at the ex-tremes of size. Thus, when evaluating a patient with suspectedacute DVT, vein size should be interpreted in the context ofother sonographic findings. Because previous DVT is a riskfactor for recurrence, it may be appropriate to perform a fol-low-up US between 3 and 6 mo after anticoagulation is initi-ated, to serve as a baseline in the event that symptoms recur.There is, however, no uniformly accepted standard of cart forrepeating US after DVT is diagnosed.
Upper extremity deep venous thrombosis. Axillary-subcla-vian vein thrombosis commonly results from indwelling venouscatheters but may be spontaneous, including the syndrome of“effort thrombosis.” The diagnosis may be made by US, CV.or MRI. When US is utilized, criteria for the diagnosis are thesame as in the lower extremities. Although compression tech-niques are employed, portions of the subclavian vein behindthe clavicle cannot be compressed and greater reliance onDoppler evaluation is required. The internal jugular, subcla-vian, axillary, and brachial veins are generally evaluated. Thesuperior vena cava and brachiocephalic vein are inaccessibleor only partially accessible to US. While the sensitivity of USfor symptomatic upper extremity thrombosis may range from78 to 100% (111, 112), it has been shown to be as low as 31%in asymptomatic individuals after subclavian catheter removal(113). Most of the false-negative studies appeared to be due toshort, nonocclusive thrombi. In a prospective study of 5X con-secutive patients with suspected upper extremity DVT. centralvenous catheters, thrombophilic states, and previous leg DVTwere significantly associated with upper extremity thrombosis(114). All patients were evaluated by objective testing for PE.Pulmonary embolism was detected in 36%. Thus. it appearsthat PE occurs in a substantial proportion of these patients.
Magnetic Resonance Imaging
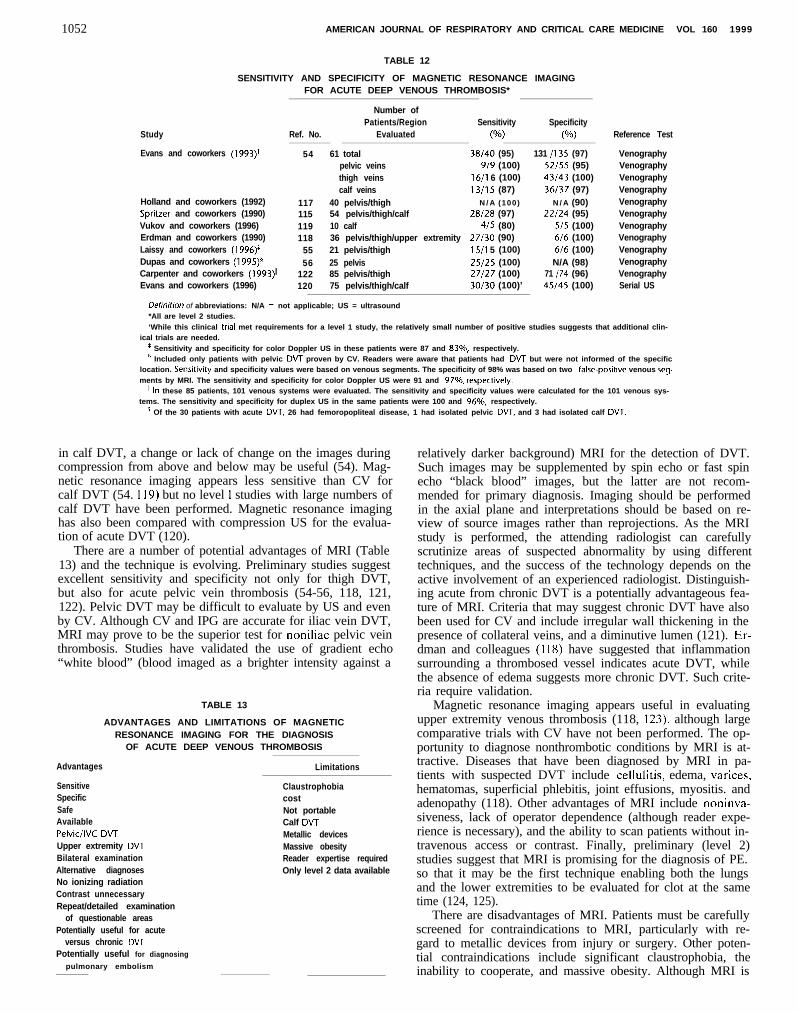
Preliminary reports using MRI to detect DVT suggested thatMRI was at least 90% sensitive and specific for acute symp-tomatic proximal DVT (I 15-l 18). A number of prospectiveclinical trials have evaluated MRI, using CV as the gold stan-dard (Table 12), with several revealing sensitivity and/or spec-ificity values as high as 100%. Less information is available forMRI as a screening modality in asymptomatic patients. It hasbeen suggested that silent lower extremity DVT may be dem-onstrated with MRI (118). This is logical since MRI directlyimages thrombi, and can image nonocclusive clots. It does notrely on compression or other adjunctive techniques. However,
1052 AMERICAN JOURNAL OF RESPIRATORY AND CRITICAL CARE MEDICINE VOL 160 1999
Study
Evans and coworkers (1993)+
Holland and coworkers (1992)Spritzer and coworkers (1990)Vukov and coworkers (1996)Erdman and coworkers (1990)Laissy and coworkers (1996)’Dupas and coworkers (1995)§Carpenter and coworkers (1993)”Evans and coworkers (1996)
TABLE 12
SENSITIVITY AND SPECIFICITY OF MAGNETIC RESONANCE IMAGINGFOR ACUTE DEEP VENOUS THROMBOSIS*
Number ofPatients/Region Sensitivity Specificity
Ref. No. Evaluated (No) (W
54 61 total 38/40 (95) 131 /135 (97)pelvic veins 9/9 (100) 52155 (95)thigh veins 16/l 6 (100) 43/43 (100)calf veins 13/l 5 (87) 36137 (97)
117 40 pelvis/thigh N / A (100) N / A (90)115 54 pelvis/thigh/calf 28128 (97) 22124 (95)119 10 calf 4/5 (80) 5/5 (100)118 36 pelvis/thigh/upper extremity 27/30 (90) 6/6 (100)
55 21 pelvis/thigh 15/l 5 (100) 6/6 (100)56 25 pelvis 25/25 (100) N/A (98)
122 85 pelvis/thigh 27/27 (100) 71 I74 (96)120 75 pelvis/thigh/calf 30/30 (100)’ 45/45 (100)
Reference Test
VenographyVenographyVenographyVenographyVenographyVenographyVenographyVenographyVenographyVenographyVenographySerial US
Dehnirion of abbreviations: N/A = not applicable; US = ultrasound*All are level 2 studies.‘While this clinical tnal met requirements for a level 1 study, the relatively small number of positive studies suggests that additional clin-
ical trials are needed.I Sensitivity and specificity for color Doppler US in these patients were 87 and 83%, respectively.* Included only patients with pelvic DVT proven by CV. Readers were aware that patients had DVT but were not informed of the specific
location. Sensitivity and specificity values were based on venous segments. The specificity of 98% was based on two false-positive venous seg.ments by MRI. The sensitivity and specificity for color Doppler US were 91 and 97%, respecttvely.
” In these 85 patients, 101 venous systems were evaluated. The sensitivity and specificity values were calculated for the 101 venous sys-tems. The sensitivity and specificity for duplex US in the same patients were 100 and 96%, respectively.
p Of the 30 patients with acute DVT, 26 had femoropopliteal disease, 1 had isolated pelvic DVT, and 3 had isolated calf DVT.
in calf DVT, a change or lack of change on the images duringcompression from above and below may be useful (54). Mag-netic resonance imaging appears less sensitive than CV forcalf DVT (54. 119) but no level I studies with large numbers ofcalf DVT have been performed. Magnetic resonance imaginghas also been compared with compression US for the evalua-tion of acute DVT (120).
There are a number of potential advantages of MRI (Table13) and the technique is evolving. Preliminary studies suggestexcellent sensitivity and specificity not only for thigh DVT,but also for acute pelvic vein thrombosis (54-56, 118, 121,122). Pelvic DVT may be difficult to evaluate by US and evenby CV. Although CV and IPG are accurate for iliac vein DVT,MRI may prove to be the superior test for noniliac pelvic veinthrombosis. Studies have validated the use of gradient echo“white blood” (blood imaged as a brighter intensity against a
TABLE 13
ADVANTAGES AND LIMITATIONS OF MAGNETICRESONANCE IMAGING FOR THE DIAGNOSIS
OF ACUTE DEEP VENOUS THROMBOSIS
Advantages
SensitiveSpecificSafeAvailablePelvic/lVC DVTUpper extremity DVTBilateral examinationAlternative diagnosesNo ionizing radiationContrast unnecessaryRepeat/detailed examination
of questionable areasPotentially useful for acute
versus chronic DVTPotentially useful for diagnosing
pulmonary embolism
Limitations
ClaustrophobiacostNot portableCalf DVTMetallic devicesMassive obesityReader expertise requiredOnly level 2 data available
relatively darker background) MRI for the detection of DVT.Such images may be supplemented by spin echo or fast spinecho “black blood” images, but the latter are not recom-mended for primary diagnosis. Imaging should be performedin the axial plane and interpretations should be based on re-view of source images rather than reprojections. As the MRIstudy is performed, the attending radiologist can carefullyscrutinize areas of suspected abnormality by using differenttechniques, and the success of the technology depends on theactive involvement of an experienced radiologist. Distinguish-ing acute from chronic DVT is a potentially advantageous fea-ture of MRI. Criteria that may suggest chronic DVT have alsobeen used for CV and include irregular wall thickening in thepresence of collateral veins, and a diminutive lumen (121). Er-dman and colleagues (1 IS) have suggested that inflammationsurrounding a thrombosed vessel indicates acute DVT, whilethe absence of edema suggests more chronic DVT. Such crite-ria require validation.
Magnetic resonance imaging appears useful in evaluatingupper extremity venous thrombosis (118, 123), although largecomparative trials with CV have not been performed. The op-portunity to diagnose nonthrombotic conditions by MRI is at-tractive. Diseases that have been diagnosed by MRI in pa-tients with suspected DVT include cellulitis, edema, varices.hematomas, superficial phlebitis, joint effusions, myositis. andadenopathy (118). Other advantages of MRI include noninva-siveness, lack of operator dependence (although reader expe-rience is necessary), and the ability to scan patients without in-travenous access or contrast. Finally, preliminary (level 2)studies suggest that MRI is promising for the diagnosis of PE.so that it may be the first technique enabling both the lungsand the lower extremities to be evaluated for clot at the sametime (124, 125).
There are disadvantages of MRI. Patients must be carefullyscreened for contraindications to MRI, particularly with re-gard to metallic devices from injury or surgery. Other poten-tial contraindications include significant claustrophobia, theinability to cooperate, and massive obesity. Although MRI is
American Thoracic Society 1053
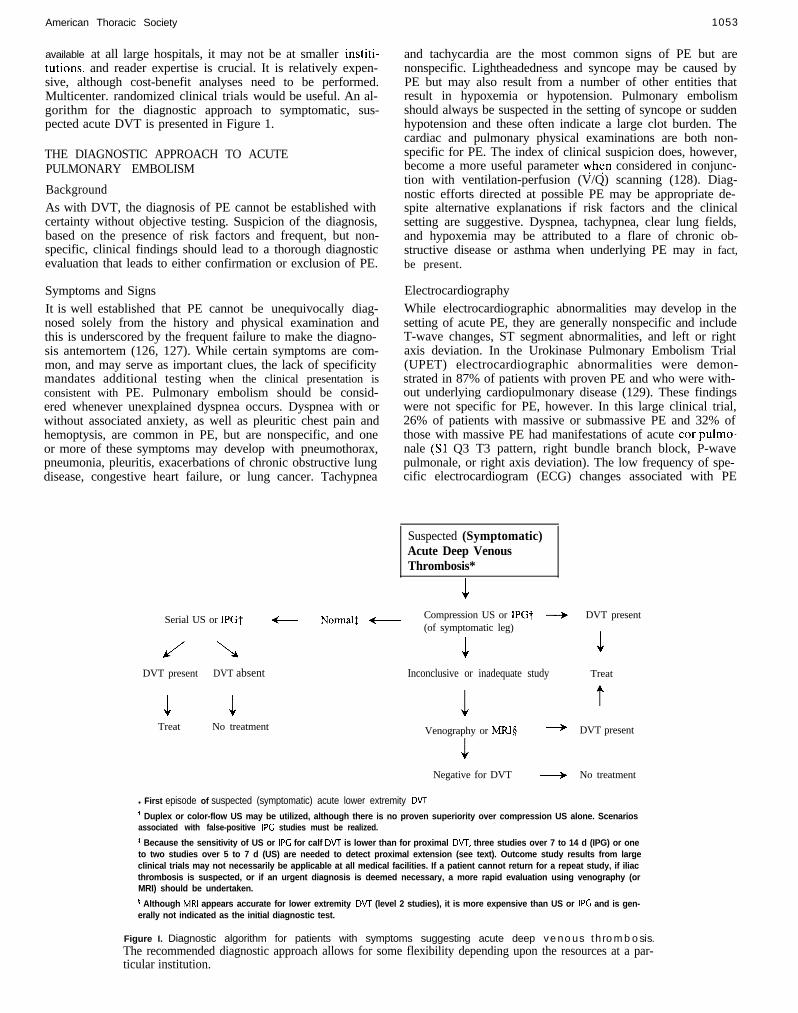
available at all large hospitals, it may not be at smaller institi-tutions, and reader expertise is crucial. It is relatively expen-sive, although cost-benefit analyses need to be performed.Multicenter. randomized clinical trials would be useful. An al-gorithm for the diagnostic approach to symptomatic, sus-pected acute DVT is presented in Figure 1.
THE DIAGNOSTIC APPROACH TO ACUTEPULMONARY EMBOLISM
BackgroundAs with DVT, the diagnosis of PE cannot be established withcertainty without objective testing. Suspicion of the diagnosis,based on the presence of risk factors and frequent, but non-specific, clinical findings should lead to a thorough diagnosticevaluation that leads to either confirmation or exclusion of PE.
Symptoms and SignsIt is well established that PE cannot be unequivocally diag-nosed solely from the history and physical examination andthis is underscored by the frequent failure to make the diagno-sis antemortem (126, 127). While certain symptoms are com-mon, and may serve as important clues, the lack of specificitymandates additional testing when the clinical presentation isconsistent with PE. Pulmonary embolism should be consid-ered whenever unexplained dyspnea occurs. Dyspnea with orwithout associated anxiety, as well as pleuritic chest pain andhemoptysis, are common in PE, but are nonspecific, and oneor more of these symptoms may develop with pneumothorax,pneumonia, pleuritis, exacerbations of chronic obstructive lungdisease, congestive heart failure, or lung cancer. Tachypnea
Serial US or IPGt
DVT present DVT absent Inconclusive or inadequate study
1 1Treat No treatment
and tachycardia are the most common signs of PE but arenonspecific. Lightheadedness and syncope may be caused byPE but may also result from a number of other entities thatresult in hypoxemia or hypotension. Pulmonary embolismshould always be suspected in the setting of syncope or suddenhypotension and these often indicate a large clot burden. Thecardiac and pulmonary physical examinations are both non-specific for PE. The index of clinical suspicion does, however,become a more useful parameter yhen considered in conjunc-tion with ventilation-perfusion (V/Q) scanning (128). Diag-nostic efforts directed at possible PE may be appropriate de-spite alternative explanations if risk factors and the clinicalsetting are suggestive. Dyspnea, tachypnea, clear lung fields,and hypoxemia may be attributed to a flare of chronic ob-structive disease or asthma when underlying PE may in fact,be present.
ElectrocardiographyWhile electrocardiographic abnormalities may develop in thesetting of acute PE, they are generally nonspecific and includeT-wave changes, ST segment abnormalities, and left or rightaxis deviation. In the Urokinase Pulmonary Embolism Trial(UPET) electrocardiographic abnormalities were demon-strated in 87% of patients with proven PE and who were with-out underlying cardiopulmonary disease (129). These findingswere not specific for PE, however. In this large clinical trial,26% of patients with massive or submassive PE and 32% ofthose with massive PE had manifestations of acute car pulmo-nale (Sl Q3 T3 pattern, right bundle branch block, P-wavepulmonale, or right axis deviation). The low frequency of spe-cific electrocardiogram (ECG) changes associated with PE
Suspected (Symptomatic)Acute Deep VenousThrombosis*
Normal1 t Compression US or IPGt -+(of symptomatic leg)
1
1Venography or MRIg -
J
Negative for DVT +
DVT present
1Treat
t
DVT present
No treatment
l First episode of suspected (symptomatic) acute lower extremity DVT
+ Duplex or color-flow US may be utilized, although there is no proven superiority over compression US alone. Scenariosassociated with false-positive IPC studies must be realized.
t Because the sensitivity of US or IPC for calf DVT is lower than for proximal DVT, three studies over 7 to 14 d (IPG) or oneto two studies over 5 to 7 d (US) are needed to detect proximal extension (see text). Outcome study results from largeclinical trials may not necessarily be applicable at all medical facilities. If a patient cannot return for a repeat study, if iliacthrombosis is suspected, or if an urgent diagnosis is deemed necessary, a more rapid evaluation using venography (orMRI) should be undertaken.
p Although MRI appears accurate for lower extremity DVT (level 2 studies), it is more expensive than US or IPC and is gen-erally not indicated as the initial diagnostic test.
Figure I. Diagnostic algorithm for patients with symptoms suggesting acute deep venous thrombosis.The recommended diagnostic approach allows for some flexibility depending upon the resources at a par-ticular institution.
1054 AMERICAN JOURNAL OF RESPIRATORY AND CRITICAL CARE MEDICINE VOL 160 1999
was confirmed in the PIOPED (Prospective Investigation ofPulmonary Embolism Diagnosis) study (128).
Arterial Blood Gas Analysis
Hypoxemia is common in acute PE, but is not universallypresent. Young patients without underlying lung disease mayhave a normal Paoz. In a retrospective analysis of hospitalizedpatients with proven PE, the Paoz was greater than 80 mm Hgin 29% of patients less than 40 yr old, compared with 3% inthe older group (130). The alveolar-arterial oxygen tensiondifference was abnormal in all patients, however. A subset ofpatients participating in the PIOPED study and suspected ofPE with no history or evidence of preexisting cardiac or pul-monary disease was evaluated, and the Pao, and alveolar-arterial difference values were compared (131). Patients withand without PE could not be distinguished on the basis of ei-ther of these values. The alveolar-arterial difference was ele-vated by more than 20 mm Hg in 76 of 88 (86%) patients withPE, however. The diagnosis of acute PE cannot be excludedon the basis of a normal Paoz and although the alveolar-arte-rial difference is usually elevated, it may be normal in patientswithout preexisting cardiopulmonary disease.
Chest Radiography
The majority of patients with PE have an abnormal but non-specific chest radiograph. Common radiographic findings in-clude atelectasis, pleural effusion, pulmonary infiltrates, andelevation of a hemidiaphragm (131). Classic suggestions ofpulmonary infarction such as Hampton’s hump or decreasedvascularity (Westermark’s sign) are suggestive but infrequent.A normal chest radiograph in the setting of severe dyspneaand hypoxemia without evidence of bronchospasm or ana-tomic cardiac shunt is strongly suggestive of PE. The presenceof a pleural effusion increases the likelihood of PE in youngpatients who present with acute pleuritic chest pain (132) Ingeneral. however, the chest radiograph cannot be used to proveor exclude PE conclusively. Diagnosing other processes suchas pneumonia, pneumothorax, or rib fracture, which may causesymptoms similar to acute PE, is important, but PE may coex-ist with other cardiopulmonary processes.
D-Dimer
Noninvasive blood tests have been evaluated in hopes of iden-tifying a specific marker of VTE. D-dimer is a specific degra-dation product released into the circulation when cross-linkedfibrin undergoes endogenous fibrinolysis (133). A number ofclinical trials have been undertaken to determine the utility ofthis test. Strategies have included the combination of V/Qscanning and D-dimer testing. Different assays have beenevaluated with different cutoff values utilized. Generally, ei-ther an enzyme-linked immunosorbent assay (ELISA) or a la-tex agglutination test has been performed. In patients withsuspected PE, a low plasma D-dimer concentration (< 500 ng/ml), measured by ELISA, has a 95% negative predictivepower. However, low D-dimcr levels have been found in onlyabout 25% of patients without PE (134, 135). A latex aggluti-nation test indicating a normal D-dimer level does not appearto be reliable in excluding PE (136, 137).
When the medical literature is systematically reviewed forpublications that compare D-dimer results with the results ofother diagnostic tests for venous thromboembolism, there ap-pears to be substantial variability in assay performance, heter-ogeneity among the patient population, and inconsistent useof definitive diagnostic criteria for venous thromboembolism(138, 139). Becker and colleagues (138) performed a thorough
review of the available literature and evaluated publicationsthat compared D-dimer results with those of objective diag-nostic tests for DVT or PE. Each study was evaluated inde-pendently by three reviewers. Articles meeting appropriatestandards were designated level 1. The following conclusionswere reached: (I) results of clinical studies utilizing one manu-facturer D-dime, assay cannot be extrapolated to another; (2)no one test has been established as the best. The ELISAs aresensitive but cannot be performed rapidly. The latex tests,while rapid, have not been proved to be sufficiently sensitive.There are insufficient data available regarding the newer im-munofiltration techniques: (3) future studies should bc morerigorous regarding the definitive presence or absence of DVTand PE, and should as well address issues such as the extent ofthrombosis, clinical setting, and comorbidity; and (4) addi-tional outcome studies are needed.
Since the publication of above-described review, both DVTand PE management studies have been performed with thera-peutic decisions based, in part, on D-dimer results. Ginsbergand colleagues (140) evaluated the results of a bedside wholeblood agglutination D-dimer assay together with IPG in pa-tients with suspected DVT. When both studies were negative,anticoagulation was withheld and the patients were monitoredfor 3 mo. In this group of patients, the negative predictivevalue was 98.5% (95% confidence interval, 96.339Y.6). For theD-dimer test alone, the negative predictive value was 07.2%.Perrier and colleagues (141) evaluated 308 consecutive pa-tients presenting to the emergency room with suspected PE.Each patient was managed according to a diagnostic protocolincluding an assessment of clinical probability, V/Q scan,ELISA plasma D-dimer, and lower extremity IJS. Of the 30Xpatients, 106 (34%) had diagnostic V/Q scans (high probabil-ity in 63 and normal in 43). The noninvasive evaluation was di-agnostic in 125 patients (62%). In 4X patients, PE was ruledout by a nondiagnostic lung scan together with low clinicalprobability. In 53 cases, it was ruled out by a quantitativeD-dimer of less than SO0 kg/L. Only 77 of the 202 patientswith nondiagnostic V/Q scans required pulmonary angiogra-phy. At 6-mo follow-up, only 2 of the 190 patients in whom thediagnostic protocol had ruled out PE had a VTE event. llsingthe same cutoff value for the quantitative D-dimcr test, theseinvestigators subsequently reported that of IYX patients withsuspected PE and a D-dimer level, < 500 kg/L, 1Y6 were freeof PE, 1 had PE, and one was lost to follow-up (142). Thus, thenegative predictive value of the D-dimer test was approxi-mately 196 of 198 (99%). These data, although from onegroup of investigators, are encouraging. Rapid “bedside as-says” are becoming increasingly available and additional out-come studies will further define their role. However, the D-dimertest cannot be recommended as a standard part of the PE orDVT diagnostic algorithm at the present time.
The Ventilation-Perfusion Scan
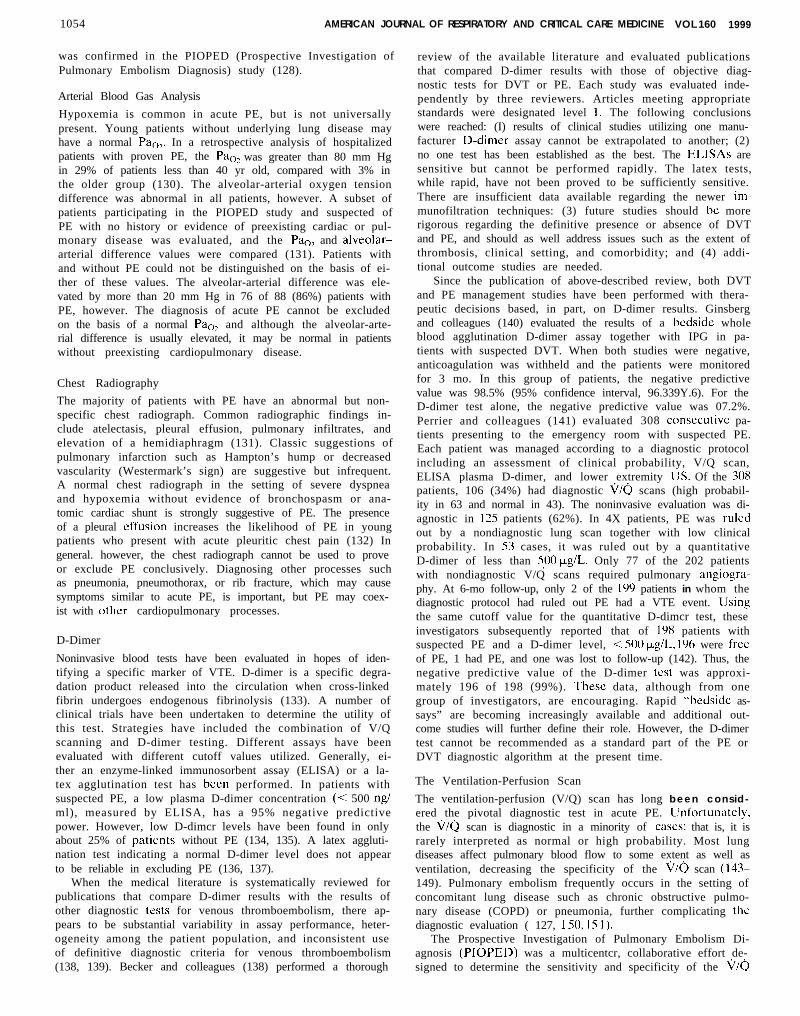
The ventilation-perfusion (V/Q) scan has long been consid-ered the pivotal diagnostic test in acute PE. linfortunately,the V/Q scan is diagnostic in a minority of casts: that is, it israrely interpreted as normal or high probability. Most lungdiseases affect pulmonary blood flow to some extent as well asventilation, decreasing the specificity of the V/Q scan (143-149). Pulmonary embolism frequently occurs in the setting ofconcomitant lung disease such as chronic obstructive pulmo-nary disease (COPD) or pneumonia, further complicating thediagnostic evaluation ( 127, I SO, 15 1).
The Prospective Investigation of Pulmonary Embolism Di-agnosis (PIOPED) was a multicentcr, collaborative effort de-signed to determine the sensitivity and specificity of the V/Q
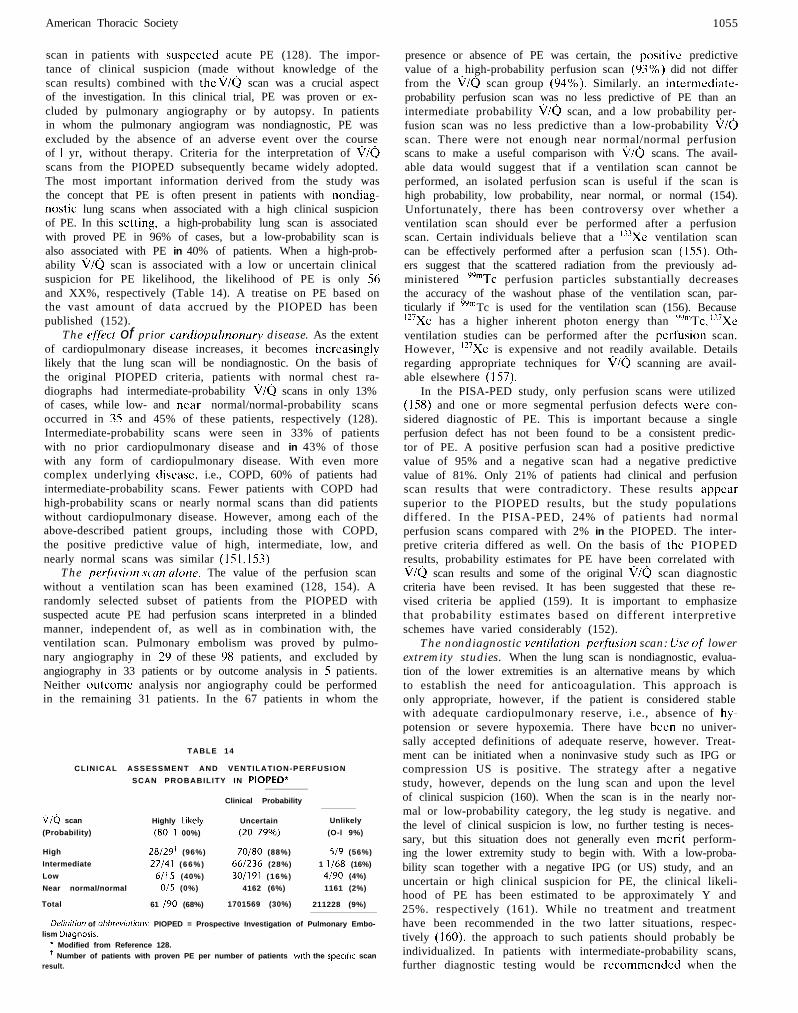
American Thoracic Society 1055
scan in patients with suspected acute PE (128). The impor-tance of clinical suspicion (made without knowledge of thescan results) combined with the i//o scan was a crucial aspectof the investigation. In this clinical trial, PE was proven or ex-cluded by pulmonary angiography or by autopsy. In patientsin whom the pulmonary angiogram was nondiagnostic, PE wasexcluded by the absence of an adverse event over the courseof 1 yr, without therapy. Criteria for the interpretation of \i/oscans from the PIOPED subsequently became widely adopted.The most important information derived from the study wasthe concept that PE is often present in patients with nondiag-nostic lung scans when associated with a high clinical suspicionof PE. In this setting, a high-probability lung scan is associatedwith proved PE in 96% of cases, but a low-probability scan isalso associated with PE in 40% of patients. When a high-prob-ability \ilQ scan is associated with a low or uncertain clinicalsuspicion for PE likelihood, the likelihood of PE is only 56and XX%, respectively (Table 14). A treatise on PE based onthe vast amount of data accrued by the PIOPED has beenpublished (152).
The ejyict of prior curdiopulmonury disease. As the extentof cardiopulmonary disease increases, it becomes increasinglylikely that the lung scan will be nondiagnostic. On the basis ofthe original PIOPED criteria, patients with normal chest ra-diographs had intermediate-probability v/Q scans in only 13%of cases, while low- and near normal/normal-probability scansoccurred in 35 and 45% of these patients, respectively (128).Intermediate-probability scans were seen in 33% of patientswith no prior cardiopulmonary disease and in 43% of thosewith any form of cardiopulmonary disease. With even morecomplex underlying disease, i.e., COPD, 60% of patients hadintermediate-probability scans. Fewer patients with COPD hadhigh-probability scans or nearly normal scans than did patientswithout cardiopulmonary disease. However, among each of theabove-described patient groups, including those with COPD,the positive predictive value of high, intermediate, low, andnearly normal scans was similar (151, 153)
The p~tfksion Scan ulone. The value of the perfusion scanwithout a ventilation scan has been examined (128, 154). Arandomly selected subset of patients from the PIOPED withsuspected acute PE had perfusion scans interpreted in a blindedmanner, independent of, as well as in combination with, theventilation scan. Pulmonary embolism was proved by pulmo-nary angiography in 20 of these 9X patients, and excluded byangiography in 33 patients or by outcome analysis in 5 patients.Neither outcome analysis nor angiography could be performedin the remaining 31 patients. In the 67 patients in whom the
TABLE 14
CLINICAL ASSESSMENT AND VENTILATION-PERFUSION
SCAN PROBABILITY IN PIOPED*
Clinical Probability
OKj scan Highly Ltkely Uncertain Unlikely
(Probability) (80-l 00%) (20-79%) (O-l 9%)
High 28/29l (96%) 70180 (88%) 519 (56%)
Intermediate 27141 (66%) 661236 (28%) 1 1168 (16%)
Low 6115 (40%) 30/191 (16%) 4190 (4%)
Near normal/normal 015 (0%) 4162 (6%) 1161 (2%)
Total 61 I90 (68%) 1701569 (30%) 211228 (9%)
Definition of abbreviotionr: PIOPED = Prospective Investigation of Pulmonary Embo-lism Diagnosis.
* Modified from Reference 128.’ Number of patients with proven PE per number of patients with the specific scan
result.
presence or absence of PE was certain, the positive predictivevalue of a high-probability perfusion scan (C)3%) did not differfrom the \ilQ scan group (c)4%). Similarly. an intermediate-probability perfusion scan was no less predictive of PE than anintermediate probability i//Q scan, and a low probability per-fusion scan was no less predictive than a low-probability \i/Gscan. There were not enough near normal/normal perfusionscans to make a useful comparison with i//Q scans. The avail-able data would suggest that if a ventilation scan cannot beperformed, an isolated perfusion scan is useful if the scan ishigh probability, low probability, near normal, or normal (154).Unfortunately, there has been controversy over whether aventilation scan should ever be performed after a perfusionscan. Certain individuals believe that a ‘j3Xe ventilation scancan be effectively performed after a perfusion scan (155). Oth-ers suggest that the scattered radiation from the previously ad-ministered yymTc perfusion particles substantially decreasesthe accuracy of the washout phase of the ventilation scan, par-ticularly if yym Tc is used for the ventilation scan (156). Because‘*‘Xe has a higher inherent photon energy than L’L’n’Tc, “‘Xeventilation studies can be performed after the perfusion scan.However, 127Xe is expensive and not readily available. Detailsregarding appropriate techniques for i//o scanning are avail-able elsewhere (I 57).
In the PISA-PED study, only perfusion scans were utilized(158) and one or more segmental perfusion defects were con-sidered diagnostic of PE. This is important because a singleperfusion defect has not been found to be a consistent predic-tor of PE. A positive perfusion scan had a positive predictivevalue of 95% and a negative scan had a negative predictivevalue of 81%. Only 21% of patients had clinical and perfusionscan results that were contradictory. These results appearsuperior to the PIOPED results, but the study populationsdiffered. In the PISA-PED, 24% of patients had normalperfusion scans compared with 2% in the PIOPED. The inter-pretive criteria differed as well. On the basis of the PIOPEDresults, probability estimates for PE have been correlated withv/Q scan results and some of the original i//o scan diagnosticcriteria have been revised. It has been suggested that these re-vised criteria be applied (159). It is important to emphasizethat probability estimates based on different interpretiveschemes have varied considerably (152).
The nondiagnostic ventilation-perfilsion scan: Use of lowerextremity studies. When the lung scan is nondiagnostic, evalua-tion of the lower extremities is an alternative means by whichto establish the need for anticoagulation. This approach isonly appropriate, however, if the patient is considered stablewith adequate cardiopulmonary reserve, i.e., absence of hy-potension or severe hypoxemia. There have been no univer-sally accepted definitions of adequate reserve, however. Treat-ment can be initiated when a noninvasive study such as IPG orcompression US is positive. The strategy after a negativestudy, however, depends on the lung scan and upon the levelof clinical suspicion (160). When the scan is in the nearly nor-mal or low-probability category, the leg study is negative. andthe level of clinical suspicion is low, no further testing is neces-sary, but this situation does not generally even merit perform-ing the lower extremity study to begin with. With a low-proba-bility scan together with a negative IPG (or US) study, and anuncertain or high clinical suspicion for PE, the clinical likeli-hood of PE has been estimated to be approximately Y and25%. respectively (161). While no treatment and treatmenthave been recommended in the two latter situations, respec-tively (160), the approach to such patients should probably beindividualized. In patients with intermediate-probability scans,further diagnostic testing would be recommended when the
1056 AMERICAN JOURNAL OF RESPIRATORY AND CRITICAL CARE MEDICINE VOL 160 1999
lower extremity study is negative. The “further evaluation”would traditionally involve pulmonary angiography, particu-larly in an unstahlc patient. In a stable patient, serial noninva-sive lower extremity studies would also be appropriate.
Serial noninvasive lower extremity studies offer the oppor-tunity to scrutinize the patient with a nondiagnostic lung scanmore closely. Hull and colleagues (162) prospectively evalu-ated 1,564 consecutive patients with suspected PE and ade-quate cardiopulmonary reserve who underwent V/Q scanningand serial IPG. Adequate reserve was defined as the absenceof the following: pulmonary edema, right ventricular failure,hypotension (systolic blood pressure < 90 mm Hg), syncope.acute tachyarrhythmias, forced expiratory volume < 1 .O L, vi-tal capacity < I .S L, Paz < SO mm Hg or Pc.02 > 45 mm Hg. Ofthe 627 patients with nondiagnostic lung scans and negativeserial IPG in whom treatment was withheld, only 12 (1.9%)had VTE on long-term follow-up. Of interest, 4 of the 586(0.7%) untreated patients with normal lung scans, and 8 of the145 (5.5%) patients with high-probability scans (who receivedtreatment), developed VTE subsequently. This plan has beenshown to reduce the need for angiography and appears costeffective (163. 164). Thus, it appears appropriate to incorpo-rate such an approach at centers where these validated proto-cols are utilized and whcrc follow-up is guaranteed. On thebasis of available data in which the sensitivity of MRI in clini-cal studies of suspected lower extremity DVT has been exam-ined, this technique may prove effective in the setting of anondiagnostic V/Q scan (level 2 studies) (I 18, 120-122).
Pulmonary Angiography
Pulmonary angiography has been considered the gold stan-dard diagnostic technique for PE. The historic development ofthis technique has been described (16s. 166). The most com-mon diagnostic algorithm for PE has consisted of V/Q scan-ning followed by pulmonary angiography when the scan isnondiagnostic and the clinical suspicion high. The validity ofthis approach was established in the PlOPED (167). All pa-tients were monitored for 1 yr after the pulmonary angiogramwas performed to determine the incidence of PE, complica-tions of anticoagulation, or death. Patients were scrutinized indetail for the possibility of PE. and a negative angiogram read-ing could potentially bc reversed by the outcome classificationcommittee. Among I ,I I1 patients in whom pulmonary angiog-raphy was performed, 3X3 (35%) had positive angiograms,and 6X1 (61%) had negative studies. Angiography was nondi-agnostic in 35 patients (3%) and was not completed in 12 indi-viduals ( I%), generally because of associated complications.It is important to emphasize that these PIOPED readingswere consensus readings with the potential for more detailedscrutiny than in the usual clinical setting. The interobserveragreement in the PIOPED was, nonetheless, not perfect. Bothangiography readers agreed that PE was present or bothagreed that it could not be diagnosed with certainty in 92% ofcases. Both agreed that PE was absent or both agreed that itcould not be excluded with certainty in 82% of cases. Interob-server agrecmcnt was 08% for lobar PE, YO% for segmentalPE. and only 66% for subsegmental emboli (167). The inci-dence of nondiagnostic angiograms in the PIOPED is, how-ever, similar to that determined in other large studies (168).Nonethclcss, the sensitivity, specificity and complication rateof this tcchniquc in the community hospital setting are not en-tirely clear (169).
Pulmonary angiography for the purpose of diagnosingacute PE is unnecessary when the perfusion scan is normal.Relative contraindications lo the procedure include significantbleeding risk and renal insufficiency. The procedure can gen-
erally safely be performed when the platelet count is at least7S,000/mm3 and if coagulation studies are normal or minimallyabnormal (170). In patients with renal insufficiency, adequatehydration must be maintained before, during, and after theangiogram. Diseases such as diabetes or multiple myelomamay increase the frequency of acute renal insufficiency afterangiography. The presence of a left bundle branch block is anindication for a temporary pacemaker during the procedure toprotect against complete heart block. The electrocardiogramshould be reviewed for any potential arrhythmias. Pulmonaryangiography should be performed by an experienced angiog-rapher. The most frequent site of access is the femoral vein,preferably on the right. The basilic vein or the right internaljugular may also be used. A number of different cathetershave been utilized for the procedure. with a Grollman or pig-tail catheter being commonly used ( 170). Biplane angiographyallows for two views with each contrast injection. Subselective(lobar or segmental) injections are often useful, with or with-out magnification. Balloon occlusion angiography may also beuseful (171). The technique of selective pulmonary angiogra-phy and details regarding interpretation have been reviewedand are not discussed in detail here (166, 170). Pulmonary em-bolism is definitively diagnosed angiographically by the pres-ence of an intralumenal filling defect in two views and thedemonstration of an occluded pulmonary artery with or with-out a trailing edge. Secondary criteria are nonspecific and in-clude reduced perfusion and flow, abnormal pulmonary pa-renchymal stain, tortuous peripheral vessels, and delayed venousreturn (170).
Complications related to pulmonary angiography have beenreported in several large clinical trials (128, 167, 168, 172). Inthe PIOPED, death occurred in the setting of pulmonary an-giography in 5 of 1,111 patients (0.5%) (167). Other severecomplications in this trial included severe cardiopulmonarycompromise requiring intubation or cardiopulmonary rcsusci-tation in four patients (0.4%) renal failure requiring dialysisin three (0.3%), or groin hematomas requiring transfusion oftwo units of blood in two (0.2%). Less scvcre complicationsincluded an elevation in the serum creatinine without the needfor dialysis. This occurred in IO patients (0.9%). Major com-plications of angiography were reported in 43 of 1,350 patients(3%) patients by Mills and colleagues (172). Death occurredin three patients (().20/o), each with pulmonary hypertensionand car pulmonale. Other major complications included car-diac perforation in 14 (I%), major arrhythmias in I I (I%),cardiac arrest with successful resuscitation in 6 patients (0.4%).and significant contrast reaction in 4 patients (0.3%). Deathrelated to angiography has been documented in other clinicaltrials but appears rare. Dalen and associates (16X) reportedsignificant complications in I3 of 367 patients (4%) undergo-ing angiography because of suspected PE, including one death(0.3%). Hull and associates (173) reported no deaths among104 patients. Bleeding in patients undergoing angiographymay occur, particularly when thrombolytic therapy is adminis-tered, and a noninvasive diagnostic approach may reduce thefrequency of this complication (174, 175). Except for renal in-sufficiency, complications related to age do not appear morecommon when angiography is performed (167. 176). In gen-eral, when a definitive diagnosis is necessary, the benefit ofthe procedure outweighs the risk.
Major complications due to pulmonary angiography ap-pear to have been reported to bc more common in patients rc-ferred for the procedure from medical intensive care units. Ofthe 1 ,l I1 patients described from the PIOPED study, 5 of I22(4%) developed major complications compared with Y of 089(1%) who were not as critically ill (167). It is interesting that in
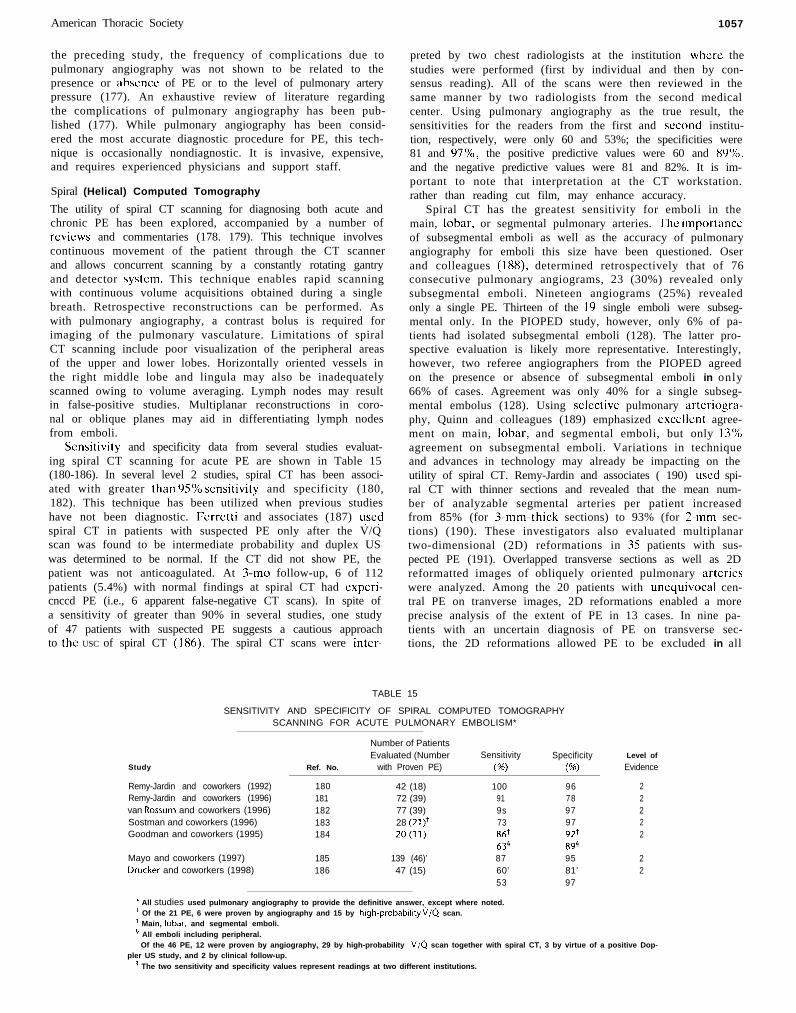
American Thoracic Society
the preceding study, the frequency of complications due topulmonary angiography was not shown to be related to thepresence or ahscnce of PE or to the level of pulmonary arterypressure (177). An exhaustive review of literature regardingthe complications of pulmonary angiography has been pub-lished (177). While pulmonary angiography has been consid-ered the most accurate diagnostic procedure for PE, this tech-nique is occasionally nondiagnostic. It is invasive, expensive,and requires experienced physicians and support staff.
Spiral (Helical) Computed Tomography
The utility of spiral CT scanning for diagnosing both acute andchronic PE has been explored, accompanied by a number ofrcvicws and commentaries (178. 179). This technique involvescontinuous movement of the patient through the CT scannerand allows concurrent scanning by a constantly rotating gantryand detector system. This technique enables rapid scanningwith continuous volume acquisitions obtained during a singlebreath. Retrospective reconstructions can be performed. Aswith pulmonary angiography, a contrast bolus is required forimaging of the pulmonary vasculature. Limitations of spiralCT scanning include poor visualization of the peripheral areasof the upper and lower lobes. Horizontally oriented vessels inthe right middle lobe and lingula may also be inadequatelyscanned owing to volume averaging. Lymph nodes may resultin false-positive studies. Multiplanar reconstructions in coro-nal or oblique planes may aid in differentiating lymph nodesfrom emboli.
Sensitivity and specificity data from several studies evaluat-ing spiral CT scanning for acute PE are shown in Table 15(180-186). In several level 2 studies, spiral CT has been associ-ated with greater than YS% sensitivity and specificity (180,182). This technique has been utilized when previous studieshave not been diagnostic. Ferretti and associates (187) usedspiral CT in patients with suspected PE only after the V/Qscan was found to be intermediate probability and duplex USwas determined to be normal. If the CT did not show PE, thepatient was not anticoagulated. At 3-mo follow-up, 6 of 112patients (5.4%) with normal findings at spiral CT had experi-cnccd PE (i.e., 6 apparent false-negative CT scans). In spite ofa sensitivity of greater than 90% in several studies, one studyof 47 patients with suspected PE suggests a cautious approachto the USC of spiral CT (186). The spiral CT scans were inter-
1057
preted by two chest radiologists at the institution where thestudies were performed (first by individual and then by con-sensus reading). All of the scans were then reviewed in thesame manner by two radiologists from the second medicalcenter. Using pulmonary angiography as the true result, thesensitivities for the readers from the first and second institu-tion, respectively, were only 60 and 53%; the specificities were81 and 97%, the positive predictive values were 60 and Xc)%.and the negative predictive values were 81 and 82%. It is im-portant to note that interpretation at the CT workstation.rather than reading cut film, may enhance accuracy.
Spiral CT has the greatest sensitivity for emboli in themain, lobar, or segmental pulmonary arteries. The imporlanccof subsegmental emboli as well as the accuracy of pulmonaryangiography for emboli this size have been questioned. Oserand colleagues (188), determined retrospectively that of 76consecutive pulmonary angiograms, 23 (30%) revealed onlysubsegmental emboli. Nineteen angiograms (25%) revealedonly a single PE. Thirteen of the 19 single emboli were subseg-mental only. In the PIOPED study, however, only 6% of pa-tients had isolated subsegmental emboli (128). The latter pro-spective evaluation is likely more representative. Interestingly,however, two referee angiographers from the PIOPED agreedon the presence or absence of subsegmental emboli in only66% of cases. Agreement was only 40% for a single subseg-mental embolus (128). Using selective pulmonary artcriogra-phy, Quinn and colleagues (189) emphasized excellent agree-ment on main, lobar, and segmental emboli, but only 13%agreement on subsegmental emboli. Variations in techniqueand advances in technology may already be impacting on theutility of spiral CT. Remy-Jardin and associates ( 190) used spi-ral CT with thinner sections and revealed that the mean num-ber of analyzable segmental arteries per patient increasedfrom 85% (for 3-mm-thick sections) to 93% (for 2-mm sec-tions) (190). These investigators also evaluated multiplanartwo-dimensional (2D) reformations in 35 patients with sus-pected PE (191). Overlapped transverse sections as well as 2Dreformatted images of obliquely oriented pulmonary artcricswere analyzed. Among the 20 patients with unequivocal cen-tral PE on tranverse images, 2D reformations enabled a moreprecise analysis of the extent of PE in 13 cases. In nine pa-tients with an uncertain diagnosis of PE on transverse sec-tions, the 2D reformations allowed PE to be excluded in all
TABLE 15
SENSITIVITY AND SPECIFICITY OF SPIRAL COMPUTED TOMOGRAPHYSCANNING FOR ACUTE PULMONARY EMBOLISM*
Number of PatientsEvaluated (Number Sensitivity Specificity Level of
Study Ref. No. with Proven PE) (W (W Evidence
Remy-Jardin and coworkers (1992) 180 42 (18) 100 96 2Remy-Jardin and coworkers (1996) 181 72 (39) 91 78 2van Rossum and coworkers (1996) 182 77 (39) 9s 97 2Sostman and coworkers (1996) 183 28 (21)+ 73 97 2Goodman and coworkers (1995) 184 20(11) 8& 92* 2
634 894Mayo and coworkers (1997) 185 139 (46)’ 87 95 2Drucker and coworkers (1998) 186 47 (15) 60’ 81’ 2
53 97
* All studies used pulmonary angiography to provide the definitive answer, except where noted.+ Of the 21 PE, 6 were proven by angiography and 15 by high-probablllty o/o scan.t Main, lobar, and segmental emboli.p All emboli including peripheral.” Of the 46 PE, 12 were proven by angiography, 29 by high-probability i//Q scan together with spiral CT, 3 by virtue of a positive Dop-
pler US study, and 2 by clinical follow-up.v The two sensitivity and specificity values represent readings at two different institutions.
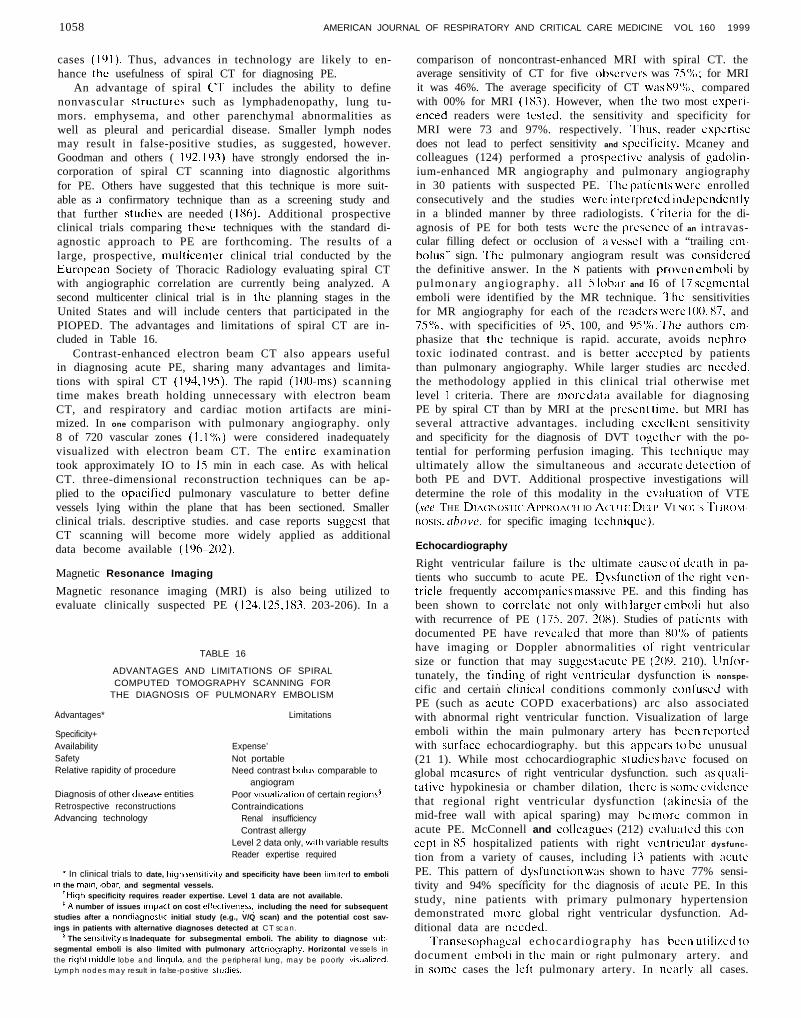
1058 AMERICAN JOURNAL OF RESPIRATORY AND CRITICAL CARE MEDICINE VOL 160 1999
cases (IYI). Thus, advances in technology are likely to en-hance the usefulness of spiral CT for diagnosing PE.
An advantage of spiral (‘T includes the ability to definenonvascular structures such as lymphadenopathy, lung tu-mors. emphysema, and other parenchymal abnormalities aswell as pleural and pericardial disease. Smaller lymph nodesmay result in false-positive studies, as suggested, however.Goodman and others ( 192. I Y.3) have strongly endorsed the in-corporation of spiral CT scanning into diagnostic algorithmsfor PE. Others have suggested that this technique is more suit-able as 21 confirmatory technique than as a screening study andthat further studies are needed (186). Additional prospectiveclinical trials comparing these techniques with the standard di-agnostic approach to PE are forthcoming. The results of alarge, prospective, multicenter clinical trial conducted by theEuropean Society of Thoracic Radiology evaluating spiral CTwith angiographic correlation are currently being analyzed. Asecond multicenter clinical trial is in the planning stages in theUnited States and will include centers that participated in thePIOPED. The advantages and limitations of spiral CT are in-cluded in Table 16.
Contrast-enhanced electron beam CT also appears usefulin diagnosing acute PE, sharing many advantages and limita-tions with spiral CT (194. 195). The rapid (100-ms) scanningtime makes breath holding unnecessary with electron beamCT, and respiratory and cardiac motion artifacts are mini-mized. In one comparison with pulmonary angiography. only8 of 720 vascular zones (1. I %) were considered inadequatelyvisualized with electron beam CT. The entire examinationtook approximately IO to IS min in each case. As with helicalCT. three-dimensional reconstruction techniques can be ap-plied to the opacified pulmonary vasculature to better definevessels lying within the plane that has been sectioned. Smallerclinical trials. descriptive studies. and case reports suggest thatCT scanning will become more widely applied as additionaldata become available (196-202).
Magnetic Resonance Imaging
Magnetic resonance imaging (MRI) is also being utilized toevaluate clinically suspected PE (124, 125, 18.3, 203-206). In a
TABLE 16
ADVANTAGES AND LIMITATIONS OF SPIRALCOMPUTED TOMOGRAPHY SCANNING FOR
THE DIAGNOSIS OF PULMONARY EMBOLISM
Advantages*
Specificity+AvailabilitySafetyRelative rapidity of procedure
Diagnosis of other disease entitiesRetrospective reconstructionsAdvancing technology
Limitations
Expense’Not portableNeed contrast bolus comparable to
angiogramPoor wsualiration of certain regions4Contraindications
Renal insufficiencyContrast allergy
Level 2 data only, wth variable resultsReader expertise required
* In clinical trials to date, high sensitivity and specificity have been llmlted to emboliI” the ma,“, lobar, and segmental vessels.
’ High specificity requires reader expertise. Level 1 data are not available.*A number of issues Impact on cost effectivenqss,, including the need for subsequent
studies after a nondlagnostic initial study (e.g., V/Q scan) and the potential cost sav-ings in patients with alternative diagnoses detected at CT scan.
’ The sensitivity IS Inadequate for subsegmental emboli. The ability to diagnose sub-segmental emboli is also limited with pulmonary arterlography. Horizontal vessels inthe right mlddle lobe and lingula, and the peripheral lung, may be poorly visualized.Lymph nodes may result in false-positive studies.
comparison of noncontrast-enhanced MRI with spiral CT. theaverage sensitivity of CT for five obscrvcrs was 7.5%: for MRIit was 46%. The average specificity of CT ~21s 89%. comparedwith 00% for MRI (1X3). However, when the two most cxperi-enced readers were tested. the sensitivity and specificity forMRI were 73 and 97%. respectively. ‘l‘hus, reader cxpertiscdoes not lead to perfect sensitivity and specificity. Mcaney andcolleagues (124) performed a prospcctivc analysis of gadolin-ium-enhanced MR angiography and pulmonary angiographyin 30 patients with suspected PE. The patients wcrc enrolledconsecutively and the studies wcrc interpreted independentlyin a blinded manner by three radiologists. C’riteria for the di-agnosis of PE for both tests were the prcscnce of an intravas-cular filling defect or occlusion of a vessel with a “trailing cm-bolus” sign. The pulmonary angiogram result was consideredthe definitive answer. In the X patients with proven emholi bypulmonary angiography. al l 5 lobar and I6 of 17 segmentalemboli were identified by the MR technique. The sensitivitiesfor MR angiography for each of the readers wcrc 100. X7, and75%, with specificities of 9.5. 100, and YS%. The authors cm-phasize that the technique is rapid. accurate, avoids ncphro-toxic iodinated contrast. and is better accepted by patientsthan pulmonary angiography. While larger studies arc needed.the methodology applied in this clinical trial otherwise metlevel I criteria. There are more dat;~ available for diagnosingPE by spiral CT than by MRI at the present time. but MRI hasseveral attractive advantages. including excellent sensitivityand specificity for the diagnosis of DVT togcthcr with the po-tential for performing perfusion imaging. This tcchniquc mayultimately allow the simultaneous and accurate dctcction ofboth PE and DVT. Additional prospective investigations willdetermine the role of this modality in the evaluation of VTE(set THE DIA(;NOSIX. AI~IN>A(.II IO A(I 1.1 I: DI,I I’ VI NOI IS ‘1‘1 IKOM-BOSIS. N~OVP, for specific imaging technique).
Echocardiography
Right ventricular failure is the ultimate CALISC of death in pa-tients who succumb to acute PE. Dvsfunction of the right vcn-tricle frequently accompanies ITI&VC PE. and this finding hasbeen shown to correlate not only with larger cmholi hut alsowith recurrence of PE (175, 207. 20X). Studies of patients withdocumented PE have revealed that more than 80% of patientshave imaging or Doppler abnormalities of right ventricularsize or function that may suggest :tcutc PE (209. 210). linfor-tunately, the findin! of right ventricular dysfunction is nonspe-
cific and certain clmical conditions commonly conl‘uxecl withPE (such as acute COPD exacerbations) arc also associatedwith abnormal right ventricular function. Visualization of largeemboli within the main pulmonary artery has been rcportcdwith surface echocardiography. but this zrppwrs to bc unusual(21 1). While most cchocardiographic studies have focused onglobal measures of right ventricular dysfunction. such ;IS yuali-talive hypokinesia or chamber dilation, there is some cviduncethat regional right ventricular dysfunction (akincsia of themid-free wall with apical sparing) may be IIWIK common inacute PE. McConnell and colleagues (212) cv;~lu;~lcd this COII-
cept in X5 hospitalized patients with right ventricular dysfunc-
tion from a variety of causes, including 1.3 patients with acutePE. This pattern of pvsfunction W~IS shown to have 77% sensi-tivity and 94% specificity for the diagnosis of acute PE. In thisstudy, nine patients with primary pulmonary hypertensiondemonstrated more global right ventricular dysfunction. Ad-ditional data are needed.
Transesophagcal echocardiography has been utili/cd todocument cmboli in the main or right pulmonary artery. andin some cases the Icft pulmonary artery. In nearly all cases.
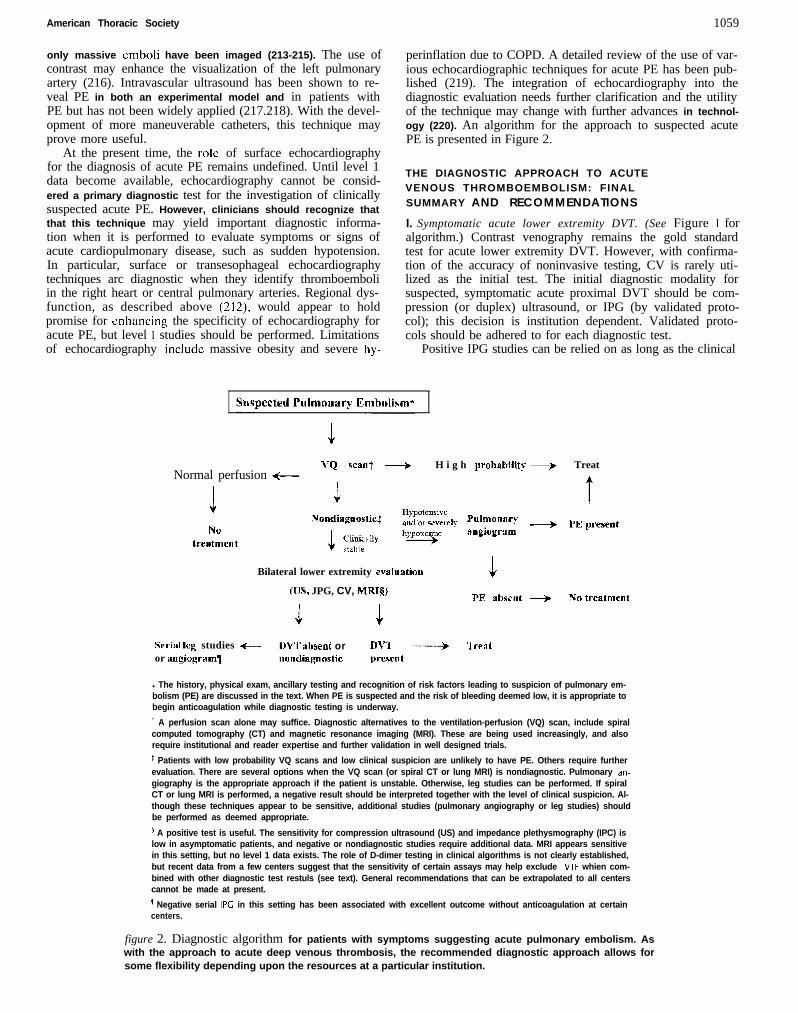
American Thoracic Society 1059
only massive emboli have been imaged (213-215). The use ofcontrast may enhance the visualization of the left pulmonaryartery (216). Intravascular ultrasound has been shown to re-veal PE in both an experimental model and in patients withPE but has not been widely applied (217.218). With the devel-opment of more maneuverable catheters, this technique mayprove more useful.
perinflation due to COPD. A detailed review of the use of var-ious echocardiographic techniques for acute PE has been pub-lished (219). The integration of echocardiography into thediagnostic evaluation needs further clarification and the utilityof the technique may change with further advances in technol-ogy (220). An algorithm for the approach to suspected acutePE is presented in Figure 2.
At the present time, the role of surface echocardiographyfor the diagnosis of acute PE remains undefined. Until level 1data become available, echocardiography cannot be consid-ered a primary diagnostic test for the investigation of clinicallysuspected acute PE. However, clinicians should recognize thatthat this technique may yield important diagnostic informa-tion when it is performed to evaluate symptoms or signs ofacute cardiopulmonary disease, such as sudden hypotension.In particular, surface or transesophageal echocardiographytechniques arc diagnostic when they identify thromboemboliin the right heart or central pulmonary arteries. Regional dys-function, as described above (212), would appear to holdpromise for enhancing the specificity of echocardiography foracute PE, but level I studies should be performed. Limitationsof echocardiography include massive obesity and severe hy-
THE DIAGNOSTIC APPROACH TO ACUTEVENOUS THROMBOEMBOLISM: FINALSUMMARY AND RECOMMENDATIONS
I. Symptomatic acute lower extremity DVT. (See Figure I foralgorithm.) Contrast venography remains the gold standardtest for acute lower extremity DVT. However, with confirma-tion of the accuracy of noninvasive testing, CV is rarely uti-lized as the initial test. The initial diagnostic modality forsuspected, symptomatic acute proximal DVT should be com-pression (or duplex) ultrasound, or IPG (by validated proto-col); this decision is institution dependent. Validated proto-cols should be adhered to for each diagnostic test.
Positive IPG studies can be relied on as long as the clinical
VQ want + H i g h prol,ahiJity + TreatNormal perfusion ++--
I t3NO
treatmcllt
Bilateral lower extremity evaluatiou
(IJS, JPG, CV, ICIRTQPE nhscllt + Nn trcatmcnt
Swinl Icg studies +- DW iWent or D\‘+K ------+ ‘1 realor angiogramll nondiqnnstic prcscnt
l The history, physical exam, ancillary testing and recognition of risk factors leading to suspicion of pulmonary em-bolism (PE) are discussed in the text. When PE is suspected and the risk of bleeding deemed low, it is appropriate tobegin anticoagulation while diagnostic testing is underway.
’ A perfusion scan alone may suffice. Diagnostic alternatives to the ventilation-perfusion (VQ) scan, include spiralcomputed tomography (CT) and magnetic resonance imaging (MRI). These are being used increasingly, and alsorequire institutional and reader expertise and further validation in well designed trials.
* Patients with low probability VQ scans and low clinical suspicion are unlikely to have PE. Others require furtherevaluation. There are several options when the VQ scan (or spiral CT or lung MRI) is nondiagnostic. Pulmonary an-giography is the appropriate approach if the patient is unstable. Otherwise, leg studies can be performed. If spiralCT or lung MRI is performed, a negative result should be interpreted together with the level of clinical suspicion. Al-though these techniques appear to be sensitive, additional studies (pulmonary angiography or leg studies) shouldbe performed as deemed appropriate.
’ A positive test is useful. The sensitivity for compression ultrasound (US) and impedance plethysmography (IPC) islow in asymptomatic patients, and negative or nondiagnostic studies require additional data. MRI appears sensitivein this setting, but no level 1 data exists. The role of D-dimer testing in clinical algorithms is not clearly established,but recent data from a few centers suggest that the sensitivity of certain assays may help exclude VTE whien com-bined with other diagnostic test restuls (see text). General recommendations that can be extrapolated to all centerscannot be made at present.
s Negative serial IPC in this setting has been associated with excellent outcome without anticoagulation at certaincenters.
figure 2. Diagnostic algorithm for patients with symptoms suggesting acute pulmonary embolism. Aswith the approach to acute deep venous thrombosis, the recommended diagnostic approach allows forsome flexibility depending upon the resources at a particular institution.
1060 AMERICAN JOURNAL OF RESPIRATORY AND CRITICAL CARE MEDICINE VOL 160 1999
conditions associated with a high false-positive rate are real-ized. This recommendation is based on level 1 studies. If thetest is initially negative, the diagnostic approach should be in-dividualized. Outcome studies suggest a low risk without anti-coagulation, provided serial IPG studies over a 7- to 14-d pe-riod remain negative. The decision to do further testing,rather than serial IPG, depends on the clinical setting, diag-nostic testing resources, and the experience at the particularinstitution.
Compression US has proved highly sensitive and specific insymptomatic patients with acute proximal DVT, and is an ap-propriate initial diagnostic test. This recommendation is basedon level I studies. Compression US with venous imaging (real-time B-mode imaging), duplex US, and color Doppler all relyon vein noncompressibility as the primary criterion for the di-agnosis of DVT. A clear advantage of one US technique overanother has not been demonstrated in prospective clinical tri-als as long as compression is used. Each of the US modalitiesis highly operator dependent. Level 1 data exist supporting theuse of serial US testing (repeat US in 5 to 7 d) in patients withsuspected, symptomatic acute DVT and an initially negativeUS. Although it has been suggested that IPG might be lesssensitive than IJS for thromhi that barely extend into thepopliteal vein, significant differences in outcome have notbeen demonstrated when serial testing is used. Serial IPG andIJS are sensitive methods by which to detect proximal exten-sion of calf DVT in symptomatic outpatients, and this ap-proach is supported by lcvcl 1 data. This method of follow-upis more practical at some institutions than others.
When the US examination is abbreviated, such as omittingevaluation of the superficial femoral vein (now termed femo-ral), diagnostic efficacy may be reduced, and the need to eval-uate from inguinal ligament to calf veins has been controver-sial. While certain studies have suggested that as many as 5%of DVT might be missed with an abbreviated procedure, out-come studies utilizing this approach have been conducted.Data suggest that a simplified compression US procedure lim-ited to the common femoral vein in the groin and the poplitealvein down to the trifurcation of the calf veins (or approxi-mately 10 cm below the midpatella) can be performed in sus-pected DVT and, if normal, a second study can be repeated1 wk later. Two negative stud& 5 to 7 d apart are associatedwith an acceptably low rate of venous thromboembolic com-plications when anticoagulation is withheld. If acute DVT isdetected, evaluating the opposite leg is unlikely to impact im-mediately on therapy.
If the diagnosis remains in question after US or IPG is per-formed, or if the results conflict with strong clinical suspicion,CV or MRI is appropriate. While the use of MRI in the settingof a nondiagnostic US examination appears promising, level 1evidence is not available. Gradient echo “white blood” MRIhas been validated for the detection of DVT. Such images maybe supplemented by spin echo or fast spin echo “black blood”images, but the latter are not recommended for primary diag-nosis. Interpretation should be based on review of source im-ages rather than reprojections. While MRI is not the initial di-agnostic technique for symptomatic DVT, in certain settings,such as massive edema, plaster Icg casts, or inadequate visual-ization of the pelvic veins, it appears to be an appropriate op-tion. This technique is the first to enable both the lungs andthe lower extremities to be evaluated for clot at the same time,although large level 1 trials have not been performed. An ad-ditional advantage of both MRI and US is the potential to di-agnose extravascular disease. Contraindications to MRI in-clude significant claustrophobia, the inability to cooperate,massive obesity, and the presence of certain metallic devices.
These should be carefully reviewed before proceeding withthe technique. Some institutions utilize MRI extensively whileothers use it very little. The success of the technology dependson the involvement of an experienced radiologist.
Various D-dimer assays have been evaluated in the settingof acute DVT and PE (see PE recommendations). Whilequantitative D-dimer data have suggested excellent sensitivityfrom several groups of investigators, and outcome data areemerging, general recommendations cannot be made for theuse of this assay at present.
For acute calf DVT, CV has been considered the most ac-curate diagnostic test. Neither IPG nor US can be relied on toexclude calf vein thrombosis for which treatment is controver-sial. However, serial IPG or US is CI sensitive means by which todetect extension of calf DVT into the popliteul veins whichclearly requires therapy. If, in a particular patient with sus-pected DVT, follow-up cannot be guaranteed, then CV wouldbe appropriate. Ultrasonography is specific for symptomaticacute calf vein DVT, and a positive test in this setting can berelied on. These recommendations are based on level I stud-ies. Magnetic resonance imaging appears to be sensitive andspecific for symptomatic acute calf DVT. The use of MRI inthis setting is based on level 2 data, and additional data shouldbe acquired.
The diagnosis of pelvic vein thrombosis is complex. Con-trast venography, MRI, and IPG are sensitive for iliac veinthrombosis. For non-iliac vein pelvic thrombosis, MRI may besuperior (level 2 studies).
Ultrasound is less reliable for pelvic vein DVT.2. Asymptomatic (Icute lower extremity DVT. A search for
lower extremity DVT is sometimes undertaken in high-riskpatients without suggestive symptoms, such as those individu-als who have undergone total hip or total knee replacement.However, in the latter population of (appropriately anticoagu-lated) patients, performing screening US at hospital dischargedoes not appear justified. Although US appears specific inasymptomatic patients, the predictive value of a positive test istoo low to be relied on. The sensitivity of US is too low for thetechnique to be considered reliable as a screening test, even inhigh-risk patients (e.g., after total hip or knee replacement).Magnetic resonance imaging appears to be capable of diag-nosing silent DVT. Small. nonocclusive thrombi have beendemonstrated by MRI. Outcome data to dute indicate that thereis no proven utility in screening asymptomutic patients.
3. Recurrent and chronic lower extremity DVT. Diagnosingrecurrent lower extremity venous thrombosis has proved chal-lenging. No single test is ideal. Even CV does not always pro-vide definitive information. It can be difficult to visualize anew intralumenal defect with CV when veins have beenthrombosed previously. Over time, the rate of normalizationof IPG increases, and is as high as 95% at 12 mo. In centerswhere this test is utilized, it is appropriate to repeat it to estab-lish normalization. In patients with previous DVT in whomresolution has been documented, IPG can be used to diagnoseeven an early recurrence. This is supported by level 1 data. Incontrast, US is less likely to normalize, and recurrence cannotbe reliably proved unless the test has been shown to revert tonormal prior to the recurrence, or unless the noncompressiblesegment is in a new location. While it might appear prudent torepeat the US examination in 3 to 6 mo to determine whetherit has returned to normal, there arc no level I-based data tosupport the latter concept. In some instances, CV and MRImay distinguish acute from chronic DVT. The criteria used forthis distinction require validation, and are based on level 2data. More experience is required before firm recommenda-tions can be made. Magnetic resonance imaging would appear
American Thoracic Society 1061
to hold the most promise in distinguishing acute from chronicDVT, even without a baseline study.
4. Acute upper extremity DVT. The presence of risk factorssuch as the presence of intravascular catheters should raise theindex of suspicion for acute upper extremity thrombosis andCV is accurate for thrombosis in this region. However, US ap-pears to be the appropriate initial study, based on acceptablespecificity and noninvasiveness (level 2 data). The sensitivityof US for upper extremity thrombosis may be significantlyreduced in the asymptomatic patient, however. Impedanceplethysmography is not utilized for upper extremity DVT.Magnetic resonance imaging appears to be an appropriate di-agnostic modality for suspected upper extremity DVT, if US isnondiagnostic or inadequate, based on level 2 studies. As withthe lower extremity evaluation, MRI and US offer the possi-bility of diagnosing extravascular disease.
THE DIAGNOSTIC APPROACH TO ACUTEPULMONARY EMBOLISM: FINAL SUMMARYAND RECOMMENDATIONS
I. The standard approach to patients with suspected acute PE.(See Figure 2 for algorithm.) The history, physical examina-tion, chest radiograph, electrocardiogram, and arterial bloodgas analysis are often useful in suggesting the presence or ab-sence of PE. This information may aid in the assessment of pa-tients with nondiagnostic lung scans. Clinical information byitself; however, is inadequate to confirm or exclude the diagno-sis of PE. Ventilation-perfusion scanning is an appropriateinitial diagnostic test in this setting. When technically ade-quate, a normal lung perfusion scan reliably excludes acutePE. In suspected acute PE, a high-probability V/Q scan is con-sidered diagnostic, unless the level of clinical suspicion is deemedlow. A high-probability scan is much less useful in the settingof a previously high-probability scan, unless interval scanshave been performed. Unfortunately, the V/Q scan is mostoften nondiagnostic. In such cases, when PE is suspected,additional testing is indicated. Pulmonary angiography is anappropriate subsequent diagnostic modality. This approach issupported by level 1 data. Pulmonary angiography remainsthe gold standard test for acute PE, and positive and negativetests can generally be relied on. Nondiagnostic pulmonary an-giography can occur. Because of the invasiveness, expense,and potential inconvenience of angiography, several otherpossible diagnostic algorithms can be considered (see below).
Stable patients with suspected acute PE, nondiagnosticlung scans, and adequate cardiopulmonary reserve (absenceof hypotension or severe hypoxemia) may undergo noninva-sive lower extremity testing to rule in DVT. This approach hasbeen best studied with serial IPG. A single US or IPG, whenpositive, presents the opportunity to treat without further test-ing. These recommendations are supported by level 1 data.However, a precise definition of “cardiopulmonary reserve”has not been agreed on. Magnetic resonance imaging of thelower extremities may also be useful after a nondiagnosticlung scan (level 2). If the lower extremity test is negative, pul-monary angiography is an appropriate option. The option ofserial noninvasive lower extremity testing in the setting of sus-pected PE should be performed only in centers where follow-up is guaranteed and validated protocols are utilized.
2. Use of the spiral CT scan or MRI for the initial approachto suspected PE or in the setting of a nondiagnostic V/Q scan.Another potential approach to suspected acute PE involvesthe use of either spiral CT or MRI. However, no level 1 stud-ies have been completed to support the use or nonuse of ei-ther technique for suspected PE. Although the sensitivity and
specificity of these techniques may vary with reader experi-ence, spiral CT has been shown, in some studies, to be quitespecific for acute PE. Pulmonary emboli in the main, lobar. orsegmental vessels can be diagnosed with a moderate to highdegree of sensitivity with spiral CT. The spiral CT data avail-able meet level 2 criteria; thus, more clinical studies areneeded. Level 2 studies suggest the potential use of MRI fordiagnosing PE. These techniques also offer more opportunityto make alternative diagnoses than does the V/Q scan or pul-monary angiogram. Reader and institution experience shouldbe taken into consideration when utilizing spiral CT or MRIfor the diagnosis of acute PE. Precise recommendations forthe use of these techniques await the completion of large, mul-ticenter clinical trials. It would appear likely that their use willincrease as the technology continues to advance.
3. Use of the perfusion scan without the ventilation scan. If aventilation scan cannot be performed, an isolated perfusionscan is useful if the scan is high probability, very low probabil-ity, or normal. This approach is supported by level 1 data. Asubsequent ventilation scan is potentially useful if the perfusionscan is intermediate probability. The value of yYmT~ or 13’Xe forventilation imaging after perfusion scintigraphy is controversial,although computer subtraction techniques may be useful. Ven-tilation imaging with ‘lrnKr or “‘Xe is accepted in this setting,but these agents are expensive and their availability is limited.
4. Use of the D-dimer assay to investigate suspected PE. Anelevated concentration of plasma D-dimer, by itself, is toononspecific to be diagnostic of DVT or PE. Different assayscannot be clinically applied interchangeably and althoughrapid results cannot always be obtained, rapid “bedside” as-says are now available. D-dimer testing offers no additionalinformation in patients with diagnostic lung or leg studies butmay ultimately prove useful when the latter are nondiagnostic.In several studies, a quantitative D-dimer (performed byELISA) of less than 500 pg/L has been shown to effectivelyexclude PE. Level 1 data (including management data) isemerging for the use of the D-dimer assay in acute DVT andPE at certain centers but the wide variability among the assaysand in their testing characteristics continues to limit the gen-eral application of the test.
5. Use of echocardiography in the approach to suspectedacute PE. At the present time, the role of surface echocardio-graphy for the diagnosis of acute PE remains undefined. Inmany institutions, surface echocardiography can be rapidlyobtained. A clinical presentation suggestive of acute PE to-gether with unexplained right ventricular hypokinesis and/ordilation by surface echocardiography may be strongly sugges-tive of, but not diagnostic of, acute PE. Such findings are morecommonly associated with clinically massive PE. Thrombusdirectly visualized in the right atrium or ventricle is compel-ling evidence for PE. Clots may occasionally be imaged in theproximal pulmonary arteries. Transesophageal echocardio-graphy and intravascular ultrasound have been utilized for thediagnosis of PE, but these are most useful for massive PE andexcept in unusual circumstances do not, at present, have a rolein the diagnostic approach to acute PE. All clinical trials eval-uating right ventricular function as an indication of the pres-ence of acute PE are level 2 studies. The integration of echo-cardiography into the diagnostic evaluation needs furtherclarification and the utility of the technique may change withfurther advances in technology.
THE FUTURE
Future investigations involving VTE will be productive withregard to characterization of genetic risk factors, diagnosis,
1062 AMERICAN JOURNAL OF RESPIRATORY AND CRITICAL CARE MEDICINE VOL 160 1999
therapy, and prevention. Data currently being analyzed in-clude that from the International Cooperative PulmonaryEmbolism Registry (ICOPER), a prospective, multicenter, in-ternational, extensive collection of data from approximately2,500 patients with pulmonary embolism (221, 222). Analysisof such data will assist in the delineation of appropriate issuesto study in prospective randomized trials as well as serving asan opportunity to unite investigators from different countriesin the approach to VTE. Certain areas in the diagnostic realmclearly merit continued investigation, which will require anongoing analysis of the capabilities of the technology involved.Further discovery and characterization of thrombophilicstates such as activated protein C resistance and the pro-thrombin 202lOA gene defect will necessitate alterations inthe design of clinical trials and may affect our approach toDVT surveillance. Nuclear imaging technology may improve,and MRI and CT technology will continue to evolve. The Eu-ropean Society of Thoracic Radiology prospective spiral CTinvestigation and others will add to our knowledge base. Theuse of MRI, with its potential ability to distinguish acute fromchronic thrombosis, may not only lead to more appropriateinitial therapeutic stratification but may aid in the determina-tion of the duration of and aggressiveness of therapy. CT scan-ning will become faster and undoubtedly more accurate. Thelatter techniques will likely replace angiography and venogra-phy altogether. Hematologic studies, such as of the D-dimer,while not currently playing a significant role in the diagnosisand treatment of VTE at most centers may evolve into moreuniversally applicable techniques, particularly when used to-gether with other diagnostic modalities. Outcome studies willbecome increasingly important as the sensitivity and specific-ity of diagnostic tests as well as therapeutic modalities con-tinue to improve. Technological advances, however, could con-sume increased health care dollars which may not necessarilybe available. Both the tertiary care/academic medical centerand the community hospital need to be considered with theseefforts. Accordingly, cost-benefit analyses are essential.
Committee Members
VWTOR F. TAPSON, M.D., ChairmanBARBARA A. CARROLL, M.D.BRWE L. DAVIMON, M.D., M.P.H.C. GREGORY ELLIOTT, M.D.PETER F. FI:INJLLO, M.D.CHARLES A. HALES, M.D.RIISSF.LL D. HLJLL., M.B.B.S.THOMAS M. HYERS, M.D.KENNETH V. LEEPER, JR., M.D.TIMOTHY A. MORRIS, M.D.KENNETH M. MOSER, M.D.G ARY E. RASKOB, M.Sc.DEBORAH SHURE, M.D.H. DIRK SOSTMAN, M.D.B. TAYLOR THOMPSON, M.D.
ReferencesI. Anderson. F. A.. Jr.. H. B. Wheeler, R. J. Goldberg, cv~I. IYYl. A pop-
ulation-based perspective of the hospital incidence and case fatalityrates of deep win thrombosis and pulmonary embolism: The Worces-ter DVT Study. Arch. Inrrrn. Med. lSl:Y33-938.
2. Evidence-Based Medicine Working Group. IYYZ. Evidence-based med-icine: a new approach to teaching the practice of medicine. .J.A.M.A.26X:2420-2425.
3. Redman. H. C’. IYXH. Deep venous thrombosis: is contrast vcnographystill the “gold standard”‘? Hrrdiolo~y 16X:277-278.
4. American Thoracic Society Clinical Practice Committee. lYY7. At-
tributes of American ‘l‘horacic Society documcnls that guide clinicalpractice: Recommendations of the American ‘l‘horacic Soc~cty (‘lini-cal Practice Committee. AWL .J. Hecpir. C‘n/. ~1~ Med. lSh:2OlS~202S.
5. Wheeler, H. B. IYXS. Diagnosis of deep vcnouh thrombosis: rcviw 01clinical evaluation and impedance plethy~mography. Aw ./. Slrr,q. IS0(suppl.):7~13.
6. Lcclerc, J. R., F. Illescas, and P. Jarzcm. IYYI. I)qnosi\ of deep veinthrombosis. In J. R. Lcclerc, editor. Venous ‘l‘l~rtrmboc~nholic Dwr-den. Lea & Febiger. Philadelphia. 176-22X.
7. Kakkar, V. V. lY7S. Deep venous thrombosis: detcclwn and prevcn-tion. Circ&liw S 1:X.
X. Rabinov. K., and S. Paulin. IY72. Rocntgcn diagnosis (IC ven,,u\ thron-hosis in the leg. Arch. Surg. 104:134~144.
9. Hull, R., W. G. van Aken. J. Hirsh. (‘I trl. lY7h. Impcdancc plethysmog-raphy wing the occlusive cuff technique in the diagno\i\ of vcnou!,thrombosis. Circ~uhiorr 53:hY6-700.
IO. Richards, K. L., D. J. Armrtrong, (;. Tikoff. CI N/. lY7h. Noninvaalve di-agnosis of deep venous thrombosis. Ar&. /r~/rn~. Med. 1%: IOY-I OYh.
I I. Hull, R.. J. Hirsh, D. L. Sackett, (‘I rrl. 1977. (‘omhincd uw 01 leg vzan-ning and impedance plethysmo~rephy m suspected venous thromho-sis: an alternative to venography. N /+I,$ ./. Met/. 2Yh: 14<)7-1500.
12. Hull. R., D. W. Taylor, J. Hirah. (‘I N/. lY7X. Impedance plethysmogra-phy: the relationship between venous filling and scnsttivity and spec-ificity for proximal vein thrombosis. ~‘irur/a/irw~ SX:XYX%OO2.
13. Taylor, D. W., R. D. Hull. D. L. Sackett. and J. Ilirsh. IYXI). Simpllfic+tion of the scqucntial impedance plcthywwpraphy technique with-out loss of accuracy. ‘Thromh. KCL I7:56-565.
1. Flanigan. D. P., J. J. Goodreau. S. J. Burham. cv trl. lY7X. Vascular Iaho-ratory diagnosis of clinically suspected acute deep win-thrombosis.Lanwr 2331-334.
5. Cooperman. M., E. W. Martin, Jr.. B. Satiani. 1’1 (11. 107’). Dctectitrn otdeep venous thrombosis by impedance plcthysmo~r;~phy. Ani. ./.S~rrg. 137x252-254.
6. Hull, R., J. Hirsh. D. L. Sackett. (11 ol. IYXI. Replacement of vcntrgra-phy in suspected venous thrombosis by impedance plethysmographyand “‘I-fibrinogen leg scanning: a Ices invasive approach. Arr,~. /II-lern. Marl. Y4: 12-l 5.
17. Peters, H. S.. J. J. Jonker. A. C. de Boer, and (i. J. den Ottolander.1982. Home diagnosis of deep vcnou!, thromlwsih with impedanceplethysmography. Tl~rornh. Htrerr~o,\r. 4X:207-100.
IX. Prandoni. P., A. W. A. Lensing. M. V. Hw\man. (‘I II/. IYYI. A newcomputerized impedance plcthyamograph: accuracy in the dcteclionof proximal deep-win thrombosis in symptomatic outpatients. 711m1,zh.1trterno.\r. 65:22Y-232.
10. Anderson, D. R.. A. W. A. Lcnsing. P. S. Wells. M. N. Lcvinc. J. I.Weitz, and J. Hirsh. 1993. Limitations of impedance plcthqw~ogr;l-phy in the diagnosis of clinically-wspectcd deq-vein thrtrmhosi~.Ann. In&rrr. Met/. I I X:25-30.
20. Ginsberg, J. S., P. S. Wells. J. Hirsh, 01 t/l. lYY4. Rccvalualion ol the sen-sitivity of impedance plethysmography for the detectwn of proximaldeep vein thrombosis. Arc/l. Inwrrr. Mrtl. 154: I Y30- I Y33.
21. Moser, K. M., and J. R. LcMoine. 19x1. Is emholic risk conditioned hylocation of deep venous thrombosi\‘? Ar~rr. I~~rcwr. MN/ Y4:43%443.
22. Agnelli. G.. M. Longetli. and B. (‘osmi. (‘I t/l. IYYO. Dlagno\tic accuraqof computerized irnpcdance plcthysmography in the diagnosla 01symptomatic deep vein thrombosis: a controlled vcnographic study.An,~&o~_v 41559-564.
23. Heijboer, H.. A. Cogo, H. R. Bullcr. P. Prandonl. and J. W. ten (‘ate.lYY2. Detection of deep-vein thrombosis wilh ~mpedancc plcthya-mography and real-time compression ultrasonography in hospitabized patients. Arch. Irtrcw~. Mcrl. lS2:lYOl~lYO3.
24. Wells, P. S.. J. Hirsh. D. R. Anderson, 1’1 cl/. IYYS. <‘ompariwn of the ac-curacy of impedance plethysmography and compression ultraaonog-raphy in outpatients with clinical suspcctcd deep win thrombosis.Thromh. Hurmmt. 74: 1423-1427.
25. Hull, R. D.. J. Hirsh, C. J. Carter. er rrl. IYXS. DiagnoslIc efficacy of impedance plethyamography for clinically-suspected deep-bein thron-bosis: a randomized trial. Anrr. I~rcwr. MIV/. 102:21-2X.
26. Huisman, M. V.. H. R. Buller, J. W. ten (‘ate, c’, trl. IYXh. Serial Imped-ance plethysmography for suspected deep venom\; thromhow in out-patients. N. EngI. J. Mud. 314:X23-X2X.
27. Huisman, M. V., H. R. Buller. J. W. ten <‘ate, c’/ II/. 10%). Managementof clinically suspected acute venous thrombosis in outpatients wthserial impcdancc plcthyamography in a community hwpital setting.Arch. Intrrrr. Mel. 1495 I 1-S 13.
28. Hull, R. D., G E. Raskoh. and C. J. (‘arter. IYYO. Serial impedanceplethysmography in pregnant patients wth clinically w<pccted deep-

American Thoracic Society 1 0 6 3
vein thrombosis: clinical validity of negative findings. Ann. Intern.Med. I 12:663%667.
2Y. Heijboer, H., H. R. Buller. A. W. A. Lensing. rl al. 1993. A comparisonof real-time compression ultrasonography with impedance plethys-mography for the diagnosis of deep-vein thrombosis in symptomaticoutpatients. N. Fr~gl. .I. Med. 329:1365-1369.
30. Prandoni. P., A. W. A. Lcnsing, H. R. Buller. et ul. 1991. Failure ofcomputerized impedance plethysmography in the diagnostic man-agement of patients with clinically-suspected deep-vein thrombosis.Thromh. Hwmo.\~. 65:233-236.
31. Kearon, C.. and J. Hirsh. lYY4. Factors influencing the reported sensi-tivity and specificity of impedance plethysmography for proximaldeep vein thrombosis. Thromh. Huemost. 72:652-65X.
32. Wheeler, H. B., J. Hirsh, P. Wells. and F. A. Anderson, Jr. 1994. Diag-nostic tests for deep vein thrombosis: clinical usefulness depends onprobability of disease. Arch. Intern. Med. 154:1921-1928.
33. Cogo, A., A. W. A. Lensing, P. Prandoni, and J. Hirsh. 1993. Distribu-tion of thrombosis in patients with symptomatic deep vein thrombo-sis: implications for simplifying the diagnostic process with compres-sion ultrasound. Arch. Inkw. Med. 153:2777--27X0.
34. Raskob, G. E., and R. 0. Hull. IYYS. Impedance plethysmography for sus-pected deep-vein thrombosis. Arch. Intern. Med. 155:773-776. [Letter]
35. Harris. W. H.. E. W. Salzman. C. Athanasoulis,el ul. 1975. Comparison of“‘I-fibrinogen count scanning with phlehography for detection ofvenous thrombi after elective hip surgery. N. Engl. J. Med. 292:665467.
36. Hull, R., J. Hirsh. D. L. Sackett. et ul. IY7Y. The value of adding imped-ance plethysmography to ‘*‘I-fibrinogen leg scanning for the detec-tion of deep vein thrombosis in high risk surgical patients: a compar-ative study between patients undergoing general surgery and hipsurgery. Thromh. Ku. 151227-234.
37. Comerota, A. J., M. L. Katz. R. J. Grossi, et ul. 19X8. The comparativevalue of non-invasive testing for diagnosis and surveillance of deepvein thrombosis. J. Vusc. Surg 7:4&4Y.
3X. Paiement, G.. S. J. Wessinger, A. C. Waltman, and W. H. Harris. 1988.Surveillance of deep-vein thrombosis in asymptomatic total hip re-placement patients: impedance plethysmography and fibrinogen scan-ning versus roentgenographic phlebography. Am. .I. Surg. 155:4(&4&l.
39. Cruickshank. M. K.. M. N. Levine, J. Hirsh, et al. 1989. An evaluationof impedance plethysmography and “‘I-fibrinogen scanning in pa-tients following hip surgery. Thrwnh. Haemost. 62:830-X34.
40. Agnelli. G., B. Cosmi, S. Radicchia. rr al. 1991. Impedance plethysmog-raphy in the diagnosis of asymptomatic deep vein thrombosis in hipsurgery: a venography-controlled study. Arch. Intern. Med. 151:2167-2171.
41. Agnelli, G.. B. Cosmi. S. Radicchia. et 01. 1993. Features of thrombi anddiagnostic accuracy of impedance plethysmography in symptomaticand asymptomatic deep vein thrombosis. Thromh. Haemost. 70:266-269.
42. Ginsberg, J. S.. C. C. Caco. P. Brill-Edwards. et (11. I YYI. Venous throm-bosis in patients who have undergone major hip or knee surgery: de-tection with compression ultrasound and impedance plethysmogra-phy. Rudiolo~y I Xl :65 1454.
43. Borris. L. C., H. M. Christiansen. M. R. Lassen, er ~11. 1989. Comparisonof real time B mode ultrasonography and bilateral ascending phle-bography for detection of post operative deep vein thrombosis fol-lowing elective hip surgery. Thromh. Hurmosr. 61:361-365.
44. Hull, R. D., C. J. Carter, and R. M. Jay. 1983. The diagnosis of acute,recurrent deep vein thrombosis: a diagnostic challenge. Circulation67:YOI-906.
45. Leclerc. J. R., R. M. Jay, and R. D. Hull. 1985. Recurrent leg symptomsfollowing deep vein thrombosis: a diagnostic challenge. Arch. Intern.Med. 145:1X67-1X6’).
46. Huisman, M. V.. H. R. Buller, and J. W. ten Cate. 1988. Utility of im-pedance plethysmography in the diagnosis of recurrent deep-veinthrombosis. Arch. Inkwz. Mrd. 14X:681-683.
47. Borgstede, J. P., and G. E. Clagett. lYY2. Types, frequency, and signifi-cance of alternative diagnoses found during duplex Doppler venousexaminations of the lower extremities. .I. Ulrrasound Med. 11:85-X9.
4X. Frederick, M. G., B. S. Hertzberg, M. A. Kliewer, et al. 1996. Can theultrasound examination for lower extremity deep venous thrombosisbe abbreviated’? A prospective study of 75.5 examinations. Radiology199:45&7.
49. Pezzullo. J. A.. A. B. Perkins, and J. J. Cronan. 1996. Symptomaticdeep vein thromhosis: diagnosis with limited compression ultra-sound. Radiology 19X:67-70.
50. Cronan, J. J. 1997. Controversies in venous ultrasound. Semin. Ultra-sound, Cornput. Tomop-. Mqn. I X:33-38.
51. Sheiman, R. G., and C. R. McArdle. 1995. Bilateral lower extremity LJSin the patient with unilateral symptoms of deep venous thrombosis:assessment of need. Rndiology lY4:171-173.
52. Naidich, J. B., J. R. Torre, J. S. Pellerito,ernl. 1996. Suspected deep venousthrombosis: is US of both legs necessary’? Rudiology 2(X~:429-431_
53. Wells, P. S., A. W. A. Lensing, B. L. Davidson, et al. 1905. Accuracy ofultrasound for the diagnosis of deep venous thrombosis in asymp-tomatic patients after orthopedic surgery: a meta-analysis. Ann. In-tern. Med. 122:47-53.
54. Evans, A. J.. H. D. Sostman, M. H. Knelson. rl 01. lYY3. Detection ofDVT: prospective comparison of MRI with contrast venography.Am. J. Roenrgenol. 161:131-13Y.
55. Laissy, J. P., A. Cinqualbre, A. Loshkajian, et ul. l9Yh. Assessment ofdeep venous thrombosis in the lower limbs and pelvis: MR venographyversus duplex Doppler sonography. Am. J. Roenrgenol. l67:971-Y75.
56. Dupas, B., D. El Kouri, C. Curtet. et ul. 1995. Angiomagnetic resonanceimaging of iliofemorocaval venous thrombosis. Luncer 346:17-l’).
57. Vaccaro, J. P., J. J. Cronan. and G. S. Dorfman. IYYO. Outcome analysisof patients with normal compression ultrasound examinations. Radi-ology 1751645-649.
5X. Lensing, A. W. A.. P. Prandoni, D. Brandjes. ct (11. IYXY. Detection ofdeep-vein thrombosis by real-time B-mode ultrasonography. N.Engl. J. Med. 320:342-345.
59. Cronan, J. J., G. S. Dorfman. F. H. Scala. B. Schepps, et ul. IYX7. Deepvenous thrombosis: US assessment using vein compression. Rodiol-ogy 162:lYl-194.
60. Appelman, P. T., T. E. De Jong, and L. E. Lampmann. 19X7. Deepvenous thrombosis of the leg: ultrasound findings. Rudiolqy 163:743-746.
61. Monreal, M., E. Montserrat, R. Salvador. J. Bechini, et ol. IYXY. Real-time ultrasound for diagnosis of symptomatic venous thrombosis andfor screening of patients at risk: correlation with ascending conven-tional venography. Angiology 40~527-533.
62. Pedersen, 0. M., A. Aslaksen, H. Vik-Mo, and A. M. Bassoe. IYYl.Compression ultrasonography in hospitalized patients with sus-pected deep venous thrombosis. Arch. /n@rn. Med. 151:2217-2220.
63. Fletcher, J. P., L. Z. Kershaw, D. S. Barker, J. Koutts, et ul. IYYO. Ultra-sound diagnosis of lower limb deep venous thrombosis. Med. J. AKK153:453455.
64. Chance, J. F., P. L. Abbitt. C. J. Tegtmeyer. R. D. Powers, (‘I cd. IYYl.Real-time ultrasound for the detection of deep venous thrombosis.Ann. Emerg. Med. 20:4Y4496.
65. Habscheid. W., M. HGhmann, T. Wilhelm, and J. Epping. 1990. Real-time ultrasound in the diagnosis of acute deep venous thromhosis ofthe lower extremity. Angiology 41:599%60X.
66. Gudmundsen, T. E., B. Vinje, and T. Pedersen. 1090. Deep vein throm-bosis of lower extremities. Acta. Radial. 3 I :473-475.
67. Dauzat, M. M., J. P. Laroche, C. Charras, B. Blin. et al. IYXh. Real-timeB-mode ultrasonography for better specificity in the noninvasive di-agnosis of deep venous thrombosis. J. Ultrusound Med. 5:625%631.
68. Aitken, A. G. F.. and D. J. Godden. 1987. Real-time ultrasound diagno-sis of deep vein thrombosis: a comparison with venography. C/in. Rrr-dbl. 38:309-313.
69. O’Leary, D. H., R. A. Kane, and B. M. Chase. 19X8. A prospective studyof the efficacy of B-scan sonography in the detection of deep venousthrombosis in the lower extremities. J. Clin. Ulwusound Ih:l-X.
70. George, J. E., M. 0. Smith, and R. E. Berry. 19X7. Duplex scanning forthe detection of deep venous thrombosis of lower extremities in acommunity hospital. Curr. Surg. 3X:202-204.
71. Mitchell, D. C., M. S. Grasty, W. S. L. Stebbings, 1. B. Nockler. et al.lY91. Comparison of duplex ultrasonography and venography in thediagnosis of deep venous thrombosis. Br. J. Surg. 7X:61 1413.
72. Quintavalla, R., P. Larini, A. Miselli, et 01. 1992. Duplex ultrasound di-agnosis of symptomatic proximal deep vein thrombosis of lowerlimbs. Eur. J. Rudiol. 15:32-36.
73. Vogel, P., F. C. Laing, R. B. Jeffrey. Jr., et ul. lYX7. Deep venous throm-bosis of the lower extremity: ultrasound evaluation. Radiology163~747-751.
74. Mantoni, M. 1989. Diagnosis of deep venous thrombosis by duplexsonography. Acta. Radiol. 30:57S-579.
75. Elias, A., rl al. 1987. Value of real time B mode ultrasound imaging inthe diagnosis of deep vein thrombosis of the lower limbs. Inl. An,@/.6~175-182.
76. Comerota, A. J., M. L. Katz, L. L. Greenwald, E. Leefmans, M. Czere-darczuk, and J. V. White. 1YYO. Venous duplex imaging: should it re-place hemodynamic tests for deep venous thrombosis? .1. Vusc. Surg.11:53-61.
1064 AMERICAN JOURNAL OF RESPIRATORY AND CRITICAL CARE MEDICINE VOL 160 1999
77. Lewis, B. I)., M. E. James, T. J. Welch, et al. lYY4. Diagnosis of acutedeep venous thrombosis of the lower extremities: prospect& cvalu-ation of color Doppler flow imaging versus venography. Rudiolog~yI Y25.5 I-655.
7X. Kose. S. C‘.. W. J. Zwiehel. I). D. Nelson, D. L. Priest, r!a/. IYYO. Symp-tomatic lower extremity deep venous thrombosis: accuracy, Iimita-tiona. and role of color duplex flow imaging in diagnosis. Rudiofqy175:63Y~,44.
71). Schindler. J. M., M. Kaiser, A. (&her. A. Vuilliomenet, rt ul. 1YYO. Co-lour coded duplex sonography in suspected deep vein thrombosis ofthe leg. Hr. Med. ./. 301:136Y-1370.
XI). Baxter, (i. M.. S. McKcchnic, and P. Duffy. IYYO. Colour dopplcr ultra-sound in deep venous thrombosis: a comparison with venography.C‘lirl. Radial. 42:32-36.
Xl. Baxter. G. M.. P. Duffy. and E. PartrIdge. lYY2. Colour flow imaging ofcalf vein thrombosis. C/in. Rudiol. 46: lYX~201.
82. Mattes. J. A., G. L. Londrcy. D. W. Leutz, K. J. Hodgson, eral. 1092.Color-flow duplex scanning for the surveillance and diagnosis ofacute deep venous thrombosis. ./. Vusc. Surg 1.5:366-376.
X3. Foley. W. I>.. W. D. Middleton, T. L. Lawson, S. Erickson, ct ~1. IYXY.Color Doppler ultrasound imaging of lower-extremity venous dis-cast. Anr. .I. Koc,n/grno~. I S2:371-376.
X4. Kaghavcndra, B. N.. R. J. Rosen, S. Lam. T. Riles, e/ al. lY84. Deepvenous thrombosis: dctcction by high-resolution real-time ultra-sonography. Katliob)~~ lS2:7XYm7Y3.
X5. Montcfusco-von Kleist. C. M., <‘. Bakal, S. Sprayregen, B. A. Rhodes, etal. lOY3. Comparison of duplex ultrasonography and ascending con-trast venography in the diagnosis of venous thrombosis. Angiofogy44: I hY- 175.
X6. Birdwell. H. G., G. E. Raskoh. T. L. Whitsett, of ul. IYYX. The clinicalvalidiiy of normal compression ultrasonography in outpatients sus-pected of deep venous thrombosis. Ann. Inturn. Med. 12X:1-7.
X7. Cogo, A., A. W. Lensing. M. M. Koopman, crul. 199X. Compression ul-trasonography for diagnostic management of patients with clinicallysuspected deep vein thrombosis: prospective cohort study. Br. Med..J. 316(7124):2-I
XX. Davidson. B. L., and E. J. Deppert. IYYX. Ultrasound for the diagnosisof deep vein thrombosis: where to now? Br. Med. J. 316:2-3.
XY. Claggctt, G. P.. F. A. Andcraon, M. N. Levine, et al. lYY2. Prevention ofvenous thromboembolism. In J. E. Dalen and J. Hirsh, editors. ThirdAC‘CP Consensus Conference on Antithrombotic Therapy. Chr~t102:3Y I s407s.
YO. Borris. L. c’.. H. M. Christiansen. M. R. Lassen, A. D. Olsen, and P.Schott. IYYO. Keal-time B-mode ultrasonography in the diagnosis ofpostoperatlvc deep vein thrombosis in non-symptomatic high-riskpatients. Eur. .I. Vrrsc~. Surg. 4:473-47.5.
Yl. Agnelli. (i.. R. Volpato, S. Radicchia, F. Vcschi, P. Di Filippo, L. Lu-pattelli. ef rrl. IYYZ. Detection of asymptomatic deep vein thrombosisby real-lime B-mode compression ultrasound in hip surgery patients.Thromh. fiuemo.sl. 6X:257-260.
92. Tremaine. M. D., <‘. J. Choroszy, G. H. Gordon. and S. A. Menking.lYY2. Diagnosis of deep venous thrombosis by compression ultra-sound in knee arthropla\ty patients. J. Arthrop/rr.r/~v 7:l X7-1 92.
93. Froehlich. J. A.. (;. S. Dorfman. J. J. Cronan. P. J. Urbanek, J. H. Hern-don. and R. K. Aaron. IYXY. Compresston ultrasonography for thedetection of deep venou\ thrombosis in patients who have a fractureof the hip: a prospective study. J. Bone Joint Surfi. 71:24Y-256.
04. Elliott, C. G.. M. Suchyta. S. (‘. Kose. S. Talbot, C. Ford. G. Raskob, clcrl. lYY3. Duplex ultrasonography for the detection of deep veinthromhi after total hip or knee arthroplasty. Angiology 44:26-33.
YS. Barnes, C. L.. (‘. L. Nelson. M. L. Nix. T. <‘. McGowan, R. C. Lavender,and R. W. Barnes. IYYO. Duplex scanning versus venography as ascreening exammatlon in total hip arthroplasty patients. Clin. Ortho-pd. 27 I : I X0- I X9.
Yh. Woolson, S. ‘T.. and G. Pottorff. IYYI. Venous ultrasonography in thedetection of proximal vein thrombosis after total knee arthroplasty.(‘/;,I. Orrho/,rtl. 273: I3 l-135.
97. Davidson. 13. L.. <‘. <;. Elliott. and A. W. Lensing. 1’82. Low accuracyof color Doppler ultrasound to detect proximal leg vein thrombosisduring screening of asymptomatic high-risk patients. Ann. Intern.Mm/. I 17:735-73x.
YX. Lensing. A. W. A.. C‘. I. Doris. F. P. McGrath, c’t ul. lYY7. A comparisonof compression ultrasound with color Doppler ultrasound for the di-agnosis of sympromless postoperative deep vein thrombosis. Arch.Intcw. Mm/. 157:765-76X.
YY. Dorfman. G. S., J. A. Froehlich, J. J. Cronan, P. .I. Urbanek, and J. H.Herndon. IYYO. Lower-extremity venous thrombosis in patients with
acute hip fractures: determination of anatomic location and time ofonset with compression sonography. Am. ./. Rocv~~gcvw/. 154:X5 I-855.
100. Woolson, S. T., D. W. McCrory. J. F. Walter. W. J. Mahoney. M. J.Watt, and P. Cahill. 19(N). B-mode ultrasound scanning in the dctec-tion of proximal venous thrombosis after total hip replacement. ./.Rone Joint Surg 72:983-0X7.
101. White, R. H., J. A. Goulet. T. J. Bray, M. M. Daschbach. J. P. Mctia-han. and R. P. Hartling. 1990. Deep-vein thrombosis after fracture ofthe pelvis: assessment with serial duplex-ultrasound screening. J.Bone .fornl Surg. 72:4YS~SofJ.
102. Cronan, J. J., J. A. Froehlich. and G. S. Dorfman. 1091. Image-directedDoppler ultrasound: a screening technique for patients at high risk todevelop deep vein thrombosis. J. C/in. Ul/ru.rrwnd 19: I33- 13X.
103. Robinson, K. S., D. R. Anderson, M. Gross, (‘I N/. lYY7. Ultrasono-graphic screening before hospital discharge for deep venous throm-bosis after arthroplasty: the post-arthroplasty screening study. A ran-domized, controlled trial. Ann. fnrern. Med. 127:439445.
104. Leclerc, J. R., M. Gent, J. Hirsh, et ul. IYYX. The incidence of symptom-atic VTE during and after prophylaxis with enoxaparin. Arch. fnlcw.Med. 15X:873-878.
105. Yucel. E. K., J. S. Fisher, T. K. Egglin, rl ul. IYYI. Isolated calf venousthrombosis: diagnosis with compression ultrasound. Hu&o/og_v I7Y:443-446.
106. Bradley, M. J., P. A. Spencer, A. Milner. and (Ii. R. Milnrr. lYY3. (‘o-lour flow mapping in the diagnosis of the calf deep vcm thrombosis.Clin. Rudiol. 47:3YY402.
107. Jongbloets. L. M., A. W. A. Lensing. M. M. Koopman. (‘I rrl. IYY4. Lim-itations of compression ultrasound lor the detection of symptomlesspostoperative deep vein thrombosis. I_uncr/ 343:1142-l 144.
108. Heijboer, H., L. M. M. Jongbloets, H. R. Buller, c/ u/. 1992. The clinicalutility of real-time compression ultrasonography in the diagnosticmanagement of patients with recurrent venous thromhosis. Acr(l. Rn-dbl. Stand. 33:2Y7-300.
100. Murphy, T. P.. and J. J. Cronan. 1990. Evolution of deep venous thrombo-sis: a prospective evaluation with ultrasound. Rudi~lo~~v 177543-548.
110. Hertzberg, B. S., M. A. Kliewer. D. M. DeLong. 6’1 NI. lYY7. Sono-graphic assessment of lower limb vein diameters: implications for thediagnosis and characterization of deep venous thrombosis. Am. J.Roen~gmol. 16X: 1253- 1257.
I II. Baxter, G. M., W. Kincain, R. F. Jeffrey, c’/rr/. 1991. (‘omparison of co-lour Doppler ultrasound with venography in the diagnosis of axillaryand subclavian thrombosis. Br. J. Rmfiol. 64:777-7X1.
112. Knudson. G. J.. D. A. Wiedmeyer, and S. J. Erickson. (‘I trl. IYYO. ColorDoppler sonographic imaging in the assessment of upper-extremitydeep venous thrombosis. Am. J. Roentgol. lS4:403.
113. Haire, W. D., T. G. Lynch. R. P. Lieherman, PI ul. IYYI. lltility of du-plex ultrasound in the diagnosis of asymptomatic catheter-inducedsubclavian vein thrombosis. J. Ul~rusound Mm/. 10:4Y3_4Y6.
114. Prandoni, P., P. Polistena, E. Bernardi, el rrl. IYY7. Upper-extremitydeep vein thrombosis: risk factors, diagnosis, and complicalions.Arch. Intern. M~ti. 15757-62.
115. Spritrer, C. E., H. D. Sostman, D. C. Wilkes, and R. E. Coleman. IYYO.Deep venous thrombosis: experience with gradient-echo MR imag-mg in 66 patients. Rrrdio/qv 177:235~241.
I 16. Totterman. S., C. W. Francis, T. H. Foster, PI trl. IYYO. Diagnosis of fem-oropopliteal venous thrombosis with MR imaging: a comparison offour MR pulse sequences. Am J. Rorw/pwl. IS4:17S-178.
117. Holland, G. A., R. A. Baum, J. Carpenter. (11 N/. lYY2. Evaluation ofMR venography in the detection of deep venous thrombosis in theveins of the pelvis and lower extremities. /rl Proceedings. I Ith An-nual Scientific Meeting, Society of Magnetic Kesonance in Medicine.Berlin, Germany. X23.
118. Erdman. W. A., H. T. Jayson. H. C. Redman, PI N/. 1990. Deep venousthrombosis of extremities: role of MRI in thr diagnosis. Rurliofqq~v1741425113 I.
IlY. Vukov, L. F.. T. H. Berquist. and B. F. King. 1991. MRI for calf deepvenous thrombosis. Ann. Emcq. Mrd. 20:497_4YY.
120. Evans, A. J.. H. D. Sostman. L. A. Witty, et ul. lYY6. Detection of DVT:prospective comparison of MR imaging and sonography. J. Mqp.Reson. Imaging I :44-S I.
121. Spritzer. C. E., J. J. Norconk. H. D. Soatman, and R. E. Coleman. lYY3.Detection of deep venous thrombosis by MRI. Chrsf lO4:54-60.
122. Carpenter, J. P., G. A. Holland, R. A. Baum. er ul. 109.3. Magnetic rcso-name vcnography for the detection of deep venous thrombosis: com-parison with contrast venography and duplex Doppler ultrasonogra-phy. J. Vu.sc. Surg. 1 X:734-74 I.
American Thoracic Society 1065
123. Hansen, M. E., C. E. Spritzer. and H. D. Sostman. 1990. Assessing thepatency of mediastinal and thoracic inlet veins: value of MR imaging.Am. .J. Rmqqwol. 15S:l 177-l 1X2.
124. Mcancy, J. F. M., J. G. Weg, T. L. Chenevert, ef al. IYY7. Diagnosis ofpulmonary embolism with magnetic resonance angiography. N. Ertgl..I. Mm/. 336: I422- 1421.
125. Tapson, V. F. IY97. Pulmonary embolism-new diagnostic approaches.N. Engl. J. Med. 336: I44Y- I45 1.
126. Lmdblad, B.. A. Eriksson, and 0. Bergquist. IYYI. Autopsy-verifiedpulmonary embolism in a surgical department: analysis of the periodfrom 195 I to I YXX. Br. ./. S~rg. 78:849-X52.
127. Goldhaber. S. 2.. C. H. Hennekens, D. A. Evans, eta/. IY82. Factors as-sociated with correct antemortem diagnosis of major pulmonary em-bolism. Am. .J. Mrd. 73:X22-826.
12X. PIOPED Investigators. IYYO. Value of the ventilation-perfusionscan in acute pulmonary embolism: results of the Prospective In-vestigation of Pulmonary Embolism Diagnosis (PIOPED)..I.A.M.A 263:2753-27.5’).
129. lY73. The lirokinase Pulmonary Embolism Trial: a national coopera-tive study. Circulution 47(Suppl. 11):1-10X.
130. Green. R. M.. T. J. Meyer, M. Dunn, and J. Glassroth. 1992. Pulmonaryembolism in younger adults. Chesr lOl:lSO7-I.51 I.
1.11. Stein. P. D.. M. L. Terrin, C. A. Hales et 01. 1991. Clinical, laboratory,roentgenographic. and electrocardiographic findings in patients withacute pulmonary embolism and no pre-existing cardiac or pulmonarydisease. C‘hcsr Io():SYX~603.
132. McNeill, B. J., S. J. Hessel, W. T. Branch et al. 1976. Measures of clini-cal efficacy: 3. The value of the lung scan in the evaluation of youngpatients with pleuritic chest pain. J. Nucl. Med. 17:163-164.
133. Bounameaux, H.. P. Clrafici, P. DeMoerloose. et al. 1901. Measure-ment of D-dimer in plasma as diagnostic aid in suspected pulmonaryembolism. Luncr~ 337: I Yh.
134. Goldhaber, S. Z., G. R. Simons, C. G. Elliott, rt al. 1993. QuantitativeD-dimer levels among patients undergoing pulmonary angiographyfor suspected pulmonary embolism. J.A.M.A. 270:281Y-2822.
13.5. Bounameaux. H., P. de Mocrloose, A. Perrier, ef al. 1994. Plasma mea-surement of D-dimer as diagnostic aid in suspected venous throm-boembolism. 7‘hmn1h. Huemost 71:1-6.
136. Ginsberg, J. S., P. A. Brill-Edwards, C. Demers, et 01. 1993. D-dimer inpalients with clinically suspected pulmonary embolism. Chest 104:1679-16X4.
137. De Moerloose, P., P. Minazio, G. Reber, et ul. 1994. D-dimer determi-nation to exclude pulmonary embolism: a two step approach usinglatex assay as a screening tool. 77zromh. Ifnemost 72:89-Y I
13X. Becker. D. M., J. ‘I‘. Philbrick, T. L. Bachhuber, and J. E. Humphries.IYYh. D-dimer testing and acute venous thromboembolism: a short-cut to accurate diagnosis? Arch. Inrem. Med. 156:93Y-946.
139. Moser, K. M. lYY4. Diagnosing pulmonary embolism: D-dime, needsrigorous evaluation. Br. Med. J. 309:152S-3526.
140. Ginsberg. J. S.. C. Kearon, J. Doukelis, et al. 1997. The use of D-dimertesting and impedance plethysmographic examination in patientswith clinical indications of deep venous thrombosis. Arch. Inwn.Mm/. lS7:1077-1081.
141. Perrier. A., H. Bounameaux, A. Morabia, rl ul. 1996. Diagnosis of pul-monary embolism by a decision analysis-based strategy includingclinical probability, D-dimer levels, and ultrasonography: a manage-ment study. Arch. In&vw. Med. 156:531-536.
142. Perrier, A., S. Desmarais, C. Goehring. rt al. 1997. D-dimer testing forsuspected pulmonary embolism in outpatients. Am. J. Respir. Crit.Cure Med. lS6:4Y2_4Y6.
143. McNeil. B. J. lY76. A diagnostic strategy using ventilation-perfusionstudies in patients suspect for pulmonary embolism. J. Nucl. Med. 17:613-616.
144. Sostman. H. D., M. Brown, A. Toole, el ul. 1981. Perfusion scan in pul-monary vascular/lymphangitic carcinomatosis: the segmental con-tour pattern. Anz. ./. Komqywl. 137:1072-1074.
145. Velchik. M. G., M. Tobin. and K. McCarthy. 1989. Nonthromboemboliccauses of high-probability lung scans. Am. J. fhysiol. lmqing 4:32-3X.
146. Thomas. D., M. Stein, G. Tanabe, et rd. 1964. Mechanism of broncho-constriction produced by thrombocmboli in dogs. Am. J. Physiol.206: 1207-l 2 12.
147. Epstein, J., A. Taylor, N. Alazraki, el ul. 1976. Acute pulmonary embo-lus associated with a transient ventilatory defect.]. Nucl. Med. 16:1017-1020.
14X. Stein. P. D., J. 0. Leu, M. H. Welch, et al. 1971. Pathophysiology of thepulmonary circulation in emphysema associated with alphal anti-lrypain dcficicncy. C‘ircrrlarion 43:227-239.
149. Newman, G. E., D. C. Sullivan, A. Got&chalk, a cd. IYX2. Scintigraphicperfusion patterns in patients with diffuse lung disease. Rudiology143~227-231.
150. Lesser, B. A., K. V. Leeper, P. D. Stein, et al. lYY2. The diagnosis ofpulmonary embolism in patients with chronic obstructive pulmonarydisease. Chest 102:17~22.
151. Stein, P. D., R. E. Coleman. A. Got&chalk, rl ul. IYYI. Diagnostic util-ity of ventilation-perfusion lung scans in acute pulmonary embolismis not diminished by pre-existing cardiac or pulmonary discasc. C‘hcw100:60&606.
152. Stein, P. D. 197. Pulmonary Embolism. Williams & Wilkins. Baltimore.153. Stein, P. D., A. Alavi, A. Gottschalk, ct rd. IYYI. Usefulness of non-
invasive diagnostic tools for diagnosis of acute pulmonary embolism inpatients with a normal chest radiograph. Am J. Curdiol. 67: I I 17-l 120.
154. Stein. P. D., M. L. Terrin, A. Gottschalk. cv al. 1992. Value of ventila-tion-perfusion scans compared to perfusion scans alone in acute pul-monary embolism. Am. .I. Cardiol. 6Y: 1239-1241.
155. Kipper, M. S., and N. Alazraki. 1982. The feasibility of performing‘j’Xe imaging following the perfusion study. Kudiol<,~~ 144:5X1-5%.
156. Gottschalk. A., P. 0. Alderson, H. D. Sostman. cv 01. 1994. Nuclearmedicine techniques and applications. In J. F. Murray and J. A.Nadel, editors. Textbook of Respiratory Medicine. W. B. Saunders,Philadelphia. 6X2-710.
157. Stein, P. D.. and A. Gottschalk. IYY4. Critical review of vcntilation-perfusion lung scans in acute pulmonary embolism. /‘ro,q. Cbrdw-vast. Dis. 37: 13-24.
158. PISA-PED Investigators. 1995. Invasive and noninvasive diagnosis ofpulmonary embolism. C2-ze.s~ 107:33S~3XS.
159. Gottschalk. A., H. D. Sostman, R. E. Coleman, (‘I al. lYY.1. Vcntilation-perfusion scintigraphy in the PIOPED study: II. Evaluation of thescintigraphic data and interpretations. J. Nucl. Med. 34: I1 I Y-l 126.
160. Stein, P. D. 1997. Strategies for diagnosis. In P. D. Stein. editor. Pulmo-nary Embolism. Williams & Wilkins, Baltimore. 261-272.
161. Stein, P. D., R. D. Hull, H. A. Saltrman, and G. Pinto. lYY3, Strategyfor diagnosis of patients with suspected pulmonary embolism. C’hrsr103:lSS3-1559.
162. Hull, R. D.. G. Raskob. J. S. Ginsberg, A. A. Panju. P. Brill-Edwards.G. Coates, and G. F. Pineo. IYY4. A noninvasive strategy for the treat-ment of patients with suspected pulmonary embolism. Arch. Inkrn.Med. 154:289-297.
163. Stein, P. D., R. D. Hull, and G. Pineo. lYY.5. Strategy that includes se-rial noninvasive leg tests for diagnosis of thromboembolic disease inpatients with suspected acute pulmonary embolism based on datafrom PIOPED. Arch. In&v-n. Med. ISS:2lOl-2104.
164. Hull, R. D., W. Feldstein, and P. D. Stein. IYYh. Cost-effectiveness ofpulmonary embolism diagnosis. Arch. Inrrm. Med. 156:6X-72.
165. Stein, P. D., J. F. O’Connor. J. E. Dalen. et cd. 1967. The angiographicdiagnosis of acute pulmonary embolism: evaluation of criteria. Am.Heart J. 73:730-741.
166. Stein, P. D. 1997. Standard and augmented lechniqucs of pulmonaryangiography. In P. D. Stein, editor. Pulmonary Embolism. Williams& Wilkins, Baltimore. 203-214.
167. Stein, P. D., C. Athanasoulis. A. Alavi, et cd. lYY2. Complications andvalidity of pulmonary angiography in acute pulmonary embolism.Circulation X5:462-469.
168. Dalen, J. E., H. L. Brooks, L. W. Johnson. a ul. 1971. Pulmonary an-giography in acute pulmonary embolism: indications. techniques.and results in 367 patients. Am. Hran J. XI:l7S~lXS.
169. Kelly, M. A.. J. L. Carson, H. Palevsky, et al. 1901. Diagnosing pulmo-nary embolism: new facts and strategies. Ann. Inwrt?. Med. 114: 300&306.
170. Newman, G. E. 1989. Pulmonary angiography in pulmonary embolism.J. Thoruc. Imaging 412X-39.
171. Ferris, E. J.. J. C. Holder, W. N. Lim. era/. 19X4. Angiography of pul-monary emboli: digital studies and balloon-occlusion cincangiogra-phy. Am. J. Roentgenol. 142:369-373.
172. Mills, S. R., D. C. Jackson, R. A. Older, et 01. lYX0. The incidence, etiol-ogies, and avoidance of complications of pulmonary angiography in alarge series. Radiology 136:2YS-29Y.
173. Hull, R. D., J. Hirsh. C. J. Carter, er ~1. 19x3. Pulmonary angiography,ventilation lung scanning, and venography for clinically suspectedpulmonary embolism with abnormal perfusion lung scan. Ann. In-fern. Med. 98:X91-899.
174. Stein, P. D., R. D. Hull, and G. Raskob. 1994. Risks for major bleedingfrom thrombolytic therapy in patients with acute pulmonary cmbo-lism. Ann. Intern. Med. 121:313~317.
175. Goldhaber. S. Z.. W. D. Hairr, M. L. Feldalein c’rcd. lYY3, Altcplahe vcr-

1066 AMERICAN JOURNAL OF RESPIRATORY AND CRITICAL CARE MEDICINE VOL 160 1999
sus heparin in acute pulmonary embolism: randomized trial assessingright ventricular function and pulmonary perfusion. Lancet 341:507-5 10.
176. Stein, P. D.. and J. W. Henry. 1993. Age-related complications of pul-monary angiography for acute pulmonary embolism. Am. J. Geriutr.Curdiol. 2: 13-22.
177. Stein, P. D. 1YY7. Complications of Pulmonary Angiography. In P. D.Stein, editor. Pulmonary Embolism. Williams & Wilkins, Baltimore.I YS-202.
178. Gefter. W. B., H. Hatabu, G. A. Holland, et al. 1995. Pulmonary throm-boembolism: recent developments in diagnosis with CT and MR im-aging. Radiology lY7:561-574.
179. Touliopoulos, P., and P. Costello. 1905. Helical (spiral) CT of the tho-rax. Radiol. Clin. North Am. 33:X43-861.
180. Remy-Jardin. M.. rr ul. lYY2. Central PE: diagnosis with spiral volumet-ric CT with single-breath-hold technique: comparison with pulmo-nary angiography. Radiology 185:381-387.
181. Remy-Jardin, M. J., J. Remy. F. Deschildre, et al. 1996. Diagnosis ofacute pulmonary embolism with spiral CT: comparison with pulmo-nary angiography and scintigraphy. Radiology 200:699-706.
182. van Rossum, A. B., F. E. Treurniat, G. J. Kieft, et al. 1996. Role of spi-ral volumetric computed tomographic scanning in the assessment ofpatients with clinical suspicion of pulmonary embolism and an ab-normal ventilation perfusion scan. Thorax 51:23-28.
183. Sostman, H. D., D. T. Layish, V. F. Tapson. et al. 1996. Prospectivecomparison of helical CT and MR imaging in patients with clinicallysuspected pulmonary embolism. J. Magn. Reson. Imaging 6275-281.
184. Goodman, L. R.. J. J. Curtin, M. W. Mewissen et al. 1995. Detection ofpulmonary embolism in patients with unresolved clinical and scinti-graphic diagnosis: helical CT vs angiography. Am. .I. Roentgenul.164:136Y-1374.
185. Mayo. J. R.. M. Remy-Jardin, N. L. Muller, et al. 1997. Pulmonary em-bolism: prospective comparison of spiral CT with ventilation-perfu-sion scintigraphy. Radiology 205:447452.
186. Drucker, E. A., S. M. Rivitz, J. 0. Shepard, et al. 1998. Acute pulmo-nary embolism: assessment of helical CT for diagnosis. Radiology209:235-241.
187. Ferretti. G. R., J.-L. Bosson. P.-D. Buffaz, et al. 1997. Acute pulmonaryembolism: role of helical CT in 164 patients with intermediate proba-bility at ventilation-perfusion scintigraphy and normal results at du-plex US of the legs. Radiology 205:453-458.
188. Oser, R. F.. D. A. Zuckerman, F. R. Gutirrez, and J. A. Brink. 1996.Anatomic distribution of pulmonary embolism at pulmonary arteri-ography: implications for spiral and electron-beam CT. Radiology199:31-3s.
189. Quinn, M. F.. C. J. Lundell, T. A. Klotz, et al. 1987. Reliability of selec-tive pulmonary arteriography in the diagnosis of acute pulmonaryembolism. Am. J. Roentgmol. 149:469-471.
190. Remy-Jardin. M., J. Remy. D. Artaud et al. 1997. Peripheral pulmonaryarteries: optimization of the spiral CT acquisition protocol. Radiol-ogy 204:157-163.
191. Remy-Jardin. M.. J. Remy, 0. Cauvain, et al. 1995. Diagnosis of centralpulmonary embolism with helical CT: role of two-dimensional multi-planar reformations. Am. J. Roentgenol. 165:1131-1138.
192. Remy-Jardin. M.. J. Remy, D. Artaud, et al. 1997. Spiral CT of pulmo-nary embolism: technical considerations and interpretive pitfalls. J.Thorac. Imaging. 12:103-l 17.
193. Goodman, L. R.. and R. J. Lipchik. 1996. Diagnosis of acute pulmonaryembolism: time for a new approach. Radiology 199:25-27.
194. Teigen, C. L., T. P. Maus, P. F. Sheedy. C. M. Johnson, A. W. Stanson,and T. J. Welch. 1993. Pulmonary embolism: diagnosis with electro-beam CT. Radiology 188:839-X45.
195. Teigen, C. L., T. P. Maus, P. F. Sheedy. et al. 1995. Pulmonary embo-lism: diagnosis with contrast-enhanced electron-beam CT and com-parison with pulmonary angiography. Radiology 194:313-319.
196. Steiner, P.. G. K. Lund, J. F. Debatin. et al. 1996. Acute pulmonary em-bolism: value of transthoracic and transesophageal echocardiographyin comparison with helical CT. Am. J. Roentgenol. 167:931-936.
197. Blum. A. G., F. Delfau, B. Grignon. et al. 1994. Spiral computed tomog-raphy versus pulmonary angiography in the diagnosis of acute mas-sive pulmonary embolism. Am. J. Cardiol. 74196-98.
198. Greaves. S. M.. E. M. Hart, K. Brown. et ul. 1995. Pulmonary throm-
boembolism: spectrum of findings on CT. Am. .J. Roent~enol.165:1359-1363.
199. Woodard, P. K., H. D. Sostman, J. R. MacFall, et al. 1005. Detection ofpulmonary embolism: comparison of contrast-enhanced spiral CTand time-of-flight MR techniques. J. Thorac. /maging. 1050-72.
200. Dresel, S.. A. Stabler, J. Scheidler, et ul. 1995. Diagnostic approach inacute pulmonary embolism: perfusion scintigraphy versus spiralcomputed tomography. Nucl. Med. Commrm. 16:1OOY-101.5.
201. Winston, C. B., R. J. Wechsler, A. M. Salazar. vt al. lYY6. Incidentalpulmonary emboli detected at helical CT: effect on patient care. Ra-diology 201123-27.
202. van Erkel, A. R.. A. B. van Rossum, J. L. Bloem, eta/. lYY6. Spiral CTangiography for suspected pulmonary embolism: a cost-effectivenessanalysis. Radiology 201:2Y-36.
203. Loubeyre, P., D. Revel, P. Douek, et al. 1904. Dynamic contrast-en-hanced MR angiography of pulmonary embolism: comparison withpulmonary angiography. Am. J. Roentgmol. 162:1035-1039.
204. Schiebler, M. L., G. A. Holland, H. Hatabu. et al. lYY3. Suspected pul-monary embolism: prospective evaluation with pulmonary MR an-giography. Radiology 189:125-131.
205. Erdman, W. A., R. M. Peshock, H. C. Redman, et ul. lYY4. Pulmonaryembolism: comparison of MR images with radionuclide and angio-graphic studies. Radiology lYO:49Y--508.
206. Grist, T. M., H. D. Sostman. J. R. MacFall. et ul. lYY3. Pulmonary an-giography with MRI: preliminary clinical experience. Radio/og_ylXY:S23-530.
207. Kasper, W., T. Meinertz, B. Henkel. er al. IYXh. Echocardiographicfindings in patients with proved pulmonary embolism. Am. Heart J.112:128&3290.
208. Wolfe, M. W., R. T. Lee. M. L. Feldstein, et al. 1994. Prognostic signifi-cance of right ventricular hypokinesis and perfusion lung scan de-fects in pulmonary embolism. Am. Heart J. 127:1371-1375.
209. Come, P. C. 1992. Echocardiographic evaluation of pulmonary embo-lism and its response to therapeutic interventions. Chest lOl:lSlS-162s.
210. Kasper, W., T. Meinertz. F. Kersting, et al. 1980. Echocardiography inassessing acute pulmonary hypertension due to pulmonary embo-lism. Am. J. Cardiol. 45567-572.
211. Gabrielsen, F., A. Schmidt, T. Eggeling, et al. 1992. Massive main pul-monary artery embolism diagnosed with two-dimensional Dopplerechocardiography. Clin. Cardiol. 1S:S45-546.
212. McConnell, M. V., S. D. Solomon, M. E. Rayan. et al. 1996. Regionalright ventricular dysfunction detected by echocardiography in acutepulmonary embolism. Am. J. Cardiol. 78~46Y-473.
213. Nixdorf, U., R. Erbel, M. Drexler, and J. Meyer. 19x8. Detection ofthromboembolus of the right pulmonary artery by transesophagealtwo-dimensional echocardiography. Am J. Cardiof. 61:4Xx.
214. Galernt, M. D., A. Mogtader. and R. T. Hahn. 1992. Transesophagealechocardiography to diagnose and demonstrate resolution of anacute massive pulmonary embolus. Chest 102:297-299.
215. Popovic, A. D., B. Milanovic, A. N. Nescovic. e/ al. 1992. Detection ofmassive pulmonary embolism by transesophageal echocardiography.Cardiology 80:94_9Y.
216. Pruszczyk, P., A. Torbicki. R. Pacho, et (11. 1997. Noninvasive diagnosisof suspected severe pulmonary embolism: transesophageal echocar-diography versus spiral CT. Chesr 112:722-72X.
217. Tapson, V. F., C. J. Davidson, P. A. Gurbel, cf al. lYY1. Rapid and accu-rate diagnosis of pulmonary emboli in a canine model using intravas-cular ultrasound imaging. Chest 1(x):1410-1413.
218. Tapson, V. F., C. J. Davidson, K. B. Kisslo, rt 01. lY94. Rapid visualiza-tion of massive pulmonary emboli utilizing intravascular ultrasound.Chest 105:X88-890.
219. Torbicki, A. 1994. Echocardiography in pulmonary embolism. In M.Morpugo. editor. Pulmonary Embolism. Marcel Dekker, New York.153-l 78.
220. Tapson. V. F. 1997. Pulmonary embolism: the diagnostic repertoire.Chest 11257%580.
221. Goldhaber, S. Z., and L. Visani. 1995. The International CooperativePulmonary Embolism Registry. Chest 10X:302-304.
222. Goldhaber, S. Z., L. Visani, and M. De Rosa. 19YY. Acute pulmonaryembolism: clinical outcomes in the International Cooperative Embo-lism Registry. Luncet 353:13X6-1389.