america’s secret water crisis
TRANSCRIPT

AMERICA’S SECRET WATER CRISIS:NATIONAL SHUTOFF SURVEY REVEALS WATER AFFORDABILITY EMERGENCY AFFECTING MILLIONS

Food & Water Watch champions healthy food and clean water for all. We stand up to corporations that put profits before people, and advocate for a democracy that improves people’s lives and protects our
environment. We envision a healthy future for our families and for generations to come, a world where all people have the wholesome food, clean water and sustainable energy they need to thrive. We believe this will happen when people become involved in making democracy work and when people, not corporations, control the decisions that affect their lives and communities.
Food & Water Watch has state and regional offices across the country to help engage concerned citizens on the issues they care about. For the most up-to-date contact information for our field offices, visit foodandwaterwatch.org.
National Office1616 P Street, NW
Suite 300Washington, DC 20036
(202) 683-2500
Oakland, California155 Grand AvenueSuite 905Oakland, CA 94612(510) 922-0720
Los Angeles, California 915 Wilshire BoulevardSuite 2125Los Angeles, CA 90017(323) 843-8450
Santa Barbara, California 222 E Canon Perdido StreetSuite 207CSanta Barbara, CA 93101(323) 843-8456
Ventura, California 940 E. Santa Clara StreetSuite 202Ventura, CA 93001(805) 507-5083
Colorado1801 N. Williams StreetSuite 400Denver, CO 80218(720) 449-7505
Florida2655 6th Avenue SouthSuite 200St. Petersburg, FL 33712(954) 687-9224
Maryland3121 St. Paul StreetSuite 28Baltimore, MD 21218(410) 394-7650
New Jersey100 Bayard StreetSuite 202New Brunswick, NJ 08901(732) 839-0860
New Mexico7804 Pan American East Freeway NE #2Albuquerque, NM 87109(505) 633-7366
New York147 Prince Street 4th Floor, No. 7Brooklyn, NY 11201(347) 778-2743
Illinois670 W. Hubbard StreetSuite 300Chicago, IL 60654(773) 796-6086
Pennsylvania1501 Cherry StreetSecond FloorPhiladelphia, PA 19102(267) 428-1903
Oregon1028 SE Water AvenueSuite 245Portland, Oregon 97214(971) 266-4528
About Food & Water Watch
Copyright © October 2018 by Food & Water Watch. All rights reserved.
This report can be viewed or downloaded at foodandwaterwatch.org.

Executive Summary . . . . . . . . . . . . . . . . . . . . . . . . . . . . . . . . . . . 2
Introduction: Our Deepening Water Affordability Crisis . . . . . . . . . . . . . 2
The Harm of Water Shutoffs 3
National Survey: How Widespread Are Water Shutoffs? . . . . . . . . . . . . . 6
Socioeconomic Trends . . . . . . . . . . . . . . . . . . . . . . . . . . . . . . . . . 7
Water Burdens and Unaffordable Bills . . . . . . . . . . . . . . . . . . . . . . . 8
System Improvement Costs . . . . . . . . . . . . . . . . . . . . . . . . . . . . 11
Water Shutoff Policies and Existing Assistance . . . . . . . . . . . . . . . . . 13
Conclusions and Policy Recommendations . . . . . . . . . . . . . . . . . . . . 13
Local governments . . . . . . . . . . . . . . . . . . . . . . . . . . . . . . . . . 13
State legislatures . . . . . . . . . . . . . . . . . . . . . . . . . . . . . . . . . . 14
Congress . . . . . . . . . . . . . . . . . . . . . . . . . . . . . . . . . . . . . . . 14
Appendix A: Water Burdens and Unaffordable Bills . . . . . . . . . . . . . . 15
Appendix B: System Improvement Costs . . . . . . . . . . . . . . . . . . . . . 16
Endnotes . . . . . . . . . . . . . . . . . . . . . . . . . . . . . . . . . . . . . . . . 17
TABLE OF CONTENTS
AMERICA’S SECRET WATER CRISIS:NATIONAL SHUTOFF SURVEY REVEALS WATER AFFORDABILITY EMERGENCY AFFECTING MILLIONS

2 Food & Water Watch • foodandwaterwatch.org
Executive SummaryThis survey is a first-of-its-kind nationwide assessment of water shutoffs for nonpayment. Food & Water Watch contacted the two largest water systems in each state to request the number of households whose water was shut off for nonpayment in 2016. We received responses back from 73 utilities.
Top findings:
• The average water utility shut off 5 percent of households for nonpayment in 2016.
• Among responding utilities, more than half a million households lost water service for nonpayment, affecting an estimated 1.4 million people in 2016.
• An estimated 15 million people in the United States experienced a water shutoff in 2016.
Overall, there appears to be a regional pattern, with more shutoffs in the South and relatively few in Alaska, Hawaii and the Northeast. The highest water shutoff rates were in Oklahoma, where Oklahoma City and Tulsa discon-nected one in five households for nonpayment. Three cities —Eau Claire, Wisconsin; Leominster, Massachusetts; and Champlain Water District, Vermont — did not shut off any household for nonpayment.
Compared to the cities with the fewest shutoffs, the highest shutoff rates occurred in lower-income cities with higher rates of poverty and unemployment. Water service is exceedingly unaffordable for low-income households in Detroit and New Orleans, in particular. More than one in five households in these cities receive water bills that exceed 9 percent of their income. Overall, communities of color had higher water bill burdens. This pattern was seen among the cities with the highest and lowest shutoff rates.
Capital improvements are driving high water bills. On average, the cities with the highest shutoff rates were spending 22 percent more per household each year on capital improvements than the cities with the fewest shutoffs, but there is substantial variation in planned improvements. New Orleans (a high-shutoff city) and Honolulu (a low-shutoff city) had the highest per-house-hold improvement costs. They planned to spend $2,700 to $2,800 per residential customer each year.
Local policies are driving high rates of shutoffs. The three utilities with the highest shutoffs gave residents the least amount of time to pay their bills before facing shutoff. In Springdale, Arkansas, which had the third highest shutoff
rate, the minimum time between the date the bill was sent and disconnection of service for nonpayment was a mere three weeks. At the other end of the spectrum, Eau Claire, Wisconsin and Leominster, Massachusetts did not use water shutoffs for collection at all.
Private water utilities overwhelmingly refused to respond to our requests (see box on page 3). This lack of transparency with privatized systems is a particular concern because these companies charge significantly higher water rates than their government peers, suggesting that affordability might be a bigger problem for their customers.
Local, state and federal officials need to take urgent action to curb the tide of water shutoffs in the face of a growing water affordability crisis:
• Local governments can set up affordability programs to tackle the problem head-on and employ best practices to ensure that households have sufficient time and notice to pay their bills prior to disconnection.
• States should require all utilities, including privately owned systems, to disclose shutoff and reconnec-tion rates.
• The federal government can act to support localities by providing the funding relief needed to ensure that every person in the country has access to safe and affordable water service.
Introduction: Our Deepening Water Affordability Crisis Unaffordable water bills are a growing problem in communities across the country.5 A 2017 study found that water bills were already unaffordable for 12 percent of households, and if water charges increased at projected rates, nearly 36 percent of U.S. households would be unable to afford their water bills within five years.6 This affordability crisis has already made headlines in cities like Detroit and Baltimore,7 but low-income households in communities across the country are struggling to pay their water bills.8
Part of the issue is that the federal government has cut back support for water systems, shifting the burden onto local ratepayers. Federal funding for water and sewer systems has fallen by 74 percent in real dollars since its peak in 1977.9 At the same time, our water pipes are aging and need to be replaced, while treatment plants need updates to comply with stronger water quality regulations.10 According to estimates by the U.S.

America’s Secret Water Crisis: National Shutoff Survey Reveals Water Affordability Emergency Affecting Millions 3
Environmental Protection Agency (EPA), drinking water, wastewater and stormwater systems need at least $744 billion over the next 20 years.11 The American Water Works Association put the figure even higher. It found that our drinking water systems alone need more than $1 trillion over the next 25 years, with the greatest household burden expected in small systems in the southern and northeastern parts of the country.12
With lackluster federal support, water systems are having to hike water rates to make improvements.13 From 2008 to 2014, water and sewer rates increased by about 40 percent.14 Over the last 15 years, water bills have increased at three times the rate of inflation, but household incomes have fallen in real terms, after adjusting for inflation.15
Localities are grappling with water service costs that are increasingly unaffordable for more and more of their residents.16 This problem becomes especially complex in this period of widening income inequality and reli-ance on regressive water billing practices, which cause low-income households to pay a disproportionate amount of their income for their water service.17
Water industry experts have recognized this problem for decades. A 1994 article in the journal of the American Water Works Association predicted that water affordability would become a growing issue over the next decade.18 By 2012, a utility consultant concluded in the same publication: “The trend in decreasing house-hold incomes and rapidly increasing water and sewer bills places our industry on a collision course where the need for more money is clear, but the customers’ ability to pay is trending down. It’s an affordability challenge.”19
In the absence of renewed federal support and local policy changes, this water affordability crisis will only deepen.
The Harm of Water Shutoffs When households receive unaffordable water bills, they may cut back on medicine, groceries or other essentials; or they do not pay for their water service. It is a simple reality that unaffordable bills are often unpaid bills. For utilities, one of the main collection practices for unpaid water bills is service shutoffs.20 This is a punitive measure that can cause substantial harm to low-income households.
Low-income households are particularly vulnerable to water shutoffs because water bills consume a higher share of their income.21 One census study found that
Investor-Owned Utilities Overwhelmingly Refusedto ReplyAlmost all private water companies did not reply to requests for information about their number of shutoffs. Of the 11 privately owned water utilities surveyed, only 1 (Suez Idaho) responded — repre-senting a 9 percent response rate. In comparison, the response rate among public sector providers was 93 percent.1
The companies that did not reply were:
• Suez’s subsidiary in New Jersey (Bergen and Hudson counties)
• Artesian Water Company in Delaware (New Castle County)
• American Water subsidiaries in:
◦ Illinois (the Peoria area)
◦ Kentucky (Lexington, Fayette County)
◦ Missouri (St. Charles and St. Louis counties)
◦ New Jersey (Elizabeth City, Union County, et al.)
◦ West Virginia (Charleston, Kanawha County and Huntington, Cabell County)
• Baton Rouge Water Company in Louisiana (Baton Rouge)
• Aqua America’s subsidiary in Pennsylvania (Montgomery County et al.)
• Maine Water Company (Biddeford, York County).2
Private companies have even refused to provide data to federal agencies. American Water refused to provide shutoff statistics to the Government Accountability Office (GAO) for its survey of economically distressed cities.3 This indicates that government mandates are necessary for disclo-sure from water corporations.
This lack of transparency is a major concern, espe-cially because private companies charge higher rates on average than public sector providers. Food & Water Watch’s survey of the 500 largest community water systems found that privately owned systems charge typical households 59 percent more than public providers charge.4 This real-world impact of those higher rates cannot be explored in the absence of data from the private providers.

4 Food & Water Watch • foodandwaterwatch.org
Table 1 • Water Shutoff Rates in 2016 — A RankingShutoff
rank Utility name State Shutoff rate
Households experi-encing shutoffs
Estimated number of people affected (5)
1 Oklahoma City (7) OK 23% 44,324 113,913
2 Tulsa OK 20% 23,903 56,889
3 Springdale Water Utilities AR 19% 6,072(1) 18,034
4 Sewerage and Water Board of New Orleans LA 17% 19,486 46,572
5 JEA ( Jacksonville) FL 16% 41,311 107,409
6 Rapid City SD 16% 2,953 7,028
7 Des Moines Water Works IA 15% 11,625(2) 28,946
8 Mobile Board of Water and Sewer Commission AL 13% 11,491 27,808
9 Detroit MI 13% 27,588 72,005
10 Columbia SC 12% 15,463(1) 35,256
11 Milwaukee WI 11% 16,342 41,182
12 Tucson AZ 11% 22,453(1) 54,336
13 Kansas City MO 11% 16,262(1) 38,378
14 Newport News VA 10% 11,574 28,935
15 Raleigh NC 10% 17,652 42,718
16 Greenville SC 9% 13,734 29,528
17 Louisville Water Company KY 9% 22,152(1) 53,608
18 Meridian ID 9% 2,858 8,060
19 Charlotte NC 9% 21,220 54,535
20 Phoenix AZ 9% 33,066(1) 94,238
21 Ogden UT 8% 1,671 4,612
22 DeKalb County GA 7% 14,137 37,039
23 Wichita KS 6% 7,558 19,122
24 Philadelphia PA 5% 26,479 68,581
25 Billings MT 5% 1,312 3,109
26 Minneapolis MN 5% 3,538 8,067
27 East Bay MUD — Oakland City only CA 4% 4,106(1) 10,470
28 Albuquerque NM 4% 7,916(3) 19,711
29 Cedar Rapids IA 4% 1,861 4,355
30 Saint Paul MN 4% 3,152 8,069
31 Washington Suburban Sanitary Commission MD 4% 16,181 44,821
32 Tacoma WA 3% 3,235 8,055
33 Columbus OH 3% 8,792 21,013
34 Sioux Falls SD 3% 1,601 3,890
35 Citizens Water (Indianapolis) IN 3% 9,443(1) 23,608
36 DC Water DC 3% 3,313 7,421
37 Denver Water CO 3% 6,201(3) 14,324
38 Fairfax County Water Authority VA 3% 7,948 22,731
39 Metropolitan Utilities District NE 3% 4,898 12,098
40 Salt Lake City UT 2% 1,683 4,157
41 Truckee Meadows Water Authority NV 2% 2,940(3) 7,556
42 Las Vegas Valley Water District NV 2% 7,818(1) 21,578
43 Fort Wayne IN 2% 2,245(1) 5,545
44 Santa Fe NM 2% 592 1,362

America’s Secret Water Crisis: National Shutoff Survey Reveals Water Affordability Emergency Affecting Millions 5
Table 1 • Water Shutoff Rates in 2016 — A Ranking (continued)45 Casper WY 2% 428 1,049
46 Suez Idaho ID 2% 1,666 4,348
47 Portland OR 2% 2,751 6,492
48 Providence RI 2% 1,179 3,006
49 Portland Water District ME 2% 772(1) 1,830
50 Cleveland OH 1% 5,953 13,394
51 Chicago IL 1% 6,351 16,195
52 Kent County Water Authority RI 1% 333 793
53 Fargo ND 1% 370 799
54 Water District No. 1 of Johnson County KS 1% 1,563(1) 4,236
55 Los Angeles CA 1% 5,152 14,580
56 Regional Water Authority CT 1% 1,078 2,749
57 Seattle WA 1% 1,804 3,824
58 Juneau AK 1% 72(1) 189
59 Boston Water and Sewer Commission MA 1% 716 1,683
60 Suffolk County Water Authority NY 1% 3,195 9,553
61 Baltimore MD 1% 1,192 2,932
62 Manchester NH 1% 156(4) 370
63 Dallas TX 1% 1,570 4,051
64 Honolulu Board of Water Supply HI 0% 635(1) 1,949
65 Bismarck ND 0% 80 175
66 AWWU (Anchorage) AK 0% 154(1) 427
67 Lincoln NE 0% 223 531
68 Eugene OR 0% 100 233
69 Burlington VT 0% 11 24
70 Jackson MS 0% 42 110
73 Eau Claire WI 0% 0 -
73 Leominster MA 0% 0 -
73 Champlain Water District (6) VT 0% 0 -
Average 5%
Total 567,695 1,436,192
(1) This is the number of shutoffs performed on households. It is possible for the same household to experience multiple shutoffs in a year.(2) “This number represents the number of disconnect orders for non-payment of services. It is possible an eligible order may not result in disconnection,
for various reasons, including but not limited to: i) the customer was granted additional time to make payment, or ii) the customer made payment after the order was created but before the field work was completed.”
(3) All accounts, including commercial disconnections. (4) Estimated at 156 to 520 a year. Only 22 properties disconnected in 2016 have not had service restored, and they are vacant.(5) Food & Water Watch calculation based on the U.S. Census Bureau, 2012-2016 American Community Survey 5-Year Estimates, Table S1101.(6) Champlain Water District, Vermont, is mostly a wholesale water supply provider. According to the EPA’s Safe Drinking Water Information System, the
district has the most service connections in the state. Correspondence with the utility clarified that only a couple hundred households are residential retail customers.
(7) When the Associated Press contacted the Oklahoma City Utilities Department, its spokesperson said the utility made an error and included commer-cial accounts in the shutoff data provided to Food & Water Watch. The corrected figure for residential-only shutoffs is approximately 26,500 house-holds, or 14 percent, which would move the city’s ranking to 7th highest. The data in this report reflect the original responses from the utilities.
SOURCES: Responses to records requests. Sources on file with Food & Water Watch; Miller, Ken and Adam Kealoha Causey. “Report: More than 500,000 US households had water cut off.” Associated Press. October 24, 2018.

6 Food & Water Watch • foodandwaterwatch.org
low-income families were nearly five times as likely as non-low-income households to experience disconnec-tion of their electric or natural gas service.22 Water shut-offs pose a real threat to human health.23 Without water service, people cannot flush their toilets or wash their hands. Lack of adequate sanitation can cause diseases to spread and allow people to become sick. The elderly, pregnant women, children and people with diabetes and other illnesses would be especially vulnerable.24
Water shutoffs can make homes uninhabitable, forcing families to move.25 Frequent forced moves can negatively impact children’s education. Children who change schools frequently are more likely to repeat grades or completely drop out of school.26 When moving is not an option, water shutoffs can tear fami-lies apart. Lack of running water can be a reason that parents and other guardians lose custody of children.27 Lack of water access in the home may be considered child neglect in 21 states, and water shutoffs have led to children being taken from their homes under child protection laws.28
Unaffordable utility bills can lead to homelessness.29 Studies have found strong associations between discon-nections of other utilities and abandoned homes.30 Water shutoffs can have community-wide consequences. An analysis from We the People of Detroit found that wide-spread water shutoffs were dismantling African-American neighborhoods in Detroit.31
Despite these far-reaching consequences, information about the prevalence of shutoffs is limited. There is no national dataset of water service disconnections.32 This survey seeks to fill the existing information gap and provide a national snapshot of the extent of the problem.
National Survey: How Widespread Are Water Shutoffs? Food & Water Watch submitted information requests under state public information laws to the utilities that owned the two largest community water systems in each state.33 A community water system delivers drinking water to households year-round. Of each utility, we requested the number of
DETROIT
DES MOINES
TULSA
OKLAHOMA CITY SPRINGDALE
NEW ORLEANS
MOBILE
JACKSONVILLE
COLUMBIA
RAPID CITY
12
3
48 5
10
9
7
6
Figure 1 • Water Shutoffs in 2016
Portion of household customers that experienced a water shutoff for nonpayment at the two largest water systems in each state, among responding utilities. Top 10 cities ranked by highest shutoff rate.
>20%
15%
10%
5%<1%0%
Shutoff Rate
DETROIT
DES MOINES
TULSA
OKLAHOMA CITY SPRINGDALE
NEW ORLEANS
MOBILE
JACKSONVILLE
COLUMBIA
RAPID CITY
12
3
48 5
10
9
7
6

America’s Secret Water Crisis: National Shutoff Survey Reveals Water Affordability Emergency Affecting Millions 7
households shut off for nonpayment in 2016 and the total number of residential customers for the system. Responses were received from 73 utilities. For these utilities, shutoff rates were calculated to determine the portion of household customers that had service disconnected for nonpayment that year (see Table 1 on pages 4 and 5 for a ranking).
Three key findings among the responding utilities were:
• The average utility shut off 5 percent of households for nonpayment in 2016.
• 567,695 households lost water service for nonpay-ment among surveyed cities in 2016.
• An estimated 1.4 million people experienced a water shutoff among surveyed cities in 2016.
If we extrapolate the average shutoff rate of responding utilities to all community water systems nationwide, which reportedly served 306 million people in 2016,34 then an estimated 15 million people in the United States experienced a water shutoff that year.
There is great variation in shutoff rates. Three cities — Eau Claire, Wisconsin; Leominster, Massachusetts; and Champlain, Vermont — did not shut off any households for nonpayment, while the two biggest water providers in Oklahoma — Oklahoma City and Tulsa — shut off at least one in five households.
A regional trend is also apparent (see Figure 1 on page 6). The states with the highest water shutoff rates are mostly concentrated in the South: Oklahoma, Arkansas, Louisiana and Florida. Relatively few shutoffs occurred in the Northeast, Hawaii and Alaska.
Overall, the shutoff rates have no obvious direct asso-ciation with poverty rates, bottom household income quintiles or unemployment rates. There are likely too many other various factors that influence shutoffs, including housing characteristics, water bill burdens and local policies. The following sections explore some of these factors by comparing the jurisdictions with the highest shutoff rates (most shutoffs) and the lowest shutoff rates (fewest shutoffs).
Socioeconomic TrendsWhile the full dataset did not show clear associations between shutoff rates and socioeconomic factors, an examination of the systems at the two extremes — with the most and fewest shutoffs — indicates that the highest rates of shutoffs are occurring in cities with relatively higher poverty rates, lower household
Figure 2 • Socioeconomic Indicators of Cities With Most and Fewest Shutoffs
Oklahoma City, OK
Tulsa, OK
Springdale, AR
New Orleans, LA
Jacksonville, FL
Rapid City, ND
Des Moines, IA
Mobile, AL
Detroit, MI
Columbia, SC
Honolulu, HI
Bismark, ND
Anchorage, AK
Lincoln, NE
Eugene, OR
Burlington, VT
Jackson, MS
Eau Claire, WI
Leominster, MA
Champlain Water District, VT
$50,070
$43,045
$44,854
$37,488
$48,256
$47,300
$48,088
$38,759
$26,249
$42,875
$77,161
$60,320
$80,862
$51,126
$44,859
$46,754
$32,866
$45,403
$56,510
$66,728
% White, Non-Latino
% Peopleof Color
Median Income
Figure 3 • Poverty and Unemployment Rates in Cities With Most and Fewest Shutoffs
SOURCE: Food & Water Watch calculation based on U.S. Census Bureau, 2012-2016 American Community Survey 5-Year Estimates, American FactFinder. Accessed August 2018.
Most Shutoffs Fewest Shutoffs
Most Shutoffs Fewest Shutoffs
Poverty Rate Unemployment Rate
22%
16%
9%6%
13% National
7% National
SOURCE: Food & Water Watch calculation based on U.S. Census Bureau, 2012-2016 American Community Survey 5-Year Estimates, American FactFinder. Accessed August 2018.
8 Food & Water Watch • foodandwaterwatch.org
incomes and more unemployment (see Figures 2 and 3 on page 7). High shutoff rates were also dispro-portionately in cities with more people of color.35 Water shutoffs are an issue of environmental justice, as under-resourced communities confront the chal-lenge of repairing aging water systems in the era of widening disparities and climate change.
Compared to the cities with the fewest shutoffs, the cities with the most shutoffs had an average 41 percent higher poverty rate and an average 47 percent higher unemployment rate. The median household income in cities with the highest shutoff rates was only three-quarters the median household income of cities with the lowest shutoff rates.
A GAO survey found high rates of shutoffs in several economically distressed, majority African-American cities. In 2015, about one in five customers in New Orleans, Louisiana and in Gary, Indiana had their service cut off. That year, about one in eight customers lost water service in Birmingham, Alabama; Detroit, Michigan; and Youngstown, Ohio.36 These cities have several characteristics in common, including declining
populations, high rates of poverty and populations that are majority people of color.37 A study of Boston, Massachusetts found that significantly more water shutoff notices were sent to wards with higher propor-tions of people of color.38
Some cities, like Jackson, Mississippi, however, had higher rates of poverty (31 percent) and low shutoff rates (0 percent). In 2014, voters in Jackson approved an increase to the sales tax to help improve the city’s infrastructure, including its water and sewer system.39 Jackson has not had a water or sewer rate increase since then.40
While the average city with the most shutoffs is low-income, not all low-income cities engage in mass shutoffs. The use of water shutoffs for collection is a policy decision, and policies can help prevent shutoffs in distressed communities.
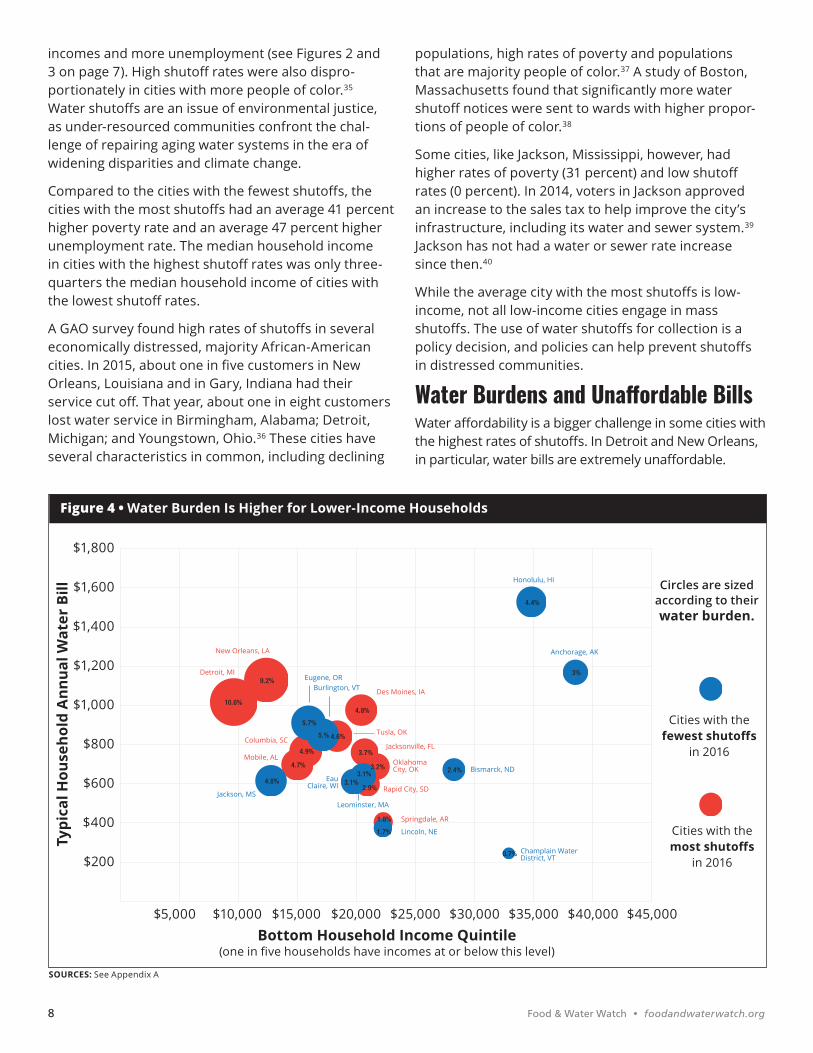
Water Burdens and Unaffordable Bills Water affordability is a bigger challenge in some cities with the highest rates of shutoffs. In Detroit and New Orleans, in particular, water bills are extremely unaffordable.
Figure 4 • Water Burden Is Higher for Lower-Income Households
3.2%
4.6%
1.8%
9.2%
3.7%
2.9%
4.8%
4.7%
10.6%
4.9%
4.4%
2.4%
3%
1.7%
5.7%
5.%
4.8% 3.1%3.1%
0.7% Champlain WaterDistrict, VT
Bismarck, ND
Anchorage, AK
Burlington, VTEugene, OR
Honolulu, HI
Lincoln, NE
EauClaire, WI
Leominster, MAJackson, MS
Springdale, AR
Rapid City, SD
OklahomaCity, OK
Jacksonville, FL
Tusla, OK
Des Moines, IA
New Orleans, LA
Detroit, MI
Mobile, AL
Columbia, SC
Bottom Household Income Quintile(one in five households have incomes at or below this level)
$5,000 $10,000 $15,000 $20,000 $25,000 $30,000 $35,000 $40,000 $45,000
$1,800
$1,600
$1,400
$1,200
$1,000
$800
$600
$400
$200
Typi
cal H
ouse
hold
Ann
ual W
ater
Bill
3.2%
4.6%
1.8%
9.2%
3.7%
2.9%
4.8%
4.7%
10.6%
4.9%
4.4%
2.4%
3%
1.7%
5.7%
5.%
4.8% 3.1%3.1%
0.7% Champlain WaterDistrict, VT
Bismarck, ND
Anchorage, AK
Burlington, VTEugene, OR
Honolulu, HI
Lincoln, NE
EauClaire, WI
Leominster, MAJackson, MS
Springdale, AR
Rapid City, SD
OklahomaCity, OK
Jacksonville, FL
Tusla, OK
Des Moines, IA
New Orleans, LA
Detroit, MI
Mobile, AL
Columbia, SC
Circles are sized according to their water burden.
Cities with the fewest shutoffs
in 2016
3.2%
4.6%
1.8%
9.2%
3.7%
2.9%
4.8%
4.7%
10.6%
4.9%
4.4%
2.4%
3%
1.7%
5.7%
5.%
4.8% 3.1%3.1%
0.7% Champlain WaterDistrict, VT
Bismarck, ND
Anchorage, AK
Burlington, VTEugene, OR
Honolulu, HI
Lincoln, NE
EauClaire, WI
Leominster, MAJackson, MS
Springdale, AR
Rapid City, SD
OklahomaCity, OK
Jacksonville, FL
Tusla, OK
Des Moines, IA
New Orleans, LA
Detroit, MI
Mobile, AL
Columbia, SC
Cities with the most shutoffs
in 2016
SOURCES: See Appendix A

America’s Secret Water Crisis: National Shutoff Survey Reveals Water Affordability Emergency Affecting Millions 9
Low-income households in these cities have what is known as high water burdens. A water burden is the portion of a household’s total income that is spent on their drinking water, wastewater and stormwater service.41 The United Nations has indicated that for water service to be affordable, charges should not constitute more than 3 percent of a household’s income.42 California’s Department of Public Health has set an affordability threshold of 1.5 percent of household income for drinking water alone.43 Some affordability experts set the threshold for water and sewer affordability at 2 percent of household income,44 and others put that combined threshold at 4 percent.45 Although utility affordability experts acknowledge that these thresholds are to some degree subjective, they generally accept these thresholds.46
Because comparing water bills to the median household income can obscure affordability challenges for low-income households,47 this survey looks at the bottom quintile of household income in each city. One-fifth of households have annual incomes at or below this amount. Typical water bills were calculated assuming 5,000 gallons of water used a month by a household with a 5/8-inch meter inside a utility’s main service area. Water bills include charges for drinking water, sewer and stormwater services.
The average water burden for low-income households is 5.0 percent in cities with the most shutoffs and 3.7 percent in cities with the fewest shutoffs (see Appendix A on page 15). Although average water bills are slighter higher in the cities with the fewest shutoffs, water burdens tend to be lower because household incomes are higher (see Figure 4 on page 8).
Notably, a typical household’s water bill exceeds $1,000 a year in Detroit and New Orleans. Among the cities with the highest shutoff rates, these two cities have the largest water bills and the lowest household incomes. They are also predominately African-American communities. For more than one in five households in New Orleans, typical water bills would consume at least 9 percent of their income. Low-income Detroit households are facing water service charges that would consume more than 10 percent of their income. Water service is simply unaffordable for low-income house-holds in Detroit and New Orleans.
A 2018 survey of low-income residents in the Detroit area similarly found that the average household was paying 10 percent of its income on water bills.48 Unaffordable water bills were hitting home. That survey found that
more than 80 percent of households were making difficult tradeoffs to pay their water bills: more than half of surveyed residents reduced spending on their rent or property taxes, clothing, fruit and vegetables, and transportation.49 More than half of surveyed residents cut back dramatically or completely on school supplies.50
Overall, between the two groups with the most and fewest shutoffs, the water bill burdens were much higher in majority African-American cities. The average majority African-American city had a water bill burden more than twice that of the average majority white city (see Figure 5). In majority African-American cities, low-income households paid more than 7 percent of their income on water on average. In the average majority white city, low-income households paid 3 percent of their income on water.
While this water burden analysis looked only at 20 cities and more research is needed, these results suggest that African-American communities disproportionately face water affordability challenges. Other surveys have found similar trends. A study of Michigan found that communities of color pay higher average household water bills than communities with lower percentages of racial minorities.51 In 2017, a Chicago Tribune survey of the Chicagoland metropolitan area found that black and poor suburbs paid higher water bills than their wealthier, whiter neighbors. It found that majority
Figure 5 • Average Water Bill Burden for Low- Income Households
MajorityWhite Cities
3%
MajorityBlack Cities
7%

10 Food & Water Watch • foodandwaterwatch.org
Honolulu, HINew Orleans, LA
Oklahoma City, OK
Jacksonville, FL
Columbia, SC
Anchorage, AK
Des Moines, IA
Burlington, VTJackson, MS
Springdale, ARRapid City, ND
Eau Claire, WI
Lincoln, NE
Mobile, AL
Eugene, ORBismarck, ND
Champlain, VT
Leominster, MA
Tulsa, OK
Detroit, MI
Figure 6 • Expensive Improvements Are Driving Rate Increases
Annualized total cost of capital improvements (millions)
Ann
ualiz
ed c
ost
per
resi
dent
ial c
usto
mer
$3,000
$2,500
$2,000
$1,500
$1,000
$500
$100 $200 $300 $400 $500
SOURCES: See Appendix B
Honolulu, HINew Orleans, LA
Oklahoma City, OK
Jacksonville, FL
Columbia, SC
Anchorage, AK
Des Moines, IA
Burlington, VTJackson, MS
Springdale, ARRapid City, ND
Eau Claire, WI
Lincoln, NE
Mobile, AL
Eugene, ORBismarck, ND
Champlain, VT
Leominster, MA
Tulsa, OK
Detroit, MI
Cities with the fewest shutoffs
in 2016
Cities with the most shutoffs
in 2016
Honolulu, HINew Orleans, LA
Oklahoma City, OK
Jacksonville, FL
Columbia, SC
Anchorage, AK
Des Moines, IA
Burlington, VTJackson, MS
Springdale, ARRapid City, ND
Eau Claire, WI
Lincoln, NE
Mobile, AL
Eugene, ORBismarck, ND
Champlain, VT
Leominster, MA
Tulsa, OK
Detroit, MI

America’s Secret Water Crisis: National Shutoff Survey Reveals Water Affordability Emergency Affecting Millions 11
African-American communities had typical household bills that were 20 percent higher than those in majority white communities.52
System Improvement CostsAs expected, among both groups of cities, cities with larger capital improvement plans were charging higher rates, but some cities with high improvement needs had low rates of shutoffs (see Figure 6 on page 10).
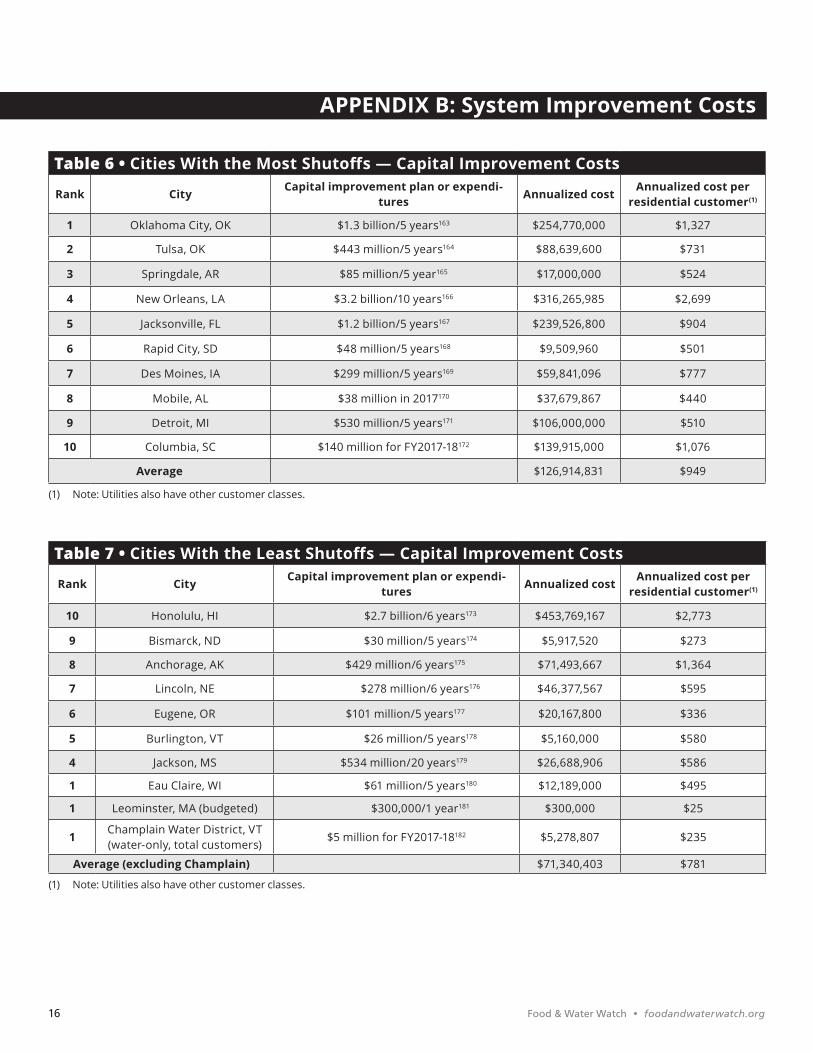
On average, the cities with the highest shutoff rates were spending 22 percent more per household each year on capital improvements than the cities with the fewest shutoffs, but there is substantial variation in the planned capital improvements in water and sewer systems. Nearly all systems are planning millions of dollars of upgrades every year, amounting to an average cost of $949 per household a year for high-shutoff cities and $781 among low-shutoff cities (see Appendix B on page 16).
New Orleans and Honolulu, notably, have the highest capital needs among the surveyed cities. New Orleans has one of the highest shutoff rates, while Honolulu has one of the lowest.
New Orleans, a high shutoff rate city, planned to spend $3.2 billion in total over the next decade,53 which amounts to an annualized cost of $2,699 per house-hold. As of November 2017, the utility had 253 active projects, totaling $1.2 billion.54 More than 40 percent of those costs are drainage projects to reduce flood damage in the city, still reeling from Hurricane Katrina more than a decade later.55 New Orleans has the world’s second largest drainage system.56 These improvement projects appear to be the driver of the city’s high water costs and high water burden for low-income residents.
Honolulu, a low shutoff rate city, has had to increase its rates substantially to pay for capital improvements to its wastewater system because of federal consent decrees.57 Honolulu has relatively high water bills as a result, but because of the city’s higher household incomes, water burdens for low-income households (4.4 percent) are less than half those in New Orleans (9.2 percent).
These high capital needs indicate that affordability problems will only deepen in the foreseeable future. Cities like New Orleans will need to continue to increase rates that are already unaffordable for low-income households. The city cannot afford not
Tax Sales as an Alternative Enforcement Mechanism: The Baltimore Case Study Unaffordable water bills can become liens against properties in some places, including Baltimore, Maryland.128 In 2016, Baltimore had a relatively low shutoff rate with about 1,200 households discon-nected for nonpayment. This was a decline from 2015, when the city shut off 8,000 households, mostly in the lowest-income areas of the city.129
Instead of using service cutoffs, Baltimore tradi-tionally used tax sales of properties to enforce its water collections.130 Unpaid water bills become liens on the property, and the city sells these liens to investors at annual tax sales. In fiscal year 2017, Baltimore sold about 1,800 properties at tax sale over their water bills alone.131 If a homeowner fails to repay the investor with interest and fees within nine months, the investor can move to foreclose on the home.132
At the end of 2017, in response to public concerns about the impacts of these tax sales, the mayor of Baltimore issued a moratorium on tax sales of owner-occupied homes solely over water bills.133 Because of this moratorium, 3,528 homes were removed from the tax sale list and protected from any water-related foreclosure in 2018.134 In 2018, the Maryland legislature expanded this morato-rium to renter-occupied housing and extended it through 2019.135
In response to the moratorium, the city of Balti-more’s Department of Public Works revamped its water shutoff policy, according to rate consultants for the city, “to incentivize on-time payment of customer bills.”136 However, as the city continued to address issues with the migration of its water billing system, which occurred in October 2016,137 the city put a temporary halt to most water shutoffs. There were only four shutoffs in 2017 and none in the first half of 2018.138
Baltimore’s internal policy of not shutting off water service for nonpayment is highly protective of low-income households. Until the city establishes a comprehensive affordability program, the city should maintain this policy against shutoffs as the city’s affordability crisis intensifies. According to an analysis of Baltimore by a utility affordability expert, “2019 is the year that water and wastewater bills become unaffordable for more than half the city at median income.”139

12 Food & Water Watch • foodandwaterwatch.org
Table 2 • Cities With the Most Shutoffs — Shutoff Policies and Procedures
Rank Utility Notice requirements Minimum period before shutoff Assistance programs or safety nets
1 Oklahoma City, OKMailed notice 10 days prior; door hanger 2 days prior76 31 days from billing date77 H2O (Help 2 Others)78
2 Tulsa, OKNotice provided on next bill
10 days prior79
40 days from billing date (10 days after subsequent bill)80
3 Springdale, AR Mailed notice 5 days prior81 21 days from billing date
(6 days past due)82 Penalty Exempt Program83
4 New Orleans, LA Mailed notice 10 days prior84 70 days past due85 Water Help Program, up to $200 a year86
5 Jacksonville, FLMailed notice 7 days prior, phone call 2 days prior87 44 days after billing date88
United Way 2-1-189
6 Rapid City, SD Mailed notice 10 days prior90 45 days after billing date91 Water Rate Relief Program92
7 Des Moines, IA Mailed notice 10 days prior93 55 days after billing date94 Project H2O, up to $125 a year (voluntary)95
8 Mobile, AL 42 days after billing date96 Neighbors in Need (voluntary)97
9 Detroit, MIFirst mailed notice 11 days
after past due; second notice 10 days prior98
42 days after billing date99 WRAP, up to $300 a year100
10 Columbia, SC Mailed notice 15 days prior101 60 days after due date102
Table 3 • Cities With the Fewest Shutoffs — Shutoff Policies and Procedures
Rank Utility Notice requirements Minimum period before shutoff Assistance programs or safety nets
10Honolulu Board of
Water SupplyMailed notice 10
business days prior103 35 days past due104
9 Bismarck, ND Mailed notice 5 days prior105 75 days after billing date106 No107
8 Anchorage, AKMailed or emailed notice 15 days prior; door hanger 2
days prior108
70 days after billing date109 Coins Can Count (voluntary)110
7 Lincoln, NEMailed or hand delivered
notice 7 days prior111 97 days past due112
6 Eugene, OR Written notice113 144 days after billing date114
Customer Care Program, up to $200 a year, and other support115;
no shutoffs during hot (>100 degree F) or freezing weather116
5 Burlington, VTWritten notice 14 to 20 days prior117
44 days after billing date118 Medical safety net119
4 Jackson, MS 35 days past due120 No
1 Eau Claire, WI N/ADoes not shut off water
for nonpayment121 No122
1 Leominster, MA N/ADoes not shut off water
for nonpayment123 No124
1Champlain Water
District, VTWritten notice 14 to 20 days prior125 44 days after billing date126 Medical safety net127
America’s Secret Water Crisis: National Shutoff Survey Reveals Water Affordability Emergency Affecting Millions 13
to improve its water system, especially its drainage system in the face of more frequent climate change-fueled storms, but residents cannot afford to pay the bills to make these necessary improvements. The situ-ation in New Orleans, in particular, paints a clear case for the need for federal funding to ensure that every household in the country has access to safe water and an environment safe from flooding.
Water Shutoff Policies and Existing AssistanceLocal policies directly influence shutoff rates. These decisions include the use of tax sales as an alternative collection practice, water shutoff procedures and the availability of low-income assistance programs (see Tables 2 and 3 on page 12).
Shutoff procedures appear to drive the high shutoff rates in Oklahoma City, Oklahoma, Tulsa, Oklahoma and Springdale, Arkansas. These three cities with the highest shutoff rates allow the least amount of time in between mailing bills and shutting off service for nonpayment. In Oklahoma City, the monthly bills are due within 15 days, and accounts are subject to shutoff within 31 days after the billing day.58 That means a household could experi-ence a shutoff in about a month of receiving a water bill.
Notably, Springdale, Arkansas, which has a relatively low water bill burden for low-income households (1.8 percent) and a high shutoff rate (19 percent), provides the least amount of time for bill payment. It shuts off water service for nonpayment at a minimum of three weeks after sending water bills.59 The city’s high shutoff rate is likely driven by this policy.
On the other end of the spectrum, Eau Claire, Wisconsin and Leominster, Massachusetts do not shut off water service for nonpayment at all.60 Instead, the cities place liens on the property (see box on page 11 for informa-tion on tax sales of unpaid liens).61
Among the cities with the fewest shutoffs, Eugene, Oregon has the highest water burden. Low-income households there face water bills that consume at least 5.7 percent of their income. Eugene, however, grants customers 144 days to pay their bills before being subject to shutoff,62 and it offers a low-income assistance program of up to $200 year as well as other safety nets and protections.63
The largest water provider in Oregon — Portland — was one of the first U.S. water systems to offer afford-ability programs, in the 1990s.64 As of 2017, Portland
(shutoff rate of 2 percent) offered a “customer driven, flexible, no cost and generous payment arrangement system”, and it offers bill discounts, crisis vouchers, a safety net program and assistance with fixture repair.65 Portland also uses multiple notification methods: the bill, a bill reminder, a shutoff notice, a call and a door hanger.66
Most of the utilities offer some form of assistance, but that assistance can vary. Oklahoma City provides funding to the Salvation Army to help struggling households pay their bills.67 Many of the assistance programs apply only to low-income seniors and people with disabilities, including in New Orleans68 and Rapid City,69 while others are funded by voluntary contribu-tions that may not generate sufficient funding to meet the demand.70
Bismarck, North Dakota, indicated that while it does not offer low-income assistance, “We work to factor in affordability and sustainability into our rates.”71 Similarly, Springdale Water Utilities, Arkansas, does not offer low-income assistance other than waiving late fees for customers on disability or social security. The customer service representative indicated, “We try to keep our water rates as low as possible for every customer.”72 Among cities with the highest shutoff rates, Springdale charges the lowest rates.
A 2017 EPA survey of nearly 800 water utilities found that only 30 percent of utilities offered some form of customer assistance program.73 An American Water Works Association survey found that the share of utili-ties offering assistance and payment plans increased from 39 percent in 2017 to 48 percent in 2018, but in 2018 only 25 percent had actual low-income assistance programs — the rest offered only payment plans or referred people to nonprofits.74 A detailed review found that most assistance programs are small with limited capacity and ability to meet the needs of low-income households.75
Conclusions and Policy RecommendationsWater affordability is a national problem, and water shutoffs are widespread and affect millions of people across the country. Disconnecting water service poses a very real threat to personal wellbeing. Extensive water shutoffs could potentially create a public health crisis in highly impacted communities. Local, state and federal policy makers need to take urgent action to reverse the tide and prevent mass shutoffs.

14 Food & Water Watch • foodandwaterwatch.org
Local governments There are many ways that local governments can reduce water shutoffs even in the face of increasing water bills. Affordability programs can tackle the heart of the problem of water bills colliding with the ability of low-income households to pay. For large cities where low-income households confront high water burdens, percentage-of-income water affordability programs would be an effective solution. These programs cap water bills at a level that each and every low-income household can afford to pay based on its income. In July 2017, Philadelphia launched the nation’s first income-based affordability program for the water sector.140
Other best practices include more-lenient payment schedules, extended periods for payment plans and sufficient notice prior to disconnection.
State legislaturesAt the state level, more transparency is urgently needed about water shutoffs. State legislatures should require that all utilities — including privately owned ones — track water shutoffs for nonpayment and reconnections of these affected households, disclose that information to the public on the utility website and at a central loca-tion managed by a state agency, and ensure that the information is publicly available.
CongressNationally, a robust federal funding program will ease high water burdens and can redistribute costs through a more progressive funding stream. Congress must act and create a dedicated source of federal funding for our drinking water and wastewater infrastructure. The Water Affordability, Transparency, Equity and Reliability Act (WATER Act) is the right vision to ensure that every community can repair aging systems, stop sewage backups and overflows, remove lead pipes, improve school drinking water, help households address contaminated wells and outdated septic systems, and prevent water shutoffs because of unaf-fordable water bills.
An infusion of federal assistance is critical for cities like New Orleans, which must make substantial invest-ments to protect the health and safety of its residents. The costs of these necessary improvements are leading to rate increases that make water service exceedingly unaffordable for households. We need a major federal investment in our public water infrastructure to ensure universal access to safe and clean water service at an affordable price.

America’s Secret Water Crisis: National Shutoff Survey Reveals Water Affordability Emergency Affecting Millions 15
Table 4 • Cities With the Most Shutoffs — Water BurdenAnnual water, sewer and stormwater bills for households with 5/8” meters, using 60,000 gallons a year, 2018
Rank City Annual water bill Bottom household income quintile141 Water burden
1 Oklahoma City, OK142 $ 689 $ 21,721 3.2%
2 Tulsa, OK143 $ 844 $ 18,344 4.6%
3 Springdale, AR144 $ 405 $ 22,276 1.8%
4 New Orleans, LA145 $ 1,130 $ 12,336 9.2%
5 Jacksonville, FL146 $ 762 $ 20,698 3.7%
6 Rapid City, SD147 $ 599 $ 20,931 2.9%
7 Des Moines, IA148 $ 977 $ 20,419 4.8%
8 Mobile, AL149 $ 697 $ 14,981 4.7%
9 Detroit, MI150 $ 1,018 $ 9,574 10.6%
10 Columbia, SC151 $ 768 $ 15,696 4.9%
Average $ 789 $ 17,698 5.0%
Table 5 • Cities With the Fewest Shutoffs — Water BurdenAnnual water, sewer and stormwater bills for households with 5/8” meters, using 60,000 gallons a year, 2018
Rank City Annual water bill Bottom household income quintile152 Water burden
10 Honolulu, HI153 $ 1,529 $ 34,849 4.4%
9 Bismarck, ND154 $ 673 $ 28,252 2.4%
8 Anchorage, AK155 $ 1,169 $ 38,578 3.0%
7 Lincoln, NE156 $ 375 $ 22,245 1.7%
6 Eugene, OR157 $ 912 $ 15,920 5.7%
5 Burlington, VT158 $ 849 $ 17,133 5.0%
4 Jackson, MS159 $ 616 $ 12,740 4.8%
1 Eau Claire, WI160 $ 611 $ 19,782 3.1%
1 Leominster, MA161 $ 641 $ 20,564 3.1%
1 Champlain Water District, VT (water-only)162 $ 245 $ 32,921 0.7%
Average (excluding Champlain) $ 820 $ 23,340 3.7%
APPENDIX A: Water Burdens and Unaffordable Bills
16 Food & Water Watch • foodandwaterwatch.org
Table 6 • Cities With the Most Shutoffs — Capital Improvement Costs
Rank City Capital improvement plan or expendi-tures Annualized cost Annualized cost per
residential customer(1)
1 Oklahoma City, OK $1.3 billion/5 years163 $254,770,000 $1,327
2 Tulsa, OK $443 million/5 years164 $88,639,600 $731
3 Springdale, AR $85 million/5 year165 $17,000,000 $524
4 New Orleans, LA $3.2 billion/10 years166 $316,265,985 $2,699
5 Jacksonville, FL $1.2 billion/5 years167 $239,526,800 $904
6 Rapid City, SD $48 million/5 years168 $9,509,960 $501
7 Des Moines, IA $299 million/5 years169 $59,841,096 $777
8 Mobile, AL $38 million in 2017170 $37,679,867 $440
9 Detroit, MI $530 million/5 years171 $106,000,000 $510
10 Columbia, SC $140 million for FY2017-18172 $139,915,000 $1,076
Average $126,914,831 $949
(1) Note: Utilities also have other customer classes.
Table 7 • Cities With the Least Shutoffs — Capital Improvement Costs
Rank City Capital improvement plan or expendi-tures Annualized cost Annualized cost per
residential customer(1)
10 Honolulu, HI $2.7 billion/6 years173 $453,769,167 $2,773
9 Bismarck, ND $30 million/5 years174 $5,917,520 $273
8 Anchorage, AK $429 million/6 years175 $71,493,667 $1,364
7 Lincoln, NE $278 million/6 years176 $46,377,567 $595
6 Eugene, OR $101 million/5 years177 $20,167,800 $336
5 Burlington, VT $26 million/5 years178 $5,160,000 $580
4 Jackson, MS $534 million/20 years179 $26,688,906 $586
1 Eau Claire, WI $61 million/5 years180 $12,189,000 $495
1 Leominster, MA (budgeted) $300,000/1 year181 $300,000 $25
1 Champlain Water District, VT (water-only, total customers)
$5 million for FY2017-18182 $5,278,807 $235
Average (excluding Champlain) $71,340,403 $781
(1) Note: Utilities also have other customer classes.
APPENDIX B: System Improvement Costs
America’s Secret Water Crisis: National Shutoff Survey Reveals Water Affordability Emergency Affecting Millions 17
Endnotes1 In comparison, 82 out of the 88 public sector entities that were
surveyed provided a response, representing a 93 percent re-sponse rate. Most nonresponses were from states where public information laws apply to only citizens of that state. Of the public entities that responded, two systems charged prohibi-tively high fees for searching for the records, and eight systems responded that they did not maintain the records. Data were obtained for 72 of the publicly owned systems, or 82 percent of the public utilities surveyed.
2 U.S. Environmental Protection Agency (EPA). Safe Drinking Wa-ter Information System. Accessed April 11, 2017.
3 U.S. Government Accountability Office (GAO). “Water Infrastruc-ture: Information on Selected Midsize and Large Cities With Declining Populations.” (GAO-16-785.) September 2016 at 72.
4 Food & Water Watch. “The State of Public Water.” February 2016.5 National Academy of Public Administration. “Developing a New
Framework for Community Affordability of Clean Water Ser-vices.” October 2017 at 2.
6 Mack, Elizabeth A. and Sarah Wrase. “A burgeoning crisis? A nationwide assessment of the geography of water affordability in the United States.” PLoS One, Vol. 12, Iss. 1. January 2017 at 7 to 9.
7 For example, see: Stafford, Kat. “Controversial water shutoffs could hit 17,461 Detroit households.” Detroit Free Press. March 26, 2018; Duncan, Ian. “As Baltimore Council weighs tack-ling high water bills, study shows how much customers are squeezed.” Baltimore Sun. December 18, 2017.
8 National Academy of Public Administration at 2.9 U.S. Congressional Budget Office. “Public Spending on Transpor-
tation and Water Infrastructure.” (Pub. No. 49910.) March 2015 at Supplemental Table W-8; Food & Water Watch. [Fact sheet]. “U.S. Water Systems Need Sustainable Funding: The Case for the Water Affordability, Transparency, Equity and Reliability Act.” May 2016 at 1.
10 Mirosa, Oriol. “Water affordability in the United States: An initial exploration and an agenda for research.” Sociological Imagina-tion. Vol. 51, Iss. 2. December 2015 at 41 to 42.
11 U.S. EPA. “Clean Watersheds Needs Survey 2012: Report to Con-gress.” (EPA 830-R-15005.) January 2016 at 1; U.S. EPA. “Drinking Water Infrastructure Needs Survey and Assessment: 6th Report to Congress.” (EPA 816-K-17-002.) March 2018 at 9.
12 American Water Works Association. “Buried no longer: Con-fronting America’s infrastructure challenge.” 2012 at 10 to 11.
13 National Academy of Public Administration at 25.14 Ibid. at 21.15 Ibid. at 22.16 National Consumer Law Center. “Review and recommendations
for implementing water and wastewater affordability programs in the United States.” March 2014 at 1 and 5.
17 Economic Policy Institute. “Income Inequality in the U.S. by State, Metropolitan Area, and County.” June 16, 2016 at 1 to 4; Mirosa at 52.
18 Beecher, Janice A. “Water affordability and alternatives to ser-vice disconnection.” Journal AWWA, Vol. 86, No. 10. October 1994 at 61 to 62.
19 Mumm, Jason. “Accepting the affordability challenge.” Journal AWWA. Vol. 104, No. 5. May 2012 at 28.
20 U.S. EPA. Environmental Financial Advisory Board. “Affordable Rate Design for Households.” February 2006 at 5.
21 National Academy of Public Administration at 145 to 146.
22 Ibid. at 146.23 Amirhadji, Jason et al. Georgetown Law Human Rights Institute
Fact-Finding Practicum. “Tapped Out — Threats to the Human Right to Water in the Urban United States.” April 2013 at 31 to 32.
24 Ibid. at 31 to 32.25 Colton, Roger. “Water Bill Affordability for the City of Philadel-
phia.” Testimony before the Philadelphia City Council. April 9, 2015 at 18.
26 Ibid. at 18.27 Mirosa at 40.28 Amirhadji et al. at 34.29 Colton (2015) at 19.30 Ibid. at 20.31 We the People of Detroit Community Research Collective.
“Mapping the Water Crisis: The Dismantling of African-American Neighborhoods in Detroit.” Vol. 1. 2016 at vi and 21 to 23.
32 National Academy of Public Administration at 22; Mirosa at 49.33 The two largest systems in each were identified using the EPA’s
Safe Drinking Water Information System. In each state, systems were sorted by total number of service connections.
34 Food & Water Watch analysis of EPA. Safe Drinking Water Information System. Available at https://ofmpub.epa.gov/apex/sfdw/f?p=108:200. Accessed July 2018.
35 Food & Water Watch calculation based on U.S. Census Bureau, 2012-2016 American Community Survey 5-Year Estimates, American FactFinder. Accessed August 2018.
36 GAO at 72 to 73.37 Ibid. at 57 to 58.38 Foltz-Diaz, Kimberly et al. Massachusetts Global Action. “The
Color of Water: A Report on the Human Right to Water in the City of Boston.” July 2014 at 1 and 5.
39 Jackson, MS. “The Bold New Improvement Plan: An Integrated Plan for Sustainable Infrastructure and Regulatory Compliance.” March 2015 at 2, 9 and 10.
40 Jackson, MS. “Understanding Utility Statements and Rates.” Accessed July 18, 2018.
41 Fisher, Sheehan & Colton. “Water Affordability Program for Detroit (MI). FSC’s Law & Economics Insights. Issue 05-1. January/February 2005 at 1 to 2.
42 United Nations Development Programme. (2006). Human Devel-opment Report 2006. UN Development Programme: New York, NY at 11 and 66.
43 Pacific Institute. “Water Rates: Water Affordability.” January 2013 at 1.
44 Fisher, Sheehan & Colton at 2.45 National Consumer Law Center at 8.46 Ibid. at 8.47 Ibid. at 9.48 Kay, Cria et al. University of Michigan School for Environment
and Sustainability. “Water insecurity in Southeast Michigan: the impacts of unaffordability and shutoffs on resident well-being.” April 2018 at 7 to 8.
49 Ibid. at 8 to 9.50 Ibid. at 9.51 Butts, Rachel and Stephen Gasteyer. “More cost per drop: Water
rates, structural inequality, and race in the United States — The case of Michigan.” Environmental Reviews & Case Studies, Vol. 13, No. 4. December 2011 at 386 and 392.

18 Food & Water Watch • foodandwaterwatch.org
52 Gregory, Ted et al. “Same lake, unequal rates: Why our water rates are surging — and why black and poor suburbs pay more.” Chicago Tribune. October 25, 2017.
53 Sewerage and Water Board of New Orleans. “10-Year Capital Improvement Plan: Fiscal Years 2018-2027.” 2018 at 12.
54 Ibid. at 8. 55 Ibid. at 3 and 8. 56 Ibid. at 6. 57 FitchRatings. “City and County of Honolulu, Hawaii.” October 25,
2010 at 1 and 3. 58 Oklahoma City, OK. Email correspondence with Food & Water
Watch. August 3, 2018.59 Springdale, AR. Ordinance No. 3439. January 13, 2004; Spring-
dale Water Utilities. Email correspondence with Food & Water Watch. August 2, 2018; Springdale, AR. Code of Ordinances §118-253). 2018.
60 Eau Claire, WI. Email correspondence with Food & Water Watch. July 10, 2018; Leominster, MA. Email correspondence with Food & Water Watch. August 14, 2018.
61 Ibid . 62 Eugene Water & Electric Board. Email correspondence with Food
& Water Watch. August 6, 2018.63 Eugene Water & Electric Board. “Help Paying My Bill.” Available
at http://www.eweb.org/residential-customers/help-paying-my-bill. Accessed July 24, 2018; Eugene Water & Electric Board. “Customer Service Policies.” July 10, 2018 at 10.
64 Mirosa at 45.65 Portland Public Records Request Center. Response to Public
Records Request C045458-071017. July 17, 2017. 66 Ibid . 67 Oklahoma City, OK. “Help 2 Others: Financial Assistance.” Avail-
able at https://www.okc.gov/departments/utilities/customer-service/ways-to-pay-bill/help-2-others-financial-assistance. Accessed July 24, 2018.
68 New Orleans Sewerage and Water Board. “Water Help Program.” Available at https://www.swbno.org/custserv_information_wa-terhelp.asp. Accessed August 23, 2018.
69 Rapid City, SD. Code of Ordinances. §13.08.430(C). 2018. 70 Des Moines Water Works. “Project H20.” Available at http://
www.dmww.com/customer-service/project-h20. Accessed July 24, 2018; Mobile Area Water and Sewer System. (Brochure). Neighbors in Need. 2018. Available at https://www.mawss.com/pdf/NIN_Brochure%20flat-3.pdf.
71 Bismarck, ND. Email correspondence with Food & Water Watch. July 16, 2018.
72 Springdale Water Utilities. Email correspondence with Food & Water Watch. June 7, 2018.
73 National Academy of Public Administration at 147.74 American Water Works Association. “State of the Water Industry
Report.” 2018 at 19.75 National Academy of Public Administration at 147 to 148.76 Oklahoma City, OK. Email correspondence with Food & Water
Watch. August 3, 2018. 77 Ibid. 78 Oklahoma City, OK. “Help 2 Others: Financial Assistance.” Avail-
able at https://www.okc.gov/departments/utilities/customer-service/ways-to-pay-bill/help-2-others-financial-assistance. Accessed July 24, 2018.
79 Tulsa City, OK. Email correspondence with Food & Water Watch. August 13, 2018.
80 Ibid .81 Springdale Water Utilities. Email correspondence with Food &
Water Watch. August 2, 2018. 82 Springdale, AR. Ordinance No. 3439. January 13, 2004; Spring-
dale Water Utilities. Email correspondence with Food & Water Watch. August 2, 2018; Springdale, AR. Code of Ordinances §118-253). 2018.
83 Springdale Water Utilities. Email correspondence with Food & Water Watch. June 7, 2018.
84 New Orleans Sewerage and Water Board. “Customer FAQ.” Available at https://www.swbno.org/custserv_information_faq.asp#a32. Accessed August 23, 2018.
85 Ibid.86 New Orleans Sewerage and Water Board. “Water Help Program.”
Available at https://www.swbno.org/custserv_information_wa-terhelp.asp. Accessed August 23, 2018.
87 JEA. “Credit and Collections Policy.” 2015 at 12. Available at https://www.jea.com/My_Account/Residential.../Credit_and_Collections_Policy.
88 JEA. Email correspondence with Food & Water Watch. August 14, 2018
89 JEA. “Get Assistance.” Available at https://www.jea.com/in_our_community/get_assistance/. Accessed August 2, 2018.
90 Rapid City, SD. Code of Ordinances. §13.08.500. 2018. 91 Ibid; Rapid City, SD. Email correspondence with Food & Water
Watch. August 6, 2018. 92 Rapid City, SD. Code of Ordinances. §13.08.430(C). 2018. 93 Des Moines Water Works. Email correspondence with Food &
Water Watch. July 3, 2018. 94 Ibid . 95 Des Moines Water Works. “Project H20.” Available at
http://www.dmww.com/customer-service/project-h20/. 2018. Accessed July 24, 2018.
96 Mobile Board of Water and Sewer Commissioners. “Mobile Area Water and Sewer System Policy & Procedure Manual.” January 1, 2014 at 4-4.
97 Mobile Area Water and Sewer System. (Brochure). Neighbors in Need. 2018. Available at https://www.mawss.com/pdf/NIN_Bro-chure%20flat-3.pdf.
98 Detroit Water & Sewerage Department. “Collection Rules and Procedures.” January 22, 2003 at 3.
99 Ibid. at 3.100 Detroit Water and Sewerage Department. “Keep the Water On.”
Available at http://www.detroitmi.gov/water. Accessed August 23, 2018.
101 Columbia, SC. Code of Ordinances §23-141(b). September 7, 2017.
102 Ibid.103 Honolulu Board of Water Supply. Email correspondence with
Food & Water Watch. August 2, 2018.104 Honolulu Board of Water Supply. Rules and Regulations. §2-204.
2018. 105 Bismarck, ND. Code of Ordinances §11-01-06. 2018.106 Bismarck, ND. Email correspondence with Food & Water Watch.
August 24, 2018. 107 Bismarck, ND. Email correspondence with Food & Water Watch.
July 16, 2018. 108 Anchorage Water Utility. “Tariff for Water Service.” July 29, 2010
at 96.

America’s Secret Water Crisis: National Shutoff Survey Reveals Water Affordability Emergency Affecting Millions 19
109 Ibid. at 11 and 96.110 Anchorage Water and Wastewater Utility. “Coins Can Count.”
Available at https://www.awwu.biz/customer-service/account-assistance/coins-can-count. Accessed July 24, 2018.
111 Lincoln, NE. Municipal Code §17.22.090. 2018.112 Ibid .113 Eugene Water & Electric Board. “Customer Service Policies.” July
10, 2018 at 9. 114 Eugene Water & Electric Board. Email correspondence with Food
& Water Watch. August 6, 2018.115 Eugene Water & Electric Board. “Help Paying My Bill.” Available
at http://www.eweb.org/residential-customers/help-paying-my-bill. Accessed July 24, 2018.
116 Eugene Water & Electric Board, July 10, 2018 at 10. 117 Vermont code. 24 §5142(5) and §5143(a) (2017). 118 Vermont code. 24 §5142((3)and (5) (2017).119 Vermont code. 24 §5142(b)(4) (2017). 120 Jackson, MS. Municipal Code. §122-242. August 1, 2018.121 Eau Claire, WI. Email correspondence with Food & Water Watch.
July 10, 2018. 122 Ibid . 123 Leominster, MA. Email correspondence with Food & Water
Watch. August 14, 2018. 124 Ibid . 125 Vermont code. 24 §5142(5) and §5143(a) (2017). 126 Vermont code. 24 §5142((3)and (5) (2017).127 Vermont code. 24 §5142(b)(4) (2017). 128 Jacobson, Joan. The Abell Foundation. “Keeping the water on:
Strategies for addressing high increases in water and sewer rates for Baltimore’s most vulnerable customers.” The Abell Report. Vol. 29, No. 4. November 2016 at 9 and 11; Amirhadji et al. at 32.
129 Food & Water Watch analysis of Baltimore City Department of Public Works. Response to Maryland Public Information Act Request: List of turn-offs, turn-ons (final). November 20, 2015.
130 Raftelis Financial Consultants, Inc. “Water Fund Financial Feasi-bility Report.” January 31, 2018 at 10.
131 Maryland General Assembly, Department of Legislative Ser-vices. “Fiscal and Policy Note, HB 1409.” February 22, 2018 at 2.
132 Baltimore, MD. “Tax Sale Process.” Available at http://taxsale.baltimorecity.gov/tax-sale-process. Accessed August 7, 2017.
133 Broadwater, Luke. “Mayor Catherine Pugh orders halt to tax sales for Baltimore homeowners with unpaid water bills.” Balti-more Sun. December 20, 2017.
134 Cenname, Robert. (Memorandum). “FY 2019 Council Budget Hearings — Agencies Follow-ups.” June 12, 2018.
135 Maryland General Assembly. Chapter 714 (Senate Bill 1098). May 15, 2018.
136 Raftelis Financial Consultants, Inc. “Water Fund Financial Feasi-bility Report.” January 31, 2018 at 10.
137 Ibid. at 3.138 Baltimore Department of Public Works. Response to Maryland
Public Information Act request. August 10, 2018.139 Colton, Roger. Fisher, Sheehan & Colton. “Baltimore’s conun-
drum: Charging for water/wastewater services that community residents cannot afford to pay.” November 2017 at 21.
140 Wogan, J. B. “The Cost of Water Is Rising. Philadelphia Has an Unprecedented Plan to Make It More Affordable.” Governing Magazine. July 5, 2017.
141 U.S. Census Bureau, 2012-2016 American Community Survey 5-Year Estimates. Table B19080.
142 Oklahoma City, OK. “Service Rates & Fees.” Accessed March 26, 2018.
143 Tulsa, OK. “Utility Rates and Customer Service Fees.” October 1, 2017.
144 Springdale Water Utilities, AR. “Water and Sewer Rates.” Ac-cessed March 26, 2018.
145 Sewerage and Water Board of New Orleans, LA. “Water Rates.” Accessed March 26, 2018; Sewerage and Water Board of New Orleans, LA. “Sewer Rates.” Accessed March 26, 2018.
146 JEA. “Water Bill Estimator.” Accessed July 18, 2018.147 Rapid City, SD. “Understanding Your Utility Bill.” Accessed July
17, 2018; Rapid City, SD. “Utility Billing and Service Information.” Accessed July 17, 2018.
148 Des Moines Water Works. “Des Moines - Rates & Service Areas.” July 17, 2018.
149 Mobile Area Water and Sewer System, AL. “Mobile Area Water And Sewer System Fee Schedule Effective January 1, 2018.” Ac-cessed July 17, 2018.
150 Detroit Water & Sewerage Department. “Notice to Customers.” July 1, 2017.
151 Columbia, SC. “Water / Sewer Bill Estimator.” Accessed August 20, 2018.
152 U.S. Census Bureau, 2012-2016 American Community Survey 5-Year Estimates. Table B19080.
153 Honolulu Board of Water Supply. “Revision to the Schedule of Rates and Charges for the Furnishing of Water and Water Ser-vice.” January 1, 2012; Honolulu Department of Environmental Services. “New Sewer Services Charges as of July 1, 2016.” July 1, 2016.
154 Bismarck, ND. “Public Works Utility Billing Rate Schedule 2018.” Accessed July 17, 2018.
155 Anchorage Water and Wastewater Utility. “Rates.” Accessed July 17, 2018.
156 Lincoln, NE. “Water and wastewater rates and service charges.” Accessed July 17, 2018.
157 EWEB. “Residential Pricing.” Accessed July 18, 2018; Eugene, OR. “Wastewater fees.” Accessed July 18, 2018; Eugene, OR. “Storm-water fees.” Accessed July 18, 2018.
158 Burlington, VT. “Rates.” Accessed July 18, 2018. 159 Jackson, MS. “Understanding Utility Statements and rates.” Ac-
cessed July 18, 2018.160 Eau Claire, WI. “2018 Utility Rates.” January 1, 2018. 161 Leominster, MA. “Water & Sewer Bills.” Accessed July 18, 2018. 162 Champlain Water District. “Rates & Fees.” July 18, 2018.163 Oklahoma City, OK. “FY 2017-2021 Proposed Capital Improve-
ment Plan.” 2017 at 164.164 Tulsa, OK. “Annual Budget and Capital Plan, Fiscal Year 2018-
2019.” July 1, 2017 at 5-2.165 Springdale, AR. Response to Freedom of Information Act re-
quest. August 23, 2018. 166 Sewerage and Water Board of New Orleans. “10-Year Capital
Improvement Plan: Fiscal Years 2018-2027.” 2018 at 12. 167 JEA. “JEA Water/Wastewater Five Year CAPEX
Projection.” February 9, 2018 at 1. Available at https://www.jea.com/Engineering_and_Construction/Five_Year_Plan_for_Water_Wastewater_Projects/.
168 Rapid City, SD. “Water Revenue Refunding Bonds, Series 2015.” November 6, 2015 at 12.

20 Food & Water Watch • foodandwaterwatch.org
169 Des Moines, IA “Adopted Capital Improvement Program Plan.” 2017 at 9; Freese, Peggy and Danny J. Klopfer. Des Moines Water Works. “2017-2021 Five-Year Capital Plan.” June 13, 2017 at 2.
170 Mobile, AL. Board of Water and Sewer Commissioners of the City of Mobile. “Comprehensive Annual Financial Report.” June 4, 2018 at 86.
171 Detroit Water & Sewerage Department. “2018-2022 CIP Report.” June 7, 2017 at II-3.
172 Columbia, SC. “FY17-18 Approved Operating Budget Summa-ries.” June 21, 2017 at 11 to 12.
173 Board of Water Supply City and County of Honolulu. “Six-Year Capital Improvement Program for the Fiscal Years Beginning July 1, 2014 and Ending June 30, 2020.” February 23, 2015 at 1; Honolulu, HI. “The Executive Program and Budget Fiscal Year 2015. Volume 2 — Capital Program and Budget.” 2015 at 381.
174 Bismarck, ND. “2018 Budget Request: Capital Improvement Projects.” August 10, 2017 at 11.
175 Anchorage, AK. “A Resolution Approving the 2018-2023 Munici-pal Utilities/Enterprise Activities Capital Improvement Pro-grams.” November 21, 2017 at 3.
176 Lincoln, NE. “Capital Improvement Program FY 2018/19-2023/24.” June 2018 at 1.
177 Eugene Electric and Water Board. “Water 10-Year Capital Im-provement Plans (CIP).” July 10, 2018 at Attachment 1; Eugene, OR. “Adopted FY18-23 CIP.” March 13, 2017 at 160.
178 Burlington, VT. “Draft 10 Year Capital Plan.” July 15, 2016 at 20.179 Jackson, MS. “Water and sewer system revenue refunding
bonds, series 2016.” August 24, 2016 at B-13. 180 Eau Claire, WI. “Proposed Capital Improvement Plan 2019-2023.”
2018 at 12, 20 and 26.181 Leominster, MA. “Mayor’s FY 2019 Budget.” June 6, 2018 at 63
and 67.182 Champlain Water District. “2017-2018 Fiscal Year Wholesale
Retail Budgets.” 2017 at 7.

More Food & Water Watch Research on Water Affordability
Water Injustice: Economic and Racial Disparities in Access to Safe and Clean Water in the United StatesImproving our water systems is an issue of public and environmental health, and it is an issue of economic and racial justice. But across the United States, toxic water and unaffordable water bills are infringing on the basic human rights of poor people and communities of color. The dangers of unsafe water and the financial burdens of upgrading aging water systems are not borne equally. The federal government needs to invest in water infrastructure to help ensure universal access to safe drinking water and reliable wastewater disposal.
Water. Jobs. Justice. The Case for the Water Affordability, Transparency, Equity and Reliability (WATER) Act The Water Affordability, Transparency, Equity and Reliability (WATER) Act is the most comprehensive approach to improving our water systems and helping ensure that every person has access to safe and clean water in the United States. We need a major federal investment in our public water infrastructure to renovate our nation’s old and lead-ridden water pipes, stop sewage overflows and avert a looming water affordability crisis. The WATER Act would provide the much needed $35 billion in federal funding to improve our systems that would simultaneously deliver water justice to the millions of people in the United States who lack access to safe water and create nearly a million jobs.
Five Reasons Baltimore Needs an Income-Based Water Affordability Program Many Baltimore residents have lost their homes, or access to running water in their homes, simply because they cannot afford to pay the city's ever-increasing water rates. When households cannot afford to pay their water bills, the city shuts off their water service or sends their homes to tax sale. The city needs a water affordability program as one in three households are unable to afford the increasing service rates. The astronomical increases will disproportionately threaten the financial livelihood of many of the city's low-income, elderly and of-color residents.
The Water Crisis in Martin County, Kentucky Martin County, Kentucky is facing a water emergency comparable to Flint, Michigan and other water systems across the country that have suffered from disinvestment and contamination. The Martin County Water District and the local leadership have failed to address the often-waterless plight of the county residents and have demonstrated an inability to manage and maintain the water system. Residents should not be forced to pay more for bad service, and Kentucky should declare a state of emergency in Martin County over the failure of its water system, which is compromising water that 10,000 people need.
For more Food & Water Watch research, visit
foodandwaterwatch.org/library

National Office1616 P Street, NWSuite 300Washington, DC 20036(202) 683-2500foodandwaterwatch.org
Food & Water Watch