amine-reactive dyes for dead cell - trinity college …...amine-reactive dyes for dead cell unit...
TRANSCRIPT
UNIT 9.34Amine-Reactive Dyes for Dead CellDiscrimination in Fixed Samples
Stephen P. Perfetto,1 Pratip K. Chattopadhyay,1 Laurie Lamoreaux,1 RichardNguyen,1 David Ambrozak,1 Richard A. Koup,1 and Mario Roederer1
1Vaccine Research Center, NIAID, NIH, Bethesda, Maryland
ABSTRACT
Amine-reactive dyes, also known as LIVE/DEAD fixable dead cell stains, are a classof viability dyes suitable for identifying dead cells in samples that will be fixed. Thesedyes cross the cell membranes of dead cells, and react with free amines in the cytoplasm.Live cells exclude these dyes because their cell membranes are intact, and free dyeis washed away after staining. Notably, the reaction is irreversible; therefore, whencells are fixed and permeabilized (as with intracellular staining procedures), the bounddye remains associated with the dead cells (unlike other viability dyes). Since amine-reactive dyes are fluorescent when excited by lasers, dead cells can be identified by flowcytometry. This unit describes procedures, troubleshooting, and outcomes for using thetwo most commonly used amine-reactive dyes, ViViD and Aqua Blue. Curr. Protoc.Cytom. 53:9.34.1-9.34.14. C© 2010 by John Wiley & Sons, Inc.
Keywords: amine reactive dye � LIVE/DEAD fixable cell stain � cell viability �
nonspecific binding
INTRODUCTION
Amine reactive viability dyes offer an innovative alternative to traditional viability mark-ers. There are eight LIVE/DEAD fixable dead cell stains available in the market today,covering most of the visible and UV spectrum. Two of the most commonly used amine-reactive dyes, ViViD and Aqua Blue, are described in this protocol. These dyes differfrom other viability markers because they react with free amines in the cytoplasm. Livecells exclude these dyes because their cell membranes are intact, and free dye is washedaway after staining (Fig. 9.34.1). Notably, the reaction is irreversible; therefore, whencells are fixed and permeabilized (as with intracellular staining procedures), the bounddye remains associated with the dead cells (unlike other viability dyes). To measure thesetwo dyes, it is critical to determine the correct filter configuration for detecting signalfrom each dye on the flow cytometer. For example, Figure 9.34.2 shows the excitationcurves (dotted lines) and the emission curves (solid lines) of ViViD and Aqua Blue,which can be excited by a 408-nm violet laser (vertical black line). The shaded area overthe emission curve shows the range of detection. Hence, ViViD is measured between425 to 475 nm (450/50 band pass filter), while Aqua Blue is detected between 525 to575 nm (505 nm long pass filter + 515/20 nm band pass filter). Additionally, it is im-portant to note that the flow cytometer used to measure amine-reactive dyes should becalibrated and standardized as described (see UNIT 1.3; Perfetto et al., 2006a).
The utility of amine-reactive dyes is best demonstrated in the context of staining pan-els, which employ various combinations of fluorochrome monoclonal antibody (mAb)-conjugates, using samples that have been cryopreserved and/or stimulated with antigen.Such samples often include large numbers of dead cells, which can bind mAb-conjugatesnonspecifically. In intracytoplasmic cytokine staining (ICS) and peptide-MHC Class I(“tetramer”) assays, (Perfetto et al., 2006b; Chattopadhyay et al., 2008), where detectionof rare events is critical, nonspecific binding of mAb-conjugated to dead cells may result
Current Protocols in Cytometry 9.34.1-9.34.14, July 2010Published online July 2010 in Wiley Interscience (www.interscience.wiley.com).DOI: 10.1002/0471142956.cy0934s53Copyright C© 2010 John Wiley & Sons, Inc.
Studies of CellFunction
9.34.1
Supplement 53

9.34.2
Supplement 53 Current Protocols in Cytometry
0
0
102
103
104
105
104 105
�R780-A�: CD3-CY7APC
�V
450-A
�: V
iViD
103102
damaged cell membrane amine reactive dyeenters cytoplasm
reaction tointracellular free amines
intact cell membrane amine reactive dyecannot enter cytoplasm
no reaction tointracellular free amines
Figure 9.34.1 The staining theory of amine-reactive dyes. The upper pathway shows cells with damaged membranes;in this example the amine reactive dye ViViD enters through these membranes and reacts with the free amines in thecytosol. After binding with free amines this dye complex is positive for fluorescence in the V450 detect (arrow pointing tothe upper cell population or the dead cells). In the lower pathway, the dye is excluded by the intact cell membrane andthe cell remains negative for fluorescence (arrow pointing to the lower cell population or the live cell gate). For the colorversion of this figure go to http://www.currentprotocols.com/protocol/cy0934.
0
20
Ab
so
rba
nce
/em
issio
n
Wavelength (nm)
340 380300 420 460 500 540
40
60
80
ViViDV450 detector
450/50
PMT
10Ab
so
rba
nce
/em
issio
n
Wavelength (nm)
340 380300 420 460 500 540 580
30
50
70
Aqua Blue
90
V525 detector
505LP 515/20
PMT
Figure 9.34.2 The instrument configuration for proper detection of two common amine-reactive dyes. The excitation(dashed curve) and emission (solid curve) curves of the ViViD dye (upper panel) and the Aqua Blue dye (lower panel) areshown. These dyes are excited by the violet 408-nm laser indicated by the black line over the excitation curve. Each panelshows the band-pass filter range of detection for the PMT as shown in each insert. In order to detect fluorescence fromeach emission curve, the V450 detector uses only the 450/50 nm band-pass filter (upper insert) and the V525 detectoruses a 505LP dichroic filter combined with a 515/20 nm band-pass filter (lower insert).
Studies of CellFunction
9.34.3
Current Protocols in Cytometry Supplement 53
in significant overestimation of the proportion of antigen-specific cells. In summary,amine reactive viability dyes can be a powerful substitute for more traditional viabilitydyes and can be used in a variety of panel designs.
BASICPROTOCOL 1
TITRATION OF AMINE-REACTIVE DYES
The purpose of this protocol is to ensure that an optimal amount of amine-reactive dye isused in staining experiments. The optimal concentration is defined as the concentration,which produces the highest signal (MFI) and the lowest background. To this end, amine-reactive dyes should be tested at concentrations above and below the manufacturer’srecommended dilution, using samples that contain substantial numbers of dead cells.For example, peripheral blood mononuclear cell (PBMC) samples contain substantialnumbers of dead cells when incubated at 37◦C for three to five days in RPMI cell culturemedium (containing 10% serum). Similarly, the frequency of dead cells is high whenfrozen cells are thawed under sub-optimal conditions (e.g., extended exposure of frozencells to ambient temperatures). Once titration is completed, new vials from the same lot ofamine reactive dye can be used at the same concentration; titration should be performedwith each new lot.
Materials
Amine reactive dye kit (ViViD, LIVE/DEAD fixable violet dead cell stain or AquaBlue, LIVE/DEAD fixable aqua dead cell stain; both from Invitrogen)containing:Dimethyl sulfoxide (DMSO)Lyophilized dye
Phosphate-buffered saline (PBS; Becton Dickenson)Cells of interestStandard staining medium (see Table 9.34.1)Fluorochrome-conjugated mAb mix (e.g., anti-CD3 Cy7APC)
37◦C water bathFlow cytometer (an analyzer or sorter equipped with a violet laser and optics such
as shown in Fig. 9.34.2; e.g., LSR-II, Becton Dickinson; alternatively, note inthe same figure that the ViViD and Aqua Blue dyes are also well excited by aUV laser)
Flow cytometry data analysis software (e.g., FlowJo software, Treestar)Statistical analysis software (e.g., JMP software, SAS Institute)
1. Thaw the dimethyl sulfoxide (DMSO) supplied with the kit using a 37◦C water bathuntil completely thawed (∼30 sec).
IMPORTANT NOTE: Lyophilized dye is stored desiccated and expires at 60 monthsunder these conditions. DMSO must be stored under desiccated conditions.
Each amine reactive dye kit comes with 25 μg of lyophilized dye and DMSO.
Table 9.34.1 Standard Staining Medium Preparation
Reagent VolumeStockconcentration
Finalconcentration
Neonatal calf sera (HI NCS; Invitrogen)a 20 ml 100% 4%
Sodium azide (NaN3) 0.5ml 20% 0.02%
RPMI 1640 medium (Invitrogen)b 174 ml n/a n/a
Total 500 mlaThaw NCS and place at 56◦C for 1 hr to heat inactivate (HINCS).bRPMI 1640 formula #00-0327DK.
Dead CellDiscrimination
UsingAmine-Reactive
Dyes
9.34.4
Supplement 53 Current Protocols in Cytometry
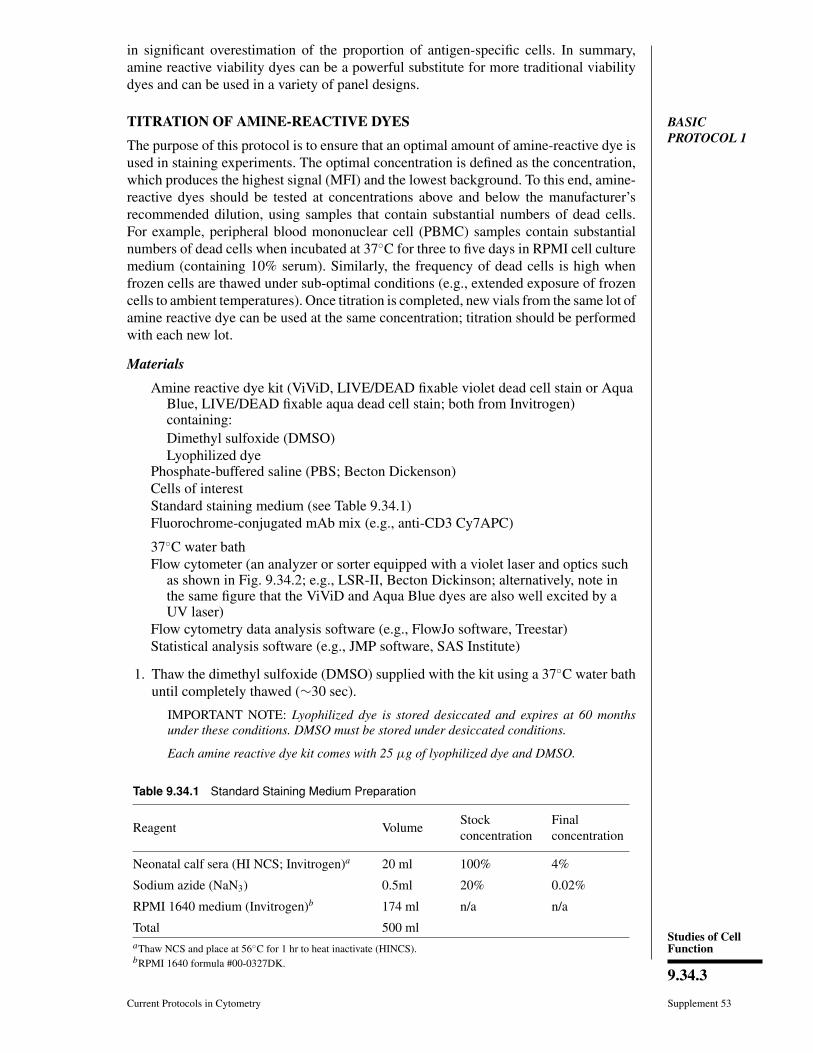
Table 9.34.2 Titration Guide
Dilution Added amountDMSO
(μl)
Stockconcentration
(μg/ml)
Workingconcentration
(μg/ml)
Finalconcentration
(μg/ml)
1 25 μg of dye 25 500 12.50 0.625
2 25 μl of dilution 1 25 250 6.25 0.313
3 25 μl of dilution 2 25 125 3.12 0.156
4 25 μl of dilution 3 25 62.5 1.56 0.078
5 25 μl of dilution 4 25 31.25 0.78 0.039
6 25 μl of dilution 5 25 15.62 0.39 0.020
2. Add 50 μl of DMSO into a vial of lyophilized dye as indicated in Table 9.34.2 inorder to prepare the first dilution (500 μg/ml).
3. Make six serial dilutions using 25 μl from the first dilution (500 μg/ml) into 25 μlvolumes of DMSO resulting in six stock concentrations as listed in Table 9.34.2.
4. Remove 1 μl of each stock concentration and add 39 μl of dH2O, resulting in sixworking concentrations as listed in Table 9.34.2.
IMPORTANT NOTE: Dilution in dH2O is critical. Loss of fluorescence intensity willoccur if this dye is prepared in other media sources containing amino acids.
5. Add 5 μl of each working dilution into 95 μl of cells suspended in PBS. The cellsource should contain substantial numbers of dead cells.
IMPORTANT NOTE: Suspension in PBS is critical. Loss of fluorescence intensity willoccur if this dye is prepared in other media sources containing amino acids. However,standard staining medium may be used in subsequent staining steps.
6. Mix and incubate 20 min at room temperature (RT), shielded from light.
IMPORTANT NOTE: This reaction time is optimal. Increased time or temperature doesnot improve staining intensity of the amine-reactive dyes.
7. Wash cells twice, each time in 1 ml standard staining medium and stain withfluorochrome-conjugated mAb mix (e.g., anti-CD3 Cy7APC) according to a standardstaining procedure as described in UNIT 6.2 and Lamoreaux et al., 2006.
8. Acquire fluorescence measurements for each dilution using a standardized flowcytometer and a detector configuration.
Figure 9.34.3 shows data from a titration experiment for ViViD. Figure 9.34.3A showsall ViViD dilutions within CD3+ T cells; note the different MFIs for negative- andpositive-stained cell populations in the 2.5 and 5 μg/ml dilutions. Figure 9.34.3B is a rep-resentative histogram of a single dilution (2.5 μg/ml) showing the ViViD-positive (2.6%)and the ViViD-negative cell populations. Plotting the medians of positive cell popula-tions versus each dye dilution shows the brightest signal or saturation point at 10 μg/ml(Figure 9.34.3C). However, when considering amine-reactive dyes, lowest backgroundsignal is more important than maximum separation. Hence, the best separation with thelowest background is dilution 2.5 μg/ml (arrow A); even though dilution 5 μg/ml (arrowB) yields a more positive signal, the background is higher and is judged unacceptable(Figure 9.34.3D).

Studies of CellFunction
9.34.5
Current Protocols in Cytometry Supplement 53
20
�g/ml
V4
50
-A: V
iViD
1052.51.250.63 0
0
102
103
104
105
104 105
R780-A: CD3-CY7APC
2.6
V4
50
-A: V
iViD
0
102
103
104
105
103102
A B
20
Dilution (�g/ml)
MF
I p
ositiv
e s
ign
al
1510501000
2000
3000
50007000
10,000
60,000
40,00030,000
20,000
C D
20
Dilution (�g/ml)
Ra
tio
(M
FI
po
s./
MF
I n
eg
.)
Ra
tio
15105
A
010
20
30
40
50
60
70
80
B
Figure 9.34.3 Representative titration of the ViViD dye used in staining panels. Cells wereincubated for 5 days under standard culture conditions and then stained with dilutions of ViViDdye (20, 10, 5, 2.5, 1.25, and 0.625 μg/ml). After staining was complete, cells were stained with anti-CD3 using standard staining procedures. Gating on only CD3+ cells (live and dead), all dilutionscan be concatenated on one histogram (A). This display can be used to measure the MFI of thenegative and positive cell populations using the appropriate software. Panel B is a representativehistogram of the working dilution of 2.5 μg/ml of ViViD and anti-CD3. When considering theamine-reactive dyes, the lowest background signal is more important than the absolute positivesignal. To illustrate the differences in the positive signal relative to the background staining, panelC (positive MFI) can be compared to panel D (ratio = positive MFI/negative MFI). The separationis acceptable at either of the lower dilutions (2.5 or 5 μg/ml); however, since the background islowest at 2.5 μg/ml (arrow A) as compared to 5 μg/ml (arrow B) the lower dilution is best. For thecolor version of this figure go to http://www.currentprotocols.com/protocol/cy0934.
BASICPROTOCOL 2
CREATING STABLE AMINE REACTIVE DYE-LABELED COMPENSATIONBEADS
The purpose of this protocol is to create a LIVE/DEAD fixable dye compensation con-trol for correction of spectral overlap in multicolor flow cytometry. The compensationreagents created are reproducible and stable under long-term storage conditions as de-scribed in this protocol.
There is one important consideration for using these controls. When dead cells areexcluded in the same channel as other cell types (e.g., CD14+ monocytes or CD20+ Bcells, also known as a “DUMP Channel”), only one compensation control is necessary.Typically, the LIVE/DEAD fixable dye is the brightest reagent in this detector becauseonly the CD3+ T cells are included in the final gating (negative gating); hence, onlythe ViViD-stained beads need to be considered as a compensation control. Anotheradvantage of negative gating can be demonstrated in Figure 9.34.4, where ViViD iscombined with anti-CD20 Pacific Blue (PB) and anti-CD14 Pacific Blue to exclude dead
Dead CellDiscrimination
UsingAmine-Reactive
Dyes
9.34.6
Supplement 53 Current Protocols in Cytometry
0
0
102
103
104
105
104 105
CD3-Cy7APC
4 3 2
1
5
ViV
iD/1
4�
20
�P
B
103102
A
00
104 105
SSC
1
FS
C
50K
100K
150K
200K
250K
103102 0 104 105
2
103102
B
00
104 105
3
FS
C
50K
100K
150K
200K
250K
103102 0 104 105
SSC
4
103102 0 104 105
5
103102
D E F
C
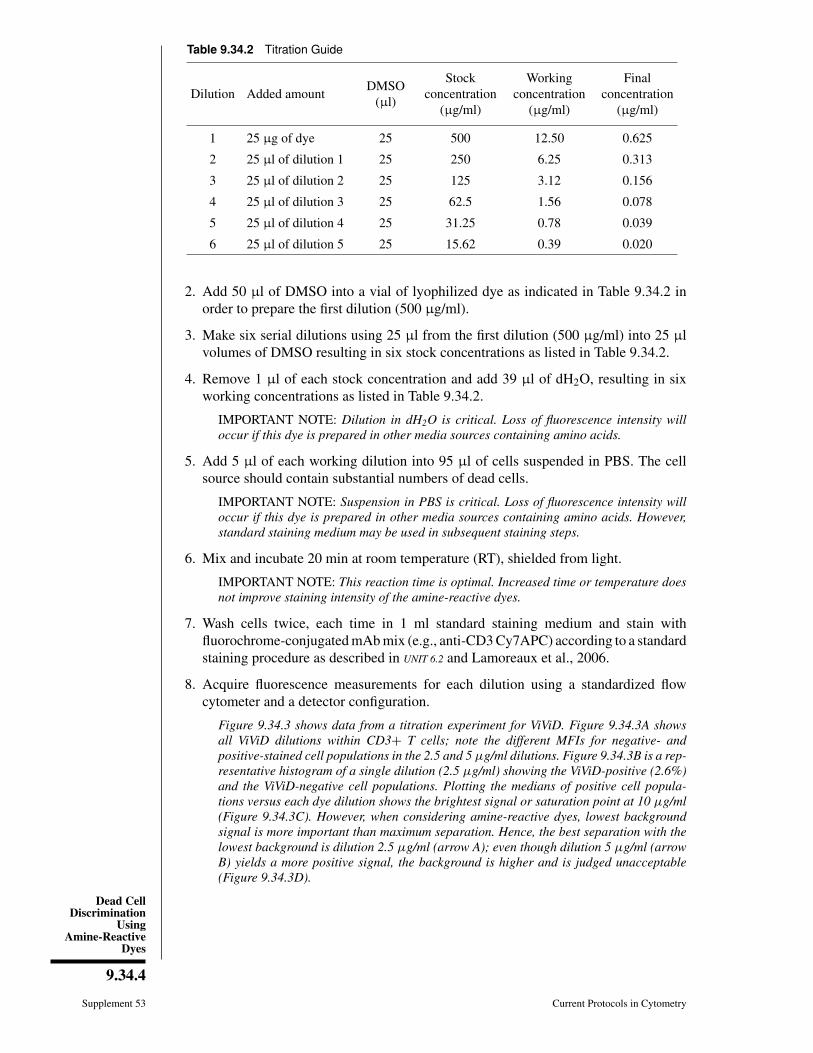
Figure 9.34.4 Dump channel analysis. This figure shows the effective use of a “dump” channel, which uses negativegating strategy. In this strategy, ViViD is combined with anti-CD20 Pacific Blue (PB) and anti-CD14 PB to exclude dead cells,B cells, and monocytes (respectively) using a single detector. (A) After compensation, five populations can be discriminatedbased on the ViViD and MAB-conjugates as follows: live CD3+ T cells (1), dead CD3+ T cells (2), monocytes (3), B cells(4), and live CD3-, CD14-, CD20- cells (5). (B-F) Overlay of the different populations (1-5) over the lymphocyte gatecontaining the CD3+ T cells (1). Each population shows the degree of contamination within the traditional lymphocytegate, dead cells (C), monocytes (D), B cells (E) and live CD3-, CD14-, and CD20- cells (F). For the color version of thisfigure go to http://www.currentprotocols.com/protocol/cy0934.
cells, B cells, and monocytes (respectively) using a single detector. After compensation,five populations can be discriminated based on the ViViD and mAb-conjugate stains(Fig. 9.34.4A); these are as follows: live CD3+ Tcells (1), dead CD3+ T cells (2),monocytes (3), B cells (4), and live CD3-, CD14-, CD20- cells (5). Figure 9.34.4B-Fshows the overlay of the different populations (1-5) over the lymphocyte gate containingthe CD3+ T cells (1). Each population shows the degree of contamination within thetraditional lymphocyte gate, dead cells (C), monocytes (D), B cells (E), and live CD3-,CD14-, and CD20- cells (F). Hence, negative cell gating removes many unwanted cells,which might otherwise fall within the gates of interest.
Materials
R-NH2 Beads (SMPLX Amine active beads; Bangs Laboratories)Phosphate-buffered saline (PBS)Prediluted (reconstituted vial) amine dye at the highest concentrationBead storage medium (see Table 9.34.3)Flow cytometer (an analyzer or sorter equipped with a violet laser and optics such
as shown in Fig. 9.34.2; e.g., LSR-II, Becton Dickinson; alternatively, note inthe same figure that the ViViD and Aqua Blue dyes are also well excited by aUV laser)
Studies of CellFunction
9.34.7
Current Protocols in Cytometry Supplement 53
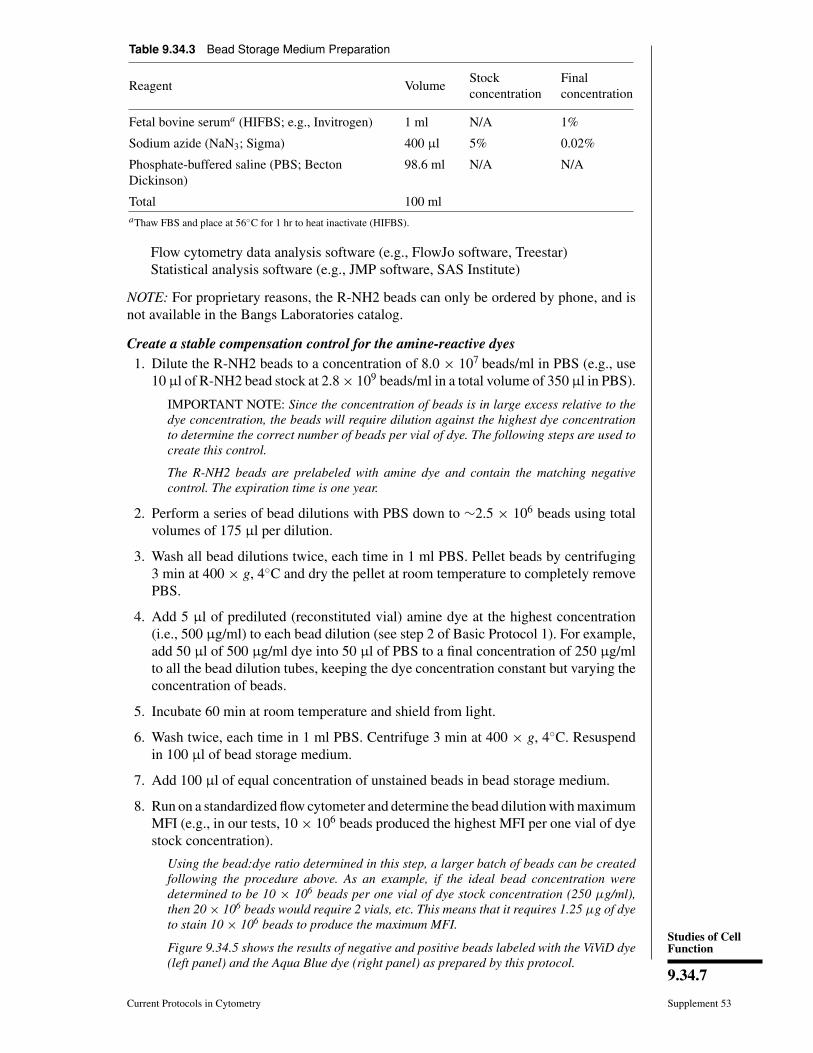
Table 9.34.3 Bead Storage Medium Preparation
Reagent VolumeStockconcentration
Finalconcentration
Fetal bovine seruma (HIFBS; e.g., Invitrogen) 1 ml N/A 1%
Sodium azide (NaN3; Sigma) 400 μl 5% 0.02%
Phosphate-buffered saline (PBS; BectonDickinson)
98.6 ml N/A N/A
Total 100 mlaThaw FBS and place at 56◦C for 1 hr to heat inactivate (HIFBS).
Flow cytometry data analysis software (e.g., FlowJo software, Treestar)Statistical analysis software (e.g., JMP software, SAS Institute)
NOTE: For proprietary reasons, the R-NH2 beads can only be ordered by phone, and isnot available in the Bangs Laboratories catalog.
Create a stable compensation control for the amine-reactive dyes1. Dilute the R-NH2 beads to a concentration of 8.0 × 10⁷ beads/ml in PBS (e.g., use
10 μl of R-NH2 bead stock at 2.8 × 10⁹ beads/ml in a total volume of 350 μl in PBS).
IMPORTANT NOTE: Since the concentration of beads is in large excess relative to thedye concentration, the beads will require dilution against the highest dye concentrationto determine the correct number of beads per vial of dye. The following steps are used tocreate this control.
The R-NH2 beads are prelabeled with amine dye and contain the matching negativecontrol. The expiration time is one year.
2. Perform a series of bead dilutions with PBS down to ∼2.5 × 10⁶ beads using totalvolumes of 175 μl per dilution.
3. Wash all bead dilutions twice, each time in 1 ml PBS. Pellet beads by centrifuging3 min at 400 × g, 4◦C and dry the pellet at room temperature to completely removePBS.
4. Add 5 μl of prediluted (reconstituted vial) amine dye at the highest concentration(i.e., 500 μg/ml) to each bead dilution (see step 2 of Basic Protocol 1). For example,add 50 μl of 500 μg/ml dye into 50 μl of PBS to a final concentration of 250 μg/mlto all the bead dilution tubes, keeping the dye concentration constant but varying theconcentration of beads.
5. Incubate 60 min at room temperature and shield from light.
6. Wash twice, each time in 1 ml PBS. Centrifuge 3 min at 400 × g, 4◦C. Resuspendin 100 μl of bead storage medium.
7. Add 100 μl of equal concentration of unstained beads in bead storage medium.
8. Run on a standardized flow cytometer and determine the bead dilution with maximumMFI (e.g., in our tests, 10 × 106 beads produced the highest MFI per one vial of dyestock concentration).
Using the bead:dye ratio determined in this step, a larger batch of beads can be createdfollowing the procedure above. As an example, if the ideal bead concentration weredetermined to be 10 × 106 beads per one vial of dye stock concentration (250 μg/ml),then 20 × 106 beads would require 2 vials, etc. This means that it requires 1.25 μg of dyeto stain 10 × 106 beads to produce the maximum MFI.
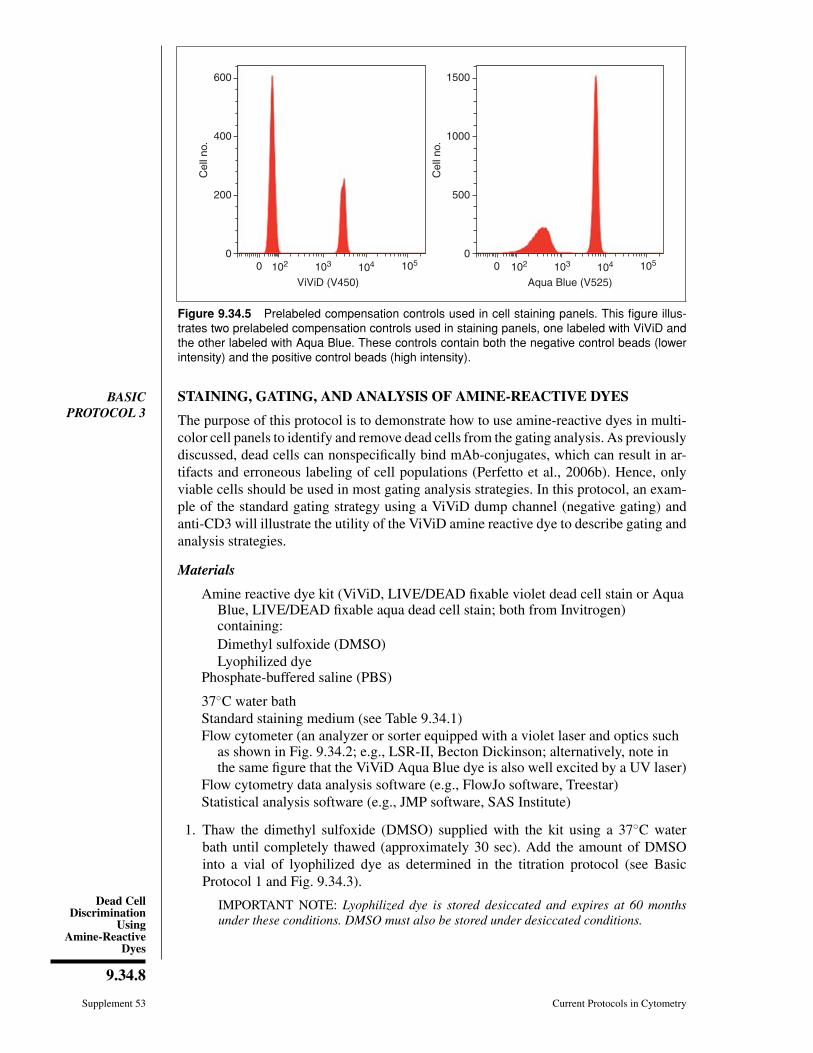
Figure 9.34.5 shows the results of negative and positive beads labeled with the ViViD dye(left panel) and the Aqua Blue dye (right panel) as prepared by this protocol.
Dead CellDiscrimination
UsingAmine-Reactive
Dyes
9.34.8
Supplement 53 Current Protocols in Cytometry
Cell
no.
200
0
400
600
Cell
no.
500
0
1000
1500
0 104 105
ViViD (V450)
103102 0 104 105
Aqua Blue (V525)
103102
Figure 9.34.5 Prelabeled compensation controls used in cell staining panels. This figure illus-trates two prelabeled compensation controls used in staining panels, one labeled with ViViD andthe other labeled with Aqua Blue. These controls contain both the negative control beads (lowerintensity) and the positive control beads (high intensity).
BASICPROTOCOL 3
STAINING, GATING, AND ANALYSIS OF AMINE-REACTIVE DYES
The purpose of this protocol is to demonstrate how to use amine-reactive dyes in multi-color cell panels to identify and remove dead cells from the gating analysis. As previouslydiscussed, dead cells can nonspecifically bind mAb-conjugates, which can result in ar-tifacts and erroneous labeling of cell populations (Perfetto et al., 2006b). Hence, onlyviable cells should be used in most gating analysis strategies. In this protocol, an exam-ple of the standard gating strategy using a ViViD dump channel (negative gating) andanti-CD3 will illustrate the utility of the ViViD amine reactive dye to describe gating andanalysis strategies.
Materials
Amine reactive dye kit (ViViD, LIVE/DEAD fixable violet dead cell stain or AquaBlue, LIVE/DEAD fixable aqua dead cell stain; both from Invitrogen)containing:Dimethyl sulfoxide (DMSO)Lyophilized dye
Phosphate-buffered saline (PBS)
37◦C water bathStandard staining medium (see Table 9.34.1)Flow cytometer (an analyzer or sorter equipped with a violet laser and optics such
as shown in Fig. 9.34.2; e.g., LSR-II, Becton Dickinson; alternatively, note inthe same figure that the ViViD Aqua Blue dye is also well excited by a UV laser)
Flow cytometry data analysis software (e.g., FlowJo software, Treestar)Statistical analysis software (e.g., JMP software, SAS Institute)
1. Thaw the dimethyl sulfoxide (DMSO) supplied with the kit using a 37◦C waterbath until completely thawed (approximately 30 sec). Add the amount of DMSOinto a vial of lyophilized dye as determined in the titration protocol (see BasicProtocol 1 and Fig. 9.34.3).
IMPORTANT NOTE: Lyophilized dye is stored desiccated and expires at 60 monthsunder these conditions. DMSO must also be stored under desiccated conditions.
Studies of CellFunction
9.34.9
Current Protocols in Cytometry Supplement 53
2. Mix thoroughly with a pipet tip.
Depending on the dye used, DMSO will turn from clear to colored, indicating the dye isdissolved.
3. Store the vials up to 3 months at –20◦C. These vials can be thawed and frozen untilthe vial is empty.
IMPORTANT NOTE: Do not store as aliquots in buffered medium or media containingamino acids.
4. Add 1 μl of stock concentration into 39 μl of dH2O (see Basic Protocol 1).
IMPORTANT NOTE: Dilution in dH2O is critical. Loss of fluorescent intensity will occurif this dye is prepared in other media sources containing amino acids.
5. Add 5 μl of the working concentration (from step 4) into cells suspended in 95 μl ofPBS.
IMPORTANT NOTE: Because some mAb-fluorochromes and free amino acids in mediacan compete with amine-reactive dyes, all other cell surface stains should be added ina separate step to avoid the loss of dye effectiveness. In addition, PBS is used in thisstaining step but all other wash steps can use media containing heat-inactivated fetalbovine serum (HIFBS) or other enriched media containing amino acids.
6. Mix and incubate 20 min at room temperature shielded from light.
IMPORTANT NOTE: This reaction time is optimal. Increased time or temperature doesnot improve staining intensity of the amine-reactive dyes.
7. Wash once in 1 ml standard staining medium or medium containing HIFBS.
8. Prepare fluorochrome mAb conjugates, typically in a master mix brought to a vol-ume of 100 μl/test; mix thoroughly and incubate according to each panel standard
250K
FSC-H
FS
C-A
200K150K100K50K 0
0
102
103
104
105
104 105
�R780-A�: CD3-Cy7APC
Singlets and the live cell gate
2.6
�4
50
-A�
: ViV
iD C
D1
4/1
9 P
B
250K
200K
150K
100K
50K
0
103102
A B
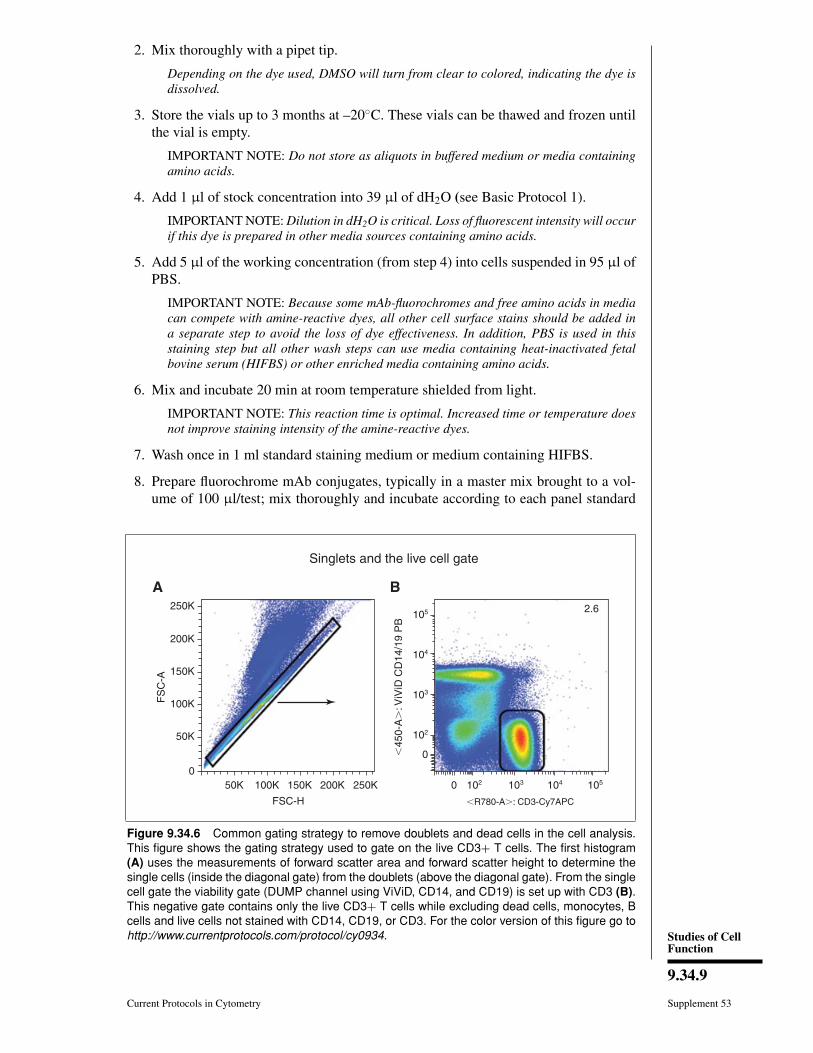
Figure 9.34.6 Common gating strategy to remove doublets and dead cells in the cell analysis.This figure shows the gating strategy used to gate on the live CD3+ T cells. The first histogram(A) uses the measurements of forward scatter area and forward scatter height to determine thesingle cells (inside the diagonal gate) from the doublets (above the diagonal gate). From the singlecell gate the viability gate (DUMP channel using ViViD, CD14, and CD19) is set up with CD3 (B).This negative gate contains only the live CD3+ T cells while excluding dead cells, monocytes, Bcells and live cells not stained with CD14, CD19, or CD3. For the color version of this figure go tohttp://www.currentprotocols.com/protocol/cy0934.
Dead CellDiscrimination
UsingAmine-Reactive
Dyes
9.34.10
Supplement 53 Current Protocols in Cytometry
operating procedure (see UNIT 6.2; Lamoreaux et al., 2006; Chattopadhyay et al.,2008).
IMPORTANT NOTE: PERM/FIX reagents such as Cytofix/Cytoperm or 0.5% PFA willnot change the stability of this dye nor will the dye leak out of the cells.
9. Run compensation controls and all stained cells using a standardized flow cytometer.
Figure 9.34.6 shows a typical gating strategy when collecting cell samples to verifycorrect gate position and efficiency of the viability stain. The first histogram uses themeasurements of forward scatter area and forward scatter height to determine the singlecells (inside the diagonal gate in panel A) from the doublets (above the diagonal gate inpanel A). From the single cell gate, the viability gate (DUMP channel using ViViD, anti-CD14 and anti-CD19) is set up with anti-CD3 to identify the live CD3+ T cells (panelB), which are gated for further analysis depending on the staining panel characteristics.
COMMENTARY
Background InformationImmune monitoring and vaccine immuno-
genicity studies often require the measurementof low-frequency cell populations in sam-ples that have been cryopreserved. This in-evitably leads to questions of sensitivity andreproducibility, since dead cells in the sam-ple may nonspecifically bind mAb-conjugatesand cause significant artifacts (O’Brien andBolton, 1995; Schmid et al., 1999; Perfettoet al., 2004a; Maecker et al., 2005). For-tunately, viability dyes may be used to ex-clude dead cells from analysis. Historically,viability dyes that enter damaged cells viacompromised cell membranes and intercalateinto the DNA were employed; propidium io-dide (PI) is an example of such a dye. How-ever, PI may leak out of cells within a shortperiod of time, leading to significant lossof signal (Desrues et al., 1989; Costantinoet al., 1995; Clarke and Pinder, 1998). Thisis particularly problematic when permeabi-lization reagents are used to stain intracellu-lar molecules (such as cytokines), as is oftenthe case in immune monitoring and immuno-genecity studies. To avoid this problem, ethid-ium monoazide (EMA) may be used. Thisdye covalently binds to DNA after exposureto ultraviolet (UV) light. Although this dye
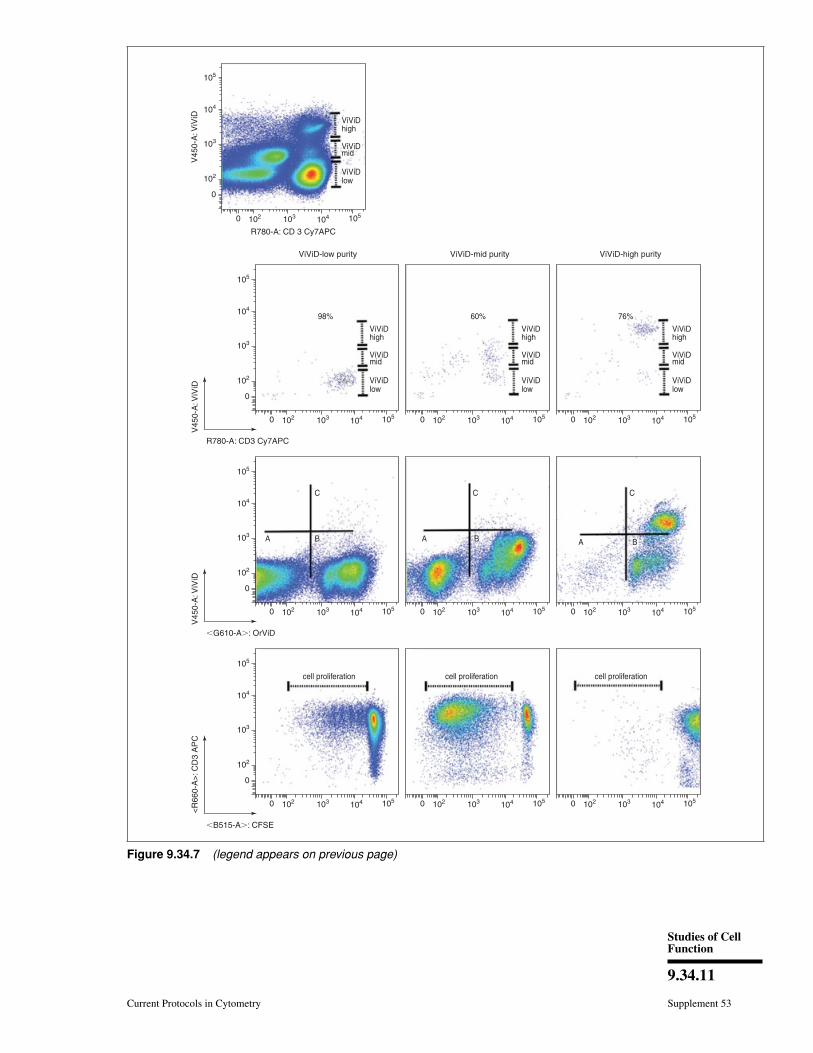
Figure 9.34.7 (appears on next page) CD3+ T cells that are dimly stained with amine-reactivedyes should be included in cell analysis. This figure shows the proliferative capacity of three CD3+ViViD-stained populations, ViViD-Low, ViViD-Mid, and ViViD-High after staining with CFSE, ViViD,and anti-CD3-Cy7APC. The second row shows the sort purity results for each of the sorted cellpopulations as illustrated in the histogram in the first row. The third and fourth rows show results ofpost-incubation for five days in the presence of SEB followed by staining with OrViD (amine reactivedye measured in the G610 detector) and anti-CD3-APC. These additional stains were added tomeasure dead cells as a result of a 5-day incubation and the total number of CD3+ T cells. In thethird row three populations can be described, live cells (A, ViViD-OrViD-), dead cells as a result ofincubation (B, ViViD-OrViD+), and dead cells from the original sort (C, ViViD+OrViD+). In both theViViD-Low and ViViD-Mid cell sorts, live cells were observed and these cells were also proliferating(fourth row). The dead cells from the ViViD-High cell sort show no cell proliferation (fourth row).For the color version of this figure go to http://www.currentprotocols.com/protocol/cy0934.
can resolve dead cell populations and is unaf-fected by intracellular treatments, the need fora UV light source is inconvenient (Riedy et al.,1991). In addition, the degree of membranedamage in apoptotic cells can be variable, leav-ing some Annexin V+ cells with intermediatelevels of PI or EMA staining (Matteucci et al.,1999; Waters et al., 2002). The amine-reactivedyes as discussed in this protocol avoid manyof the disadvantages of these traditional viabil-ity markers. Hence, these are a good alternativefor measuring and removing dead cells fromthe cell analysis.
Critical Parameters andTroubleshooting
The amine-reactive dyes have distinct ad-vantages over traditional viability staining.Firstly, they are simple to use, they are sta-ble, and they can be used with other mAb-conjugates after complete interaction with freeamines in the cytosol of the dead cell. Sec-ondly, the amine-reactive dyes are sold witha variety of emission and excitation wave-lengths and can therefore be included in manycell-staining panels. This flexibility allows formany traditional mAb-conjugates combina-tions to remain while “fitting in” a viabilitydye.
Studies of CellFunction
9.34.11
Current Protocols in Cytometry Supplement 53
0
0
102
103
104
105
104 105
R780-A: CD 3 Cy7APC
R780-A: CD3 Cy7APC
V4
50
-A: V
iViD
ViViD-low purity ViViD-mid purity ViViD-high purity
ViViDhigh
ViViDmid
ViViDlow
ViViDhigh
ViViDmid
ViViDlow
ViViDhigh
ViViDmid
ViViDlow
ViViDhigh
ViViDmid
ViViDlow
98% 60% 76%
V4
50
-A: V
iViD
0
102
103
104
105
103102
0 104 105103102 0 104 105
103102 0 104 105103102
�G610-A�: OrViD
V4
50
-A: V
iViD
C C C
A A AB B B
0
102
103
104
105
0 104 105103102 0 104 105
103102 0 104 105103102
�B515-A�: CFSE
<R
66
0-A
>: C
D3
AP
C
cell proliferation cell proliferation cell proliferation
0
102
103
104
105
0 104 105103102 0 104 105
103102 0 104 105103102
Figure 9.34.7 (legend appears on previous page)

Dead CellDiscrimination
UsingAmine-Reactive
Dyes
9.34.12
Supplement 53 Current Protocols in Cytometry
Table 9.34.4 List of Common Problems and Solutions
Problem Possible cause Solution
Dead cells are dimly fluorescent andappear to separate poorly from thelive cell population
ViViD dye was used at theincorrect concentration
See Basic Protocol 2 for details
Dye not resuspended properly When initially resuspending dye in DMSO,mix well using a pipet
DMSO is contaminated Oxidized DMSO can cause a loss in dyesolubility. Use only DMSO that is part of thekit (stored at −30◦C) or minimize exposed tooxygen.
Free amines competingfor dye
Stain cells only in PBS or medium containing alow concentration of free amines
Poor amine-reactive dyecompensation control. Dim stainingas compared to dead cells stainedwith amine-reactive dye.
Amine-reactive dye notstained according to protocol
Compensation beads must be stained accordingto Basic Protocol 2. Incubation time andconcentration are critical.
Unmatched negative beads Beads used for the stained compensationcontrol (positive) MUST be the same beadsource as the negative
Did not use amine-reactivedye stained beads
Amine-coated beads as described in BasicProtocol 2 are unique for this control.
Used an incorrectamine-reactive dye
Use correct amine-reactive dye to match thedetector configuration.
Poor DUMP compensation control.amine-reactive dye appears not tobe subtracted.
Did not use amine-reactivedye stained beads forcompensation control
When mixing other mAb-conjugates with theamine-reactive dye, only the amine-reactivecompensation control is needed to establish thecompensation matrix.
In some cases, greater intensity of theamine-reactive dye can be seen above back-ground but below expected positive intensity.In these situations, it is important to deter-mine if these cells should be excluded becausethey are dead or to include them because theyare viable. To this end, the immunophenotype,cytokine production, or proliferation of theViViD dim and negative cells may be com-pared. If the ViViD dim population shows asimilar expression profile as the negative cells,then the former should be included in the anal-ysis. For example, we compared three cell pop-ulations sorted from the viability histogram inthe first row of Figure 9.34.7; these include:live CD3+ T cells (ViViD-Low), dim ViViD+CD3+ cells (ViViD-Mid), and ViViD+ CD3+dead cells (ViViD-High). In addition to cellsurface stains, the cells were loaded with theproliferation marker CFSE. The sorted cells(Fig. 9.34.7, second row) were then culturedin the presence of streptococcus enterotoxinB (SEB) for five days using standard culture
procedures. After this incubation, cells wererestained for CD3 (anti-CD3-APC) and OrViD(a second amine-reactive dye) and measuredon the flow cytometer. OrViD positive cellsdied as a result of the 5-day incubation pro-cess and they were excluded from the analysis(Fig. 9.34.7, third row). The sorted popula-tion of cells that was ViViD-Mid progressedthrough as many (or more) rounds of divi-sion as the ViViD negative population (ViViD-Low), suggesting that these cells should be in-cluded in the final analysis (Fig. 9.34.7, fourthrow). Notably, ViViD staining is reduced inproliferating cells, presumably as a result ofdilution of bound dye into the daughter cells.These results suggest that protein expressionis increased for cell populations that are acti-vated in vivo or in vitro, resulting in a slightlyincreased ViViD binding (ViVid Mid) andfluorescence.
For a list of common problems and solu-tions, see Table 9.34.4.

Studies of CellFunction
9.34.13
Current Protocols in Cytometry Supplement 53
CD3 Cy7APC
ViV
iD/C
D14/1
9 P
B
FSC-A
FS
C-H
CD3 Cy7APCV
iViD
/CD
14/1
9 P
BCD45RO QD545
CD
57 Q
D585
FSC-A
SS
C
CMV tetramer APC
CD
8 A
lexa 5
94P
E
FSC-A
SS
C
CD3 Cy7APC
SS
C
CMV tetramer APC
1.57%
0.62%
CD
8 A
lexa 5
94P
E
Figure 9.34.8 An example of gating strategy used to eliminate aberrant binding events due to dead cells that maychange tetramer analysis. This figure shows an example of the utility of using amine-reactive dyes to eliminate erroneousfrequencies due to nonspecific binding of dead cells. In this example, CMV antigen specific CD8+ T cells are measuredin a staining panel containing a specific CMV tetramer reagent. The first row shows a traditional gating strategy. Thegate at the far right indicates that 1.57% of the CD8+ T cells are tetramer positive. However, when including the viabilitygate (second row) the CD8+ tetramer + T cells were determined to be at a lower frequency (0.62%) than reported usingtraditional gating. Overlaying the total CD8+ tetramer + T cells from the first row onto the viability gate (bottom row) showsthat the majority of the cells are in fact ViViD + and hence should not be included in the final analysis. For the color versionof this figure go to http://www.currentprotocols.com/protocol/cy0934.
Anticipated ResultsThe problem of nonspecific binding is par-
ticularly notable when analyzing rare eventswithin cryopreserved samples, since thesesamples are likely to contain significant num-bers of dead cells. When viability markersare not included in these analyses, the fre-quency of the cells of interest can be dra-matically misrepresented because dead cellscan nonspecifically bind reagents. For exam-ple, in Figure 9.34.8, a rare population (CMV-specific CD8+ T cells) was examined in bonemarrow samples. Data was analyzed with andwithout excluding cells in the dump chan-nel, which included antibodies against CD14and CD19 (conjugated to Pacific Blue) andViViD. The top row shows a “traditional”gating strategy (without dump channels) thatmight be used on a six-parameter flow cy-tometer; tetramer+ cells are identified in abivariate plot with CD8 after gating to iden-tify T cells on the basis of CD3 expression.The second row shows a polychromatic gating
strategy to eliminate aberrant binding events.In this analysis, live CD3+ T cells were dis-tinguished from dead cells, monocytes, and Bcells, which could bind tetramer and mAbsnonspecifically. Notably, CD8+ T cells spe-cific for the CMV epitope could be cleanlyidentified with the polychromatic gating strat-egy (second row, right panel, 0.62%), whereastetramer-binding cells are overrepresented inthe top panel (1.57%). Backgating analysisshows that many of these cells are bindingreagents in the dump channel, suggesting thatmuch of the binding is nonspecific (bottompanel; tetramer+ events are shown in blueoverlaid on the total population in a bivariateCD3 versus CD14/CD19/ViViD plot). Thus,it is possible that sample-to-sample variationin viability, or in the frequency of B cellsand monocytes, could have a profound im-pact on the proportion of antigen-specific cellsidentified, thereby skewing study results. Thisdemonstrates very clearly the need for amine-reactive dyes in cell-staining panels.
Dead CellDiscrimination
UsingAmine-Reactive
Dyes
9.34.14
Supplement 53 Current Protocols in Cytometry
Time ConsiderationsThe time needed for cell staining with via-
bility dyes and multicolor antibody conjugatesis typically no more than 30 min. It wouldbe tempting to shorten this procedure by mix-ing the mAb-conjugates with the viability dye;however, this is not recommended because thestaining medium used for antibody stainingoften contains proteins. Moreover, some anti-body preparations typically contain high lev-els of proteins as stabilizers. These proteinsintroduce free amines, which compete withfree amines from the cytosol of dead cells tobind to the amine-reactive dyes. This compe-tition significantly decreases the fluorescenceintensity of the dye, and increases backgroundstaining. Therefore, we recommend prestain-ing cells (resuspended in PBS) with amine-reactive dyes, washing the cell sample, andthen incubating with multicolor antibodies inthe staining medium of choice.
AcknowledgementsThis work was supported by the Intramu-
ral Research Program of the National Instituteof Allergy and Infectious Diseases, NIH; theNational Cancer Institute, NIH, under contractno. HHSN261200800001E.
DisclaimerThe views expressed here are the opinions
of the authors and are not to be consideredas official or reflecting the views or policiesof the Vaccine Research Center/National In-stitutes of Health/Department of Health andHuman Services nor does mention of tradenames, commercial products, or organizationsimply endorsement by the U.S. Government.
Literature CitedChattopadhyay, P.K., Melenhorst, J.J., Ladell,
K., Gostick, E., Scheinberg, P., Barrett, A.J.,Wooldridge, L., Roederer, M., Sewell, A.K., andPrice, D.A. 2008. Techniques to improve the di-rect ex vivo detection of low frequency antigen-specific CD8+ T cells with peptide-majorhistocompatibility complex class I tetramers.Cytometry A 73:1001-1009.
Clarke, R.G. and Pinder, A.C. 1998. Improved de-tection of bacteria by flow cytometry using acombination of antibody and viability markers.J. Appl. Microbiol. 84:577-584.
Costantino, P.J., Budd, D.E., and Gare, N.F. 1995.Enumeration of viable Candida albicans blas-tospores using tetrabromofluorescein (eosin Y)and flow cytometry. Cytometry 19:370-375.
Desrues, B., Collet, B., Rame, M.P., Bourel, D.,Bourguet, P., Martin, A., Delaval, P., Toujas,L., and Dazord, L., 1989. Distribution of ra-
diolabelled monoclonal antibody Po66 afterintravenous injection into nude mice bearinghuman lung cancer grafts. Cancer Immunol.Immunother. 30:295-299.
Lamoreaux, L., Roederer, M., and Koup, R. 2006.Intracellular cytokine optimization and stan-dard operating procedure. Nat. Protoc. 1:1507-1516.
Maecker, H.T., Rinfret, A., D’Souza, P., Darden,J., Roig, E., Landry, C., Hayes, P., Birungi, J.,Anzala, O., Garcia, M., Harari, A., Frank, I.,Baydo, R., Baker, M., Holbrook, J., Ottinger, J.,Lamoreaux, L., Epling, C.L., Sinclair, E., Suni,M.A., Punt, K., Calarota, S., El-Bahi, S., Alter,G., Maila, H., Kuta, E., Cox, J., Gray, C., Altfeld,M., Nougarede, N., Boyer, J., Tussey, L., Tobery,T., Bredt, B., Roederer, M., Koup, R., Maino,V.C., Weinhold, K., Pantaleo, G., Gilmour, J.,Horton, H., and Sekaly, R.P. 2005. Standardiza-tion of cytokine flow cytometry assays. BMCImmunol. 6:13.
Matteucci, C., Grelli, S., De Smaele, E., Fontana,C., and Mastino, A. 1999. Identification ofnuclei from apoptotic, necrotic, and viablelymphoid cells by using multiparameter flowcytometry. Cytometry 35:145-153.
O’Brien, M.C. and Bolton, W.E. 1995. Comparisonof cell viability probes compatible with fixationand permeabilization for combined surface andintracellular staining in flow cytometry. Cytom-etry 19:243-255.
Perfetto, S.P., Ambrozak, D.R., Roederer, M., andKoup, R.A. 2004a. Viable infectious cell sortingin a BSL-3 facility. Methods Mol. Biol. 263:419-424.
Perfetto, S.P., Chattopadhyay, P.K., and Roed-erer, M. 2004b. Seventeen-colour flow cytom-etry: Unravelling the immune system. Nat. Rev.Immunol. 4:648-655.
Perfetto, S., Ambrozak, D., Nguyen, R., Chattopad-hyay, P., and Roederer, M. 2006a. Quality as-surance for polychromatic flow cytometry. Nat.Protoc. 1:1522-1530.
Perfetto, S., Chattopadhyay, P., Lamoreaux, L.,Nguyen, R., Ambrozak, D., Koup, R., and Roed-erer, M. 2006b. Amine reactive dyes: An ef-fective tool to discriminate live and dead cellsin polychromatic flow cytometry. J. Immunol.Meth. 313:199-208.
Riedy, M.C., Muirhead, K.A., Jensen, C.P., andStewart, C.C. 1991. Use of a photolabeling tech-nique to identify nonviable cells in fixed homol-ogous or heterologous cell populations. Cytom-etry 12:133-139.
Schmid, I., Ferbas, J., Uittenbogaart, C.H., andGiorgi, J.V. 1999. Flow cytometric analysis oflive cell proliferation and phenotype in pop-ulations with low viability. Cytometry 35:64-74.
Waters, W.R., Harkins, K.R., and Wannemuehler,M.J. 2002. Five-color flow cytometric analy-sis of swine lymphocytes for detection of pro-liferation, apoptosis, viability, and phenotype.Cytometry 48:146-152.