amino-acid mutations on influenza...
TRANSCRIPT

viruses
Article
Accurate Measurement of the Effects of AllAmino-Acid Mutations on Influenza Hemagglutinin
Michael B. Doud 1,2,3 and Jesse D. Bloom 1,2,*1 Division of Basic Sciences Basic Sciences and Computational Biology Program,
Fred Hutchinson Cancer Research Center, 1100 Fairview Ave N, Seattle, WA 98109, USA;[email protected]
2 Department of Genome Sciences, University of Washington, 3720 15th Ave NE, Seattle,WA 98195-5065, USA
3 Medical Scientist Training Program, University of Washington, Seattle, WA 98109, USA* Correspondence: [email protected]; Tel.: +1-206-667-3622
Academic Editor: Eric O. Freed and Thomas KlimkaitReceived: 23 April 2016; Accepted: 25 May 2016; Published: 3 June 2016
Abstract: Influenza genes evolve mostly via point mutations, and so knowing the effect of everyamino-acid mutation provides information about evolutionary paths available to the virus. We andothers have combined high-throughput mutagenesis with deep sequencing to estimate the effectsof large numbers of mutations to influenza genes. However, these measurements have sufferedfrom substantial experimental noise due to a variety of technical problems, the most prominent ofwhich is bottlenecking during the generation of mutant viruses from plasmids. Here we describeadvances that ameliorate these problems, enabling us to measure with greatly improved accuracyand reproducibility the effects of all amino-acid mutations to an H1 influenza hemagglutinin onviral replication in cell culture. The largest improvements come from using a helper virus toreduce bottlenecks when generating viruses from plasmids. Our measurements confirm at muchhigher resolution the results of previous studies suggesting that antigenic sites on the globularhead of hemagglutinin are highly tolerant of mutations. We also show that other regions ofhemagglutinin—including the stalk epitopes targeted by broadly neutralizing antibodies—have amuch lower inherent capacity to tolerate point mutations. The ability to accurately measure theeffects of all influenza mutations should enhance efforts to understand and predict viral evolution.
Keywords: influenza; hemagglutinin; mutational tolerance; deep mutational scanning; evolution
1. Introduction
Seasonal influenza is a recurrent threat to human health, largely because it rapidly accumulatesamino-acid mutations in proteins targeted by the immune system [1]. Measuring the functionalimpact of every possible amino-acid mutation to influenza can therefore provide useful informationabout which evolutionary paths are accessible to the virus. Such measurements are now possibleusing deep mutational scanning [2,3]. When applied to influenza, this technique involves creating allcodon mutants of a viral gene, incorporating these mutant genes into viruses that are subjected to afunctional selection, and estimating the functional impact of each mutation by using deep sequencingto quantify its frequency pre- and post-selection. We and others have used deep mutational scanningto estimate the effects of all amino-acid [4–6] or nucleotide [7,8] mutations to several influenza genes,and Heaton and coworkers [9] have used a similar approach to examine influenza’s tolerance to shortinsertions. However, these studies suffered from substantial noise that degrades the utility of theirresults. For instance, in every study that reported the results for independent experimental replicates,the replicate-to-replicate correlation was mediocre.
Viruses 2016, 8, 155; doi:10.3390/v8060155 www.mdpi.com/journal/viruses

Viruses 2016, 8, 155 2 of 17
This experimental noise arises primarily from bottlenecking of mutant diversity during thegeneration of viruses from plasmids. The influenza genome consists of eight negative-sense RNAsegments. During viral infection, gene expression from these segments is a highly regulatedprocess [10–12]. Generating influenza from plasmids involves co-transfecting mammalian cells withmultiple plasmids that must yield all eight viral gene segments and at least four viral proteins ata stoichiometry that leads to assembly of infectious virions [13–15]. This plasmid-driven processis understandably less efficient than viral infection. A small fraction of transfected cells probablyyield most initial viruses, which are then amplified by secondary infection. This bottleneckingseverely hampers experiments that require creating a diverse library of viruses from an initial libraryof plasmids.
Several strategies have been used to overcome problems associated with bottlenecks duringthe generation of influenza from plasmids. One strategy is to generate and titer each viral variantindividually, and then mix them [16,17]. A second strategy is to reduce the impact of bottlenecksby shrinking the complexity of the libraries, such as by only mutating a small portion of a viralgene [18,19]. Neither of these strategies scale effectively to the deep mutational scanning of full-lengthproteins, since there are ∼104 unique amino-acid mutants of a 500-residue protein.
To overcome these limitations, we have developed a novel approach that uses a “helper virus”to generate virus libraries without strong bottlenecking. We have combined this approach with othertechnical improvements to perform deep mutational scanning of all amino-acid mutations to an H1hemagglutinin (HA) with much higher accuracy and reproducibility than existing deep mutationalscans of influenza genes. We use phylogenetic analyses to show that our measurements accuratelyreflect constraints on HA evolution in nature. We confirm that antigenic sites in the globular headof HA are highly tolerant of mutations, and identify other regions of the protein that are moreconstrained. These advances improve our understanding of HA’s inherent evolutionary capacityand can help inform evolutionary modeling and guide the development of vaccines targeting siteswith a limited capacity for mutational escape.
2. Results
2.1. A Helper-Virus Enables Efficient Production of Mutant Virus Libraries from Plasmids
We reasoned that the process of generating viral libraries carrying HA mutants would be moreefficient if transfected cells only needed to produce HA from plasmid, and the other gene segmentsand proteins were delivered by viral infection (Figure 1A). The Palese lab has previously shownthat a seven-segmented HA-deficient virus can be propagated in cells that constitutively express HAprotein [20]. We created HA-expressing cells and validated that we could propagate an HA-deficientA/WSN/1933 (H1N1) virus (Figure S1).
We cloned triplicate plasmid libraries of random codon mutants of the A/WSN/1933 HAgene. These libraries contain multi-nucleotide (e.g., GGC→CAT) as well as single-nucleotide(e.g., GGC→GAC) codon mutations. There are 63 × 565 ≈ 3.5 × 10⁴ different codon mutations thatcan be made to the 565-codon HA gene, corresponding to 19× 565 ≈ 104 amino-acid mutations. Thedeep sequencing described below found at least three occurrences of over 97% of these amino-acidmutations in each of the three replicate plasmid mutant libraries. These libraries have a somewhatlower mutation rate than our previous deep mutational scan of hemagglutinin [4], with the numberof mutations per clone following a roughly Poisson distribution with a mean of about one (FigureS2). We cloned these HA libraries into both uni-directional and bi-directional reverse-geneticsplasmids [13,14].
We then transfected cells with one of the HA plasmid mutant libraries along withplasmids expressing the four viral polymerase-related proteins (PB2, PB1, PA, and NP) withthe goal of generating pre-formed viral ribonucleoprotein complexes carrying the HA segment.These transfected cells were then infected with the HA-deficient helper virus, and 24 h
Viruses 2016, 8, 155 3 of 17
later, we determined the titer of fully competent virus in the supernatant. The highest titers(∼103 TCID50 per µL) were obtained using the uni-directional reverse-genetics plasmid (Figure S3).The reason that we co-transfected protein expression plasmids for the four polymerase-relatedproteins was to create pre-formed viral ribonucleoprotein complexes. Virus titers were ∼100-foldlower when the polymerase plasmids were not co-transfected (data not shown). Overall, thesefindings demonstrate the feasibility of the helper-virus strategy in Figure 1A.
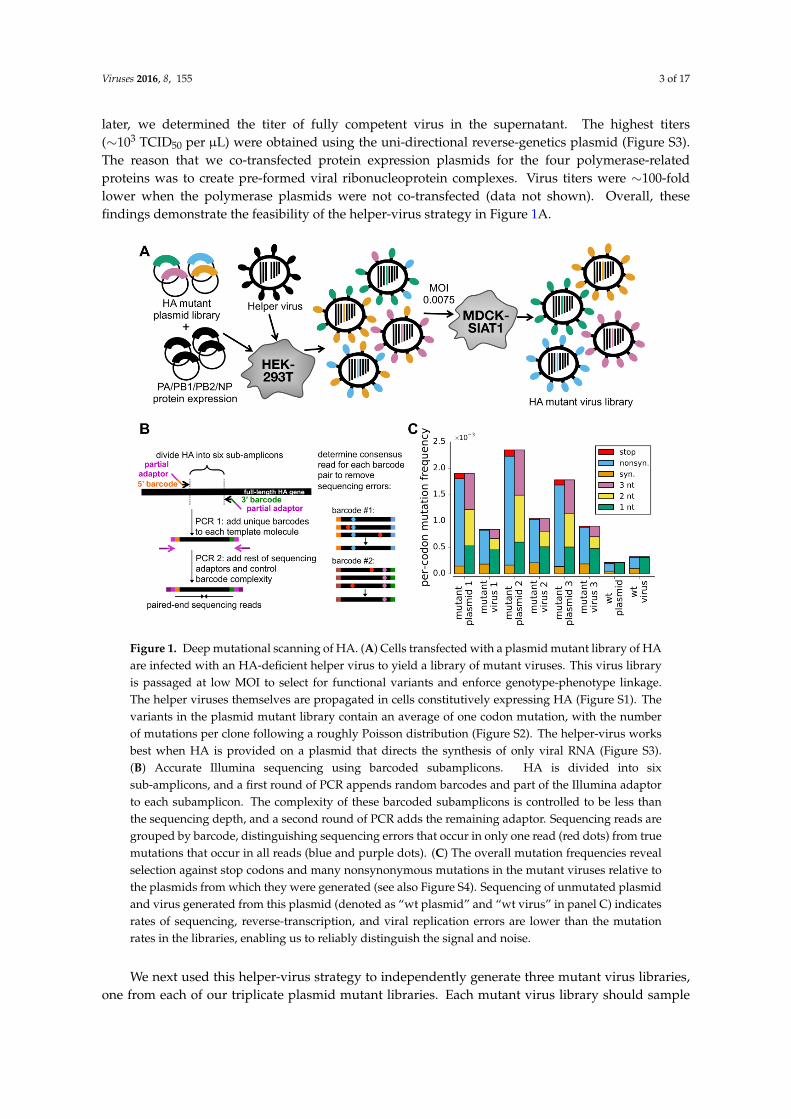
Figure 1. Deep mutational scanning of HA. (A) Cells transfected with a plasmid mutant library of HAare infected with an HA-deficient helper virus to yield a library of mutant viruses. This virus libraryis passaged at low MOI to select for functional variants and enforce genotype-phenotype linkage.The helper viruses themselves are propagated in cells constitutively expressing HA (Figure S1). Thevariants in the plasmid mutant library contain an average of one codon mutation, with the numberof mutations per clone following a roughly Poisson distribution (Figure S2). The helper-virus worksbest when HA is provided on a plasmid that directs the synthesis of only viral RNA (Figure S3).(B) Accurate Illumina sequencing using barcoded subamplicons. HA is divided into sixsub-amplicons, and a first round of PCR appends random barcodes and part of the Illumina adaptorto each subamplicon. The complexity of these barcoded subamplicons is controlled to be less thanthe sequencing depth, and a second round of PCR adds the remaining adaptor. Sequencing reads aregrouped by barcode, distinguishing sequencing errors that occur in only one read (red dots) from truemutations that occur in all reads (blue and purple dots). (C) The overall mutation frequencies revealselection against stop codons and many nonsynonymous mutations in the mutant viruses relative tothe plasmids from which they were generated (see also Figure S4). Sequencing of unmutated plasmidand virus generated from this plasmid (denoted as “wt plasmid” and “wt virus” in panel C) indicatesrates of sequencing, reverse-transcription, and viral replication errors are lower than the mutationrates in the libraries, enabling us to reliably distinguish the signal and noise.
We next used this helper-virus strategy to independently generate three mutant virus libraries,one from each of our triplicate plasmid mutant libraries. Each mutant virus library should sample

Viruses 2016, 8, 155 4 of 17
most of the codon mutations to the A/WSN/1933 HA. We also generated a control virus library froma plasmid encoding the unmutated wild-type HA gene.
2.2. Low MOI Passage Combined with Barcoded-Subamplicon Sequencing Reveals Strong Selection againstNon-Functional HA Variants
To select for viruses carrying functional HA variants, we passaged the mutant virus libraries ata low multiplicity of infection (MOI) of 0.0075 TCID50 per cell as outlined in Figure 1A. This MOIis substantially lower than the MOI of 0.1 that we used in our previous study to examine the effectsof all mutations to HA [4], and was chosen with the goal of more effectively purging non-functionalHA variants.
To quantify selection on HA, we needed our deep sequencing to be sufficiently accurate todetermine the frequency of each mutation pre- and post-selection. Standard Illumina sequencinghas an error rate that is too high. In our previous deep mutational scanning of influenza [4–6],we reduced this error rate by using overlapping paired-end reads. Here, we used an alternativeerror-correction strategy that involves attaching random barcodes to PCR subamplicons and thenclustering reads with the same barcode (Figure 1B). To our knowledge, this basic strategy was firstdescribed by Hiatt et al. [21] and first applied to influenza by Wu et al. [7]. Sequencing of theunmutated plasmid allows us to estimate that the error rate is∼2× 10⁻⁴ per codon, corresponding to<10−4 per nucleotide (Figure 1C, sample referred to as “wt plasmid”). This error rate is substantiallylower than we obtained previously using overlapping paired-end reads, consistent with the resultsof the sequencing-strategy comparison by Zhang et al. [22]. Sequencing of viruses generated fromthe unmutated plasmid shows that the error rates associated with reverse-transcription and viralreplication are also tolerably low (below the mutation rate in the mutant libraries) (Figure 1C, samplereferred to as “wt virus”).
Figure 1C reveals strong selection against non-functional HA variants. The plasmid mutantlibraries contain a mix of synonymous, nonsynonymous, and stop-codon mutations. However,stop-codon mutations are almost completely purged from the passaged mutant virus libraries, as aremany nonsynonymous mutations. The selection against the stop codons is stronger than in ourprevious deep mutational scan [4] (Figure S4). Overall, these results indicate strong selection onHA that can be quantified by accurate deep sequencing.
2.3. The Mutant Virus Libraries Have Reduced Bottlenecking and Yield Reproducible Measurements ofMutational Effects
To evaluate whether the virus libraries were bottlenecked, we examined the distributionof synonymous mutation frequencies in each library. If bottlenecking causes a few mutantsto stochastically dominate, we expect that in each library a few sites will have relatively highsynonymous mutation frequencies and that these sites will differ among replicates. Figure 2A showsnormalized synonymous mutation frequencies across HA for each of the three replicate mutant viruslibraries from both our previous deep mutational scan of HA that utilized reverse genetics [4], and thecurrent study utilizing helper viruses. In the older study, each replicate had a different handful of siteswith greatly elevated synonymous frequencies (green arrows), indicative of stochastic bottlenecking.In contrast, in our new virus libraries, the distribution of synonymous mutation frequencies is muchmore uniform across the HA gene. Specifically, the standard deviation of normalized synonymousfrequencies was 1.63 ± 0.14 for the old libraries, but only 1.18 ± 0.05 for the new libraries, indicatingless bottlenecking-induced variation in mutation frequencies in the new libraries.

Viruses 2016, 8, 155 5 of 17
Figure 2. The use of helper viruses increases reproducibility due to reduced bottlenecking during thegeneration of the mutant virus libraries. (A) Each row shows the synonymous mutation frequency forevery site normalized to the total synonymous frequency for that sample. If synonymous mutationsare sampled uniformly, the data should resemble the black line in the top row (the line is notcompletely straight because different codons have different numbers of synonymous variants). Thenext six rows show the synonymous mutation frequencies for each replicate of the old (red lines) [4]and new (blue lines) experiments. To assist in comparing the locations and heights of peaks across allsamples, the data for each replicate are shown as a thick line in front of thin lines representing the otherfive replicates. The old experiments have more bottlenecking as manifested by taller peaks indicatingsynonymous mutations that were stochastically enriched in each replicate (examples marked bygreen arrows). The differences between replicates are not due to differences in synonymous mutationfrequencies in the plasmid libraries used to generate the viruses (Figure S5). (B) The mutational effectsmeasured in the new experiments are much more reproducible across replicates. Each plot shows thesquared Pearson correlation coefficient for all site-specific amino-acid preferences measured in a pairof independent experimental replicates.
We next evaluated the reproducibility of our measurements of the effects of each amino-acidmutation. We estimated the effect of each mutation from its change in frequency in themutant viruses relative to the original plasmid libraries, correcting for the site-specific error ratesdetermined by sequencing unmutated virus and plasmid, and performing the analyses using the

Viruses 2016, 8, 155 6 of 17
algorithms described in [23] and implemented in the dms_tools software (version 1.1.12, available athttp://jbloomlab.github.io/dms_tools/). The results are quantified in terms of the preference of eachsite for each amino-acid; the set of all 20 preferences at a site can be thought of as representing theexpected post-selection frequency of each amino acid at that site if all amino acids are initially presentat equal frequencies.
Figure 2B shows the correlation between the amino-acid preferences from each experimentalreplicate. The replicate-to-replicate reproducibility is dramatically improved in our new experimentsrelative to our previous work utilizing reverse genetics [4], with the average Pearson’s R2 increasingfrom 0.34 to 0.61. The new experiments are also largely free of the most problematic type of noise thatplagued the previous study, where an amino acid at a site is deemed highly preferred in one replicatebut disfavored in another. Overall, these results demonstrate that our new strategies enable morereproducible measurement of the effects of all mutations to HA.
2.4. The Measurements Better Reflect the Constraints on HA Evolution in Nature
We next tested whether our new measurements better describe the evolution of HA innature. The accuracy with which experimental measurements of site-specific amino-acid preferencesreflect the constraints shaping a protein’s evolution in nature can be quantified by comparingthe phylogenetic fit of experimentally informed substitution models [5]. We assembled a setof human and swine influenza HA sequences and fit substitution models using phydms [24](version 1.1.1, available at http://jbloomlab.github.io/phydms/), which in turn uses Bio++ [25] forthe likelihood calculations.
A substitution model informed by our new measurements described the natural evolution ofHA better than a model informed by our older measurements from [4], and vastly better thanconventional non-site-specific substitution models (Table 1). Averaging the measurements from bothstudies improved phylogenetic fit even further, a finding consistent with previous work reportingthat combining data from multiple deep mutational scanning studies of the same protein tends toimprove substitution models [6].
Table 1. The site-specific amino-acid preferences measured in the new experiments offer an improveddescription of HA evolution in nature. Aikake information criterion (AIC) [26] was used comparethe maximum likelihood phylogenetic fit of several models to an alignment of seasonal humanH1N1 and classical swine H1N1 HAs. The experimentally informed substitution models are ofthe form described in [24] with the data from the average of all three replicates of the new or oldexperiments, or the average of the two. These models are compared to the variants of the substitutionmodel of Goldman et al. [27] denoted as M0 and M8 in Yang et al. [28] with the equilibrium codonfrequencies estimated empirically using the F3X4 method. The best model is the one that combines allexperimental data, but a model informed by the new experiments alone is better than one informed bythe old experiments alone. To confirm that the experimentally informed models are superior becausethey are site specific, we fit a control model in which the experimental data is averaged across sites.The tree topology was fixed to that inferred by maximum likelihood using the M0 version of theGoldman–Yang model. The free parameters for each model were then optimized along with thebranch lengths; optimized parameters are in the last column.
Model ∆AIC Log Likelihood Parameters (Optimized + Empirical): Optimized Values
new data + old data 0.0 −14933.5 6 (6 + 0): β = 1.82, ω = 0.51, κ = 4.95, φA = 0.40, φC = 0.18, φG = 0.20new data 197.6 −15032.3 6 (6 + 0): β = 1.80, ω = 0.46, κ = 5.06, φA = 0.40, φC = 0.18, φG = 0.20old data 341.2 −15104.1 6 (6 + 0): β = 1.40, ω = 0.46, κ = 4.90, φA = 0.39, φC = 0.18, φG = 0.20
Goldman–Yang M8 2156.8 −16003.9 14 (5 + 9): pω>1 = 0.01, ω>1 = 1.91, pβ = 0.02, qβ = 0.76, κ = 4.94
new data + old data, 2971.6 −16419.3 6 (6 + 0): β = 0.50, ω = 0.20, κ = 5.38, φA = 0.38, φC = 0.18, φG = 0.21averaged across sites
Goldman–Yang M0 2980.8 −16418.9 11 (2 + 9): ω = 0.19, κ = 4.88

Viruses 2016, 8, 155 7 of 17
The phylogenetic model fitting optimizes a parameter that accounts for differences in thestringency of selection between the experiments and natural evolution [29]; a stringency parameter>1 indicates that natural selection prefers the same amino acids as the experimental selections butwith greater strength. The best model in Table 1 has a stringency parameter of 1.8. The site-specificamino-acid preferences for this model scaled by this stringency parameter are displayed in Figure 3;text files with unscaled and scaled numerical values are in File S2 and File S3.
Figure 3. HA’s site-specific amino-acid preferences. The preference of each site in HA for each ofthe 20 amino-acids as inferred by combining the new and old data and re-scaling by the stringencyparameter inferred in Table 1. The height of each letter is proportional to the preference for thatamino acid at that site. The overlay bars show each residue’s secondary structure, relative solventaccessibility, and wildtype identity in the A/WSN/1933 HA. Amino acids are colored accordingto hydrophobicity using a blue-to-red-to-green scale (most hydrophobic is blue, most hydrophilicis green). The sequence is numbered using the H3 numbering scheme. Conversion between WSNsequential numbering and H3 numbering is provided in File S6.

Viruses 2016, 8, 155 8 of 17
2.5. A Handful of Sites Are under Very Different Selection in Our Experiments Than in Nature
We next asked whether there are sites in HA that evolve in nature in a way that is highlydiscordant with our experimental measurements. To do this, we again used phydms [24] to identifyselection in nature for amino acids that differ from the ones preferred in the deep mutationalscanning, again using natural sequences from seasonal human H1N1 and classical swine H1N1 HAs.Briefly, this program uses a maximum-likelihood phylogenetics approach to estimate the differencein preference for each amino acid at each site between the experimental measurements and selectionin nature (see [24] for details). Figure 4 shows the difference in amino-acid preferences between ourexperiments and natural evolution for each site in HA. At most sites, the magnitude of differentialselection is small, indicating that the experimentally measured preferences mostly parallel constraintson natural evolution. Sites that are under strong differential selection usually show conservativechanges; for example, site 70 (H3 numbering) prefers isoleucine in nature but leucine in our deepmutational scanning.
Figure 4. Differential selection between our selection in the lab and HA’s evolution in nature. Theapproach in [24] was used to determine the magnitude of differential selection between the deepmutational scanning and the natural evolution of human seasonal H1N1 and classical swine H1N1HAs. At each site, the height of a letter above or below the center line indicates that differentialselection for or against that amino acid in nature as compared to our experiments. At most sites,the differential selection is very small, showing that the experimental measurements are mostlyconcordant with natural selection on HA. However, a few sites are under very different selection innature as compared to our experiments. The sequence is numbered using the H3 numbering scheme.Amino acids are colored by hydrophobicity as in Figure 3. Conversion between WSN sequentialnumbering and H3 numbering is provided in File S6.

Viruses 2016, 8, 155 9 of 17
One of the most striking exceptions to this general concordance between natural selection andour experiments can be given a clear explanation. At site 327A (H3 numbering), the experimentallymeasured preference for tyrosine is at odds with nature’s strong preference for serine (Figure 4).The lab-adapted A/WSN/1933 strain used in our experiments differs from naturally occurringinfluenza in that it uses plasmin to cleave and activate HA [30,31]. Plasmin cleavage is enhancedby tyrosine at this site [32], so it is unsurprising that our experiments detected a preference at thissite unique to the influenza strain we used. This example illustrates how the occasional deviationsfrom the general concordance between deep mutational scanning experiments and natural selectioncan point to interesting biological mechanisms.
2.6. Antigenic Sites in HA’s Globular Head Are Highly Tolerant of Mutations, but Stalk Epitopes Targeted byBroadly Neutralizing Antibodies Are Not
We computed the inherent mutational tolerance of each site using the stringency-scaledamino-acid preferences from the combined datasets (Figure 5A). The mutational tolerance is mappedonto the structure of HA in Figure 5B.
Figure 5. Antigenic sites in HA’s globular head have a high inherent tolerance for mutations, butHA’s stalk is relatively intolerant of mutations. (A) Mutational tolerance is calculated as the Shannonentropy of a site’s amino-acid preferences. (B) Mutational tolerance mapped onto the HA trimer(yellow indicates low tolerance, red indicates high tolerance, blue sticks show the sialic-acid receptor).(C,D) The antigenic sites defined by Caton et al. [33] have high mutational tolerance, as do the residuescontacting these sites. (E) Conserved receptor-binding residues have low mutational tolerance.(F) Sites that contribute to antigenic cluster jumps [34]. (G) Sites in the footprints of four broadlyneutralizing antibodies have low mutational tolerance. Shown are footprints of F10, CR6261, FI6v3,and CR9114 [35–38]. For panels B-G, tolerance is mapped onto PDB structure 1RVX [39]. For panelsC-G, each monomer is shown in a different shade of gray. Figure S6 reports statistical analyses ofwhether subsets of sites have higher or lower tolerance than expected given their solvent accessibility.Figure S7 shows the tolerance of the different domains of HA.

Viruses 2016, 8, 155 10 of 17
The H1 HA antigenic sites defined by Caton et al. [33] are significantly more mutationally tolerantthan the average site (Figure 5C), even after accounting for relative solvent accessibility (Figure S6A).This high mutational tolerance extends to other solvent-exposed residues in contact with the antigenicsites (Figure 5D, Figure S6B), indicating that the HA molecular surfaces commonly targeted byantibodies have a high inherent capacity for evolutionary change. This high mutational tolerancedoes not extend to the receptor-binding pocket (Figure 5E, Figure S6C,D) but may be a feature ofthe sites that make the greatest contributions to the punctuated antigenic evolution of H3N2 andseasonal H1N1 HA [34] (Figure 5F), albeit not at a level that is statistically significant after correctingfor solvent accessibility (Figure S6E). These results support the findings of our previous study [4] thatthe sites in HA that are the immunodominant targets of antibodies have a high inherent capacity totolerate mutations.
Perhaps in part because of the high mutational tolerance of the antigenic sites in its globularhead, HA is adept at escaping antibody-mediated immunity [1,40]. New vaccines are beingdeveloped that aim to elicit immunity against other portions of HA [41], most commonly regionsin the stalk that are relatively conserved among naturally occurring strains. An important question iswhether these stalk regions are conserved because they are inherently intolerant of point mutations,or simply because they are not currently under immune pressure. To answer this question,we examined the inherent mutational tolerance of the largely overlapping epitopes of four broadlyneutralizing anti-stalk antibodies: F10 [35], CR6261 [36], FI6v3 [37], and CR9114 [38]. Visualinspection of Figure 5G shows that these stalk epitopes have a low mutational tolerance, a result thatis confirmed by statistical analysis (Figure S6F). Therefore, the epitopes that next-generation vaccinesaim to target indeed have a reduced capacity for immune escape by point mutations. This finding isalso consistent with Heaton et al.’s report that HA’s stalk is intolerant to insertions [9].
We wondered if some of HA’s variation in mutational tolerance is explained by differencesin the three ancient domains that compose the protein. HA is the product of a series of ancientinsertions that merged a fusion domain, a receptor-binding domain (which contains the majority ofthe antigenic sites as well as the receptor-binding pocket itself), and a vestigial esterase domain [42].We compared the inherent mutational tolerance of these three domains, again correcting for solventaccessibility. We found that sites in the receptor-binding domain on average have a significantlyhigher mutational tolerance than all sites in the protein, although sites in the receptor-binding pocketitself are often highly constrained (Figure 5, Figure S7). On the other hand, sites in the fusion domainhave a significantly lower mutational tolerance than all sites (Figure S7). This enriched toleranceto point mutations throughout the receptor-binding domain is also concordant with the results ofHeaton et al., showing that the receptor-binding domain is uniquely tolerant to short insertions [9].Therefore, HA’s antigenic evolvability is not just a consequence of the immunodominant antigenicsites themselves having high mutational tolerance, but also because these sites are found within aprotein domain that is intrinsically more mutable than the rest of HA.
3. Discussion
We have described new techniques that greatly improve the reproducibility of deep mutationalscanning of influenza. The largest improvement appears to result from using a helper virus togenerate virus mutant libraries without the bottlenecks that plague the creation of viruses purely fromplasmids. We have used these techniques to more accurately measure the effects of all amino-acidmutations to HA. Our measurements confirm at greater precision and resolution the finding [4,9] thatHA’s propensity for immune escape is underpinned by the high inherent mutational tolerance of theimmunodominant receptor-binding domain. Our data also show that some regions of HA—includingthe stalk epitopes targeted by new broadly neutralizing antibodies— have a reduced capacity forevolutionary change.
In this study, we measured the effects of all mutations to the HA from a lab-adapted H1N1 strain.To what extent can these measurements be extrapolated to other HAs? Due to epistasis, the effects
Viruses 2016, 8, 155 11 of 17
of mutations sometimes change as proteins evolve [43,44]. However, many aspects of mutationaleffects are often roughly conserved during evolutionary divergence: for instance, experiments haveshown that the effects of mutations on stability are often quite similar among homologs, both forHA [45] and proteins more generally [46,47]. In a previous study, we used deep mutational scanningto estimate the effects of all mutations to two close homologs of influenza nucleoprotein, and foundthat only a few sites exhibited large qualitative changes in their amino-acid preferences [6]. Therefore,the limited existing experimental work on this topic suggests that site-specific amino-acid preferenceswill often be broadly similar among homologs of the same protein, but that there will also be someshifts that can have important implications for evolution. However, further systematic investigationof this question is needed to assess the extent that deep mutational scanning studies like the onereported here can be extrapolated across protein homologs.
Overall, our work demonstrates a method for making accurate large-scale measurementsof the effects of mutations to influenza proteins. Our results offer insight into howprotein-intrinsic mutational tolerance shapes influenza evolution, and provide a basis for usingdeep mutational scanning to improve quantitative models of viral evolution and understandvirus-immune interactions.
4. Materials and Methods
4.1. Growth of HA-Deficient Helper Virus in HA-Expressing Cells
MDCK-SIAT1 cells (Sigma, 05071502) were engineered to constitutively express the HA proteinof A/WSN/1933 (H1N1) under control of the EF1a promoter by lentiviral transduction. These newlycreated cells will be referred to as MDCK-SIAT1-EF1a-WSN-HA cells since they are MDCK-SIAT1cells that we have engineered to express the WSN HA under an EF1a promoter. HA surfaceexpression was validated by flow cytometry (Figure S1).
To generate HA-deficient helper viruses, we seeded co-cultures of 293T cells (obtained fromthe ATCC, number CRL-3216; seeded at 5 × 10⁵ cells per well) and MDCK-SIAT1-EF1a-WSN-HAcells (5 × 10⁴ cells cells per well) in 6-well dishes in D10 media (DMEM supplemented with10% heat-inactivated FBS, 2 mM L-glutamine, 100 U of penicillin/mL, and 100 µg ofstreptomycin/mL). After 24 h, we transfected these co-cultures with bidirectional reverse-geneticsplasmids for the seven non-HA segments of the A/WSN/1933 virus (pHW181-PB2, pHW182-PB1,pHW183-PA, pHW185-NP, pHW186-NA, pHW187-M, and pHW188-NS) [13] plus a proteinexpression plasmid for WSN HA (pHAGE2-CMV-WSNHA, which importantly does not containnon-coding regions of the HA segment or a promoter for the transcription of negative-sense viralRNA). Transfection was performed with BioT transfection reagent (Bioland B01-02, Paramount, CA,USA) with each well receiving 250 ng of each plasmid. Twenty-two hours after transfection, wechanged the media to WSN growth media (Opti-MEM supplemented with 0.5% heat-inactivated FBS,0.3% BSA, 100 U of penicillin/mL, 100 µg of streptomycin/mL, and 100 µg of calcium chloride/mL).At 96 h post-transfection, we passed 400 µL of the transfection supernatant into 15-cm dishescontaining 4 × 10⁶ MDCK-SIAT1 cells (as a negative control) or MDCK-SIAT1-EF1a-WSN-HA cellsin WSN growth media. HA-deficient helper virus could only be propagated in the HA-expressingcells as expected (Figure S1). We collected the expanded helper virus from these cells after 68 h,aliquoted, and froze aliquots at −80 ◦C. We titered the helper virus in MDCK-SIAT1-EF1a-WSN-HAcells by TCID50. We obtained titers between 103 and 104 TCID50 per µL when titering inMDCK-SIAT1-EF1a-WSN-HA cells, and no cytopathic effect except with extremely concentratedhelper virus in MDCK-SIAT1 cells (Figure S1).
4.2. HA Plasmid Mutant Libraries
Codon mutagenesis was performed as described in [4] except that we performed one overallround of the PCR mutagenesis to yield a lower mutation rate (Figure S2). Ligation and eletroporation

Viruses 2016, 8, 155 12 of 17
were also performed as in [4], except that we cloned the inserts into both pHW2000 [13] andpHH21 [14] plasmid backbones. All steps were performed in triplicate. For each replicate, we pooledover 3 million transformants, cultured in LB for 3 h in shaking flasks at 37 ◦C, and maxi-preppedplasmid libraries.
4.3. Generation of Mutant HA Virus Libraries from Mutant Plasmids and Helper Viruses
To generate mutant virus libraries, we transfected 293T cells with a DNA mixture containingone of the three pHH21-MutantHA libraries (or the wild-type pHH21-WSN-HA control) andprotein expression plasmids for the four proteins that compose the ribonucleoprotein complex,using plasmids HDM-Nan95-PA, HDM-Nan95-PB1, HDM-Nan95-PB2, and HDM-Aichi68-NP [43].Specifically, we plated 293T cells in D10 at a density of 8 × 10⁵ per well in 6-well plates, changedthe media to fresh D10 after 16 h, and then four hours later transfected cells with 500 ng of theHA reverse-genetics plasmid plus 375 ng of each of the PA, PB1, PB2, and NP plasmids using BioT.Twenty-four hours after transfection, we infected the cells with HA-deficient helper virus by makingan inoculum of 1.3× 10³ TCID50 per µL in WSN growth media, aspirating the D10 media from thecells, and adding 2 mL of inoculum to each well. After 3 h, we removed the inoculum by aspirationand added 2 mL of WSN growth media supplemented with 5% D10. Twenty-four hours after helpervirus infection, we collected the supernatants for each replicate, stored aliquots at−80 ◦C, and titeredin MDCK-SIAT1 cells. Of note, we found that helper viruses that had been passaged more than oncein MDCK-SIAT1-EF1a-WSN-HA cells tended to become less effective at rescuing fully replicationcompetent viruses following infection of transfected cells, so we exclusively used single-passagehelper virus in these experiments.
We passaged these transfection supernatants to create a genotype-phenotype link and imposefunctional selection on HA. We passaged over 9× 10⁵ TCID50 at an MOI of 0.0075 TCID50 per cell.Specifically, for each library, we plated ten 15-cm dishes with 6× 10⁶ MDCK-SIAT1 cells per dish andallowed cells to grow for 20 h, at which point they had reached a density ∼ 1.25× 10⁷ cells per dish.We then replaced the media in each dish with 25 mL of WSN growth media in each dish containing3.7 TCID50 of virus per µL. We allowed virus replication to proceed for 40 h before collecting virusesfrom the supernatant for sequencing.
4.4. Barcoded Subamplicon Sequencing
For each of the three replicate HA virus libraries and the wild-type HA virus, we extracted viralRNA by ultracentrifuging 24 mL of supernatant at 22,000 rpm in a Beckman Coulter SW28 rotor.RNA was extracted using the Qiagen RNeasy kit by resuspending the viral pellet in 400 µL bufferof Qiagen RLT freshly supplemented with β-mercaptoethanol, pipetting 30 times, transferring to anRNase-free microcentrifugefuge tube, adding 600 µL freshly-made 70% ethanol, and continuing withthe manufacturer’s recommended protocol, eluting the final RNA product in 40 µL of RNase-freewater. HA was then reverse transcribed using AccuScript Reverse Transcriptase (Agilent 200820) withthe primers WSNHA-For (5’-AGCAAAAGCAGGGGAAAATAAAAACAAC-3’) and WSNHA-Rev(5’-AGTAGAAACAAGGGTGTTTTTCCTTATATTTCTG-3’).
We generated PCR amplicons of HA for each of the eight samples (three replicate plasmid DNAlibraries, three corresponding virus libraries, one wild-type plasmid DNA, and one wild-type virus)using KOD Hot Start Master Mix (71842, EMD Millipore) with the PCR reaction mixture and cyclingconditions described in [5] and the primers WSNHA-For and WSNHA-Rev. The templates for thesereactions were 2 µL of cDNA (for the virus-derived samples) or 2 µL of plasmid DNA at 10 ng/µL.To ensure that the number of molecules used as template did not bottleneck diversity, parallel PCRreactions were run with a standard curve of template molecules, and all products were analyzed byband intensity after agarose gel electrophoresis; all samples used ≥106 molecules as a template forPCR. We purified these PCR amplicons using Agencourt AMPure XP beads (bead-to-sample ratio 0.9)(Beckman Coulter).

Viruses 2016, 8, 155 13 of 17
These PCR amplicons were quantified using Quant-iT PicoGreen dsDNA Assay Kit(Life Technologies) and used as the templates for the barcoded-subamplicon sequencing in Figure 1B.We performed the first round of PCR (“PCR 1”) in six parallel reactions (one for each of the six HAsubamplicons) for each of the eight samples. Each reaction contained 12 µL 2X KOD Hot Start MasterMix, 2 µL forward primer diluted to 5 µM, 2 µL reverse primer diluted to 5 µM, and 8 µL purifiedamplicon diluted to 0.5 ng/µL (primer sequences for PCR 1 and PCR 2 are provided in File S5).In addition to containing sequences targeting regions in HA, the forward and reverse primers forPCR 1 each contain an 8-base degenerate barcode and partial Illumina sequencing adaptors. To limitthe generation of PCR artifacts, we performed only 9 cycles of PCR for PCR 1 using the followingprogram: 1. 95 ◦C for 2:00; 2. 95 ◦C for 0:20; 3. 70 ◦C for 0:01; 4. 54 ◦C for 0:20; 5. 70 ◦C for 0:20;6. Go to 2 (8 times); 7. 95 ◦C for 1:00; and 8. 4 ◦C hold. The denaturation step after cycling ensures thatidentical barcode pairs are not annealed at the end, so that most double-stranded molecules enteringPCR 2 will contain two unique barcoded mutants. PCR 1 products were purified by Ampure XP(bead-to-sample ratio 1.0), quantified with Quant-iT PicoGreen, and diluted to 0.5 ng/µL.
We then mixed all six subamplicons from each experimental sample at equal concentrations anddiluted these subamplicon pools such that the number of template molecules used in PCR 2 was lessthan the anticipated sequencing depth to ensure multiple reads per barcode. Specifically, we reducedthe total amount of DNA for each experimental sample used as template in PCR 2 to 9.24× 10⁻⁴ ng,which corresponds to 1.54× 10⁻⁴ ng of each of the six subamplicons, corresponding to approximately3.5× 105 double-stranded DNA molecules (or 7× 10⁵ uniquely-barcoded single-stranded variants)per subamplicon per sample.
We performed PCR 2 for each sample with the following reaction conditions: 20 uL 2X KODHot Start Master Mix, 4 µL forward primer UniversalRnd2 for diluted to 5 µM, 4 µL reverse primerindexXXRnd2rev diluted to 5 µM (a different index for each experimental sample), and 9.24× 10⁻⁴ ngof the subamplicon pool of PCR 1 products described above, for a total volume of 40 µL. We usedthe following thermal cycling program: 1. 95 ◦C for 2:00; 2. 95 ◦C for 0:20; 3. 70 ◦C for 0:01;4. 55 ◦C for 0:20; 5. 70 ◦C for 0:20; 6. Go to 2 (23 times); and 7. 4 ◦C hold. PCR 2 productswere purified by Ampure XP (bead-to-sample ratio 1.0), quantified with Quant-iT PicoGreen, andequal amounts of each experimental sample were mixed and purified by agarose gel electrophoresis,excising the predominant DNA species at the expected size of approximately 470 bp. Sequencing wasperformed on one lane of a flow cell of an Illumina HiSeq 2500 using 2 × 250 bp paired-end reads inrapid-run mode.
4.5. Inference of Amino-Acid Preferences from Sequencing Data
We used dms_tools (http://jbloomlab.github.io/dms_tools/), version 1.1.12, to alignsubamplicon reads to a reference HA sequence, group barcodes to build consensus sequences,quantify mutation counts at every site in the gene for each experimental sample, and infer site-specificamino-acid preferences based on mutation frequencies pre- and post-selection using the algorithmdescribed in [23]. The code that performs these analyses is in File S4.
4.6. Phylogenetic Modeling Using Amino-Acid Preferences
We sub-sampled human and swine H1 sequences (1 sequence per host per year) from the setof sequences from [4], removed identical sequences, and built a sequence alignment. We then usedphydms version 1.1.0 [24] (http://jbloomlab.github.io/phydms/), which in turn uses Bio++ [25] forthe likelihood calculations, to compare experimentally informed codon substitution models and othernon-site-specific substitution models. The code that performs these analyses is in File S4.
4.7. Statistical Tests
Multiple linear regression of the continuous dependent variable of site entropy as a functionof the continuous independent variable of relative solvent accessibility and a binary indicator of
Viruses 2016, 8, 155 14 of 17
a site belonging to a specific classification (e.g., “antigenic sites”) was performed with the sameclassifications as described in [4]. Additional classifications were obtained from [34] for sitesresponsible for antigenic cluster transitions in H3N2 and seasonal H1N1 (sites 158, 168, 169, 171,172, 202, and 206 in sequential WSN H1 numbering starting with the initiating methionine), and thesites within antibody footprints of broadly-neutralizing antibodies F10, CR6261, FI6v3, and CR9114(sites 25, 45, 46, 47, 48, 49, 305, 306, 307, 332, 361, 362, 363, 364, 379, 381, 382, 384, 385, 386, 388,389, 391, 392, 395, 396, 399, and 400 in sequential WSN H1 numbering starting with the initiatingmethionine) [35–38]. Definition of the protein domains within HA were from [39] (HA1 fusiondomain: 18–72, 291–340; HA1 vestigial esterase domain: 73–125, 279–290; HA1 receptor bindingdomain: 126–278; HA2 fusion domain: 344–503; and all sites in sequential H1 numbering startingwith the initiating methionine). The code that performs these analyses is in File S4.
4.8. Availability of Data and Computer Code
Sequencing data are available from the Sequence Read Archive under accession numbersSRR3113656 (mutant DNA library 1), SRR3113657 (mutant DNA library 2), SRR3113658 (mutant DNAlibrary 3), SRR3113660 (mutant virus library 1), SRR3113661 (mutant virus library 2), SRR3113662(mutant virus library 3), SRR3113655 (wild-type DNA control), and SRR3113659 (wild-type viruscontrol). An iPython notebook (and a static HTML version of it) for all analyses is in File S4. A Pythonscript for visualizing mutational tolerance on the HA structure in PyMol is in File S1.
Supplementary Materials: The following figures are available online at www.mdpi.com/1999-4915/8/6/155/s1, and the following files are available online at www.mdpi.com/1999-4915/8/6/155/s2, Figure S1:An HA-deficient helper virus can replicate in cells constitutively expressing HA protein. Figure S2: The mutantplasmid DNA library used in this study (“new”) has a lower mutation rate than the library used by [4] (“old”).Figure S3: Mutant virus library generation is more efficient when HA is encoded on the pHH21 plasmid.Figure S4: Purging of stop codons is more complete in our new experiment than in the previous one. Figure S5:Synonymous frequency peaks observed in bottlenecked virus libraries are not due to the composition of plasmidmutant libraries. Figure S6: Statistical analyses of whether sets of sites have higher or lower mutational tolerancethan expected given their solvent accessibility. Figure S7: The mutational tolerance of HA’s domains. File S1:PyMol script for visualization of mutational tolerance on the HA crystal structure. File S2: Text file with theoverall merged site-specific amino-acid preferences (average of the new and old data). Residues are numberedsequentially beginning with 1 at the N-terminal methionine. Conversion between WSN sequential numberingand H3 numbering is provided in File S6. File S3: Text file with the overall merged site-specific amino-acidpreferences (average of the new and old data) scaled by the stringency parameter from Table 1. Residues arenumbered sequentially beginning with 1 at the N-terminal methionine. Conversion between WSN sequentialnumbering and H3 numbering is provided in File S6. File S4: A ZIP /hlfile containing the data and code for alldata analysis and figure generation, File S5: Text file with primer sequences for the barcoded subampliconsequencing, File S6: Text file with HA site numbering conversion between H3 numbering and sequentialnumbering of the WSN HA beginning with 1 at the N-terminal methionine.
Acknowledgments: We thank Bargavi Thyagarajan for performing the PCR mutagenesis of the HA gene.We thank Anice Lowen for discussions that helped inspire the idea of using a helper virus to generate the mutantvirus libraries. This work was supported by the National Institute of General Medical Sciences (NIGMS) of theNational Institutes of Health (NIH) under grant R01 GM102198. M.B.D. was supported in part by a fellowshipfrom the Seattle Chapter of the Achievement Rewards for College Scientists Foundation.
Author Contributions: M.B.D. and J.D.B. conceived and designed the experiments; M.B.D. performed theexperiments; M.B.D. analyzed the data; M.B.D. and J.D.B. wrote the paper.
Conflicts of Interest: The authors declare no conflict of interest. The founding sponsors had no role in the designof the study; in the collection, analyses, or interpretation of data; in the writing of the manuscript, or in thedecision to publish the results.

Viruses 2016, 8, 155 15 of 17
Abbreviations
The following abbreviations are used in this manuscript:
HA: hemagglutininMOI: multiplicity of infectionTCID50: 50% tissue culture infectious dose
References
1. Smith, D.J.; Lapedes, A.S.; de Jong, J.C.; Bestebroer, T.M.; Rimmelzwaan, G.F.; Osterhaus, A.D.;Fouchier, R.A. Mapping the Antigenic and Genetic Evolution of Influenza Virus. Science 2004, 305, 371–376.
2. Fowler, D.M.; Fields, S. Deep mutational scanning: A new style of protein science. Nat. Methods 2014,11, 801–807.
3. Boucher, J.I.; Cote, P.; Flynn, J.; Jiang, L.; Laban, A.; Mishra, P.; Roscoe, B.P.; Bolon, D.N. Viewing proteinfitness landscapes through a next-gen lens. Genetics 2014, 198, 461–471.
4. Thyagarajan, B.; Bloom, J.D. The inherent mutational tolerance and antigenic evolvability of influenzahemagglutinin. eLife 2014, 3, e03300.
5. Bloom, J.D. An experimentally determined evolutionary model dramatically improves phylogenetic fit.Mol. Biol. Evol. 2014, 31, 1956–1978.
6. Doud, M.B.; Ashenberg, O.; Bloom, J.D. Site-specific amino acid preferences are mostly conserved in twoclosely related protein homologs. Mol. Biol. Evol. 2015, 32, 2944–2960.
7. Wu, N.C.; Young, A.P.; Al-Mawsawi, L.Q.; Olson, C.A.; Feng, J.; Qi, H.; Chen, S.H.; Lu, I.H.; Lin, C.Y.;Chin, R.G.; et al. High-throughput profiling of influenza A virus hemagglutinin gene at single-nucleotideresolution. Sci. Rep. 2014, 4, 4942.
8. Wu, N.C.; Du, Y.; Le, S.; Young, A.P.; Zhang, T.H.; Wang, Y.; Zhou, J.; Yoshizawa, J.M.; Dong, L.; Li, X.; et al.Coupling high-throughput genetics with phylogenetic information reveals an epistatic interaction on theinfluenza A virus M segment. BMC Genom. 2016, 17, 1.
9. Heaton, N.S.; Sachs, D.; Chen, C.J.; Hai, R.; Palese, P. Genome-wide mutagenesis of influenza virus revealsunique plasticity of the hemagglutinin and NS1 proteins. Proc. Natl. Acad. Sci. USA 2013, 110, 20248–20253.
10. Chua, M.A.; Schmid, S.; Perez, J.T.; Langlois, R.A.; Tenoever, B.R. Influenza A virus utilizes suboptimalsplicing to coordinate the timing of infection. Cell Rep. 2013, 3, 23–29.
11. Robb, N.C.; Smith, M.; Vreede, F.T.; Fodor, E. NS2/NEP protein regulates transcription and replication ofthe influenza virus RNA genome. J. Gen. Virol. 2009, 90, 1398–1407.
12. Shapiro, G.; Gurney, T.; Krug, R. Influenza virus gene expression: Control mechanisms at early and latetimes of infection and nuclear-cytoplasmic transport of virus-specific RNAs. J. Virol. 1987, 61, 764–773.
13. Hoffmann, E.; Neumann, G.; Kawaoka, Y.; Hobom, G.; Webster, R.G. A DNA transfection system forgeneration of influenza A virus from eight plasmids. Proc. Natl. Acad. Sci. USA 2000, 97, 6108–6113.
14. Neumann, G.; Watanabe, T.; Ito, H.; Watanabe, S.; Goto, H.; Gao, P.; Hughes, M.; Perez, D.R.; Donis, R.;Hoffmann, E.; et al. Generation of influenza A viruses entirely from cloned cDNAs. Proc. Natl. Acad.Sci. USA 1999, 96, 9345–9350.
15. Fodor, E.; Devenish, L.; Engelhardt, O.G.; Palese, P.; Brownlee, G.G.; García-Sastre, A. Rescue of influenzaA virus from recombinant DNA. J. Virol. 1999, 73, 9679–9682.
16. Varble, A.; Albrecht, R.A.; Backes, S.; Crumiller, M.; Bouvier, N.M.; Sachs, D.; García-Sastre, A.;tenOever, B.R. Influenza a virus transmission bottlenecks are defined by infection route and recipient host.Cell Host Microbe. 2014, 16, 691–700.
17. Benitez, A.A.; Panis, M.; Xue, J.; Varble, A.; Shim, J.V.; Frick, A.L.; López, C.B.; Sachs, D.; tenOever, B.R.In vivo RNAi screening identifies MDA5 as a significant contributor to the cellular defense against influenzaA virus. Cell Rep. 2015, 11, 1714–1726.
18. Wu, N.C.; Olson, C.A.; Du, Y.; Le, S.; Tran, K.; Remenyi, R.; Gong, D.; Al-Mawsawi, L.Q.; Qi, H.;Wu, T.T.; et al. Functional constraint profiling of a viral protein reveals discordance of evolutionaryconservation and functionality. PLoS Genet. 2015, 11, e1005310.
Viruses 2016, 8, 155 16 of 17
19. Jiang, L.; Liu, P.; Bank, C.; Renzette, N.; Prachanronarong, K.; Yilmaz, L.S.; Caffrey, D.R.; Zeldovich, K.B.;Schiffer, C.A.; Kowalik, T.F.; et al. A balance between inhibitor binding and substrate processing confersinfluenza drug resistance. J. Mol. Biol. 2015, 428, 538–553.
20. Marsh, G.A.; Hatami, R.; Palese, P. Specific residues of the influenza A virus hemagglutinin viral RNA areimportant for efficient packaging into budding virions. J. Virol. 2007, 81, 9727–9736.
21. Hiatt, J.B.; Patwardhan, R.P.; Turner, E.H.; Lee, C.; Shendure, J. Parallel, tag-directed assembly of locallyderived short sequence reads. Nat. Methods 2010, 7, 119–122.
22. Zhang, T.H.; Wu, N.C.; Sun, R. A benchmark study on error-correction by read-pairing and tag-clusteringin amplicon-based deep sequencing. BMC Genom. 2016, 17, 1.
23. Bloom, J.D. Software for the analysis and visualization of deep mutational scanning data. BMC Bioinform.2015, 16, 1.
24. Bloom, J. Identification of positive selection in genes is greatly improved by using experimentally informedsite-specific models. bioRxiv 2016, 037689, doi:10.1101/037689.
25. Guéguen, L.; Gaillard, S.; Boussau, B.; Gouy, M.; Groussin, M.; Rochette, N.C.; Bigot, T.; Fournier, D.;Pouyet, F.; Cahais, V.; et al. Bio++: Efficient Extensible Libraries and Tools for Computational MolecularEvolution. Mol. Biol. Evol. 2013, 30, 1745–1750.
26. Posada, D.; Buckley, T.R. Model selection and model averaging in phylogenetics: Advantages of Akaikeinformation criterion and Bayesian approaches over likelihood ratio tests. Syst. Biol. 2004, 53, 793–808.
27. Goldman, N.; Yang, Z. A codon-based model of nucleotide substitution for protein-coding DNA sequences.Mol. Biol. Evol. 1994, 11, 725–736.
28. Yang, Z.; Nielsen, R.; Goldman, N.; Pedersen, A.M.K. Codon-substitution models for heterogeneousselection pressure at amino acid sites. Genetics 2000, 155, 431–449.
29. Bloom, J.D. An experimentally informed evolutionary model improves phylogenetic fit to divergentlactamase homologs. Mol. Biol. Evol. 2014, 31, 2753–2769.
30. Lazarowitz, S.G.; Goldberg, A.R.; Choppin, P.W. Proteolytic cleavage by plasmin of the HA polypeptide ofinfluenza virus: host cell activation of serum plasminogen. Virology 1973, 56, 172–180.
31. Goto, H.; Kawaoka, Y. A novel mechanism for the acquisition of virulence by a human influenza A virus.Proc. Natl. Acad. Sci. USA 1998, 95, 10224–10228.
32. Sun, X.; Longping, V.T.; Ferguson, A.D.; Whittaker, G.R. Modifications to the hemagglutinin cleavage sitecontrol the virulence of a neurotropic H1N1 influenza virus. J. Virol. 2010, 84, 8683–8690.
33. Caton, A.J.; Brownlee, G.G.; Yewdell, J.W.; Gerhard, W. The antigenic structure of the influenza virusA/PR/8/34 hemagglutinin (H1 subtype). Cell 1982, 31, 417–427.
34. Koel, B.F.; Burke, D.F.; Bestebroer, T.M.; van der Vliet, S.; Zondag, G.C.; Vervaet, G.; Skepner, E.; Lewis, N.S.;Spronken, M.I.; Russell, C.A.; et al. Substitutions near the receptor binding site determine major antigenicchange during influenza virus evolution. Science 2013, 342, 976–979.
35. Sui, J.; Hwang, W.C.; Perez, S.; Wei, G.; Aird, D.; Chen, L.M.; Santelli, E.; Stec, B.; Cadwell, G.; Ali, M.; et al.Structural and functional bases for broad-spectrum neutralization of avian and human influenza A viruses.Nat. Struct. Mol. Biol. 2009, 16, 265–273.
36. Ekiert, D.C.; Bhabha, G.; Elsliger, M.A.; Friesen, R.H.; Jongeneelen, M.; Throsby, M.; Goudsmit, J.;Wilson, I.A. Antibody recognition of a highly conserved influenza virus epitope. Science 2009, 324, 246–251.
37. Corti, D.; Voss, J.; Gamblin, S.J.; Codoni, G.; Macagno, A.; Jarrossay, D.; Vachieri, S.G.; Pinna, D.; Minola, A.;Vanzetta, F.; et al. A neutralizing antibody selected from plasma cells that binds to group 1 and group 2influenza A hemagglutinins. Science 2011, 333, 850–856.
38. Dreyfus, C.; Laursen, N.S.; Kwaks, T.; Zuijdgeest, D.; Khayat, R.; Ekiert, D.C.; Lee, J.H.; Metlagel, Z.;Bujny, M.V.; Jongeneelen, M.; et al. Highly conserved protective epitopes on influenza B viruses. Science2012, 337, 1343–1348.
39. Gamblin, S.; Haire, L.; Russell, R.; Stevens, D.; Xiao, B.; Ha, Y.; Vasisht, N.; Steinhauer, D.; Daniels, R.;Elliot, A.; et al. The structure and receptor binding properties of the 1918 influenza hemagglutinin. Science2004, 303, 1838–1842.
40. Bedford, T.; Suchard, M.A.; Lemey, P.; Dudas, G.; Gregory, V.; Hay, A.J.; McCauley, J.W.; Russell, C.A.;Smith, D.J.; Rambaut, A. Integrating influenza antigenic dynamics with molecular evolution. eLife 2014,3, e01914.

Viruses 2016, 8, 155 17 of 17
41. Krammer, F.; Palese, P. Influenza virus hemagglutinin stalk-based antibodies and vaccines. Curr. Opin. Virol.2013, 3, 521–530.
42. Rosenthal, P.B.; Zhang, X.; Formanowski, F.; Fitz, W.; Wong, C.H.; Meier-Ewert, H.; Skehel, J.J.; Wiley, D.C.Structure of the haemagglutinin-esterase-fusion glycoprotein of influenza C virus. Nature 1998, 396, 92–96.
43. Gong, L.I.; Suchard, M.A.; Bloom, J.D. Stability-mediated epistasis constrains the evolution of an influenzaprotein. eLife 2013, 2, e00631.
44. Harms, M.J.; Thornton, J.W. Historical contingency and its biophysical basis in glucocorticoid receptorevolution. Nature 2014, 512, 203–207.
45. Byrd-Leotis, L.; Galloway, S.E.; Agbogu, E.; Steinhauer, D.A. Influenza hemagglutinin (HA) stem regionmutations that stabilize or destabilize the structure of multiple HA subtypes. J. Virol. 2015, 89, 4504–4516.
46. Ashenberg, O.; Gong, L.I.; Bloom, J.D. Mutational effects on stability are largely conserved during proteinevolution. Proc. Natl. Acad. Sci. USA 2013, 110, 21071–21076.
47. Risso, V.; Manssour-Triedo, F.; Delgado-Delgado, A.; Arco, R.; Barroso-delJesus, A.; Ingles-Prieto, A.;Godoy-Ruiz, R.; Gavira, J.; Gaucher, E.; Ibarra-Molero, B.; et al. Mutational Studies on ResurrectedAncestral Proteins Reveal Conservation of Site-Specific Amino Acid Preferences throughout EvolutionaryHistory. Mol. Biol. Evol. 2015, 32, 440–455.
c© 2016 by the authors; licensee MDPI, Basel, Switzerland. This article is an open accessarticle distributed under the terms and conditions of the Creative Commons Attribution(CC-BY) license (http://creativecommons.org/licenses/by/4.0/).