ammo inc. investor presentation (sept 14 2021)
TRANSCRIPT
S E P T E M B E R 2 0 2 1
2
SAFE HARBOR / FORWARD-LOOKINGThis document contains certain “forward-looking statements”. All statements other than statements of historical fact are “forward-looking statements” for purposes of federal and state securities laws, including, but not limited to, any projections of earnings, revenue or other financial items; any statements of the plans, strategies, goals and objectives of management for future operations; any statements concerning proposed new products and services or developments thereof; any statements regarding future economic conditions or performance; any statements or belief; and any statements of assumptions underlying any of the foregoing. Forward looking statements may include the words “may,” “could,” “estimate,” “intend,” “continue,” “believe,” “expect” or “anticipate” or other similar words, or the negative thereof. These forward-looking statements present our estimates and assumptions only as of the date of this report. Accordingly, readers are cautioned not to place undue reliance on forward-looking statements, which speak only as of the dates on which they are made. We do not undertake to update forward-looking statements to reflect the impact of circumstances or events that arise after the dates they are made. You are urged to carefully review and consider any cautionary statements and other disclosures, including the statements made under the heading "Risk Factors" and elsewhere in the prospectus included in the Registration Statement on Form S-1 (file number 333-248800) initially filed by the Company with the U.S. Securities and Exchange Commission on September 15, 2020. In our filings with the Securities and Exchange Commission, references to “AMMO, Inc.”, “AMMO”, “the Company”, “we,” “us,” “our” and similar terms refer to AMMO, Inc. and its wholly owned operating subsidiaries The Enlight Group, SNI, LLC and Ammo Technologies, Inc.
3
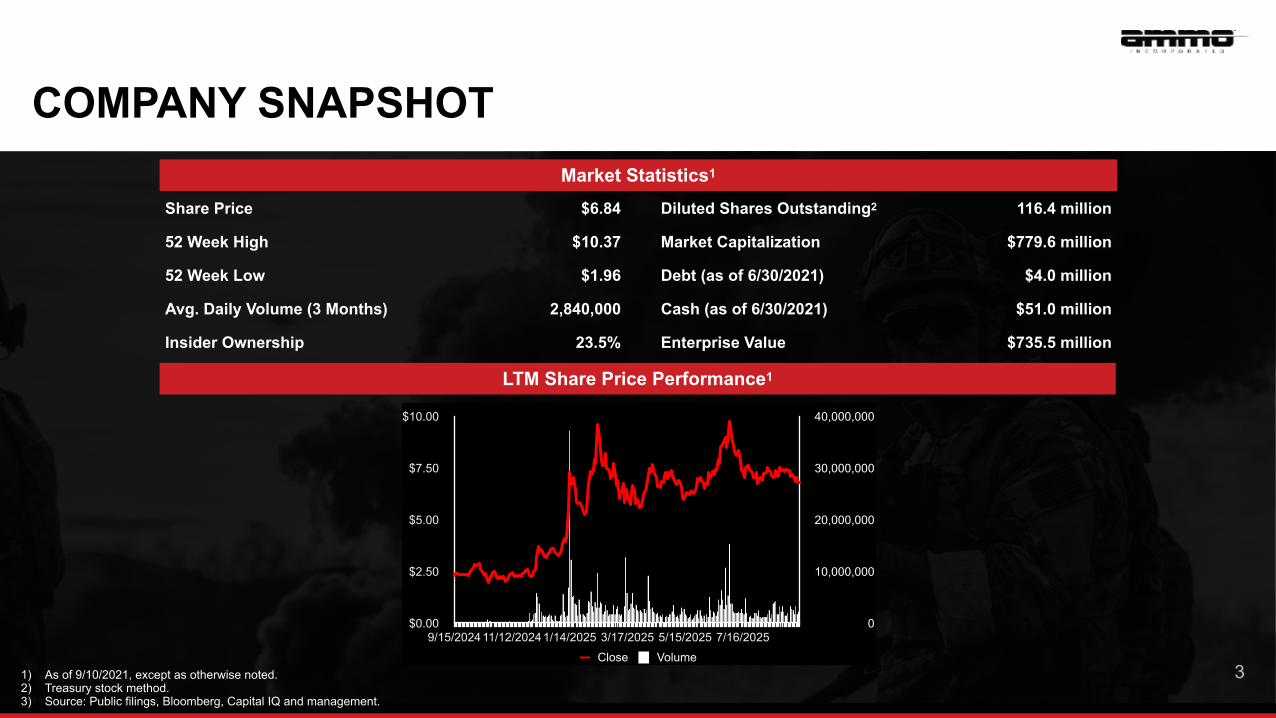
COMPANY SNAPSHOT
1) As of 9/10/2021, except as otherwise noted. 2) Treasury stock method. 3) Source: Public filings, Bloomberg, Capital IQ and management.
3
Market Statistics1
Share Price $6.84 Diluted Shares Outstanding2 116.4 million
52 Week High $10.37 Market Capitalization $779.6 million
52 Week Low $1.96 Debt (as of 6/30/2021) $4.0 million
Avg. Daily Volume (3 Months) 2,840,000 Cash (as of 6/30/2021) $51.0 million
Insider Ownership 23.5% Enterprise Value $735.5 million
0
10,000,000
20,000,000
30,000,000
40,000,000
$0.00
$2.50
$5.00
$7.50
$10.00
9/15/202411/12/20241/14/2025 3/17/2025 5/15/2025 7/16/2025
Close Volume
LTM Share Price Performance1
4
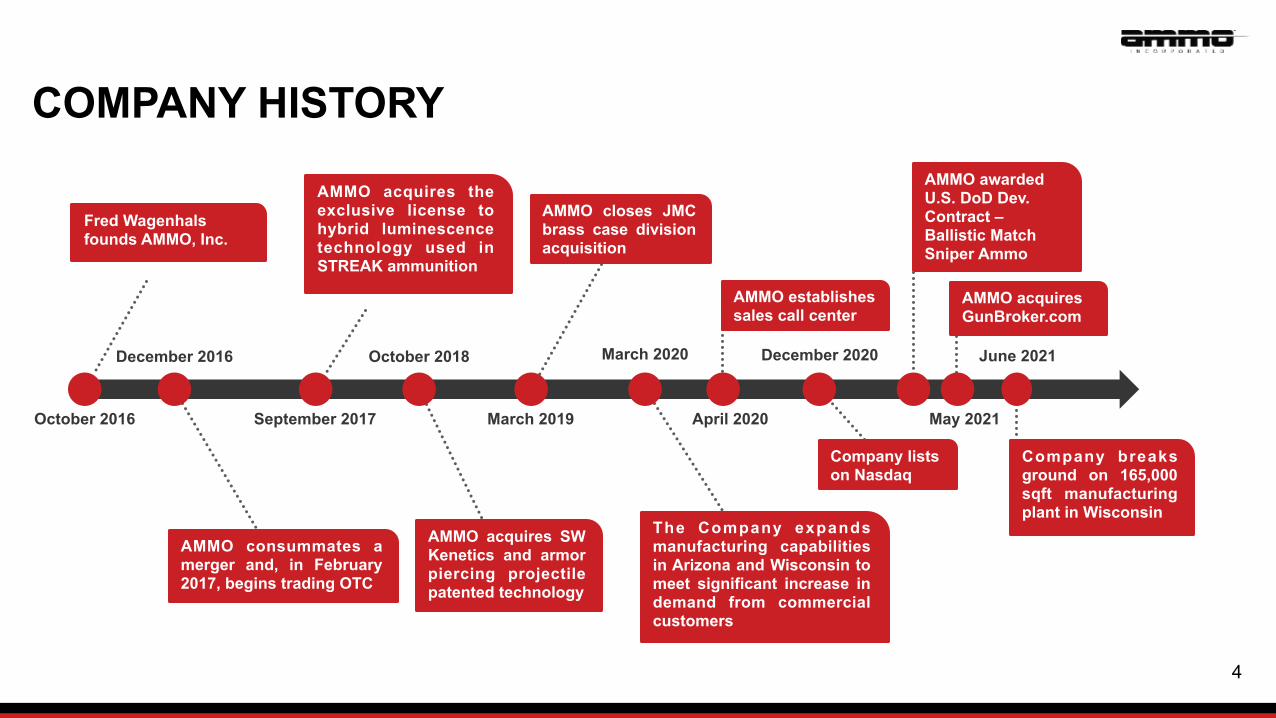
COMPANY HISTORY
Fred Wagenhals founds AMMO, Inc.
October 2016
AMMO consummates a merger and, in February 2017, begins trading OTC
December 2016 June 2021
March 2019
The Company expands manufacturing capabilities in Arizona and Wisconsin to meet significant increase in demand from commercial customers
AMMO closes JMC brass case division acquisition
March 2020 December 2020
Company lists on Nasdaq
Company breaks ground on 165,000 sqft manufacturing plant in Wisconsin
AMMO acquires the exclusive license to hybrid luminescence technology used in STREAK ammunition
September 2017
AMMO acquires SW Kenetics and armor piercing projectile patented technology
October 2018
April 2020
AMMO establishes sales call center
May 2021
AMMO acquires GunBroker.com
AMMO awarded U.S. DoD Dev. Contract – Ballistic Match Sniper Ammo
5
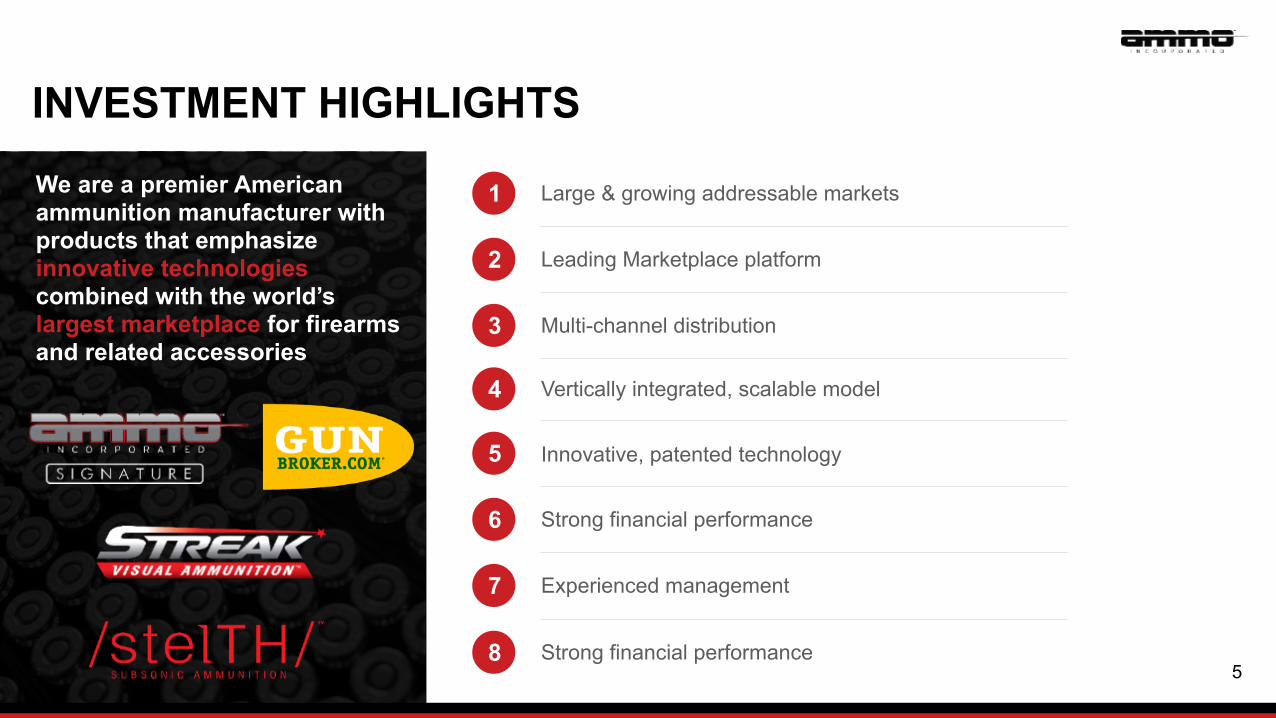
INVESTMENT HIGHLIGHTS
We are a premier American ammunition manufacturer with products that emphasize innovative technologies combined with the world’s largest marketplace for firearms and related accessories
Large & growing addressable markets1
Leading Marketplace platform2
Multi-channel distribution3
4 Vertically integrated, scalable model
5 Innovative, patented technology
6 Strong financial performance
7 Experienced management
8 Strong financial performance
6
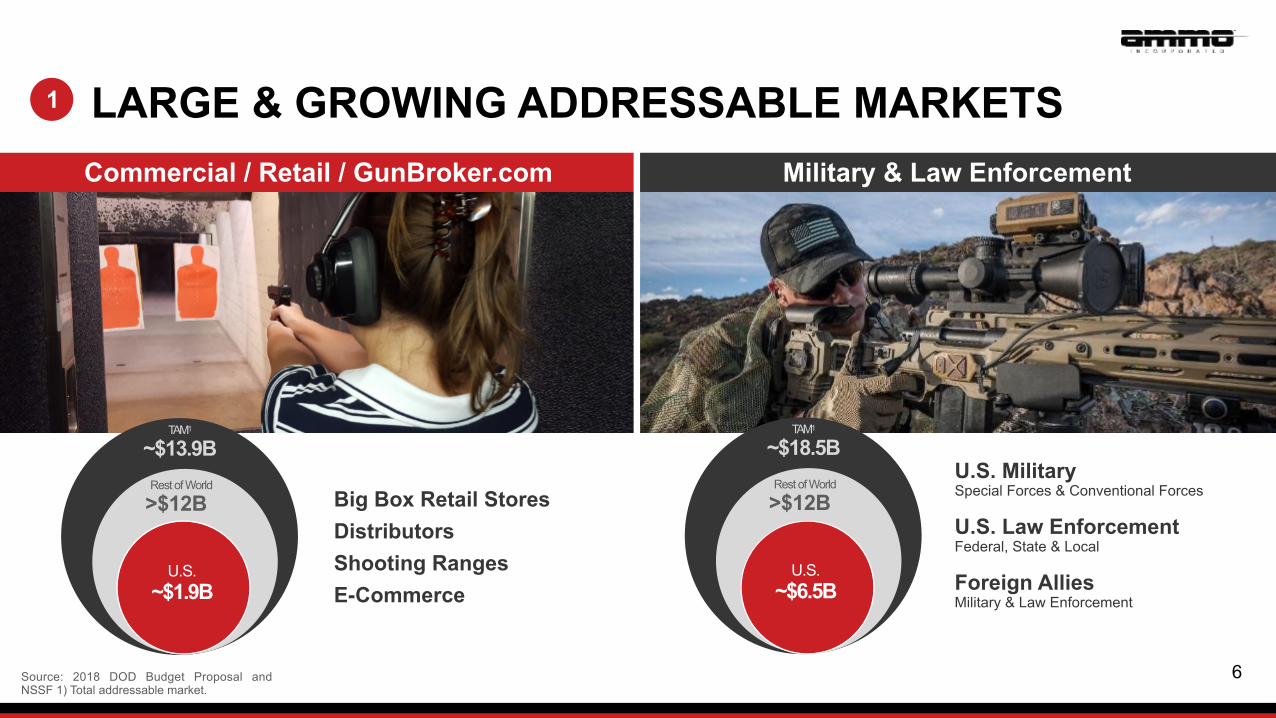
LARGE & GROWING ADDRESSABLE MARKETS
U.S. Military Special Forces & Conventional Forces
U.S. Law Enforcement Federal, State & Local
Foreign Allies Military & Law Enforcement
Big Box Retail Stores Distributors Shooting Ranges E-Commerce
Commercial / Retail / GunBroker.com Military & Law Enforcement
Source: 2018 DOD Budget Proposal and NSSF 1) Total addressable market.
TAM1 ~$13.9B
Rest of World >$12B
U.S. ~$1.9B
TAM1 ~$18.5B
Rest of World >$12B
U.S. ~$6.5B
1
7
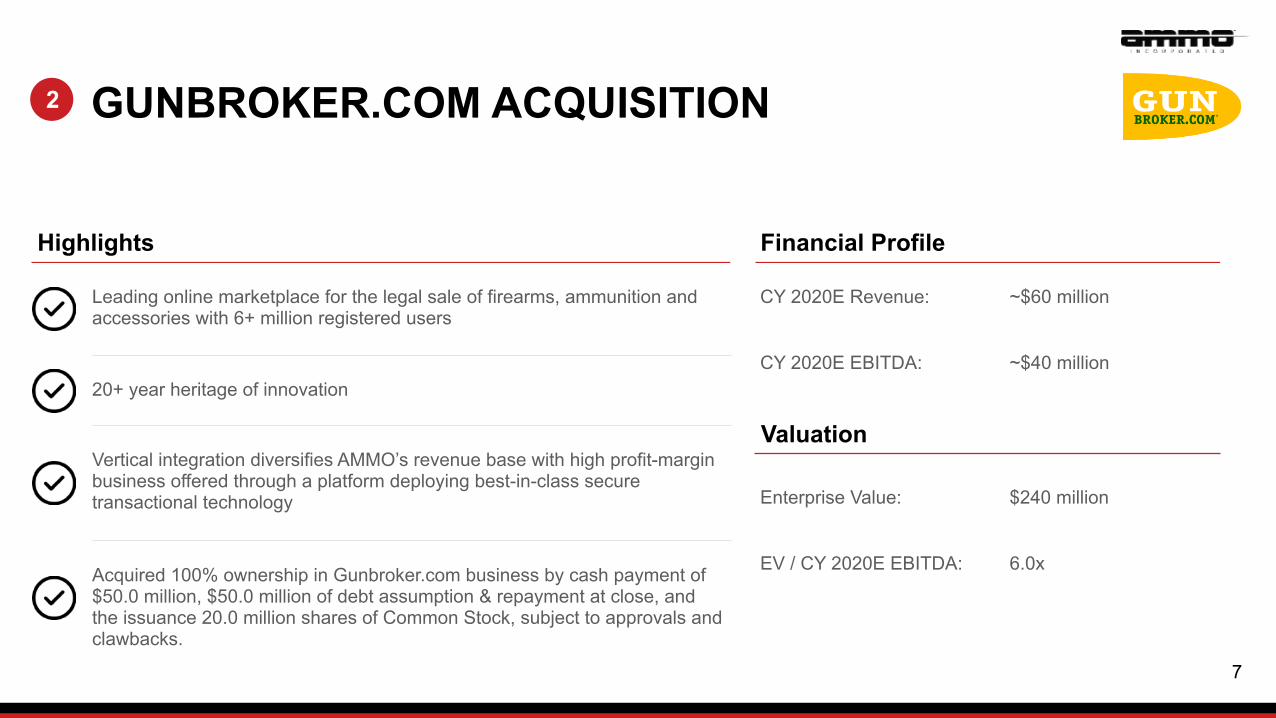
Leading online marketplace for the legal sale of firearms, ammunition and accessories with 6+ million registered users
Acquired 100% ownership in Gunbroker.com business by cash payment of $50.0 million, $50.0 million of debt assumption & repayment at close, and the issuance 20.0 million shares of Common Stock, subject to approvals and clawbacks.
20+ year heritage of innovation
Vertical integration diversifies AMMO’s revenue base with high profit-margin business offered through a platform deploying best-in-class secure transactional technology
Highlights Financial Profile
CY 2020E Revenue: ~$60 million
CY 2020E EBITDA: ~$40 million
Valuation
Enterprise Value: $240 million
EV / CY 2020E EBITDA: 6.0x
GUNBROKER.COM ACQUISITION2
8
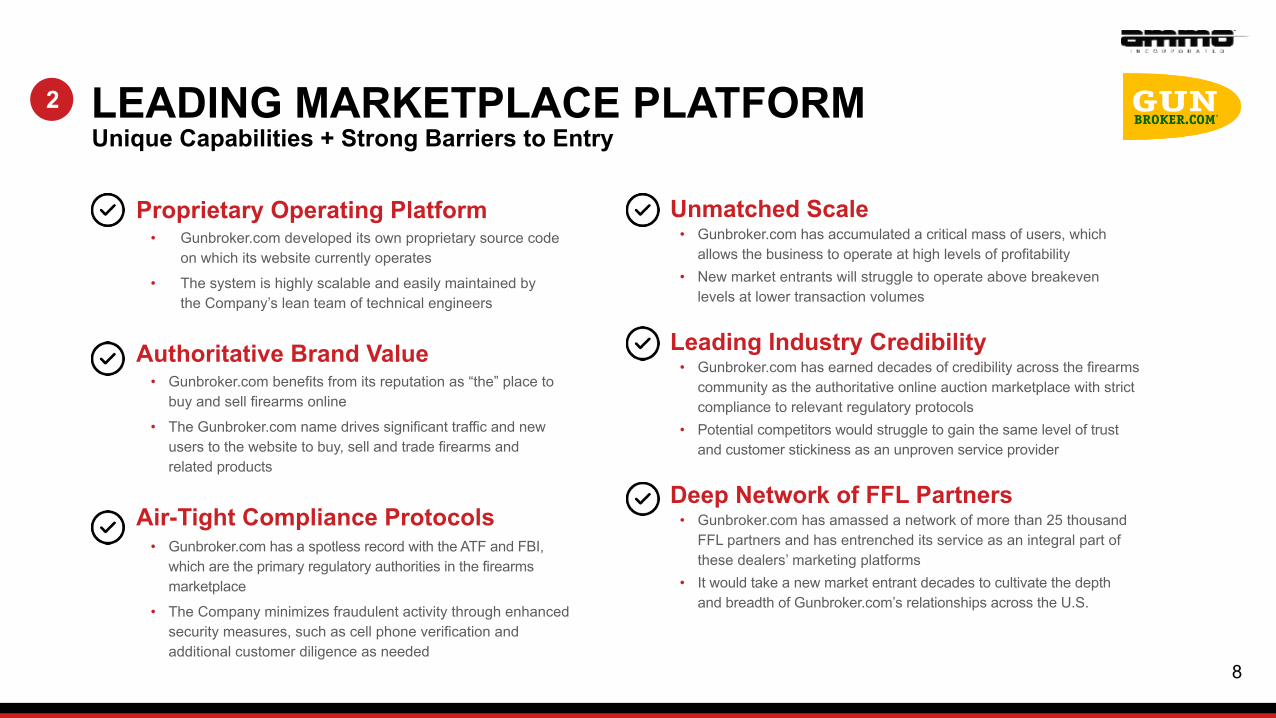
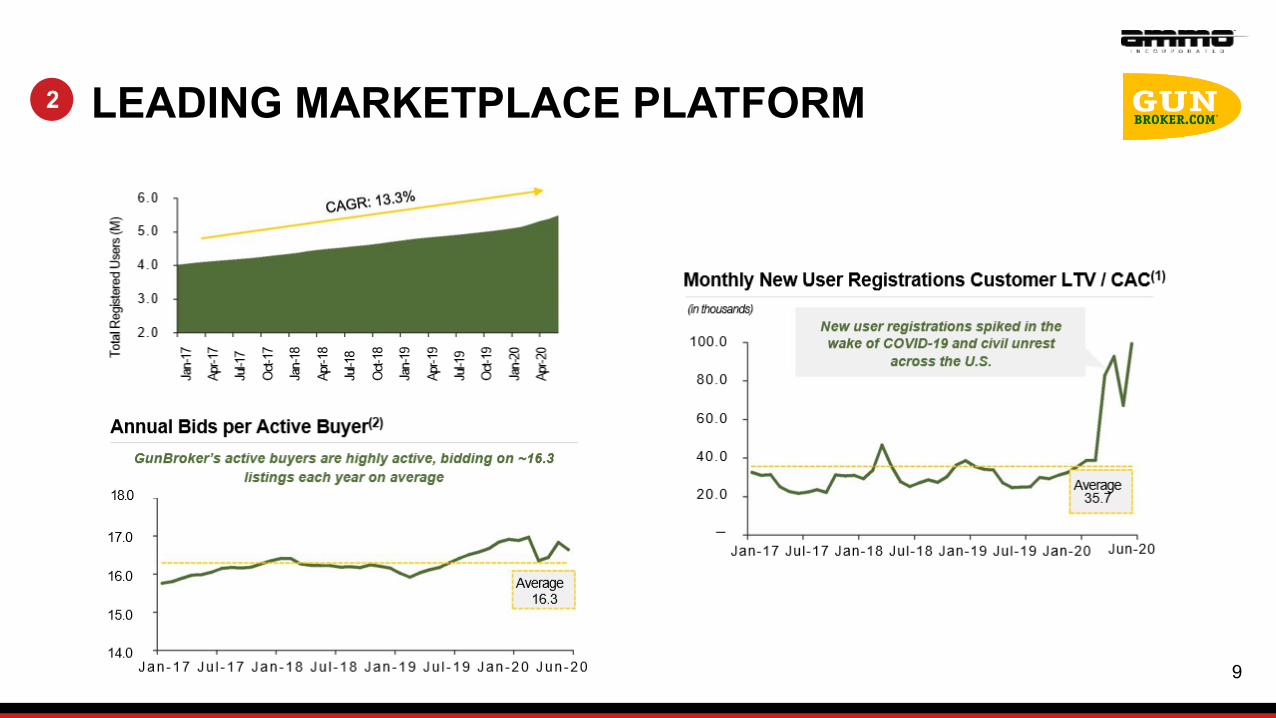
LEADING MARKETPLACE PLATFORM
Shooting Ranges
Distributors
Proprietary Operating Platform
• Gunbroker.com developed its own proprietary source code on which its website currently operates
• The system is highly scalable and easily maintained by the Company’s lean team of technical engineers
Authoritative Brand Value
• Gunbroker.com benefits from its reputation as “the” place to buy and sell firearms online
• The Gunbroker.com name drives significant traffic and new users to the website to buy, sell and trade firearms and related products
Air-Tight Compliance Protocols
• Gunbroker.com has a spotless record with the ATF and FBI, which are the primary regulatory authorities in the firearms marketplace
• The Company minimizes fraudulent activity through enhanced security measures, such as cell phone verification and additional customer diligence as needed
Unmatched Scale • Gunbroker.com has accumulated a critical mass of users, which
allows the business to operate at high levels of profitability
• New market entrants will struggle to operate above breakeven levels at lower transaction volumes
Leading Industry Credibility • Gunbroker.com has earned decades of credibility across the firearms
community as the authoritative online auction marketplace with strict compliance to relevant regulatory protocols
• Potential competitors would struggle to gain the same level of trust and customer stickiness as an unproven service provider
Deep Network of FFL Partners • Gunbroker.com has amassed a network of more than 25 thousand
FFL partners and has entrenched its service as an integral part of these dealers’ marketing platforms
• It would take a new market entrant decades to cultivate the depth and breadth of Gunbroker.com’s relationships across the U.S.
Unique Capabilities + Strong Barriers to Entry 2
9
LEADING MARKETPLACE PLATFORMOnline / Retail Shooting Ranges
Distributors Buying Groups
2
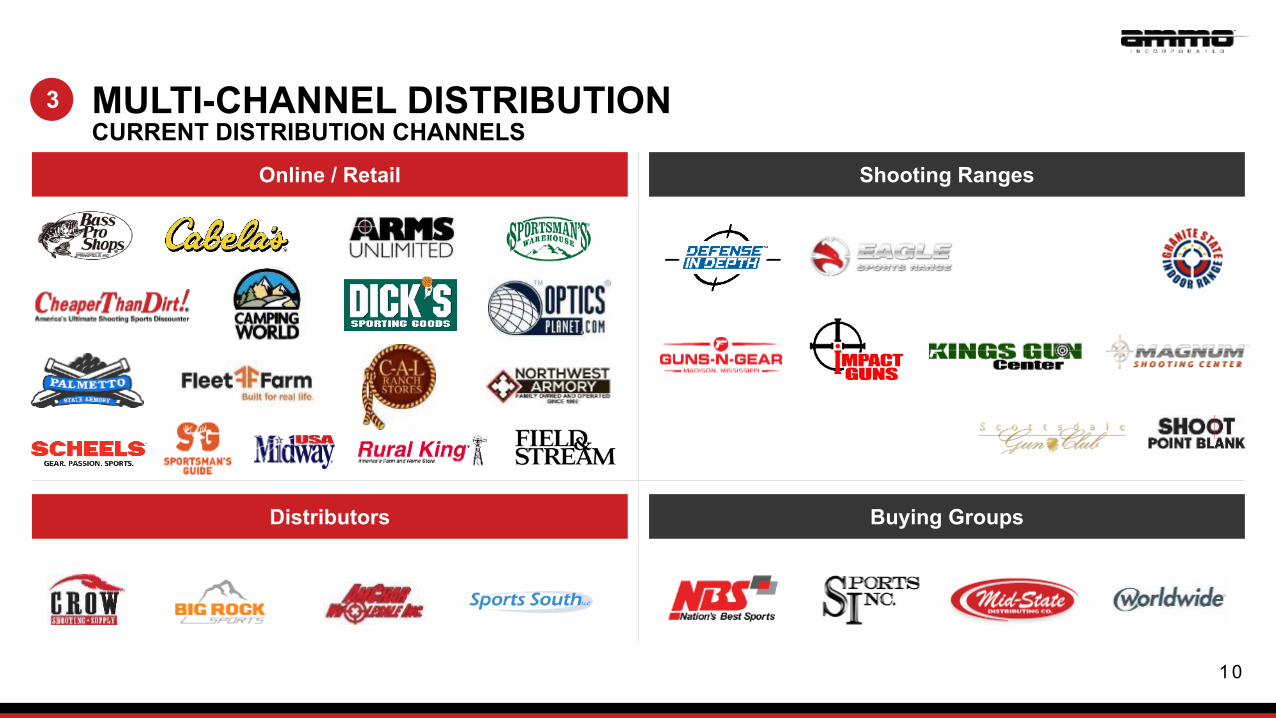
1 0
Online / Retail Shooting Ranges
Distributors Buying Groups
MULTI-CHANNEL DISTRIBUTION CURRENT DISTRIBUTION CHANNELS
3
11
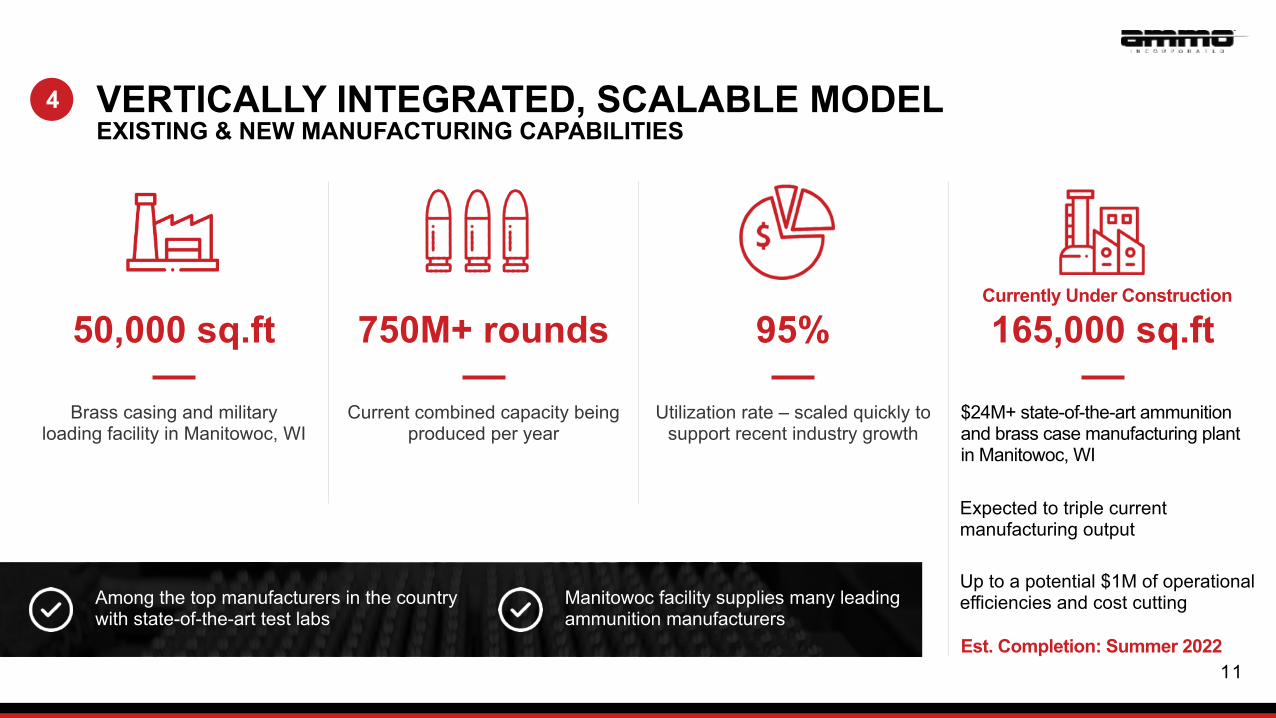
50,000 sq.ft 165,000 sq.ft750M+ rounds 95%
Among the top manufacturers in the country with state-of-the-art test labs
Manitowoc facility supplies many leading ammunition manufacturers
Brass casing and military loading facility in Manitowoc, WI
$24M+ state-of-the-art ammunition and brass case manufacturing plant in Manitowoc, WI
Current combined capacity being produced per year
Utilization rate – scaled quickly to support recent industry growth
VERTICALLY INTEGRATED, SCALABLE MODEL EXISTING & NEW MANUFACTURING CAPABILITIES
Expected to triple current manufacturing output
Up to a potential $1M of operational efficiencies and cost cutting
Currently Under Construction
Est. Completion: Summer 2022
4
1 2
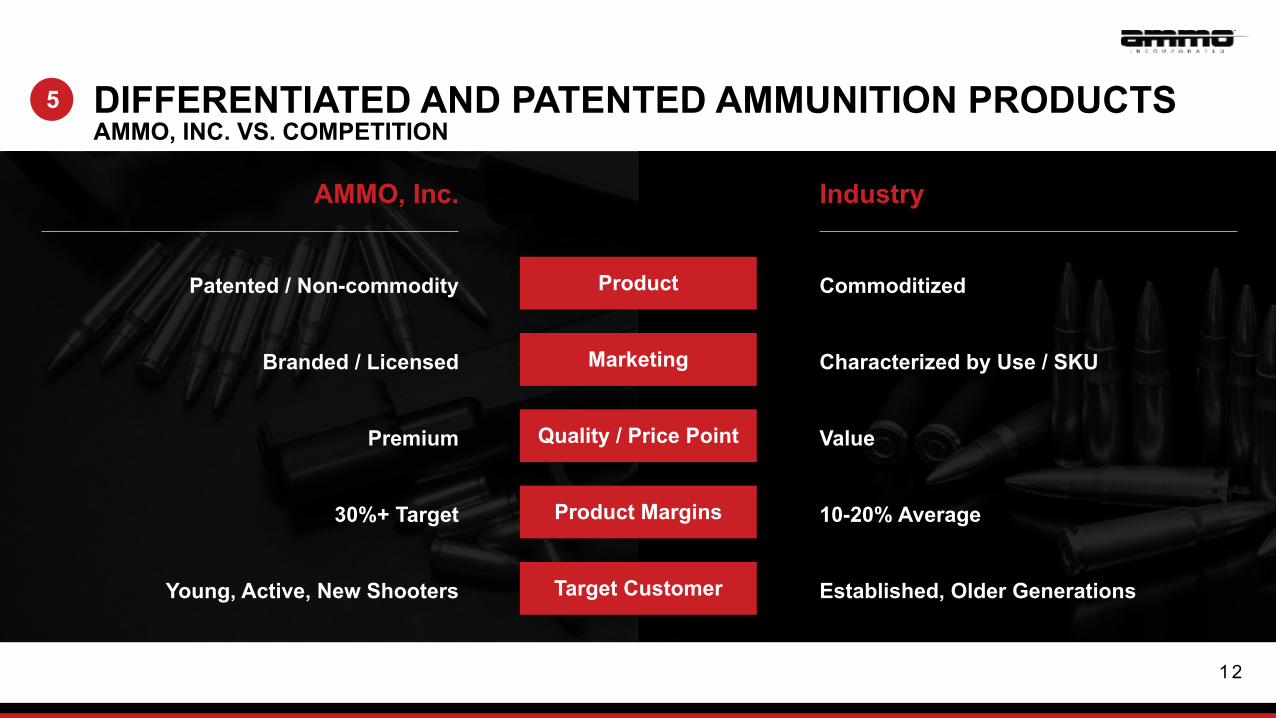
DIFFERENTIATED AND PATENTED AMMUNITION PRODUCTS AMMO, INC. VS. COMPETITION
AMMO, Inc. Industry
ProductPatented / Non-commodity Commoditized
Branded / Licensed Characterized by Use / SKUMarketing
Premium ValueQuality / Price Point
30%+ Target 10-20% AverageProduct Margins
Young, Active, New Shooters Established, Older GenerationsTarget Customer
5
1 3
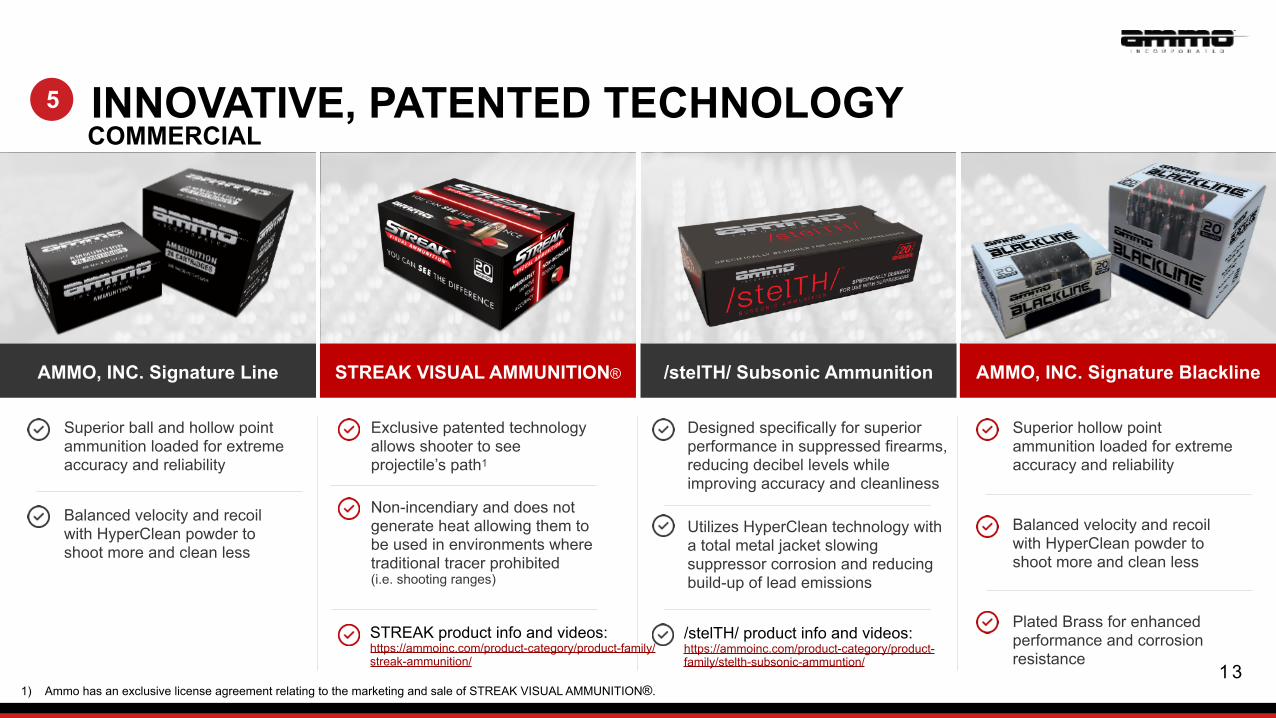
INNOVATIVE, PATENTED TECHNOLOGY
Exclusive patented technology allows shooter to see projectile’s path1
Non-incendiary and does not generate heat allowing them to be used in environments where traditional tracer prohibited (i.e. shooting ranges)
AMMO, INC. Signature Line STREAK VISUAL AMMUNITION® /stelTH/ Subsonic Ammunition AMMO, INC. Signature Blackline
Designed specifically for superior performance in suppressed firearms, reducing decibel levels while improving accuracy and cleanliness
Utilizes HyperClean technology with a total metal jacket slowing suppressor corrosion and reducing build-up of lead emissions
Superior hollow point ammunition loaded for extreme accuracy and reliability
Balanced velocity and recoil with HyperClean powder to shoot more and clean less
Superior ball and hollow point ammunition loaded for extreme accuracy and reliability
Balanced velocity and recoil with HyperClean powder to shoot more and clean less
Plated Brass for enhanced performance and corrosion resistance
1) Ammo has an exclusive license agreement relating to the marketing and sale of STREAK VISUAL AMMUNITION®.
STREAK product info and videos: https://ammoinc.com/product-category/product-family/streak-ammunition/
/stelTH/ product info and videos: https://ammoinc.com/product-category/product-family/stelth-subsonic-ammuntion/
COMMERCIAL5
1 4
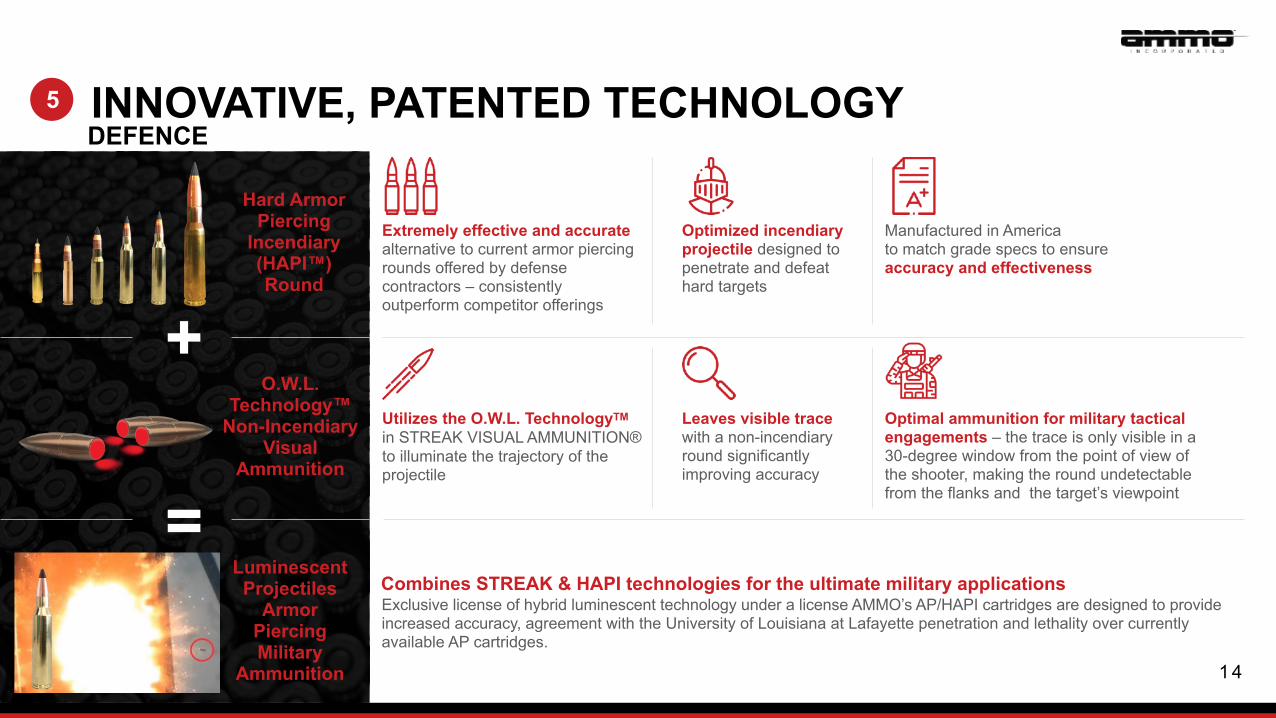
Hard Armor Piercing
Incendiary (HAPI™) Round
O.W.L. Technology™
Non-Incendiary Visual
Ammunition
Extremely effective and accurate alternative to current armor piercing rounds offered by defense contractors – consistently outperform competitor offerings
Optimized incendiary projectile designed to penetrate and defeat hard targets
Manufactured in America to match grade specs to ensure accuracy and effectiveness
Utilizes the O.W.L. TechnologyTM
in STREAK VISUAL AMMUNITION® to illuminate the trajectory of the projectile
Leaves visible trace with a non-incendiary round significantly improving accuracy
Optimal ammunition for military tactical engagements – the trace is only visible in a 30-degree window from the point of view of the shooter, making the round undetectable from the flanks and the target’s viewpoint
INNOVATIVE, PATENTED TECHNOLOGY DEFENCE
Exclusive license of hybrid luminescent technology under a license AMMO’s AP/HAPI cartridges are designed to provide increased accuracy, agreement with the University of Louisiana at Lafayette penetration and lethality over currently available AP cartridges.
+
=Luminescent Projectiles
Armor Piercing Military
Ammunition
Combines STREAK & HAPI technologies for the ultimate military applications
5
1 5
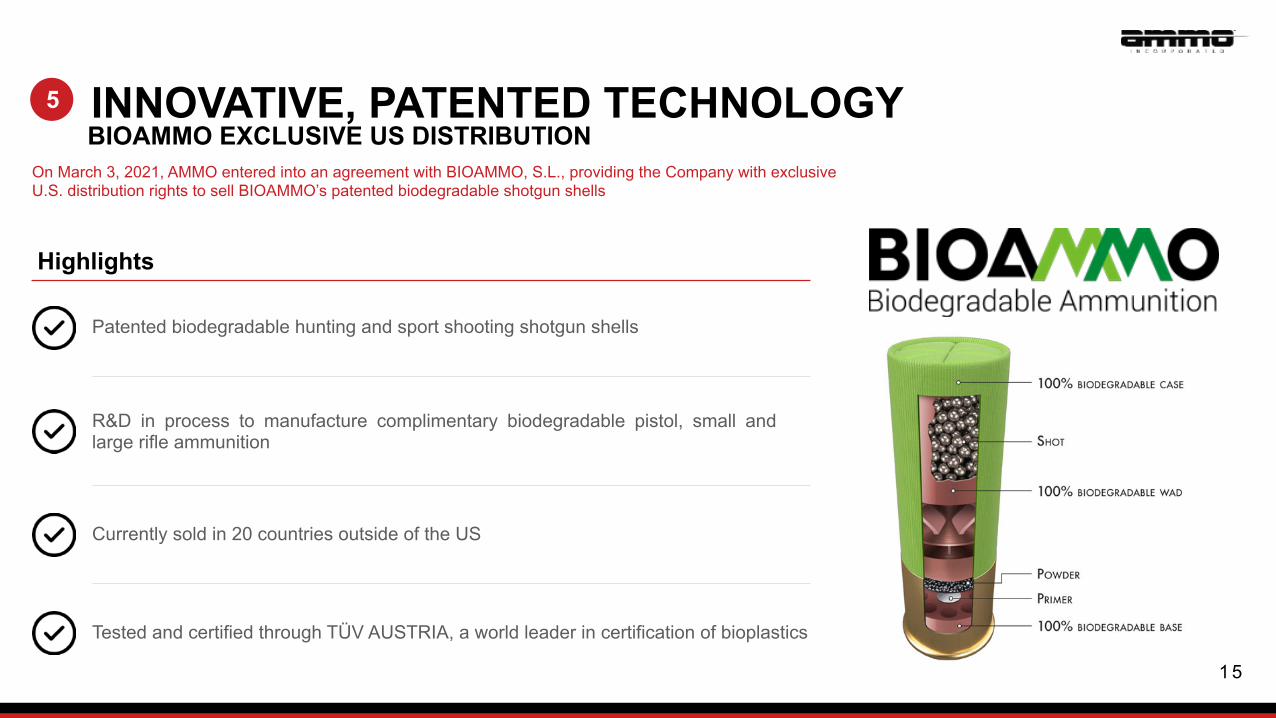
INNOVATIVE, PATENTED TECHNOLOGY BIOAMMO EXCLUSIVE US DISTRIBUTIONOn March 3, 2021, AMMO entered into an agreement with BIOAMMO, S.L., providing the Company with exclusive U.S. distribution rights to sell BIOAMMO’s patented biodegradable shotgun shells
Highlights
Patented biodegradable hunting and sport shooting shotgun shells
R&D in process to manufacture complimentary biodegradable pistol, small and large rifle ammunition
Currently sold in 20 countries outside of the US
Tested and certified through TÜV AUSTRIA, a world leader in certification of bioplastics
5
1 6
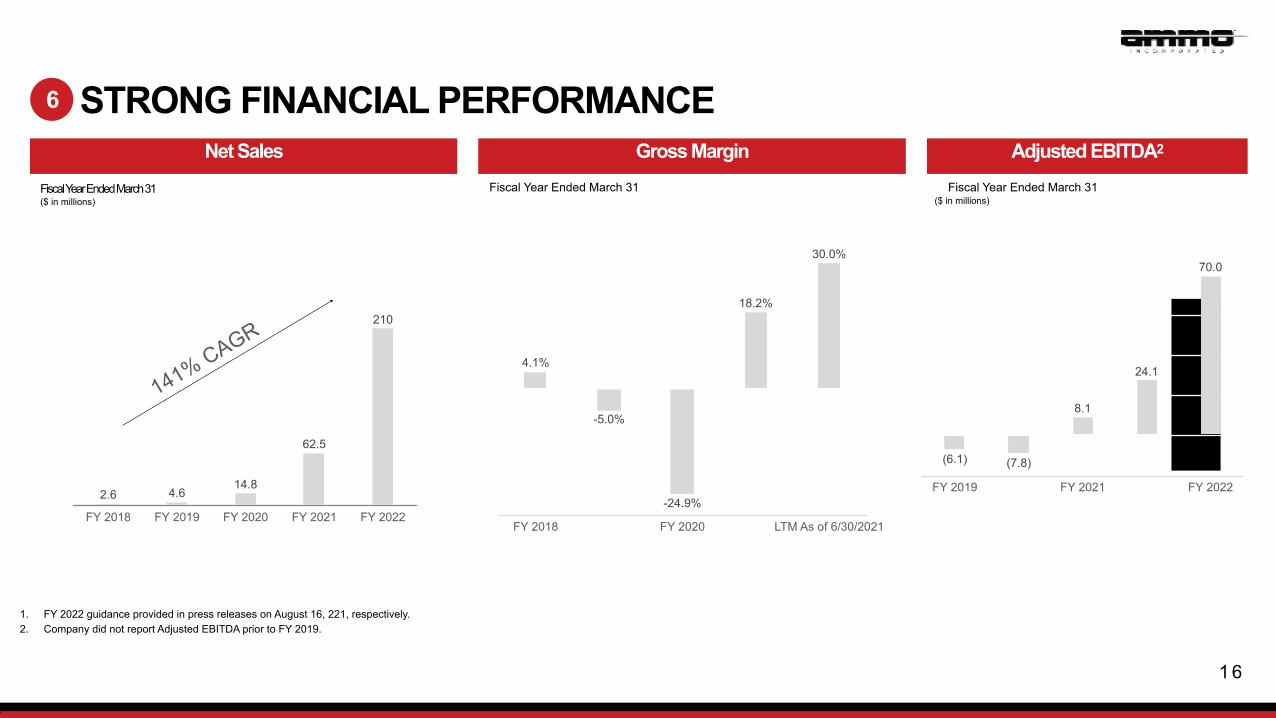
STRONG FINANCIAL PERFORMANCENet Sales Gross Margin Adjusted EBITDA2
Fiscal Year Ended March 31 Fiscal Year Ended March 31 ($ in millions)
Fiscal Year Ended March 31 ($ in millions)
Guid
ance
1
Guid
ance
1
1. FY 2022 guidance provided in press releases on August 16, 221, respectively. 2. Company did not report Adjusted EBITDA prior to FY 2019.
FY 2018 FY 2019 FY 2020 FY 2021 FY 2022
210
62.5
14.84.62.6
141% CAGR
FY 2018 FY 2020 LTM As of 6/30/2021
30.0%
18.2%
-24.9%
-5.0%
4.1%
FY 2019 FY 2021 FY 2022
70.0
24.1
8.1
(7.8)(6.1)
6
1 7
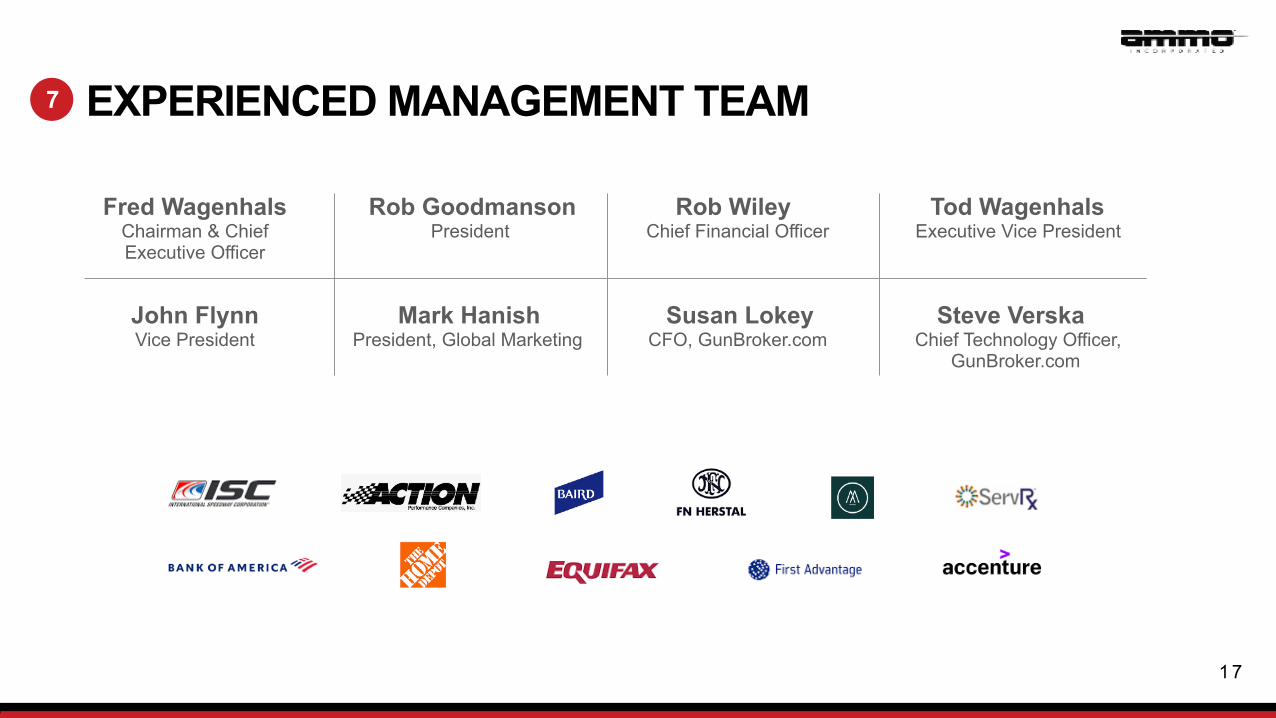
EXPERIENCED MANAGEMENT TEAM
Fred Wagenhals Chairman & Chief Executive Officer
Rob Goodmanson President
Rob Wiley Chief Financial Officer
Tod Wagenhals Executive Vice President
John Flynn Vice President
Mark Hanish President, Global Marketing
Susan Lokey CFO, GunBroker.com
Steve Verska Chief Technology Officer,
GunBroker.com
7
1 8
0
500,000
1,000,000
1,500,000
2,000,000
2,500,000
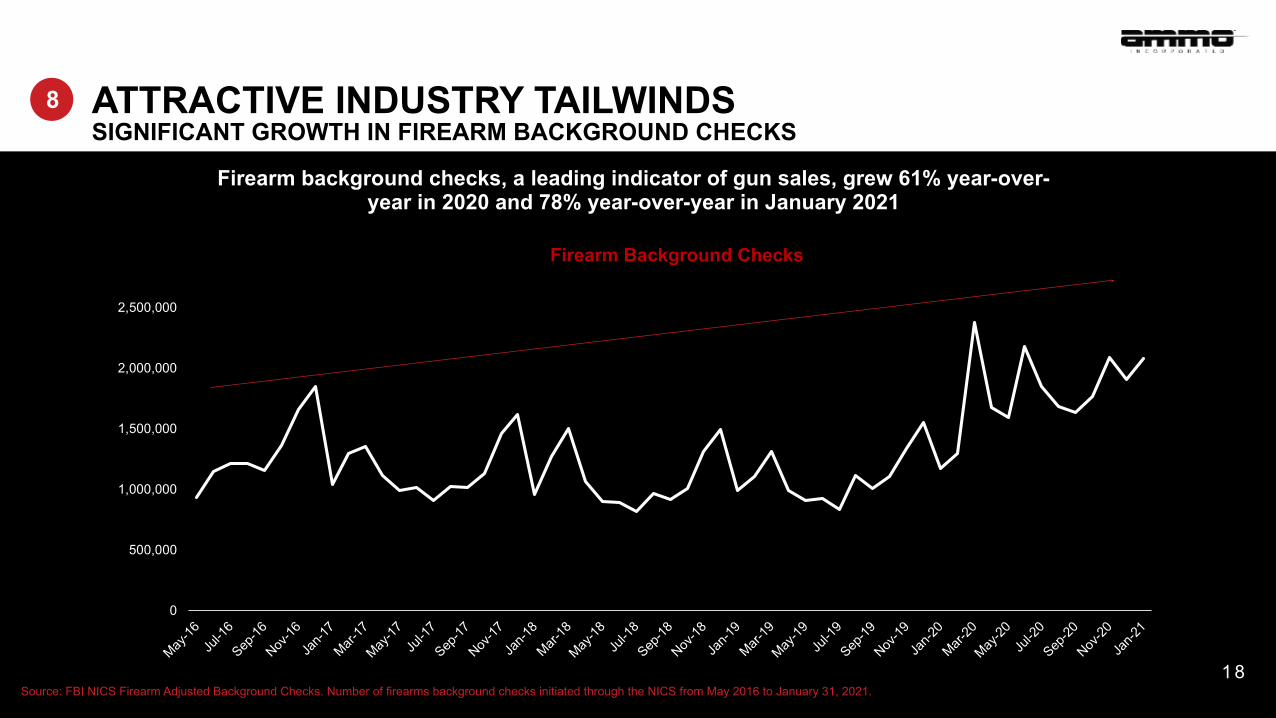
Firearm background checks, a leading indicator of gun sales, grew 61% year-over-year in 2020 and 78% year-over-year in January 2021
Source: FBI NICS Firearm Adjusted Background Checks. Number of firearms background checks initiated through the NICS from May 2016 to January 31, 2021.
Firearm Background Checks
1 8
ATTRACTIVE INDUSTRY TAILWINDS SIGNIFICANT GROWTH IN FIREARM BACKGROUND CHECKS
8
1 9
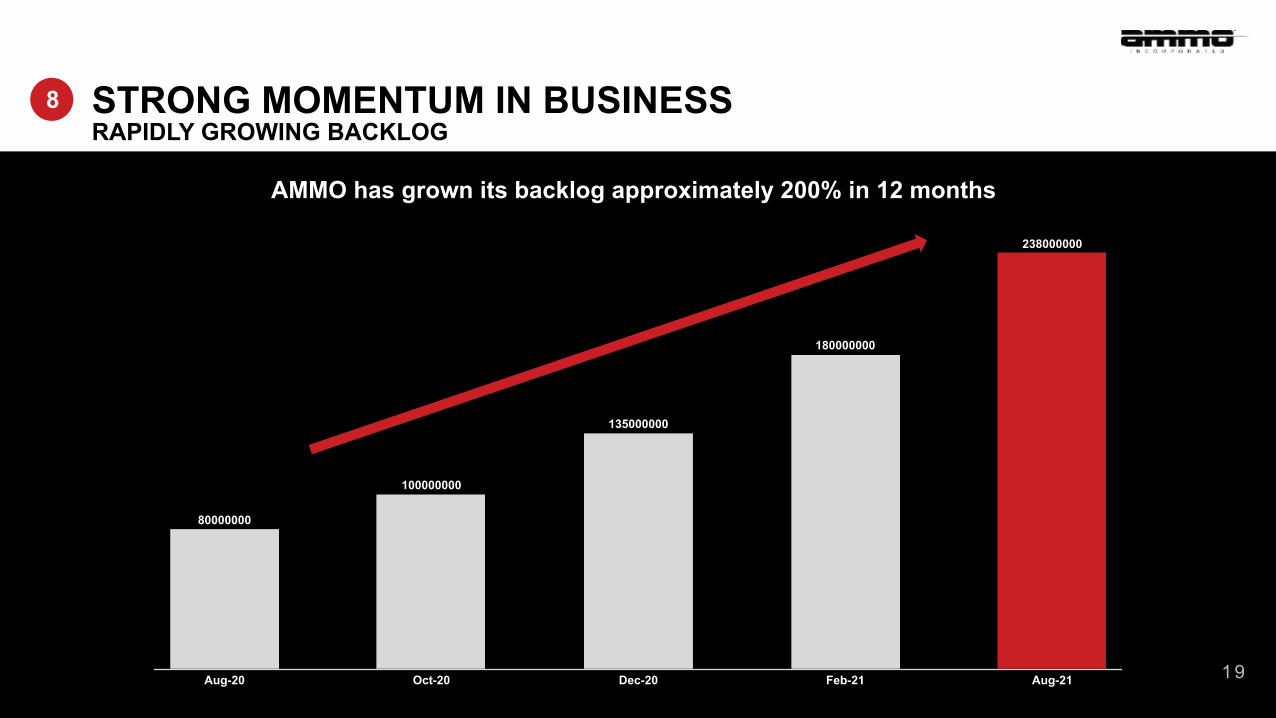
AMMO has grown its backlog approximately 200% in 12 months
Aug-20 Oct-20 Dec-20 Feb-21 Aug-21
238000000
180000000
135000000
100000000
80000000
1 9
STRONG MOMENTUM IN BUSINESS RAPIDLY GROWING BACKLOG
8
2 0
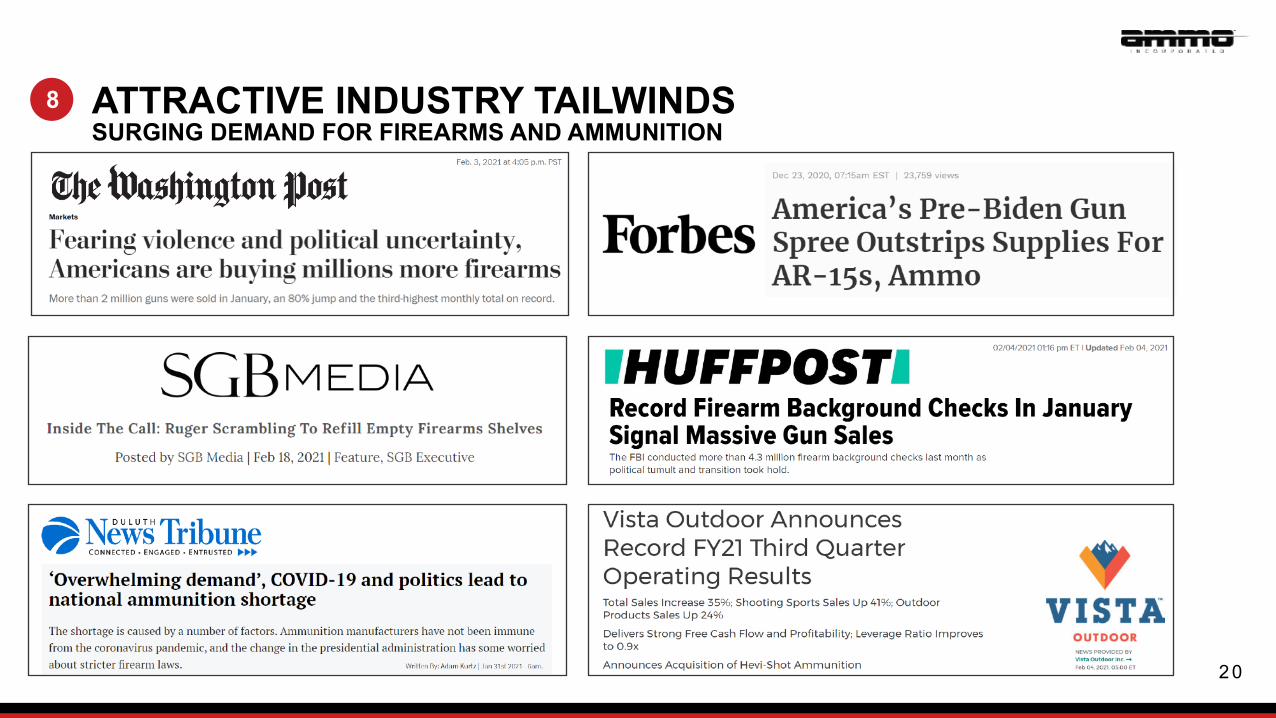
ATTRACTIVE INDUSTRY TAILWINDS SURGING DEMAND FOR FIREARMS AND AMMUNITION
8
2 1
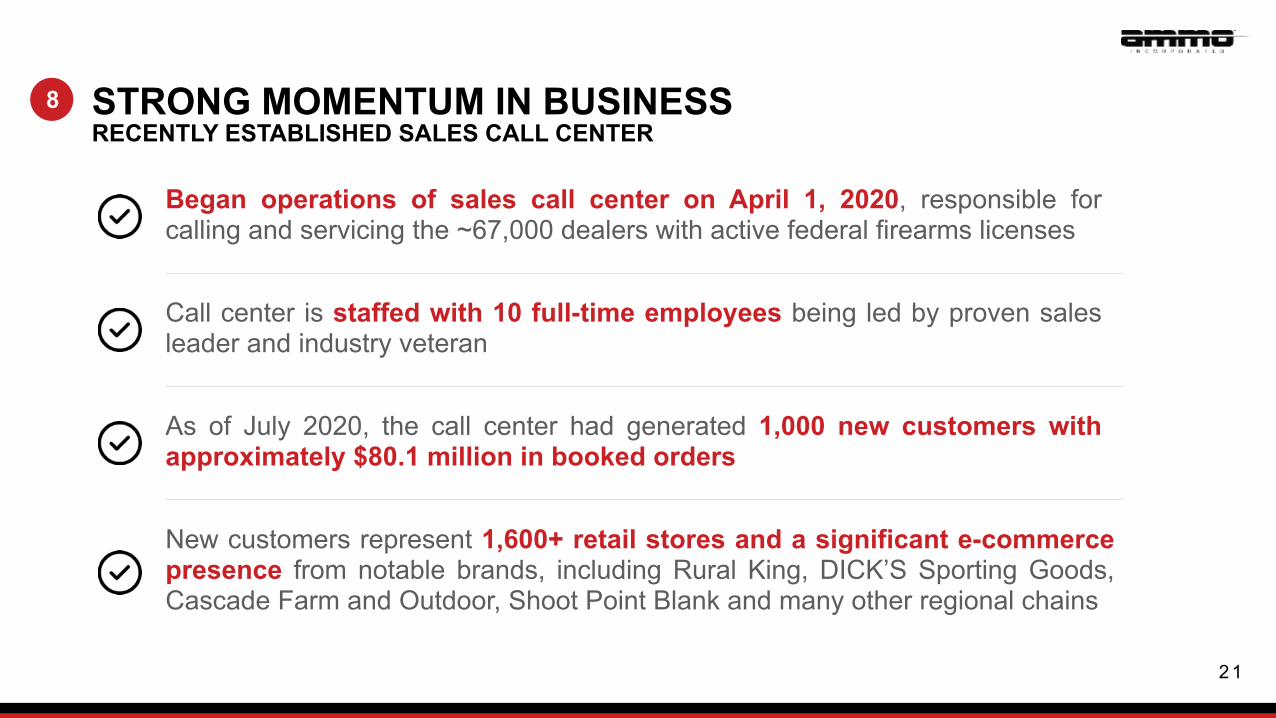
Began operations of sales call center on April 1, 2020, responsible for calling and servicing the ~67,000 dealers with active federal firearms licenses
Call center is staffed with 10 full-time employees being led by proven sales leader and industry veteran
As of July 2020, the call center had generated 1,000 new customers with approximately $80.1 million in booked orders
New customers represent 1,600+ retail stores and a significant e-commerce presence from notable brands, including Rural King, DICK’S Sporting Goods, Cascade Farm and Outdoor, Shoot Point Blank and many other regional chains
STRONG MOMENTUM IN BUSINESS RECENTLY ESTABLISHED SALES CALL CENTER
8
2 2
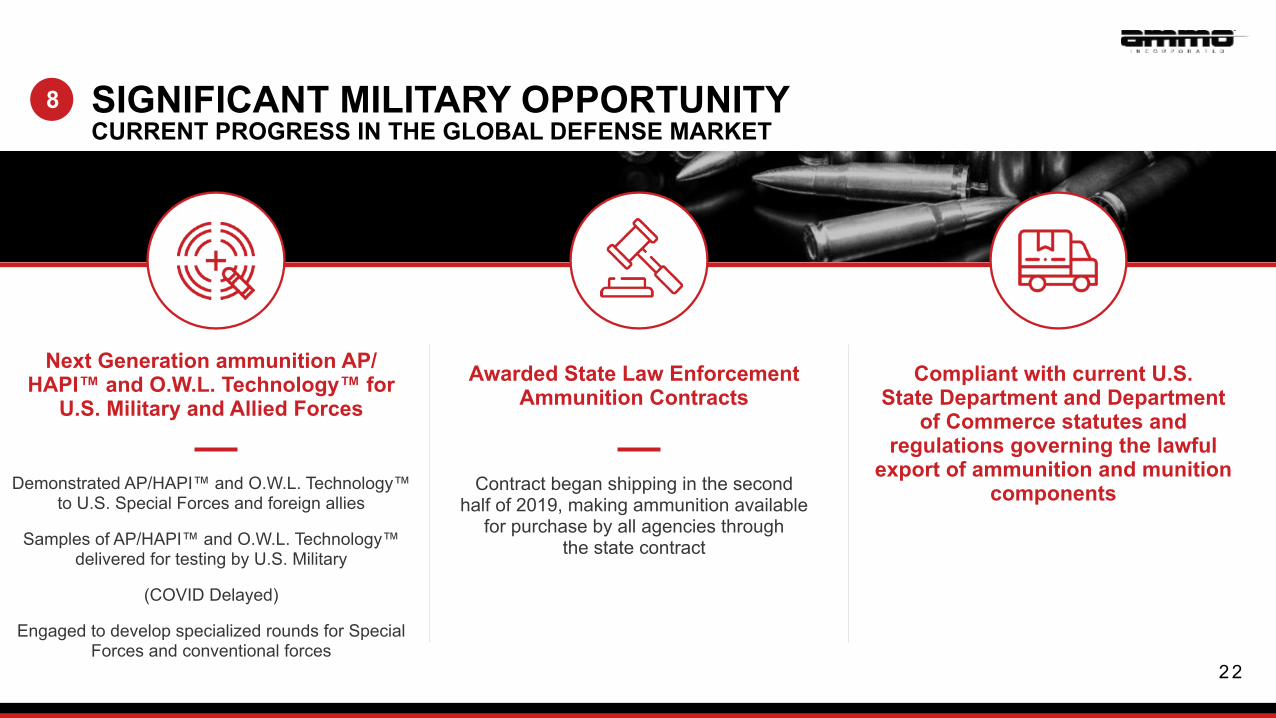
Next Generation ammunition AP/HAPI™ and O.W.L. Technology™ for
U.S. Military and Allied ForcesAwarded State Law Enforcement
Ammunition ContractsCompliant with current U.S.
State Department and Department of Commerce statutes and
regulations governing the lawful export of ammunition and munition
componentsDemonstrated AP/HAPI™ and O.W.L. Technology™ to U.S. Special Forces and foreign allies
Samples of AP/HAPI™ and O.W.L. Technology™ delivered for testing by U.S. Military
(COVID Delayed)
Engaged to develop specialized rounds for Special Forces and conventional forces
Contract began shipping in the second half of 2019, making ammunition available
for purchase by all agencies through the state contract
SIGNIFICANT MILITARY OPPORTUNITY CURRENT PROGRESS IN THE GLOBAL DEFENSE MARKET
8
2 3
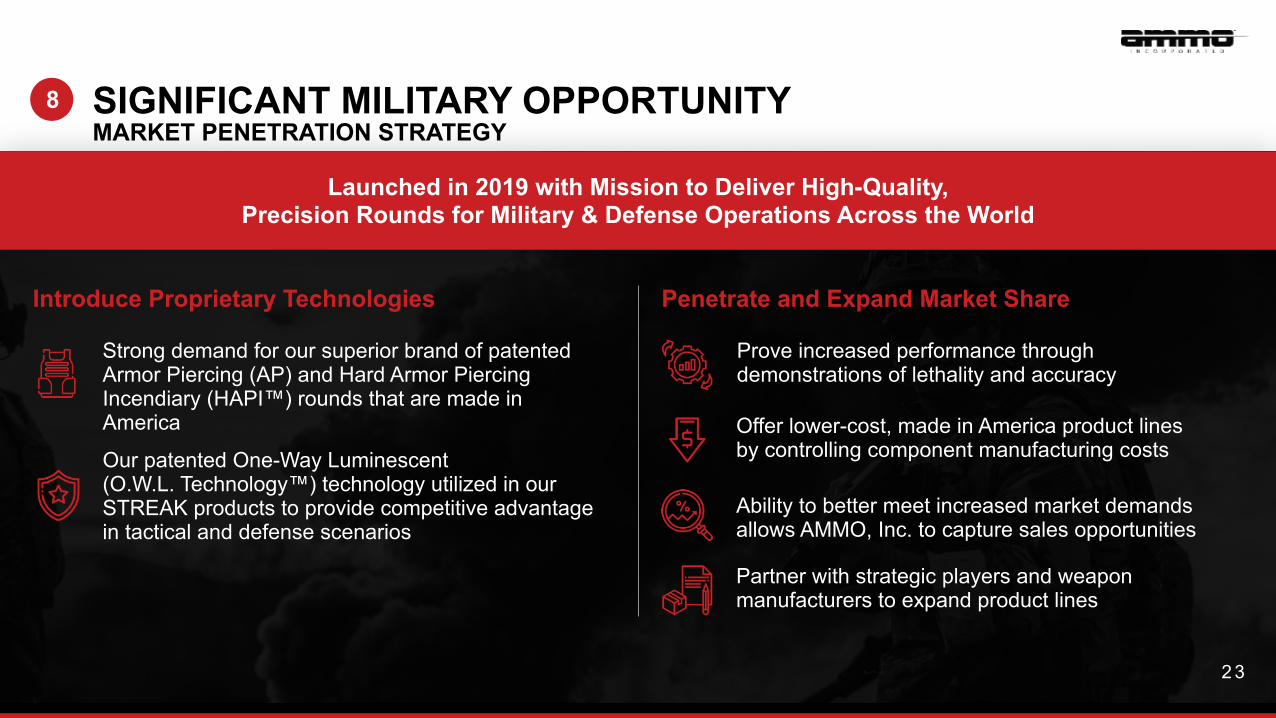
Launched in 2019 with Mission to Deliver High-Quality, Precision Rounds for Military & Defense Operations Across the World
Introduce Proprietary Technologies Penetrate and Expand Market Share
Strong demand for our superior brand of patented Armor Piercing (AP) and Hard Armor Piercing Incendiary (HAPI™) rounds that are made in America
Our patented One-Way Luminescent (O.W.L. Technology™) technology utilized in our STREAK products to provide competitive advantage in tactical and defense scenarios
Prove increased performance through demonstrations of lethality and accuracy
Offer lower-cost, made in America product lines by controlling component manufacturing costs
Ability to better meet increased market demands allows AMMO, Inc. to capture sales opportunities
Partner with strategic players and weapon manufacturers to expand product lines
2 3
SIGNIFICANT MILITARY OPPORTUNITY MARKET PENETRATION STRATEGY
8
A P P E N D I X
2 5
In addition to total net sales, net loss, and other results under generally accepted accounting principles (GAAP), the following information includes key operating metrics and non-GAAP financial measures we use to evaluate our business. We believe these measures are useful for period-to-period comparisons of the Company. We have included these non-GAAP financial measures in this presentation because they are key measures we use to evaluate our operational performance, produce future strategies for our operations, and make strategic decisions, including those relating to operating expenses and the allocation of our resources. Accordingly, we believe these measures provide useful information to investors and others in understanding and evaluating our operating results in the same manner as our management and board of directors. Adjusted EBITDA is a non-GAAP financial measure that displays our net loss, adjusted to eliminate the effect of certain items as described below. We have excluded the following non-cash expenses from our non-GAAP financial measures: depreciation and amortization, loss on purchase, share-based compensation expenses, and changes to the contingent consideration fair value. We believe it is useful to exclude these non-cash expenses because the amount of such expenses in any specific period may not directly correlate to the underlying performance of our business operations. Adjusted EBITDA as a non-GAAP financial measure also excludes other cash interest income and expense, as these items are not components of our core operations. We have not included adjustment for any provision or benefit for income taxes as we currently record a valuation allowance and have included adjustment for excise taxes. Non-GAAP financial measures have limitations, should be considered as supplemental in nature, and are not meant as a substitute for the related financial information prepared in accordance with GAAP. These limitations include the following: • Employee stock awards and stock grants expense has been, and will continue to be for the foreseeable future, a significant recurring expense in the Company and an important part of
our compensation strategy; • The assets being depreciated or amortized may have to be replaced in the future, and the non-GAAP financial measures do not reflect cash capital expenditure requirements for such
replacements or for new capital expenditures or other capital commitments; • Non-GAAP measures do not reflect changes in, or cash requirements for our working capital needs; and • Other companies, including companies in our industry, may calculate the non-GAAP financial measures differently or not at all, which reduces their usefulness as comparative
measures. Because of these limitations, you should consider the non-GAAP financial measures alongside other financial performance measures, including our net loss and other financial results presented in accordance with GAAP.
NON-GAAP FINANCIAL MEASURES
2 6
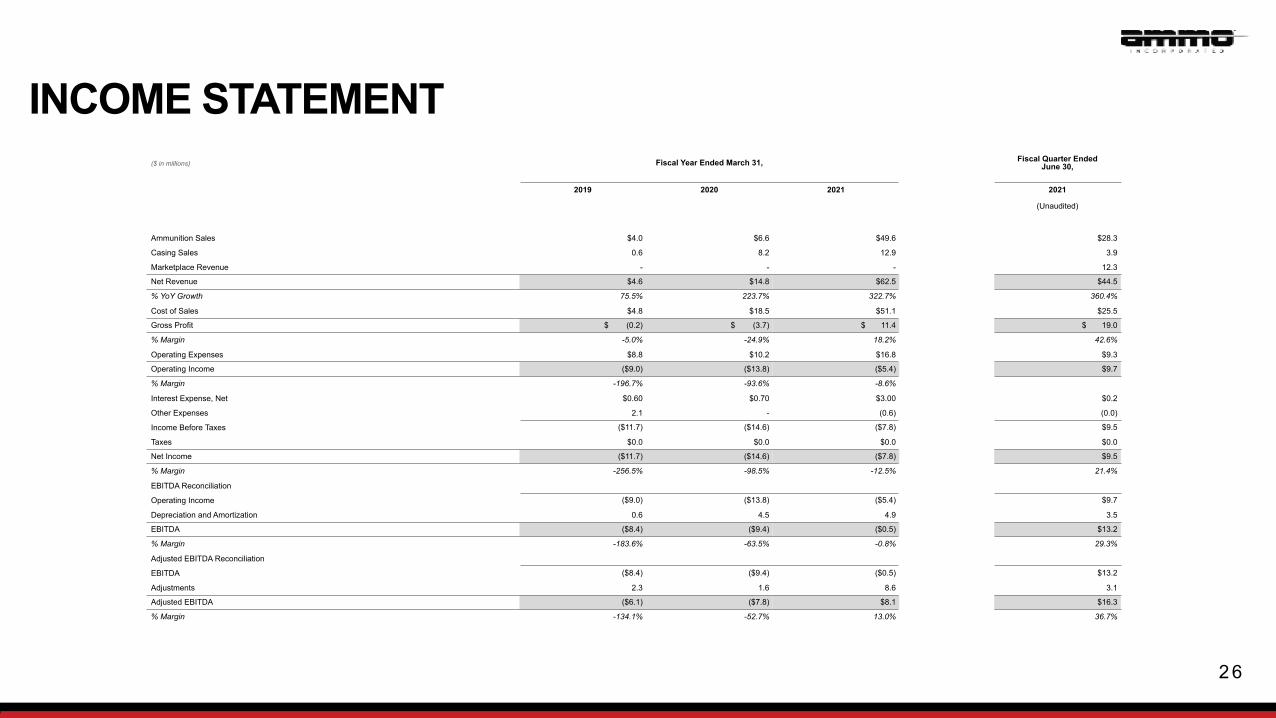
INCOME STATEMENT ($ in millions) Fiscal Year Ended March 31, Fiscal Quarter Ended
June 30,
2019 2020 2021 2021
(Unaudited)
Ammunition Sales $4.0 $6.6 $49.6 $28.3
Casing Sales 0.6 8.2 12.9 3.9
Marketplace Revenue - - - 12.3
Net Revenue $4.6 $14.8 $62.5 $44.5
% YoY Growth 75.5% 223.7% 322.7% 360.4%
Cost of Sales $4.8 $18.5 $51.1 $25.5
Gross Profit $ (0.2) $ (3.7) $ 11.4 $ 19.0
% Margin -5.0% -24.9% 18.2% 42.6%
Operating Expenses $8.8 $10.2 $16.8 $9.3
Operating Income ($9.0) ($13.8) ($5.4) $9.7
% Margin -196.7% -93.6% -8.6%
Interest Expense, Net $0.60 $0.70 $3.00 $0.2
Other Expenses 2.1 - (0.6) (0.0)
Income Before Taxes ($11.7) ($14.6) ($7.8) $9.5
Taxes $0.0 $0.0 $0.0 $0.0
Net Income ($11.7) ($14.6) ($7.8) $9.5
% Margin -256.5% -98.5% -12.5% 21.4%
EBITDA Reconciliation
Operating Income ($9.0) ($13.8) ($5.4) $9.7
Depreciation and Amortization 0.6 4.5 4.9 3.5
EBITDA ($8.4) ($9.4) ($0.5) $13.2
% Margin -183.6% -63.5% -0.8% 29.3%
Adjusted EBITDA Reconciliation
EBITDA ($8.4) ($9.4) ($0.5) $13.2
Adjustments 2.3 1.6 8.6 3.1
Adjusted EBITDA ($6.1) ($7.8) $8.1 $16.3
% Margin -134.1% -52.7% 13.0% 36.7%
2 7
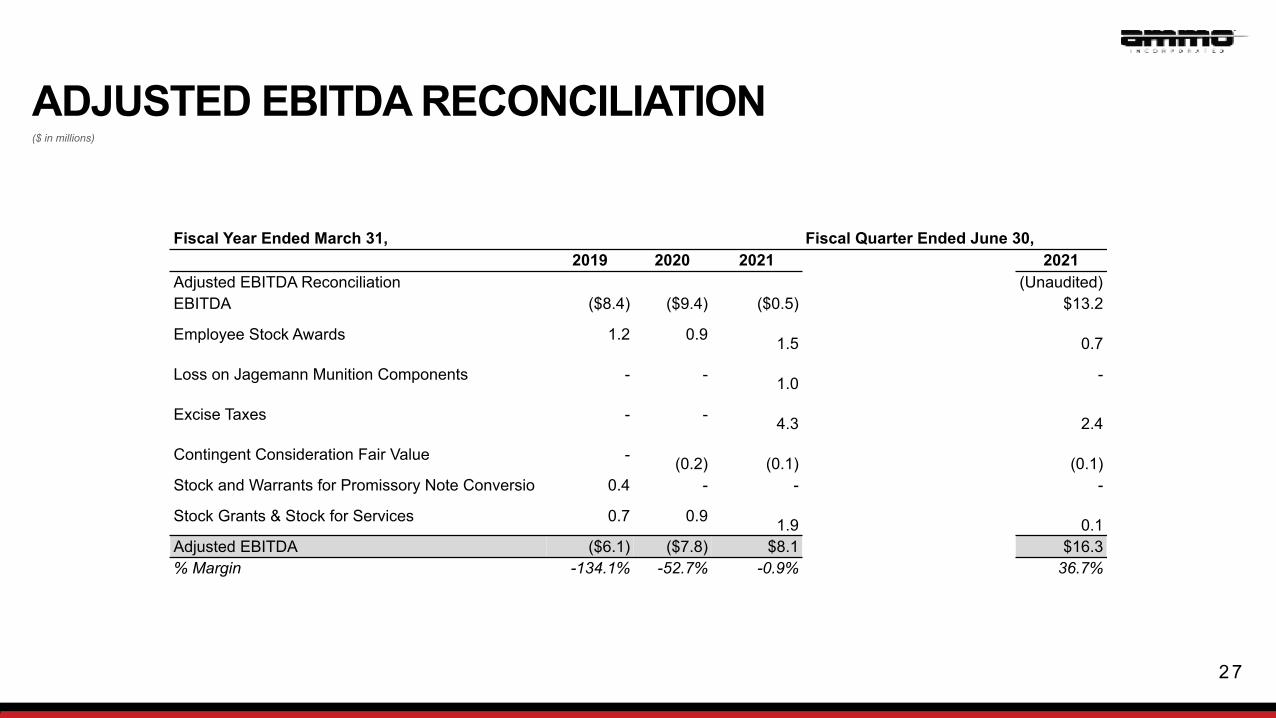
ADJUSTED EBITDA RECONCILIATION ($ in millions)
Fiscal Year Ended March 31, Fiscal Quarter Ended June 30, 2019 2020 2021 2021Adjusted EBITDA Reconciliation (Unaudited)EBITDA ($8.4) ($9.4) ($0.5) $13.2
Employee Stock Awards 1.2 0.9 1.5
0.7
Loss on Jagemann Munition Components - - 1.0 -
Excise Taxes - - 4.3
2.4
Contingent Consideration Fair Value - (0.2)
(0.1)
(0.1)
Stock and Warrants for Promissory Note Conversio 0.4 - - -
Stock Grants & Stock for Services 0.7 0.9 1.9
0.1
Adjusted EBITDA ($6.1) ($7.8) $8.1 $16.3 % Margin -134.1% -52.7% -0.9% 36.7%
2 8
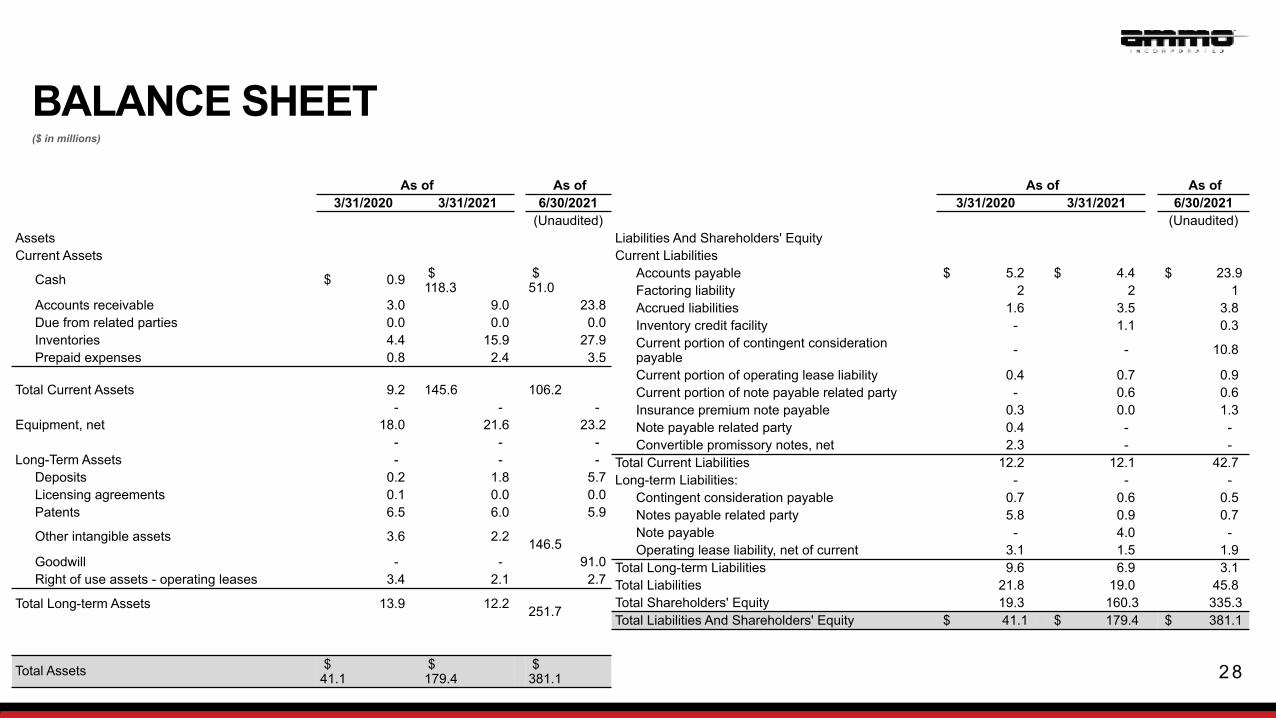
BALANCE SHEET ($ in millions)
As of As of 3/31/2020 3/31/2021 6/30/2021
(Unaudited)AssetsCurrent Assets
Cash $ 0.9 $ 118.3
$ 51.0
Accounts receivable 3.0 9.0 23.8 Due from related parties 0.0 0.0 0.0 Inventories 4.4 15.9 27.9
Prepaid expenses 0.8 2.4 3.5
Total Current Assets 9.2 145.6
106.2
- - - Equipment, net 18.0 21.6 23.2
- - - Long-Term Assets - - -
Deposits 0.2 1.8 5.7 Licensing agreements 0.1 0.0 0.0 Patents 6.5 6.0 5.9
Other intangible assets 3.6 2.2 146.5
Goodwill - - 91.0 Right of use assets - operating leases 3.4 2.1 2.7
Total Long-term Assets 13.9 12.2 251.7
Total Assets $ 41.1 $
179.4 $ 381.1
As of As of 3/31/2020 3/31/2021 6/30/2021
(Unaudited)Liabilities And Shareholders' EquityCurrent Liabilities
Accounts payable $ 5.2 $ 4.4 $ 23.9 Factoring liability 2 2 1 Accrued liabilities 1.6 3.5 3.8 Inventory credit facility - 1.1 0.3 Current portion of contingent consideration payable - - 10.8
Current portion of operating lease liability 0.4 0.7 0.9 Current portion of note payable related party - 0.6 0.6 Insurance premium note payable 0.3 0.0 1.3 Note payable related party 0.4 - -
Convertible promissory notes, net 2.3 - - Total Current Liabilities 12.2 12.1 42.7 Long-term Liabilities: - - -
Contingent consideration payable 0.7 0.6 0.5 Notes payable related party 5.8 0.9 0.7 Note payable - 4.0 -
Operating lease liability, net of current 3.1 1.5 1.9 Total Long-term Liabilities 9.6 6.9 3.1 Total Liabilities 21.8 19.0 45.8 Total Shareholders' Equity 19.3 160.3 335.3 Total Liabilities And Shareholders' Equity $ 41.1 $ 179.4 $ 381.1