ammonia sanitisation of human excreta - slu.sepub.epsilon.slu.se/2361/1/nordin_a_101005.pdf ·...
TRANSCRIPT

Ammonia Sanitisation of Human Excreta
Treatment Technology for Production of Fertiliser
Annika Nordin Faculty of Natural Resources and Agricultural Sciences
Department of Energy and Technology and
National Veterinary Institute Uppsala
Doctoral Thesis Swedish University of Agricultural Sciences
Uppsala 2010

Acta Universitatis agriculturae Sueciae
2010:67
ISSN 1652-6880 ISBN 978-91-576-7512-5 © 2010 Annika Nordin, Uppsala Print: SLU Service, Uppsala 2010
Cover photo and montage: Annika Nordin

Ammonia Sanitisation of Human Excreta. Treatment Technology for Production of Fertiliser
Abstract Safe reuse of plant nutrients from human excreta increases the sustainability of society and promotes health, both by decreasing disease transmission and by increasing agricultural production. This thesis examined ammonia sanitisation as a treatment method to produce a hygienically safe fertiliser from source-separated urine and faeces.
Salmonella spp. and E. coli O157:H7 were inactivated to a high degree even at low NH3 concentrations and temperatures. It was possible to model Salmonella spp. inactivation using these two parameters. Salmonella spp. inactivation is suggested to be verified by determining inactivation of faecal coliforms. Between NH3 concentrations 20 and 60 mM, a sharp decrease in inactivation was observed at 24 ºC or below for Enterococcus spp., bacteriophages and Ascaris eggs, with insignificant inactivation of the latter during 6 months.
Urine contains sufficiently high total ammonia concentration and pH for self-sanitisation. Keeping the urine as concentrated as possible proved critical in achieving NH3 concentrations that inactivated Ascaris eggs. Sun exposure increased urine temperature and NH3 and shortened treatment time, and is feasible when urine containers are small.
Urea treatment of faeces increased pH and total ammonia concentrations, both contributing to formation of NH3. The final value and stability of the pH achieved depended on initial pH and other material properties, but increased with increasing urea addition. At high pH caused by ash addition, urea was not degraded. When urea was added alone, it could not be confirmed that it was fully degraded. Organism inactivation was always faster in urea-treated faeces compared with untreated faeces. Urea treatment substantially shortened treatment time compared with storage, especially at the higher temperatures studied (24 and 34 ºC).
Sanitation systems that collect urine and faeces separate and sanitise them by ammonia permit a high degree of hygienically safe plant nutrient reuse.
Keywords: Ammonia, Ascaris, faeces, fertiliser, inactivation model, pathogen, Salmonella, sanitisation technology, sustainable sanitation, urine
Author’s address: Annika Nordin, SLU, Department of Energy and Technology, P.O. Box 7032, SE 750 07 Uppsala, Sweden E-mail: [email protected]

Dedication
Till Paloma och till minnet av mormor Elsa
As our circle of knowledge expands, so does the circumference of darkness surrounding it.
Albert Einstein

Contents
List of Publications 9
Abbreviations 12
Terms 13
1 Introduction 15
2 Objectives 17
3 Background 19 3.1 Human excreta as fertiliser 19
3.1.1 Closing the nutrient loop 19 3.1.2 Constraints with excreta-derived fertilisers 21
3.2 Pathogens in human excreta 22 3.3 Excreta treatment technologies 24
3.3.1 Disease transmission and prevention 24 3.3.2 Sanitation systems and excreta fractions 25 3.3.3 Faecal treatments 26
3.4 Evaluation of treatment efficiency 29 3.4.1 Model and indicator organisms 29 3.4.2 Process and product verification 31
3.5 Chemical disinfection with ammonia 33 3.5.1 Urea as a source of ammonia 33 3.5.2 Ammonia-ammonium equilibrium 33 3.5.3 Mechanisms of inactivation 35
4 Materials and Methods 37 4.1 Pathogens and indicator and model organisms 37 4.2 Treatment at constant temperatures 37 4.3 Urine treatment at varying temperatures 38 4.4 Microbial reduction kinetics 39
5 Results: Summary of Papers I-IV 41 5.1 Urine treatment 41
5.1.1 Ammonia and pH in urine 41 5.1.2 Temperatures at ambient exposure 42

5.1.3 NH3 formation in urine 43 5.1.4 Microbial inactivation 43
5.2 Urea treatment of faeces 46 5.2.1 Ammonia and pH in faecal treatments 46 5.2.2 NH3 formation in faecal treatments 48 5.2.3 Microbial inactivation 49
6 Results: Inactivation Models 51 6.1 NH3 and temperature-dependent Salmonella inactivation 51
6.1.1 Model aim and assumptions 51 6.1.2 Inactivation model 52
6.2 Inactivation of related organisms 55 6.2.1 Salmonella and E. coli O157:H7 55 6.2.2 Salmonella and Enterococcus 56
6.3 Shouldered inactivation of Ascaris eggs 57
7 Discussion 61 7.1 Organism inactivation 61
7.1.1 Salmonella 61 7.1.2 Enterococcus 64 7.1.3 Ascaris eggs 65 7.1.4 Bacteriophages 68
7.2 Achieving critical NH3 concentrations 70 7.2.1 pH 70 7.2.2 Ammonia nitrogen 71 7.2.3 Temperature 73
7.3 Ammonia sanitisation efficiency 74 7.3.1 Product and process verification 74 7.3.2 WHO guidelines and Ammonia sanitisation 76
7.4 Treatment implications 76 7.4.1 Source-separated urine 76 7.4.2 Faecal urea treatment 80 7.4.3 Sanitising other biomaterial 83
8 Systems for Excreta Reuse 85 8.1 Sanitation systems and excreta handling 86
8.1.1 Collection and primary treatment 86 8.1.2 Secondary treatment for fertiliser production 87
8.2 Excreta fertilisers 89 8.2.1 Nutrient content 89

8.2.2 Application 89 8.2.3 Fertiliser management 90
8.3 Sustainable sanitation and health 91
9 Conclusions 93
10 Future research 95
References 97
Acknowledgements 109


9
List of Publications
This thesis is based on the work contained in the following papers, referred to by Roman numerals in the text:
I Björn Vinnerås, Annika Nordin, Charles Niwagaba and Karin Nyberg (2008). Inactivation of bacteria and viruses in human urine depending on temperature and dilution rate. Water Research 42 (2008), 4067-4074.
II Annika Nordin, Karin Nyberg and Björn Vinnerås (2009). Inactivation of Ascaris eggs in source-separated urine and faeces by ammonia at ambient temperatures. Applied and Environmental Microbiology 75(3), 662-667.
III Annika Nordin, Charles Niwagaba, Håkan Jönsson and Björn Vinnerås (2009). Pathogen and indicator inactivation in source-separated human urine heated by sun. Submitted Manuscript.
IV Annika Nordin, Jakob R. Ottoson and Björn Vinnerås (2009). Sanitation of faeces from source-separating dry toilets using urea. Journal of Applied Microbiology 107(2009), 1579-1587.
Papers I-IV are reproduced with the permission of the publishers.
10
The contribution of Annika Nordin to the papers included in this thesis was as follows:
I Nordin and Vinnerås planned the study and Nordin, Niwagaba, Nyberg and Vinnerås performed it. Vinnerås and Nordin did the writing with revision by co-authors.
II Nordin and Vinnerås planned the study and Nordin and Nyberg performed it. Nordin and Vinnerås did the writing with revision by Nyberg.
III Niwagaba, Nordin, Jönsson and Vinnerås planned the study. Nordin and Niwagaba performed the study and did the writing with revisions by Jönsson and Vinnerås.
IV Nordin and Vinnerås planned the study and Nordin performed it. Nordin and Vinnerås did the writing with revision by Ottoson.
Papers I-IV are reproduced with the permission of the publishers.

11
Other papers produced but not included in the thesis:
V Jacob Ottoson, Annika Nordin, Dietrich von Rosen and Björn Vinnerås (2008). Salmonella reduction in manure by the addition of urea and ammonia. Bioresource Technology 99(6) 1610-1615.
VI Björn Vinnerås, Michael Hedenquist, Annika Nordin and Anders Wilhelmson (2009). Peepoo bag: self-sanitising biodegradable toilet. Water Science and Technology 59(9) 1743-1749.
VII Björn Vinnerås, Caroline Schönning and Annika Nordin (2006). Identification of the microbial community in biogas systems and evaluation of microbial risks from gas usage. Science of the Total Environment 367(2006), 606-615.

12
Abbreviations
Cfu Colony-forming unit
dsDNA Double-stranded deoxyribonucleic acid
EC The European Commission
E. coli Escherichia coli
E. faecalis Enterococcus faecalis
Ent. Coli Entamoeba coli
Pfu Plaque-forming unit
S. Typhimurium Salmonella enterica subspecies 1 serovar Typhimurium
SEPA The Swedish Environmental Protection Agency
spp. Sub-species
ssDNA Single-stranded deoxyribonucleic acid
ssRNA Single-stranded ribonucleic acid
TAN Total ammonia nitrogen
TN Total nitrogen
TS Total solids
TTC Total thermotolerant coliforms
UNICEF The United Nations Children’s Fund
USEPA U S Environmental Protection Agency
WHO World Health Organization

13
Terms
Censored value
The true value is below a value x (left censoring), but it is unknown by how much. Given as <x
NH3 In this thesis a short term for NH3 (aq), i.e. the concentration of un-ionised ammonia solved in liquid phase.
Pathogen Disease-causing microorganism
Sanitation Formulation and application of measures to protect human health from risks, microbiological, biological or chemical, related to hazardous waste
Sanitisation Disinfection, i.e. inactivation of microorganisms, not necessarily all, but to a level considered sufficient to protect human and animal health
t90, t99 etc. Time for decimal reduction, i.e. 1, 2 log10 reduction etc. derived from first order decay
Zoonose Microorganism capable of infecting humans and animals

14

15
1 Introduction
Sanitation of toilet waste has been hailed by the British Medical Journal as the greatest health breakthrough since 1840, greater than the discoveries of antibiotics, anaesthesia, vaccines and DNA. However, inadequate sanitation is still a major problem in low income countries and infectious diarrhoea accounts for more deaths than AIDS, malaria and measles combined (UNICEF/WHO, 2009). For example, nearly 80% of the 300 000 conflict-related deaths in Darfur were due to diseases associated with diarrhoea, not to violence (Degomme & Guha-Sapir, 2010), indicating that the impact from unsanitary conditions is even greater when healthcare infrastructure is lacking.
The number of people lacking ‘improved’ sanitation in 2004 was estimated to be 2.6 billion, i.e. 42% of the world’s population. These people mainly live in low and middle income countries (Rockström et al., 2005). According the Joint Monitoring Program (JMP) for Water Supply and Sanitation of WHO and UNICEF, excreta disposal systems are considered improved if they are private and if they prevent human contact with the excreta. This does not necessarily include any secondary treatment of the collected or sewer-transported excreta. On the global scale, only 330 million people, i.e. approximately 5%, are connected to an advanced sewage treatment facility (Ecosanres, 2005). However, even advanced secondary treatment is in many cases still a source of environmental pollution and water recipients are eutrophied with plant nutrients, even in high income countries such as Sweden (SEPA, 2008).
Human excreta contain millions of tons of fertiliser equivalents, 20 to 30% of what the global fertiliser industry produces annually, which to a large extent end up in water bodies via wastewater and surface runoff (Koné et al., 2010; Winker et al., 2009). Such misuse of plant nutrients from human excreta is currently a neglected aspect of health in relation to sanitation. In

16
low and middle income countries malnutrition constituted approximately 14% of the 2001 contribution to global burden of disease, measured as Disability Adjusted Life Years (DALYs), overshadowing the contribution from sanitation-related diseases, which constituted 3.4% (Lopez et al., 2006).
The use of plant nutrients from human excreta offers great potential to increase crop production and nutritional status in countries with limited use of other fertilisers (Winker et al., 2009). In sub-Saharan Africa, the annual excreta production corresponds to more than 100% of the local application of mineral fertilisers (Rockström et al., 2005). In China, where excreta reuse has long been widely practised, soil fertility has been maintained over millennia, despite high population densities (Bracken et al., 2007). However, such reuse has also resulted in a high prevalence of enteric pathogens in the population, with e.g. Ascaris being endemic (Xu et al., 1995; Ling et al., 1993).
Sustainable sanitation is a reuse-orientated sanitation approach which puts emphasis on sanitisation to develop hygienically safe, closed loop sanitation systems. According to Esrey (2001), a sustainable sanitation system is a system that: prevents disease and promotes health; protects the environment and conserves water; and recycles recovered nutrients and organic matter. The reuse concept, shifting from waste disposal to resource conservation and safe reuse, does not favour any specific sanitation technology and systems should be tailored to meet the needs of users and to the local conditions (Langergraber & Muellegger, 2005).
The main challenge for sustainable sanitation is effective pathogen destruction in order to prevent infectious disease transmission (Moe & Rheingans, 2006). The acceptance of sustainable sanitation, and thus its successful implementation, may depend on the safety of the reuse. Sanitisation technologies have to be diversified as well as refined to offer methods applicable in all different contexts. The 2.6 billion people to be served with improved sanitation will likely use on-site sanitation, the predominant option in low income countries (Koné et al., 2010). Low-cost sanitisation options for excreta that allow effective recycling of organic matter and nutrients have to be developed.
The ambition with this thesis was to assess and develop an excreta treatment method based on ammonia in order to permit safe nutrient recycling from human excreta.

17
2 Objectives
The general aim of this thesis was to examine the efficiency of ammonia sanitisation as a treatment method in order to produce hygienically safe fertiliser from human excreta. Specific research questions addressed were:
1. How do excreta characteristics affect the efficiency of ammonia
sanitisation? (Papers I-IV) 2. At what rates are pathogens, model and indicator organisms in source-
separated human urine and faeces inactivated in relation to ammonia concentration and temperature? (Papers I- IV)
3. Can organism inactivation in urine be enhanced by increased and varying temperature from sun exposure? (Paper III)
4. Is it possible to construct generalised models of ammonia-induced organism inactivation rates and their relation to each other and to inactivation factors? (Thesis)
5. What recycling systems, i.e. combinations of treatment techniques and applications are most appropriate, according to research questions 1-4 and current hygiene guidelines? (Thesis)

18

19
3 Background
3.1 Human excreta as fertiliser
3.1.1 Closing the nutrient loop
The recovery and use of human urine and faeces have been practised over millennia by almost all cultures and the practice has not been limited to agricultural production, but this has been the main application (Muskolus, 2008). Both the Aztec and Inca people collected and processed human excreta for agricultural use, especially for production of maize (Bracken et al., 2007). In Europe, from the Middle Ages up to the mid-19th Century cities became an important source of plant nutrients and urban sanitation benefited from this recognition and the use in agricultural production (Bracken et al., 2007).
Human excreta are the waste products of the human metabolism and, as the human organism has a limited maximum size, the nutrients excreted after adolescence generally balance those consumed (Jönsson et al., 2004). Urine is the route of excretion of metabolised food components, whereas the faeces are mainly composed of the indigestible parts of the food, e.g. cellulose and chitin, together with bacteria (Petersen, 2007).
In most low income countries, i.e. home to the majority of the world’s population, food production is mainly based on vegetal products and the removal of nutrients with the harvested crop constitutes a constant flow of plant nutrients from arable land. To maintain agricultural yields at high levels over the years, the nutrients removed by crops have to be replaced. Otherwise, there is an annual net loss of nutrients from the soil, which in some parts of Eastern Africa is as high as 60 kg of nitrogen per hectare and

20
year (Vinnerås et al., 2008). To close the nutrient loops of society, it is important that nutrients from human excreta are recycled.
Human excreta offer a complete source of plant nutrients, but the different origin and function of the urine and faeces influence their properties and use. Substances in urine, which have entered the metabolism, are water-soluble and readily plant-available (Kirchman & Pettersson, 1995; Lentner & Geigy, 1981). Substances in faeces are partly incorporated into bacterial cells and indigestible materials, which have to be mineralised to become plant-available (Winker et al., 2009; Hotta & Funamizu, 2007). The partitioning of plant nutrients between urine and faeces thus depends on the digestibility of the diet (Jönsson & Vinnerås, 2003). Urine is rich in nitrogen, which is frequently the most limiting nutrient for plant growth, while faeces are rich in phosphorus, potassium and recalcitrant organic matter, which can give substantial yield increases, especially on poor soils (Jönsson et al., 2004). Both fractions also contain micronutrients which, even if requirements are low, may be limiting for plant growth. Experience shows that it is beneficial for soil fertility to use both urine and faeces on the soil, but they can be used in different years and for different crops (Richert et al., 2010).
Source-separated urine is already in large-scale use (Jönsson & Vinnerås, 2007) and the composition of plant nutrients and their availability have been evaluated (Kirchman & Pettersson, 1995). Compared with mineral fertiliser, yields from urine application have been reported to be similar (Mnkeni et al., 2008), smaller (Richert Stintzing et al., 2001) and larger (Heinonen-Tanski et al., 2007; Pradhan et al., 2007). Such variance can be explained by many uncontrolled variables in the field. Compared with unfertilised crops, yields in all most all cases increased. Product qualities such as nutritional value, taste, etc. are similar for urine-fertilised and conventionally fertilised crops (Pradhan et al., 2007).
Use of separately collected human faeces as a fertiliser and soil conditioner has not been as thoroughly studied (Malkki, 1999). Kutu et al. (2010) observed increase in spinach yields only when faeces were applied in combination with urine. Morgan (2007) reported increased yields when using composted latrine compared with unfertilised crops. Guzha et al. (2005) reported improved soil qualities as well as increased maize yields from application of human faeces in combination with urine compared with only fertilising with urine. However, the long-term beneficial effects of compost in general on chemical and biological properties of soils have been extensively reported (Ouédraogo et al., 2001; Pascual et al., 1999; Gallardo-Lara & Nogales, 1987).

21
3.1.2 Constraints with excreta-derived fertilisers
As with all other fertilisers, continuous use of human excreta can pose a risk of accumulation of unwanted contaminants in agricultural soils. The contents of heavy metals in human excreta depend on the amounts present in food products consumed. Levels in urine are very low (Vinnerås et al., 2006; Jönsson, 2002; Jönsson et al., 1997), while for faeces they are usually lower than in chemical fertilisers and farmyard manure (Winker et al., 2009).
Hormones and pharmaceutical residues in human excreta are currently regarded as constraints on the use of human excreta as fertilisers. However, concentrations of hormones as well as pharmaceuticals, especially antibiotics, are larger or far larger in manure from domestic animals than in human excreta (Winker et al., 2008; Hammer & Clemens, 2007). However, a wider spectrum of pharmaceuticals is used for humans than for animals (Richert et al., 2010; Winker et al., 2008).
With wastewater discharged into aquatic environments, as is the most common practice today, sex disruption in wildlife and increased build-up of antibiotic resistance have been observed (Kim & Aga, 2007; Sumpter, 2005; Jobling et al., 1998). Although not fully confirmed several factors indicate that fertiliser use of human excreta would decrease such environmental effects from organic pollutants. Vegetation and soil microbes, in contrast to aquatic biota, have adapted to hormones from terrestrial mammals during the course of evolution. Pharmaceutical companies rely on a community of aerobic bacteria and fungi to purify process water (AstraZeneca, 2006). Similar, landfarming, a bioremediation method for soils with organic contaminants, is based on the indigenous soil flora in combination with enhancement of environmental factors such as nutrients, temperature, moisture, aeration etc. to degrade e.g. hydrocarbons (Marin et al., 2005). The higher density of microorganisms in soil, with roughly the same number per m3 soil as per km3 water (Lapygina et al., 2002; Jiang et al., 1992), makes the terrestrial environment a much more suitable recipient of human excreta than the aquatic environment.
The major factor restricting the use of human excreta as a fertiliser is the presence of disease-causing microorganisms, pathogens (Winker et al., 2009; Jimenez et al., 2007; Moe & Rheingans, 2006; WHO, 2006). Enteric infections can be caused by bacteria, viruses and parasites as protozoa and helminths resulting in high concentrations in the faeces whereas only a few pathogens are shed via the urine (WHO, 2006). Open defecation and disposal of untreated wastewater expose people and animals to pathogens mainly via contaminated water and food/feed sources. Similarly, the use of inadequately treated wastewater or toilet waste as a fertiliser is associated

22
with increased prevalence of e.g. intestinal parasitic infections (Moubarrad & Assobhei, 2007; Amahmid et al., 1999).
Since pathogens can be excreted at high concentrations, even without any symptoms of disease, unsanitised human excreta, especially faeces, must always be considered contagious and handled accordingly (WHO, 2006). Many excreta-related pathogens are zoonoses, i.e. they can infect a variety of species, including humans. Zoonoses constitute a special risk regarding reuse of excreta due to their potential adverse effect on animal health and livestock economy, and since a reservoir among wild animals may be impossible to eliminate (Albihn, 2002).
3.2 Pathogens in human excreta
Gastrointestinal infections constitute a great part of all infections (Lopez et al., 2006) and enteric pathogens can be found in high concentrations in faeces. In addition, organisms excreted with the mucus, e.g. Mycobacterium tuberculosis, can be swallowed and end up in the faeces (Vinnerås et al., 2008). Faecal cross-contamination during urine collection (Höglund et al., 1998) means that faecal pathogens have to be considered even with urine reuse (WHO, 2006). Such contamination increases with diarrhoeal disease and children using urine-diverting toilets (Jönsson et al., 2000). Only the bacteria Leptospira interrogans and the helminth Schistosoma haematobium, which is endemic in Africa, have urine as their main route of excretion. Salmonella typhi/paratyphi and Mycobacterium tuberculosis (Wilson & Gaido, 2004; Feachem, 1983) may appear in urine, but only on very rare occasions where the bacteria are disseminated in the blood or in cases of renal tuberculosis, respectively.
Globally, bacteria are the major agent causing gastrointestinal illness and many of the bacterial pathogens in faeces occur world-wide, such as Salmonella spp., Campylobacter spp., Yersinia spp. and verotoxin-producing E. coli, (VTEC). Where sanitation is poor, e.g. in low income countries, Salmonella typhi and paratyphi, Vibrio cholerae and Shigella spp. are common causes of diarrhoea (WHO, 2006; Ashbolt, 2004). Bacterial pathogens constitute the majority of zoonotic agents, and Salmonella spp. and VTEC are important zoonoses in livestock production (Albihn & Vinnerås, 2007).
Viruses are a major cause of gastrointestinal infections in developed countries (Svensson, 2000). The single most common cause of enteritis for children all over the world is rotavirus (Parashar et al., 2006). Viruses shed by faeces can be classified as enteropathogenic viruses, for which the gastrointestinal system is the principal site of infection (e.g. astroviruses,

23
caliciviruses and rotaviruses), and non-enteropathogenic viruses, which can occur in the intestinal tract but not in association with gastroenteritis (e.g. most adenoviruses, enteroviruses and hepatitis A/E viruses)(Guardabassi et al., 2003). Viruses are normally more stable in the environment than non spore-forming bacteria (WHO, 2006). A few viruses of the many excreted are considered to be zoonotic, e.g. hepatitis E infecting both humans and pigs (Vinnerås et al., 2008).
Parasites are responsible for the majority of enteric diseases in low income countries and the protozoa Entamoeba histolytica is an important cause of morbidity and mortality. However, Cryptosporidium hominis and Giardia intestinalis are also associated with water-borne outbreaks in high income countries (WHO, 2006). These three protozoan parasites are zoonotic, even though humans in most cases are the main reservoir (Venglovsky et al., 2006; Ashbolt, 2004; Bitton, 1999). Parasitic helminths, especially Ascaris lumbricoides and Trichuris spp. (whipworm), are common in rural regions with poor sanitation practices (Venglovsky et al., 2006). Helminths with a direct lifecycle, i.e. no intermediate hosts, are more likely to infect humans by either eggs (Ascaris, Trichuris, Hymenolepsis nana) or larvae (hookworms) than helminths with an indirect life cycle, e.g. Shistosoma (Bethony et al., 2006). However, the spread of zoonotic helminths, e.g. tapeworms of Taenia spp. causing cysterosis in cattle and swine, can affect animal health and meat quality and subsequently pose a risk of infection to humans consuming the meat.
Both viruses and parasites can infect at low doses, as low as 1 unit, and have a high tolerance to environmental factors, whereas bacterial pathogens may require a dose as high as 106 to result in infection. However, bacteria can multiply outside their host, i.e. increase in numbers in the environment. Some pathogens possess characteristics that limit their significance in waste and wastewater management. Schistosoma haematobium larvae have a survival span counted in days and preventing contact with their intermediate host, freshwater snails, for that time can prevent further transmission (Vinnerås et al., 2008). Campylobacter jujeni is a microaerophilic bacterium and thus sensitive to O2 levels and most other factors related to biological treatment, such as heating, drying and acids (Vinnerås et al., 2008).

24
3.3 Excreta treatment technologies
3.3.1 Disease transmission and prevention
When using excreta-derived fertilisers, health protection measures in different combinations can be used to reduce the health risks for consumers, workers, farmers and their families and local communities. Examples of health protection measures/barriers are: treatment to remove pathogens; restricted fertiliser application; post-harvest processing; food hygiene; etc. (WHO, 2006). Figure 1 depicts routes of disease transmission and different barriers that can be established to prevent transmission.
Faeces
Fields
Protection of water sources
Primary and secondary treatment
Washing facilities
Flies
Fingers
Fluids
Water disinfection
Personal hygiene
New host
Food
Foodhygiene
Processing
FaecesReuse
practicesFaeces
Fields
Protection of water sources
Primary and secondary treatment
Washing facilities
Flies
Fingers
Fluids
Water disinfection
Personal hygiene
New host
Food
Foodhygiene
Processing
FaecesReuse
practices
Figure 1. The F-diagram depicting transmission routes for pathogenic organisms from human excreta and restriction barriers for prevention of disease transmission.
Contaminated food/feed and water is the most common source of infection by excreta-related pathogens for both humans and animals. In addition to the faecal-oral transmission route, some parasites infect through skin penetration (hookworms), whereas others (Taenia spp.) infect when meat from infected intermediate hosts (pigs and cattle) is consumed.
Introducing zoonoses into animal production and the food chain increases the sources of pathogen exposure. Infected food products, e.g. egg, and milk, can contain the pathogen and products can also be contaminated with infected manure.

25
One of the simplest methods to mitigate the risk of spreading diseases, whether or not the excreta are used as fertiliser, is treatment. The earlier treatment takes place the better, as risks are then minimised for the following sequence of events posing a risk of disease transmission (Figure 1). There is no simple distinction between primary and secondary treatment for on-site sanitation systems. In this thesis, not considering systems connected to sewage plants, primary treatment is the collection system, and secondary treatment is post-collection when no more excreta material is added.
3.3.2 Sanitation systems and excreta fractions
In general, keeping the excreta fractions as concentrated as possible normally simplifies on-site treatment, as well as transport to central treatment. The exception is water-borne sewerage, which is a transport method, but results in contaminated water of very large volumes compared with the excreta it transports.
Urine collected separately is normally piped directly from the urine-diverting toilet or urinal to a collection tank or vessel, which can range in size from small jerry cans (Paper III) to hundreds of cubic metres (Münch & Winker, 2009). If urine is to be used in home gardens, sanitisation is not necessary (WHO, 2006). Separate long-term storage, based on the sanitising effect of ammonia, is the only large-scale secondary treatment of urine in use, as it is simple and cheap (Maurer et al., 2006). Volatile losses of nitrogen during urine storage have been estimated at less than 0.5% in a well-designed system (Jönsson et al., 2000), and otherwise the plant nutrients are retained in the urine solution. In addition to urine storage, there have been attempts to reduce the volume of urine fertiliser by drying or by extraction of solids such as struvite and isobutylaldehyde diurea (Maurer et al., 2006), as well as acidification of urine to inhibit urea degradation (Hellström et al., 1999).
Faeces can be collected at various degrees of dilution, with flushwater and also mixed with urine. Thus the resulting product can be a solid, a faecal sludge or latrine mix according to the water content. Along with the faeces, other substances can be found that affect the fertiliser value and treatment options available, e.g. inert material for anal cleansing such as stones and covering material such as ash and soil in the case of dry collection (Winker et al., 2009). There are several primary and secondary treatment options available, all of which have advantages and constraints and may affect the final nutrient content and plant availability of the excreta fertiliser (Jönsson et al., 2004). The choice of technology or sanitation system can be dictated by reuse objectives, but also by other factors such as ambient temperature, legal

26
restrictions or the availability of sufficient and reliable low cost energy (Koné et al., 2010). Common treatments for faeces, mainly collected separately from urine, are described below according to their sanitation efficiency, resulting plant nutrients and implementability.
3.3.3 Faecal treatments
Pathogens are inactivated in the environment over time depending on a combination of factors such as moisture, temperature, pH, carbon content and nutrient availability. Microbial competition for nutrients and antagonistic behaviour may also contribute to the reduction of pathogenic microorganisms (Semenov et al., 2007; Sidhu et al., 2001). The level of pathogen inactivation may however be slow and unreliable. In addition, changes in the external environment, e.g. seasonal shifts in temperature and humidity, can result in re-growth, with an increased number of pathogenic bacteria (Gibbs et al., 1997). In this thesis storage of faecal material, through which pathogen reduction is based on the factors described above, is not considered a sanitisation treatment.
Inactivation in relation to factors that are easily quantifiable, and in the best case controllable, offers the possibility to predict sanitation levels from sanitisation treatment in a way that cannot be done for storage. In general, most well-established excreta sanitisation methods are based on a few inactivation factors such as temperature, pH, moisture and ammonia.
Chemical sanitation – alkali
Addition of alkali such as ash and lime to the faeces during collection has great benefits, such as reduced smell and a reduction in flies. The sanitisation efficiency from alkaline additions is mainly from elevated pH but drying also contributes. A pH of 12 is recommended to inactivate Ascaris eggs, after 3 months storage (Eriksen et al., 1995), or in combination with an initial temperature increase from quicklime (CaO) of 55-70 ºC e.g. required for Class A biosolids (USEPA, 1994). To achieve such high alkaline pH by ash amendment, large amounts of ash may have to be added (Boost & Poon, 1998). The initial inactivation of pathogens may be very rapid due to a pH and temperature increase.
High pH leads to significant losses of gaseous ammonia and thus of nitrogen, resulting in decreased fertiliser value. However, ash is rich in potassium and phosphorus and ash- and lime-treated faeces increase soil buffering capacity and pH, which is often desirable. As a secondary treatment, nitrogen losses can be prevented if treatment is performed in

27
closed tanks, which have proven beneficial for hygiene since ammonia also contributes to sanitisation (Mendez et al., 2002).
Reaching the high pH necessary for sanitisation by alkali requires special handling to protect workers and the working environment.
Drying faeces
A moisture content below 30-40% is considered inhibitory for microorganisms in general, whereas eggs of Ascaris spp. are very tolerant to desiccation and can survive at a moisture content of 5% (Feachem, 1983). Desiccating toilets (also known as dehydrating or drying toilets) divert the urine from the faecal collection chamber and function best in arid climates, where dry ambient air can be circulated into the toilet chamber to remove evaporated moisture. This drying process usually takes several months to complete (Moe & Izurieta, 2003). Additives such as soil, sawdust, lime or ash also lower the moisture content and achieve sanitation due to a combination of decreased moisture content and alkaline pH.
In the drying process, some nitrogen is lost as ammonia and some organic matter degrades (Jönsson et al., 2004). However, losses depend on temperature, rate of drying and the resulting moisture level.
Composting
Composting is not a sanitation method per se – it is a temperature above 50 ºC that sanitises the material (Albihn & Vinnerås, 2007). The temperature and time relationships required to inactivate pathogens have been extensively examined (Haug, 1993; Mitscherlich & Marth, 1984; Feachem, 1983). However, in the composting process, prolonged pathogen survival despite a seemingly adequate temperature increase has been observed (Germer et al., 2010). Non-homogeneous temperature distribution may allow pathogen survival (Tonner-Klank et al., 2007) and re-growth in colder outer zones (Elving et al., 2009). Frequent turning of large-scale composts and insulation of small-scale composts can overcome such temperature distribution problems (Germer et al., 2010; Niwagaba et al., 2009; Vinnerås et al., 2003a). A substrate based entirely on faeces is often not enough to achieve high temperatures, although this is sometimes possible (Vinnerås et al., 2003a). Co-composting faeces with e.g. food waste can enhance the temperature development and its stability (Germer et al., 2010) and may be necessary when faeces have been collected during a long time period and/or are mixed with inorganic additives such as ash.
In successful composting, the combination of high temperature, pH and aeration can result in nitrogen losses of up to 94% (Lopez Zavala et al.,

28
2005). If urine is added to compost material most of its nitrogen, which is mainly in the form of ammonia, can be lost (Vinnerås et al., 2003a). Due to the low nitrogen availability of compost, it is normally used more as a soil conditioner than a fertiliser (Winker et al., 2009).
Composting is best applied as a secondary large-scale treatment where the process can be strictly managed. The use of small-scale composting for faecal sanitisation needs further development.
Anaerobic digestion
A thermophilic temperature (>45 ºC) (Sahlström et al., 2004) as well as a prolonged hydraulic retention time (Yen-Phi et al., 2009) have been proven to be beneficial for pathogen inactivation in anaerobic digestors. However, digestion above ambient temperature requires external energy and increases the demands on process monitoring. Small-scale digestion is most often performed at ambient (psycrophilic or mesophilic) temperatures, resulting in limited pathogen reduction, 1-3 log10 (Yen-Phi et al., 2009). High concentration ammonia digestion, 7 g N L-1 and pH 8, can improve pathogen inactivation in mesophilic reactors (Ottoson et al., 2008b) and the ammonia can be increased by including urine in the substrate. However, the methanogens have to be adapted, as otherwise the high ammonia will inhibit the process.
The majority of the plant nutrients are retained in the digestate, with 50-70% of the organic nitrogen degraded to ammonium (Jönsson et al., 2004).
Incineration of faeces
Ash from combusted faeces is a hygienic and concentrated fertiliser that is high in total phosphorus and potassium in particular, but essentially all nitrogen and sulphur are lost with the flue gases (Niwagaba et al., 2000). Furthermore, after incineration most of the phosphorus is no longer plant-available. Ash has a high pH and increases the buffering capacity of the soil.
Addition of ash, soil, lime or other cover materials can affect the incineration and additional fuel may be needed. Incineration of faecal matter is of limited interest as a low-tech sanitation method because the faecal material has to be dried to about 10% moisture content prior to combustion to prevent smell and smoke development (Niwagaba et al., 2000).
Chemical sanitation – ammonia
The ammonia nitrogen, NH3 (aq), in source-separated urine as well as other materials is recognised as being microbiocidal (Mendez et al., 2002; Höglund et al., 1998). Material can be supplemented with ammonia by the addition of
29
urea (Park & Diez-Gonzalez, 2003; Vinnerås et al., 2003b) or aqueous ammonia (Ottoson et al., 2008a; Pecson et al., 2007). Both these substances are able to give an alkaline pH, which is necessary to push the NH4
+/ NH3 equilibrium in solution towards NH3 (Emerson et al., 1975). The treatment time is dependent on the amount of NH3 (aq) formed and the temperature. Ammonia sanitisation of source-separated faeces within the ambient, sub-lethal, temperature range is examined in the present thesis.
The process resembles storage in that very little degradation of the faeces takes place and therefore neither organic matter nor nitrogen is lost, but the treatment, as well as storage before use as fertiliser, should take place in closed containers. The ammonium content of this sludge is higher than that of urine or digestion residue.
3.4 Evaluation of treatment efficiency
3.4.1 Model and indicator organisms
Sanitisation, treatment where pathogen concentrations are reduced to acceptable levels, is a necessary step towards safe reuse of human excreta (Moe & Rheingans, 2006). To assess sanitisation efficiency, pre- and post-treatment concentrations of pathogens can be analysed. However, it is normally not feasible to study inactivation regarding all pathogens that may be present due to limitations in time, cost or analytical methods.
A model organism can be studied to reach conclusions about other organisms having similar properties with respect to the inactivating agent. A studied pathogen can be considered as a model for other similar pathogens, e.g. strains of the same species or family. The use of bacteriophages, which infect bacterial cells, as a model for pathogenic viruses is common practice (Fraise et al., 2004), since they are easy to enumerate compared with human or animal viruses that require living tissue for cultivation.
Endogenous organisms, organisms that originate and are present in the biomaterial of concern, can be used to indicate the potential presence and/or decay of other similar, usually pathogenic, organisms. Faecal indicator organisms should ideally be present in high numbers in faeces and be easier to sample and measure than the actual pathogens (Bitton, 1999).
To evaluate treatment processes regarding sanitisation, both indicator and model organisms need to be equally or slightly more resistant than potential pathogens as well as representative in their mode of inactivation. Therefore it is important to differentiate indicator/model organisms as representatives of different groups of pathogenic organisms. It is preferable, but not always

30
possible, to use model and indicator organisms that are non- or only weakly pathogenic, e.g. bacteriophages.
Bacterial models
The most frequently used faecal indicator bacteria belong to Enterococcus and Enterobacteriaceae. Total thermotolerant coliform (TTC) count determines the presence and concentration of Enterobacteriaceae of faecal origin, i.e. faecal coliforms, and is to a large extent comprised of E. coli. Enterococci are a subset (E. faecalis; E. faecium; E. avium and E. gallinarum) of faecal streptococci. Belonging to the gram-positive bacteria, their cell wall offers more resistance to mesophilic temperature, disinfection and desiccation compared with gram-negative bacteria, to which most pathogenic bacteria belong (Bitton, 1999).
Salmonella is one of the most prevalent bacterial pathogens (Venglovsky et al., 2006). Its zoonotic properties, in combination with high survival and possible re-growth in the environment, make Salmonella spp. problematic for the use of biowaste as fertiliser. Salmonella are currently proposed for quality verification of sanitation fractions along with E. coli and Enterococcus spp. (SEPA, 2010).
Virus models
The use of bacteriophages as models for pathogenic viruses is common practice (Fraise et al., 2004). Somatic coliphages, f-specific RNA coliphages and phages that infect Bacteroides fragilis are candidate model phages for detection of faecal contamination in the environment (Havelaar et al., 1991). They are naturally present in faecal material. In contrast, Salmonella Typhimurium phage 28B (Lilleengen, 1948) is a phage that does not occur naturally in the environment. It has previously been used as a model for viral survival in anaerobic digestion processes (Sahlström et al., 2008) and for tracing groundwater contamination (Carlander et al., 2000).
Parasite models
Oocysts of Cryptosporidium spp. (Fraise et al., 2004) and eggs of Ascaris spp. and of Taenia are considered very resistant in the environment and to treatment and disinfection processes. Ascaris holds a special position both due to the persistence of the eggs but also due to being the most widespread helminth, with more than 25% of all humans infected (Quilès et al., 2006). Ascaris suum, which infects pigs, is often used as model for A. lumbricoides, which infects humans. The reason is that pigs are infected all around the world and eggs and worms are easily available at slaughter. Regarding

31
ammonia sanitisation, a comparison of A. suum and A. lumbricoides eggs, eggs from worm uteri and eggs extracted from faeces revealed equal inactivation, regardless of species or extraction method (Ghiglietti et al., 1995). Helminth eggs in general and Ascaris spp. in particular are used to monitor the hygienic quality of biowaste (Table 1).
3.4.2 Process and product verification
In Sweden, the hygiene quality of sewage fractions, e.g. sewage sludge, has previously not been regulated. However, in 2009 the Swedish government commissioned the Swedish Environmental Protection Agency (SEPA) to work out a proposal for a revised bylaw regarding the usage and disposal of sewage sludge. If accepted, the by-law is planned to take effect in 2012. Disease transmission is suggested to be controlled by treatment requirements, product requirements and application restrictions. Sanitation fractions spread on land have to meet product quality criteria regarding endogenous model organisms according to Table 1 (SEPA, 2010). However, excreta from single households that are used on the home property are exempt from the restrictions. For source-separated urine storage recommendations are given, almost identical to recommendations given by WHO (2006).
Table 1. Process and product verification measures based on reduction and concentration of the pathogens Salmonella spp. and Ascaris eggs and the indicator organisms Enterococcus spp. and Escherichia coli for sanitation fractions (SEPA, 2010), Class A sewage sludge (USEPA, 1994) and Category 3 ABP and animal manure (EC, 2006)
Regulation /guideline
Verification Salmonella E. coli Enterococcus Helminth eggs
SEPA 2010 Product 0 in 25 g ww <1000 g-1 TS <1000 g-1 TSa
EC 2006b Process 5 log10 red. 5 log10 red.c 3 log10 red.d
EC 2006b Product 0 in 25 g ww
USEPA 1994 Product <1000 g-1 TSe <1 in 4 g-1 TS
WHO 2006 Product <1000 g-1 TS <1 in 1 g-1 TS a Required only for the higher Category A sewage products. b Additional 3 log10 reduction in heat-resistant viruses, e.g. parvovirus, when relevant. c Specifically Enterococcus faecalis. d Specifically Ascaris spp. e Faecal coliforms.
On the global level, the WHO Guidelines for the safe use of wastewater, excreta and greywater in agriculture (2006) give sanitisation recommendations based on the health-based goal that the additional burden of disease from excreta reuse should not exceed a loss of 10-6 disability adjusted life years (DALYs), which is the level of protection already set for drinking water. Based on

32
microbial risk assessment, the guidelines stipulate a collective aim of reducing the potential pathogen load by 108 compared with fresh faeces. For urine the reduction is set to 104 based on the fact that pathogens mainly originate from faecal contamination. However, the pathogen reduction in excreta does not have to be achieved by treatment only, but can be the result of several health protection measures together, e.g. one month between fertiliser application and harvest is estimated to reduce pathogen exposure by 2 log10. Thus a 6 log10 and 2 log10 reduction in pathogens is the basis for suggested storage time for faeces and urine, respectively (WHO, 2006). With combinations of storage time and temperatures there are risks that pathogens may still remain, and crop fertilisation restrictions are suggested as an additional health protection measure.
Urine stored for at least 1 month at 4 ºC is assumed to still contain viruses and protozoa and should only be applied to food and fodder crops to be processed. Extending the storage time at 4 ºC to at least 6 months gives a similar risk as storage for at least 1 month at 20 ºC, i.e. only from viruses. Urine stored at those two temperature and time combinations is recommended for food crops to be processed and fodder crops, but use on pasture should be avoided. After more than 6 months at 20 ºC, urine can be used on all crops in combination with incorporation into soil for food eaten raw (WHO, 2006). SEPA (2010) urine recommendations are generally in line with the WHO guidelines, but add that with 6 months of storage at 4 ºC the fertilised fodder should not be harvested in the same calendar year. With 6 months of storage at 20 ºC the urine can be used in parks, while with storage for at least 1 year (no defined temperature) urine can be used with same restrictions as when stored for 6 months at 20 ºC (SEPA, 2010).
Faecal storage below 20 ºC for 1.5-2 years is assumed to totally eliminate gram negative bacterial pathogens and reduce protozoa and viruses to levels negligible for health risks, whereas helminth eggs may be present in low numbers. At temperatures above 20 ºC even Ascaris spp. eggs are assumed to be eliminated to negligible levels after 1 year. The WHO guidelines also give organism concentration levels for product verification (Table 1).
For comparison, the process and product quality of Class A sewage sludge stipulated by USEPA (1994), which was often referred to before 2006, as well as EC regulation No. 208/2006 regulating the hygiene quality of Category 3 animal by-products (ABP) and manure, are included in Table 1. The SEPA (2010) by-law recommends that treatments for sanitisation of sewage fractions are harmonised with treatments accepted for animal by-products by the Swedish Board of Agriculture based on EC regulation No. 208/2006.

33
3.5 Chemical disinfection with ammonia
Virtually all organisms generate ammonia as a by-product of the metabolism of nitrogenous compounds, e.g. proteins. Depending on concentration and ionisation, ammonia can serve as beneficial nutrient or toxic agent to microorganisms. The toxic effects from unionised ammonia (NH3) on several types of organisms have long been known, whereas ammonium ions (NH4
+) are tolerated by most organisms, even at high concentrations (Warren, 1962).
3.5.1 Urea as a source of ammonia
When nitrogen is excreted from the human body with the urine, approximately 80% is in the form of urea (CO(NH2)2) and 7% as ammonia/ammonium (Lentner & Geigy, 1981). Biofilms of urease-producing bacteria in U-bends, pipes and tanks degrade urea into ammonia within sanitation systems (Jönsson et al., 2000) and thus 92-99% of the nitrogen in the source-separated urine consists of ammonia nitrogen (Heinonen-Tanski et al., 2007; Udert et al., 2003a). The decomposition of urea results in an alkaline pH (Eq. 1), which affects the equilibrium between ammonia and ammonium (Eq. 2). Adding urea to faecal material results in the same decomposition products as in urine (Eq. 1).
CO(NH2)2 + 3 H2O 2 NH4
+ + OH- + HCO (Equation 1)
Unionised ammonia, NH3, is the main component sanitising the urine, but the carbonates formed from urea decomposition (Eq. 1) have also been suggested to contribute to pathogen inactivation, when in the ionic form of CO3
-2 (Park & Diez-Gonzalez, 2003). The carbonate equilibrium is, similar to the ammonia/ammonium equilibrium, pH and temperature-dependent.
The pH usually stabilises around 9.0 when urea decomposes (Hellström et al., 1999). Due to the pKa of carbonic acid (6.35 and 10.33) and ammonium (9.25), a pH of 9.0 at 25 ºC gives 36% of TAN as NH3 compared with 4.5% of total carbonates as CO3
-2. Adding aqueous ammonia solution to a substrate only adds ammonia (NH3 and NH4
+) and the pH stabilises around 10.
3.5.2 Ammonia-ammonium equilibrium
Ammonia gas, NH3, is highly soluble in water, which is partly explained by its polarity and ability to form hydrogen bonds. The solubility of NH3 (aq) in liquids is temperature-dependent and the ratio can be calculated by Henry’s law constant H (Eq. 2). Since the amount of dissolved NH3 (g) is directly proportional to the partial pressure of NH3 (g) above the solution,
Urease

34
ventilation and head space volume affect the NH3 (g) solute concentration. The exchange to air is not calculated in this thesis and chemical tables are recommended for equations on Henry’s law constant.
NH3 (gas) ↔ NH3 (aq) + H2O (l) ↔ NH4
+(aq) + OH-(aq) (Equation 2)
In solution, ammonia acts as a weak base, producing hydroxide ions by the de-protonation of water (Eq. 2). The relationship between dissolved ammonia, NH3 (aq), and ammonium ions, NH4
+ (aq), is quantified by the dissociation constant, Ka. The pKa of ammonia/ammonium within the temperature range 0-50 °C can be calculated by Equation 3 (Emerson et al., 1975), where T is the temperature in degrees Kelvin. The temperature dependence of the dissociation constant gives pKa, i.e. the pH at which the base and its conjugated acid are present in equal concentrations, of 9.9, 9.6, 9.3 and 9.0 for the temperatures 4, 14, 24 and 34 °C respectively.
pKa = 2729.92 / T + 0.090181 (Equation 3)
fNH3 = 1 / (10pKa-pH + 1) (Equation 4)
The fraction present as NH3 in aqueous solution can be calculated according to Equation 4, and is thus affected by pH and temperature. With increasing pH or temperature, or both, the fraction of dissolved ammonia NH3 (aq) increases. The influence of temperature has a larger impact at moderately alkaline pH (8-10), whereas at pH 11 more than 90% of the ammonia is present as NH3, regardless of temperature (Figure 2).
Throughout this thesis, the term ammonia is used when talking about the compound in general and not necessarily to distinguish between the unionised and ionised form. To avoid ambiguity when important for interpretation, the chemical speciation is given by the chemical formula, NH3 and NH4
+, whereas the terms total ammonia and total ammonia nitrogen (TAN) refer to the sum of NH3 and NH4
+ species. From here on uncharged ammonia in solution is given as NH3 without the (aq) denotation. The NH3 concentration is given as mM and 1 mM is equivalent to 14 mg N L-1.
Kb H

35
4035
3025
2015
105 8
8.59
9.510
10.511
0
10
20
30
40
50
60
70
80
90
100
NH3 (%)
Temperature(°C) pH
Figure 2. Fraction of total ammonia present as NH3 (aq) at combinations of pH 8-11 and temperatures 5-40 °C.
3.5.3 Mechanisms of inactivation
The mechanism and action of ammonia as a disinfectant are not totally clear. The small size of the ammonia molecule and its high solubility, not only in water but also in lipids, may enhance transport over membranes and other cellular barriers by simple diffusion.
In contact with bacterial cells, ammonia (NH3) may act as a uncoupler, destroying the membrane potential, as well as denaturing bacterial membranes and cell proteins (Bujozek, 2001). When ammonia gas enters the cell it may cause damage by rapid alkalinisation of the cytoplasm (Diez-Gonzalez et al., 2000). Consequently, to maintain optimum internal pH, the cell takes up protons from the outside but sacrifices potassium ions (K+) instead and the loss of this essential substance eventually leads to death of the bacterial cell (Bujozek, 2001).
The proposed inactivation mechanism for poliovirus and bacteriophage f2 in relation to ammonia is cleavage of the RNA in intact particles with otherwise little structural alteration (Burge et al., 1983; Ward, 1978).

36
37
4 Materials and Methods
4.1 Pathogens and indicator and model organisms
The bacterial pathogens used in Papers I, III & IV were Salmonella enterica subspecies 1 serovar Typhimurium (Salm. Typhimurium CCUG 42744 and a sewage isolate of phage type 178) and Escherichia coli O157:H7 (ATCC 25922). Enterococcus faecalis (ATCC 29212) together with Enterococcus spp. of excreta origin were studied as indicator bacteria.
As models for human viruses, three different bacteriophages were studied, Salm. Typhimurium bacteriophage 28B (Lilleengen, 1948), enterobacteria phage MS2 (ATCC 15597-B1) and coliphage Φx 174 (ATCC 13706-B1), chosen to represent dsDNA, ssRNA and ssDNA genome constitutions (Papers I, III & IV).
Eggs of Ascaris suum, harvested by dissection of the uterus of worms collected from the intestine of slaughterhouse pigs and studied in permeable nylon bags, represented a persistent helminth parasite. The Ascaris eggs were studied with respect to their ability, after interrupted treatment, to develop into infective larval stages under favourable conditions (Paper II).
4.2 Treatment at constant temperatures
The urine used in studies conducted at constant temperatures originated either from a source-separating, low-flush, sanitation system (approximate dilution 1:1) or was collected directly from persons in a single household. The latter was used for evaluation of influences from the degree of dilution with flushwater. Urine was studied at 1:0, 1:1 and 1:3 dilutions with water at constant temperatures 4, 14, 24 and 34 °C. The 12 treatment combinations were studied with respect to all mentioned organisms and

38
incubated in either 500 mL plastic flasks or 50 mL centrifuge tubes (Papers I & II).
The faecal matter was from two sources: collected from mainly men in their late teens or early twenties doing their military service and from faecal bins in a housing area using dry urine-diverting toilets. The water content was set to 80-83% before the studies. Faecal material was treated with urea from 0.5 to 2% addition (w/w) at constant temperatures 14, 24 and 34 ºC, although not all concentrations were studied at all temperatures (Paper IV). For inactivation of Ascaris suum eggs in faeces, two additional treatments were studied at 24 and 34 °C: addition of ash (0.1 L per 100 g faeces), studied as the sole treatment and also in combination with 1% urea. The amendment simulated the use of ash for surface coverage during collection (Paper II). Salmonella and Enterococcus spp. were studied for most of the combinations of treatments and temperatures, whereas Ascaris suum eggs and the Salm. Typhimurium phage 28B were studied only at 24 and 34 ºC. The faecal material was studied in soft plastic containers, 200 g each (Papers II & IV).
Studies were performed with respect to pH, ammonia and organism inactivation. At constant temperatures, inactivation of all organisms was also studied in ammonia-free controls (physiological saline solution, 0.8-0.9% NaCl) (Paper I).
4.3 Urine treatment at varying temperatures
A two-step study was conducted to evaluate the possibilities to enhance urine storage treatment in a tropical climate by increasing temperature through solar exposure. In a field study in Kampala, Uganda, urine from source-separating, no-flush, sanitation systems was exposed to three different ambient conditions in 10 L yellow plastic jerry cans: outdoors exposed to full sun; outdoors adjacent to a brick wall, partly in sun, and indoors in a room. The urine was studied with respect to temperature development, pH, ammonia and inactivation of all organisms initially mentioned, except for bacteriophages (Paper III).
Following the field study, a complementary laboratory study was performed in Sweden, using an incubator programmed to mimic the natural temperature fluctuations of a mean day at the full sun location in the field study in Kampala. In Sweden, urine was collected fresh and ammonia adjusted to approximately the same concentration as in the field study. In the complementary study all organisms mentioned above were studied, as well as pH and ammonia (Paper III).

39
4.4 Microbial reduction kinetics
Bacteria and phage inactivation was tested against the hypothesis of a first order exponential decay function Nt = N0 e
kt, which was used for deriving the reduction kinetics when only minor deviations were observed (Papers I, III & IV).
For observations where non-detection (ND) concentrations (1 pfu/10 cfu mL-1 urine or 10 pfu/100 cfu g-1 faeces) gave higher inactivation rate, i.e. steeper slope on the inactivation function, the ND limit value was included in the regression data resulting in censored t90 values (Paper I & IV). This was mainly observed for Salmonella spp.
In order to avoid overestimating the sanitation of bacteriophages MS2 and Φx 174, which both showed biphasic inactivation patterns with initially fast reduction followed by slower reduction after a breakpoint, the first phase was excluded from the data set when fitting the function of inactivation (Paper I).
For estimates of t99 from Ascaris data in Paper II, treatments with a lag phase were divided into two linear inactivation functions and the time for total inactivation of counted eggs (almost 103) approximated to represent a 2 log10 reduction. When Ascaris egg inactivation was monitored by frequent sampling in Paper III, a model for shouldered inactivation (Eq. 5) was used for estimating the time for a 3 log10 egg inactivation empirically.
Nt = N0 (1-(1-ekt)m) (Equation 5)
An empirical value, m, is used to determine the lag period (lag period = ln (m)/-k) and k is the first order rate constant.

40

41
5 Results: Summary of Papers I-IV
5.1 Urine treatment
5.1.1 Ammonia and pH in urine
When urine were freshly collected in Sweden, the undiluted urine, after enzymatic degradation with urease, had a total ammonia nitrogen (TAN) concentration of 6.0 0.3 (Paper I) and 6.6 0.8 g L-1 (unpublished data). This was considerably higher than in urine collected from the no-flush sanitation system in Kampala, Uganda, which had a TAN concentration of 4.2±1.5 g L-1 urine (Paper III). There were no differences in TAN between storage temperatures and no losses were detected during 98 days (Papers I & II), whereas after 182 days at 24 and 34 ºC, TAN recovery was 97 and 92% of the initial concentration, respectively (Paper II).
Table 2. Concentration of total ammonia nitrogen (TAN) and pH, measured in urine of different origin and degree of dilution. The concentrations are presented as the ranges between the outer min and max values from Papers I, II & III
Dilution Source TAN (g L-1) pH Paper
1:0 Collected fresh, used undiluted 5.8-6.2 9.0-9.1 I & II
1:0a No-flush urine separation, Uganda 4.2 8.9-9.0 III
1:1a Low-flush urine separation, Sweden 2.9-3.2 8.7-8.9 I & II
1:3 Collected fresh, diluted with tap water 1.4-1.8 8.7-9.1 I & II
0.8:1 Collected fresh, diluted with NaCl 3.2-4.0 9.0-9.3 III
a) Degree of dilution assumed according to type of sanitation system and measured TAN
The addition of bacterial solution to the urine seemed to lower the pH slightly (at most by 0.2 pH units) compared with the stock urine (Papers I & III). However, after that initial decrease, the pH remained stable for 98 days

42
and the lowest pH of 8.7 was measured on day 202 (Paper I). In urine collected from the Swedish sanitation system the pH was slightly lower than that in urine collected fresh, disregarding dilution and ammonia concentration (Table 2).
5.1.2 Temperatures at ambient exposure
When urine was exposed to ambient conditions in 10 L jerry cans in Kampala, Uganda (Paper III), on average it was subjected to about 2-3 hours of bright sunshine in the mornings, followed by cloudy afternoons. The temperature shift in urine (mid-point measurement) and ambient air during the average day followed an approximately sinusoidal curve at the three locations (Figure 3). The outdoor ambient air temperature during the average day ranged from a high at the outdoor full sun location of 30.7 ºC to a low of 19.3 ºC.
18
20
22
24
26
28
30
32
00:00 06:00 12:00 18:00
Time of day
Tem
pera
ture
(°C
)
Figure 3. Temperature shift in urine mid-point measurement (circles) and ambient air (solid lines) during the average day from 42 days of study at the full sun (●/), wall (●/) and room (○/--) locations, together with the complementary incubator urine temperature (+) during the average day from the 48 day study (Paper III).
The urine temperature in the jerry cans followed the ambient temperature at each location, with an approximately 3 hour time lag (Figure 3). The full sun and wall exposures resulted in urine temperatures with distinct peaks

43
during the average day at approximately 16.00 hours, whereas at the room location the temperature amplitude was only 1.2 ºC.
The differences between the mid-point and bottom-point temperatures in the jerry cans were greatest at the full sun location, with at most a 1.3 ºC difference for the daily maximum temperature. The complementary incubator study (performed in 50 mL centrifuge tubes) resulted in 0.5 and 1 ºC higher minimum and maximum temperature, respectively, during the average day compared with the full sun location (Figure 3).
5.1.3 NH3 formation in urine
The urine used in Papers I & II was obtained from the same sources but used for different organisms and had slightly different pH and TAN concentrations. The overall trend at constant temperature was that the NH3 concentrations that could be compared were in a similar range as those in urine diluted one step further and stored at 20 ºC higher temperature (Table 3).
The slightly lower pH in the 1:1 diluted urine at 4 ºC resulted in similar NH3 concentrations as for the 1:3 dilution, despite the higher TAN concentration. Similarly, increasing the temperature from 14 to 24 ºC for the 1:3 diluted urine did not result in higher NH3 since the pH decreased by 0.3 pH units when incubated at 24 ºC (Table 3).
For the urine studied at varying temperature, the daily minimum to maximum mid-point temperatures resulted in a NH3 fraction varying over the day. The combined temperature and pH of 8.9-9.0 in the field study resulted in the outermost max and min values presented in Table 3. At the daily minimum temperature the differences in NH3 formation were small, at most 3 mM, whereas at the daily maximum the difference was 29 mM NH3 between the room and full sun location. Despite lower TAN concentrations in both complementary studies, the slightly higher peak temperature or pH resulted in similar or higher maximum concentrations of NH3 (Table 3).
5.1.4 Microbial inactivation
Bacteria inactivation
The reduction in S. Typhimurium in urine studied at constant temperatures was rapid and the t90 ranged from less than 0.1 day at 34 ºC to at most 6.5 days at 4 ºC (Table 3). When frequently monitored at varying temperature, Salmonella spp. was at non-detectable level after 11 hours during the lower parts of the temperature cycle (20.00 - 08.00 h) resulting in a t90 of 0.1 day

44
(Paper III; Figure 3). In the ammonia-free temperature controls some growth of Salmonella spp. occurred during the first 2 weeks and during 5 months little or no reduction was detected at each of the constant temperatures (Table 4).
Reduction in Enterococcus spp. at 34 °C constant temperature was fast, irrespective of urine concentration (t90 of 1-3 days), whereas at temperatures of 24 ºC and below the concentrated urine (1:0) resulted in much shorter t90 than the diluted urine (1:1 and 1:3). For undiluted urine the t90 of Enterococcus spp. was below 7 days at all constant temperatures (Table 3). In the incubator setting with varying temperatures, the t90 of 1.8 days was in line with results from constant temperatures, whereas in the field study the survival was fourfold longer despite similar ammonia concentrations as at the full sun location (Table 3). Enterococcus spp. increased in numbers during the first 2 weeks in ammonia-free controls and then showed stable organism concentrations for 5 months (Table 4).
Bacteriophage inactivation
S. Typhimurium 28B phage was the most persistent of the phages studied and significant reduction was observed at 4 C first after six months of study1. At 4 C and 14 °C, t90 for Φx 174 and MS2 ranged from 28 to 240 days, with little correlation to temperature and urine dilution, and no difference in sensitivity between the two phages was observed. At 24 C and 34 °C the time to inactivate S. Typhimurium 28B was in the same range as that of bacteriophages Φx 174 and MS2 with shorter time for the undiluted urine, with a t90 of at most 17 days.
Regarding the ammonia-free controls, a significant reduction in Φx 174 was observed only at 37 ºC, which was inactivated at a rate not much slower than when studied in urine. Salmonella phage 28B showed significant inactivation only at 4 ºC but it was slow, with a t90 of 140 days (Table 4).
At varying temperature the MS2 phage was the most sensitive to ammonia sanitisation and the 28B phage was the least sensitive. Comparing the t90 at varying temperature with that at the constant temperatures, the different urine dilutions at 24 ºC gave most similar reduction data (Table 3).
1 The t90 values for S. Typhimurium phage 28 B in Table 3 are updated after prolonged
studies and thereby diverging from in Paper I.

45
Tab
le 3
. Fo
rmat
ion
of N
H3
as c
once
ntra
tion
(mM
) an
d fra
ction
of
tota
l am
mon
ia (
%)
in u
rine
at t
he d
iffer
ent
tem
pera
ture
s an
d ur
ine
conc
entra
tions
, to
geth
er w
ith t
he
mea
n tim
e fo
r 1
or 2
log
10 r
educ
tion
(t 90 o
r t 99
) gi
ven
as m
ean
valu
e in
day
s (u
pper
95%
con
fiden
ce i
nter
val
in b
rack
ets)
for
S.
Typ
him
uriu
m,
Ent
eroc
occu
s sp
p.,
bacte
rioph
ages
MS2
, Φ
x174
and
S.
Typ
him
uriu
m 2
8B a
nd A
scar
is su
um e
ggs.
The
t 90 a
nd t 99
and
thei
r con
fiden
ce in
terv
als
are
roun
ded
to tw
o sig
nific
ant f
igur
es
Tem
p
(ºC
) U
rine
: H
2O
NH
3 (m
M)a
(%
) Sa
lmon
ella
(t
90)
Ent
eroc
occu
s sp
p.(t
90)
MS2
(t
90)
Φx1
74
(t90)
28B
(t
90)
Asc
aris
eggs
(t
99/t
99.9
* )
34
1:0
232-
236
54-5
5 <
0.1
- <
1.1
(1.1
) 1.
6 -
<5.
7 (6
.6)
2.2
(2.9
)b 3.
4 (4
.0)
34
1:1
95-1
00
51-5
4 0.
2 (0
.3)
<1.
2 (1
.4)
6.9
(13)
6.
8(8
.2)b
<15
(1
6)
6.3
(7.3
)
34
1:3
40
47
<0.
3 (0
.4)
<3.
0 (4
.0)
8.4
(10)
13
(1
5)
9.5
(18)
b 8.
5 (1
4)
24
1:0
141-
156
33-3
7 0.
6 (0
.7)
<2.
3 (2
.3)
15
(14)
12
(1
5)
17
(20)
48
(6
2)
24
1:1
60-6
6 32
-36
2.1
(2.4
) 9.
1(1
3)
25
(37)
16
(2
6)
51
(56)
56
(7
0)
24
1:3
18-2
4 21
-28
<1.
0 (1
.2)
47
(110
) 82
(9
9)
71
(100
) 23
0 (4
17)
NR
14
1:0
94-1
09
22-2
6 <
1.1
(1.2
) 6.
4(1
2)
71
(83)
79
(1
80)
56
(72)
24
0 (3
80)
14
1:1
33-3
9 21
-26
<5.
3 (5
.9)
21
(27)
89
(1
16)
130
(160
) N
R
1060
(1
250)
14
1:3
20-2
4 20
-24
<2.
3 (2
.7)
28
(32)
20
0 (2
60)
100
(220
) 18
0 (2
80)
NR
4 1:
0 57
13
2.
1 (2
.4)
6.3
(15)
16
0 (2
30)
120
(510
) 14
0 (1
60)
480
(770
)
4 1:
1 16
9
6.5
(7.0
) 42
(5
1)
73
(90)
28
(9
8)
NR
84
0 (1
050)
4 1:
3 14
-15
18
4.5
(5.1
) 33
(4
8)
240
(250
) 15
0 (8
10)
170
(280
) N
R
20.9
-22.
2 R
oom
75
-95c
25-3
2 -
7.7
(9.1
) -
- -
304*
21.3
-26.
0 W
all
77-1
13c
26-3
8 -
7.6
(9.4
) -
- -
106*
20.6
-28.
1 Su
n 74
-124
c 25
-41
- 7.
7(9
.4)
- -
- -
21.1
-29.
1 Su
n c1
69-1
24d
30-5
4 -
1.8
(2.1
) 8.
2 (1
6)
37
(43)
55
(6
4)
46*
21.0
-26.
3 Su
n c2
141-
194e
40-5
5 0.
1 (0
.1)
- -
- -
-
a) N
H3 i
s ca
lcul
ated
acc
ordi
ng t
o E
mer
son
et a
l (19
75).
At
cons
tant
tem
pera
ture
the
ran
ges
repr
esen
t th
e ou
term
ost
valu
es fr
om P
aper
s I
& I
I, w
here
as a
t va
ryin
g te
mpe
ratu
re
the
rang
es c
over
N
H3 f
orm
ed a
t th
e m
ax a
nd m
in t
empe
ratu
res
in c
ombi
natio
n w
ith p
H a
nd N
con
cent
ratio
n: c
) 8.
9-9.
0; 4
.2 g
N L
-1 d
) 9.
0-9.
2; 3
.2 g
N L
-1; e
) 9.
2-9.
3;
4 g
N L
-1
b) P
erfo
rmed
at
37ºC
. NR
= N
o sig
nific
ant
redu
ctio
n (p
<0.
05).

46
Ascaris suum egg inactivation
Except for the 1:3 diluted urine at 4 to 24 °C, the urine storage resulted in significant (p<0.05) egg inactivation. However, the inactivation in urine at 4 and 14 °C was low, which resulted in t99 values of more than 1 year, considering the upper 95% confidence interval (Table 3). At 34 °C, t99 of 3.4, 6.3 and 8.5 days was achieved for urine diluted 1:0, 1:1, and 1:3, respectively. At 24 ºC the t99 increased to 48 and 56 days for the 1:0 and 1:1 dilutions respectively. In the ammonia-free constant temperature controls (0.9% NaCl) viability was stable at both 24 and 34 °C for the month studied (Table 3).
When Ascaris was studied at varying temperature (Paper III), the time for a 3 log10 inactivation of viable eggs was 46, 106 and 304 days for the full sun, wall and room locations as derived from a shouldered inactivation model (Table 3).
Table 4. Time for 1 log10 reduction (t90) given as mean value (upper 95% confidence interval in brackets) in days for the bacteria S. Typhimurium and Enterococcus spp., the bacteriophages MS2, Φx174 and S. Typhimurium 28B and Ascaris eggs in ammonia-free controls at the different temperatures. NR indicates non-significant reduction (p>0.05)
Temp (ºC)
Salmonellaa (t90)
Enterococcus spp.(t90)
Φx174 (t90)
28B (t90)
Ascaris eggs (t99)
37 110 (270) 16 (25) 9 (15) NR NRa
24 NR 340 (640) NR NR NR
14 NR NR NR NR -
4 120 (200 ) NR NR 140 (340) NR
a) Performed at 34ºC. NR= No significant reduction (p<0.05).
5.2 Urea treatment of faeces
5.2.1 Ammonia and pH in faecal treatments
Total ammonia nitrogen (TAN) concentration in the untreated faecal matter was 3.5±0.1 (34 ºC) and 3.0±0.06 g L-1 (24 ºC) when measured at day 3 and 35, respectively. At 24 ºC (day 35), lower TAN concentrations were measured in all the treatments (including storage) compared with at 34 ºC when measured at day 3, except for the faeces with ash+1% urea (Table 5).
For the treatments where total ammonia was measured, the recovery, i.e. measured ammonia as a percentage of estimates based on ammonia from faecal material and ammonia added by urea, with the latter assumed to be totally degraded, constituted 84% or less of the theoretical estimate.

47
Consequently, theoretical TAN (Table 5) was calculated from 80% of total ammonia estimates according to the previous analyses. For the 0.5 and 1.5% urea additions, where ammonia was not monitored, the theoretical estimates are the only figures for the TAN concentrations (Table 5).
Table 5. Concentrations of total ammonia nitrogen (TAN) in the faecal treatments at 34 and 24 ºC measured at day 3 and 35, respectively
Faecal treatment Measured TAN (g L-1)
Recovery (%)
Theoretical TANa Paper
2% urea 9.5-12.1 67-83 11.2-11.5 I & III
1.5% urea - - 9.1-9.3 I
1% urea 6.2-7.6 73-84 6.8-7.2 I & III
0.5% urea - - 4.7-5.0 I
0% urea 3.0-3.5 - 3.0-3.5 I & III
Ash +1% urea 1.0-3.7 15-51 5.4-5.7 III
Ash 0.8-1.0 65-78 1.0 III
a) The range of the theoretical TAN is based on the different TAN concentrations of the faecal batches/measurements and is calculated from 80% recovery
In faecal material subjected to the same urea treatment, the incubation temperature did not result in significantly different pH values. The pH in the untreated faecal material (0% urea) varied from 6.6 to 8.5. Urea addition of 1.5% and 2% increased the pH to at least pH 8.9 irrespective of initial pH (Table 6). With urea added, the peak pH was recorded within the first 3 days and then pH declined over time. The largest decrease in pH was observed when faecal material with initially low pH (6.6) was treated.
Table 6. Number of faecal batches subjected to treatment and total number of samples taken to determine max pH from treatment (recorded during first 3 days) together with the decrease in pH during 60 days, given in pH units. Parameters are presented irrespective of treatment temperature and given as range with the outermost extremes from the sampling
Faecal treatment No. of samples/batches
Max pH pH decrease in 60 days
2% urea 15/5 8.9-9.2 0.1-0.9
1.5% urea 4/2 8.9-9.0 0.2
1% urea 11/4 8.7-9.0 0.2-1.5
0.5% urea 6/2 8.3-8.6 1.3
0% urea 15/5 6.6-8.5 0.0-0.3
Ash +1% urea 6/2 10.0-12.8 0.1-0.4 a
Ash 6/2 10.5-12.8 0.1-0.8a
a) The pH decrease in 20 days

48
5.2.2 NH3 formation in faecal treatments
The variations in pH displayed by the treatments (Table 6) together with variations in ammonia in the faecal material (Table 5) gave corresponding variations in the estimated concentrations of NH3 with, in some cases, a slight overlap between the different treatments and temperatures (Table 7). With no addition of urea the faecal material in some cases had so low pH, 6.6, that no NH3 was formed despite ammonia being present in the material.
The NH3 concentration in Ascaris treatments (Paper II) was within the hypothetical NH3 ranges from Paper IV (Table 7) except for the 2% urea treatment at 24 ºC where actual NH3 was lower (230 mM) than the range of 236-374 mM NH3 given in Table 7.
Table 7. NH3 in faeces subjected to treatment with urea or ash treatment, or both, given as concentration (mM) and fraction of total ammonia (%) together with time for 1 or 2 log10 reduction (t90 or t99) given as mean value (upper 95% confidence interval in brackets) in days for the bacteria Salmonella spp. and Enterococcus spp. and the bacteriophage S. Typhimurium 28B and Ascaris eggs
Temp. (ºC)
Urea (%)
NH3 (mM)a (%) Salmonella(t90)
Enteroccoccus(t90)
phage 28B(t90)
Ascaris eggs (t99)
34 2 364-514 46-63 - - 3.8 (4.2) 3.8 (6.4)
34 1.5 295-339 46-51 0.2 (0.2) 2.1 (2.5) - -
34 1 168-262 35-51 0.2 (0.4) 2.6 (3.1) 7.6 (9.8) 4.1 (5.9)
34 1+Ash 72 100 - - - 3.8 (6.4)
34 0.5 58-106 17-30 0.3 (0.4) 3.7 (4.5) - -
34 Ash 71 100 - - - 3.7 (4.1)
34 0 1-62 0-25 0.7 (1.2) 4.7 (6.0) NR 21 (27)
24 2 236-374 30-45 0.3 (0.4) 12 (14) 33 (37) 28 (33)
24 1 102-177 21-35 0.8 (1.0) 14 (16) 78 (110) 47 (59)
24 1+Ash 220 84 - - - 13 (18)
24 Ash 57 94 - - - 35 (50)
24 0 0-36 0-15 4.8 (6.6) 33 (37) 160 (290) 74 (110)
14 2 134-235 17-29 1.2 (1.7) 38 (46) - -
14 1 55-103 11-20 9.2 (10) 73 (83) - -
14 0.5 16-33 5-9 12 (14) 67 (75) - -
14 0 0-19 0-8 27 (45) NR - -
a) Calculated from temperature, total ammonia concentrations and max pH according to Emmerson et al. (1975). The min-max pH values and TAN concentrations (assuming 80% recovery) were used, so the NH3 values are presented as a min and max range. For treatments with ash the NH3 concentrations are based on actual measurements of TAN and pH. NR= No significant reduction (p<0.05).

49
5.2.3 Microbial inactivation
Bacteria inactivation
When storage and 2% urea treatments were performed repeatedly using different faecal batches, the inactivation rates in the untreated faeces (0% urea) were highly variable. For Salmonella spp. storage of faeces without urea resulted in t90 of 6-49 days and 0.9-5 days (separate t90 not presented), at 14 and 24 ºC, respectively. The longest t90 was recorded in faeces at low pH (6.6). Within the same batch of faeces, urea treatment always resulted in faster inactivation compared with untreated faeces, even at urea addition rates as low as 0.5%. However, when the results of different batches were compared, an overlap was found in t90 between untreated faeces and treatment with 0.5% urea addition. A similar variation in reduction rates as for the Salmonella spp. was observed for Enterococcus spp. To derive inactivation kinetics including this variation between faecal materials, all data from repeated batches were analysed by linear regression (Paper IV).
Salmonella spp. was much more sensitive to the treatments than Enterococcus spp. and the t90 was in most cases only 10% of t90 for Enterococcus spp., irrespective of temperature. Each 10 ºC increase in temperature from 14 ºC decreased the t90 for Salmonella spp. by about one order of magnitude, from 27 to 5 and 0.7 days at 24 and 34 ºC, respectively. At 24 and 34 ºC all studied urea treatments of faeces resulted in t90 for Salmonella spp. of less than one day. At 34 ºC t90 did not exceed 5 days for Enterococcus spp., even in untreated faeces (Table 7).
Bacteriophage inactivation
During the storage of untreated faeces (0% urea) at 34 ºC, no reduction in Salm. Typhimurium phage 28B was observed in 35 days. At 24 ºC, there was a small but significant reduction, with a mean t90 of 164 days from 5 months of study. Addition of 1% and 2% urea reduced inactivation time at 24 ºC by 50% to 82 days and 75% to 41 days, respectively, compared with untreated faeces. Comparing inactivation of the phage with the same urea addition, increasing temperature from 24 ºC to 34 ºC resulted in a 90% decrease in t90 (Table 7).
Ascaris suum egg inactivation
All faecal treatments, including storage with no added urea, resulted in significant (p<0.05) egg inactivation. At 34 °C all treatments resulted in t99 of less than 5 days. In untreated faeces at 34 °C an initial peak, with higher egg

50
viability on days 3 and 8 compared with the initial viability, but t99 of 21 days, was achieved.
At 24 ºC, ash + 1% urea resulted in the shortest t99 of 13 days. For ash or 1% urea used singly, there was no significant difference in inactivation at the end of the study (day 35). An increase from 24 to 34 °C reduced the inactivation time by 80% at equal NH3 concentration and pH (1% urea at 34 °C and 2% urea at 24 °C).
In the ammonia-free temperature controls (0.9% NaCl), viability was stable at both 24 and 34 °C for the month studied (Table 4). Furthermore, during a 1-week study, no significant inactivation was detected with pH>13 at 24 °C in ash-amended urine, while the nitrogen was still present as urea, indicating high tolerance to extreme pH.

51
6 Results: Inactivation Models
6.1 NH3 and temperature-dependent Salmonella inactivation
6.1.1 Model aim and assumptions
Microbial inactivation rates were in general related to NH3 concentrations and inactivation rates were found to increase with temperature (Papers I & II). Formulating the relationship between inactivation rates and these treatment parameters gives the possibility to predict inactivation rates for combinations of NH3 and temperature within the ranges investigated but not specifically studied. Another possible use for a material-independent inactivation model could be to assess pathogen inactivation in other materials possessing similar characteristics e.g. manure or other sewage fractions.
Regression model for prediction of inactivation rate for Salmonella spp. were based on the input variables temperature and NH3 concentration in the solute, with the starting hypothesis that the inactivation would be material-independent. The NH3 concentration is a function of temperature, pH, dry matter content and TAN (intrinsic and added) but since all those input variables except temperature were assumed to not directly affect inactivation rates, they were only considered when calculating the NH3 concentrations according to Emerson et al. (1975). Figure 4 shows the combinations of NH3 concentrations and temperatures studied.

52
0
100
200
300
400
500
4 8 12 16 20 24 28 32 36 40
Temperature (C)
NH
3 (m
M)
Figure 4. Combinations of NH3 concentrations and temperatures (Papers I-III) at which inactivation Salmonella spp. was studied in faeces (×), urine (○) and NaCl (●).
6.1.2 Inactivation model
Model building
Inactivation data for Salmonella Typhimurium (sewage sludge isolate) studied in urine, which maintained stable pH as well as ammonia concentration, were used together with data on ammonia-free controls for formulation of a model and calibration of model parameters. However, this resulted in the highest NH3 concentration used for model parameterisation being lower than the concentrations reached with urea treatment (Figure 4).
As regards the relationship between Salmonella spp. decay coefficients, k, and the variables, the relationship between k (log10 cfu day-1) and NH3 concentration was linear (p<0.001) for all temperatures studied2, but with the regression at 4 and 14 ºC close to each other (Figure 5a). The slope of the function for the NH3 concentration-dependent inactivation rates ( - k = f [NH3]), here denoted f, showed an exponential increase with increasing temperature, which could be assumed reasonable considering inactivation mechanisms (Figure 5b). From these relationships an objective function for the Salmonella spp. inactivation was formulated,
2 4 ºC (n=13); 14 ºC (n=29); 24 ºC (n=15) and 34 ºC (n=13).

53
kSalm. = - a CNH3ebT, where C is the NH3 concentration in mM and T the
temperature in degrees Celsius. However, Figure 5b indicates that such a model, covering the whole temperature range, will underestimate inactivation rates at both 4 and 34 ºC while overestimating them at 14 and 24 ºC.
0
0.01
0.02
0.03
0.04
0.05
0.06
0.07
0.08
0 10 20 30 40
Temperature (°C)
a) b)-
k (lo
g 10
cfu
day-1
)
0
2
4
6
8
10
12
14
16
0 50 100 150 200 250
NH3 (mM)f (
-k N
H3-1
)
0
0.01
0.02
0.03
0.04
0.05
0.06
0.07
0.08
0 10 20 30 40
Temperature (°C)
a) b)-
k (lo
g 10
cfu
day-1
)
0
2
4
6
8
10
12
14
16
0 50 100 150 200 250
NH3 (mM)
0
0.01
0.02
0.03
0.04
0.05
0.06
0.07
0.08
0 10 20 30 40
Temperature (°C)
a) b)
0
0.01
0.02
0.03
0.04
0.05
0.06
0.07
0.08
0 10 20 30 40
Temperature (°C)
0
0.01
0.02
0.03
0.04
0.05
0.06
0.07
0.08
0 10 20 30 40
Temperature (°C)
a) b)-
k (lo
g 10
cfu
day-1
)
0
2
4
6
8
10
12
14
16
0 50 100 150 200 250
NH3 (mM)
-k
(log 1
0 cf
uda
y-1)
0
2
4
6
8
10
12
14
16
0 50 100 150 200 250
NH3 (mM)
0
2
4
6
8
10
12
14
16
0 50 100 150 200 250
NH3 (mM)f (
-k N
H3-1
)
Figure 5. a) NH3-dependent Salmonella spp. inactivation at temperatures 4 (□/- - ), 14 (○, ), 24 (■/- - ) and 34 ºC (●/) with linear regression lines. b) The temperature-dependent NH3 factor f with the exponential trend line.
Model fitting and calibration
Since the inactivation of Salmonella spp. at temperatures of 24 ºC and above was fast, resulting in t90 of 2.1 day or less (Table 4 and Table 7), the focus chosen for the model formulation was to differentiate inactivation rates for the temperature range 4-24 ºC with better accuracy. Thus only the inactivation data from urine studies performed at 4 to 24 ºC were used for calibration of the model constants/parameters a and b by minimising the residual sum of squares (RSS) between predicted and observed k values (Excel, Microsoft Corporation; Redmond, CA, USA). The optimisation resulted in the model constants a = 0.0037 and b = 0.066. For more conservative estimates of Salmonella spp. inactivation rates, a factor 0.8 was added to the model (Eq. 6) based on the relationship between the mean and the upper 95th percentile for Salmonella spp. inactivation rates, k. This factor gives a relationship between the upper 95th percentile and mean t90 of 1.25 (Table 4 and Table 7).
kSalm. = - 0.8 CNH3 0.0037e0.066T (Equation 6)

54
Sensitivity analysis and validation
The objective function (Eq. 6) gives the relationship that if one of the variables is zero no inactivation occurs, which was the case in the ammonia-free controls. However, 4 ºC was the lower temperature boundary for the model and it cannot be extended below that temperature. The impact of changes in temperature was constant and a 10 ºC increase in temperature resulted in approximately doubled inactivation rate, i.e. halved t90 time, over the whole NH3 concentration range.
Similarly, the impact of changes in NH3 concentration was constant over the temperature range but with an exponential relationship, i.e. doubling the NH3 concentrations doubled the inactivation rates and halved the t90 time. This resulted in a higher effect from each 10 mM increase at the lower concentrations, i.e. an increase from 10 to 20 mM halved the t90, whereas a increase from 190 to 200 mM NH3 resulted in only a 5% decrease in t90. Somewhere below 14 mM NH3 there will be a breakpoint at which there will be no inactivation, but lower NH3 concentrations, except its absence in the controls, were not investigated in the present study.
Root mean squared error (RMSE) of the t90 was used as a measure of fit between model (without the 0.8 factor) and validation sets and coefficient of variation (CVRMSE) was 109% for S. Senftenberg (CCUG 2280) in urine3 (unpublished data) and 86% for Salmonella (sewage sludge isolate and CCUG 42744) studied in faeces4 (Paper IV). However, removing data where NH3 concentrations were based on assessments and not measurements of TAN resulted in a CVRMSE for faecal treatments of 49%5. The great deviance from the model for S. Senftenberg, resulting from inactivation rates at 4 and 14 ºC that were larger than the estimates, may indicate a higher tolerance to NH3 at lower temperatures for S. Senftenberg. However, for data from faecal studies no such temperature pattern could be observed, although no faecal studies were performed at 4ºC.
The RMSE considers both underestimations and overestimations of inactivation rates, but for the practical use of the model, underestimations of inactivation rates are of less importance regarding the microbial risk from fertiliser application. The underestimation of t90 in the faecal treatments (storage not considered a treatment) in some cases constituted as much as 100% of the estimated t90 but at most 0.5 days, and in only 7 treatments out of 46. However, for S. Senftenberg inactivation in urine, t90 was underestimated by 32-38 days at 4 ºC and 3.4-3.8 days at 14 ºC. The model 3 n=9 4 n=32 5 n=15

55
was based on data at 4-24 ºC and including data from 34 ºC in the validation resulted in larger CVRMSE. However the model tended to underestimate inactivation rates at temperatures above 24 ºC and, since it resulted in short inactivation times, it can be used for the whole temperature range.
The highest NH3 concentration studied at the respective temperature result in part of the model matrix covering temperatures and NH3 combinations for which inactivation could not be validated (Figure 4). Whether increasing NH3 concentrations could be a means to shorten the treatment time at the lower temperatures, i.e. expand the model outside the highest investigated concentrations, could not be validated by literature data, since ammonia treatments were mainly conducted at room temperature and above and not at NH3 concentrations much higher than in the present study. To account for combinations of temperature and NH3 concentrations not investigated (Figure 4), the assumption has to be made that the inactivation rate will be as high as at the highest investigated NH3 concentration.
6.2 Inactivation of related organisms
6.2.1 Salmonella and E. coli O157:H7
Salmonella spp. and E. coli O157:H7 (ATCC 25922) were the most sensitive organisms studied, although E. coli O157:H7 was examined to a much lesser extent than Salmonella spp. In treatments where E. coli O157:H7 was studied in parallel (same samples) or pseudo-parallel (same treatment but different samples) with S. Typhimurium (CCUG 42744 or the sewage sludge isolate), it was possible to examine the relationship between the inactivation rates of the two bacteria6.
A power function (kE. coli = 1.16kSalm.
1.0027) gave a better fit (R2=0.96) than a linear function (kE. coli = 1.0392kSalm.) where the intercept was set to zero (R2=0.92). Not setting the intercept to zero gave a model with an intercept of 0.25, i.e. no inactivation of S. Typhimurium and a t90 of 4 days for E. coli H7:O157 in the absence of NH3, which is not a reasonable model according to inactivation data for the two organisms in NaCl and pH 9 controls (unpublished data). The power function will give a 0 to 0 relationship for the k values and a kE. coli that increases in relation to kSalm. However, since three of the S. Typhimurium inactivation rates were censored values, in reality a
6 Salmonella Typhimurium and E. coli O157:H7 were studied in parallel in urine diluted 1:1 at
4 and 34ºC, in urine at varying temperature and in faecal treatments (0, 0.5 ,1 and 2 % urea; lime; ammonia) at 14ºC (n=15).
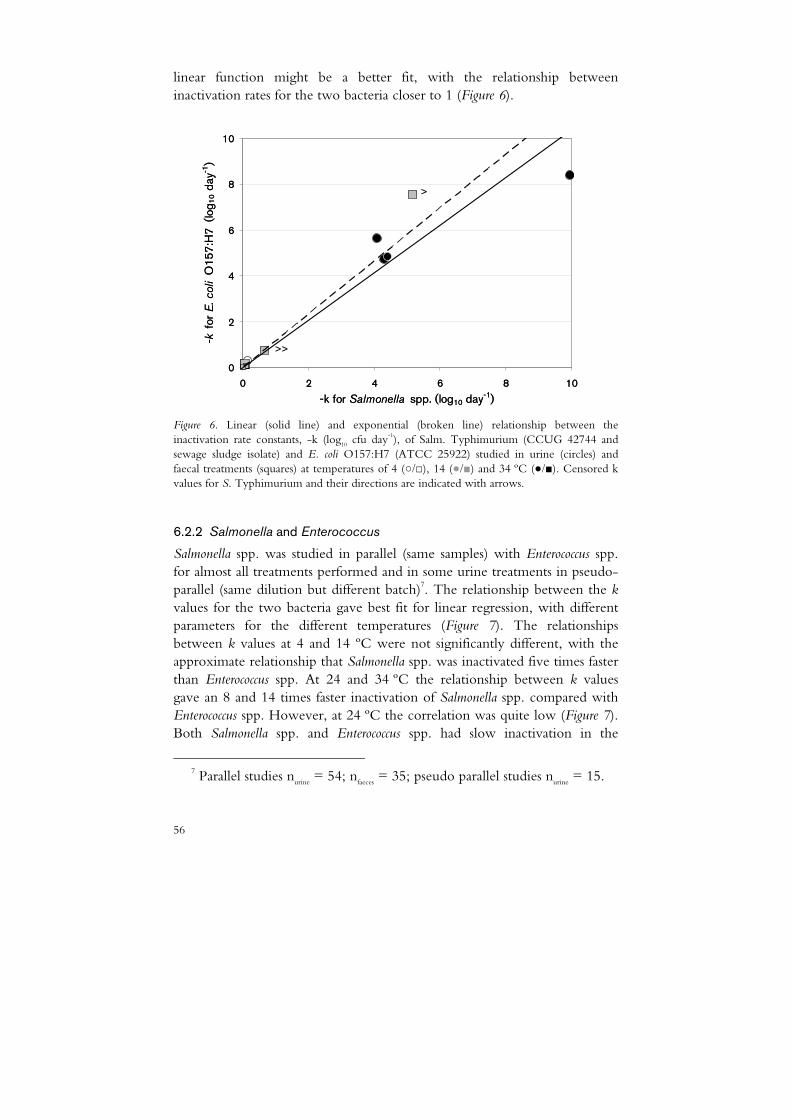
56
linear function might be a better fit, with the relationship between inactivation rates for the two bacteria closer to 1 (Figure 6).
0
2
4
6
8
10
0 2 4 6 8 10
-k for Salmonella spp. (log10 day-1)
-k f
or E
. col
i O
157:
H7
(lo
g 10 d
ay-1
)>
>>
0
2
4
6
8
10
0 2 4 6 8 10
-k for Salmonella spp. (log10 day-1)
-k f
or E
. col
i O
157:
H7
(lo
g 10 d
ay-1
)>
>>
Figure 6. Linear (solid line) and exponential (broken line) relationship between the inactivation rate constants, -k (log10 cfu day-1), of Salm. Typhimurium (CCUG 42744 and sewage sludge isolate) and E. coli O157:H7 (ATCC 25922) studied in urine (circles) and faecal treatments (squares) at temperatures of 4 (○/□), 14 (●/■) and 34 ºC (●/■). Censored k values for S. Typhimurium and their directions are indicated with arrows.
6.2.2 Salmonella and Enterococcus
Salmonella spp. was studied in parallel (same samples) with Enterococcus spp. for almost all treatments performed and in some urine treatments in pseudo-parallel (same dilution but different batch)7. The relationship between the k values for the two bacteria gave best fit for linear regression, with different parameters for the different temperatures (Figure 7). The relationships between k values at 4 and 14 ºC were not significantly different, with the approximate relationship that Salmonella spp. was inactivated five times faster than Enterococcus spp. At 24 and 34 ºC the relationship between k values gave an 8 and 14 times faster inactivation of Salmonella spp. compared with Enterococcus spp. However, at 24 ºC the correlation was quite low (Figure 7). Both Salmonella spp. and Enterococcus spp. had slow inactivation in the
7 Parallel studies nurine = 54; nfaeces = 35; pseudo parallel studies nurine = 15.

57
absence of ammonia except at 37 ºC, where Enterococcus spp. was much more sensitive to temperature alone than Salmonella spp.
0
2
4
6
8
10
12
14
16
0 0.2 0.4 0.6 0.8 1
-k for Enterococcus spp. (log10 day-1)
-k fo
r Sal
mon
ella
spp
. (lo
g1
0 d
ay-1
)
Figure 7. Linear correlation between the inactivation rate constants, -k (log10 cfu day-1), of S. Typhimurium (CCUG 42744 and sewage sludge isolate) and Enterococcus spp. (endogenous and ATCC 29212) studied in urine and faecal treatments at temperatures of 4 (□), 14 (○), 24 (■) and 34 ºC (●).
6.3 Shouldered inactivation of Ascaris eggs
In the studies of A. suum eggs, initial lag phases with no significant inactivation were observed both for urine dilutions and faecal treatments (Papers II & III). When a lag phase was observed it constituted approximately one-third to half of the time taken for total inactivation. Similar lag phases have been reported for Ascaris egg inactivation in relation to ammonia (Pecson et al., 2007; Ghiglietti et al., 1997; Ghiglietti et al., 1995), heat treatment (Aitken et al., 2005; Barnard et al., 1987) and long-term sludge storage (Nelson & Darby, 2002). Such lag phases have been observed irrespective of whether the inactivation took place during 110 minutes or 40 days (Pecson et al., 2007).
In Paper II, to account for the lag phases, the inactivation was divided into two linear models and t99 was approximated from, most often, a 103 egg count. When Ascaris eggs were sampled more frequently at varying

58
temperature (Paper III), both a lag phase and a following exponential decline in egg viability were much more apparent (Figure 8). The model for shouldered survival curves (Eq. 6)(Harm, 1980) proposed by Pecson et al. (2007) was used to estimate time for a 3 log10 egg inactivation for those data with a good fit (Figure 8).
0
0.2
0.4
0.6
0.8
1
1.2
0 10 20 30 40 50Time (days)
Via
ble
egg
frac
tion
Figure 8. Fraction of viable Ascaris suum eggs (○) in urine exposed to temperature variations simulating the ambient conditions at the full sun location and the model for inactivation, Nt = N0 (1-(1-e-0.2489t)99), shown by solid line (Paper III).
From the present study and data from the literature mentioned above, an exponential model including possible lag phases seems to best describe Ascaris egg inactivation, irrespective of whether lag phases are detected or not. The lag phases derived from such an inactivation function will be fixed and of same length even if N0 is changed and will thereby be specific to initial concentrations/counts. Due to this constraint and to the inactivation times having to be derived numerically, the function will be less applicable for generalisations of inactivation rates compared with the decimal reductions derived from plain first order kinetics, which can be multiplied for estimating the next log10 magnitude reduction.
When applying the model to data in Paper II the function, based on the 103 egg count, was used for estimates of time for a 3 log10 egg inactivation (Table 8). The exponential base in the lag function will result in more conservative estimates of inactivation rates compared with the previous approach in Paper II, especially for treatments with slow inactivation. The

59
exception is for treatments with a lag phase in combination with fast inactivation such as the faecal treatment of 2% urea and ash+1% urea at 34 ºC, where the time for a 3 log10 inactivation was shorter than the time for a 2 log10 inactivation using the inactivation model in Paper II (Table 3 and Table 7).
Table 8. Pseudo-first order inactivation rate constants and model parameters for Ascaris suum egg inactivation derived by minimising sum of squares for the model Nt = N0 (1-(1-ekt)m) in relation to data, where m is an empirical value used to determine the lag period=(ln m/)-k, and k is the first order rate constant
Temp. Material Dilution /Treatment
k (d) m Lag period (d)
Lag period (%)
3 log10 egg inactivation
34 ºC Urine 1:0 -1.3 9.77 1.7 24 7.0 d
1:1 -1.7 2090 4.4 52 8.4 d
1:3 -0.44 3.91 3.1 16 19 d
Faeces 2% urea <-2.4 1 - - 2.9 d
1% urea -1.0 4.06 1.3 16 7.9 d
Ash+1% urea <-2.4 1 - - 2.9 d
Ash -1.8 1 - - 3.9 d
0% urea -0.30 45.5 13 36 1.2 m
24 ºC Urine 1:0 0.051 1.89 12 4.9 m
1:1 -0.078 9.53 29 25 3.9 m
1:3 -0.0022 1 - - > 2 yrs
Faeces 2% urea -0.11 1.71 4.8 7 2.2 m
1% urea -0.034 1 - - 6.8 m
Ash+1% urea -0.47 8.35 4.5 23 19 d
Ash -0.060 1.12 1.8 1.5 3.9 m
0% urea -0.023 1 - - 10.2 m
14 ºC Urine 1:0 -0.019 7.28 102 23 1.3 yrs
1:1 -0.0031 2.07 240 10 > 2 yrs
1:3 -0.012 1 - - > 2 yrs
4 ºC Urine 1:0 -0.0028 1 - - > 2 yrs
1:1 -0.0014 1 - - > 2 yrs
1:3 -0.0011 1 - - > 2 yrs
A function for egg inactivation including a lag phase gave better fit for 12 out of 22 treatments (Table 8). In general, lag phases were not observed in treatments with fast inactivation and few initial points of sampling, i.e. mainly treatments at 24 ºC and above in the present study. Although for some treatments a shouldered inactivation function still gave a better fit to

60
the data in the later part of inactivation. At 24 ºC, the model resulted in longer time for egg inactivation in undiluted urine compared to urine diluted 1:1. This may be due to different sampling frequency. The present data as well as data from Pecson et al. (2007) indicate that lag phases might not always be present. However, the factors that determine the presence or absence of a lag phase are unclear.
For treatments with slow or no egg inactivation, e.g. storage of urine at temperatures 4 and 14 C, no conclusions can be drawn as to whether the inactivation was still within the lag phase (as indicated for 1:0 and 1:1 urine dilution at 14ºC) or whether a slow decline was proceeding according to plain first order kinetics. For temperatures of 4 and 14 ºC and for urine dilute 1:3 at 24 ºC, the estimates of time for a 3 log10 egg inactivation according the model ranged from 1.3 to 18 years. In Table 8 these are given as > 2 years, since stating what would take place far beyond the experimental period of 6 months would be pure speculation.

61
7 Discussion
7.1 Organism inactivation
7.1.1 Salmonella
Inactivation rates
Salmonella spp. was inactivated in all urine dilutions and faecal urea treatments, whereas in ammonia-free controls their numbers remained stable for five months (Table 4). However despite no NH3 being formed in untreated faecal material (Table 7), Salmonella spp. inactivation was significant (t90 of 49 days at 14 ºC) (Paper IV). Bacterial antagonism, production of organic acids, as indicated by a declining pH, etc. may contribute to such Salmonella spp. inactivation in stored faeces (Semenov et al., 2007). The lowest investigated NH3 concentrations in urine and treated faeces, 14-16 mM (Table 3 and Table 7), resulted in t90 of 7 (4 ºC) and 14 days (14 ºC) regarding the upper 95th percentile, respectively. When Park and Diez-Gonzalez (2003) evaluated the threshold inhibitory concentration of NH3 with respect to S. Typhimurium and E. coli O157:H7, a reduction was observed at 5 mM in pure broth cultivation, whereas 30 mM NH3 (aq) was required in cattle manure. However, temperatures were different between the broth and the manure (37 ºC and 20 ºC, respectively) and the study period was only 24 hours.
Figure 9 depicts the outcome of the NH3 and temperature-dependent model for Salmonella spp., kSalm. = 0.8 CNH3 0.0037e0.066T, in the form of t90 values (days) for the temperatures 4-40 ºC and the NH3 concentrations 20-300 mM (300 mM the highest NH3 concentration studied at 24 ºC). The model deviates from Table 7, which shows average t90 from repeated

62
treatments. If NH3 were to be correlated for each single replicate, the model would underestimate t90 by at most 0.5 days.
4 8 12 16 20 24 28 32 36 40
20
60
100
140
180
220
260
300
340
380
Temp (°C)
< 0.3
0.3-1
3-1
3-10
▲
▲
●
●▲
●▲
▲
▲
▲
▲
▲
▲
▲
NH
3(m
M)
4 8 12 16 20 24 28 32 36 40
20
60
100
140
180
220
260
300
340
380
Temp (°C)
< 0.3
0.3-1
3-1
3-10
▲
▲
●
●▲
●▲
▲
▲
▲
▲
▲
▲
▲
4 8 12 16 20 24 28 32 36 40
20
60
100
140
180
220
260
300
340
380
Temp (°C)
< 0.3
0.3-1
3-1
3-10
▲
▲
●
●▲
●▲
▲
▲
▲
4 8 12 16 20 24 28 32 36 40
20
60
100
140
180
220
260
300
340
380
Temp (°C)
< 0.3
0.3-1
3-1
3-104 8 12 16 20 24 28 32 36 40
20
60
100
140
180
220
260
300
340
380
Temp (°C)
4 8 12 16 20 24 28 32 36 40
20
60
100
140
180
220
260
300
340
380
Temp (°C)
4 8 12 16 20 24 28 32 36 40
20
60
100
140
180
220
260
300
340
380
4 8 12 16 20 24 28 32 36 40
20
60
100
140
180
220
260
300
340
380
Temp (°C)
< 0.3
0.3-1
3-1
3-10
< 0.3
0.3-1
3-1
3-10
▲
▲
●
●▲●▲
●▲●▲
▲
▲
▲
▲
▲
▲
▲
▲
▲
▲
▲
NH
3(m
M)
Figure 9. Prediction of t90 (days) at different combinations and temperatures, by the model kSalm. = 0.8 CNH3 0.0037e0.066T, with t90 classes based on the base 10 logarithm. The shaded upper left corner indicate the combinations of NH3 concentrations and temperatures that were not studied here. The correlation to literature data is indicated with black triangles signs, while black circles indicate when longer inactivation times have been reported8.
Sanitisation of human excreta before use as fertiliser is important in order not to increase the incidence of salmonellosis in humans or to create new transmission routes for this zoonotic pathogen, e.g. from humans to animals via feed or environment. However, the present results indicate that Salmonella spp. can be reduced in high numbers within short treatment times compared with more persistent pathogens, e.g. parasite eggs. Sanitisation specifically targeting Salmonella spp. is of interest during outbreaks in human populations or cattle herds. In emergencies, sanitisation with regard to Salmonella spp. and other bacterial pathogens could prevent epidemics with a major impact on public health. Similarly, the Swedish Board of Agriculture (JBV) and the National Veterinary Institute (SVA) recommend urea or lime to sanitise manure from Salmonella-infected herds.
8 (Ottoson et al., 2008a; Mendez et al., 2004; Vinnerås et al., 2003b; Diez-Gonzalez et al.,
2000; Deal et al., 1975)

63
By ammonia sanitisation, a 6 log10 inactivation of Salmonella spp. can be achieved in approximately 80, 40, 20 and 10 days at temperatures 4, 14, 24 and 34 ºC with a minimum NH3 concentration of 20 mM (Eq. 6). Doubling the NH3 concentration at each temperature will half the time required for a 6 log10 reduction (Eq. 6). With either a temperature of 25 ºC or an NH3 concentration of 80 mM, the time for a 6 log10 reduction will be less than 20 days (considering lower model limits of 20 mM and 4 ºC).
Salmonella and other Enterobacteriaceae
Salmonella belongs to the family Enterobacteriaceae along with other pathogenic species, e.g. Shigella spp., Yersinia spp. and toxin-producing strains of E. coli. When S. Typhimurium (CCUG 42744 and sewage sludge isolate) was studied in parallel with E. coli O157:H7 (ATCC 25922) the inactivation rates, k, showed a close one-to-one relationship, i.e. equal inactivation rates, at temperatures of 4 to 34 ºC, irrespective of whether they were studied in faeces or urine (Figure 6). In studies on inactivation of Salmonella spp. strains and E. coli strains (pathogenic and non-pathogenic) in relation to ammonia in water (Park & Diez-Gonzalez, 2003), urine (Chandran et al., 2009; Höglund et al., 1998), cow manure (Park & Diez-Gonzalez, 2003; Himathongkham et al., 1999), chicken manure (Himathongkham et al., 2000); (Himathongkham & Riemann, 1999), sewage sludge (Mendez et al., 2004) and faeces (Vinnerås et al., 2003b), equal or only slightly different inactivation rates have been observed. The collected findings indicate that E. coli and Salmonella spp. seem to be inactivated in relation to ammonia at such rates that any differences might be irrelevant. Total thermotolerant coliform (TTC) count determines the presence and concentration of Enterobacteriaceae of faecal origin, faecal coliforms, and is to a large extent comprised of E. coli. Mendez et al. (2002) observed that faecal coliforms as well as Salmonella spp. were sensitive to ammonia and that Salmonella spp. was inactivated slightly faster than faecal coliforms, with both organisms naturally occurring in the sewage sludge studied (Mendez et al., 2004).
Inactivation of other bacterial pathogens has been studied mainly in urine, with ammonia not quantified. Eight bacteria belonging to Enterobacteriaceae were studied in pure cultures mixed with cattle urine at a 1:1 ratio and all species and strains9 were reduced from 7 log10 cfu mL-1 to
9 Eschericia coli O157:H7 (ATTC 43895); Eschericia coli K-12 (ATTC 12435); Salmonella
Typhimurium (ATTC 14028); Kleibsella pneumoniae (ATCC 13883); Enterobacter cloacae (ATCC 23355); Citrobacter freundi (ATCC 8090); Proteus vulgaris (ATCC 13315) and Serratia marcescens (ATCC 8100).

64
non-detectable levels (10 cfu) in 24 hours at 37 ºC (Diez-Gonzalez et al., 2000). Enterococcus faecalis (ATTC 19433) was also inactivated at this fast rate and differences in inactivation rates were probably not detected due to only two samplings. In human urine, diluted approximately 0.5-1:1, and 1-2:1 with flushwater, Salmonella and other gram negative-bacteria10 have been found to have equal inactivation time, i.e. t90 of less than 1 days, at both 4 and 20 ºC (Höglund et al., 1998).
Inactivation rates of pathogens belonging to the Enterobacteriaceae in relation to ammonia seem to be consistent, so the assumption can be made that the sanitisation method is equal for all these species and that differentiation is at a level not relevant for ammonia sanitisation. E. coli is presumed in general to have survival characteristics very similar to those of well-known pathogens such as Salmonella spp. and Shigella (Todar). Sewage is always likely to contain E. coli and other faecal coliforms in relatively large numbers. Since pathogenic bacteria such as Salmonella spp. can be assumed to normally occur in lower densities, faecal coliforms can be considered a suitable indicator for Salmonella spp., enteropathogenic strains of E. coli and probably also Shigella and Yersinia spp.
Standard methods for TTC counts can thus be used for product and process validation.
7.1.2 Enterococcus
Enterococcus spp. was more resistant to the treatments compared with the other bacteria studied and was inactivated slowly below concentrations of 60 mM NH3 and temperatures of 24 °C. In untreated faecal material, inactivation of Enterococcus spp. was insignificant at 14 ºC, whereas at 34 ºC it was fast (t90 of 5 days) (Table 7). A t90 of 16 days in the absence of ammonia (37 ºC) indicates a lower tolerance to temperature alone compared with Salmonella spp. (Table 4). However, a temperature of 24 ºC promoted initial growth when NH3 concentration was low (urine diluted 1:3), resulting in longer t90 compared with the two lower temperatures (Table 3).
At 24 ºC and below, diluting urine 1:3 resulted in t90 values of 28-47 days, compared with 2-6 days when the urine was undiluted (Table 3). However there were inconsistencies in that Enterococcus spp. in 1:1 diluted urine was inactivated at a lower rate compared with in more diluted urine (1:3), which can probably be explained by the method not distinguishing the added E. faecalis from endogenous Enterococcus spp. The urine from sanitation systems in Sweden and Uganda had concentrations of endogenous 10 Salmonella Senftenberg (775 W); Salmonella Typhimurium (SH4809); Aeromonas hydrophila
(ATCC 35654), Pseudomonas aeruginosa 233/78 and Eschericia coli (isolated from urine).
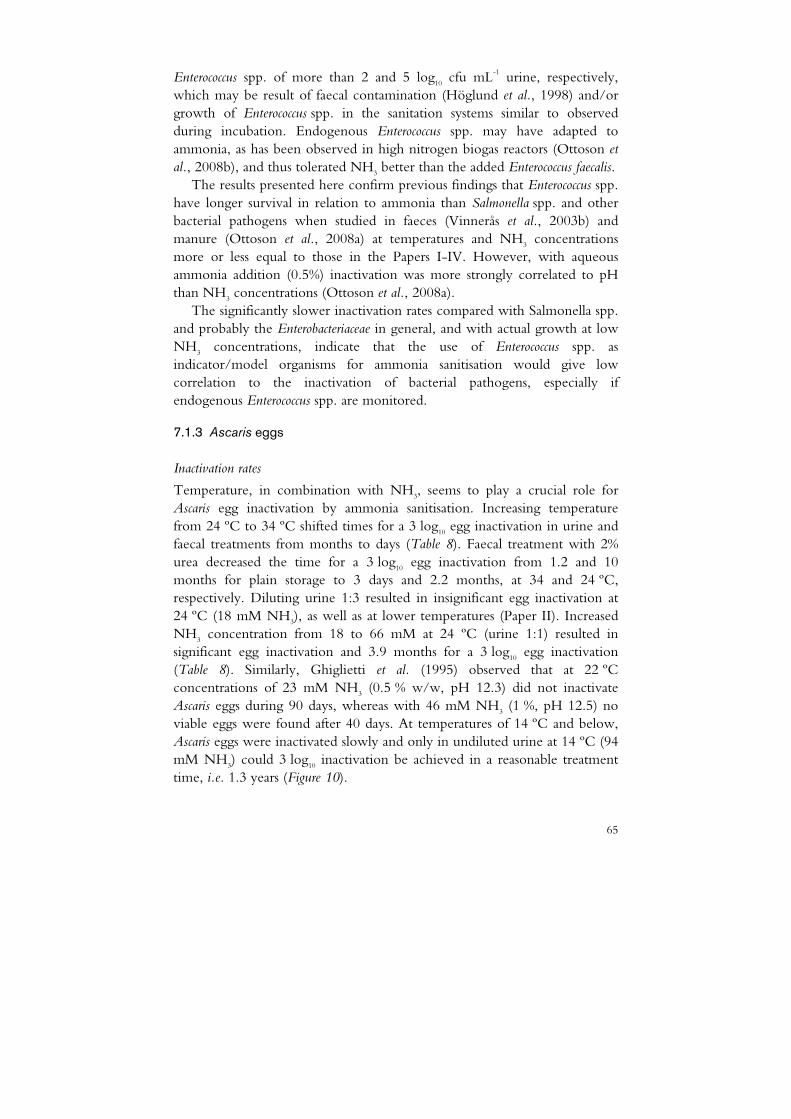
65
Enterococcus spp. of more than 2 and 5 log10 cfu mL-1 urine, respectively, which may be result of faecal contamination (Höglund et al., 1998) and/or growth of Enterococcus spp. in the sanitation systems similar to observed during incubation. Endogenous Enterococcus spp. may have adapted to ammonia, as has been observed in high nitrogen biogas reactors (Ottoson et al., 2008b), and thus tolerated NH3 better than the added Enterococcus faecalis.
The results presented here confirm previous findings that Enterococcus spp. have longer survival in relation to ammonia than Salmonella spp. and other bacterial pathogens when studied in faeces (Vinnerås et al., 2003b) and manure (Ottoson et al., 2008a) at temperatures and NH3 concentrations more or less equal to those in the Papers I-IV. However, with aqueous ammonia addition (0.5%) inactivation was more strongly correlated to pH than NH3 concentrations (Ottoson et al., 2008a).
The significantly slower inactivation rates compared with Salmonella spp. and probably the Enterobacteriaceae in general, and with actual growth at low NH3 concentrations, indicate that the use of Enterococcus spp. as indicator/model organisms for ammonia sanitisation would give low correlation to the inactivation of bacterial pathogens, especially if endogenous Enterococcus spp. are monitored.
7.1.3 Ascaris eggs
Inactivation rates
Temperature, in combination with NH3, seems to play a crucial role for Ascaris egg inactivation by ammonia sanitisation. Increasing temperature from 24 ºC to 34 ºC shifted times for a 3 log10 egg inactivation in urine and faecal treatments from months to days (Table 8). Faecal treatment with 2% urea decreased the time for a 3 log10 egg inactivation from 1.2 and 10 months for plain storage to 3 days and 2.2 months, at 34 and 24 ºC, respectively. Diluting urine 1:3 resulted in insignificant egg inactivation at 24 ºC (18 mM NH3), as well as at lower temperatures (Paper II). Increased NH3 concentration from 18 to 66 mM at 24 ºC (urine 1:1) resulted in significant egg inactivation and 3.9 months for a 3 log10 egg inactivation (Table 8). Similarly, Ghiglietti et al. (1995) observed that at 22 ºC concentrations of 23 mM NH3 (0.5 % w/w, pH 12.3) did not inactivate Ascaris eggs during 90 days, whereas with 46 mM NH3 (1 %, pH 12.5) no viable eggs were found after 40 days. At temperatures of 14 ºC and below, Ascaris eggs were inactivated slowly and only in undiluted urine at 14 ºC (94 mM NH3) could 3 log10 inactivation be achieved in a reasonable treatment time, i.e. 1.3 years (Figure 10).

66
Stored faeces at 24 ºC had NH3 concentrations similar to those in urine diluted 1:3, but nevertheless inactivation in faeces was significant, even though slow (3 log10 in 10 months). Similarly, Ascaris eggs have been inactivated in sewage sludge with negligible NH3 concentrations but not in water with 0.5% NH3 (Ghiglietti et al., 1997). When Ascaris inactivation was studied in urea-treated faeces at 14 ºC, no viable eggs (of approximately 500 counted) were detected at day 41 (Nordin, 2006), which is a faster inactivation than in the present studies of urine. Urea treatment did not result in inactivation different from that in untreated faeces, but low initial faecal pH resulted in a pH decline and low NH3 concentrations from urea treatments (Nordin, 2006). Components from faecal material may affect Ascaris egg inactivation in a similar way to that observed for Salmonella spp. A low faecal pH seems to be related to inactivation, but bacteria have also been shown to interact (Adedeji et al., 1988).
When Ascaris inactivation was studied in urine at ambient exposure, the variation in temperature and the peak temperatures reaches (Figure 3), had a major effect on Ascaris inactivation time in combination with ammonia. A lag was detected only for the full sun complementary study, where sampling was performed more frequently (Table 1). The slight higher max temperature when exposed to full sun (21.1-29.1 ºC) compared with the wall location (21.3-26.0 ºC) more than halved the time for a 3 log10 Ascaris egg inactivation to 1.5 from 3.5 months, whereas in the room location (20.9-22.2 ºC), 10 months were estimated required for a 3 log10 egg inactivation. At constant temperature of 24 ºC inactivation was faster than in the room, despite lower NH3 concentrations (Table 3 & Table 8). The wall location (21.3-26.0 ºC; 75-111 mM NH3) resulted in an inactivation rate not very different from that in urine diluted 1:1 at 24 ºC (60-66 mM) (3.5 and 3.9 months, respectively).
Figure 10 depicts the estimated time for a 3 log10 inactivation related to temperature and NH3 concentration. It was not possible to determine whether higher ammonia concentrations can give faster inactivation at temperatures of 14 ºC and below, or whether it is the temperature that limits inactivation rate. Apart from in the present study and Nordin (2006), ammonia treatment for Ascaris inactivation has only been studied at room temperature and above.
In the present study, samples amended with ash all had shorter time for inactivation compared with ash-free samples with similar NH3 concentrations and lower pH, whereas in the absence of ammonia, egg viability was not reduced in one week at pH 13 at 24 °C, similar to the 90 days at pH 12.3 reported by Ghiglietti et al. (1995). However, ash treatment

67
was only studied at 24 and 34 ºC. With alkaline treatment at temperatures of 4-6 ºC, it took 435 days to reach a 99% decrease in Ascaris egg viability with lime doses equal to or more than 80 g kg-1 TS (Abu-Orf MM, 2004; Brewster et al., 2003). This indicates that temperature may also be a key factor for the efficiency of alkali treatment.
0
50
100
150
200
250
300
350
400
450
500
0 10 20 30 40
Temperature (°C)
NH
3 (m
M)
2.9 d
7.0 d
7.9 d
8.4 d
19 d3-4 d
36 d
2.2 m
19 d
3.9 m
6.8 m
4.9 m
3.9 m
>2 yrs>2 yrs
1.3 yrs
>2 yrs
>2 yrs
0
50
100
150
200
250
300
350
400
450
500
0 10 20 30 40
Temperature (°C)
NH
3 (m
M)
2.9 d
7.0 d
7.9 d
8.4 d
19 d3-4 d
36 d
2.2 m
19 d
3.9 m
6.8 m
4.9 m
3.9 m
>2 yrs>2 yrs
1.3 yrs
>2 yrs
>2 yrs
2.9 d
7.0 d
7.9 d
8.4 d
19 d3-4 d
36 d
2.2 m
19 d
3.9 m
6.8 m
4.9 m
3.9 m
>2 yrs>2 yrs
1.3 yrs
>2 yrs
>2 yrs
Figure 10. Time for a 3 log10 reduction of Ascaris suum egg viability marked in relation to combinations of temperatures and NH3 concentration reached in urine (○) and faecal treatments with 2% urea (■), 1% urea (■), and 1% urea+ash (□) and only ash (▲). Inactivation times for treatments with ash are given in bold figures.
Initial delays in organism inactivation are neither rare nor surprising, since it is natural that a disinfectant needs time to pass cellular barriers. Even for Salmonella spp. a small initial lag phase was noted when frequently monitored during 24 h. Ascaris eggs have a complex egg wall normally composed of four layers, with each of them offering some special resistance to environmental factors (Wharton, 1980).
In conclusion, since inactivation patterns for Ascaris eggs vary both between and within studies, it could be recommended that the sampling covers the span of the whole inactivation to better estimate the inactivation rates and treatment efficiency.

68
Ascaris and other persistent parasites
In general, the eggs of Ascaris and Trichuris spp. are considered among the most persistent infectious pathogens. When ammonia inactivation of Ascaris eggs has been studied in relation to eggs of other helminths such as Trichuris muris and Diphyllobothrium latum, Ascaris eggs have proven to be the most resistant (Ghiglietti et al., 1995; Chefranova et al., 1978).
Of the protozoan pathogens, Cryptosporidium spp. oocysts are considered the most tolerant to disinfection. Studies have shown that ammonia is more efficient in reducing Cryptosporidium parvum and C. baileyi, viability as well as numbers, compared with many disinfectants commonly used against cryptosporidia (Sundermann et al., 1987; Campbell et al., 1982). However, in those studies ammonia was applied in higher concentrations than relevant for fertiliser production. Finstein (2004), reviewing literature on cryptosporidia inactivation, concluded that temperature and ammonia are the two main inactivation factors in biowaste. In a study by Jenkins et al. (1998), wild-type cryptosporidium oocysts were treated at 24 ºC with ammonium solution (7-148 mM NH3) with exposure time from 10 minutes to 24 hours. Exposure to 148 mM for 24 hours reduced the viable oocysts by 80% and 5.8 days were estimated to be required for 5 log10 inactivation.
Even at lower temperatures, Cryptosporidium spp. is inactivated by ammonia. Exposure of C. parvum oocysts to 5 and 50 mg NH3 L
-1 for 4 days at 4 ºC reduced their viability from ~80% to 41.5% and 14.8%, respectively (Reinoso et al., 2007). In source-separated urine at 4 ºC (pH 9, ~30 mM NH3) C. parvum oocysts were inactivated below the detection limit (1/300) within 63 days, corresponding to a t90 of 29 days (Höglund & Stenström, 1999). Regarding other protozoa, biocidal effects of ammonia on Entamoeba histolytica, Entamoeba coli and Lamblia intestinalis in faeces (3% NH3 w/w) have been observed (Gordeeva & Chefranova, 1977).
These findings indicate that Ascaris spp. can be regarded as a good model for parasite inactivation by ammonia-based sanitation techniques, as it seems to be one of the most resistant parasites of concern for human health. However, at temperatures of 14 ºC and below, inactivation of Ascaris eggs is slow and thus at these temperatures Ascaris would probably underestimate the inactivation of other parasites, although it is itself an important parasite to consider.
7.1.4 Bacteriophages
In general, S. Typhimurium phage 28B was the most persistent of the phages studied, especially at the lower urine temperatures. In urine at 34 ºC, all phages were inactivated at similar rates, with t90 of 2-13 days, whereas no

69
reduction in bacteriophage 28B was observed in faeces stored for one month at 34 °C. A more rapid inactivation when urine was undiluted was observed at temperatures of 24 ºC and above. Bacteriophage inactivation at 14 °C and below was not clearly related to NH3 concentration, which may partly be explained by the fact that the derivation of inactivation kinetics for MS 2 and Фx 174 did not include the first initial phase, with fast inactivation (Paper I).
Treatment of faecal material (TS 10%) with 6% urea at 20 ºC (470 mM NH3) has been reported to result in a t90 value of 7.5 days for S. Typhimurium phage 28B (Vinnerås et al., 2003b). This is faster than in any of the faecal treatments at 24 ºC in the present study. However, NH3 was also higher.
Since bacteriophages differ from animal viruses in many features, studying them along with animal viruses gives indications of their relevance as viral models. The inactivation of S. Typhimurium phage 28B in urine (Paper I) was similar to the inactivation reported by Höglund et al. (2002) at 5 and 20 °C, i.e. 71 days at 20 °C (60-70 mM NH3) and little reduction in 200 days at 5 °C. Höglund et al. (2002) also studied rhesus rotavirus (double-stranded RNA), which was considerably more sensitive than S. Typhimurium phage 28B. However, no significant difference was observed between rotavirus inactivation in urine and physiological saline controls, either at 4 or 20 °C.
Phages as viral models
The viricidal effect of ammonia at 21 °C has been tested on several polioviruses and other enteric viruses, including coxsackie and reoviruses (Ward, 1978; Ward & Ashley, 1977). The reduction at pH 9.5 (290 mM NH3) was found to be rapid for all viruses (>5 log10 reduction in 24 h) except reovirus (dsRNA), which was slightly less sensitive to the treatment (~2 log10 reduction in 24 h). The inactivation of poliovirus and bacteriophage f2, with structure comparable to that of MS2, was further examined by (Cramer et al., 1983) at 20 °C. Both organisms showed a log-linear correlation between NH3 (2-180 mM) and k (corresponding to t90 values 1-90 days), with polio having a 4.5 faster inactivation than bacteriophage f2. A similar correlation between MS2 and Avian flu has been observed by Emmoth et al. (manuscript). Only when the bacteriophages were studied at varying temperature (Paper III) the inactivation could be related to the genome type (Table 3) as proposed above. Studies on the enteric viruses indicate that they may be reduced faster than the phages tested here.

70
7.2 Achieving critical NH3 concentrations
7.2.1 pH
Biomaterial such as manure, latrine waste and digestate is often rich in nitrogen, with substantial amounts in the form of ammonia/ammonium (Rodhe et al., 2004; Rotz, 2004) However, at neutral or slightly alkaline pH, only a small fraction of the ammonia is present as NH3, irrespective of temperature (Figure 2). Thus the sanitisation of faeces differs largely from urine, which is self-sanitising due to decomposition of urea resulting in an alkaline pH. For example, in the present study urine diluted 1:1 resulted in t90 for Salmonella spp. of less than 5.3 days compared with 49 days for untreated faecal material (Paper IV), despite the similar TAN concentrations, 3.0-3.5 and 2.9-3.2 g L-1, respectively. With a pH of 8.0, which was the most common in faeces (Table 6), the fraction of ammonia present as NH3 will be at most 10% at 34 ºC.
Even in urine the importance of pH was obvious, as small differences in pH, overrode the effect on NH3 formation of less dilution and a 10 ºC increase in temperature (Paper I). The pH in urine from different sources in the present study (8.7-9.3) could not be related to dilution or the TAN concentration. The lowest pH was observed at day 150 and not at the start of the study. The decline in pH on adding bacterial solutions and during incubation (Paper I), as well as the increase in pH indicating that urea was not completely degraded at the start of the experiment when collected fresh (Paper III), have to be partly considered laboratory artefacts. Small samples from few people can probably differ in pH due to dietary conditions.
Urine pH has been found to stabilise at 9 when about 50% of the nitrogen is in the form of TAN at concentrations ranging from 12.5 to 100% urine in urine-water mixtures (Hellström et al., 1999). However, pH values lower than 9 have been reported from urine storage tanks, as well as in the present study. Chandran et al. (2009) observed that pH was 0.2 units lower when urine collected fresh was subsequently diluted 1:1 with water. Pradhan et al. (2007) reported a pH as low as 8.6, but the low nitrogen concentration of 0.9 g L-1 indicates a very high degree of dilution, more than 1:9, or large ammonia losses.
Adding urea to faecal matter increased and stabilised the pH (Table 6) at a range similar to that measured in urine. However, when treating faeces of low initial pH (6.6), pH declined with time, as reflected by lower microbial inactivation rates. A pH of 6.8-7.5 is considered normal for stool samples (www.medicinenet.com). However, the pH upon excretion in faeces from African and Asiatic people as well as from vegetarians and lactose-intolerant

71
people, seems to be somewhat lower than that range (Reddy et al., 1998; Polprasert & Valencia, 1981; Madanagopalan et al., 1970). Vinnerås et al. (2003a) and Andersson & Jensen (2002) reported pH of 8.1 and 7.6 in faeces collected from the same sources as in the present study.
Treating faecal material with 1.5% urea increased the pH to at least 8.9 despite low initial pH (Table 6), whereas with 0.5% urea at most 8.6 was reached, even when treating faeces with an initial pH of 8. Treating faeces with initial pH 8 with 1-2% urea gave a stable pH (max 0.2 units decline) for 60 days. During that time Salmonella spp. would be inactivated by more than 6 log10 at 14 ºC and above (not investigated at 4 ºC). With 2% urea, similar pH values as in the present study have been reached (9.2 and 8.8, respectively) when added to manure with 12% TS and pH 8.0-8.2 (Ottoson et al., 2008a) and sewage sludge with 28% TS and pH 7.5 (Sylwan, 2010). At higher rates of urea, 4% and 6%, added to faeces with 17 and 10% TS, a pH of 8.9 and 9.2 (increasing to 9.5 within a few hours) was achieved (Fidjeland, 2010; Vinnerås, 2007).
The results above do not clearly show any relationship between pH and TS, which could be expected from studies of sewage sludge (10% TS) where a higher pH from ammonia solution was reached the more the sludge was diluted with water (1:2-1:10) (Allievi et al., 1994). Treating aerobic and anaerobic sludge (10% TS) with 0.5% (w/w) NH3, resulted in pH 9.5 and 10, respectively, despite a higher initial pH in the aerobic sludge (Allievi et al., 1994). With the same treatment, 0.5% NH3, of manure (12% TS, pH 8.0-8.2) Ottoson et al. (2008) achieved a pH 9.6-9.7, whereas Mendez et al. (2004) treating sewage sludge (5.4% TS) reached pH 9.7 with 10% (w/w) NH3 and required 20% to reach pH 10.3.
7.2.2 Ammonia nitrogen
On a dry matter basis, the faecal TAN concentrations measured in the present study fell between the concentration in faeces collected from the same sources (Andersson & Jensen, 2002; Vinnerås & Jönsson, 2002) and Swedish default values (Jönsson et al., 2005). Only increasing the pH to 9 at such TAN concentrations would generate NH3 concentrations similar to those in urine diluted 1:1. However, it is difficult to achieve a stable pH below pH 12 by alkaline treatment of biomaterial (Pecson et al., 2007; Boost & Poon, 1998). Adding ash to faecal matter in the present study resulted in pH 10.5 and 12.8, with the higher pH from sieved ash. At such pH, 94-100% of the TAN will be present in the form of NH3. However, by day 19 the pH of 10.5 had decreased to 9.7. When faeces with initial pH of 6.6 were treated with lime to pH 9.0, a decline to pH 7 was observed after 13

72
days and the pH continued to decrease (Nordin, 2006). Alteration of the pH in source-separated urine is not commonly practised, but as a result of accidentally misplaced ash, urine pH as high as 11.8 has been measured in source-separating sanitation systems (Tesfaye, 2009). For the urine diluted 1:3, an increase in pH from 8.7 to at least 9.4 at 24 ºC would increase NH3 concentration to 60 mM, giving significant Ascaris egg inactivation.
Treating faeces with urea will not only increase pH, but also the TAN concentrations. In the present study, 1 and 2% urea resulted in approximately double (6.2-7.6 g L-1) and fourfold (9.5-12.1 g L-1) the TAN concentration, respectively (Table 5), compared with untreated faeces. This is similar and more TAN, respectively, than in the undiluted urine in the present study (Table 3). Although added urea was never completely recovered as ammonia, measurements indicated that at least 75 and 79% of the 1 and 2% urea added, respectively, had degraded into TAN. Later measurements showed lower recovery of TAN from urea, 58-59%, which may indicate subsequent losses. Sylwan (2010) experienced similar TAN recovery, but analyses of total nitrogen (Kjeldahl N) showed that nitrogen from urea was still present in the material but not detectable as total ammonia. A recent study indicates that urea or ammonia from urea addition seems to some extent to complex bind to organic material (Agostini, unpublished).
The subsequent dilution 1:3 of urine initially containing 6.1-6.2 g TAN L-1 was found to be critical for the significance of Ascaris egg inactivation at 24 ºC (Paper I). Collecting urine fresh, i.e. no dilution and no losses expected from the sanitation system, TAN concentrations were in the range 6.0-6.6 g L-1. Although lower than the Swedish default value of 6.8 g TAN L-1 (Jönsson et al., 2005), the urine collected fresh from a Swedish household had higher TAN concentrations compared with the urine from the no-flush sanitation system in Uganda (4.2 g L-1) (Table 2). The lower TAN concentration in Uganda may be explained by public toilets not collecting morning urine to any large extent and to the urine in Sweden being collected from single households and thus not representative of the whole population. However, a diet with less processed food and a lower animal protein and total protein intake will give less nitrogen excreted via the urine. Estimates based on the intake of proteins put nitrogen urine excretion at 2.2 kg p-1 yr-1 in Uganda, compared with 4.0 kg p-1 yr-1 in Sweden (Jönsson & Vinnerås, 2003).

73
7.2.3 Temperature
Most often urine and faeces are treated at ambient temperatures, thermal composting excluded. However, solar toilets aim at sanitising faeces by a combination of elevated temperature and desiccation. In the present study exposure of urine jerry cans to sun was investigated as a means to increase urine temperature (Paper III). An increase in temperature increases the efficiency of ammonia sanitisation by increasing the formation of NH3 and the direct effect of the NH3 present (Papers I & II). Thus it is difficult to estimate the temperature increase necessary to get inactivation e.g. of Ascaris eggs. At 24 ºC, 60 mM was the lowest NH3 concentration at which egg inactivation was observed, whereas at 34 ºC, 40 mM NH3 (i.e. urine diluted 1:3) inactivated Ascaris eggs. A smaller increase in temperature than 10 ºC might result in significant inactivation of Ascaris eggs. If urine is collected undiluted, increasing the temperature to above 14 ºC can shorten Ascaris egg inactivation time substantially (Table 8).
When jerry cans were exposed to ambient conditions, even small differences in maximum temperature, 29 ºC compared with 26 ºC (minimum temperature equal), more than halved the time for a 3 log10 reduction in Ascaris eggs and was 6 times faster than in the room with temperature of 21-22 ºC (Table 3). However, exposure to sun (full sun and wall) and the resulting increase in temperature did not give any enhanced inactivation of Enterococcus spp. compared with in the room location, indicating that ammonia or temperature thresholds were not reached. However Enterococcus spp. concentrations declined, supporting the findings by Ottoson et al. (2007) that pH has a larger influence on the inactivation of Enterococcus spp. than ammonia concentration.
Fluctuations in temperature in the sub-lethal range have been found to inactivate E. coli and S. Typhimurium at significantly faster rates compared with mean temperatures held constant (Semenov et al., 2007). However, a fluctuating temperature did not result in faster inactivation compared with constant temperature higher than the fluctuating temperature range. Heat death of a cell results in part from thermal inactivation of its enzymes (Haug, 1993), a mechanism different from that suggested for ammonia inactivation.
With ammonia sanitisation NH3 concentrations will fluctuate along with fluctuating temperature. The different temperature variation at the three ambient locations resulted in NH3 profiles that correlated to temperature, as the pH was stable at 8.9-9.0 during the study, irrespective of location (Figure 11). Considering the lower pH 8.9 and the TAN concentration of 4.2 g N L-1 the NH3 concentrations were never less than 70 mM for any of the three exposures, considering the mid-point temperature (Table 3). The

74
peak NH3 concentrations were 124, 113 and 95 mM for the full sun, wall and room location, respectively.
70
80
90
100
110
120
130
140
150
160
0.00 4.00 8.00 12.00 16.00 20.00 24.00
Time of day (hour)
NH
3 (m
M)
Figure 11. NH3 concentrations (mM) at each hour during an average day as a function of pH 8.9, 4.2 g TAN L-1 and the urine temperature (mid-point measurement) at the full sun (black), wall (grey) and room (shaded) locations and at constant temperatures of 24 and 34 ºC (lower and upper broken lines).
7.3 Ammonia sanitisation efficiency
7.3.1 Product and process verification
Swedish EPA (2010) suggests product quality of sanitation fractions, other than urine, to be validated with less than 1000 E. coli g-1 TS for class B. This is similar to WHO guidelines (2006), whereas for Class A products Enterococcus spp. should also comprise less than 1000 g-1 TS (Table 1). Enterococci are present in faeces in densities between 105 and 107 cfu g-1 faeces and E. coli at slight higher concentrations, 107 to 109 cfu g-1 faeces. Assuming the concentration per g TS to be 1 log10 higher compared with in wet faeces, and with a TS of 10%, more than 5 and 7 log10 reduction in Enterococcus and E. coli, respectively, may be needed to reach Class A quality. A 5 log10 reduction in Enterococcus faecalis is also suggested as process validation of Category 3 ABP products by EC regulation No. 208 (2006) (Table 1).

75
Based on the correlation shown between Salmonella spp. and E. coli inactivation, they can be assumed to be inactivated at the same rate by ammonia sanitisation. Thus the 7 log10 reduction in E. coli. assessed to be needed to reach SEPA (2010) product quality would give corresponding inactivation of Salmonella spp., i.e. more than the 5 log10 suggested for process validation by the EC (2006) for Category 3 ABP and manure. Whether such reduction resulting in less than 1000 E. coli g-1 TS would result in an absence of Salmonella spp. in 25 g wet weight is a matter of prevalence. However, Salmonella spp. have to be initially present in a concentration of 106 cfu g-1 wet weight to not fulfil the product quality requirement in relation to E. coli reduction.
According to the present results (Table 3 and Figure 7), a 5 log10 Enterococcus reduction would almost certainly result in a corresponding 7 log10 reduction in E. coli and Salmonella spp. Table 3 shows the treatment times required to achieve some of the discussed reductions in bacterial concentrations by ammonia sanitation. It should be noted that those times are based on the upper 95% CI value from repeated trials, including that performed with faeces with low initial pH.
Table 9. Treatment time required to achieve a reduction in Salmonella spp. and E. coli (7 log10), Enterococcus (5 log10) and Ascaris eggs (3 log10) in source-separated faeces during urea treatment (0-2% urea) at temperatures 14, 24 and 34 ºC. Figures rounded up to closest half unit and <1 week the shortest treatment time given
Temperature (ºC)
Urea (% w/w)
Salmonella and E. coli (7 log10)
Enterococcus (5 log10)
Ascaris eggs (3 log10)
14 0 10 months Slow reduction -
1 2 months 14 months -
2 2 weeks 8 months -
24 0 1.5 months 7.5 months 11 months
1 1 week 3 months 7 months
2 <1 week 2.5 months 2.5 months
34 0 1.5 weeks 1 months 1.5 months
1 <1 week 2.5 weeks 1.5 weeks
2 <1 week <2 weeks <1 week
A 5 log10 reduction in Enterococcus in faecal material for process verification would almost certainly result in the quality verification of absence of Salmonella spp. in 25 g wet material being reached. The WHO recommended storage time of at least 1.5 (below 20 ºC) and 1 year (above 20 ºC) will most probably render the faeces safe regarding bacterial pathogens such as Salmonella. Whether a 3 log10 reduction in viable Ascaris

76
eggs, as required by EC (2006) when validating chemical treatment of ABP, can achieve the product quality of less than 1 viable egg per gram TS recommended by WHO (2006) is dependent on the incoming concentration, i.e. the prevalence of Ascaris. If faecal material contains 1000 Ascaris eggs g-1 faeces wet weight (Schönning et al., 2007; Westrell, 2004), more than a 4 log10 reduction may be required to reach the WHO product validation requirements. However, Table 9 gives the time for a 3 log10 reduction, since the lag model resulted in concentration/count-specific inactivation kinetics.
7.3.2 WHO guidelines and Ammonia sanitisation
WHO (2006) considers that the target value of <104 E. coli per gram of treated faecal material applied would ensure a comparative level of safety against bacterial pathogens and probably against viral pathogens as well. However, WHO does not recommend use of E. coli concentrations for verification monitoring for collected urine, due to a rapid die-off of the bacteria in this medium, which could also be assumed to apply for ammonia-treated faeces.
WHO (2006) mainly consider storage and alkali for faecal treatments and the product quality recommendation of less than 1 helminth ovum g-1 TS is based on application of 10 tonnes treated faeces (25% TS) ha-1 year-1. Such application of urea-treated faeces would result in 150 and 200 N ha-1 yr-1 with urea treatment of 1 and 2% (w/w), respectively.
Urine storage times recommended by WHO (2006) are based on a nitrogen content of at least 1 g L-1 and pH of minimum 8.8. However, such material composition would result in NH3 concentrations (Figure 12) lower than investigated at each temperature in the present work. At 4 ºC the NH3 would be 5 mM, i.e. the threshold concentration for Salmonella inactivation detected by Diez-Gonzalez et al. (2000). With pH 8.8 and 1 g N L-1, the inactivation of Ascaris eggs may be negligible even after 6 months at 20 ºC (Table 8). The urine recommendations in WHO guidelines, even if Ascaris eggs are not considered, ought to be set in relation to the temperature related NH3 concentrations.
7.4 Treatment implications
7.4.1 Source-separated urine
The collected findings indicate that at dilutions relevant for sanitation systems, components buffering against pH changes in urine seem to be

77
present at sufficiently high concentrations (Hellström et al., 1999). Provided a system has been in use long enough for urease-producing biofilm to develop, pH can be assumed to be 8.9 and above in any collection tank or container connected to a system with low flush. This is supported by most literature, reporting pH of 8.9-9.2 in sanitation systems of different degrees of dilution and TAN concentrations, in northern Europe (Chandran et al., 2009; Pradhan et al., 2009; Udert et al., 2003; Andersson & Jensen, 2002; Jönsson et al., 1997b; Kirchmann & Pettersson, 1995) as well as in Asia (Yang et al., 2003) and Africa (Paper III; (Mnkeni et al., 2006).
Dilution with flushwater will thus mainly affect the TAN concentrations. In Sweden, most urine-separating sanitation systems have some kind of flush system for the urine, but the amount used differs widely between different toilets and the user’s behaviour. In a Swedish eco-village, 16 to 290 mL water are used per flush, resulting in an average dilution of urine less than 3:1 with tap water. This is considered a low dilution as a result of committed users (Andersson & Jensen, 2002). Most other studies have assessed the dilution with flushwater to be 1:1 or 1:2. A 1:3 dilution with flushwater can be considered a high rate for a sanitation system and is only reported from one source, resulting in 1.7 g TAN L-1 (Udert et al., 2003). In general, TAN concentrations in urine collection tanks are higher than the 1.4-1.8 g L-1 measured in the present study with 1:3 dilution (Papers I & II). When urine is collected without any flushwater, TAN concentrations still vary due to diet and habits.
Volatile losses of TAN in urine-separating systems, mainly from the storage tank, can decrease the final urine nitrogen concentrations. In Sweden, such losses were estimated at max. 0.5% based on air exchange (Jönsson et al., 2000). At tropical temperatures, volatile losses during collection and storage can be expected to be higher. In the present studies losses were recorded at constant temperatures of 24 and 34 ºC but despite frequent sampling of treatment containers did not exceed 8% (Paper I).
Even if dilutions in the present studies related to each other regarding TAN (Paper I), assessment of degree of dilution seems to say little about total ammonia concentrations. Thus these should preferably be measured to make the right assumptions about pathogen inactivation rates. TAN concentrations can be estimated accurately in the field with quick sticks based on colorimetric methods. The ammonia concentration, which constitutes most of the nitrogen in urine, can then be used to provide farmers with information on nutrient content. The nitrogen content is important for the efficient use of urine, especially if mineral fertilisers are to be replaced (Tidåker, 2007).

78
Figure 12 shows that keeping urine undiluted can be crucial for reaching NH3 concentrations sufficient for pathogen inactivation, i.e. between 40 and 60 mM at 24ºC and below. However, temperature itself is critical for ammonia sanitisation and at 14 ºC Ascaris eggs will be slowly inactivated despite fairly high NH3 concentrations, i.e. as in undiluted urine. In countries with a temperate climate, e.g. Sweden, temperatures in large-scale underground storage are not likely to reach 20 ºC. However, in Sweden and Europe in general, human Ascaridiasis is rare and the risk related to fertilising with urine is probably very low.
0
50
100
150
200
250
0 5 10 15 20 25 30 35 40
Temperature (°C)
NH
3 (m
M)
0
50
100
150
200
250
0 5 10 15 20 25 30 35 40
Temperature (°C)
NH
3 (m
M)
Figure 12. NH3 formation in urine at 0-40 ºC based pH 9.0 and 6.8 g TAN L-1 (Jönsson et al., 2005) and dilutions 1:0 (black); 1:1 (grey) and 1:3 (shaded/white) thereof. Broken line shows NH3 formed at the combination of 1 g N L-1 (94% assumed as TAN) and pH 8.8 (WHO, 2006). Circles give the NH3 concentrations in the present study at constant temperature (dilution colour marked according to above) (Paper I) and shaded areas give the NH3 for varying temperature at full sun location (lower), and incubator setting (upper) (Paper III).
Enhancing pathogen inactivation by increasing the urine temperature by exposure of containers to sun seems to be a good idea when collection containers are small (high surface to volume ratio high), storage capacity is limited or urine is used continuously, as in countries with several cropping

79
seasons per year. Placement of urine containers adjacent to a wall gave slightly higher urine temperature during the night and morning hours than exposure in the open and the thermal capacity of the wall may partly explain the lower peak temperatures (Paper III). If there are more than three hours of sun per day, as in the present study (Paper III), even higher temperatures can be achieved. Despite lower ambient temperatures, initial tests in Sweden have with enhancement reached water temperatures of 45 ºC in a 20 L container (Niwagaba, unpublished). Such further development of urine heating solar systems using with e.g. reflectors can be useful in regions with high prevalence of Ascaridiasis in combination with temperate climate, e.g. large parts of China and Latin America.
For safe use of urine after 6 months of storage at 20 ºC, as suggested by WHO (2006), it also needs to have an ammonia content of 60 mM to inactivate Ascaris eggs. If this concentration is achieved, e.g. by 4.2 g TAN L-1 and pH 8.8 or 2.9 g TAN L-1 and pH 9.0, the storage time can be shortened to 1 month at a temperature of 34 ºC. When urine temperature varies above 20 ºC, the mean temperature could be used to relate to recommendations based on constant temperatures and would then most likely give a higher pathogen inactivation than the constant temperature (Paper III). At temperatures below 20 ºC, no assurance can be given that urine is safe regarding content of viruses (WHO, 2006) or Ascaris eggs (Paper II). However, at NH3 concentrations of 60 mM (in the present study achieved in undiluted urine at 14 ºC) restricted use to crops not intended for human consumption can be accepted after only 1 month of storage, even at temperatures as low as 4 ºC, as the two major zoonotic risk organisms in urine, Salmonella and Cryptosporidium, will be inactivated (Höglund & Stenström, 1999; Jenkins et al., 1998); Paper I).
Urine at container bottoms has higher concentrations of organisms (Höglund et al., 2000) especially Ascaris and other parasitic eggs and cysts, which sediment easily (Panicker and Krishnamoorthi, 1981). To avoid cooling effects from the surface, as observed in the present study (Paper III), the cans can be put on a pallet or on some insulating material, since even small increases in temperature can contribute to Ascaris inactivation. In general, avoiding fertilising with urine bottom sludge could be a means to avoid risks from Ascaris if sanitisation is not achieved.
To generalise, having sanitation systems that keep the urine as concentrated as possible, i.e. no or low flush systems, is the simplest way to enhance pathogen inactivation in source-separated urine. Another positive effect from collecting urine undiluted is that systems without flushwater seem less prone to clogging (Udert et al., 2003b).

80
7.4.2 Faecal urea treatment
Adding urea to faecal material gives an alkaline pH, important for NH3 formation, as well as increasing the total ammonia concentration (Paper IV). The collected findings indicate that pH may increase in proportion to the rate of urea addition until a breakpoint is reached where further additions will contribute little to further pH increase. The composition of the untreated material seems to determine the pH reached and its stability. Similar material dependency is observed when ammonia solution is used, but the resulting pH at breakpoint is higher than for urea (Ottoson et al., 2008a; Mendez et al., 2002; Allievi et al., 1994). To generalise, urea will give a pH above 9 and ammonia solution a pH above 10, provided the breakpoint is reached.
Lower TS through dilution would probably result in higher pH, although this conclusion could not be drawn when comparing urea added to different materials. Until knowledge gaps are filled, urea is recommended to be added at rates higher than 0.5% to faecal matter with TS as high as in the present study, 17-20%.
Two approaches can be envisaged with urea and ammonia treatment: to strive to keep additions and costs at a minimum level or to adjust the final nitrogen content to the fertiliser application. For the former it may be wise to monitor pH, since it may decrease to a level critical for ammonia sanitisation if urea or ammonia addition is low. With the latter it is important to use TAN concentrations that are applicable to common operational practices and equipment at the farm. With current fertiliser equipment the concentration should not be higher than about 10 g TAN per litre, corresponding to urea addition of 2% w/w or 1% ammonia from solution.
Dry matter may affect the mixing of the ammonia amendment into the material. A dry matter content above 20% was found to be critical for intermixing, and thus Ascaris egg inactivation, when cesspools were disinfected with liquid ammonia (1.5 to 6%) (Chefranova et al., 1984). During collection in a dry system, unless flushwater, urine or accidental water enters the collection bins, the moisture content will decrease from the initial 10-23% (Lentner & Geigy, 1981). In the present studies the collected faeces contained 25.7 to 27.0% TS, which was standardised to 17-20% before use. Other faeces of the same origin were reported to have a TS of 18-23.5% (Vinnerås et al., 2003a; Andersson & Jensen, 2002; Vinnerås & Jönsson, 2002), despite including toilet paper, in contrast to the present study. Urea can be assumed at the large scale to encounter similar problems with mixing at high TS, but water can be added to enhance mixing. Urea

81
distribution and decomposition have been shown to increase with increasing moisture content (Vinnerås et al., 2009).
However, at equal urea addition made on wet basis, a higher TS will result in higher TAN concentration in the solute when the urea has decomposed. A higher solute concentration may account for lower pH in material high in TS. However, depending on texture, a material with high TS may be easier to mix with urea. Mature compost with 75-82% TS supplemented with 6.5% wet-weight urea with the aim of enhancing the fertiliser value also resulted in sanitisation of the material (Adamtey et al., 2009).
It seems that urea is not likely to be 100% degraded (Paper IV; Sylwan, 2010; Agostini, unpublished). If sanitisation estimates are based on the present treatment additions of urea (Table 9), such non-degraded urea is accounted for within the recommendation. Even if not all nitrogen added by urea can be accounted for in the sanitisation, the nutrient value has to be based on all nitrogen added.
Increasing the pH with ash or lime or other alkaline agent can result in substantial NH3 formation in faecal matter. The high pH of 12.8 in the present study cannot be considered representative due to the sieving, whereas the pH of 10.5 reached with unsieved ash (1 L kg-1 faeces) is more likely (Tesfaye, 2009; Moe & Izurieta, 2003). However, when ash is added continuously during collection, ammonia nitrogen is at high risk of being lost and the effect from increased pH will probably be lower that that seen in the present ash studies, where the containers were closed upon the addition of ash. Adjustment of the moisture content in the ash treatments, beneficial for a homogeneous distribution of hydroxide ions, may also explain the higher inactivation of Ascaris eggs in relation to pH compared with other studies (Sanguinetti et al., 2007).
The high pH from the ash probably inhibited the hydrolysis of the urea (Kabdasli et al., 2006), explaining very low ammonia recovery (Paper II). Therefore faecal material collected with ash amendments might not be suitable for further treatment with urea. Fidjeland (2010) added ash to faeces after 4% urea had first decomposed but concluded that water added to enhance distribution of hydroxide ions resulted in the final NH3 concentration being the same as in faeces with only urea added.
The present studies showed ammonia sanitisation to be highly efficient at higher temperatures. At 34 ºC the S. Typhimurium 28B phage, which can be considered a conservative indicator according to enteric viruses, showed that the treatment time could be reduced from the recommended 1 year (WHO) to 2 and 1 month, with 1 and 2% urea treatment, respectively. At
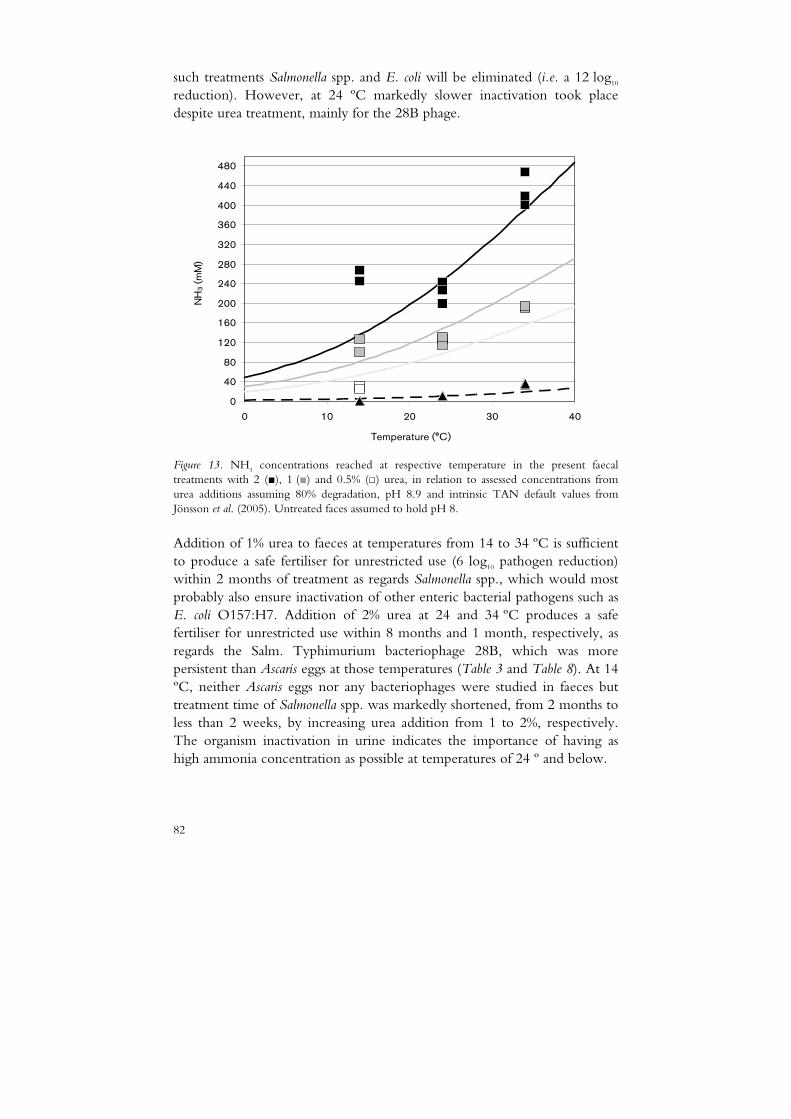
82
such treatments Salmonella spp. and E. coli will be eliminated (i.e. a 12 log10
reduction). However, at 24 ºC markedly slower inactivation took place despite urea treatment, mainly for the 28B phage.
0
40
80
120
160
200
240
280
320
360
400
440
480
0 10 20 30 40
Temperature (°C)
NH
3 (m
M)
Figure 13. NH3 concentrations reached at respective temperature in the present faecal treatments with 2 (■), 1 (■) and 0.5% (□) urea, in relation to assessed concentrations from urea additions assuming 80% degradation, pH 8.9 and intrinsic TAN default values from Jönsson et al. (2005). Untreated faces assumed to hold pH 8.
Addition of 1% urea to faeces at temperatures from 14 to 34 ºC is sufficient to produce a safe fertiliser for unrestricted use (6 log10 pathogen reduction) within 2 months of treatment as regards Salmonella spp., which would most probably also ensure inactivation of other enteric bacterial pathogens such as E. coli O157:H7. Addition of 2% urea at 24 and 34 ºC produces a safe fertiliser for unrestricted use within 8 months and 1 month, respectively, as regards the Salm. Typhimurium bacteriophage 28B, which was more persistent than Ascaris eggs at those temperatures (Table 3 and Table 8). At 14 ºC, neither Ascaris eggs nor any bacteriophages were studied in faeces but treatment time of Salmonella spp. was markedly shortened, from 2 months to less than 2 weeks, by increasing urea addition from 1 to 2%, respectively. The organism inactivation in urine indicates the importance of having as high ammonia concentration as possible at temperatures of 24 º and below.

83
A combination of pH and ammonia was highly efficient in inactivating all organisms studied at the higher temperatures. Alkaline amendment after urea is degraded or in combination with ammonia solution can be a means to achieve faster pathogen reduction at the lower concentrations without increasing the nitrogen content in the excreta fertiliser.
7.4.3 Sanitising other biomaterial
The results presented here regarding the inactivation of the pathogens Salmonella spp., E. coli O157:H7 and Ascaris eggs were related to NH3 and temperature rather than material. Since nitrogen in human excreta and manure is partly in the form of ammonia or urea, a shift in waste management can enhance both nitrogen conservation and pathogen inactivation. Incompletely sanitised manure has been identified as an important factor for Salmonella spp. occurrence in animal herds (Cardinale et al., 2004; Veling et al., 2002) and manure treatment can prevent recirculation within herds and ensure food security. When the SEPA proposal on regulation of sewage product quality comes into action, sewage sludge treatments plants will have to include a sanitisation step in their treatment. Due to the high costs of heating and to increasing interest in the use of biogas, alternatives to heat treatments are highly relevant (Sylwan, 2010). In sparsely populated areas, separate collection of toilet waste in closed tanks may be the only option to protect sensitive water recipients. Such material, high in TAN, is very suitable to be sanitised with ammonia. Pathogen inactivation studies in manure from swine (Vinnerås, 2007) and cattle (Ottoson et al., 2008a; Diez-Gonzalez et al., 2000), as well as sewage sludge (Sylwan, 2010; Pecson & Nelson, 2005) and compost (Adamtey et al., 2009), all treated with urea or aqueous ammonia, indicate the applicability of ammonia sanitisation to biowaste in general.

84

85
8 Systems for Excreta Reuse
A collected risk approach to analysing systems for handling and reuse of excreta fertiliser gives a holistic view of the hygiene risks. Different risks of exposure to pathogen-containing material occur during the chain of handling, from collection in the toilet to application as fertiliser in the field. Treatment, during collection or after collection but before fertiliser use, ought to be promoted as the best means to prevent dissemination of pathogens into the environment and the related risks. The presence of pathogens in the excreta to be handled depends on the prevalence of enteric diseases, which greatly varies around the world but in general is higher in low and middle income countries (Lopez et al., 2006). The enteric disease status is in most cases related to lack of adequate sanitation, resulting in polluted water (Ashbolt, 2004).
Mode of disease transmission in a reuse sanitation system is largely dependent on the scale, the interactions that take place within the system boundaries and the kinds of health protection measures present. A single appropriate technology and system does not exist and participatory sanitation planning tools can help reveal and structure the user’s preferences in relation to factors such as socio-economics, population density, agricultural production, infrastructure, energy and water availability, etc.
The size of the system determines the restrictions on its use. At family level, the risk of disease transmission from urine-fertilised food crops is negligible compared with person-to-person contact within the family (WHO, 2006). The larger the system, e.g. community up to municipal scale, the larger the risk of pathogens being present within the excreta (Sahlström et al., 2004) and the greater the epidemiological importance of spread of contaminated fertilisers. Similarly, on-farm nutrient circulation via manure may circulate diseases within a more limited loop compared with to-farm

86
fertilising, e.g. importing manure from extensive cattle holdings and biowaste from society to agricultural land (Petersen et al., 2007).
The size of the treatment system may also affect the sanitisation efficiency of treatment, e.g. for non-insulated composts it is important to have volumes large enough to conserve sufficient amounts of generated heat, i.e. to decrease the surface to volume ratio (Haug, 1993). For aboveground urine storage, solar radiation can be used to enhance ammonia sanitisation if the surface to volume ratio is high, i.e. the urine is stored in small containers such as 20 L jerry cans (Paper III).
System size may also affect the frequency of emptying collection vessels, which in turn may affect the degree of decomposition (Koné et al., 2010). Container size may also affect disease transmission via flies, since if emptied at a higher frequency than the time to eclosion for the relevant fly species, the breeding of flies in the faecal material can be prevented.
8.1 Sanitation systems and excreta handling
8.1.1 Collection and primary treatment
The way excreta are collected in a sanitation-reuse system may affect the concentration of pathogens in the material. Faecal contamination within the system is the main source of pathogens in urine. With urinals, this risk diminishes. In contrast, in the Peepoo sanitation system, which is based on single use toilets, high concentrations of pathogens can be expected in the toilet bag when used by a person infected by enteric disease (Vinnerås et al., 2009). However, in the normal case sanitation systems collect excreta (more or less fractionated or mixed with other waste flows) from at least one household and in many cases a community. Pathogen concentration can thus be estimated from excretion rates, prevalence (to account for mixing with excreta from non-infected persons) and finally any dilution with flushwater, cover material, cleansing material, etc. (Figure 1).
Use of excess flushwater results in large wastewater volumes to be treated. However, faecal material that can be piped, i.e. with TS <12%, and collected in a closed tank similar to source-separated urine and wastewater usually gives less exposure to pathogen-containing material compared with a dry system where the faeces stay in a open collection vessel or chamber underneath the toilet. Vector attraction is usually harder to manage in systems with open dry collection of faeces compared with a closed piped system, although cover material sprinkled over the faeces after defecation decreases attraction of e.g. flies. Such additives may also affect the secondary

87
treatment, as inert material may affect compost and combustion efficiency (Niwagaba et al., 2000) whereas adding alkali can result in any further treatment with urea not contributing to sanitisation if the pH becomes too high for the urea to decompose (Paper II). In addition, alkaline additives, especially in combination with ventilation, may increase volatilisation and loss of ammonia.
Regarding ammonia sanitisation, it is preferable for the excreta to be diluted as little as possible, since higher ammonia concentrations in the material will enable treatment and sanitisation. This is also the case for several other treatments, e.g. biogas and liquid composting. For liquid fractions, most treatments are not applicable if not mechanised, e.g. wet composting of toilet waste requires high technology as well as other waste flows to increase the energy content of the material. Drying of very wet material is not a feasible option.
8.1.2 Secondary treatment for fertiliser production
In many cases secondary treatment includes transport and processing of raw faeces and such handling means a risk of exposure to pathogens. However, pumpable materials enable mechanised handling, which can decrease the risk of exposure during emptying collection containers and transport, e.g. by vacuum tankers or by a pipe system. However, ammonia sanitisation could be performed on-site in the collection containers for faeces, i.e. urea or aqueous ammonia could be added upon closure of the full container. Such a system would minimise the contact with raw faeces and pathogen risks, especially as the sanitising action lasts until the material is spread as fertiliser, provided that the container is kept closed.
The risk of exposure to excreta, and thus pathogens, increases with open secondary treatments that require a high degree of manual handling, e.g. low technology composting and drying in the environment, both requiring manual handling of excreta for efficient sanitisation. Long-term storage, despite not being defined as a treatment in this thesis, may be a better option than e.g. unsuccessful composting, provided that the handling required is minimal. Faecal material that is treated or stored in the open may, like other waste, attract vectors such as rodents and birds and since most human pathogens are zoonotic, transmission to wildlife and consequently the environment is a risk.
Low temperature faecal composting, which from a sanitisation point is comparable to storage, can give a product that to the eye and nose resembles soil, an appearance that can make it highly attractive as fertiliser, despite it not being hygienically safe. Ammonia sanitisation can be applied as a final
88
sanitisation step after treatments with low pathogen inactivation, such as low temperature composting or biogas digestion (Adamtey et al., 2009).
Ammonia sanitisation has many similarities to chemical treatment with alkali, but compared with liming, ammonia treatment has the advantages of easier mixing, safer handling, lower treatment pH and higher fertiliser value of the treated biowaste. Ammonia is quickly distributed through the material by itself, whereas the distribution of urea is considerably slower (Agostini, unpublished). Urea treatment is suitable when additions are made manually, since a latency period before being decomposed into ammonia allows mixing without volatilisation, giving a better working environment. In addition, urea can be stored for long periods as dry pellets and is self-activated in contact with enzymes in the faeces, as in the Peepoo bag (Vinnerås et al., 2009). Treatment with aqueous ammonia, on the other hand, is cheaper, since the sanitisation effect in relation to added nitrogen is higher and the product may be easier to add in a mechanised system than urea. If the value of the nitrogen added is accounted for, both treatments are economically favourable compared with liming since the cost of treatment can largely be covered by the increased fertiliser value (Albihn & Vinnerås, 2007).
In emergencies such as floods, low-technology closed treatments resulting in fast inactivation of pathogens would make it possible to use or dispose of excreta without contaminating the environment, and especially water sources, with pathogens. In such a situation, ammonia sanitisation is probably the simplest way to rapidly inactivate pathogens.
If excreta products are not applied as fertiliser immediately after treatment, post-storage is required. Re-growth of pathogens, e.g. Salmonella spp., during storage of insufficiently hygienised biowaste has been observed (Pepper et al., 2006; Gibbs et al., 1997). Ammonia sanitisation has the advantage of continued sanitisation during storage as well as transport, since ammonia is not consumed during treatment and thus recontamination is prevented. Transport has been shown to be a weak link in biomaterial management when the same vehicles are used for unsanitised and sanitised biomaterial. In Sweden, 13% of Salmonella-positive samples in a study on biogas residues were suspected cases of recontamination during transportation (Vinnerås et al., 2004).
Since biological processes are hampered by ammonia, during treatment as well as storage, methane and nitrous oxide production ought to be negligible. This is an advantage from a greenhouse gas perspective, as both methane and nitrous oxide have a high global warming potential.

89
8.2 Excreta fertilisers
8.2.1 Nutrient content
According to Winker et al. (2009), urine contained more nitrogen than phosphorus and potassium in relation to the requirements of all crops included in their analysis, i.e. cereals, grass, maize, fodder/sugar beet, potatoes and beans and peas. Complementary application with ash (Pradhan et al., 2010) or faecal compost (Guzha et al., 2005; Jönsson et al., 2004) can contribute other nutrients required by the plants. The proportion of nitrogen in relation to phosphorus and potassium is lower in faeces than urine, even after 2% urea (w/w) has been added. However, the nitrogen concentration is more than three times higher than in undiluted urine after such urea addition.
For some plant nutrients, a short-term oversupply is acceptable if the fertiliser composition does not match crop requirements (Winker et al., 2009). This is not the case for nitrogen, which should be applied in relation to crop demand in order to avoid leaching and volatilisation. At present, urine as well as urea-treated faeces must be applied according to the nitrogen content. Without any nitrogen added, faecal material is often recommended to be applied according to its content of phosphorus or organic material, since many secondary treatments result in large losses of mineralised nitrogen and the nitrogen in organic form is less plant-available (Heinonen-Tanski & Wijk-Sijbesma, 2005; Jönsson et al., 2004).
Ammonia sanitisation of faecal material will increase the total nitrogen concentration as well as the fraction present as ammonia and produce a fertiliser with both immediate available nitrogen as well as a pool of slow release nitrogen. Winker et al. (2009) classify this as an organic-mineral fertiliser.
8.2.2 Application
It is a great advantage, especially when up-scaling, if excreta fertilisers can by applied to fields with existing fertiliser spreading equipment. It is mainly the TS that determine whether a fertiliser can be applied with slurry equipment or whether solid manure equipment should be used (Rodhe et al., 2004).
According to SEPA (2010), at most 150 kg TAN may be applied per hectare and year from sewage products. However, that is a quite high application only from TAN, which for faecal material would result in much higher total nitrogen application. If striving for the maximum permissible TAN application, urine can, if undiluted, be applied at up to 22 m3 ha-1 yr-1, which will result in 160 kg total nitrogen applied10. At present liquid

90
fertiliser equipment application rates, 10-50 m3 ha-1 (Winker et al. 2009), such a dose of 150 kg TAN m3 ha-1 yr-1 cannot be applied on one occasion if urine is diluted 1:3 with water11. If urine is to be applied at high rates, e.g. 200 and 400 kg N ha-1 are recommended for optimal yields of sugar cane and banana, respectively (Heinonen-Tanski & Wijk-Sijbesma, 2005), it would have to be applied on more than one occasion even if undiluted. This might also be wise in order to minimise the risk of leaching.
Faeces without any addition of ammonia can be applied at up to 70 tonnes ha-1 without exceeding the SEPA limit for TAN. Since faecal TAN constitutes only 20% of total nitrogen, such application will result in high total nitrogen application, although mostly in organic form. Increasing faecal TAN concentrations by adding urea decreases the allowed maximum application. Faecal material (20% TS) treated with 2% urea w/w may be applied at rates of up to 13 tonnes ha-1 yr-1. However maximum faecal application rates based on TAN would give a high total nitrogen application, since with 0.5% and 2% urea treatment TAN would constitute 35 and 60%11 of total nitrogen, respectively.
Application of fertiliser products rich in ammonia to grasses or other established crops should be avoided, if not applied with injection or other techniques, to avoid foliar burn (Jönsson et al., 2004; Rodhe et al., 2004).
8.2.3 Fertiliser management
Urine and faeces treated with ammonia or alkali will be high in pH and/or TAN (Table 2, Table 5 and Table 6), fertiliser characteristics which together with TS content may affect ammonia emissions (Sommer & Hutchings, 2001). Rapid incorporation of the fertiliser into the soil, e.g. by injection or by primary or secondary tillage, preferably within an hour of spreading, is important to reduce volatile losses (Rotz, 2004). Such management will also decrease the pathogen exposure on the soil surface and formation of aerosols, but pathogen survival in the soil may be prolonged (Gibbs et al., 1997). Incorporation into soil as a health protection measure is estimated by WHO (2006) to give a 1-2 log10 reduction in pathogen exposure.
With urine applied using trailing hose spreader or injection, ammonia losses from urine fertilisation can be less than 10%, and often below 5%, of applied nitrogen (Rodhe et al., 2004). For solid manure, broadcasting is the only existing application technique (Sommer & Hutchings, 2001) and ammonia emissions are larger than with techniques applicable for slurry (Rodhe et al., 2004; Rotz, 2004). To keep losses low, dilution to make 11 Based on excreta nitrogen values from Jönsson et al. (2005) and the assumption that urea,
when added to faeces, is totally degraded to ammonia.

91
ammonia fractions liquid might be wise. However, keeping faecal material in its dry state means that the volumes produced per capita and year are small and may be applied manually. Solid excreta fertiliser, unlike slurries and liquids, may expose workers to the material to a higher degree as the truck may be loaded manually and open.
Crop selection can be a means to control risks from excreta fertilisers e.g. restricting their use to feed and food crops that are further processed (WHO, 2006). Since many viruses are species-specific, the level of sanitation regarding viruses could be lower for fodder production or pasture than for production of food, especially food eaten raw. A time delay between application and harvest or grazing also lowers the risk of disease transmission when using fertilisers of human and animal origin. However, the inactivation rate in the field will depend on many non-controllable factors, including humidity and temperature.
8.3 Sustainable sanitation and health
At the present, 1 billion people live in chronic hunger, for some of them ending in starvation and death (www.1billionhungry.org). Low agricultural productivity is one cause of hunger and malnutrition in many low and middle income countries, in spite of the fact that the climate would allow several cropping seasons. This is attributable to the fact that almost no fertilisers are used, in combination with many working days lost due to hunger and enteric disease, the latter resulting from failure to treat human faeces properly (Heinonen-Tanski et al., 2010).
Sanitisation of human excreta and their subsequent use as fertiliser can give a more sanitary environment and more sustainable food production. Sanitisation of urine is based on intrinsic concentrations of ammonia and the treatment is just an optimisation of storage. The sustainability of treating faeces with urea or aqueous ammonia solution, products which today are produced using non-renewable energy sources, can be discussed. However, ammonia sanitisation can be seen as utilising the fertiliser twice, first for sanitisation and then for fertilising. Alternative production of urea, from biogas instead of natural gas, might be a possibility in the future, as well as using natural sources of ammonia, such as urine.
Ammonia sanitation is highly efficient in eliminating bacterial pathogens, the major agent causing gastrointestinal illness world-wide. Treatment times can be greatly reduced (Paper IV) compared with the 1.5-2 years suggested for faecal storage (WHO, 2006). Ascaris is a persistent pathogen that is inactivated slowly at temperatures below 20 ºC in ammonia treatment and

92
probably also in alkaline treatment. Increasing temperatures in combination with ammonia or alkali can enhance Ascaris inactivation substantially, even at sub-lethal temperatures (Paper II). However, pathogen destruction in sustainable sanitation is often viewed according to what it does not achieve with regard to Ascaris inactivation, rather than what it does achieve with other pathogens. It is important to remember that sanitation and nutrient reuse should be evaluated as an entire system. The risks from incompletely sanitised excreta fertilisers can be managed by use of other barriers against disease transmission such as incorporation into the soil, latency before harvest as well as washing, disinfecting, peeling or cooking crops. Together, the barriers in the system should give a pathogen reduction of 104 and 108 for urine and faeces, respectively (WHO, 2006). In ammonia sanitisation, there is a risk of ammonia losses during collection (urine), treatment, storage and fertiliser use. All managements and practices to prevent such emissions, e.g. closed containers during handling and treatment as well as incorporation into soil when used as fertiliser, will also decrease the risk of human, animal or environmental exposure to contagious material.
Ammonia sanitation technology provides new possibilities based on old knowledge to sanitise different types of waste, liquid as well as solid, at both small and large scale, with low technology or fully automatised methods. However, the level of sanitisation a treatment should achieve must be related to the context in which it is being applied. The larger question of whether the introduction and practice of sustainable sanitation can improve the overall health of a community has to be addressed. From a health perspective, sustainable sanitation is better than no sanitation at all and possible health risks must be weighed against the potential improvement in the household budget and the ability for people to feed themselves.

93
9 Conclusions
Ammonia sanitation can provide controlled pathogen inactivation in both source-separated faeces and urine across a variety of organism groups with very different characteristics, e.g. bacteria, parasites and viruses. Temperature proved to be a key factor for NH3 (aq) toxicity on the viral models and Ascaris eggs, whereas Salmonella spp. and E. coli O157:H7 could be reduced within short treatment times, t90 of 5 days, even with 15 mM NH3 at 4 ºC.
It was possible to model Salmonella spp. inactivation using NH3 and temperature, which allows for prediction of inactivation using parameter combinations not studied here. Faecal coliforms are suggested as an indicator for verification of Salmonella spp. Due to its lower sensitivity to ammonia and possible growth in the sanitation system, it was concluded that Enterococcus spp. is not a suitable indicator of pathogenic bacteria for ammonia sanitisation.
At NH3 concentrations in the interval 20-60 mM, a sharp decrease in inactivation was observed at 24 ºC and below for Enterococcus spp., bacteriophages and Ascaris eggs, with insignificant inactivation of the latter during 6 months. An exponential model including an initial lag phase provides accurate estimation of Ascaris egg inactivation rates by ammonia. Inactivation of Ascaris eggs will most probably ensure the absence of other parasites in toilet waste, but Ascaris itself may persist at 14 ºC. Bacteriophages need to be further studied in relation to animal viruses to judge their suitability as viral models for ammonia sanitisation.
For sanitisation of source-separated urine, dilution resulting in 1.4-1.8 g TAN L-1 was shown to be critical for Ascaris egg inactivation even at 24 ºC. This stresses the importance of keeping flushwater volumes low during collection. A high concentration of plant nutrients is also desirable in materials intended for use as fertiliser. Even with undiluted urine the inactivation of Ascaris and viruses will be slow at 14ºC and below. Increasing

94
temperature from 14 to 24 ºC shifted times for a 3 log10 egg inactivation in urine and faecal treatments from years to months, while an increase from 24 to 34ºC shifted it from months to weeks.
Exposing urine to sun gave temperature variations whereby fluctuations and peak temperatures were enhanced. Such treatment is applicable when urine containers are small. With increased temperature, even as peak temperatures over the day, the storage time can be reduced and sanitisation time adjusted to fertiliser needs instead of the other way round. The present study of urine provided more information on the sanitisation efficiency and indicated that treatment times may be shortened according to current urine storage recommendations.
Urea treatment of faeces increased pH and total ammonia concentrations, both factors contributing to formation of NH3, with the latter increasing the fertiliser value of the product. The final value and stability of the pH achieved from urea depended on initial pH and other material properties. Rates of 0.5% urea were too low to increase the faecal pH (TS 20%), whereas 1 and 2% mostly reached a pH ~9 that was stable during the sanitisation process. Higher urea rates than 2% may result in nitrogen concentrations that are too high for fertiliser use.
When ash or lime is used as cover material, the resulting alkaline pH can enhance the effect of intrinsic and added ammonia, but at pH >10 enzymatic degradation of urea will be inhibited.
Ammonia sanitisation of faeces offers a treatment technology that requires minimal handling and contact with raw faeces, especially if performed on-site in the collection containers upon closure. Ammonia sanitisation has the advantages of continued sanitisation during storage and transport and of preventing re-growth. All managements and practices to prevent ammonia emissions, e.g. closed containers during handling and treatment as well as incorporation into soil when used as fertiliser, will also decrease the risk of human, animal or environmental exposure to contagious material. Ammonia sanitisation is economically viable since the cost of treatment can largely be covered by the increased fertiliser value.

95
10 Future research
This thesis investigated the efficiency of ammonia sanitisation for reuse sanitation systems. Source separation of urine is already in practice on a large scale. However, urea is a novel treatment for source-separated faeces and at present is only applied at large scale in the Peepoo sanitation reuse system. Further research for optimisation, implementation and system assessment of ammonia sanitisation is suggested below. This thesis produced conclusions regarding parasitic and bacterial
pathogens and indicators, but the results indicate that development of representative models for enteric viruses need further evaluation.
At 14 ºC the inactivation of virus and parasites was slow and optimising the treatment by using aqueous ammonia or a combination of urea and alkaline amendment ought to be further investigated to provide ammonia sanitisation for temperate climates.
Development of various techniques to heat not just urine, but also faecal material, to shorten treatment times would be highly interesting. Use of resource-efficient energy sources as solar heating, e.g. by reflectors or in greenhouse-like, insulated boxes, should be promoted.
Urine as a source of urea to sanitise faeces could provide an environmentally friendly, self-sustaining, reuse sanitation system. Collecting blackwater, i.e. wastewater from toilets, with minimal flushwater and adjusting the pH for use of intrinsic ammonia should be investigated. The possibility to dry urine in ash and use the material for treating source-separated faeces should be investigated as a sanitisation option in warm arid climates.

96
From a Swedish perspective wastewater sewage sludge will be the predominant fraction needing sanitisation. Urea has been shown to be a cost-effective option to treat sewage sludge and sanitisation options should be further investigated.
Ammonia sanitisation was in this thesis investigated as a secondary treatment and the outcome should further be used for quantitative assessment of the microbial risks for whole sanitation and reuse systems. This to target sanitisation levels and to apply the right combination of health measures.
Quantitative assessments of the effects of better nutritional status on the total health outcome in terms of infectivity, morbidity and mortality rates could provide a more holistic view of health in relation to sustainable sanitation and reuse of human excreta.
The Peepoo sanitisation system, which utilises urea for sanitisation in single use toilets, has been implemented on a large scale in Kibera, a shantytown part of Nairobi, Kenya. This provides tremendous scope for epidemiological and longitudinal studies of sanitisation and for evaluation of the health impact of introduction of a new, improved sanitation system.

97
References
Abu-Orf MM, B.J., Oleszkiewicz J, Reimers RS, Lagasse P, Amy B, Glindemann D. (2004). Production of class A biosolids with anoxic low dose alkaline treatment and odor management. Water Science & Technology. 49(10), 131-138.
Adamtey, N., Cofie, O., Ofosu-Budu, G.K., Danso, S.K.A. & Forster, D. (2009). Production and storage of N-enriched co-compost. Waste Management 29(9), 2429-2436.
Adedeji, S.O., Ogunba, E.O. & Dipeolu, O.O. (1988). Inhibitory role of bacterial culture on the development of Ascaris eggs in-vitro. Tropical Veterinarian 6(1-4), 21-25.
Aitken, M.D., Sobsey, M.D., Blauth, K.E., Shehee, M., Crunk, P.L. & Walters, G.W. (2005). Inactivation of Ascaris suum and poliovirus in biosolids under thermophilic anaerobic digestion conditions. Environmental Science & Technology 39(15), 5804-5809.
Albihn, A. (2002). Recycling Biowaste - Human and Animal Health Problems. Acta Veterinaria Scandinavica 43(Suppl 1), S69 - S75.
Albihn, A. & Vinnerås, B. (2007). Biosecurity and arable use of manure and biowaste —Treatment alternatives. Livestock Science 112(3), 232-239.
Allievi, L., Colombi, A., Calcaterra, E. & Ferrari, A. (1994). Inactivation of fecal bacteria in sewage sludge by alkaline treatment. Bioresource Technology 49(1), 25-30.
Amahmid, O., Asmama, S. & Bouhoum, K. (1999). The effect of waste water reuse in irrigation on the contamination level of food crops by Giardia cysts and Ascaris eggs. International Journal of Food Microbiology 49(1-2), 19-26.
Andersson, Å. & Jensen, A. (2002). Flöden och sammansättning på BDT-vatten, urin, fekalier och fast organiskt avfall i Gebers = Flows and composition of greywater, urine, faeces and solid biodegradable waste in Gebers. Uppsala: Sveriges lantbruksuniv. (Institutionsmeddelande / Sveriges lantbruksuniversitet, Institutionen för lantbruksteknik, 2002:05.
Ashbolt, N.J. (2004). Microbial contamination of drinking water and disease outcomes in developing regions. Toxicology 198(1-3), 229-238.
AstraZeneca (2006). AstraZenecas Avloppsvattensrening (Brochyr). Stockholm. Barnard, R.J., Bier, J.W., Jackson, G.J. & McClure, F.D. (1987). Ascaris lumbricoides suum:
Thermal death time of unembryonated eggs. Experimental Parasitology 64(1), 120-122.

98
Bethony, J., Brooker, S., Albonico, M., Geiger, S.M., Loukas, A., Diemert, D. & Hotez, P.J. (2006). Soil-transmitted helminth infections: ascariasis, trichuriasis, and hookworm. Lancet. 367(9521), 1521-1532.
Bitton, G. (1999). Wastewater microbiology. 2. ed. New York: Wiley-Liss. (Wiley series in ecological and applied microbiology, ISBN 0-471-32047-1;.
Boost, M.V. & Poon, C.S. (1998). The effect of a modified method of lime-stabilisation sewage treatment on enteric pathogens. Environment International 24(7), 783-788.
Bracken, P., Wachtler, A., Panesar, A.R. & Lange, J. (2007). The road not taken: how traditional excreta and greywater management may point the way to a sustainable future. Water Science & Technology: Water Supply 7(1), 219–227.
Brewster, J., Oleszkiewicz, J., Bujoczek, G., Reimers, R.S., Abu-Orf, M., Bowman, D. & Fogarty, E. (2003). Inactivation of Ascaris suum eggs in digested and dewatered biosolids with lime and fly ash at bench scale and full scale. Journal of Environmental Engineering and Science 2(5), 395-400.
Bujozek, G. (2001). Influence of ammonia and other abiotic factors on microbial activity and pathogen inactivation during processing of high-solid residues. Diss. Manitoba:University of Manitoba.
Burge, W.D., Cramer, W.N. & Kawata, K. (1983). Effect of heat on virus inactivation by ammonia. Applied & Environmental Microbiology 46(2), 446-51.
Campbell, I., Tzipori, S., Hutchison, G. & Angus, K.W. (1982). Effect of disinfectants on survival of Cryptosporidium oocysts. Veterinary Record 111(18), 414-415.
Cardinale, E., Tall, F., Gueye, E.F., Cisse, M. & Salvat, G. (2004). Risk factors for Salmonella enterica subsp. enterica infection in senegalese broiler-chicken flocks. Preventive Veterinary Medicine 63(3), 151-161.
Carlander, A., Aronsson, P., Allestam, G., Stenstro?m, T.A. & Perttu, K. (2000). Transport and retention of bacteriophages in two types of willow-cropped lysimeters. Journal of Environmental Science and Health - Part A Toxic/Hazardous Substances and Environmental Engineering 35(8), 1477-1492.
Chandran, A., Pradhan, S.K. & Heinonen-Tanski, H. (2009). Survival of enteric bacteria and coliphage MS2 in pure human urine. Journal of Applied Microbiology 107(5), 1651-1657.
Chefranova, Y.A., Oshevskaya, Z.A. & Gushchin, P.P. (1984). Efficacy of liquid ammonia for the disinfection of biological waste in ascariasis foci. Meditsinskaya Parazitologiya i Parazitarnye Bolezni (No. 6), 39-42.
Chefranova, Y.A., Petranovskaya, M.R. & Khodakova, V.I. (1978). Disinfecting action of ammonia on helminth eggs (Trichuris muris and Diphyllobothrium latum) and enteric bacteria. Meditsinskaya Parazitologiya i Parazitarnye Bolezni 47(1), 99-101.
Cramer, W.N., Burge, W.D. & Kawata, K. (1983). Kinetics of virus inactivation by ammonia. Applied & Environmental Microbiology 45(3), 760-765.
Deal, P.P.H., Souza, K.K.A. & Mack, H.H.M. (1975). High pH ammonia toxicity, and the search for life on the Jovian planets. Origins of life and evolution of the biosphere 6(4), 561-73.
Degomme, O. & Guha-Sapir, D. (2010). Patterns of mortality rates in Darfur conflict. Lancet 375(9711), 294-300.

99
Diez-Gonzalez, F., Jarvis, G.N., Adamovich, D.A. & Russell, J.B. (2000). Use of carbonate and alkali to eliminate Escherichia coli from dairy cattle manure. Environmental Science & Technology 34(7), 1275-1279.
Ecosanres The EcoSanRes Programme for Improved Livelihoods Around the World. [online] Available from: http://www.idswater.com/water/europe/Stockholm_Environment/Ecological_Sanitation_Treatment/239_0/g_supplier_1.html. [Accessed 4 August 2010].
Elving, J., Ottoson, J.R., Vinnerås, B. & Albihn, A. (2009). Growth potential of faecal bacteria in simulated psychrophilic/mesophilic zones during composting of organic waste. Journal of Applied Microbiology 108(6), 1974-1981.
Emerson, K., Russo, R., Lund, R. & Thurston, R. (1975). Aqueous ammonia equilibrium calculations: Effects of pH and temperature. Journal of the Fisheries Research Board of Canada 32, 2379-2383.
Eriksen, L., Andreasen, P. & Ilsoe, B. (1995). Inactivation of Ascaris suum eggs during storage in lime treated sewage sludge. Water Research 30(4), 1026-1029.
Esrey, S.A. (2001). Towards a recycling society: ecological sanitation - closing the loop to food security Water Science and Technology 43(4), 177-187.
Feachem, R.G. (1983). Sanitation and disease: health aspects of excreta and wastewater management. Chichester: Wiley. (World bank studies in water supply and sanitation, 3. ISBN 0-471-90094-X;.
Fidjeland, J. (2010). Quantitative microbial risk assessment of agricultural use of faecal matter traeted with urea and ash. Diss. Ås: Norwegian University of Life Sciences.
Finstein, M.S. (2004). Protecting watersheds from Cryptosporodium in manure: A literature review. Journal American Water Works Association 96(2), 114-+.
Fraise, A.P., Lambert, P.A., Maillard, J.-Y., Russell, A.D. & Ayliffe, G.A.J. (2004). Principles and practice of disinfection, preservation and sterilization. 4. ed. Malden: Blackwell. ISBN 1-4051-0199-7.
Gallardo-Lara, F. & Nogales, R. (1987). Effect of the application of town refuse compost on the soil-plant system: A review. Biological Wastes 19(1), 35-62.
Germer, J., Boh, M.Y., Schoeffler, M. & Amoah, P. (2010). Temperature and deactivation of microbial faecal indicators during small scale co-composting of faecal matter. Waste Management 30(2), 185-191.
Ghiglietti, R., Genchi, C., Di Matteo, L., Calcaterra, E. & Colombi, A. (1997). Survival of Ascaris suum eggs in ammonia-treated wastewater sludges. Bioresource Technology 59(2-3), 195-198.
Ghiglietti, R., Rossi, P., Ramsan, M. & Colombi, A. (1995). Viability of Ascaris suum, Ascaris lumbricoides and Trichuris muris eggs to alkaline pH and different temperatures. Parassitologia 37(2-3), 229-232.
Gibbs, R.A., Hu, C.J., Ho, G.E. & Unkovich, I. (1997). Regrowth of faecal coliforms and salmonellae in stored biosolids and soil amended with biosolids. Water Science & Technology 35(11-12), 269-275.
Gordeeva, L.M. & Chefranova, Y.A. (1977). Disinfection with ammonium hydroxide of faeces containing cysts of intestinal protozoa. Meditsinskaya Parazitologiya i Parazitarnye Bolezni 46(2), 206-209.

100
Guardabassi, L., Sobsey, M. & Dalsgaard, A. (2003). Occurrence and survival of viruses in composted human faeces. : The Danish Environmental Protection Agency. (Technical Report. Sustainable Urban Renewal and Wastewater Treatment No. 32.
Guzha, E., Nhapi, I. & Rockstrom, J. (2005). An assessment of the effect of human faeces and urine on maize production and water productivity. Physics and Chemistry of the Earth 30(11-16), 840-845.
Hammer, M. & Clemens, J. (2007). A tool to evaluate the fertiliser value and the environmental impact of substrates from wastewater treatment. Water Science & Technology 56(5), 201-209.
Harm, W. (1980). Biological effects of ultraviolet radiation. Cambridge: Cambridge U.P. (IUPAB biophysics series, 1. ISBN 0-521-22121-8.
Haug, R.T. (1993). The practical handbook of compost engineering. Boca Raton: Lewis Publishers. Havelaar, A.H., Butler, M., Farrah, S.R., Jofre, J., Marques, E., Ketratanakul, A., Martins,
M.T., Ohgaki, S., Sobsey, M.D. & Zaiss, U. (1991). Bacteriophages as model viruses in water quality control. Water Research 25(5), 529-545.
Heinonen-Tanski, H., Pradhan, S.K. & Karinen, P. (2010). Sustainable Sanitation - A Cost-Effective Tool to Improve Plant Yields and the Environment. Sustainability 2(1), 341-353.
Heinonen-Tanski, H., Sjoblom, A., Fabritius, H. & Karinen, P. (2007). Pure human urine is a good fertiliser for cucumbers. Bioresource Technology 98(1), 214-217.
Heinonen-Tanski, H. & Wijk-Sijbesma, C.V. (2005). Human excreta for plant production. Bioresource Technology 96(4), 403-411.
Hellström, D., Johansson, E. & Grennberg, K. (1999). Storage of human urine: acidification as a method to inhibit decomposition of urea. Ecological Engineering 12(3-4), 253-269.
Himathongkham, S., Bahari, S., Riemann, H. & Cliver, D. (1999). Survival of Escherichia coli O157:H7 and Salmonella typhimurium in cow manure and cow manure slurry. FEMS Microbiology Letters 178(2), 251-257.
Himathongkham, S. & Riemann, H. (1999). Destruction of Salmonella typhimurium, Escherichia coli O157:H7 and Listeria monocytogenes in chicken manure by drying and/or gassing with ammonia. FEMS Microbiology Letters 171(2), 179-182.
Himathongkham, S., Riemann, H., Bahari, S., Nuanualsuwan, S., Kass, P. & Cliver, D.O. (2000). Survival of Salmonella typhimurium and Escherichia coil O157 : H7 in poultry manure and manure slurry at sublethal temperatures. Avian Diseases 44(4), 853-860.
Hotta, S. & Funamizu, N. (2007). Biodegradability of fecal nitrogen in composting process. Bioresource Technology 98(17), 3412-3414.
Höglund, C., Ashbolt, N., Stenström, T.A. & Svensson, L. (2002). Viral persistence in source-separated human urine. Advances in Environmental Research 6(3), 265-275.
Höglund, C., Stenström, T.A., Jönsson, H. & Sundin, A. (1998). Evaluation of faecal contamination and microbial die-off in urine separating sewage systems. Water Science and Technology 38(6), 17-25.
Höglund, C.E. & Stenström, T.A. (1999). Survival of Cryptosporidium parvum oocysts in source separated human urine. Canadian Journal of Microbiology 45(9), 740-6.

101
Jenkins, M.B., Bowman, D.D. & Ghiorse, W.C. (1998). Inactivation of Cryptosporidium parvum oocysts by ammonia. Applied & Environmental Microbiology 64(2), 784-788.
Jiang, S.C., Thurmond, J.M., Pichard, S.L. & Paul, J.H. (1992). Concentration of microbial populations from aquatic environments by Vortex Flow Filtration. Marine ecology progress series 80, 101-107.
Jimenez, B., Austin, A., Cloete, E., Phasha, C. & Beltran, N. (2007). Biological risks to food crops fertilized with Ecosan sludge. Water Science & Technology 55(7), 21-9.
Jobling, S., Nolan, M., Tyler, C.R., Brighty, G. & Sumpter, J.P. (1998). Widespread Sexual Disruption in Wild Fish. Environmental Science & Technology 32(17), 2498-2506.
Jönsson, H. (2002). Urine separating sewage systems--environmental effects and resource usage. Water Science & Technology 46(6-7), 333-40.
Jönsson, H., Baky, A., Jeppsson, U., Hellström, D. & Kärrman, E. (2005). Composition of urine, faeces, greywater and biowaste for utilisation in the URWARE model. Gothenburg, Sweden: Chalmers University of Technology. (Urban Water rapport, 2005:6.
Jönsson, H., Richert Stintzing, A., Vinnerås, B. & Salomon, E. (2004). Guidelines on the use of urine and faeces in crop production. Stockholm: Stockholm Environment Institute. (EcoSanRes publications series, 2004:2. ISSN 91-88714-94-2.
Jönsson, H., Stenstrom, T.-A., Svensson, J. & Sundin, A. (1997). Source separated urine-nutrient and heavy metal content, water saving and faecal contamination. Water Science and Technology 35(9), 145-152.
Jönsson, H. & Vinnerås, B. Adapting the nutrient content of urine and faeces in different countries using FAO and Swedish data. In: Proceedings of Ecosan – Closing the loop. The 2nd International Symposium on Ecological Sanitation, incorporating the 1st IWA specialist group conference on sustainable sanitation, Lübeck, Germany. , 7th-11th April 2003 2003. pp. 623-626.
Jönsson, H. & Vinnerås, B. (2007). Experiences and suggestions for collection systems for source-separated urine and faeces. Water Science and Technology 56(5), 71-6.
Jönsson, H., Vinnerås, B., Höglund, C., Stenström, T.A., Dalhammar, G. & Kirchman, H. (2000). Källsorterad humanurin i kretslopp. Stockholm. (VA-Forsk rapport 2000:1.
Kabdasli, I., Tunay, O., Islek, C., Erdinc, E., Huskalar, S. & Tatli, M.B. (2006). Nitrogen recovery by urea hydrolysis and struvite precipitation from anthropogenic urine. Water Science & Technology 53(12), 305-12.
Kim, S. & Aga, D. (2007). Potential ecological and human health impacts of antibiotics and antibiotic-resistant bacteria from wastewater treatment plants. J Toxicol Environ Health B Crit Rev 10(8), 559-73.
Kirchman, H. & Pettersson, S. (1995). Human urine-chemical composition and fertilizer use efficiency. Fertilizer research 40, 149-154.
Koné, D., Cofie, O.O. & Nelson, K. (2010). Low-Cost Options for Pathogen Reduction and Nutrient Recovery from Faecal Sludge. In: Drechsel, P., Scott, C. A.. , Raschid-Sally, L., Redwood, M. and Akiça Bahri (Ed.) Waste water Irrigation and Health - Assessing and Mitigating Risk in Low-Income Countries. pp. 171-188. London: Sterling, VA.
Kutu, F.R., Muchaonyerwa, P. & Mnkeni, P.N.S. (2010). Complementary nutrient effects of separately collected human faeces and urine on the yield and nutrient uptake of spinach (Spinacia oleracea). Waste Management & Research.

102
Langergraber, G. & Muellegger, E. (2005). Ecological Sanitation--a way to solve global sanitation problems? Environment International 31(3), 433-444.
Lapygina, E.V., Lysak, L.V. & Zvyagintsev, D.G. (2002). Tolerance of Soil Bacterial Complexes to Salt Shock. Microbiology 71(2), 143-147.
Lentner, C. & Geigy (1981). Geigy Scientific tables. Basle: Ciba-Geigy. ISBN 0-914168-50-9. Lilleengen, K. (1948). Typing of Salmonella typhimurium by means of bacteriophage. Diss.
Stockholm:Royal Veterinary College. Ling, B., Den, T.X., Lu, Z., Min, L., Wang, Z. & Yuan, A. (1993). Use of night soil in
agriculture and fish farming. World Health Forum 14(1), 67-70. Lopez, A.D., Mathers, C.D., Ezzati, M., Jamison, D.T. & Murray, C.J. (2006). Global and
regional burden of disease and risk factors, 2001: systematic analysis of population health data. Lancet 367(9524), 1747-57.
Lopez Zavala, M.A., Funamizu, N. & Takakuwa, T. (2005). Biological activity in the composting reactor of the bio-toilet system. Bioresource Technology 96(7), 805-812
Madanagopalan, N., Nadar, S.A. & Subramaniam, R. (1970). Variation in the pH of faeces in disease. Gut 11(4), 355-357.
Malkki, S. (1999). Human faeces as a resource in agriculture. Nordisk Jordbrugsforskning 81(3), 36-43.
Marin, J.A., Hernandez, T. & Garcia, C. (2005). Bioremediation of oil refinery sludge by landfarming in semiarid conditions: Influence on soil microbial activity. Environmental Research 98(2), 185-195.
Maurer, M., Pronk, W. & Larsen, T.A. (2006). Treatment processes for source-separated urine. Water Research 40(17), 3151-3166.
Mendez, J.M., Jimenez, B. & Maya, C. (2004). Disinfection kinetics of pathogens in physicochemical sludge treated with ammonia. Water Science & Technology 50(9), 67-74.
Mendez, J.M., Jimenez, B.E. & Barrios, J.A. (2002). Improved alkaline stabilization of municipal wastewater sludge. Water Science & Technology 46(10), 139-46.
Mitscherlich, E. & Marth, E.H. (1984). Microbial Survival in the Environment. Mnkeni, P.N.S., Jiménez Cisneros, B., Phasha, M.C. & Austin, L.M. (2006). Use of human
excreta from urine-diversion toilets in food gardens: agronomicand health aspects: Vol 3. Mnkeni, P.N.S., Kutu, F.R., Muchaonyerwa, P. & Austin, L.M. (2008). Evaluation of
human urine as a source of nutrients for selected vegetables and maize under tunnel house conditions in the Eastern Cape, South Africa. Waste Management & Research 26(2), 132-139.
Moe, C.C. & Izurieta, R. Longitudinal study of double vault urine diverting toilets and solar toilets in El Salvador. In: Proceedings of Proceedings of the 2nd international symposium on ecological sanitation, incorporating the 1st IWA specialist group conference on sustainable sanitation, 7th-11th April 2003, Lubeck, Germany2003: Deutsche gesellshaft fur techbische zusammenarbeit (GTZ).
Moe, C.L. & Rheingans, R.D. (2006). Global challenges in water, sanitation and health. Journal of Water and Health: 4 (Suppl. 1) 41-57 4(Suppl. 1), 1)-57.
Morgan, P. (2007). Toilets that make compost: low-cost, sanitary toilets that produce valuable compost for crops in an African context. Stockholm: Stockholm Environment Institute, EcoSanRes programme.

103
Moubarrad, F.-Z.L. & Assobhei, O. (2007). Health risks of raw sewage with particular reference to Ascaris in the discharge zone of El Jadida (Morocco). Desalination 215(1-3), 120-126.
Muskolus, A. (2008). Anthropogenic plant nutrients as fertiliser. Diss. Berlin:Humboldt-Universität zu Berlin.
Münch, E.v. & Winker, M. (2009). Technology Review | Urine diversion components. Eschborn,. (GTZ Report.
Nelson, K.L. & Darby, J.L. (2002). Determination of the inactivation rate of Ascaris eggs in wastewater stabilization pond sludge using dialysis chambers and sludge cores. Water Environment Research 74(4), 362-369.
Niwagaba, C., Nalubega, M., Vinnerås, B. & Jönsson, H. (2000). Incineration of Faecal Matter for Treatment and Sanitation. Water Practice & Technology.
Niwagaba, C., Nalubega, M., Vinnerås, B., Sundberg, C. & Jönsson, H. (2009). Bench-scale composting of source-separated human faeces for sanitation. Waste Management 29, 585-589.
Nordin, A. (2006). Nitrogen based sanitation of source separated faecal matter. Diss. Uppsala:Swedish University of Agricultural Sciences.
Ottoson, J., Nordin, A., von Rosen, D. & Vinnerås, B. (2008a). Salmonella reduction in manure by the addition of urea and ammonia. Bioresource Technology 99, 1610-1615.
Ottoson, J., Schnürer, A. & Vinnerås, B. (2008b). In situ ammonia production as a sanitation agent during anaerobic digestion at mesophilic temperature. Letters in Applied Microbiology 46(3), 325-330.
Ouédraogo, E., Mando, A. & Zombré, N.P. (2001). Use of compost to improve soil properties and crop productivity under low input agricultural system in West Africa. Agriculture, Ecosystems & Environment 84(3), 259-266.
Parashar, U.D., Gibson, C.J., S., B.J. & I., G.R. (2006). Rotavirus and severe childhood diarrhea. Emerg Infect Dis 12(2), 304-306.
Park, G.W. & Diez-Gonzalez, F. (2003). Utilization of carbonate and ammonia-based treatments to eliminate Escherichia coli O157:H7 and Salmonella Typhimurium DT104 from cattle manure. Journal of Applied Microbiology 94(4), 675-685.
Pascual, J.A., García, C. & Hernandez, T. (1999). Comparison of fresh and composted organic waste in their efficacy for the improvement of arid soil quality. Bioresource Technology 68(3), 255-264.
Pecson, B.M., Barrios, J.A., Jimenez, B.E. & Nelson, K.L. (2007). The effects of temperature, pH, and ammonia concentration on the inactivation of Ascaris eggs in sewage sludge. Water Research 41(13), 2893-902.
Pecson, B.M. & Nelson, K.L. (2005). Inactivation of Ascaris suum eggs by ammonia. Environmental Science & Technology 39(20), 7909-14.
Pepper, I.L., Brooks, J.P. & Gerba, C.P. (2006). Pathogens in Biosolids. In: Advances in Agronomy. pp. 1-41.
Petersen, O., H. (Ed.) (2007). Human physiology: Malden, Mass. : Blackwell Pub. . Petersen, S.O., Sommer, S.G., Béline, F., Burton, C., Dach, J., Dourmad, J.Y., Leip, A.,
Menzi, H., Misselbrook, T., Nicholson, F., Poulsen, H.D., Provolo, G., Sørensen, P., Vinnerås, B., Weiske, A., Bernal, M.-P., Böhm, R., Juhász, C., Mihelic, R. &

104
Martinez, J. (2007). Recycling of livestock wastes and other residues - a whole-farm perspective. Livestock Science In press.
Polprasert, C. & Valencia, L.G. (1981). The inactivation of faecal coliforms and Ascaris ova in faeces by lime. Water Research 15(1), 31-36.
Pradhan, S.K., Holopainen, J.K., Weisell, J. & Heinonen-Tanski, H. (2010). Human Urine and Wood Ash as Plant Nutrients for Red Beet (Beta vulgaris) Cultivation: Impacts on Yield Quality. Journal of Agricultural and Food Chemistry 58(3), 2034-2039.
Pradhan, S.K., Nerg, A.-M., Sjöblom, A., Holopainen, J.K. & Heinonen-Tanski, H. (2007). Use of Human Urine Fertilizer in Cultivation of Cabbage (Brassica oleracea) - Impacts on Chemical, Microbial, and Flavor Quality. Journal of Agricultural and Food Chemistry 55(21), 8657-8663.
Quilès, F., Balandier, J.-Y. & Capizzi-Banas, S. (2006). In situ characterisation of a microorganism surface by Raman microspectroscopy: the shell of Ascaris eggs. Analytical and bioanalytical chemistry 386(2), 249-255.
Reddy, S., Sanders, T.A.B., Owen, R.W. & Thompson, M.H. (1998). Faecal pH, bile acid and sterol concentrations in premenopausal Indian and white vegetarians compared with white omnivores. British Journal of Nutrition 79, 495-500.
Reinoso, R., Becares, E. & Smith, H.V. (2007). Effect of various environmental factors on the viability of Cryptosporidium parvum oocysts. Journal of Applied Microbiology 104(4), 980-986.
Richert, A., Gensch, R., Jönsson, H., Stenström, T.A. & Dagerskog, L. (2010). Practical Guidance on the Use of Urine in Crop Production. Stockholm: Stockholm Environment Institute. (EcoSanRes publications series, 2010:1.
Richert Stintzing, A., Rodhe, L. & Åkerhjelm, H. (2001). Humanurin som gödselmedel : växtnäring, spridningsteknik och miljöeffekter = Human urine as fertiliser : plant nutrients, application technique and environmental effects. Uppsala: JTI. (JTI-rapport. Lantbruk & industri ISSN 278.
Rockström, J., Axberg, G.N., Falkenmark, M., Mats Lannerstad, Rosemarin, A., Caldwell, I., Arvidson, A. & Nordström., M. (2005). Sustainable Pathways to Attain the Millenium Development Goals: Assessing the Key Role of Water, Energy and Sanitation. ISBN 91-975238-4-4.
Rodhe, L., Richert Stintzing, A. & Steineck, S. (2004). Ammonia emissions after application of human urine to a clay soil for barley growth. Nutrient Cycling in Agroecosystems 68, 191-198.
Rotz, C.A. (2004). Management to reduce nitrogen losses in animal production. J. Anim Sci. 82(13 suppl), E119-137.
Sahlström, L., Aspan, A., Bagge, E., Danielsson-Tham, M.L. & Albihn, A. (2004). Bacterial pathogen incidences in sludge from Swedish sewage treatment plants. Water Res 38(8), 1989-94.
Sahlström, L., Bagge, E., Emmoth, E., Holmqvist, A., Danielsson-Tham, M.-L. & Albihn, A. (2008). A laboratory study of survival of selected microorganisms after heat treatment of biowaste used in biogas plants. Bioresource Technology 99(16), 7859-7865.
Sanguinetti, G.S., Ingallinella, A.M. & Ferrer, V. Saneamiento ecológico: Inactivación de patógenos en heces provenientes de bano seco - disposición de aguas grises. In:

105
Proceedings of Conferencia Internacional - Saneamiento Sustentable: Agua y Seguridad Alimentaría para América Latina, Fortaleza, Brazil2007.
Schönning, C., Westrell, T., Stenström, T.A., Arnbjerg-Nielsen, K., Hasling, A.B., Hoibye, L. & Carlsen, A. (2007). Microbial risk assessment of local handling and use of human faeces. J Water Health 5(1), 117-28.
Semenov, A.V., Van Bruggen, A.H., Van Overbeek, L., Termorshuizen, A.J. & Semenov, A.M. (2007). Influence of temperature fluctuations on Escherichia coli O157:H7 and Salmonella enterica serovar Typhimurium in cow manure. FEMS Microbiology Ecology 60(3), 419-428.
SEPA. (2010). Redovisning av regeringsuppdrag 21 Uppdatering av "Aktionsplan för återföring av fosfor ur avlopp" Bilaga 1: Förslag till förordning Dnr 525-205-09; 2010-04-07).
SEPA. (2008). Näringsbelastning på Östersjön och Västerhavet 2006. Stockholm: Naturvårdsverket. (Rapport. ISSN 978-91-620-5815-9.
Sidhu, J., Gibbs, R.A., Ho, G.E. & Unkovich, I. (2001). The role of indigenous microorganisms in suppression of salmonella regrowth in composted biosolids. Water Research 35(4), 913-920.
Sommer, S.G. & Hutchings, N.J. (2001). Ammonia emission from field applied manure and its reduction--invited paper. European Journal of Agronomy 15(1), 1-15.
Sumpter, J.P. (2005). Endocrine Disrupters in the Aquatic Environment: An Overview. Acta hydrochimica et hydrobiologica 33(1), 9-16.
Sundermann, C.A., Lindsay, D.S. & Blagburn, B.L. (1987). Evaluation of disinfectants for ability to kill avian Cryptosporidium oocysts. Companion Animal Practice 1(6), 36-39.
Svensson, L.L. (2000). Diagnosis of foodborne viral infections in patients. International Journal of Food Microbiology 59(1-2), 117-26.
Sylwan (2010). A technique for sanitizing sewage sludge - Urea treatment with dual advantages. Diss.:Uppsala University
Tesfaye, Y. (2009). Pathogen Reduction Efficiency of Eco-sanitation System. Thursday. Tidåker, P. (2007). Integrating farming and wastewater management: a system perspective. Diss.
Uppsala:Swedish University of Agricultural Sciences. Todar, K. (2010). Online Textbook of Bacteriology, version 2010. In. Kennet Todar,
Department of Bacteriology, University of Wisconsin Tonner-Klank, L., Moller, J., Forslund, A. & Dalsgaard, A. (2007). Microbiological
assessments of compost toilets: In situ measurements and laboratory studies on the survival of fecal microbial indicators using sentinel chambers. Waste Management 27(9), 1144-1154.
Udert, K.M., Larsen, T.A., Biebow, M. & Gujer, W. (2003a). Urea hydrolysis and precipitation dynamics in a urine-collecting system. Water Research 37(11), 2571-2582.
Udert, K.M., Larsen, T.A. & Gujer, W. (2003b). Estimating the precipitation potential in urine-collecting systems. Water Research 37(11), 2667-2677.
UNICEF/WHO (Ed.) (2009). Diarrhoea: why children are still dying and what can be done. USEPA (1994). A Plain English Guide to the EPA Part 503 Biosolids Rule. In: Office of
waste water management, W. (Ed.). U.S. Environmental Protection Agency.
106
Ward, R.L. (1978). Mechanism of poliovirus inactivation by ammonia. . J Virol. 26(2), 299-305
Ward, R.L. & Ashley, C.S. (1977). Identification of the virucidal agent in wastewater sludge. Applied & Environmental Microbiology 33(4), 860-864.
Warren, K.S. (1962). Ammonia toxicity and pH. Nature 195, 47-9. Veling, J., Wilpshaarb, H., K. Frankenab, Bartelsa, C. & H.W. Barkemaa (2002). Risk factors
for clinical Salmonella enterica subsp. enterica serovar Typhimurium infection on Dutch dairy farms. Prev. Vet. Med. 54, 157–168.
Venglovsky, J., Martinez, J. & Placha, I. (2006). Hygienic and ecological risks connected with utilization of animal manures and biosolids in agriculture. Livestock Science 102(3), 197-203.
Westrell, T. (2004). Microbial risk assessment and its implications for risk management in urban water systems. 1. ed. Linköping: Univ. (Linköping studies in arts and science, 304. ISBN 91-85295-98-1.
Wharton, D.A. (1980). Nematode egg-shells. Parasitology 81, 447-463. WHO (2006). Volume 4: The use of excreta and greywater in agriculture. Geneva: World Health
Organization. (Guidelines for the safe use of wastewater, excreta and greywater. ISSN 4.
Wilson, M., L. & Gaido, L. (2004). Laboratory diagnosis of urinary tract infections in adult patients Clinical Infectious Diseases 38, 1150-1158.
Winker, M., Tettenborn, F., Faika, D., Gulyas, H. & Otterpohl, R. (2008). Comparison of analytical and theoretical pharmaceutical concentrations in human urine in Germany. Water Research 42(14), 3633-3640.
Winker, M., Vinnerås, B., Muskolus, A., Arnold, U. & Clemens, J. (2009). Fertiliser products from new sanitation systems: Their potential values and risks. Bioresource Technology 100(18), 4090-4096.
Vinnerås, B. (2007). Comparison of composting, storage and urea treatment for sanitising of faecal matter and manure. Bioresour Technol 98(17), 3317-21.
Vinnerås, B., Berggren, I., Albihn, A., Bagge, E. & Sahlström, L. Removal of Salmonella contamination before using plant nutrients from household waste and wastewater in agriculture In: Proceedings of Proceedings from 2nd IWA Leading-Edge Conference on Sustainability in Water Limited Environments, Sydney, 8 - 10 November 2004.
Vinnerås, B., Björklund, A. & Jönsson, H. (2003a). Thermal composting of faecal matter as treatment and possible disinfection method - laboratory-scale and pilot-scale studies. (Bioresource Technology; 1).
Vinnerås, B., Clemens, J. & Winker, M. Non-metallic contaminants in domestic waste, wastewater and manures: constraints to agricultural use? In: Society, T.I.F. (Ed.) Proceedings of The International Fertiliser Society Annual Meeting, Cambridge, United kingdom, 12th December 2008: The International Fertiliser Society.
Vinnerås, B., Hedenkvist, M., Nordin, A. & Wilhelmson, A. (2009). Peepoo bag - self sanitising single use biodegradable toilet. Water Science and Technology 59(9), 1743-1749.
Vinnerås, B., Holmqvist, A., Bagge, E., Albihn, A. & Jönsson, H. (2003b). The potential for disinfection of separated faecal matter by urea and by peracetic acid for hygienic nutrient recycling. Bioresource Technology 89(2), 155-161.

107
Vinnerås, B. & Jönsson, H. (2002). Faecal separation for nutrient management--evaluation of different separation techniques. Urban Water 4(4), 321-329.
Vinnerås, B., Palmquist, H., Balmér, P. & Jönsson, H. (2006). The characteristics of household wastewater and biodegradable solid waste - a proposal for new Swedish design values. Urban Water Journal 3(1), 3-11.
Xu, L.Q., Yu, S.H., Jiang, Z.X., Yang, J.L., Lai, L.Q., Zhang, X.J. & Zheng, C.Q. (1995). Soil-transmitted helminthiases: nationwide survey in China. Bull World Health Organ. 73(4), 507–513.
Yang, L., Li, X., Wu, Q., Xu, H., Nong, C., Nong, L., Li, L. & Lin, J. (2003). Observation on the inactivation effect on Ascaris suum eggs in urine directing toilet. Chinese Journal of Parasitic Disease Control 16(5), 299-301.
Yen-Phi, V.T., Clemens, J., Rechenburg, A., Vinnerås, B., Lenssen, C. & Kistemann, T. (2009). Hygienic effects and gas production of plastic bio-digesters under tropical conditions. Journal of Water and Health 7(590-596).

108

109
Acknowledgements
The work within this thesis was mainly funded by the Swedish University of Agricultural Sciences, SLU. The studies were included in projects funded by the Swedish Research Council Formas and the Swedish International Development Cooperation Agency, Sida. The National Veterinary Institute, SVA, provided laboratories and infrastructure, making these studies possible.
I have enjoyed my years as a PhD student a great deal due to the never-ending enthusiasm of my main supervisor, Björn Vinnerås, for safe nutrient recycling in general and my PhD project in particular. Thank you for your unconditional support!
I would like to acknowledge my assistant supervisors, Håkan Jönsson, Ann Albihn and Christine Moe, for valuable input from their fields of expertise, giving me important insights and making me broaden my perspectives.
Thanks to my co-authors of the papers for good research cooperation, especially Charles Niwagaba, with whom I shared a great deal of struggles, laughter and research experience, especially during the field study conducted in Uganda, which gave me insights into the different contexts PhD students have to work under.
Many thanks to all my other friendly colleagues at SLU and SVA for a pleasant atmosphere and enjoyable discussions around the lunch table. Special thanks to the members of the Environmental Engineering group led by Håkan Jönsson in an open-minded atmosphere: Björn, Sahar, Evgheni, Johanna, Francesco, Sven and Jörgen.
Thanks to the Peepoople for implementing this sanitisation method in such a way that it reaches the people that need it the most; and for challenging our conception of what a toilet is.
Many thanks to Mary McAfee for accurate and amazingly quick service in correcting my English.

110
At last but not least. To my family and friends, for support and distraction, and also for your ‘contributions’ to research and in the long run a more sustainable society. To Paloma, for keeping me connected to my research topic when at home changing diapers. To Alberto, Nora and Clara. To Elin, Linda and Katarina.