amrun project port dredging water quality reporting dredging water quality report page 4 ......
TRANSCRIPT

A report prepared in accordance with requirements of the Amrun Project EPBC Act Approval 2010/5642 and Port Dredge Management
Plan.
RTA Weipa Pty Ltd
Amrun Project Port Dredging Water Quality Reporting August 2017

Port Dredging Water Quality Report
Page 2
DOCUMENT CONTROL Document number: CAL.01-4400-HH-REP-00003
Version Purpose Approval Submission Date 1.0 Publication on Amrun
Website Amrun Project Environmental Specialist
Not Applicable
10/08/2017

Port Dredging Water Quality Report
Page 3
TABLE OF CONTENTS
1 INTRODUCTION ................................................................................................................................................... 4
2 METHODOLOGY................................................................................................................................................... 4
2.1. IN-SITU TELEMETERED DATA COLLECTION .................................................................................. 6 2.2. SEDIMENT TRAPS ................................................................................................................ 7 2.3. IN-SITU WATER QUALITY SAMPLING ......................................................................................... 7 2.4. DATA CONTROL AND ANALYSIS ............................................................................................... 7
3 RESULTS .............................................................................................................................................................. 8
3.1. TURBIDITY DATA ................................................................................................................. 8 3.2. PAR DATA....................................................................................................................... 13 3.3. TURBIDITY AND PAR .......................................................................................................... 17 3.4. TSS AND TURBIDITY ........................................................................................................... 17 3.5. GROSS SEDIMENTATION ..................................................................................................... 17
4 CONCLUSIONS ................................................................................................................................................... 17
APPENDIX A: DATA ANALYSIS STANDARD OPERATING PROCEDURE ....................................................................... 18
APPENDIX B: BASELINE DRY SEASON REPORT ......................................................................................................... 19
APPENDIX C: BASELINE WET SEASON REPORT ........................................................................................................ 20
APPENDIX D: DAILY SUMMARY OF RECORDED TELEMETRY ISSUES DURING DREDGING ......................................... 21

Port Dredging Water Quality Report
Page 4
1 INTRODUCTION The Amrun Project (formerly South of Embley) involves the construction and operation of a bauxite mine and associated processing and port facilities to be located near Boyd Point on the western side of Cape York Peninsula.. A detailed description of the Project is provided in the Queensland EIS (RTA 2011), the Queensland SEIS (RTA 2012), and the Commonwealth Environmental Impact Statement (RTA 2013).
The marine works associated with the new port facility will include the construction of jetty, wharf and ship loaders and dredging of berth pockets and departure channel. Capital dredging operations were completed using a cutter suction dredge between 25 March and 09 April 2016 with a total dredge volume of 202,416m3 of in-situ material removed by dredging over the campaign. This campaign was considerably smaller than the 2.6 million m3 approved in the Dredge Management Plan (DMP) – Port (Initial Capital Dredging) (approved by EHP on 21 January 2016 and Department of Environment on 16 November 2015).
Amrun Project environmental approvals (EPBC 2010/5642, EPML00725113) required water quality and coral health monitoring to determine the impacts of dredging on local inshore coral communities. This report presents the survey methodology and results of the water quality and coral health monitoring associated with the 2016 port initial capital dredge campaign.
2 METHODOLOGY The water quality monitoring program was conducted in accordance with Dredge Management Plan – Port (Initial Capital Dredging) which included monitoring of:
• Baseline dry season conditions (September to November 2015) • Baseline wet season conditions (December 2015 to February 2016) • Three months prior to dredging (26 December 2015 - 25 March 2016) • Dredge monitoring (26 March – 09 April 2016) • Four weeks after dredging (09 April – 08 May 2016)
The water quality monitoring program incorporated two components in situ water quality monitoring (primary monitoring method) and satellite imagery (secondary monitoring method).
In-situ water quality monitoring involved the following:
1. Continuous telemetered monitoring for turbidity and Photosynthetically Active Radiation (PAR) at seven (7) sampling locations: four (4) concern sites and three (3)

Port Dredging Water Quality Report
Page 5
reference sites (Figure 1). Conducted throughout the entire program allowing for management responses in the event of dredging related impact.
2. Daily gross sedimentation rate (using sediment traps at four (4) concern sites and one (1) reference. Conducted during baseline only
3. Monthly water quality sampling for TSS (laboratory analysis) and turbidity (in-situ turbidity probe. Conducted during baseline only
Satellite imagery assisted in determining if a dredge plume extended to potential sites of impact and determine if high turbidity values were region wide. No plume was observed on the imagery throughout the dredging.
Figure 1 Continuous telemetered water quality monitoring sites

Port Dredging Water Quality Report
Page 6
2.1. In-situ telemetered data collection
At each location two (2) turbidity loggers (primary and back up) and one (1) PAR logger were attached to the logger installation frame (LIF). The LIF was place on the seabed which was kept in place by anchor and chain. A cable connected the primary logger to the telemetry buoy which transmitted the data every 15 minutes using satellite telemetry (Figure 2). Data was accessible via a website in real time. Prior to deployment and on an approximately monthly basis all loggers were checked and calibrated to ensure collection of quality data.
Figure 2 Schematic diagram of in-situ telemetered water quality logger

Port Dredging Water Quality Report
Page 7
2.2. Sediment Traps
Gross sedimentation rates were monitored using sedimentation traps at the four concern sites and one reference site (R2). At each site three replicates were attached to the LIF. Samples were collected on a monthly basis during baseline sampling. Each sediment trap was placed in a bag, packed on ice and transported in an esky to the laboratory for analysis. The daily gross sedimentation rate (mg/cm2/day) was calculated for each site.
2.3. In-situ water quality sampling
Water quality samples were collected using a Niskin bottle from 0.7 metres above the seabed, a depth equivalent to the height of the logger monitoring probe, prior to the LIF being retrieved. The Niskin bottle was weighted prior to deployment to reduce the effects of current and deployed using a rope marked every one (1) metre. One (1) 250 ml bottle sample is collected at each site for TSS, with a duplicate sample collected at one (1) site for QA/QC purposes. Samples are placed on ice, and transported in an esky under chain of custody documentation to the laboratory for analysis within holding times (approximately 7 days for TSS).
Turbidity was recorded 0.7 metres from the seabed using a handheld probe capable of recording depth. A minimum of five (5) samples were recorded and averaged at the same time the continuous loggers were recording turbidity. A multi parameter physicochemical profile of the water column was also recorded. A minimum of five (5) turbidity measurements was recorded every 0.5 metres and averaged.
2.4. Data control and analysis
A Standard Operating Procedure (SOP) was developed for analysis of telemetered data, which included a strict quality control process as provided in Appendix A. A summary of the data analysis is below:
Trigger values for each respective season were calculated in accordance with the DMP using the 80th and 95th percentile of the respective season baseline data for each location.
The median total daily PAR (mol/m2/day) was calculated for each site for each season The daily gross sedimentation rate (mg/cm2/day) was calculated for each site. Gross
sedimentation for each sample was calculated by dividing the total dry sediment weight (mg) in each trap by the number of days the trap was deployed and then dividing by the area of the trap mouth in cm2.

Port Dredging Water Quality Report
Page 8
3 RESULTS A summary of the turbidity, PAR and sedimentation data collected during the water quality monitoring program are presented below along with an analysis of relationships between the parameters where possible. Detailed reports for the dry and wet season are provided in Appendix B and Appendix C, respectively.
3.1. Turbidity data
Baseline data collected for the dry season from September to November 2015 (Figure 3) and wet season from December 2015 to February 2016 (Figure 4) are presented in Table 1 below. The baseline turbidity trigger values were calculated for an internal (80th percentile) and external (95th percentile) are provided in Table 2.
Table 1 Wet and dry season turbidity trigger values
Site Depth (m)
Dry Season Wet Season
Internal Trigger Level (80th percentile)
External Trigger Levels (95th percentile)
Internal Trigger Level (80th percentile)
External Trigger Levels (95th percentile)
I1 8.7 5 9 32 90
I2 8.9 4 6 11 42
I3 9.4 5 6 20 72
I4 9.2 6 8 15 57
Reference
R1 9.3 7 11 35 85
R2 10.4 3 5 16 46
R3 26.5 4 8 8 89

Port Dredging Water Quality Report
Page 9
Figure 3: Dry Season Baseline Turbidity Data

Port Dredging Water Quality Report
Page 10
Figure 4: Wet Season Turbidity Data

Port Dredging Water Quality Report
Page 11
Turbidity data for all locations from 01 March to 08 May 2016 is provided in Figure 5. Dredging was completed between 26 March (18:20) and 09 April (01:00) 2016 during which time there were no dredging related impacts recorded at the inshore monitoring locations. Results were well below the internal and external trigger levels. Results are displayed in Figure 5 and Table 3 below. Based on the short duration of the dredging and low levels of turbidity at the monitoring sites, plume water quality impacts are assessed as nil to low.
A number of telemetry issues were recorded throughout the program. A summary of the issues and the management actions are summarised in Appendix D
Elevated turbidity events were recorded from 15 to 22 March 2016. These can be attributed to a storm event and were a region wide occurrence.
Table 2 Five day rolling average of the daily median at each monitoring location Site Site I1 Site I2 Site I3 Site I4 Site R1B Site R2 Site R3
Wet Season Internal Alert Level 32 11 20 15 - - -
Wet Season External Trigger Level 90 42 72 57 - - -
26-Mar-16 3.5 1.8 4.8 4.7 5.3 9.3 4.3
27-Mar-16 3 1.7 4.5 3.7 5 7.8 4.5
28-Mar-16 3 1.8 4.4 3.3 5.8 7.2 4.4
29-Mar-16 2.8 1.7 4.3 2.8 5.6 6.3 4.4
30-Mar-16 2.7 1.7 4.3 2.5 5.4 5.8 4.1
31-Mar-16 3.3 2.1 4.5 2.7 4.8 5.5 3.9
1-Apr-16 2.9 2 4.5 2.7 4.2 5.1 3.1
2-Apr-16 2.7 2 4.6 2.7 3.5 4.9 2.6
3-Apr-16 2.7 2 4.5 2.8 3.4 4.8 1.9
4-Apr-16 2.8 1.8 4.3 2.8 2.9 4.7 2.2
5-Apr-16 2.4 1.5 4.5 2.9 2.6 4.9 2.5
6-Apr-16 2.5 1.5 4.8 3.3 2.5 5.2 3.1
7-Apr-16 2.7 1.6 5.4 3.5 2.5 5.4 3.4
8-Apr-16 3.2 1.8 6.1 3.6 2.8 5.6 3.6
9-Apr-16 3.5 1.9 6.9 3.7 3.2 5.7 3.3

Port Dredging Water Quality Report
Page 12
Figure 5 Pre-dredging, dredging and post dredging turbidity data

Port Dredging Water Quality Report
Page 13
In field images taken of the plume are displayed below.
28/03/2016 29/03/2016 within 100 m of vessel
29/03/2016
30/03/2016
02/04/2016 04/04/2016
3.2. PAR data
PAR data was collected from September 2015 to 8 May 2016, data is displayed in Figure 6 (dry season baseline), Figure 7 (wet season baseline) and Figure 9 (pre-dredge, dredge and post dredge). Results were consistent with turbidity data with a decrease in PAR coinciding with increases in turbidity. Further information can be found in the Appendix B and C.

Port Dredging Water Quality Report
Page 14
Figure 7: Dry Season Baseline PAR Data

Port Dredging Water Quality Report
Page 15
Figure 8: Wet Season Baseline PAR Data

Port Dredging Water Quality Report
Page 16
Figure 9 Pre-dredging, dredging and post dredging PAR data

Port Dredging Water Quality Report
Page 17
3.3. Turbidity and PAR
The relationship between turbidity and PAR was examined for both the dry and wet season for each site. For both the wet and dry season an exponential relationship was the line of best fit between the two variables. This relationship was significant (p<0.05) at all locations except I3 during the dry season and R3 during the wet season. Further detailed results can be found in Appendix B and Appendix C.
3.4. TSS and turbidity
No statistical relationship was found between TSS and turbidity for either season.
3.5. Gross Sedimentation
The daily gross sedimentation rates are provided in Appendix B and Appendix C.
4 CONCLUSIONS Based on the data collected plume water quality impacts associated with dredging are assessed as nil to low.

Port Dredging Water Quality Report
Page 18
APPENDIX A: DATA ANALYSIS STANDARD OPERATING PROCEDURE

Memorandum
To: Linda Wells (RTA Weipa) Date: 12 May 2016
CC: David Parry, Jordan Gailey, Glenn Woodrow From: Kennedy, John (Brisbane)
Doc No: 301310-08460-00-EN-MEM-0003 File Loc:
G:\301310\08460 PROJ - South of Embley (SOE) Project\10.0 Engineering\10 MA-Marine\SOP\2 - Data Processing SOP\Rev 2
Subject: Turbidity and PAR Data Quality Control Standard Operating Procedure
Project: 301310-08460
AMRUN PROJECT – RECEIVING ENVIRONMENT MONITORING FOR BOYD DREDGING
STANDARD OPERATING PROCEDURE:
QUALITY CONTROL OF TURBIDITY AND PHOTOSYNTETICALLY ACTIVE RADIATION
DATA
Purpose:
The purpose of this document is to describe the standard operating procedure (SOP) for quality control
(QC) applied to turbidity and photosynthetically active radiation (PAR) monitoring for the Amrun
(formerly, South of Embley) Project.
Background:
The South of Embley Project Dredge Management Plan – Port (Initial Capital Dredging) (DMP) (RTA,
2015) describes a water quality monitoring program to be developed to monitor the impacts of dredging
on local water quality at Boyd Point where capital dredging is to be undertaken. The objective of the water
quality monitoring program is to provide continuous water quality data to assist in the management of
initial capital dredging and spoil disposal activities. Water quality data at Concern and Reference Sites
would be collected to:
monitor the spatial extent of turbidity in relation to predicted plumes;
adaptively manage the risk of impacts to coral in the Sites of Concern from increases in turbidity;
provide “early warning indicator” of potential impacts on coral health; and,
validate the appropriateness of coral health Reference Sites. Water quality monitoring will
confirm they have not been impacted by increased turbidity or sediment deposition from
dredging and spoil disposal activities.
Data are being collected in two phases:
Phase 1: Baseline – for the purposes of collecting information to support development of
seasonal internal alert and external trigger levels that are to be applied to environmental
management of dredging during the second phase.
Phase 2: Dredging – to monitor water quality during the dredging campaign to provide early
warning of potential impacts to corals from turbidity.
Baseline monitoring is being undertaken at Concern (I1, I2, I3, I4) and Reference (R1, R2, R3) Sites,
with loggers monitoring, turbidity and photosynthetically active radiation (PAR). The DMP identified that
readings are to be logged every 15 minutes and updated daily. Data are to be transferred at least once daily

and this is accomplished by access to real-time telemetered data. Data quality control is required
subsequent to receipt of data to remove unreliable data. Quality controlled data sets for the dry season
(September to November) and wet season (December to February) are used to develop site specific,
seasonal turbidity internal alert level (80th%ile) and external trigger level (95th%ile) for comparison
during dredging.
Dredge monitoring requires telemetered water quality loggers be deployed at each of the Concern and
Reference Sites. Systems are required to be equipped with turbidity sensors and have remote data transfer
capabilities. Data are required to be digitally logged in the unit and then transmitted using satellite
telemetry to the base station receivers for storage, display and analysis. The use of telemetered loggers
provides practicable real-time water quality data during dredging and spoil disposal activities. Turbidity
data collected from the telemetered loggers would be analysed daily against turbidity trigger levels set for
the Concern Sites to provide early warning of potential coral impacts associated with the initial capital
dredging and/or spoil disposal plumes. In the event of an exceedance of the trigger levels, an analysis of
data quality is to be undertaken as a key first step as defined in the Water Quality (Turbidity)
Management Process in Figure 12 of the DMP.
Context and Scope of this Standard Operating Procedure:
High quality marine observations and data require consistent and sustained quality assurance (QA) and
quality control (QC) practices to ensure credibility and value to operators and data users. Quality
Assurance practices involve processes that are employed with instrumentation and hardware to support
the generation of high quality data. Quality control involves follow-on steps that support the delivery of
high quality data and requires both automation and human interpretation.
This Data QC Standard Operating Procedure (SOP) relates to the QC of downloaded and telemetered
turbidity and PAR data being collected for the Amrun Project Receiving Environment Monitoring Project
(REMP) for Amrun Port Dredging. The purpose of the REMP is to undertake water quality monitoring
during baseline and dredging periods in accordance with the DMP.
This SOP has been developed considering the requirements of both the baseline and dredging QC
requirements.
This version of the SOP considers the outcomes of an iterative process of QC data optimisation conducted
during January 2016 by Advisian using a purpose-built data analysis tool developed in MS Excel. This
iterative process followed development of a QC SOP that was provided to RTA on 18 December 2015 and
contained initial parameter values for several proposed QC tests. The iterative optimisation process
conducted in January sought to refine the values of parameters applied to the QC tests to reduce the
occurrences of a) good data being excluded or b) poor data being included in an optimised data set. The
parameter values presented in the QC tests within this SOP version reflect the outcomes of the
optimisation process based on dry season data.
During this optimisation process, a review of the relative value of each test was undertaken to identify key
QC tests that benefit data quality, and considers their application via web-site application.
Reference documentation:
The procedures described in this SOP are based on the recommendations contained in the following
reference, which has been developed to provide guidance to the United States Integrated Ocean Observing
System and the larger community of optics professionals for real-time QC of optics measurements. This
reference was developed by a committee of ocean optical specialists and is considered of suitable rigor to
support real-time data QC for the Amrun REMP.

U.S Integrated Ocean Observing System, 2015. Manual for Real-Time Quality Control of Ocean
Data: A Guide to Quality Control and Quality Assurance of Coastal and Oceanic Optics
Observations. 46pp. (USIOOS, 2015)
USIOOS (2015) focuses on real-time data, presenting a series of 13 tests that operators can incorporate
into practices and procedures for QC of optical measurements, including turbidity and PAR. These tests
are identified as required, recommended or suggested.
This SOP also draws upon the recommendations contained in the associated USIOOS document regarding
Data Quality Control Flags.
U.S Integrated Ocean Observing System, 2014. Manual for the use of Real-Time Ocean Data
Quality Control Flags. 19pp. (USIOOS, 2014)
Approach
This SOP considers the application of each of these 13 tests to support QC of downloaded and real-time
data collected and transmitted for the Amrun REMP. The web-site hosting the telemetered data
(Fastwave) provides some ability to view automated QC data online, but provides a facility for download
of data that can be subject to more comprehensive desktop analysis. Data can also be directly downloaded
from instrumentation during on-site visits and subject to QC testing.
Tests used in this SOP are specified along with QC flags that reflect associated conditions. The tests
presented are similar to those presented in USIOOS (2015).
Data are evaluated using QC tests and results of those tests are recorded by inserting flags in the datasets.
For the detailed QC evaluation of data, the set of flags used in this SOP reflect the Intergovernmental
Oceanographic Commission (IOC) Primary Level flags (IOC 54:V3) (UNESCO, 2013) and adopted by
USIOOS. These flags are provided in Table 1, and are colour coded using a ‘stop light’ format.
Table 1 Flags for real-time QC data
Flag Description
Pass = 1 Data has passes critical real-time QC tests and are deemed adequate for use as preliminary data.
Not evaluated = 2 Data have not been QC tested, or the information on quality is not available.
Suspect or of high interest = 3
Data are considered to be either suspect or of high interest to data providers and users. They are flagged suspect to draw further attention to them by operators.
Fail = 4 Data are considered to have failed one or more critical real-time QC checks. If they are disseminated at all, it should be readily apparent that they are not of acceptable quality.
Missing data = 9 Data are missing; used as a placeholder.
(Note: Missing data for the SoE REMP is presented on the web-site as NULL.)
QC flags provide important information to those who may use the data in decision making. Apart from
providing routine review of general data quality, the DMP for the Amrun Project initial capital dredging
identifies that QC data review is required when an exceedance of a trigger level occurs, whereby detailed
QC analysis of data is a first step in identifying whether further actions are required to manage turbidity
impacts. Such detailed QC review warrants download of data and professional review and interpretation.
The purpose built QC data analysis spreadsheet developed for the Amrun Project REMP provides detailed
flag information and summary statistics for the various flag types for each QC test for each logger site.

This enables rapid review of data quality overall. Graphical outputs of data using ‘stop light’ colour coding
of QC outcome assists in identifying individual data points that contain failed or suspect data for review.
The 13 real-time QC tests that are identified by USIOOS (2015) as Required, Recommended or Suggested
as outlined in Table 2. The applicability of each test to the Amrun REMP is included in that table along
with the tests application for use on the telemetry website and detailed data QC upon the Advisian
compiled database.
Quality Baseline Data
For the Amrun REMP, a key outcome for baseline water quality monitoring is the provision of quality data
from which alert and trigger levels can be developed for subsequent comparison against dredging phase
monitoring data.
It is not uncommon that data collected and telemetered by instruments includes data that contain
anomalies and hence require further assessment for inclusion (or exclusion) in a quality data set. For
example, cloudy conditions or high seas may limit the transmission of complete data packages. Ideally,
collection of similar telemetered data using a parallel system for comparative analysis and validation
purposes would allow direct real-time comparison, however a duplicate telemetered system is not within
the scope of this REMP.
Data collection for the baseline period however is not reliant on telemetered data, with monthly
downloads of primary and backup logger data occurring. This does allow for comparative analysis of
turbidity to occur where the primary data downloaded from site is considered to possibly be erroneous. In
such circumstances, or where data is missing, the backup logger data may be input into the baseline data
program to improve completeness of the dataset, within which the source of data is recorded.
Subjecting the raw collected (not quality controlled) baseline data to the QC tests selected for the REMP
has enabled detailed review and interrogation of data. The output QC data from the baseline forms the
basis of data analysis for the purposes of developing Site Specific Seasonal Alert and Trigger levels.

Table 2 Outline of 13 Real-Time QC Tests
Test Group Test No.
Test Title Test Description Applicability to Amrun REMP Applicable to Website and/or Internal Database
Group 1 -
Required
Test 1 Timing/Gap Test Check for arrival of data and timestamp
Applicable Web-site
Test 2 Syntax Test Check to ensure that the message is structured properly
Applicable Web-site
Test 3 Location Test Check for reasonable geographic location.
Not applicable (NA). Fixed logger locations.
Not applicable
Test 4 Gross Range Test Data point exceeds sensor or operator-selected minimum/maximum.
Applicable. Both.
Web provides de-facto Test 7 for PAR.
Test 5 Decreasing Radiance, Irradiance, and PAR Test
Test that subsurface radiance, irradiance, and PAR decrease with increasing depth.
NA. Not testing profiles as the loggers are at a fixed depth.
NA
Group 2 -
Strongly recommended
Test 6 Photic Zone Limit for Radiance, Irradiance, and PAR Test
Test that radiance, irradiance, and PAR are nearly zero below the photic zone.
NA in relation to photic zone. Modify for application for night time observations.
Both
Test 7 Climatology Test Test that data point falls within seasonal expectations.
NA during baseline which establishes seasonal trends.
NA during dredging:
-Turbidity sensor range is not sufficiently high to warrant separate climatology test given wide range of turbidity levels recorded.
-PAR seasonal extent can be accommodated within Test 4 Gross Range Test particularly as PAR sensor theoretically has no sensor max.
NA
Test 8 Spike Test Data exceeds a selected threshold relative to adjacent data points.
Limited applicability to turbidity given natural variability in shallow, nearshore area and application of sensor maxima.
PAR considered within Gross Range Test (Test 4).
Internal database.

Test Group Test No.
Test Title Test Description Applicability to Amrun REMP Applicable to Website and/or Internal Database
Test 9 Rate of Change Test
Excessive rise/fall test. NA. Value of test is limited due to dynamic nature of turbidity and PAR in the nearshore marine environment.
Test not considered further. Spike test (Test 8) will act as surrogate for rate of change test.
NA
Test 10 Flat Line Test Invariant value. Applicable in concept.
Not applicable in practice, as test is confounded by missing data.
Run as part of internal database checks.
Regular observation of web-site data to be undertaken to identify potential logger failure. Check 1-2 times per day.
Internal database.
Group 3 -
Suggested
Test 11 Multi-Variate Test Comparison to other variables. Advance family of tests, typically providing a more restrictive form of Rate of Change Test. Not considered further here given Rate of Change Test is considered not applicable.
NA
Test 12 Attenuated Signal Test
A test for inadequate variation of the time series.
As for Test 10, not applicable. Test is confounded by missing data.
Run as part of internal checks only.
Internal database.
Test 13 Neighbour Test Comparison to nearby sensors. Not applicable to telemetered data as backup system is not telemetered.
NA

QC Tests Relevant to Amrun REMP Telemetry
The identified applicable tests are expanded upon separately below, with discussion of approach for test
specifications.
Each data packet received via telemetry contains information, including the raw voltages of data to be
converted to turbidity and PAR, etc. Below are two examples of data packets, the first one being from a
telemetry buoy with communication issues to the Seabird, and the second a full data packet with
reasonable data voltages.
a) 32:06.75200S,115:48.82881E,52E2,invalid,12.84,invalid data from sensor after 3 retries
b) 12:54.57496S,141:37.71829E,3585,2015-10-14 10:00:05,14.13, IMEI300234060453050,
26.2028, 5.37782,8.262,0.0759,2.7942
Once the data has been received by Fastwave, it is processed by dividing the data up into the parameters
required. Date, time, battery voltage, temperature and the other voltages are identified and split for the
data processing.
Test 1: Timing/Gap Test
Check for arrival of data
Test identifies that the most recent data point has been measured and received within the expected time window (TIM_INC) and has the correct time stamp (TIM_STMP)
Flags Condition Model Code Instructions
Fail = 4 Data have not arrived as expected If NOW – TIM_STMP > TIM_INC, Flag 4
Suspect = 3 N/A N/A
Pass = 1 Data has arrived as expected N/A
Test exception: None
Test specifications: TIM_INC = 15 minutes
QC actions:
Flag 4: Automatic - Note in data point metadata.
Operator – Investigate possible system issue for resolution.

Test 2: Syntax Test
Check to ensure that the message is structured properly
Test checks that the data packet received contains the expected structure without any indicators or flawed transmission errors.
If invalid data is in the packet the data is input into the web-site as a NULL value. Re-engineering of data is not proposed and subject to error.
Flags Condition Model Code Instructions
Fail = 4 Data sentence cannot be recognised to provide a valid observation.
If invalid data is in the data packet, the resultant inputs into the website are NULLs and are automatically inserted; Flag 4.
Suspect = 3 N/A N/A
Pass = 1 Expected data sentence received. N/A
Test exception: None
Test specifications: Received in following format (example):
12:54.57496S,141:37.71829E,3585,2015-10-14 10:00:05,14.13, IMEI300234060453050, 26.2028, 5.37782,8.262,0.0759,2.7942
QC actions:
Flag 4: Automatic – Replace invalid data with NULL in web-site data and note in data point metadata.
Operator – Investigate potentially wider system issue for resolution. Consider within context of other flags. Mobilise to site if necessary to resolve anticipated equipment issues.

Test 4: Gross Range Test
Data point exceeds sensor or operator-selected min/max.
Data point exceeds sensor or operator-selected min/max.
No optics observation value (OOn) is less than a minimum value or greater than the maximum value the sensor can output are acceptable (SENSOR_MIN, SENSOR_MAX).
There is no theoretical upper limit to PAR sensor maximum. During dredging, use maximum PAR value based on maximum recorded on daily PAR wave from baseline.
The operator can also select a smaller span (OP_MIN, OP_MAX) based upon knowledge or a desire to draw attention to extreme values.
Flags Condition Model Code Instructions
Fail = 4 Reported value is outside of sensor span. If OOn <SENSOR_MIN, or OOn > SENSOR_MAX, Flag = 4
Pass = 1 Applies for test pass condition
Test exception: None
Test specifications: TURB_SENSOR_MAX = 225 NTU; TURB_SENSOR_MIN = 0;
PAR_SENSOR_MAX = 200 NTU; TURB_SENSOR_MIN = 0;
OP_MIN = Not Used; OP_MAX = Not Used
Notes:
SENSOR-MAX sensor details to be provided. SENSOR_MIN will be set to 0 for turbidity and PAR. Neither of these parameters can have values less than 0.
QC actions:
Flag 4: Automatic –
For turbidity and PAR SENSOR_MIN, replace negative values with 0 and note in data point metadata.
For turbidity SENSOR_MAX, remove data point and replace with NULL.
For PAR SENSOR_MAX, replace data value with point averaging of next valid point either side of failed data so that total PAR calculation is not underestimated due to data removal. Note action in data point metadata.
Operator – monitor for persistent issue possibly requiring resolution at site. Confirm status within 24 - 48 hours and mobilise to site if required, within required timeframe, to resolve issues with equipment on site.

Test 6: Photic Zone Limit for Radiance, Irradiance, and PAR Test
Test that radiance, irradiance, and PAR are nearly zero below the photic zone (adaptable to night time monitoring).
This test would typically be used to check for upwelling/downwelling radiance, irradiance and PAR as the sensor is lowered and raised below the photic zone. Such a test is not relevant to the Amrun Project, however this test can be modified to check for PAR during night time when light should not be present.
Flags Condition Model Code Instructions
Fail = 4 Reported value Eun greater than operator selected Eunight.
If TIM_STMP>TIM_SSET or TIM_STMP<TIM_DAWN, if Eun > Eunight, flag = 4
Suspect = 3 No suspect flag is identified for this test. N/A
Pass = 1 Applies for test pass condition N/A
Test exception: None
Test specifications: Eunight = 0.5 µE/m²/s; TIM_SSET = refers to table of sunset times for day of year; TIM_DAWN = refers to table of dawn times for day of year.
QC actions:
Flag 4: Automatic – Replace failed night time data to be 0 µE/m²/s PAR at night. Note action in data point metadata.

Test 7: Climatology Test (NO LONGER PROPOSED FOR USE)
Test that data point falls within seasonal expectations
This test would only applicable following baseline data collection for wet season and dry season where seasonal expectations are developed. Use of climatology test during dredging program would highlight readings outside baseline conditions and potentially due to dredging operations.
This test is a variation on the gross range check, where the gross range SEASON_MIN_FAIL and SEASON_MAX_FAIL are at some operator-selected time period (TIM_TST).
Review of Amrun REMP data indicates that this test would provide negligible benefit given the application of the Gross Range Test and the spread of data up to the maximum sensor levels. Such a test would only be relevant in the event that there was a substantial difference between sensor maxima and observed data maxima.
Flags Condition Model Code Instructions
Fail = 4 Reported value is below baseline seasonal minimum for turbidity and PAR.
Reported value is above seasonal PAR maximum.
If for turbidity, OOn <SEASON_MIN, or OOn > SEASON_MAX, Flag = 4
If for PAR, OOn > SEASON_MAX, Flag = 4
Fail = 3 Reported value is above baseline seasonal maximum.
If for turbidity OOn > SEASON_MAX, Flag = 3
Pass = 1 Applies for test pass condition
Test exception:
For use only following collection of baseline data for selected time-period. In the case of the SoE Project, the time periods of relevance are wet-season and dry-season.
Test specifications:
For turbidity, SEASON_MAX = TBA (see notes below); SEASON_MIN = 0;
Notes:
SEASON-MAX details would be based on maximum value determined following completion of baseline data collection.
SEASON_MIN would be set to 0 for turbidity and PAR. Neither of these parameters can have values less than 0.
QC actions:
Flag 4: Automatic –
For turbidity and PAR SEASON_MIN, replace negative values with 0 and note in data point metadata. Note that this may be redundant if a similar action for has been undertaken in Test 4 Gross Range test for SENSOR_MIN. Note action in metadata.
For PAR SEASON_MAX, replace data with point averaging next valid point either side of failed data so that total PAR calculation is not underestimated due to data removal. Note action in data point metadata.
Flag 3: Operator – Triggering of climatology for turbidity SEASON_MAX may indicate dredging related impacts, where by the baseline conditions are exceeded. Operator to consider data in light of dredging operations and across reference and other impact locations for trends in turbidity.

Test 8: Spike Test (Internal Database)
Data point n-1 exceeds a selected threshold relative to adjacent data points
Optical data can spike due to the presence of aggregates in the water, so care must be taken setting high-spike thresholds. Frequent high spikes, however, may indicate a faulty sensor.
This check is for single- value points. Large spikes are easier to identify as outliers and flag as failures. Smaller spikes may be real and should be flagged as suspect.
For turbidity, this test consists of two operator selected thresholds: THRSHLD_LOWturb, THRSHLD_HIGHturb. The threshold values are dynamically established, computing the mean and standard deviation for a series of moving window 1.5 hours (6 data points at15 mins duration) either side of OOn.
For PAR, this test is not proposed in lieu of the Gross Range Test (Test 4) for PAR.
Flags Condition Model Code Instructions
Fail = 4 High spike threshold exceeded. If OOn > THRSHLD_HIGH, Flag = 4
Suspect = 3 Low spike threshold exceeded. If THRSHLD_LOW < OOn < THRSHLD_HIGH, Flag = 3
Pass = 1 Applies for test pass condition N/A
Test exception: None
Test specifications:
For turbidity:
THRSHLD_HIGHturb = meanwindow +100*SDwindow
THRSHLD_LOWturb = meanwindow +10*SDwindow
(Note: The SD multipliers used in these test specifications were developed iteratively to retain apparently good data. Due to the variable nature of turbidity, data was only flagged for further inspection for both test failures and suspect data. Failed data was not automatically removed.)
QC actions:
Flag 4: Automatic – Note in data point metadata.
Operator – If frequent spikes are detected this may be indicative of equipment issues. Confirm status within 24-48 hours and mobilise to site if required, within required timeframe, to resolve issues with equipment on site. Retain if not considered erroneous.
Flag 3: Automatic – Note in data point metadata.
Operator – Review spike along with other flags. If spike data considered erroneous, treat as for Flag 4. Retain if not considered erroneous.

Test 10: Flat Line Test (Internal database)
Invariant value
When some sensors or telemetry systems fail the results can be a continuously repeated observation of the same value. This test compares the present observation n to a number (REP_CNT_FAIL or REP_CNT_SUSPECT) of previous observations. Observation n is flagged if it has the same value as previous observations within a tolerance value, EPS, to allow for a numerical round-off error.
Note: Use of this Flat-Line Test during baseline monitoring program has identified that this test is confounded by missing data.
Flags Condition Model Code Instructions
Fail = 4 When the five most recent observations are equal, OOn is flagged fail.
For i= 1,REP_CNT_FAIL, if OOn – OOn-1<EPS, flag = 4
Suspect = 3 It is possible but unlikely that the present observations and the two previous observations would be equal. When three most recent observations are equal, OOn is flagged suspect.
For i= 1,REP_CNT_SUSPECT, if OOn – OOn-1
<EPS, flag = 3
Pass = 1 Applies for test pass condition N/A
Test exception: PAR data at night when it is expected that data should consistently remain effectively at 0µE/m²/s.
Test specifications: REP_CNT_FAIL = 10; REP_CNT_SUSPECT = 5, EPSntu = 0.0001 ntu, EPSpar = 0.000001 µE/m²/s
QC actions:
Flag 4: Automatic – For turbidity and PAR, replace flat-line data with NULL in web-site data and note in data point metadata.
Operator – Investigate likely flat line cause. Confirm status within 24-48 hours and mobilise to site if required, within required timeframe, to resolve issues with equipment on site.
Flag 3: Automatic – Note in flat line data point metadata.
Operator – Review flat line data along with other flags. If flat-line data considered erroneous, treat as for Flag 4. Retain if not considered erroneous.

Test 12: Attenuated Signal Test (Internal database)
A test for inadequate variation of the time series
A common sensor failure mode can provide a data series that is nearly but not exactly a flat line (e.g. from biofouling on sensor). This test inspects for an SD value or range variation (MAX-MIN) value that fails to exceed threshold values (MIN_VAR_WARN, MIN_VAR_FAIL) over a selected time period (TST_TIM).
Noe: This test provided very limited contribution to QC of Amrun Project baseline data.
Flags Condition Model Code Instructions
Fail = 4 Variation fails to meet the minimum threshold MIN_VAR_FAIL
If during TST_TIM,SD < MIN_VAR_FAIL, or During TST_TIM, MAX-MIN<MIN_VAR_FAIL, flag = 4
Suspect = 3 It is possible but unlikely that the present observations and the two previous observations would be equal. When three most recent observations are equal, OOn is flagged suspect.
If during TST_TIM,SD < MIN_VAR_WARN, or During TST_TIM, MAX-MIN < MIN_VAR_WARN, flag = 3
Pass = 1 Applies for test pass condition N/A
Test exception: PAR data at night when it is expected that data should consistently remain effectively at 0µE/m²/s.
Test specifications: TST_TIM = 24 hours
MIN_VAR_WARNturb = 0.01 NTU; MIN_VAR_FAILturb = 0.05 NTU.
MIN_VAR_WARNpar = 0.0004 µE/m²/s; MIN_VAR_FAILpar = 0.0002 µE/m²/s.
QC actions:
Flag 4: Automatic – For turbidity and PAR, replace attenuated data with NULL and note in data point metadata.
Operator – Investigate likely attenuation cause. Confirm status within 24-48 hours and mobilise to site if required, within required timeframe, to resolve issues with equipment on site.
Flag 3: Automatic – Note attenuated data point metadata.
Operator – Review attenuated data along with other flags. If attenuated data considered erroneous, treat as for Flag 4. Retain if not considered erroneous.

Monitoring QC Outcomes and Relevance of QC Tests
Advisian developed a purpose built QC analysis tool in Excel for assessing the quality of downloaded
data. Data were subject to the range of tests identified in the previous QC memorandum provided to RTA
on 18 December 2015.
The data QC process included an iterative optimisation process for the various parameters used in the QC
tests. This process proved highly useful in identifying data that were likely erroneous. The graphical
method applied to summarise the data in the data analysis tool included the stop-light colouration
indicative of data quality, allowing for rapid identification of areas of QC concern. Further, summaries of
data included performance across each QC test, allowing for determination of which tests were primarily
responsible for identifying fails or suspect data. This data QC analysis tool will form the basis of detailed
QC analysis of data used for calculation of wet season internal alert and external trigger levels and
detailed analysis of data performed by Advisian on behalf of RTA during the dredging phase.
The baseline data QC process has highlighted which tests are most beneficial in identifying potentially
erroneous data, and which are essentially redundant. Despite their redundancy, Advisian would maintain
these tests as part of the detailed QC data checks. The redundant nature of several QC tests warrants their
exclusion from QC performed on the telemetered data on the web-site, noting that raw data would
remain available for download and detailed analysis. Quality control tests considered most relevant to the
web-site include:
Test 1: Timing/Gap Test – already performed
Test 2: Syntax/ Test – already performed
Test 4: Gross Range Test
Test 6: Photic Zone Test
Review and Response
Telemetered data is typically reviewed by Advisian at the beginning and end of each business day to
identify issues of telemetry data failure. On weekends, data review is typically undertaken once a day
during baseline. This review includes:
Visual assessment of graphed data to identify that transmissions are still being
transmitted/received
Frequency of NULL data, as an indicator of logger function or potential issues that may be
arising and requiring on-site maintenance
Review of data records considered suspect
Frequency of review during the Phase 2 dredging period will similarly be twice a day on business days
and once a day on weekends unless there is a developing turbidity issue that has been identified during
Thursday/Friday of the work week or there is an increasing trend in turbidity due to dredging, when
more than one review will be conducted daily. In addition, the web-site provider will issue daily data
reports to Advisian in a format that can be incorporated into the QC database for testing. Data can also be
downloaded directly from the web-site.
Where an internal alert or external trigger level is exceeded, the detailed internal QC check will be
performed by Advisian using the telemetered data to confirm whether data quality is an issue. Following
confirmation of good data quality, further analysis will be undertaken by Advisian and other the relevant
parties to determine whether any turbidity changes are dredging related or due to unrelated factors.
Such analysis will occur within 48 hours of the exceedance being identified.
In the event that telemetry fails during the monitoring program, contractual arrangements are in place
between RTA and Advisian requiring mobilisation to site to rectify the issue within 7 days of the initial
error or loss. Data downloaded during site visit would be uploaded to website in place of non-transmitted
data within 48 hours of on-site logger download. Given that final resolution of any QC issues may require
a visit to site to ascertain fault with equipment, final data can only be confirmed subsequent to site visit
in such events. At other times, the stop-light approach of demonstrating data quality on detailed QC
would provide indication of data quality at any point that there was a trend toward trigger levels or where
those levels were exceeded.
Exceedance / Data Failure Process during dredging
In the event that an internal alert or external trigger exceedance occurs during dredging, the following
process will occur:
1. Email and SMS alerts will be provided to requested RTA Weipa personnel in the event the rolling daily median exceeds either the internal alert (80th) or external trigger (95th) values. These alerts would be issued daily on a midnight to midnight basis. Advisian would also receive daily data reports for the same time period.
2. Email and SMS alerts will identify the exceedance type, site of exceedance, site specific alert/trigger level exceeded, and 5-day rolling average of the daily median
3. Advisian will incorporate the provided daily data (or download it from the web-site) into the internal QC database and perform QC testing and review
4. On the day of exceedance notification, Advisian will provide to RTA the updated turbidity chart for the alert/trigger site in questions and an updated summary chart of turbidities across sites. These charts will provide detail regarding QC test performance and provide a visual overview of and turbidity trends more widely across sites
5. Based on review of data, Advisian will provide a conclusion regarding data quality.
Telemetry Failure Process during dredging
The Contractor is required to rectify loss of data (e.g. via telemetry) or evidence of errors within 7 days of
the initial error or loss. Boat-based in-situ monitoring is required until the system is re-instated.
Accordingly, in the event of data failure during dredging the following process will occur:
1. Telemetry failure identified within 24-hours of the initial system error (allowing for once-daily
checks on weekends)
2. Notify RTA/ Bechtel that a particular logger is not transmitting and that an internal investigation
process has commenced to determine the cause
3. Undertake internal review and discussions with Fastwave to determine whether the cause is due
to web-site issue or due to receipt of nil or corrupt data packets via satellite
4. Notify RTA/Bechtel of results of internal investiagtion, rectification plan and field mobilisation
timeframes (if required) within 48 hours of initial system error
5. If mobilisation is required field sampling plan to be issued within 48 to 72 hours of logger error
or failure
6. Mobilise to site in accordance with sampling plan and undertake rectification maintenance to
reinstate system. Download data from primary and backup logger prior to placing logger back
into the water.
7. Provide at least daily updates to RTA/Bechtel of implementation of rectification plan
8. If telemetry is not able to be restored, undertake daily download of logger data on-site. An
additional back up logger may be deployed for daily data collection.
9. Convert data collected on-site and provide to Fastwave for replacement of lost or erroneous data,
within 24 hours of return to shore. Incorporate replaced data into QC spreadsheet.

Determining if exceedance is dredging related
If an exceedance was identified during dredging, and data quality was identified as being acceptable, the
following review process would be undertaken by Advisian to identify whether the exceedance was
localised (e.g. potentially due to a point source such as dredging) or more widespread (in which case
dredging would not likely be responsible). Additional review of field operations may be undertaken by
RTA and/or dredging contractor to identify if dredging operations were likely responsible.
1. Advisian prepare summary graphs of turbidity across Concern and Reference sites using the QC
spreadsheet tool.
2. Advisian recommend to RTA whether the exceedence was localised to a particular site, or trend is
observed at several sites indicating more widespread phenomenon such as from a weather event.
3. Advisian review graphs of nearest sites to identify whether there is any gradient of turbidity
observed decreasing from the dredging area out, as might occur from a point source.
4. Advisian review 5-day rolling average of the daily medians for relevant monitoring location to
identify whether an increasing trend was evident over several prior days.
5. Advisian provide graphical output to RTA along with recommendation as to whether event could
be dredging related.
6. RTA liaise with dredging contractor to confirm actual operations for the day and prior few days
to confirm that dredging had been occuring.
7. RTA review satellite pictures for evidence of turbidity plume extending to the logger where
exceedance was notified. RTA may seek professional opinion from Advisian.
8. RTA determine likelihood that exceedence was likely dredging related on the basis of supporting
information. RTA may seek professional opinion from Advisian.
References
Intergovernmental Oceanographic Commission of UNESCO, 2013. Ocean Data Standards, Vol.3:
Recommendation for a Quality Flag Scheme for the Exchange of Oceanographic and Marine
Meteorological Data. (IOC Manuals and Guides, 54, Vol. 3.) 12 pp. (English.)(IOC/2013/MG/54-3)
U.S Integrated Ocean Observing System, 2015. Manual for Real-Time Quality Control of Ocean Data: A
Guide to Quality Control and Quality Assurance of Coastal and Oceanic Optics Observations. 46 pp.
(USIOOS, 2015)

Port Dredging Water Quality Report
Page 19
APPENDIX B: BASELINE DRY SEASON REPORT

www.advisian.com
RTA Weipa
Water Quality Trigger Report Port Initial Capital Dredging
31 May 2016
Advisian is a global advisory firm that provides project and business
solutions to clients who develop, operate and maintain physical assets in
the infrastructure and resources sectors.
301310-08460-00-EN-REP-0012
Advisian Pty Ltd
Level 3,60 Albert St
Brisbane QLD 4000
Australia
PO Box 15081
City East Brisbane Qld 4002
P +61 7 3221 7444
F +61 7 3221 7791
ABN: 50098008818
© Copyright 2016

Advisian Water Quality Trigger Report Port Initial Capital Dredging Document Number 301310-08460-00-EN-REP-0012
Page i
301310-08460-00-EN-REP-0012 Water Quality Dry Season Triggers Report_Rev2.docx
Disclaimer
This report has been prepared on behalf of and for the exclusive use of RTA Weipa, and is subject to
and issued in accordance with the agreement between RTA Weipa and Advisian.
Advisian accepts no liability or responsibility whatsoever for it in respect of any use of or reliance upon
this report by any third party.
Copying this report without the permission of RTA Weipa and Advisian is not permitted.
PROJECT NO 301310-08460– WATER QUALITY TRIGGER REPORT:
PORT INITIAL CAPITAL DREDGING
Rev Description Author Review
Advisian
Approval Date
2 Re-Issued For Use
S Neale
J Kennedy
J Kennedy
31/05/16

Advisian Water Quality Trigger Report Port Initial Capital Dredging Document Number 301310-08460-00-EN-REP-0012
Page ii
301310-08460-00-EN-REP-0012 Water Quality Dry Season Triggers Report_Rev2.docx
Table of Contents
1 Introduction 1
1.1 Background 1
1.2 Objectives 1
1.2.1 Dredge Management Plan Water Quality Triggers 3
2 Methods 5
3 Results 6
3.1 Existing Coral Community 6
3.2 Susceptibility of the Coral Community to Total Suspended Solids, Turbidity and Sedimentation 8
3.3 Previous Dredging Programs 10
3.4 Dry Season Data Results 15
3.4.1 Turbidity 15
3.4.2 PAR 16
3.4.3 Turbidity and PAR 18
3.4.4 Depth Profiling 20
3.4.5 TSS and Turbidity 22
3.4.6 Gross Sedimentation 24
4 Discussion 27
5 References 29
List of Appendices
Cape Lambert Port B turbidity triggers (SKM 2011) 31 Appendix A
Ichthys Project turbidity triggers from DSDMP (INPEX 2013) 33 Appendix B
East Arm Dredging Draft DSDMP turbidity triggers (AECOM 2011) 35 Appendix C

Advisian Water Quality Trigger Report Port Initial Capital Dredging Document Number 301310-08460-00-EN-REP-0012
Page iii
301310-08460-00-EN-REP-0012 Water Quality Dry Season Triggers Report_Rev2.docx
List of Figures
Figure 3-1 Water Quality Monitoring Sites and Coral Locations (RTA, 2015) 7
Figure 3-2 Box Plot of Median Total Daily PAR at each site after cloudy day data is removed. Sites (x-
axis) arranged from shallowest to deepest 18
Figure 3-3 Daily median turbidity compared to median total daily PAR at each site; linear regression
analysis results are provided in each graph in the top right corner. 19
Figure 3-4 Turbidity depth profile at each site during maintenance trip 1 (MT1) – October 2015 21
Figure 3-5 Turbidity depth profile at each site during maintenance trip 2 (MT2) – November 2015 22
Figure 3-6 Total Suspended Solid (TSS) data compared to turbidity data at all sites 24
Figure 3-7 Average gross sedimentation rates (mg/cm2/day) at each site during the dry season (±
Standard Error) 25
Figure 3-8 The average turbidity against the average daily sedimentation rate at all sites (top graph) and
Sites of Concern only (bottom graph) 26
List of Tables
Table 1-1 Extract of EA section relevant to establishing water quality trigger levels. 2
Table 1-2 Initial Port Capital Dredge Monitoring: Water Quality Trigger Levels (reproduced from Table
J1 of the EA) 3
Table 1-3 Draft initial Boyd Port Capital Dredging Monitoring: Water Quality Trigger Levels extract from
DMP 2015. 4
Table 3-1 Coral communities and their sensitivity categories for elevated TSS and sedimentation 9
Table 3-2 A summary of the trigger levels used and results of the Capital Dredging Programs in tropical
waters in the last 10 years 11
Table 3-3 Dry season turbidity triggers (NTU) for each site 16
Table 3-4 Median Dry Season Median Total Daily PAR at each site when all data is considered 17
Table 3-5 Total Suspended Solid (TSS) data and average turbidity data at all sites 23
Table 3-6 Average dry season gross sedimentation rates (mg/cm2/day) and average turbidity at each site
during the dry season 24

RTA Weipa
Water Quality Trigger Report
Port Initial Capital Dredging
Advisian Water Quality Trigger Report Port Initial Capital Dredging Client Reference: 301310-08460-00-EN-REP-0012
Page 1
301310-08460-00-EN-REP-0012 Water Quality Dry Season Triggers Report_Rev2.docx
1 Introduction
1.1 Background
The Amrun (formerly South of Embley) project requires the construction and operation of a new
Port facility located between Boyd Point and Pera Head. The marine works will include
construction of a jetty, wharf and ship loaders, requiring dredging for berth pockets and an
approach/departure channel.
The initial Amrun Port Capital Dredging involves the excavation of approximately 240,000 m3 of
seabed material using a large Cutter Suction Dredge (CSD) and transport and disposal to the
approved dredge material relocation ground by hopper barge. The expected time frame for the
completion of the dredging and relocation works is three (3) weeks, nominally commencing 22
March and completing on approximately 8 April 2016, subject to weather delays.
1.2 Objectives
The objective of this report is to present dry season water quality trigger levels based on the most
recent data collected during the Amrun Project - Baseline Receiving Environment Monitoring for
Amrun Port Dredging. In this report, trigger levels are developed for the dry season based on
baseline data collection across September to November 2015. A similar but separate report will be
developed regarding wet season trigger levels and be based on data collected between
The trigger levels are designed to address the requirements of the Environmental Authority (EA)
conditions (EMPL00725113) as outlined in condition J13b (extracted in Table 1-1 below). An
extract from the EA conditions - Table J1- Initial Boyd Port Capital Dredge Monitoring: Water
Quality Trigger Levels is provided in Table 1-2. Specific trigger levels will be developed at Sites of
Concern1 only, as per the requirements outlined in Table 1-2.
The methods of developing the trigger levels and the management responses have been outlined
in the South of Embley Project Dredge Management Plan – Port (Initial Capital Dredging) (DMP),
which was approved by Commonwealth in November 2015 and Queensland regulators in January
2016 (RTA, 2015). Section 1.2.1 summarises the process described in the DMP for the
development and application of the trigger levels.
1 Also referred to as Sites of Influence.

RTA Weipa
Water Quality Trigger Report
Port Initial Capital Dredging
Advisian Water Quality Trigger Report Port Initial Capital Dredging Client Reference: 301310-08460-00-EN-REP-0012
Page 2
301310-08460-00-EN-REP-0012 Water Quality Dry Season Triggers Report_Rev2.docx
Table 1-1 Extract of EA section relevant to establishing water quality trigger levels.
J13 (b) establish turbidity-based trigger values as shown in Table J1- Initial Boyd Port Capital Dredge Monitoring: Water Quality Trigger Levels, that:
(i) Considers, and is informed by, the findings of all relevant publish studies, including available water quality guidelines, trigger values from other comparable dredging programs with similar environmental conditions, and site specific baseline data;
See Section 3.2, Section 3.3 and Section 3.4.1
(ii) Considers the most sensitive receptor type and the most relevant water quality parameters (e.g. turbidity, PAR, sedimentation rate) and the reported impacts of turbidity on coral health from the literature and other dredging programs in areas of nearshore coral reefs;
See Section 3.1, Section 3.2 and Section 3.3
(iii) Includes season-specific turbidity trigger values;
See Section 3.4.1
(iv) Considers sediment plume intensity, duration and frequency of occurrence in establishing trigger values;
See Section and 1.2.1 and 3.4.1
(v) Considers the additive effect of multiple stressors; and
See Section 3.2
(vi) Considers the effect of depth and water column variation predicted from the 3D modelling
See Section 3.4.4
Advisian provided to RTA Weipa a method to ensure compliance with the requirements of EA
Condition J13(b) (Water Quality Triggers - 301310-08460-00EN-MEM-002-Revision 0,
December 16 2015). Each of the conditions listed in Condition J13(b) are addressed individually
in this report in the relevant sections as described in Table 1-1.

RTA Weipa
Water Quality Trigger Report
Port Initial Capital Dredging
Advisian Water Quality Trigger Report Port Initial Capital Dredging Client Reference: 301310-08460-00-EN-REP-0012
Page 3
301310-08460-00-EN-REP-0012 Water Quality Dry Season Triggers Report_Rev2.docx
Table 1-2 Initial Port Capital Dredge Monitoring: Water Quality Trigger Levels (reproduced from Table J1 of the EA)
Monitoring Locations
Coordinates (GDA 94)
Quality Characteristic
Unit Wet Season Trigger level
Dry Season Trigger Level
Frequency
Reference
Sites (R1,
R2 and
R3)
TBA Turbidity (as
a surrogate
WQ
parameter for
PAR and SR)
NTU N/A N/A Continuous
Telemetered,
Logged at 15
minute
intervals
PAR mol/m2/day N/A N/A TBD
SR mg/cm2/day N/A N/A TBD
Concern
sites (I1,
I2,I3 and
I4)
TBA
Turbidity (as
a surrogate
WQ
parameter for
PAR and SR)
NTU TBD TBD Continuous
Telemetered,
Logged at 15
minute
intervals
PAR mol/m2/day N/A N/A TBD
SR mg/cm2/day N/A N/A TBD
PAR – Photsynthetically Active Radiation; SR – Sedimenation Rate; TBA – To be advised based on results of monitoring;
TBD – To be determined in approved Dredge Management Plan: statistically derived turbidity trigger based on site specific
baseline data and trigger values from other dredging programs with similar environmental conditions together with literature
on potential impacts of turbidity on coral health;
Note: Trigger values may vary at different monitoring locations and the number of monitoring locations will be determined through the DMP
1.2.1 Dredge Management Plan Water Quality Triggers
The South of Embley project Dredge Management Plan – Port (Initial Capital Dredging) (RTA,
2015) outlines stages in the development and application of trigger levels. These include:
Draft Initial Trigger Levels – Preliminary trigger values developed using historical data
(prior to 2012) for consideration by the Determining Authority when approving the DMP (P36
Table 5 of DMP). These are presented in Table 1-3.
Site Specific Trigger Levels – defined process in the DMP for developing site specific
trigger levels for wet and dry seasons using baseline data collection (P36 of the DMP)
Trigger Level application during dredging – initiation of defined water quality
management processes if trigger levels are exceeded during dredging (P37-40 of DMP).

RTA Weipa
Water Quality Trigger Report
Port Initial Capital Dredging
Advisian Water Quality Trigger Report Port Initial Capital Dredging Client Reference: 301310-08460-00-EN-REP-0012
Page 4
301310-08460-00-EN-REP-0012 Water Quality Dry Season Triggers Report_Rev2.docx
The DMP clearly identifies the required approach for developing the Site Specific Trigger Values
for wet and dry season for subsequent application during the dredging period.
Site specific turbidity trigger levels for the Sites of Concern are calculated for wet and dry
seasons respectively from the data currently being collected during baseline monitoring. These
trigger values are used to establish internal alert levels and external trigger levels as
reporting requirements for the program.
The alert levels will be based on the 80th (internal alert) and the 95th (external trigger level)
percentiles with levels determined for both the wet and dry season as follows:
Internal Alert Levels would be triggered if the site specific internal alert turbidity
concentration for a Site of Concern is exceeded by the five day rolling average of the daily
median turbidity on three consecutive days. Exceedance would trigger investigations to
determine the cause of the high turbidity measured.
External Trigger Levels would be triggered if the site specific external trigger turbidity
concentration for a Site of Concern is exceeded by the five day rolling average of the daily
median turbidity on three consecutive days. Triggering would result in application of the
Water Quality Management Process as depicted in Figure 12 of the DMP (RTA, 2015).
Table 1-3 Draft initial Boyd Port Capital Dredging Monitoring: Water Quality Trigger Levels extract from DMP 2015.
Monitoring location
Quality Characteristic
Unit Initial Alert Level Trigger level Frequency
Wet season
Dry season
Wet season
Dry season
Concern
Sites (I1, I2,
I3 and I4)
Turbidity (NTUe) 7.7 6.1 23.8 14.3
Continuous
Telemetered,
logged at 15
minute
intervals

RTA Weipa
Water Quality Trigger Report
Port Initial Capital Dredging
Advisian Water Quality Trigger Report Port Initial Capital Dredging Client Reference: 301310-08460-00-EN-REP-0012
Page 5
301310-08460-00-EN-REP-0012 Water Quality Dry Season Triggers Report_Rev2.docx
2 Methods
The process used to develop the turbidity triggers from the baseline data is:
1) Examine the coral community information from the Sites of Concern and rank the coral
community in terms of susceptibility to elevated suspended solids and sedimentation rates
(see Section3.1 and Section 3.2).
2) Using the baseline Quality Control (QC) turbidity data, calculate the median, 80th, 90th and
95th percentile turbidity values2 for the Reference Sites and Sites of Concern, for each season
(dry – September to end of November, wet - December to end of February). (see Section 3.4)
3) From the perspective of biological relevance to the receiving environment, identify
appropriate turbidity percentile metric depending upon the response category (sub-lethal
and lethal effect) as outlined in Table 6 of Erftemeijer et al (2012) and the sensitivity of the
dominant coral community growth forms outlined in Figure 5 of the same study. (see Section
3.2,)
4) Compare the seasonal site specific turbidity trigger to trigger levels developed for previous
dredging programs in similar environments and the Australian and New Zealand Guidelines
for Fresh and Marine Water Quality, Australia and New Zealand Environment and
Conservation Council and Agriculture and Resource Management Council of Australia and
New Zealand (ANZECC/ARMCANZ, 2000) for context, and also examine the outcomes in
terms of coral community impacts of previous dredging campaigns where information is
available (see Section 3.3).
5) Develop a relationship between photosynthetically active radiation (PAR) and turbidity by
plotting the baseline QC data for both parameters against each other (see Section3.4.3)
6) Develop a relationship between gross sedimentation and turbidity based on data collected at
each site for gross daily sedimentation and median daily turbidity (see discussion in 3.4.6).
7) Examine the literature and results of the dredging programs to determine an appropriate
duration of low light which will preclude any sub-lethal or lethal impacts to the coral
communities at the Sites of Concern (see Section 3.2).
2 Statistical criteria for establishing the alert trigger levels are already defined in the DMP (RTA, 2015), being the 80th
and 95th percentiles of the baseline for internal alert and external alert respectively

RTA Weipa
Water Quality Trigger Report
Port Initial Capital Dredging
Advisian Water Quality Trigger Report Port Initial Capital Dredging Client Reference: 301310-08460-00-EN-REP-0012
Page 6
301310-08460-00-EN-REP-0012 Water Quality Dry Season Triggers Report_Rev2.docx
3 Results
3.1 Existing Coral Community
The closest coral communities to the proposed port facilities are located on fringing reefs situated
~1.7 km to the north at Boyd Point and ~2.8 km to the south at Pera Head, as depicted in the
DMP (RTA, 2015) (refer Figure 3-1). Drop video surveys completed as part of EIS and
Supplementary EIS studies at Boyd Point and Pera Head found large areas of coarse and silty
sand punctuated by occasional outcrops of hard substrate up to 2m high. These outcrops were
sparsely covered in algae, soft corals, sponges and hard corals. The percentage cover of hard coral
was approximately 1-3% at both locations. The drop video surveys indicated that shoals were
primarily composed of isolated patches of undulating hard substrate up to 1 m high with sand and
rubble patches in between. There were large aggregations of sea whips in some areas and only
occasional hard coral colonies at one shoal location, with approximate percentage cover of hard
coral of below 1%.
The sparse hard coral communities were dominated by small (<20cm diameter) to medium (20-
40cm diameter) sized colonies of corals from the families Dendrophylliidae, Faviidae and
Poritidae. The visibility at all sites was approximately 1–2m. There were occasional larger (>2m)
Porites spp bommies. The hard coral genera and species present at these locations are typical of
corals that grow in marine environments that experience extremes in turbidity and/or
temperature. The growth form or shape of the more common genera found, such as Turbinaria
spp (cup shaped or foliose) and Porites spp (domed shaped or massive) appeared flattened
indicating a change in the ‘typical’ growth form to adapt to consistent low light conditions.

RTA Weipa
Water Quality Trigger Report
Port Initial Capital Dredging
Advisian Water Quality Trigger Report Port Initial Capital Dredging Client Reference: 301310-08460-00-EN-REP-0012
Page 7
301310-08460-00-EN-REP-0012 Water Quality Dry Season Triggers Report_Rev2.docx
Figure 3-1 Water Quality Monitoring Sites and Coral Locations (RTA, 2015)

RTA Weipa
Water Quality Trigger Report
Port Initial Capital Dredging
Advisian Water Quality Trigger Report Port Initial Capital Dredging Client Reference: 301310-08460-00-EN-REP-0012
Page 8
301310-08460-00-EN-REP-0012 Water Quality Dry Season Triggers Report_Rev2.docx
3.2 Susceptibility of the Coral Community to Total Suspended Solids, Turbidity and Sedimentation
The genera and growth forms of the coral community at each site (as described above) provide
information on the susceptibility of that community to elevated turbidity and elevated
sedimentation. The relationship between the coral growth form (and genera) and the
susceptibility to elevated sedimentation and suspended solids is described in a study by
Erftemeijer et al (2012), refer to Table 6 and Figure 5 (Suspended Solids/Turbidity) and Table 10
and Figure 6 (Sedimentation) in that publication3.
The relative sensitivities of each coral genus and growth form compared to levels of suspended
sediment in the water column and rates of sedimentation as described are outlined in Table 3-1.
The TSS values provided are converted turbidity (NTU) based on the laboratory experiments
undertaken by James Cook University. The converted turbidity values are provided in parenthesis
after the TSS value. The relationship between TSS and turbidity was calculated as 1mg/L (TSS)
equals 0.67 NTU (see Section 4.2 of the DMP).
The growth forms of the three most dominant coral families found near Boyd Point and Pera
Head are those growth forms which have a high (foliose or laminar) or intermediate (massive or
dome shaped) tolerance to suspended solids. This suggests that extended periods of TSS values of
40mg/L (27 NTU) may have sub-lethal impacts on corals of these growth forms, partial mortality
impacts to coral colonies may not occur until these colonies are exposed to prolonged periods
(several weeks) of TSS in the water column of 100mg/L (67 NTU) or more (refer Table 3-1).
In terms of net sedimentation rates the growth forms of the three most dominant coral families
found near Boyd Point and Pera Head are those growth forms which have a sensitive (foliose or
laminar) or intermediate (massive/dome shaped) tolerance to elevated sedimentation rates. This
suggests that extended periods of sedimentation values of 10mg/cm2/day may have sub-lethal
impacts on corals of these growth forms, lethal impacts may not occur until these colonies are
exposed to extended periods of sedimentation (up to two weeks) of greater than 50mg/cm2/day
(refer to Table 3-1).
3 http://www.sciencedirect.com/science/article/pii/S0025326X12001981

RTA Weipa
Water Quality Trigger Report
Port Initial Capital Dredging
Advisian Water Quality Trigger Report Port Initial Capital Dredging Client Reference: 301310-08460-00-EN-REP-0012
Page 9
301310-08460-00-EN-REP-0012 Water Quality Dry Season Triggers Report_Rev2.docx
Table 3-1 Coral communities and their sensitivity categories for elevated TSS and sedimentation
Location
Overall Hard
Coral cover
(%)
Dominant coral
family Growth Form
Total Suspended Solids (mg/L) converted NTU values
in brackets1
Max Sedimentation Rates 2
TSS Growth
form Sensitivity
Category
Minor Sub-
lethal effect
after 5-6
weeks
Lethal effects
(Partial Mortality)
after 2-4 weeks
Sedimentation rate growth
form Sensitivity category
(Figure 6)
Sub-lethal effects
(minor) (mg/cm2/day)
after 3 weeks
Lethal effects (partial
mortality) (mg/cm2/day)
after 2-3 weeks
Boyd Point
and Pera
Head
1-3%
Dendrophylliidae Laminar and Foliose Tolerant
(category 2) 40 (27 NTU) 100 (67 NTU) Sensitive (category >3.5) 10 50
Faviidae Massive Intermediate
(category 3) 40 (27 NTU) 100 (67 NTU) Intermediate (category 3) 10 50
Poritidae Massive Intermediate
(category 3) 40 (27 NTU) 100 (67 NTU) Intermediate (category 3) 10 50
1 Values in these columns are taken from Figure 5 and Table 6 of Erftemeijer et al 2012 (pp 1752)
2 Values in these columns are taken from Figure 6 and Table 10 of Erftemeijer et al 2012 (pp 1758).

RTA Weipa
Water Quality Trigger Report
Port Initial Capital Dredging
Advisian Water Quality Trigger Report Port Initial Capital Dredging Client Reference: 301310-08460-00-EN-REP-0012
Page 10
301310-08460-00-EN-REP-0012 Water Quality Dry Season Triggers Report_Rev2.docx
3.3 Previous Dredging Programs
A review of the turbidity trigger levels utilised for a number of dredging projects in similar
environments is presented in Table 3-2. Only the most recent (last 10 years) capital dredging
projects located in tropical Australian coastal environments in close proximity to coral
communities were chosen for comparison.
The table describes the turbidity trigger levels used for each project and brief summary of the
overall impacts on the coral communities due to the dredging programs is provided. This affords
context to the turbidity trigger levels proposed for the Amrun Port capital dredging. Much of the
information in this table with the exception of the trigger levels is an extract from Ports
Australia(2014) - Appendix A – Capital and Maintenance dredging projects and monitoring
program information for subtropical and Tropical Australian Ports. The trigger levels are gathered
from individual reports (referenced in the ‘Description’ column) or appendices related to the
environmental approval documents published for each of the projects.
Note there are no specific water quality guidelines for open coastal regions of Western Cape York
or the Gulf of Carpentaria. In the event there is no baseline data for a specific area, the relevant
guidelines for the region default to the broader ANZECC/ARMCANZ guidelines
(ANZECC/ARMCANZ, 2000) or the Queensland Water Quality Guidelines (QWQG) for the wet
tropics (DEHP, 2009).
The ANZECC/ARMCANZ (2000) guidelines state that in wet-dry tropical areas such as Weipa
which are influenced by strong seasonal events, separate trigger levels for the wet and dry seasons
are required.

RTA Weipa
Water Quality Trigger Report
Port Initial Capital Dredging
Advisian Water Quality Trigger Report Port Initial Capital Dredging Client Reference: 301310-08460-00-EN-REP-0012
Page 11
301310-08460-00-EN-REP-0012 Water Quality Dry Season Triggers Report_Rev2.docx
Table 3-2 A summary of the trigger levels used and results of the Capital Dredging Programs in tropical waters in the last 10 years
Location Description Year Duration
(months)
Volume (m3) Distance to
nearest coral
community
Trigger Level Durations Outcome
Hay Point,
Queensland
Apron and
Departure Path
Capital
Dredging
(Trimarchi and
Keane 2007).
2006 6 8.6 million Victor Islet <4km,
Round Top ~4 km
>100mg/L for at least 6
continuous hours
Continuous 6 hours An assessment of all TSS data recorded pre-dredging, during dredging
and post-dredging identified a total of 31water quality trigger exceedences
at Victor Islet and none at Round Top Island. Only six exceedence events
were recorded during the dredging period at Victor Islet.
Coral condition monitoring undertaken showed evidence that sediment
deposition associated with the migration of the dredge plume occurred at
both Round Top Island and Victor Islet. This deposition resulted in
damage to some corals between three and six months after the start of
dredging, with a maximum of about 4% (Round Top Island) and 6.5%
(Victor Islet) of corals showing some patches of mortality. Approved coral
mortality at impact location was set at 20% loss.
Hay Point,
Queensland
Hay Point Coal
Terminal
expansion
(BMA 2012)
2010-2011 Dredging and
blasting over 2
stages (approx.
4 months per
stage) over a 14
month period.
258,000 Hay reef <1km,
Round Top Island
~4 km
6-hour rolling median of 110
NTU during daylight hours.
Rolling median 6
hours
Several water quality trigger exceedances (primarily during non-dredging
periods). No detectable impact of dredging as pattern of change was the
same at reference and impact sites. Major declines in coral and increases
in macroalgae at both impact and reference sites. Plumes did not reach
coral receptors. Major influences from a cyclone prior to baseline survey
complicated impact assessment.
Port Hedland,
Western
Australia
Rapid Growth
Project 5 (BHP
2011)
2008-
2010
18 3.9 million <1km 80th%ile seasonal and tidal
state turbidity triggers at
Finucane Island Coral (FIC)
monitoring site. Dry season
(neaps 5.3 NTU, spring 12.4
NTU) Wet Season (neaps
13.5 NTU and springs 15.9
NTU)
Single value No formal exceedances1 of turbidity trigger breaches at any site. Turbidity
ranged between 5 and approximately 30 NTU across sites. No impact to
coral communities at FIC impact site.
Port Hedland,
Western
Australia
South west
Creek Tug Boat
cyclone
mooring facility
(GHD 2012)
2011 4 2.5 million <1km Seasonal triggers. Tier 1
trigger level – Rolling 14 day
median at impact sites over a
full spring and neap tidal
cycle>80th%ile baseline
turbidity and significant
difference from reference
sites
Rolling 14 day
median
One exceedance of 80th percentile trigger threshold. No higher level
exceedances. Sediment levels at greater depth on corals at one impact site
than other sites (predicted in EIA). The increase had no measurable
impact on benthic cover at this site.

RTA Weipa
Water Quality Trigger Report
Port Initial Capital Dredging
Advisian Water Quality Trigger Report Port Initial Capital Dredging Client Reference: 301310-08460-00-EN-REP-0012
Page 12
301310-08460-00-EN-REP-0012 Water Quality Dry Season Triggers Report_Rev2.docx
Location Description Year Duration
(months)
Volume (m3) Distance to
nearest coral
community
Trigger Level Durations Outcome
Port Hedland,
Western
Australia
South West
Creek Dredging
and
reclamation
Project.
(WorleyParsons
2012)
2011-2012 12 14.2 million <1km Upper trigger of 32 NTU
(80th%ile of baseline data) at
SEC coral Impact site.
Upper trigger of 18.3 NTU
(80th%ile of baseline data) at
SWC coral Impact site.
24 hour rolling
median is greater
than the upper
trigger threshold for
a continuous period
of more than 14 days
One exceedance of 80th percentile trigger threshold for turbidity.
Sediment levels increased at one impact site (predicted in EIA).
Subsequent surveys found that the coral health at that site had improved post-dredging indicating impacts were temporary and rapid recovery.
Port Hedland,
Western
Australia
Stingray Creek
cyclone
moorings
Project
(WorleyParsons
2012)
2012 4 5.88 million <1km Upper trigger of 32 NTU
(80th%ile of baseline data) at
SEC coral Impact site.
Upper trigger of 18.3 NTU
(80th%ile of baseline data) at
SWC coral Impact site.
24 hour rolling
median is greater
than the upper
trigger threshold for
a continuous period
of more than 14 days
Brief exceedances of investigation trigger levels (not at levels requiring
formal reporting to regulator or reactive management actions). Coral
health parameters did not change significantly at inshore sites between
the baseline and the post-dredge survey.
Cape Lambert,
Western
Australia
RIO Port A
expansion
(SKM 2011)
2007 4 3.6 million <1km Water quality triggers based
on Intensity Duration and
Frequency of baseline
turbidity data (80th and
95th%ile)
Rolling median 6
hours
Permitted impact of <10% net coral mortality at any impact site. Actual
impact was <3% net mortality at impact sites.
Cape Lambert,
Western
Australia
Rio Port B
expansion
(SKM 2011)
2008-
2009
10 301 million <1km Site specific water quality
early warning criteria -
99th%ile of the baseline
rolling 6hr median turbidity
data at each site (see
tabulated values extract from
SKM (2011) in Appendix A
coral health triggers used for
compliance
Rolling median 6hrs <3% net coral mortality at impact sites compared to an allowable loss of
<10% net mortality.
Dampier,
Western
Australia
Woodside
Pluto- Mermaid
sound dredging
(MScience
2009, SKM
2007,
WorleyParsons
2011
2007-
2010
30 14 million <1km Turbidity triggers based on
80th%ile and 95th%ile of
baseline data.
Permitted impact of 5 -10% coral mortality at impact sites depending
upon zone of impact. Actual impacts were <5% net mortality at impact
sites. Water quality threshold were too conservative and well below those
needed to cause coral mortality

RTA Weipa
Water Quality Trigger Report
Port Initial Capital Dredging
Advisian Water Quality Trigger Report Port Initial Capital Dredging Client Reference: 301310-08460-00-EN-REP-0012
Page 13
301310-08460-00-EN-REP-0012 Water Quality Dry Season Triggers Report_Rev2.docx
Location Description Year Duration
(months)
Volume (m3) Distance to
nearest coral
community
Trigger Level Durations Outcome
Barrow Island,
Western
Australia
Gorgon Gas
Development
(Chevron 2011)
2010-2011 18 7.6 million <200m Adaptive Management
triggers based on ongoing
coral mortality measures.
Initial water quality criterion
used to trigger a response,
but primarily coral health
triggers used.
Net area of coral loss was 3.26 ha, less than the allowed limit of 8.47 ha.
Coral assemblages were variable and some changes (e.g. % coral cover in
Zones of High and Moderate Impact) were likely to be dredging related.
Port of Darwin East Arm
Ichthys Project
(INPEX 2013)
2014 14 16.1 million <2km See extract of DSMP detail
on turbidity triggers in
Appendix B. Wet and dry
season triggers. Level 1
trigger occurs when the daily
average turbidity was:
Greater than the 99th%ile
(intensity)
Greater than the 95th%ile
for more than X
consecutive days
(Duration)
Greater than the 95th%ile
for more than X number
of days within a 7 day
period (frequency)
Variable up to 7 days Based on the first 8 months of dredging: No turbidity exceedances
(intensity, duration or frequency). No impacts attributable to dredging.
Five bimonthly surveys during dredging have been completed. Substantial
coral thermal bleaching recorded from survey 3.
Port of Darwin East Arm
Wharf
Expansion
(AECOM 2011)
2012-2013 4 685,000 <2km Low trigger level of median
daily turbidity >80th%ile,
high trigger of >95th%ile. See
Appendix C for extract from
the DSDMP.
Low trigger levels
for 3 consecutive
days
Several exceedances of water quality triggers during periods of spring
tides (not thought to be dredging related). Plume limited to 50m of
dredge footprint. Authors report no adverse effects from dredging. No
changes in filter feeder indicators. Decreases (<10%) in coral cover at 2 of
3 designated impact sites.
Changes in coral health were ascribed to both natural and dredge factors.

RTA Weipa
Water Quality Trigger Report
Port Initial Capital Dredging
Advisian Water Quality Trigger Report Port Initial Capital Dredging Client Reference: 301310-08460-00-EN-REP-0012
Page 14
301310-08460-00-EN-REP-0012 Water Quality Dry Season Triggers Report_Rev2.docx
The most common triggers utilised were the 80th, 95th and 99th percentile metrics for turbidity.
This is consistent with advice provided in the ANZECC guidelines and the methods for calculating
internal alert level and external alert level for turbidity as detailed in the Amrun (South of
Embley) Project DMP (RTA, 2015). Durations range from daily to weekly, in some instances neap
and spring tidal triggers are provided due to the macrotidal nature of some locations. In most
cases seasonal triggers are applicable.
Examples of turbidity trigger levels used in other projects which may be applicable when
comparing to those developed for the Amrun project are from the Cape Lambert Port B projects,
the Ichthys Project, Darwin East Arm Wharf project and the Hay Point Apron and Departure Path
Capital Dredging project. It is worth noting that all of these projects are substantially larger in
scale and of longer durations (>4 months) when compared to the Amrun Port Initial Capital
Dredging (240,000m3, approximately 3 weeks).
The 99th%ile trigger levels developed from baseline data proposed for the monitoring sites at Cape
Lambert ranged between 7 NTU (Delambre Island) and 34 NTU (Power Station) (Appendix A).
The Power station site (PWR) was located in the impact area and closest to the dredging
operations and consisted of a sparse turbidity tolerant coral community. Durations and
frequencies above this trigger value were set at 7 instances of >34 NTU allowed in a two week
period. Coral monitoring of 60 tagged colonies at the PWR site was undertaken every two weeks.
Despite several elevations above the turbidity trigger levels, no statistically significantly impacts
on the coral community due to dredging activities were measured at the PWR site during the 10
month monitoring period.
The Level 1 trigger levels used on the Ichthys Project in Darwin for turbidity tolerant coral
communities in the area of impact at Channel Island was set at <15 NTU in the dry season.
Additional management actions were taken if the rolling daily average turbidity was >15 NTU for
5 consecutive days. Based on the first 8 months of dredging, no turbidity exceedances were noted
and no impacts on the coral communities attributable to dredging were observed.
The rolling average 6hr trigger level of >100mg/L (~67 NTU) used at Hay Point was exceeded on
several occasions at the nearest high turbidity adapted coral community site located
approximately 4km away at Victor Islet. Results of coral surveys at Victor Islet after dredging
suggested there was dredging related partial coral mortality and bleaching at monitoring sites.
The compromised coral colonies recovered four months after dredging had ceased.
Based on the review by Erftemeijer et al (2012) summarised in Section 3.2, turbidity tolerant coral
communities (such as those found at Boyd Point and Pera Head) may experience some nonlethal
impacts when turbidity is elevated for long periods (5-6 weeks) above 27 NTU and lethal impacts
when turbidity exceeds 67 NTU for long periods up to 2-4 weeks.
A review by Hanley (2011) on the results of capital dredging environmental monitoring programs
in the Pilbara region of Western Australia found generally that trigger levels set to predict the
areas of impact were often very conservative. This lead to overly large predicted areas of impact,
costly and complex and intensive monitoring program designs and implementations. The actual
impacts to the benthic communities in the areas of impact due to the dredging and relocation
activities were often negligible or not statistically significant even for the very large dredging
programs over years (refer to the ’outcome’ column information for each project in Table 3-2).
Most monitoring programs use a very conservative approach when adopting site specific triggers
or thresholds due to the lack of specific information on the benthic community in the vicinity of

RTA Weipa
Water Quality Trigger Report
Port Initial Capital Dredging
Advisian Water Quality Trigger Report Port Initial Capital Dredging Client Reference: 301310-08460-00-EN-REP-0012
Page 15
301310-08460-00-EN-REP-0012 Water Quality Dry Season Triggers Report_Rev2.docx
the dredging operations (Ports Australia 2014). In more recent times (Gladstone – Western Basin
Dredging project for example), site specific thresholds for the sensitive receptor which is most
likely to be impacted upon by dredging (seagrass) were developed in partnership with specific
scientific studies into these thresholds (Chartrand et al 2012). The results were then incorporated
into the dredging management plans as triggers for management actions.
3.4 Dry Season Data Results
3.4.1 Turbidity
The dry season trigger levels are based on the 80th and 95th percentile of the combined dry season
data.
The dry season turbidity 80th and 95th%ile values for each site (NTU) are provided in Table 3-3.
The 80th%ile correspond to the internal trigger levels and the 95th%ile correspond to the external
trigger levels (rounded down to the nearest whole number). In terms of management actions
during dredging, only the trigger levels from the Sites of Concern are applicable; trigger levels for
Reference Sites are provided for comparison only. The highest internal turbidity trigger for dry
season at the Sites of Concern was Site I4 (6 NTU) and the lowest was Site I2 (4 NTU). The
highest external turbidity trigger for Sites of Concern was also measured at site I1 (9 NTU) and
the lowest at Site I2 and Site I3 (6 NTU).

RTA Weipa
Water Quality Trigger Report
Port Initial Capital Dredging
Advisian Water Quality Trigger Report Port Initial Capital Dredging Client Reference: 301310-08460-00-EN-REP-0012
Page 16
301310-08460-00-EN-REP-0012 Water Quality Dry Season Triggers Report_Rev2.docx
Table 3-3 Dry season turbidity triggers (NTU) for each site
Site Average Depth as
measured by
logger (m)
Turbidity samples
(n)
Internal
Turbidity
Trigger Level
(NTU) 80th
%ile
External
Turbidity
Trigger Level
(NTU) 95th
%ile
Sites of Concern
I1 8.7 8515 5 9
I2 8.9* 7407 4 6
I3 9.4 4611 5 6
I4 9.2 7171 6 8
Reference Sites
R1 9.3 4028 7# 11#
R2 10.4 8202 3# 5#
R3 26.5* 7184 4# 8#
* Depth estimate based on field vessel depth sounder measurements reported in daily reports during field
maintenance. Logger does not include depth sensor.
# Reference site percentile values added for comparison. Reference sites do not have internal alert or external trigger
values.
3.4.2 PAR
The median total daily PAR (i.e. cumulative PAR across 24 hour period) was calculated for each
site during the dry season period and the results are presented in Table 3-4. The lowest total daily
PAR was measured at site R3 and the highest total daily median PAR measured at site I4. This
data was used to examine the relationship between median daily PAR and depth at each site. The
results are presented as a box plot in Figure 3-2. The sites on the x-axis are arranged in increasing
depth. The regression analysis undertaken in STATISTICA found there is a significant linear
relationship between median daily PAR and depth (p<0.05); the shallower the site the higher the
sunlight reaching the seafloor.

RTA Weipa
Water Quality Trigger Report
Port Initial Capital Dredging
Advisian Water Quality Trigger Report Port Initial Capital Dredging Client Reference: 301310-08460-00-EN-REP-0012
Page 17
301310-08460-00-EN-REP-0012 Water Quality Dry Season Triggers Report_Rev2.docx
Table 3-4 Median Dry Season Median Total Daily PAR at each site when all data is considered
Site Average Depth as
measured by logger (m)
PAR samples (n) Median Total Daily
PAR (mol/m2/day)
Sites of Concern
I1 8.7 8427 1.01
I2 8.9* 7996 0.89
I3 9.4 4581 0.96
I4 9.2 7023 1.28
Reference Sites
R1 9.3 3949 0.27
R2 10.4 8019 1.09
R3 26.5* 6630 0.07
* depth estimate based on field vessel depth sounder measurements reported in daily reports during field
maintenance. Logger does not include depth sensor.

RTA Weipa
Water Quality Trigger Report
Port Initial Capital Dredging
Advisian Water Quality Trigger Report Port Initial Capital Dredging Client Reference: 301310-08460-00-EN-REP-0012
Page 18
301310-08460-00-EN-REP-0012 Water Quality Dry Season Triggers Report_Rev2.docx
Figure 3-2 Box Plot of Median Total Daily PAR at each site after cloudy day data is removed. Sites (x-axis) arranged from shallowest to deepest
3.4.3 Turbidity and PAR
The relationship between the turbidity and PAR measured at depth at each site was examined by
comparing the median total daily PAR plotted against the median daily turbidity. Because the
light reaching the seafloor is influenced by the amount of cloud in the sky at the time the PAR data
is recorded, these PAR data (and associated turbidity data for that day) need to be removed. The
data on daily solar radiation measured at the Weipa Airport Bureau of Meteorology (BOM) site
(BOM 2016) was examined to look for falls in solar radiation on a given day. The decreases in
daily solar radiation correspond with clouds passing over the sun and the total daily PAR data on
these days (and corresponding turbidity data) is removed from the analysis. The line of best fit
shown on each graph indicates an exponential relationship best describes the relationship
between the two variables. A regression comparing median total daily PAR and median daily
turbidity from each site (Figure 3-3) found a significant relationship between the two variables
(p<0.05) in all cases except at Site I3. Provision of individual site graphs removes depth as a
variable between sites.

RTA Weipa
Water Quality Trigger Report
Port Initial Capital Dredging
Advisian Water Quality Trigger Report Port Initial Capital Dredging Client Reference: 301310-08460-00-EN-REP-0012
Page 19
301310-08460-00-EN-REP-0012 Water Quality Dry Season Triggers Report_Rev2.docx
Figure 3-3 Daily median turbidity compared to median total daily PAR at each site; exponential line of best fit equation and R2 values are provided
in each graph in the top right corner.

RTA Weipa
Water Quality Trigger Report
Port Initial Capital Dredging
Advisian Water Quality Trigger Report Port Initial Capital Dredging Client Reference: 301310-08460-00-EN-REP-0012
Page 20
301310-08460-00-EN-REP-0012 Water Quality Dry Season Triggers Report_Rev2.docx
3.4.4 Depth Profiling
Turbidity depth profiling was undertaken at all sites during each dry season water quality logger
maintenance trip (approximately monthly). The changes in turbidity values as depth increases at
each site from data collected in the dry season from MT1 and MT2 is presented in Figure 3-4 and
Figure 3-5, respectively.
The profile data collected during MT1 indicates that at all sites turbidity increased with depth. At
six if the seven monitoring sites the increase in turbidity with depth was small (1-2NTU), at the
Reference Site R2 the increase in depth was larger in the order of >3NTU.
The profile data collected during MT2 indicates that at the majority of sites the turbidity increased
with depth, with the exception of Reference Sites R1 and R2 where no increases in turbidity with
depth were observed. Increases in turbidity with depth at the four Sites of Concern (I1, I2, I3 and
I4) were approximately between 0 – 2 NTU over the depth profile. The measured turbidity
increased most markedly at the deepest site - Reference Site 3 (R3) at depths greater than 16m. At
this depth the turbidity values started to increase until eventually the turbidity measured near the
seafloor at 25m was over five times (5.5NTU) the turbidity values measured at the shallower
depths (<1NTU).
Three dimensional modelling of the fate of sediments from dredging was undertaken as part of
the South of Embley EIS across a number of tidal and seasonal scenarios. The modelling outputs
showed the spatial scales of the depth averaged concentrations of TSS throughout the water
column and predicted potential impacts based on this. Examples of the model outputs can be
found in the DMP (RTA 2015).
The depth profiling data collected during MT1 and MT2 (outlined above) shows that turbidity is
generally homogenous through the water column, increasing slightly with depth. There are some
exceptions which are likely due to depth profiling measurements being undertaken at peak of tidal
flow potentially during the largest tidal ranges (spring tides) when the seafloor sediments are
resuspended more readily leading to elevated turbidity measurements near the seafloor.
Generally, the model predictions using depth averaging of the TSS through the water column is
therefore good approximation of what occurs (homogenous TSS throughout the water column) at
the monitoring sites.

RTA Weipa
Water Quality Trigger Report
Port Initial Capital Dredging
Advisian Water Quality Trigger Report Port Initial Capital Dredging Client Reference: 301310-08460-00-EN-REP-0012
Page 21
301310-08460-00-EN-REP-0012 Water Quality Dry Season Triggers Report_Rev2.docx
Figure 3-4 Turbidity depth profile at each site during maintenance trip 1 (MT1) – October 2015

RTA Weipa
Water Quality Trigger Report
Port Initial Capital Dredging
Advisian Water Quality Trigger Report Port Initial Capital Dredging Client Reference: 301310-08460-00-EN-REP-0012
Page 22
301310-08460-00-EN-REP-0012 Water Quality Dry Season Triggers Report_Rev2.docx
Figure 3-5 Turbidity depth profile at each site during maintenance trip 2 (MT2) – November 2015
3.4.5 TSS and Turbidity
At all sites during each field trip in the dry season TSS samples were collected from the lower
water column adjacent to the seafloor at the same time as turbidity measurements were being
undertaken during the depth profiling exercise. The turbidity values represented are the average
of at least 20 turbidity measurements taken during the depth profiling exercise at the same depth

RTA Weipa
Water Quality Trigger Report
Port Initial Capital Dredging
Advisian Water Quality Trigger Report Port Initial Capital Dredging Client Reference: 301310-08460-00-EN-REP-0012
Page 23
301310-08460-00-EN-REP-0012 Water Quality Dry Season Triggers Report_Rev2.docx
as the TSS sample was taken. The results are presented in Table 3-5 and Figure 3-6. There is no
linear relationship between TSS and turbidity (see Figure 3-6, R2=0.0039).
Table 3-5 Total Suspended Solid (TSS) data and average turbidity data at all sites
Site Field trip
code Date sampled Season TSS (mg/L)
Average Turbidity
(NTU)
I1 MT0 02/09/2015 @4:00 dry 3 2.1
I1 Duplicate MT0 02/09/2015 @4:00 dry 3 2.2
I2 MT0 08/09/2015 @8:15 dry 1.5 1.8
I3 MT0 09/09/2015 @13:40 dry 3 2.8
I4 MT0 10/09/2015 @13:40 dry 4 2.7
R1 MT0 02/09/2015 @5:05 dry 2 2.1
R1 Duplicate MT0 02/09/2015 @5:05 dry 1.5 1.9
R2 MT0 10/09/2015 @5:05 dry 3 3
R3 MT0 09/09/2015 @10:00 dry 4 0.3
I1 MT1 17/10/2015 @ 14:45 dry 3 3.4
I1 Duplicate MT1 17/10/2015 @ 14:45 dry 1.5 3.4
I2 MT1 14/10/2015 @ 12:00 dry 3 2.6
I3 MT1 15/10/2015 @ 13:15 dry 4 2.5
I4 MT1 15/10/2015 @ 13:15 dry 2 3.5
R1 MT1 15/10/2015 @ 8:00 dry 2 3.4
R1 Duplicate MT1 18/10/2015 @ 9:15 dry 1.5 3.4
R2 MT1 16/10/2015 @ 8:45 dry 3 3.9
R3 MT1 17/10/2015 @ 13:05 dry 2 1.4
I1 MT2 09/11/2015 @13:45 dry 1.5 1.6
I1 Duplicate MT2 09/11/2015 @13:45 dry 1.5 1.6
I2 MT2 09/11/2015 @ 10:00 dry 1.5 2.8
I3 MT2 10/11/2015 @ 13:45 dry 1.5 2.6
I4 MT2 12/11/2015 @ 7:30 dry 2 3.1
R1 MT2 09/11/2015 @ 08:45 dry 1.5 1.2
R2 MT2 10/11/2015 @ 09:15 dry 1.5 1.2
R3 MT2 11/11/2015 @ 08:30 dry 1.5 5.4

RTA Weipa
Water Quality Trigger Report
Port Initial Capital Dredging
Advisian Water Quality Trigger Report Port Initial Capital Dredging Client Reference: 301310-08460-00-EN-REP-0012
Page 24
301310-08460-00-EN-REP-0012 Water Quality Dry Season Triggers Report_Rev2.docx
Figure 3-6 Total Suspended Solid (TSS) data compared to turbidity data at all sites
3.4.6 Gross Sedimentation
The daily gross sedimentation rates at each site were calculated from replicate sediment trap data
collected during each field trip. Three sediment traps were attached to the logger frame at each
site. Before redeployment of the logger system, the sediment in the traps was collected and
despatched to the laboratory after the field trip for dry weight analysis. For the Sites of Concern
(I1, I2, I3 and I4), nine separate samples (three replicates at each site per three trips) were
collected during the dry season period. For comparison, only three sediment trap samples were
collected from Reference Site 1 (R1) during a MT3 due to issues with sediment trap retrieval
during previous field trips. Gross sedimentation for each sample was calculated by dividing the
total dry sediment weight (mg) in each trap by the number of days the trap was deployed and then
dividing by the area of the trap mouth in cm2. The results of the average gross sedimentation rates
in mg/cm2/day (±Standard Errors) are presented in Table 3-6 and Figure 3-7.
Table 3-6 Average dry season gross sedimentation rates (mg/cm2/day) and average
turbidity at each site during the dry season
Site Average Gross sedimentation rates (mg/cm
2/day)
Standard Error
Average turbidity (NTU)
Site I1 28.5 7.1 5.2
Site I2 16.6 3.3 4.1
Site I3 24.6 4.1 4.3
Site I4 32.5 5.6 4.7
R1 19.0 0.8 6.4

RTA Weipa
Water Quality Trigger Report
Port Initial Capital Dredging
Advisian Water Quality Trigger Report Port Initial Capital Dredging Client Reference: 301310-08460-00-EN-REP-0012
Page 25
301310-08460-00-EN-REP-0012 Water Quality Dry Season Triggers Report_Rev2.docx
Figure 3-7 Average gross sedimentation rates (mg/cm2/day) at each site during the dry
season (± Standard Error)
The highest gross daily sedimentation rates (mg/cm2/day) occurred at Site I4 (32.5±5.6) and I1
(28.5±7.1), the lowest at I2 (16.6±3.3) and R1 (19.0±0.8). At all sites the gross daily average
sedimentation rate was above the GBRWQG (GBRMPA 2010) daily net average sedimentation
maximum of 15mg/cm2/day and daily net average of 3mg/cm2/day. These guidelines are specific
to coral communities growing in the Great Barrier Reef region and are presented for potential
comparison to the Gulf of Carpentaria coral communities.
The sediment trap method of measuring sedimentation rates overestimates the actual
sedimentation (net) the benthic community is experiencing on a daily basis. The trap acts to draw
out and retain suspended solids which would otherwise be re-suspended via currents or wave
action during the different tidal phases. Gross sedimentation measures are a good measure of the
relative sedimentation rates between sites. They also provide baseline sedimentation regimes to
compare against whilst dredging operations are underway.
The average turbidity value for each site is also included in Table 3-6 and Figure 3-7 for
comparison. If the data from R1A/R1B is removed and the average turbidity is plotted against the
average daily sedimentation rate (lower graph Figure 3-7), there is a linear relationship
(R2=0.5346). Turbidity is lowest at the site which experiences the least sedimentation.

RTA Weipa
Water Quality Trigger Report
Port Initial Capital Dredging
Advisian Water Quality Trigger Report Port Initial Capital Dredging Client Reference: 301310-08460-00-EN-REP-0012
Page 26
301310-08460-00-EN-REP-0012 Water Quality Dry Season Triggers Report_Rev2.docx
Figure 3-8 The average turbidity against the average daily sedimentation rate at all sites (top graph) and Sites of Concern only (bottom graph)

RTA Weipa
Water Quality Trigger Report
Port Initial Capital Dredging
Advisian Water Quality Trigger Report Port Initial Capital Dredging Client Reference: 301310-08460-00-EN-REP-0012
Page 27
301310-08460-00-EN-REP-0012 Water Quality Dry Season Triggers Report_Rev2.docx
4 Discussion
The coral communities growing at Pera Head and Boyd Point are well adapted to low light, high
suspended solids regimes. The growth forms they exhibit are designed to maximise benthic light
capture and effectively deal with elevated sedimentation rates.
Fugitive suspended solids from dredging activities can cause a partial or total loss of sunlight
reaching the seafloor. This impact may have consequences for benthic organisms that rely on
sunlight to survive depending upon the duration of these low or no light events. Recent studies
into the temporal patterns in water quality from dredging in tropical environments (Jones et al
2015) found high temporal variability in the levels of suspended solids in the water column close
to dredging (<500m) which ranged from 100mg/L to 500mg/L over several hours. During longer
periods (days to weeks to months) the average concentrations of suspended solids in the water
column decrease markedly toward background baseline levels. The main feature the study found
of the water quality during the dredging operations was the persistent daylight twilight periods
due to persistent small elevations of TSS above background TSS, where sunlight reaching the
seafloor was not fully extinguished, but very low.
For the Amrun Port Initial Capital Dredging, the dry season turbidity levels measured at the Sites
of Concern range between 4 and 6 NTU (80th%ile –internal) and 6 and 9 NTU (95th%ile-external).
It is difficult to compare these values with other trigger levels used for other dredging projects,
which may also have a tidal component or no seasonal component. Compared to the values
outlined in Erftemeijer et al (2012), the proposed trigger levels are extremely conservative. The
wet season triggers will be developed once the wet season dataset is collected. These triggers are
likely to be higher, as reflected in the previous turbidity measurements outlined in the DMP (RTA
2015).
The use of turbidity as a trigger appears to be a good surrogate for the amount of light reaching
the seafloor on a given day (daily PAR) and the average gross daily sedimentation rate. Both
measures appear to have a strong statistically significant relationship with the turbidity in the
water column. There is no relationship between TSS and turbidity as measured so far during the
first three field trips. Developing relationships between these two variables, should a relationship
exist, is likely to require more sampling over a range of water quality extremes such as those that
would be experienced during the wet season.
The Amrun Port Initial Capital Dredging involves the dredging of approximately 240,000m3. The
volume of material to be dredged is one tenth of the volume proposed in the EIS and DMP and on
which predictive hydrodynamic modelling was undertaken. The temporal and spatial distribution
of fugitive sediments and the concentrations of these sediments will be considerably less than
predicted by the modelling impact assessment.
Based on this, only the areas in close proximity (100’s of meters) to the dredging will likely
experience elevated levels of TSS in the water column and twilight periods over the course (up to
three weeks) of the dredging. It is unlikely that impacts will occur to the low light tolerant coral
communities located further afield at Boyd Point and Pera Head, located approximately two
kilometres to the north and three kilometres south of the dredging footprint respectively.
The turbidity triggers outlined in this report for the dry season are highly conservative (an order
of magnitude lower) when compared to those levels considered to be biologically relevant (refer
Table 3-1). Trigger levels defined for the wet season will be developed following completion of
baseline data collection from December 2015 to February 2016. Triggers levels for future dredging

RTA Weipa
Water Quality Trigger Report
Port Initial Capital Dredging
Advisian Water Quality Trigger Report Port Initial Capital Dredging Client Reference: 301310-08460-00-EN-REP-0012
Page 28
301310-08460-00-EN-REP-0012 Water Quality Dry Season Triggers Report_Rev2.docx
operations should be reviewed following completion of monitoring and works for the Amrun Port
Initial Capital Dredging.

RTA Weipa
Water Quality Trigger Report
Port Initial Capital Dredging
Advisian Water Quality Trigger Report Port Initial Capital Dredging Client Reference: 301310-08460-00-EN-REP-0012
Page 29
301310-08460-00-EN-REP-0012 Water Quality Dry Season Triggers Report_Rev2.docx
5 References
AECOM (2011) East Arm Wharf Expansion Project – Dredge Management Plan. Prepared for
Northern Territory Department of Land and Planning, 29 March 2011
ANZECC/ ARMCANZ (2000). Australian and New Zealand Guidelines for Fresh and Marine
Water Quality. Australia and New Zealand Environment and Conservation Council and
Agriculture and Resource Management Council of Australia and New Zealand. Canberra.
BHP(2011). Hunt Point Marine Precinct – Dredge Management Plan. November 2011
BMA (2012). Annual Ecological Monitoring Summary Report – 2011. Hay Point Coal Terminal
Expansion Phase 3. Report prepared by SKM for BM Alliance Coal Operations, 23 February
2012.
BOM (2016). Weipa Aero – 2016 daily calculations. Accessed online 21 January 2016 at:
http://www.bom.gov.au/watl/eto/tables/qld/weipa_aero/weipa_aero.html
Chartrand KM, Ralph PJ, Petrou K, Rasheed MA. (2012) Development of a light-based seagrass
management approach for the Gladstone Western Basin Dredging Program. DEEDI Publication.
Fisheries Queensland, Cairns, 92pp.
Chevron(2011). Gorgon Gas Development and Jansz Feed Gas Pipeline: Dredging and Spoil
Disposal Management and Monitoring Plan, 8 June 2011
Department of Environment and Heritage Protection (DEHP) (2009) Queensland Water Quality
Guidelines, version 3, July 2013
Ports Australia (2014). Dredging and Australian Ports – Subtropical and Tropical Ports, April
2014.
Erftemeijer P.L.A, Riegl B., Hoeksema B.W. and Todd P.A. (2012). Environmental impacts of
dredging and other sediment disturbances on corals: A review. Marine Pollution Bulletin 64:1737-
1765.
GHD (2012). Report for Small Vessel Cyclone Mooring Protection Facility – Dredge Management
Plan. Report prepared for the Port Hedland Port Authority, March 2012.
GBRMPA (2010). Great Barrier Reef Water Quality Guidelines. Great Barrier Reef Marine Park
Authority.
Hanley J.R. (2011). Environmental Monitoring Programs on Recent Capital Dredging Projects in
the Pilbara (2003-2010): a review. APPEA Journal 2011:273-293.
INPEX (2013). Ichthys Project – Dredging and Spoil Disposal Management Plan – East Arm, 16
December 2013.
Jones R., Fisher R., Stark C., and Ridd P. (2015). Temporal Patterns in Seawater Quality from
Dredging in Tropical Environments. PLoS ONE 10(10):e0137112.
Doi:10.1371/journal.pone.0137112
MScience (2009). Dampier Marine Services Facility: Water Quality Impacts of the Pluto Program
in an area of intensive dredging. Report prepared for the Dampier Port Authority, 18 December
2009.

RTA Weipa
Water Quality Trigger Report
Port Initial Capital Dredging
Advisian Water Quality Trigger Report Port Initial Capital Dredging Client Reference: 301310-08460-00-EN-REP-0012
Page 30
301310-08460-00-EN-REP-0012 Water Quality Dry Season Triggers Report_Rev2.docx
Rio Tinto Alcan (2015). South of Embley Project, Dredge Management Plan – Port (Initial Capital
Dredging). 16 November 2015.
SKM (2007). Pluto LNG Development. Addendum to Public Environmental Report/Public
Environmental Review Supplement and Response to Submissions. Revision 2.
SKM (2011). Cape Lambert Port B Development – Dredging and Spoil Disposal Management
Plan. Report prepared by SKM on behalf of RioTinto, 12 December 2011.
Trimarchi S. and Keane J. (2007). Port of Hay Point Apron Areas and Departure Path Capital
Dredging project Environmental Review. EcoPorts Monograph Series No.24. Report prepared by
Ports Corporation of Queensland. 63pp.
WorleyParsons (2012). South West Creek Dredging and Reclamation Project – Water Quality
Monitoring Report6: 21 March – 28 May 2012. Report prepared for the Port Hedland Port
Authority, 29 August 2012

RTA Weipa
Water Quality Trigger Report
Port Initial Capital Dredging
Advisian Water Quality Trigger Report Port Initial Capital Dredging Client Reference: 301310-08460-00-EN-REP-0012
Page 31
301310-08460-00-EN-REP-0012 Water Quality Dry Season Triggers Report_Rev2.docx
Appendix A Cape Lambert Port B turbidity triggers (SKM 2011)
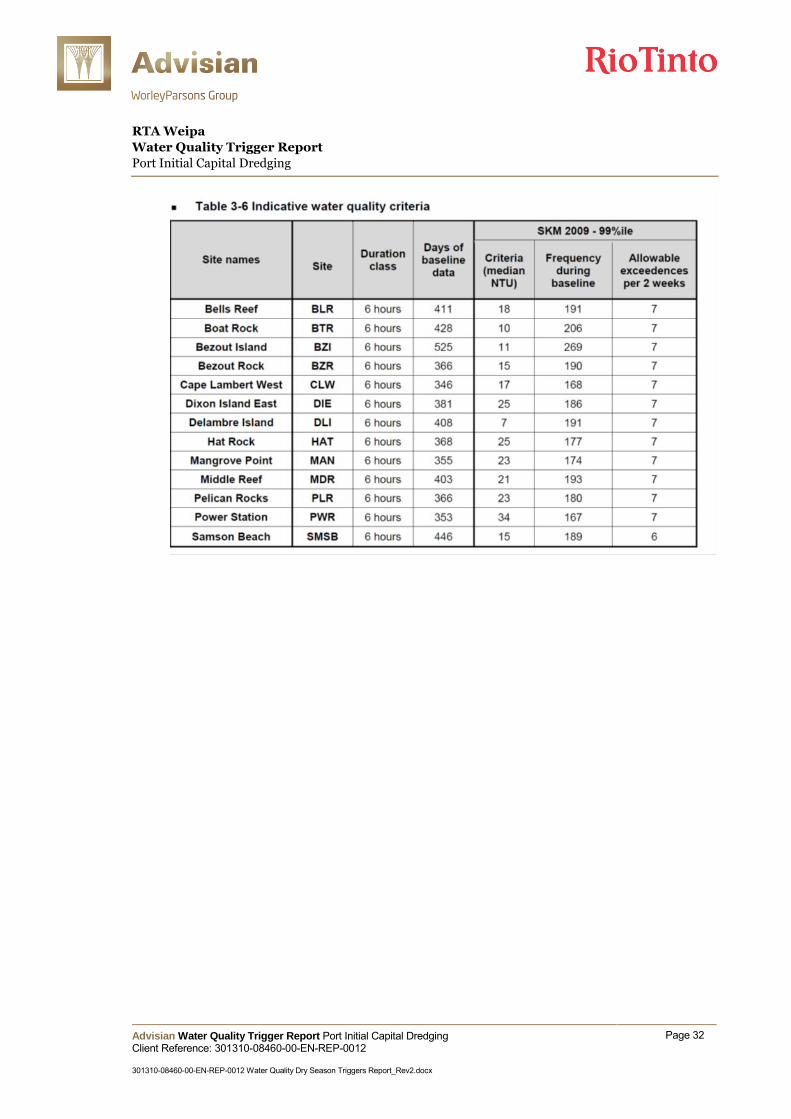
RTA Weipa
Water Quality Trigger Report
Port Initial Capital Dredging
Advisian Water Quality Trigger Report Port Initial Capital Dredging Client Reference: 301310-08460-00-EN-REP-0012
Page 32
301310-08460-00-EN-REP-0012 Water Quality Dry Season Triggers Report_Rev2.docx
RTA Weipa
Water Quality Trigger Report
Port Initial Capital Dredging
Advisian Water Quality Trigger Report Port Initial Capital Dredging Client Reference: 301310-08460-00-EN-REP-0012
Page 33
301310-08460-00-EN-REP-0012 Water Quality Dry Season Triggers Report_Rev2.docx
Appendix B Ichthys Project turbidity triggers from DSDMP (INPEX 2013)

RTA Weipa
Water Quality Trigger Report
Port Initial Capital Dredging
Advisian Water Quality Trigger Report Port Initial Capital Dredging Client Reference: 301310-08460-00-EN-REP-0012
Page 34
301310-08460-00-EN-REP-0012 Water Quality Dry Season Triggers Report_Rev2.docx

RTA Weipa
Water Quality Trigger Report
Port Initial Capital Dredging
Advisian Water Quality Trigger Report Port Initial Capital Dredging Client Reference: 301310-08460-00-EN-REP-0012
Page 35
301310-08460-00-EN-REP-0012 Water Quality Dry Season Triggers Report_Rev2.docx
Appendix C East Arm Dredging Draft DSDMP turbidity triggers (AECOM 2011)

RTA Weipa
Water Quality Trigger Report
Port Initial Capital Dredging
Advisian Water Quality Trigger Report Port Initial Capital Dredging Client Reference: 301310-08460-00-EN-REP-0012
Page 36
301310-08460-00-EN-REP-0012 Water Quality Dry Season Triggers Report_Rev2.docx

Port Dredging Water Quality Report
Page 20
APPENDIX C: BASELINE WET SEASON REPORT

www.advisian.com
RTA Weipa
Water Quality Trigger Report Port Initial Capital Dredging
1 August 2016
Advisian is a global advisory firm that provides project and business
solutions to clients who develop, operate and maintain physical assets in
the infrastructure and resources sectors.
301310-08460-00-EN-REP-0017
Advisian Pty Ltd
Level 3,60 Albert St
Brisbane QLD 4000
Australia
PO Box 15081
City East Brisbane Qld 4002
P +61 7 3221 7444
F +61 7 3221 7791
ABN: 50098008818
© Copyright 2016

Advisian Water Quality Trigger Report Port Initial Capital Dredging
Page i
301310-08460-00-EN-REP-0017 Water Quality Wet Season Triggers Report_Rev2.docx
Disclaimer
This report has been prepared on behalf of and for the exclusive use of RTA Weipa, and is subject to
and issued in accordance with the agreement between RTA Weipa and Advisian.
Advisian accepts no liability or responsibility whatsoever for it in respect of any use of or reliance upon
this report by any third party.
Copying this report without the permission of RTA Weipa and Advisian is not permitted.
PROJECT NO 301310-08460– WATER QUALITY TRIGGER REPORT:
PORT INITIAL CAPITAL DREDGING
Rev Description Author Review
Advisian
Approval Date
2 For Use
S Neale
J Kennedy
J Kennedy
01/08/16

Advisian Water Quality Trigger Report Port Initial Capital Dredging
Page ii
301310-08460-00-EN-REP-0017 Water Quality Wet Season Triggers Report_Rev2.docx
Table of Contents
List of Appendices ii
1 Introduction 1
1.1 Background 1
1.2 Objectives 1
1.2.1 Dredge Management Plan Water Quality Triggers 4
2 Methods 5
3 Results 6
3.1 Existing Coral Community 6
3.2 Susceptibility of the Coral Community to Total Suspended Solids, Turbidity and Sedimentation 8
3.3 Previous Dredging Programs 10
3.4 Wet Season Data Results 15
3.4.1 Turbidity 15
3.4.2 PAR 16
3.4.3 Turbidity and PAR 17
3.4.4 Depth Profiling 19
3.4.5 TSS and Turbidity 21
3.4.6 Gross Sedimentation 23
4 Discussion 26
5 References 27
List of Appendices
Appendix A
Cape Lambert Port B turbidity triggers (SKM 2011) 29
Ichthys Project turbidity triggers from DSDMP (INPEX 2013) 31
East Arm Dredging Draft DSDMP turbidity triggers (AECOM 2011) 33

Advisian Water Quality Trigger Report Port Initial Capital Dredging
Page iii
301310-08460-00-EN-REP-0017 Water Quality Wet Season Triggers Report_Rev2.docx
List of Figures
Figure 3-1 Water Quality Monitoring Sites and Coral Locations (RTA, 2015) 7
Figure 3-2 Box Plot of Median Total Daily wet season PAR at each site after cloudy day data is removed.
Sites (x-axis) arranged from shallowest to deepest 17
Figure 3-3 Daily median turbidity compared to median total daily PAR at each site; the exponential line
of best fit equation and R2 value are provided in each graph in the top right corner. 18
Figure 3-4 Turbidity depth profile at each site during maintenance trip 3 (MT3) – December 2016 20
Figure 3-5 Turbidity depth profile at each site during maintenance trip 4 (MT4) – January 2016 21
Figure 3-6 Total Suspended Solid (TSS) data compared to turbidity data at all sites for the wet season 23
Figure 3-7 Average gross sedimentation rates (mg/cm2/day) at each site during the wet season (±
Standard Error) 24
Figure 3-8 The average turbidity against the average gross daily sedimentation rate at all sites for the wet
season data only 25
List of Tables
Table 1-1 Extract of EA section relevant to establishing water quality trigger levels. 2
Table 1-2 Initial Port Capital Dredge Monitoring: Water Quality Trigger Levels (reproduced from Table
J1 of the EA) 3
Table 1-3 Draft initial Boyd Port Capital Dredging Monitoring: Water Quality Trigger Levels extract from
DMP 2015. 4
Table 3-1 Coral communities and their sensitivity categories for elevated TSS and sedimentation 9
Table 3-2 A summary of the trigger levels used and results of the Capital Dredging Programs in tropical
waters in the last 10 years 11
Table 3-3 Wet season turbidity triggers (NTU) for each site. Dry season values provided in brackets for
comparison 15
Table 3-4 Wet Season Median Total Daily PAR at each site when all data is considered. 16
Table 3-5 Total Suspended Solid (TSS) data and average turbidity data at all sites 22
Table 3-6 Average wet season gross sedimentation rates (mg/cm2/day) and average turbidity at each site
during the wet season 24

RTA Weipa
Water Quality Trigger Report
Port Initial Capital Dredging
Advisian Water Quality Trigger Report Port Initial Capital Dredging
Page 1
301310-08460-00-EN-REP-0017 Water Quality Wet Season Triggers Report_Rev2.docx
1 Introduction
1.1 Background
The Amrun (formerly South of Embley) Project requires the construction and operation of a new
Port facility located between Boyd Point and Pera Head. The marine works will include
construction of a jetty, wharf and ship loaders, requiring dredging for berth pockets and an
approach/departure channel.
The Amrun (Boyd) Port Initial Capital Dredging involves the excavation of approximately
240,000 m3 of seabed material using a large Cutter Suction Dredge (CSD) and transport and
disposal to the approved dredge material relocation ground by hopper barge. The expected time
frame for the completion of the dredging and relocation works is three (3) weeks commencing end
of March 2016, with dates subject to completion of Embley River dredging.
1.2 Objectives
The objective of this report is to present wet season water quality trigger levels based on the most
recent data collected during the Amrun Project - Baseline Receiving Environment Monitoring for
Amrun Port Initial Capital Dredging. In this report, trigger levels are developed for the wet season
based on baseline data collection across December 2015 to February 2016.
The trigger levels are designed to address the requirements of the Environmental Authority (EA)
conditions (EMPL00725113) as outlined in condition J13b (extracted in Table 1-1 below). An
extract from the EA conditions - Table J1- Initial Boyd Port Capital Dredge Monitoring: Water
Quality Trigger Levels is provided in Table 1-2. Specific trigger levels will be developed at Sites of
Concern1 only, as per the requirements outlined in Table 1-2.
The methods of developing the trigger levels and the management responses have been outlined
in the South of Embley Project Dredge Management Plan – Port (Initial Capital Dredging) (DMP)
which was approved by Commonwealth in November 2015 and Queensland regulators in January
2016 (RTA, 2015). Section 1.2.1 summarises the process described in the DMP for the
development and application of the trigger levels.
The development of the wet season turbidity trigger levels and general data analysis follow those
used in the Water Quality Dry Season Trigger Report (301310-08460-00-EN-REP-0012)
produced by Advisian and approved for use by RTA Weipa.
1 Also referred to as Sites of Influence.

RTA Weipa
Water Quality Trigger Report
Port Initial Capital Dredging
Advisian Water Quality Trigger Report Port Initial Capital Dredging
Page 2
301310-08460-00-EN-REP-0017 Water Quality Wet Season Triggers Report_Rev2.docx
Table 1-1 Extract of EA section relevant to establishing water quality trigger levels.
J13 (b) establish turbidity-based trigger values as shown in Table J1- Initial Boyd Port Capital Dredge Monitoring: Water Quality Trigger Levels, that:
(i) Considers, and is informed by, the findings of all relevant publish studies, including available water quality guidelines, trigger values from other comparable dredging programs with similar environmental conditions, and site specific baseline data;
See Section 3.2, Section 3.3 and Section 3.4.1
(ii) Considers the most sensitive receptor type and the most relevant water quality parameters (e.g. turbidity, PAR, sedimentation rate) and the reported impacts of turbidity on coral health from the literature and other dredging programs in areas of nearshore coral reefs;
See Section 3.1, Section 3.2 and Section 3.3
(iii) Includes season-specific turbidity trigger values;
See Section 3.4.1
(iv) Considers sediment plume intensity, duration and frequency of occurrence in establishing trigger values;
See Section and 1.2.1 and 3.4.1
(v) Considers the additive effect of multiple stressors; and
See Section 3.2
(vi) Considers the effect of depth and water column variation predicted from the 3D modelling
See Section 3.4.4
Advisian provided to RTA Weipa a method to ensure compliance with the requirements of EA
Condition J13(b) (Water Quality Triggers - 301310-08460-00EN-MEM-002-Revision 0,
December 16 2015). Each of the conditions listed in Condition J13(b) are addressed individually
in this report in the relevant sections as described in Table 1-1.

RTA Weipa
Water Quality Trigger Report
Port Initial Capital Dredging
Advisian Water Quality Trigger Report Port Initial Capital Dredging
Page 3
301310-08460-00-EN-REP-0017 Water Quality Wet Season Triggers Report_Rev2.docx
Table 1-2 Initial Port Capital Dredge Monitoring: Water Quality Trigger Levels (reproduced from Table J1 of the EA)
Monitoring Locations
Coordinates (GDA 94)
Quality Characteristic
Unit Wet Season Trigger level
Dry Season Trigger Level
Frequency
Reference
Sites (R1,
R2 and
R3)
TBA Turbidity (as
a surrogate
WQ
parameter for
PAR and SR)
NTU N/A N/A Continuous
Telemetered,
Logged at 15
minute
intervals
PAR mol/m2/day N/A N/A Continuous
Telemetered,
Logged at 15
minute
intervals
SR mg/cm2/day N/A N/A Sediment
traps (approx.
monthly)
Concern
sites (I1,
I2,I3 and
I4)
TBA
Turbidity (as
a surrogate
WQ
parameter for
PAR and SR)
NTU TBD TBD Continuous
Telemetered,
Logged at 15
minute
intervals
PAR mol/m2/day N/A N/A Continuous
Telemetered,
Logged at 15
minute
intervals
SR mg/cm2/day N/A N/A Sediment
traps (approx.
monthly)
PAR – Photsynthetically Active Radiation; SR – Sedimenation Rate; TBA – To be advised based on results of monitoring;
TBD – To be determined in approved Dredge Management Plans: statistically derived turbidity trigger based on site specific
baseline data and trigger values from other dredging programs with similar environmental conditions together with literature
on potential impacts of turbidity on coral health;
Note: Trigger values may vary at different monitoring locations and the number of monitoring locations will be determined through the DMP

RTA Weipa
Water Quality Trigger Report
Port Initial Capital Dredging
Advisian Water Quality Trigger Report Port Initial Capital Dredging
Page 4
301310-08460-00-EN-REP-0017 Water Quality Wet Season Triggers Report_Rev2.docx
1.2.1 Dredge Management Plan Water Quality Triggers
The South of Embley project Dredge Management Plan – Port (Initial Capital Dredging) (RTA,
2015) outlines stages in the development and application of trigger levels. These include:
Draft Initial Trigger Levels – Preliminary trigger values developed using historical data
(prior to 2012) for consideration by the Determining Authority when approving the DMP (P36
Table 5 of DMP). These are presented in Table 1-3.
Site Specific Trigger Levels – defined process in the DMP for developing site specific
trigger levels for wet and dry seasons using baseline data collection (P36 of the DMP)
Trigger Level application during dredging – initiation of defined water quality
management processes if trigger levels are exceeded during dredging (P37-40 of DMP).
The DMP clearly identifies the required approach for developing the Site Specific Trigger Values
for wet and dry season for subsequent application during the dredging period.
Site specific turbidity trigger levels for the Sites of Concern are calculated for wet and dry
seasons respectively from the data currently being collected during baseline monitoring. These
trigger values are used to establish internal alert levels and external trigger levels as
reporting requirements for the program.
The alert levels will be based on the 80th (internal alert) and the 95th (external trigger level)
percentiles with levels determined for both the wet and dry season as follows:
Internal Alert Levels would be triggered if the site specific internal alert turbidity
concentration for a Site of Concern is exceeded by the five day rolling average of the daily
median turbidity on three consecutive days. Exceedance would trigger investigations to
determine the cause of the high turbidity measured.
External Trigger Levels would be triggered if the site specific external trigger turbidity
concentration for a Site of Concern is exceeded by the five day rolling average of the daily
median turbidity on three consecutive days. Triggering would result in application of the
Water Quality Management Process as depicted in Figure 12 of the DMP (RTA, 2015).
Table 1-3 Draft initial Boyd Port Capital Dredging Monitoring: Water Quality Trigger Levels extract from DMP 2015.
Monitoring location
Quality Characteristic
Unit Initial Alert Level Trigger level Frequency
Wet season
Dry season
Wet season
Dry season
Concern
Sites (I1, I2,
I3 and I4)
Turbidity (NTUe) 7.7 6.1 23.8 14.3
Continuous
Telemetered,
logged at 15
minute
intervals

RTA Weipa
Water Quality Trigger Report
Port Initial Capital Dredging
Advisian Water Quality Trigger Report Port Initial Capital Dredging
Page 5
301310-08460-00-EN-REP-0017 Water Quality Wet Season Triggers Report_Rev2.docx
2 Methods
The process used to develop the turbidity triggers from the baseline data is:
1) Examine the coral community information from the Sites of Concern and rank the coral
community in terms of susceptibility to elevated suspended solids and sedimentation rates
(see Section3.1 and Section 3.2).
2) Using the baseline Quality Control (QC) turbidity data, calculate the median, 80th, 90th and
95th percentile turbidity values2 for the Reference Sites and Sites of Concern, for each season
(dry – September to end of November, wet - December to end of February). (see Section 3.4)
3) From the perspective of biological relevance to the receiving environment, identify
appropriate turbidity percentile metric depending upon the response category (sub-lethal
and lethal effect) as outlined in Table 6 of Erftemeijer et al (2012) and the sensitivity of the
dominant coral community growth forms outlined in Figure 5 of the same study. (see Section
3.2,)
4) Compare the seasonal site specific turbidity trigger to trigger levels developed for previous
dredging programs in similar environments and the Australian and New Zealand Guidelines
for Fresh and Marine Water Quality, Australia and New Zealand Environment and
Conservation Council and Agriculture and Resource Management Council of Australia and
New Zealand (ANZECC/ARMCANZ, 2000) for context, and also examine the outcomes in
terms of coral community impacts of previous dredging campaigns where information is
available (see Section 3.3).
5) Develop a relationship between photosynthetically active radiation (PAR) and turbidity by
plotting the baseline QC data for both parameters against each other (see Section3.4.3)
6) Develop a relationship between gross sedimentation and turbidity based on data collected at
each site for gross daily sedimentation and median daily turbidity (see discussion in 3.4.6).
7) Examine the literature and results of the dredging programs to determine an appropriate
duration of low light which will preclude any sub-lethal or lethal impacts to the coral
communities at the Sites of Concern (see Section 3.2).
2 Statistical criteria for establishing the alert trigger levels are already defined in the DMP (RTA, 2015), being the 80th
and 95th percentiles of the baseline for internal alert and external alert respectively

RTA Weipa
Water Quality Trigger Report
Port Initial Capital Dredging
Advisian Water Quality Trigger Report Port Initial Capital Dredging
Page 6
301310-08460-00-EN-REP-0017 Water Quality Wet Season Triggers Report_Rev2.docx
3 Results
3.1 Existing Coral Community
The closest coral communities to the proposed port facilities are located on fringing reefs situated
~1.7 km to the north at Boyd Point and ~2.8 km to the south at Pera Head, as depicted in the
DMP (RTA, 2015) (refer Figure 3-1). Drop video surveys completed as part of EIS and
Supplementary EIS studies at Boyd Point and Pera Head found large areas of coarse and silty
sand punctuated by occasional outcrops of hard substrate up to 2m high. These outcrops were
sparsely covered in algae, soft corals, sponges and hard corals. The percentage cover of hard coral
was approximately 1-3% at both locations.
The sparse hard coral communities were dominated by small (<20cm diameter) to medium (20-
40cm diameter) sized colonies of corals from the families Dendrophylliidae, Faviidae and
Poritidae. There were occasional larger (>2m) Porites spp bommies. The hard coral genera and
species present at these locations are typical of corals that grow in marine environments that
experience extremes in turbidity and/or temperature. The growth form or shape of the more
common genera found, such as Turbinaria spp (cup shaped or foliose) and Porites spp (domed
shaped or massive) appeared flattened indicating a change in the ‘typical’ growth form to adapt to
consistent low light conditions.
In February 2016, more targeted towed video surveys of the coral communities in close proximity
to the water quality monitoring logger sites (I1, I2, I3, I4, R1 and R2) along four 30m transects
were undertaken (301310-08460-EN-REP-0002 – Baseline Coral Health Monitoring Report Rev
0, April 2016)). The analysis of the video footage found the hard coral percentage cover (±
Standard Error) was highest at Site R2 (23.6±4.5%) and lowest at site I1 (4.4±1.0%). As previous
surveys found, the seafloor at all sites was dominated by sand, turf algae or macroalgae or
combinations of these three groups with occasional hard and soft coral colonies. As per the
previous study (Supplementary EIS) , the dominant corals families were Dendrophylliidae,
Faviidae and Poritidae and the dominant hard coral growth forms were foliose, massive and
encrusting.

RTA Weipa
Water Quality Trigger Report
Port Initial Capital Dredging
Advisian Water Quality Trigger Report Port Initial Capital Dredging
Page 7
301310-08460-00-EN-REP-0017 Water Quality Wet Season Triggers Report_Rev2.docx
Figure 3-1 Water Quality Monitoring Sites and Coral Locations (RTA, 2015)

RTA Weipa
Water Quality Trigger Report
Port Initial Capital Dredging
Advisian Water Quality Trigger Report Port Initial Capital Dredging
Page 8
301310-08460-00-EN-REP-0017 Water Quality Wet Season Triggers Report_Rev2.docx
3.2 Susceptibility of the Coral Community to Total Suspended Solids, Turbidity and Sedimentation
The genera and growth forms of the coral community at each site (as described above) provide
information on the susceptibility of that community to elevated turbidity and elevated
sedimentation. The relationship between the coral growth form (and genera) and the
susceptibility to elevated sedimentation and suspended solids is described in a study by
Erftemeijer et al (2012), refer to Table 6 and Figure 5 (Suspended Solids/Turbidity) and Table 10
and Figure 6 (Sedimentation) in that publication3.
The relative sensitivities of each coral genus and growth form compared to levels of suspended
sediment in the water column and rates of sedimentation as described are outlined in Table 3-1.
The TSS values provided are converted turbidity (NTU) based on the laboratory experiments
undertaken by James Cook University. The converted turbidity values are provided in parenthesis
after the TSS value. The relationship between TSS and turbidity was calculated as 1mg/L (TSS)
equals 0.67 NTU (see Section 4.2 of the DMP).
The growth forms of the three most dominant coral families found near Boyd Point and Pera
Head are those growth forms which have a high (foliose or laminar) or intermediate (massive or
dome shaped) tolerance to suspended solids. This suggests that extended periods of TSS values of
40mg/L (27 NTU) may have sub-lethal impacts on corals of these growth forms, partial mortality
impacts to coral colonies may not occur until these colonies are exposed to prolonged periods
(several weeks) of TSS in the water column of 100mg/L (67 NTU) or more (refer Table 3-1).
In terms of net sedimentation rates the growth forms of the three most dominant coral families
found near Boyd Point and Pera Head are those growth forms which have a sensitive (foliose or
laminar) or intermediate (massive/dome shaped) tolerance to elevated sedimentation rates. This
suggests that extended periods of sedimentation values of 10mg/cm2/day may have sub-lethal
impacts on corals of these growth forms, lethal impacts may not occur until these colonies are
exposed to extended periods of sedimentation (up to two weeks) of greater than 50mg/cm2/day
(refer to Table 3-1).
3 http://www.sciencedirect.com/science/article/pii/S0025326X12001981

RTA Weipa
Water Quality Trigger Report
Port Initial Capital Dredging
Advisian Water Quality Trigger Report Port Initial Capital Dredging
Page 9
301310-08460-00-EN-REP-0017 Water Quality Wet Season Triggers Report_Rev2.docx
Table 3-1 Coral communities and their sensitivity categories for elevated TSS and sedimentation
Location
Overall Hard
Coral cover
(%)
Dominant coral
family Growth Form
Total Suspended Solids (mg/L) converted NTU values
in brackets1
Max Sedimentation Rates 2
TSS Growth
form Sensitivity
Category
Minor Sub-
lethal effect
after 5-6
weeks
Lethal effects
(Partial Mortality)
after 2-4 weeks
Sedimentation rate growth
form Sensitivity category
(Figure 6)
Sub-lethal effects
(minor) (mg/cm2/day)
after 3 weeks
Lethal effects (partial
mortality) (mg/cm2/day)
after 2-3 weeks
Boyd Point
and Pera
Head
1-3%
Dendrophylliidae Laminar and Foliose Tolerant
(category 2) 40 (27 NTU) 100 (67 NTU) Sensitive (category >3.5) 10 50
Faviidae Massive Intermediate
(category 3) 40 (27 NTU) 100 (67 NTU) Intermediate (category 3) 10 50
Poritidae Massive Intermediate
(category 3) 40 (27 NTU) 100 (67 NTU) Intermediate (category 3) 10 50
1 Values in these columns are taken from Figure 5 and Table 6 of Erftemeijer et al 2012 (pp 1752)
2 Values in these columns are taken from Figure 6 and Table 10 of Erftemeijer et al 2012 (pp 1758).

RTA Weipa
Water Quality Trigger Report
Port Initial Capital Dredging
Advisian Water Quality Trigger Report Port Initial Capital Dredging
Page 10
301310-08460-00-EN-REP-0017 Water Quality Wet Season Triggers Report_Rev2.docx
3.3 Previous Dredging Programs
A review of the turbidity trigger levels utilised for a number of dredging projects in similar
environments is presented in Table 3-2. Only the most recent (last 10 years) capital dredging
projects located in tropical Australian coastal environments in close proximity to coral
communities were chosen for comparison.
The table describes the turbidity trigger levels used for each project and brief summary of the
overall impacts on the coral communities due to the dredging programs is provided. This affords
context to the turbidity trigger levels proposed for the Amrun Port capital dredging. Much of the
information in this table with the exception of the trigger levels is an extract from Ports
Australia(2014) - Appendix A – Capital and Maintenance dredging projects and monitoring
program information for subtropical and Tropical Australian Ports. The trigger levels are gathered
from individual reports (referenced in the ‘Description’ column) or appendices related to the
environmental approval documents published for each of the projects.
Note there are no specific water quality guidelines for open coastal regions of Eastern Cape York
or the Gulf of Carpentaria. In the event there is no baseline data for a specific area, the relevant
guidelines for the region default to the broader ANZECC/ARMCANZ guidelines
(ANZECC/ARMCANZ, 2000) or the Queensland Water Quality Guidelines (QWQG) for the wet
tropics (DEHP, 2009).
The ANZECC/ARMCANZ (2000) guidelines state that in wet-dry tropical areas such as Weipa
which are influenced by strong seasonal events, separate trigger levels for the wet and dry seasons
are required.

RTA Weipa
Water Quality Trigger Report
Port Initial Capital Dredging
Advisian Water Quality Trigger Report Port Initial Capital Dredging
Page 11
301310-08460-00-EN-REP-0017 Water Quality Wet Season Triggers Report_Rev2.docx
Table 3-2 A summary of the trigger levels used and results of the Capital Dredging Programs in tropical waters in the last 10 years
Location Description Year Duration
(months)
Volume (m3) Distance to
nearest coral
community
Trigger Level Durations Outcome
Hay Point,
Queensland
Apron and
Departure Path
Capital
Dredging
(Trimarchi and
Keane 2007).
2006 6 8.6 million Victor Islet <4km,
Round Top ~4 km
>100mg/L for at least 6
continuous hours
Continuous 6 hours An assessment of all TSS data recorded pre-dredging, during dredging
and post-dredging identified a total of 31water quality trigger exceedences
at Victor Islet and none at Round Top Island. Only six exceedence events
were recorded during the dredging period at Victor Islet.
Coral condition monitoring undertaken showed evidence that sediment
deposition associated with the migration of the dredge plume occurred at
both Round Top Island and Victor Islet. This deposition resulted in
damage to some corals between three and six months after the start of
dredging, with a maximum of about 4% (Round Top Island) and 6.5%
(Victor Islet) of corals showing some patches of mortality. Approved coral
mortality at impact location was set at 20% loss.
Hay Point,
Queensland
Hay Point Coal
Terminal
expansion
(BMA 2012)
2010-2011 Dredging and
blasting over 2
stages (approx.
4 months per
stage) over a 14
month period.
258,000 Hay reef <1km,
Round Top Island
~4 km
6-hour rolling median of 110
NTU during daylight hours.
Rolling median 6
hours
Several water quality trigger exceedances (primarily during non-dredging
periods). No detectable impact of dredging as pattern of change was the
same at reference and impact sites. Major declines in coral and increases
in macroalgae at both impact and reference sites. Plumes did not reach
coral receptors. Major influences from a cyclone prior to baseline survey
complicated impact assessment.
Port Hedland,
Western
Australia
Rapid Growth
Project 5 (BHP
2011)
2008-
2010
18 3.9 million <1km 80th%ile seasonal and tidal
state turbidity triggers at
Finucane Island Coral (FIC)
monitoring site. Dry season
(neaps 5.3 NTU, spring 12.4
NTU) Wet Season (neaps
13.5 NTU and springs 15.9
NTU)
Single value No formal exceedances1 of turbidity trigger breaches at any site. Turbidity
ranged between 5 and approximately 30 NTU across sites. No impact to
coral communities at FIC impact site.
Port Hedland,
Western
Australia
South west
Creek Tug Boat
cyclone
mooring facility
(GHD 2012)
2011 4 2.5 million <1km Seasonal triggers. Tier 1
trigger level – Rolling 14 day
median at impact sites over a
full spring and neap tidal
cycle>80th%ile baseline
turbidity and significant
difference from reference
sites
Rolling 14 day
median
One exceedance of 80th percentile trigger threshold. No higher level
exceedances. Sediment levels at greater depth on corals at one impact site
than other sites (predicted in EIA). The increase had no measurable
impact on benthic cover at this site.
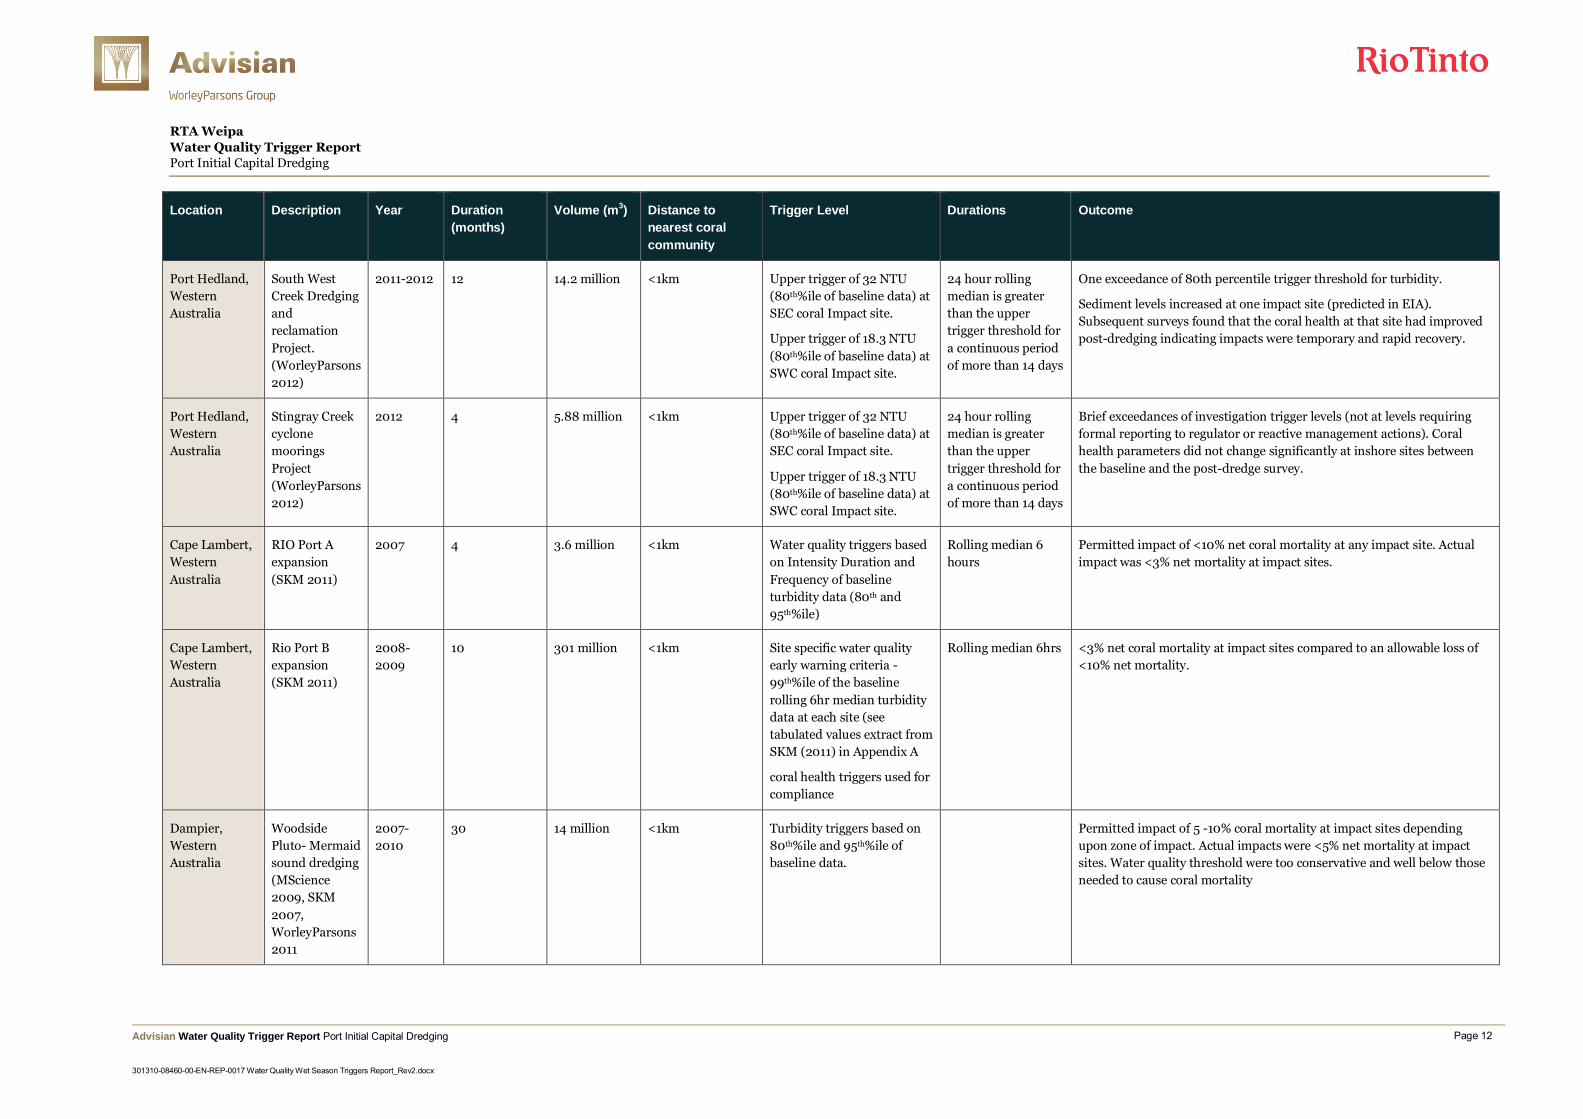
RTA Weipa
Water Quality Trigger Report
Port Initial Capital Dredging
Advisian Water Quality Trigger Report Port Initial Capital Dredging
Page 12
301310-08460-00-EN-REP-0017 Water Quality Wet Season Triggers Report_Rev2.docx
Location Description Year Duration
(months)
Volume (m3) Distance to
nearest coral
community
Trigger Level Durations Outcome
Port Hedland,
Western
Australia
South West
Creek Dredging
and
reclamation
Project.
(WorleyParsons
2012)
2011-2012 12 14.2 million <1km Upper trigger of 32 NTU
(80th%ile of baseline data) at
SEC coral Impact site.
Upper trigger of 18.3 NTU
(80th%ile of baseline data) at
SWC coral Impact site.
24 hour rolling
median is greater
than the upper
trigger threshold for
a continuous period
of more than 14 days
One exceedance of 80th percentile trigger threshold for turbidity.
Sediment levels increased at one impact site (predicted in EIA).
Subsequent surveys found that the coral health at that site had improved post-dredging indicating impacts were temporary and rapid recovery.
Port Hedland,
Western
Australia
Stingray Creek
cyclone
moorings
Project
(WorleyParsons
2012)
2012 4 5.88 million <1km Upper trigger of 32 NTU
(80th%ile of baseline data) at
SEC coral Impact site.
Upper trigger of 18.3 NTU
(80th%ile of baseline data) at
SWC coral Impact site.
24 hour rolling
median is greater
than the upper
trigger threshold for
a continuous period
of more than 14 days
Brief exceedances of investigation trigger levels (not at levels requiring
formal reporting to regulator or reactive management actions). Coral
health parameters did not change significantly at inshore sites between
the baseline and the post-dredge survey.
Cape Lambert,
Western
Australia
RIO Port A
expansion
(SKM 2011)
2007 4 3.6 million <1km Water quality triggers based
on Intensity Duration and
Frequency of baseline
turbidity data (80th and
95th%ile)
Rolling median 6
hours
Permitted impact of <10% net coral mortality at any impact site. Actual
impact was <3% net mortality at impact sites.
Cape Lambert,
Western
Australia
Rio Port B
expansion
(SKM 2011)
2008-
2009
10 301 million <1km Site specific water quality
early warning criteria -
99th%ile of the baseline
rolling 6hr median turbidity
data at each site (see
tabulated values extract from
SKM (2011) in Appendix A
coral health triggers used for
compliance
Rolling median 6hrs <3% net coral mortality at impact sites compared to an allowable loss of
<10% net mortality.
Dampier,
Western
Australia
Woodside
Pluto- Mermaid
sound dredging
(MScience
2009, SKM
2007,
WorleyParsons
2011
2007-
2010
30 14 million <1km Turbidity triggers based on
80th%ile and 95th%ile of
baseline data.
Permitted impact of 5 -10% coral mortality at impact sites depending
upon zone of impact. Actual impacts were <5% net mortality at impact
sites. Water quality threshold were too conservative and well below those
needed to cause coral mortality

RTA Weipa
Water Quality Trigger Report
Port Initial Capital Dredging
Advisian Water Quality Trigger Report Port Initial Capital Dredging
Page 13
301310-08460-00-EN-REP-0017 Water Quality Wet Season Triggers Report_Rev2.docx
Location Description Year Duration
(months)
Volume (m3) Distance to
nearest coral
community
Trigger Level Durations Outcome
Barrow Island,
Western
Australia
Gorgon Gas
Development
(Chevron 2011)
2010-2011 18 7.6 million <200m Adaptive Management
triggers based on ongoing
coral mortality measures.
Initial water quality criterion
used to trigger a response,
but primarily coral health
triggers used.
Net area of coral loss was 3.26 ha, less than the allowed limit of 8.47 ha.
Coral assemblages were variable and some changes (e.g. % coral cover in
Zones of High and Moderate Impact) were likely to be dredging related.
Port of Darwin East Arm
Ichthys Project
(INPEX 2013)
2014 14 16.1 million <2km See extract of DSMP detail
on turbidity triggers in
Appendix B. Wet and dry
season triggers. Level 1
trigger occurs when the daily
average turbidity was:
Greater than the 99th%ile
(intensity)
Greater than the 95th%ile
for more than X
consecutive days
(Duration)
Greater than the 95th%ile
for more than X number
of days within a 7 day
period (frequency)
Variable up to 7 days Based on the first 8 months of dredging: No turbidity exceedances
(intensity, duration or frequency). No impacts attributable to dredging.
Five bimonthly surveys during dredging have been completed. Substantial
coral thermal bleaching recorded from survey 3.
Port of Darwin East Arm
Wharf
Expansion
(AECOM 2011)
2012-2013 4 685,000 <2km Low trigger level of median
daily turbidity >80th%ile,
high trigger of >95th%ile. See
Appendix C for extract from
the DSDMP.
Low trigger levels
for 3 consecutive
days
Several exceedances of water quality triggers during periods of spring
tides (not thought to be dredging related). Plume limited to 50m of
dredge footprint. Authors report no adverse effects from dredging. No
changes in filter feeder indicators. Decreases (<10%) in coral cover at 2 of
3 designated impact sites.
Changes in coral health were ascribed to both natural and dredge factors.

RTA Weipa
Water Quality Trigger Report
Port Initial Capital Dredging
Advisian Water Quality Trigger Report Port Initial Capital Dredging
Page 14
301310-08460-00-EN-REP-0017 Water Quality Wet Season Triggers Report_Rev2.docx
The most common triggers utilised were the 80th, 95th and 99th percentile metrics for turbidity.
This is consistent with advice provided in the ANZECC guidelines and the methods for calculating
internal alert level and external alert level for turbidity as detailed in the Amrun (South of
Embley) Project DMP (RTA, 2015). Durations range from daily to weekly, in some instances neap
and spring tidal triggers are provided due to the macrotidal nature of some locations. In most
cases seasonal triggers are applicable.
Examples of turbidity trigger levels used in other projects which may be applicable when
comparing to those developed for the Amrun project are from the Cape Lambert Port B projects,
the Ichthys Project, Darwin East Arm Wharf project and the Hay Point Apron and Departure Path
Capital Dredging project. It is worth noting that all of these projects are substantially larger in
scale and of longer durations (>4 months) when compared to the Amrun Port Initial Capital
Dredging (240,000m3, approximately 3 weeks).
The 99th%ile trigger levels developed from baseline data proposed for the monitoring sites at Cape
Lambert ranged between 7 NTU (Delambre Island) and 34 NTU (Power Station) (Appendix A).
The Power station site (PWR) was located in the impact area and closest to the dredging
operations and consisted of a sparse turbidity tolerant coral community. Durations and
frequencies above this trigger value were set at 7 instances of >34 NTU allowed in a two week
period. Coral monitoring of 60 tagged colonies at the PWR site was undertaken every two weeks.
Despite several elevations above the turbidity trigger levels, no statistically significantly impacts
on the coral community due to dredging activities were measured at the PWR site during the 10
month monitoring period.
The Level 1 trigger levels used on the Ichthys Project in Darwin for turbidity tolerant coral
communities in the area of impact at Channel Island was set at <15 NTU in the dry season.
Additional management actions were taken if the rolling daily average turbidity was >15 NTU for
5 consecutive days. Based on the first 8 months of dredging, no turbidity exceedances were noted
and no impacts on the coral communities attributable to dredging were observed.
The rolling average 6hr trigger level of >100mg/L (~67 NTU) used at Hay Point was exceeded on
several occasions at the nearest high turbidity adapted coral community site located
approximately 4km away at Victor Islet. Results of coral surveys at Victor Islet after dredging
suggested there was dredging related partial coral mortality and bleaching at monitoring sites.
The compromised coral colonies recovered four months after dredging had ceased.
Based on the review by Erftemeijer et al (2012) summarised in Section 3.2, turbidity tolerant coral
communities (such as those found at Boyd Point and Pera Head) may experience some nonlethal
impacts when turbidity is elevated for long periods (5-6 weeks) above 27 NTU and lethal impacts
when turbidity exceeds 67 NTU for long periods up to 2-4 weeks.
A review by Hanley (2011) on the results of capital dredging environmental monitoring programs
in the Pilbara region of Western Australia found generally that trigger levels set to predict the
areas of impact were often very conservative. This lead to overly large predicted areas of impact,
costly and complex and intensive monitoring program designs and implementations. The actual
impacts to the benthic communities in the areas of impact due to the dredging and relocation
activities were often negligible or not statistically significant even for the very large dredging
programs over years (refer to the ’outcome’ column information for each project in Table 3-2).
Most monitoring programs use a very conservative approach when adopting site specific triggers
or thresholds due to the lack of specific information on the benthic community in the vicinity of

RTA Weipa
Water Quality Trigger Report
Port Initial Capital Dredging
Advisian Water Quality Trigger Report Port Initial Capital Dredging
Page 15
301310-08460-00-EN-REP-0017 Water Quality Wet Season Triggers Report_Rev2.docx
the dredging operations (Ports Australia 2014). In more recent times (Gladstone – Western Basin
Dredging project for example), site specific thresholds for the sensitive receptor which is most
likely to be impacted upon by dredging (seagrass) were developed in partnership with specific
scientific studies into these thresholds (Chartrand et al 2012). The results were then incorporated
into the dredging management plans as triggers for management actions.
3.4 Wet Season Data Results
3.4.1 Turbidity
The wet season triggers levels are based on the 80th and 95th percentile of the combined wet
season data. The wet season turbidity 80th and 95th%ile values for each site (NTU) are provided in
Table 3-3, and based on data that has been through QC process. In this table, the dry season
trigger values are provided in brackets next to the wet season triggers for comparison. The
80th%ile correspond to the internal trigger levels and the 95th%ile correspond to the external
trigger levels (rounded down to the nearest whole number). In terms of management actions
during dredging, only the trigger levels from the Sites of Concern are applicable; similar percentile
values for Reference Sites are provided for comparison. The highest internal turbidity trigger for
wet season at the Sites of Concern was Site I1 (32 NTU) and the lowest was Site I2 (11 NTU). The
highest external turbidity trigger for Sites of Concern was also measured at site I1 (90 NTU) and
the lowest at Site I2 (42 NTU).
Table 3-3 Wet season turbidity triggers (NTU) for each site. Dry season values provided in brackets for comparison
Site Average Depth
as measured by
logger (m)
Turbidity
samples
(n)
Internal Turbidity
Trigger Level
(NTU) 80th
%ile1
External Turbidity
Trigger level
(NTU) 95th
%ilet
Sites of Concern
I1 8.7 8486 32 (5) 90 (9)
I2 8.9* 8442 11 (4) 42 (6)
I3 9.4 8667 20 (5) 72 (6)
I4 9.2 8628 15 (6) 57 (8)
Reference Sites
R1 9.3 8126 35 (7)# 85 (11)#
R2 10.4 8544 16 (3)# 46 (5)#
R3 26.5* 8588 8 (4)# 89 (8)#
* Depth estimate based on field vessel depth sounder measurements reported in daily reports during field maintenance. Logger does not include depth sensor.
t Dry season turbidity trigger values provided in brackets for comparison with wet season triggers
# Reference site percentile values added for comparison. Reference sites do not have internal alert or external trigger values.

RTA Weipa
Water Quality Trigger Report
Port Initial Capital Dredging
Advisian Water Quality Trigger Report Port Initial Capital Dredging
Page 16
301310-08460-00-EN-REP-0017 Water Quality Wet Season Triggers Report_Rev2.docx
3.4.2 PAR
The median total daily PAR (i.e. cumulative PAR across 24 hour period) was calculated for each
site during the dry season period and the results are presented in Table 3-4. The lowest median
total daily PAR was measured at site R3 and the highest total daily median PAR measured at site
I2 and I3. This data was used to examine the relationship between median daily PAR and depth at
each site. The results are presented as a box plot in Figure 3-2. The sites on the x-axis are arranged
in increasing depth. The regression analysis undertaken in STATISTICA found in the wet season
there is a significant linear relationship between median total daily PAR and depth (p<0.05); the
shallower the site the higher the amount of sunlight reaching the seafloor. This relationship
between depth and PAR was also evident in the dry season.
Table 3-4 Wet Season Median Total Daily PAR at each site when all data is considered.
Site Average Depth as
measured by logger
(m)
PAR samples
(days)
Median Total Daily
PAR (mol/m2/day)
1
Sites of Concern
I1 8.7 8687 (91) 0.40 (1.01)
I2 8.9* 8565 (91) 0.60 (0.89)
I3 9.4 8711 (91) 0.60 (0.96)
I4 9.2 8657 (91) 0.30 (1.28)
Reference Sites
R1 9.3 7199 (74) 0.20 (0.27)
R2 10.4 8697 (91) 0.30 (1.09)
R3 26.5* 8721 (91) 0.00 (0.07)
* Depth estimate based on field vessel depth sounder measurements reported in daily reports during field maintenance. Logger does not include depth sensor.
1 Dry season median daily PAR (mol/m2/day) provided in brackets for comparison

RTA Weipa
Water Quality Trigger Report
Port Initial Capital Dredging
Advisian Water Quality Trigger Report Port Initial Capital Dredging
Page 17
301310-08460-00-EN-REP-0017 Water Quality Wet Season Triggers Report_Rev2.docx
Figure 3-2 Box Plot of Median Total Daily wet season PAR at each site after cloudy day data is removed. Sites (x-axis) arranged from shallowest to deepest
3.4.3 Turbidity and PAR
The relationship between the turbidity and PAR measured at depth at each site was examined by
comparing the median total daily PAR plotted against the median daily turbidity. Because the
light reaching the seafloor is influenced by the amount of cloud in the sky at the time the PAR data
is recorded, these PAR data (and associated turbidity data for that day) need to be removed. The
data on daily solar radiation measured at the Weipa Airport Bureau of Meteorology (BOM) site
(BOM 2016) was examined to look for falls in solar radiation on a given day. The decreases in
daily solar radiation correspond with clouds passing over the sun and the total daily PAR and
daily turbidity data on these days is removed from the analysis. The line of best fit shown on each
graph indicates an exponential relationship best describes the relationship between the two
variables. A regression comparing median total daily PAR and median daily turbidity at each site
(Figure 3-3) found a significant relationship between the two variables at all sites (p<0.05) except
Reference Site R3. Provision of individual site graphs removes depth as a variable between sites.

RTA Weipa
Water Quality Trigger Report
Port Initial Capital Dredging
Advisian Water Quality Trigger Report Port Initial Capital Dredging
Page 18
301310-08460-00-EN-REP-0017 Water Quality Wet Season Triggers Report_Rev2.docx
Figure 3-3 Daily median turbidity compared to median total daily PAR at each site; the exponential line of best fit equation and R2 value are
provided in each graph in the top right corner.

RTA Weipa
Water Quality Trigger Report
Port Initial Capital Dredging
Advisian Water Quality Trigger Report Port Initial Capital Dredging
Page 19
301310-08460-00-EN-REP-0017 Water Quality Wet Season Triggers Report_Rev2.docx
3.4.4 Depth Profiling
Turbidity depth profiling was undertaken at all sites during each wet season water quality logger
maintenance trip (approximately monthly). The changes in turbidity values as depth increases at
each site from data collected during maintenance trip 3 (MT3) in December 2015 and
maintenance trip4 (MT4) in January 2016 are presented in Figure 3-4 and Figure 3-5 respectively.
During MT3, the turbidity generally increased with depth. Changes in turbidity with depth at the
four Sites of Concern (I1, I2, I3 and I4) were approximately between 0 – 5 NTU over the depth
profile, with site I3 showing the most marked change. The measured turbidity also increased with
depth at the reference sites, increases between1-4NTU with depth were observed at the reference
sites.
During MT4, the turbidity generally increased with depth. Changes in turbidity with depth at the
four Sites of Concern (I1, I2, I3 and I4) and Reference Sites (R1B, R2 and R3) were approximately
between 0 – 5 NTU over the depth profile. The measured turbidity increased slightly at Reference
Site 3 (R3) at depths greater than 17m. At this depth the turbidity values started to increase until
eventually the turbidity measured near the seafloor at20m (3NTU) was over three times the
turbidity values measured at the shallower depths (1NTU).
Three dimensional modelling of the fate of sediments from dredging was undertaken as part of
the South of Embley EIS across a number of tidal and seasonal scenarios. The modelling outputs
showed the spatial scales of the depth averaged concentrations of TSS throughout the water
column and predicted potential impacts based on this. Examples of the model outputs can be
found in the DMP (RTA 2015).
The depth profiling data collected during MT3 and MT4 (outlined above) shows that turbidity is
generally homogenous through the water column, increasing slightly with depth. There are some
exceptions which are likely due to depth profiling measurements being undertaken at peak of tidal
flow potentially during the largest tidal ranges (spring tides) when the seafloor sediments are
resuspended more readily leading to elevated turbidity measurements near the seafloor.
Generally, the model predictions using depth averaging of the TSS through the water column is
therefore a good approximation of what occurs (homogenous TSS throughout the water column)
at the monitoring sites.

RTA Weipa
Water Quality Trigger Report
Port Initial Capital Dredging
Advisian Water Quality Trigger Report Port Initial Capital Dredging
Page 20
301310-08460-00-EN-REP-0017 Water Quality Wet Season Triggers Report_Rev2.docx
Figure 3-4 Turbidity depth profile at each site during maintenance trip 3 (MT3) – December 2016

RTA Weipa
Water Quality Trigger Report
Port Initial Capital Dredging
Advisian Water Quality Trigger Report Port Initial Capital Dredging
Page 21
301310-08460-00-EN-REP-0017 Water Quality Wet Season Triggers Report_Rev2.docx
Figure 3-5 Turbidity depth profile at each site during maintenance trip 4 (MT4) – January 2016
3.4.5 TSS and Turbidity
At all sites during each field trip TSS samples were collected from the lower water column
adjacent to the seafloor at the same time as turbidity measurements were being undertaken
during the depth profiling exercise.

RTA Weipa
Water Quality Trigger Report
Port Initial Capital Dredging
Advisian Water Quality Trigger Report Port Initial Capital Dredging
Page 22
301310-08460-00-EN-REP-0017 Water Quality Wet Season Triggers Report_Rev2.docx
During all sampling trips except MT5, the turbidity values represented are the average of at least
20 turbidity measurements taken during the depth profiling exercise at the same depth as the TSS
sample was taken. During MT5 the TSS samples were taken from the surface waters and the
turbidity measured at the surface is used. This does not pose an issue because TSS and turbidity
are not depth dependant.
The wet season results are presented in Table 3-5 and Figure 3-6. Based on this data there is no
significant linear relationship between TSS and turbidity (see Figure 3-6, R2=0.1524, p>0.05).
Table 3-5 Total Suspended Solid (TSS) data and average turbidity data at all sites
Site Field trip
code Date sampled Season TSS (mg/L)
Average Turbidity
(NTU)
I1 MT3 04/12/20145 @ 10:20 wet 4 2.7
I2 MT3 02/12/20145 @ 09:27 wet 6 3.3
I2 duplicate MT3 02/12/20145 @ 09:27 wet 1.5 3.3
I3 MT3 03/12/20145 @ 12:53 wet 1.5 6
I4 MT3 03/12/20145 @ 10:45 wet 3 6.8
R1B MT3 04/12/20145 @ 07:20 wet 3 4.2
R2 MT3 05/12/20145 @ 07:52 wet 1.5 3.2
R3 MT3 03/12/20145 @ 07:30 wet 7 3.2
I1 MT4 12/01/2016 @ 09:45 wet 3 1.9
I2 MT4 15/01/2016 @ 07:25 wet 7 2.9
I3 MT4 14/01/2016 @ 08:23 wet 4 3.4
I4 MT4 13/01/2016 @ 12:00 wet 9 4.8
I4 Duplicate MT4 13/01/2016 @ 12:00 wet 7 4.8
R1B MT4 12/01/2016 @ 12:45 wet 4 2.6
R2 MT4 13/01/2016 @ 09:00 wet 4 2.4
R3 MT4 14/01/2016 @ 13:30 wet 2 1.8
I1 MT5 11/02/16 @ 09:20 wet 19 5.5
I2 MT5 09/02/16 @ 12:15 wet 1.5 1.4
I3 MT5 11/02/16 @ 07:15 wet 4 2.1
I4 MT5 10/02/16 @ 11:15 wet 1.5 2.6
I4 Duplicate MT5 10/02/16 @ 11:15 wet 1.5 2.6
R1B MT5 09/02/16 @ 15:30 wet 6 4.8
R2 MT5 10/02/16 @ 07:45 wet 2 3.6
R3 MT5 09/02/16 @ 08:00 wet 1.5 3.0

RTA Weipa
Water Quality Trigger Report
Port Initial Capital Dredging
Advisian Water Quality Trigger Report Port Initial Capital Dredging
Page 23
301310-08460-00-EN-REP-0017 Water Quality Wet Season Triggers Report_Rev2.docx
Figure 3-6 Total Suspended Solid (TSS) data compared to turbidity data at all sites for the wet season
3.4.6 Gross Sedimentation
The daily gross sedimentation rates at each site were calculated from replicate sediment trap data
collected during each field trip in the wet season. Three sediment traps were attached to the
logger frame at each site. Before redeployment of the logger system, the sediment in the traps was
collected and despatched to the laboratory after the field trip for dry weight analysis.
Data from field trip MT4 are not included because all traps were full of sediment upon retrieval
and therefore provide no accurate sedimentation rate. During field trip MT5 three samples were
collected from each site except R1B where two samples were collected (one trap was missing).
Gross sedimentation for each sample was calculated by dividing the total dry sediment weight
(mg) in each trap by the number of days the trap was deployed and then dividing by the area of
the trap mouth in cm2. The results of the average gross sedimentation rates in mg/cm2/day
(±Standard Errors) for the wet season are presented in Table 3-5 and Figure 3-7 .

RTA Weipa
Water Quality Trigger Report
Port Initial Capital Dredging
Advisian Water Quality Trigger Report Port Initial Capital Dredging
Page 24
301310-08460-00-EN-REP-0017 Water Quality Wet Season Triggers Report_Rev2.docx
Table 3-6 Average wet season gross sedimentation rates (mg/cm2/day) and average
turbidity at each site during the wet season
Site Season n Average Gross sedimentation
rates (mg/cm2/day)
Standard Error
Average turbidity
(NTU)
Site I1 wet 3 61.1 4.3 21.4
Site I2 wet 3 41.9 2.9 9.6
Site I3 wet 3 36.4 6.9 16.9
Site I4 wet 3 71.0 17.7 12.9
R1B wet 2 52.7 14.9 21.7
Figure 3-7 Average gross sedimentation rates (mg/cm2/day) at each site during the wet
season (± Standard Error)
In the wet season the highest gross daily sedimentation rates (mg/cm2/day) occurred at Site I4
(71.0±17.7) and the lowest at I3 (36.4±6.9).
The average turbidity value for each site is included in Table 3-6 and Figure 3-8 for comparison.
There is no significant linear relationship (R2=0.0390, P>0.05) between daily gross
sedimentation rates and turbidity when wet season data is considered.

RTA Weipa
Water Quality Trigger Report
Port Initial Capital Dredging
Advisian Water Quality Trigger Report Port Initial Capital Dredging
Page 25
301310-08460-00-EN-REP-0017 Water Quality Wet Season Triggers Report_Rev2.docx
Figure 3-8 The average turbidity against the average gross daily sedimentation rate at all sites for the wet season data

RTA Weipa
Water Quality Trigger Report
Port Initial Capital Dredging
Advisian Water Quality Trigger Report Port Initial Capital Dredging
Page 26
301310-08460-00-EN-REP-0017 Water Quality Wet Season Triggers Report_Rev2.docx
4 Discussion
The coral communities growing at Pera Head and Boyd Point are well adapted to low light, high
suspended solids regimes. The growth forms they exhibit are designed to maximise benthic light
capture and effectively deal with elevated sedimentation rates.
Recent studies into the temporal patterns in water quality from dredging in tropical environments
(Jones et al 2015) found high temporal variability in the levels of suspended solids in the water
column close to dredging (<500m) which ranged from 100mg/L to 500mg/L over several hours.
During longer periods (days to weeks to months) the average concentrations of suspended solids
in the water column decrease markedly toward background baseline levels. The main feature the
study found of the water quality during the dredging operations was the persistent twilight
periods during the day due to persistent small elevations of TSS above background TSS, where
sunlight reaching the seafloor was not fully extinguished, but very low.
For the Amrun Port Initial Capital Dredging, the wet season turbidity levels measured at the Sites
of Concern range between 11 and 32NTU (80th%ile –internal) and 42 and 90 NTU (95th%ile-
external). In some cases the wet season values are ten times the dry season trigger values.
Compared to the turbidity threshold values outlined in Erftemeijer et al (2012), the proposed wet
season trigger levels can be considered to be more biologically relevant than the much lower dry
season trigger values (refer Table 3-1).
The use of turbidity as a trigger appears to be a good surrogate for the amount of light reaching
the seafloor on a given day (daily PAR); daily PAR appears to have a statistically significant
relationship with the turbidity in the water column.
The Amrun Port Initial Capital Dredging involves the dredging of approximately 240,000m3. The
volume of material to be dredged is one tenth of the volume proposed in the EIS and DMP and on
which predictive hydrodynamic modelling was undertaken. The temporal and spatial distribution
of fugitive sediments and the concentrations of these sediments will be considerably less than
predicted by the modelling impact assessment.
Based on this, only the areas in close proximity (100’s of meters) to the dredging will likely
experience high levels of TSS in the water column and twilight periods over the course (up to
three weeks) of the dredging. It is unlikely that impacts will occur to the low light tolerant coral
communities located further afield at Boyd Point and Pera Head, located approximately two
kilometres to the north and three kilometres south of the dredging footprint respectively.

RTA Weipa
Water Quality Trigger Report
Port Initial Capital Dredging
Advisian Water Quality Trigger Report Port Initial Capital Dredging
Page 27
301310-08460-00-EN-REP-0017 Water Quality Wet Season Triggers Report_Rev2.docx
5 References
AECOM (2011) East Arm Wharf Expansion Project – Dredge Management Plan. Prepared for
Northern Territory Department of Land and Planning, 29 March 2011
ANZECC/ ARMCANZ (2000). Australian and New Zealand Guidelines for Fresh and Marine
Water Quality. Australia and New Zealand Environment and Conservation Council and
Agriculture and Resource Management Council of Australia and New Zealand. Canberra.
BHP(2011). Hunt Point Marine Precinct – Dredge Management Plan. November 2011
BMA (2012). Annual Ecological Monitoring Summary Report – 2011. Hay Point Coal Terminal
Expansion Phase 3. Report prepared by SKM for BM Alliance Coal Operations, 23 February
2012.
BOM (2016). Weipa Aero – 2016 daily calculations. Accessed online 21 January 2016 at:
http://www.bom.gov.au/watl/eto/tables/qld/weipa_aero/weipa_aero.html
Chartrand KM, Ralph PJ, Petrou K, Rasheed MA. (2012) Development of a light-based seagrass
management approach for the Gladstone Western Basin Dredging Program. DEEDI Publication.
Fisheries Queensland, Cairns, 92pp.
Chevron(2011). Gorgon Gas Development and Jansz Feed Gas Pipeline: Dredging and Spoil
Disposal Management and Monitoring Plan, 8 June 2011
Department of Environment and Heritage Protection (DEHP) (2009) Queensland Water Quality
Guidelines, version 3, July 2013
Ports Australia (2014). Dredging and Australian Ports – Subtropical and Tropical Ports, April
2014.
Erftemeijer P.L.A, Riegl B., Hoeksema B.W. and Todd P.A. (2012). Environmental impacts of
dredging and other sediment disturbances on corals: A review. Marine Pollution Bulletin 64:1737-
1765.
GHD (2012). Report for Small Vessel Cyclone Mooring Protection Facility – Dredge Management
Plan. Report prepared for the Port Hedland Port Authority, March 2012.
GBRMPA (2010). Great Barrier Reef Water Quality Guidelines. Great Barrier Reef Marine Park
Authority.
Hanley J.R. (2011). Environmental Monitoring Programs on Recent Capital Dredging Projects in
the Pilbara (2003-2010): a review. APPEA Journal 2011:273-293.
INPEX (2013). Ichthys Project – Dredging and Spoil Disposal Management Plan – East Arm, 16
December 2013.
Jones R., Fisher R., Stark C., and Ridd P. (2015). Temporal Patterns in Seawater Quality from
Dredging in Tropical Environments. PLoS ONE 10(10):e0137112.
Doi:10.1371/journal.pone.0137112
MScience (2009). Dampier Marine Services Facility: Water Quality Impacts of the Pluto Program
in an area of intensive dredging. Report prepared for the Dampier Port Authority, 18 December
2009.

RTA Weipa
Water Quality Trigger Report
Port Initial Capital Dredging
Advisian Water Quality Trigger Report Port Initial Capital Dredging
Page 28
301310-08460-00-EN-REP-0017 Water Quality Wet Season Triggers Report_Rev2.docx
Rio Tinto Alcan (2015). South of Embley Project, Dredge Management Plan – Port (Initial Capital
Dredging). 16 November 2015.
SKM (2007). Pluto LNG Development. Addendum to Public Environmental Report/Public
Environmental Review Supplement and Response to Submissions. Revision 2.
SKM (2011). Cape Lambert Port B Development – Dredging and Spoil Disposal Management
Plan. Report prepared by SKM on behalf of RioTinto, 12 December 2011.
Trimarchi S. and Keane J. (2007). Port of Hay Point Apron Areas and Departure Path Capital
Dredging project Environmental Review. EcoPorts Monograph Series No.24. Report prepared by
Ports Corporation of Queensland. 63pp.
WorleyParsons (2012). South West Creek Dredging and Reclamation Project – Water Quality
Monitoring Report6: 21 March – 28 May 2012. Report prepared for the Port Hedland Port
Authority, 29 August 2012

RTA Weipa
Water Quality Trigger Report
Port Initial Capital Dredging
Advisian Water Quality Trigger Report Port Initial Capital Dredging
Page 29
301310-08460-00-EN-REP-0017 Water Quality Wet Season Triggers Report_Rev2.docx
Appendix A Cape Lambert Port B turbidity triggers (SKM 2011)

RTA Weipa
Water Quality Trigger Report
Port Initial Capital Dredging
Advisian Water Quality Trigger Report Port Initial Capital Dredging
Page 30
301310-08460-00-EN-REP-0017 Water Quality Wet Season Triggers Report_Rev2.docx

RTA Weipa
Water Quality Trigger Report
Port Initial Capital Dredging
Advisian Water Quality Trigger Report Port Initial Capital Dredging
Page 31
301310-08460-00-EN-REP-0017 Water Quality Wet Season Triggers Report_Rev2.docx
Appendix B Ichthys Project turbidity triggers from DSDMP (INPEX 2013)

RTA Weipa
Water Quality Trigger Report
Port Initial Capital Dredging
Advisian Water Quality Trigger Report Port Initial Capital Dredging
Page 32
301310-08460-00-EN-REP-0017 Water Quality Wet Season Triggers Report_Rev2.docx

RTA Weipa
Water Quality Trigger Report
Port Initial Capital Dredging
Advisian Water Quality Trigger Report Port Initial Capital Dredging
Page 33
301310-08460-00-EN-REP-0017 Water Quality Wet Season Triggers Report_Rev2.docx
Appendix C East Arm Dredging Draft DSDMP turbidity triggers (AECOM 2011)

RTA Weipa
Water Quality Trigger Report
Port Initial Capital Dredging
Advisian Water Quality Trigger Report Port Initial Capital Dredging
Page 34
301310-08460-00-EN-REP-0017 Water Quality Wet Season Triggers Report_Rev2.docx

Port Dredging Water Quality Report
Page 21
APPENDIX D: DAILY SUMMARY OF RECORDED TELEMETRY ISSUES DURING DREDGING Date (2016)
Issue Turbidity monitored in accordance with DMP
NOTES Compliant with DMP
13/03 – 15/03
Maintenance of loggers prior to commencement of dredging
• Telemetry – turbidity (R1, I3, I4, R2 and R3)
• Telemetry – PAR (I1 and I2) • Turbidity recorded on backup
loggers (all locations) • MODIS imagery
• Maintenance of loggers was conducted but was unable to be completed due to poor weather preventing safe access to R3. A team will be mobilised to site as soon as possible to rectify the remaining issues.
• R3 logger maintenance to be completed. It is important to note that there is no concern of the quality of data provided at R3 with calibration consistent with previous records.
• I1 was displaying occasional erroneous values • I2 required calibration file to be installed on website. Data collecting correctly.
Yes
15/03 –25/03
I1 and I2 erroneous telemetered turbidity data. R3 logger maintenance (data is still acceptable); prior to commencement of dredging.
• Telemetry – turbidity (R1, I3, I4, R2 and R3
• Telemetry – PAR (I1 and I2) • MODIS imagery • Turbidity recorded on backup
logger (all locations) • MODIS imagery
• I1 telemetry for turbidity erroneous (19/03) and I2 telemetry for turbidity erroneous (18/03). As an alternative PAR data will be used to monitor turbidity. If daily median of PAR is greater than zero daily median turbidity is less than 10 and no trigger event has been recorded.
• The consultant was scheduled to mobilise to site on 28/03 (due to Easter public holidays). Team was onsite on 28-30 will be downloading turbidity data from I1 and I2 back-up loggers. Technical repair team attempted to fix telemetry issues with equipment on 31/03.
Yes
26/03 Erroneous turbidity data at I1 and I2.
• Telemetry – turbidity (R1, I3, I4, R2 and R3
• Telemetry – PAR (I1 and I2) • MODIS imagery • Turbidity recorded on backup
logger (all locations) • MODIS imagery
• Dredging commenced at 18:20 • Consultant is scheduled to be on site and will download data from back-up turbidity
loggers at I1 and I2 on 29/03 • PAR data was used to monitor light levels (alternate for turbidity). No issues identified
with both loggers recording median daily PAR greater than zero. • MODIS Imagery for 26/03 was collected prior to commencement of dredging
Yes
27/03 Erroneous turbidity data at I1 and I2.
• Telemetry – turbidity (R1, I3, I4, R2 and R3
• Telemetry – PAR (I1 and I2) • MODIS imagery • Turbidity recorded on backup
logger (all locations) • MODIS imagery
• Consultant is scheduled to be on site and will download data from back-up turbidity loggers at I1 and I2 on 29/03
• PAR data was used to monitor light levels (alternate for turbidity). No issues identified with both loggers recording median daily PAR greater than zero.
Yes

Port Dredging Water Quality Report
Page 22
Date (2016)
Issue Turbidity monitored in accordance with DMP
NOTES Compliant with DMP
28/03 Erroneous turbidity data at I1. I2 and R3 data package issues (pm)
• Telemetry – turbidity (R1, I3, I4, R2, R3 - am)
• Telemetry – PAR (I1, 12 -am) • MODIS imagery • Turbidity recorded on backup
logger (all locations) • MODIS imagery • In situ boat based monitoring • MODIS imagery • In-field plume observations
• MODIS imagery monitoring of plume - – no plume evident • On-site monitoring of plume and in situ boat based monitoring. Plume was localised
around vessel. Plume returned to 2 NTU within 500m of vessel. • Internal trigger alert was recorded at I1 (day 1). The management process was
followed and an investigation identified erroneous data at I1. PAR data has not shown any reduction from pre-dredge observations. False exceedance recorded.
Yes
29/03 Erroneous turbidity data at I1 and I2 and R3 data package issues
• Telemetry (R1, I3, I4, R2) • Data downloaded daily from
back-up turbidity loggers (I1 and I2)
• In-field plume observations • MODIS imagery
Consultant arrived on site and team members were present on site for the remainder of the dredge period • Turbidity was monitored using the downloaded turbidity data collected by the
consultant at I1 and I2 in accordance with the DMP. All data was recovered from back up loggers and no erroneous data was identified. Data from loggers was analysed, no trigger events were recorded. Data was consistent with previous infield observations and in situ monitoring.
• Consultant recorded observations on plume (localised around vessel and slight surface plume to 500m south (not evident in pictures).
• MODIS imagery monitoring of plume - – no plume evident • Erroneous data issues were corrected at I1.
Yes
30/03 I2 and R3 data package issues
• Telemetry (R1,I1, I3, I4, R2) • Data downloaded daily from
instruments (I2 and R3) • In-field plume observations • In-situ boat based monitoring • MODIS imagery
• Plume was recorded as being localised at vessel. • All data was recovered from back up loggers and no erroneous data was identified.
Data from loggers was analysed, no trigger events were recorded. Data was consistent with previous infield observations and in situ monitoring In-situ plume monitoring conducted surrounding the vessel. Plume localised to around the vessel.
• MODIS imagery monitoring of plume - – no plume evident
Yes
31/03 Erroneous turbidity data at I1 being recorded R3 data package issues
• Telemetry (R1,I2 , I3, I4, R2) • Data downloaded daily from
instruments (I1 and R3) • In-field plume observations • In-situ boat based monitoring • MODIS imagery
• Consultant downloaded data at I1 and rectified telemetry in accordance with DMP. Data from loggers was analysed and data was consistent with observations and in situ monitoring with no impact recorded.
• In-situ boat based plume monitoring conducted surrounding the vessel. Plume localised to around the vessel and within 500m of the vessel. .
• MODIS imagery monitoring of plume - – no plume evident
Yes
01/04 R3 data package issues and erroneous data at I1
• Telemetry (R1,I2 , I3, I4, R2) • Data downloaded daily from
turbidity loggers (I1 and R3) • In-field plume observations
• Consultant downloaded turbidity data at I1 and rectified problem in accordance with the DMP. Completed maintenance at R3, downloaded turbidity data and rectified telemetry.
• All data was recovered from back up loggers and no erroneous data was identified.
Yes

Port Dredging Water Quality Report
Page 23
Date (2016)
Issue Turbidity monitored in accordance with DMP
NOTES Compliant with DMP
• In-situ monitoring • MODIS
Data from loggers was analysed, no trigger events were recorded. Data was consistent with previous infield observations and in situ monitoring
• MODIS imagery monitoring of plume - – no plume evident 02/04 No issues • Telemetry (R1, I1, I2, I3, I4, R2
and R3) • In-field plume observations • MODIS imagery
• All equipment operational. All operations in accordance with DMP. Yes
03/04 I2 telemetry stopped working
• Telemetry (R1, I1, I3, I4, R2 and R3)
• In-situ boat based monitoring I2
• In-field plume observations • MODIS imagery
• Issues were identified at I2 logger early AM. • In-situ plume monitoring conducted surrounding the vessel. Plume localised to within
400 m of the vessel. Monitoring in accordance with DMP • MODIS imagery monitoring of plume - – no plume evident.
Yes
04/04 No telemetry at I2 • Telemetry (R1, I1, I3, I4, R1, R2 and R3)
• In-situ monitoring (I2) and plume turbidity monitoring around vessel
• In-field plume observations • MODIS imagery
• In-situ water quality logging was completed at I2 (including depth profiles) in accordance with the DMP. An additional autonomous logger was deployed at I2.
• In-situ plume monitoring conducted surrounding the vessel. The plume was most prevalent in the first 300-500m from the active dredge, with a less evident plume extending for around ~1km
• MODIS imagery monitoring of plume - – no plume was visible. This indicates plume was only slightly higher than background elevations. This was confirmed in the field with plumes not evident in field photos
Yes
05/04 No telemetry at I2 • Telemetry (R1, I1, I3, I4, R2 and R3)
• Turbidity data downloaded daily from instrument (I2)
• In-situ plume monitoring • In-field plume observations • MODIS imagery
• Data downloaded from instrument at I2 in accordance with DMP. Data downloaded was analysed and no trigger events were recorded. Date was consistent with observations and in situ monitoring with no impact recorded. No plume evident at location.
• Plume from the dredge was travelling in a north westerly direction heading away from the coast. The plume was most prevalent in the first 200-250m from the active dredge, with a less evident plume extending for around ~500m.
• In-situ plume monitoring conducted surrounding the vessel. • MODIS imagery monitoring of plume - – no plume evident.
Yes
06/04 No telemetry at I2 • Telemetry (R1, I1, I3, I4, R2 and R)
• Turbidity data downloaded daily from instrument (I2)
• In-field plume observations • MODIS
• Loggers at R1 and I2 swapped for compatibility with telemetry systems to allow real time management.
• Data was downloaded from instrument at I2 in accordance with DMP. Data downloaded was analysed and no trigger events were recorded. Date was consistent with observations and in situ monitoring with no impact recorded. No plume evident at location.
• No dredge plume was visible.
Yes

Port Dredging Water Quality Report
Page 24
Date (2016)
Issue Turbidity monitored in accordance with DMP
NOTES Compliant with DMP
• MODIS imagery monitoring of plume - – no plume evident. 07/04 No telemetry at R1 • Telemetry (I1, I2 I3, I4, R2 and
R3) • Data downloaded daily from
instrument (R1) • In-situ plume monitoring • In-field plume observations • MODIS imagery
• Data downloaded from instrument at R1 in accordance with DMP. Data downloaded was analysed and compared to impact sites. Date was consistent with observations and in situ monitoring with no impact recorded. No plume evident at location.
• In-situ plume monitoring conducted surrounding the vessel. • MODIS imagery monitoring of plume - – no plume evident. • An Internal alert notification was received for I2 with the 5 day rolling median greater
than the site internal trigger level for the first time (1 consecutive day). The management process was followed and an investigation identified a website problem. This was determined to be a false exceedance with turbidity below the trigger value.
Yes
08/04 No telemetry at R1 • Telemetry (I1, I2 I3, I4, R2 and R3)
• Data downloaded daily from instrument (R1)
• In-situ plume monitoring • In-field plume observations • MODIS imagery
• Data downloaded from instrument at R1 in accordance with DMP. Data downloaded was analysed and compared to impact sites. Date was consistent with observations and in situ monitoring with no impact recorded. No plume evident at location.
• No plume was recorded. • MODIS imagery monitoring of plume - – no plume evident.
Yes
09/04 No telemetry at R1 • Telemetry (I1, I2 I3, I4, R22 and R3)
• Data downloaded daily from instrument (R1)
• In-situ plume monitoring • In-field plume observations • MODIS
• Dredging completed at 01:30 am. • Data downloaded from instrument at R1 in accordance with DMP. Data downloaded
was analysed and compared to impact sites. Date was consistent with observations and in situ monitoring with no impact recorded. No plume evident at location.
• No plume was evident. • MODIS imagery monitoring of plume - – no plume evident.
Yes