ams journals online - journal - table of contents · ams journals online - journal - table of...
TRANSCRIPT
10-12-2 下午7:43AMS Journals Online - Journal - Table of Contents
第 1 页(共 2 页)http://journals.ametsoc.org/toc/clim/23/18
INST OF ATMOS. PHYSICS Sign In or Institutional Administrator | Help
Quick Search Full Text Journals Subscribe For Authors Information Online Help
Next >< Previous
Volume 23 Issue 18 (September 2010)
Current Issue Available Issues
Early Online Releases Author Index
Journal Information
Online ISSN: 1520-0442 Print ISSN: 0894-8755 Frequency: Semimonthly
Special Collections Staff and Editors Instructions to Authors Manuscript Submission How to Subscribe
AMS Alerts
(What is this?)JOIN: Journal Online IssueNotification
Journal of Climate
Climate research concerned with large-scale variability of the atmosphere, oceans, and land surface, including the cryosphere; past, present andprojected future changes in the climate system (including those caused by human activities); climate simulation and prediction. Occasionally theJournal of Climate will publish review articles on particularly topical areas. Such reviews must be approved by the Chief Editor prior tosubmission.
Table of Contents
Volume 23, Issue 18 (September 2010)
View Abstracts Add to Favorites Email Download to Citation Manager Track Citations
Select All
ARTICLES
4717 Australian Monsoon Variability Driven by a Gill–Matsuno-Type Response to Central West Pacific WarmingAndréa S. Taschetto, Reindert J. Haarsma, Alexander Sen Gupta, Caroline C. Ummenhofer, Khalia J. Hill, Matthew H.EnglandAbstract . Full Text . PDF (6695 KB)
4717–4736
4737 Isotopic and Elemental Changes in Winter Snow Accumulation on Glaciers in the Southern Alps of New ZealandHeather Purdie, Nancy Bertler, Andrew Mackintosh, Joel Baker, Rachael RhodesAbstract . Full Text . PDF (1604 KB)
4737–4749
4750 Spatial Structure, Forecast Errors, and Predictability of the South Asian Monsoon in CFS Monthly RetrospectiveForecastsHae-Kyung Lee Drbohlav, V. KrishnamurthyAbstract . Full Text . PDF (4146 KB)
4750–4769
4770 The Madden–Julian Oscillation Simulated in the NCEP Climate Forecast System Model: The Importance ofStratiform HeatingKyong-Hwan Seo, Wanqiu WangAbstract . Full Text . PDF (4109 KB)
4770–4793
4794 Model Fidelity versus Skill in Seasonal ForecastingTimothy DelSole, Jagadish ShuklaAbstract . Full Text . PDF (996 KB)
4794–4806
4807 Asymmetry of Atmospheric Circulation Anomalies over the Western North Pacific between El Niño and La NiñaBo Wu, Tim Li, Tianjun ZhouAbstract . Full Text . PDF (2022 KB)
4807–4822
4823 Tracking and Mean Structure of Easterly Waves over the Intra-Americas SeaYolande L. Serra, George N. Kiladis, Kevin I. HodgesAbstract . Full Text . PDF (3033 KB)
4823–4840
4841 Milankovitch Forcing and Meridional Moisture Flux in the Atmosphere: Insight from a Zonally Averaged Ocean–Atmosphere ModelAndrés Antico, Olivier Marchal, Lawrence A. Mysak, Françoise VimeuxAbstract . Full Text . PDF (1463 KB)
4841–4855
4856 A Pseudoproxy Evaluation of the CCA and RegEM Methods for Reconstructing Climate Fields of the LastMillenniumJason E. Smerdon, Alexey Kaplan, Diana Chang, Michael N. EvansAbstract . Full Text . PDF (21677 KB)
4856–4880
4881 Changes in Precipitation Extremes in the Hawaiian Islands in a Warming ClimatePao-Shin Chu, Ying Ruan Chen, Thomas A. SchroederAbstract . Full Text . PDF (2489 KB)
4881–4900
4901 The NCEP GODAS Ocean Analysis of the Tropical Pacific Mixed Layer Heat Budget on Seasonal to InterannualTime ScalesBoyin Huang, Yan Xue, Dongxiao Zhang, Arun Kumar, Michael J. McPhadenAbstract . Full Text . PDF (2278 KB)
4901–4925
4926 Exploring Atmosphere–Ocean Coupling Using Principal Component and Redundancy AnalysisFaez Bakalian, Harold Ritchie, Keith Thompson, William MerryfieldAbstract . Full Text . PDF (3450 KB)
4926–4943
4944 Asymmetry in ENSO Teleconnection with Regional Rainfall, Its Multidecadal Variability, and ImpactWenju Cai, Peter van Rensch, Tim Cowan, Arnold SullivanAbstract . Full Text . PDF (4287 KB)
4944–4955
4956 Time–Frequency Characteristics of Regional Climate over Northeast China and Their Relationships with
All Journals > Journal of Climate > September 2010 Advanced Search
Asymmetry of Atmospheric Circulation Anomalies over the WesternNorth Pacific between El Nino and La Nina*
BO WU
LASG, Institute of Atmospheric Physics, Chinese Academy of Sciences, and Graduate University
of Chinese Academy of Sciences, Beijing, China
TIM LI
IPRC, and Department of Meteorology, University of Hawaii at Manoa, Honolulu, Hawaii
TIANJUN ZHOU
LASG, Institute of Atmospheric Physics, Chinese Academy of Sciences, Beijing, China
(Manuscript received 27 April 2009, in final form 26 January 2010)
ABSTRACT
The asymmetry of the western North Pacific (WNP) low-level atmospheric circulation anomalies between
the El Nino and La Nina mature winter is examined. An anomalous WNP cyclone (WNPC) center during La
Nina tends to shift westward relative to an anomalous WNP anticyclone (WNPAC) center during El Nino.
Two factors may contribute to this asymmetric response. The first factor is the longitudinal shifting of El Nino
and La Nina anomalous heating. The composite negative precipitation anomaly center during La Nina is
located farther to the west of the composite positive precipitation anomaly center during El Nino. The
westward shift of the heating may further push the WNPC westward relative to the position of the WNPAC.
The second factor is the amplitude asymmetry of sea surface temperature anomalies (SSTAs) in the WNP,
namely, the amplitude of local cold SSTA during El Nino is greater than that of warm SSTA during La Nina.
The asymmetry of SSTA is originated from the asymmetric SSTA tendencies during the ENSO developing
summer. Although both precipitation and surface wind anomalies are approximately symmetric, the surface
latent heat flux anomalies are highly asymmetric over the key WNP region, where the climate mean zonal
wind speed is small. Both the anomalous westerly during El Nino and the anomalous easterly during La Nina
in the region lead to an enhanced surface evaporation, strengthening (weakening) the enhancement of the
cold (warm) SSTA in situ during El Nino (La Nina). The asymmetry of the SSTA in the WNP is further
amplified due to anomalous wind differences between El Nino and La Nina in their mature winter. Atmo-
spheric general circulation model experiments demonstrate that both factors contribute to the asymmetry
between the WNPAC and WNPC. The asymmetric circulation in the WNP contributes to the asymmetry of
temporal evolutions between El Nino and La Nina.
1. Introduction
During the mature phase of El Nino, the most prom-
inent low-level atmospheric circulation anomalies over
the tropical western Pacific and East Asia is an off-
equatorial anomalous anticyclone [hereafter the western
North Pacific (WNP) anticyclone (WNPAC)] (Wang et al.
2000; Chang et al. 2000a). The WNPAC is a key bridge
that links El Nino and the East Asian summer monsoon
(Chang et al. 2000a,b; Wang et al. 2000; Wu et al. 2003).
It influences the East Asian climate from the El Nino
mature winter to the following summer. Concurring with
the formation of the WNPAC, a positive anomalous rain-
fall belt extends from southeastern China to the Kuroshio
Extension region in boreal winter and spring owing to
anomalous moisture transport by the southerly compo-
nent in the northwestern flank of the WNPAC (Zhang
* School of Ocean and Earth Science and Technology Contri-
bution Number 7907 and International Pacific Research Center
Contribution Number 683.
Corresponding author address: Dr. Tianjun Zhou, LASG, In-
stitute of Atmospheric Physics, Chinese Academy of Sciences,
Beijing 100029, China.
E-mail: [email protected]
15 SEPTEMBER 2010 W U E T A L . 4807
DOI: 10.1175/2010JCLI3222.1
� 2010 American Meteorological Society
et al. 1996; Lau and Nath 2000; Zhang and Sumi 2002).
During the subsequent summer, the WNPAC favors a
westward extension of the western Pacific subtropical
high, which blocks the mei-yu front from moving south-
ward and thereby prolongs the frontal rainfall along the
lower reaches of the Yangtze River and the Huaihe River
valleys (Chang et al. 2000a,b; Zhou and Yu 2005; Sui et al.
2007; Wu and Zhou 2008).
As a response to El Nino forcing, the WNPAC may
play a role in the phase reversal of El Nino (Wang et al.
2001). Easterly anomalies to the south of the WNPAC
may stimulate oceanic upwelling Kelvin waves and thus
reverse warm SST anomalies (SSTAs) in the equatorial
central-eastern Pacific (Weisberg and Wang 1997a,b; Wang
et al. 1999a; Kim and Lau 2001; Li et al. 2007; Ohba and
Ueda 2009).
The WNPAC is tightly coupled with underlying ocean
surface cooling. The northeasterly anomalies over the
southeastern flank of the WNPAC increase the back-
ground mean northeasterly trades and generate a colder
SST in situ through enhanced evaporation. The nega-
tive SSTAs further suppress convection and stimulate a
descending Rossby wave to the northwest and thus re-
inforce the WNPAC (Wang et al. 2003). This positive
wind–evaporation–SST feedback maintains the WNPAC
through the El Nino mature winter and the subsequent
spring (Wang et al. 2000). The ‘‘wind–evaporation–SST’’
feedback was first proposed to study the equatorial asym-
metry of the intertropical convergence zone (Xie and
Philander 1994; Li 1997), and then was used to study the
decadal variability over the tropical Atlantic (Chang et al.
1997; Xie 1999) and the phase locking of ENSO (Wang
et al. 1999b). In the study, we will explore the nonlinear
feature of the wind–evaporation process over the western
North Pacific.
While the WNPAC is maintained by local air–sea
interaction, it is initiated possibly through the following
three routes. First, circulation anomalies in response to
the El Nino heating over the equatorial central Pacific
generate cold SSTAs in the western Pacific, which fur-
ther set up the WNPAC (Wang et al. 2000). Second, the
deepening of the East Asian trough and the intrusion
of midlatitude cold air into the Philippine Sea might
trigger the WNPAC (Wang and Zhang 2002; Lau and
Nath 2006). Third, the WNPAC results from the east-
ward movement of an anomalous anticyclone established
over the northern Indian Ocean (Chou 2004; Chen et al.
2007).
Most previous studies assumed a symmetric circula-
tion feature between El Nino and La Nina; namely,
there is an anomalous anticyclone (cyclone) over the
WNP during the El Nino (La Nina) mature winter. How-
ever, it is important to note that El Nino and La Nina
have a significant asymmetry in amplitude, structure, and
temporal evolution (e.g., Hoerling et al. 1997; Burgers
and Stephenson 1999; Kang and Kug 2002; Jin et al.
2003; An and Jin 2004; An et al. 2005). The anomalous
convection over the equatorial central Pacific during La
Nina tends to shift to the west of its El Nino counterpart
(Hoerling et al. 1997). Numerical model experiments
indicated that this asymmetry is attributed to nonlinear
atmospheric responses to the underlying SSTA (Hoerling
et al. 1997; Kang and Kug 2002).
The anomalous convective heating over the equatorial
central Pacific is a crucial factor that impacts the circu-
lation over the WNP (Lau and Nath 2000; Wu and Zhou
2008; Zhou et al. 2009a,b). Given the asymmetric SSTA
pattern between El Nino and La Nina, one may wonder
whether the WNP atmospheric response to El Nino and
La Nina is asymmetric. In this paper, we attempt to ad-
dress the following questions: 1) are WNPAC and WNP
cyclone (WNPC) during the El Nino and La Nina ma-
ture winter asymmetric and 2), If they show an asym-
metric characteristic, what are the physical mechanisms
that cause the asymmetry?
The rest of the paper is organized as follows. Datasets,
analysis methods, and an atmospheric general circula-
tion model (AGCM) are described in section 2. Section
3 presents the asymmetric circulation features over the
WNP between El Nino and La Nina. In section 4, we
discuss two possible factors that cause the asymmetry.
The two factors are further examined through a series of
AGCM numerical experiments in section 5. The impacts
of the asymmetry on ENSO evolution are discussed in
section 6. Summary and concluding remarks are given in
section 7.
2. Data, method, and model experiments
a. Data and method
The datasets used in the present study consist of
1) the 850-hPa and 1000-hPa wind fields and the surface
heat flux from the National Centers for Environment
Prediction–National Center for Atmospheric Research
(NCEP–NCAR) reanalysis data (Kalnay et al. 1996)
for the period from 1948 to 2004, 2) SST data from the
Hadley Centre Global Sea Ice and Sea Surface Tem-
perature dataset (HadISST) (Rayner et al. 2003) for
the period 1948–2004, 3) monthly precipitation anoma-
lies over global land and oceans for the same period
from the precipitation reconstruction (PREC) dataset
(Chen et al. 2002), and 4) oceanic subsurface temperature
data from a simple ocean data assimilation analysis of
global upper ocean (SODA) (Carton et al. 2000) for the
period from 1950 to 2000.
4808 J O U R N A L O F C L I M A T E VOLUME 23
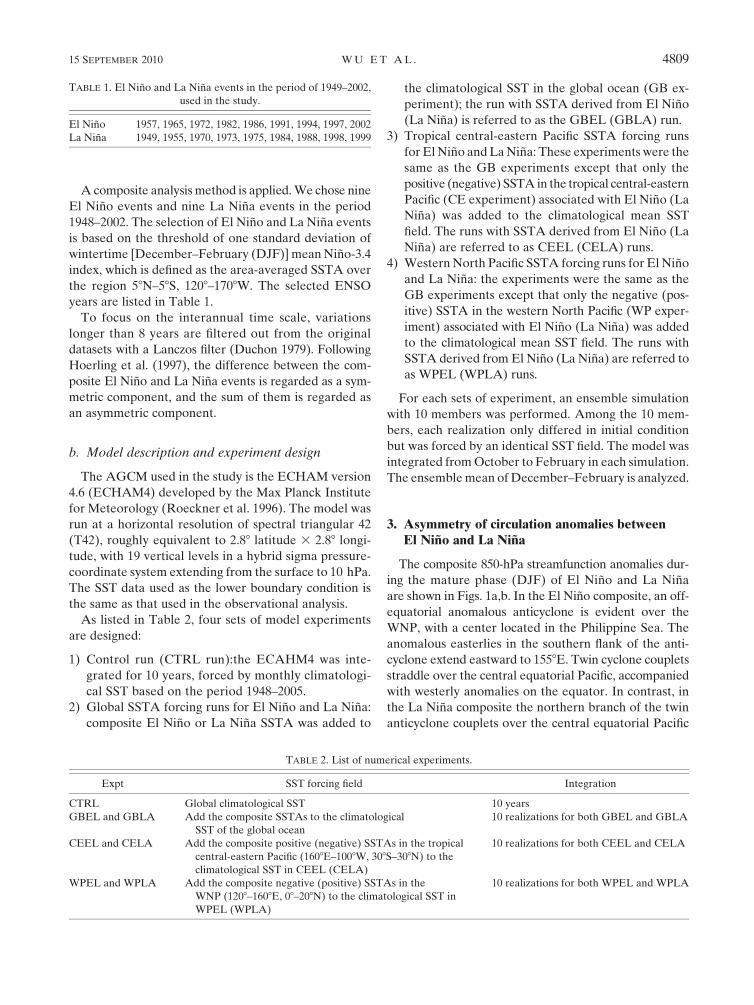
A composite analysis method is applied. We chose nine
El Nino events and nine La Nina events in the period
1948–2002. The selection of El Nino and La Nina events
is based on the threshold of one standard deviation of
wintertime [December–February (DJF)] mean Nino-3.4
index, which is defined as the area-averaged SSTA over
the region 58N–58S, 1208–1708W. The selected ENSO
years are listed in Table 1.
To focus on the interannual time scale, variations
longer than 8 years are filtered out from the original
datasets with a Lanczos filter (Duchon 1979). Following
Hoerling et al. (1997), the difference between the com-
posite El Nino and La Nina events is regarded as a sym-
metric component, and the sum of them is regarded as
an asymmetric component.
b. Model description and experiment design
The AGCM used in the study is the ECHAM version
4.6 (ECHAM4) developed by the Max Planck Institute
for Meteorology (Roeckner et al. 1996). The model was
run at a horizontal resolution of spectral triangular 42
(T42), roughly equivalent to 2.88 latitude 3 2.88 longi-
tude, with 19 vertical levels in a hybrid sigma pressure-
coordinate system extending from the surface to 10 hPa.
The SST data used as the lower boundary condition is
the same as that used in the observational analysis.
As listed in Table 2, four sets of model experiments
are designed:
1) Control run (CTRL run):the ECAHM4 was inte-
grated for 10 years, forced by monthly climatologi-
cal SST based on the period 1948–2005.
2) Global SSTA forcing runs for El Nino and La Nina:
composite El Nino or La Nina SSTA was added to
the climatological SST in the global ocean (GB ex-
periment); the run with SSTA derived from El Nino
(La Nina) is referred to as the GBEL (GBLA) run.
3) Tropical central-eastern Pacific SSTA forcing runs
for El Nino and La Nina: These experiments were the
same as the GB experiments except that only the
positive (negative) SSTA in the tropical central-eastern
Pacific (CE experiment) associated with El Nino (La
Nina) was added to the climatological mean SST
field. The runs with SSTA derived from El Nino (La
Nina) are referred to as CEEL (CELA) runs.
4) Western North Pacific SSTA forcing runs for El Nino
and La Nina: the experiments were the same as the
GB experiments except that only the negative (pos-
itive) SSTA in the western North Pacific (WP exper-
iment) associated with El Nino (La Nina) was added
to the climatological mean SST field. The runs with
SSTA derived from El Nino (La Nina) are referred to
as WPEL (WPLA) runs.
For each sets of experiment, an ensemble simulation
with 10 members was performed. Among the 10 mem-
bers, each realization only differed in initial condition
but was forced by an identical SST field. The model was
integrated from October to February in each simulation.
The ensemble mean of December–February is analyzed.
3. Asymmetry of circulation anomalies betweenEl Nino and La Nina
The composite 850-hPa streamfunction anomalies dur-
ing the mature phase (DJF) of El Nino and La Nina
are shown in Figs. 1a,b. In the El Nino composite, an off-
equatorial anomalous anticyclone is evident over the
WNP, with a center located in the Philippine Sea. The
anomalous easterlies in the southern flank of the anti-
cyclone extend eastward to 1558E. Twin cyclone couplets
straddle over the central equatorial Pacific, accompanied
with westerly anomalies on the equator. In contrast, in
the La Nina composite the northern branch of the twin
anticyclone couplets over the central equatorial Pacific
TABLE 1. El Nino and La Nina events in the period of 1949–2002,
used in the study.
El Nino 1957, 1965, 1972, 1982, 1986, 1991, 1994, 1997, 2002
La Nina 1949, 1955, 1970, 1973, 1975, 1984, 1988, 1998, 1999
TABLE 2. List of numerical experiments.
Expt SST forcing field Integration
CTRL Global climatological SST 10 years
GBEL and GBLA Add the composite SSTAs to the climatological
SST of the global ocean
10 realizations for both GBEL and GBLA
CEEL and CELA Add the composite positive (negative) SSTAs in the tropical
central-eastern Pacific (1608E–1008W, 308S–308N) to the
climatological SST in CEEL (CELA)
10 realizations for both CEEL and CELA
WPEL and WPLA Add the composite negative (positive) SSTAs in the
WNP (1208–1608E, 08–208N) to the climatological SST in
WPEL (WPLA)
10 realizations for both WPEL and WPLA
15 SEPTEMBER 2010 W U E T A L . 4809
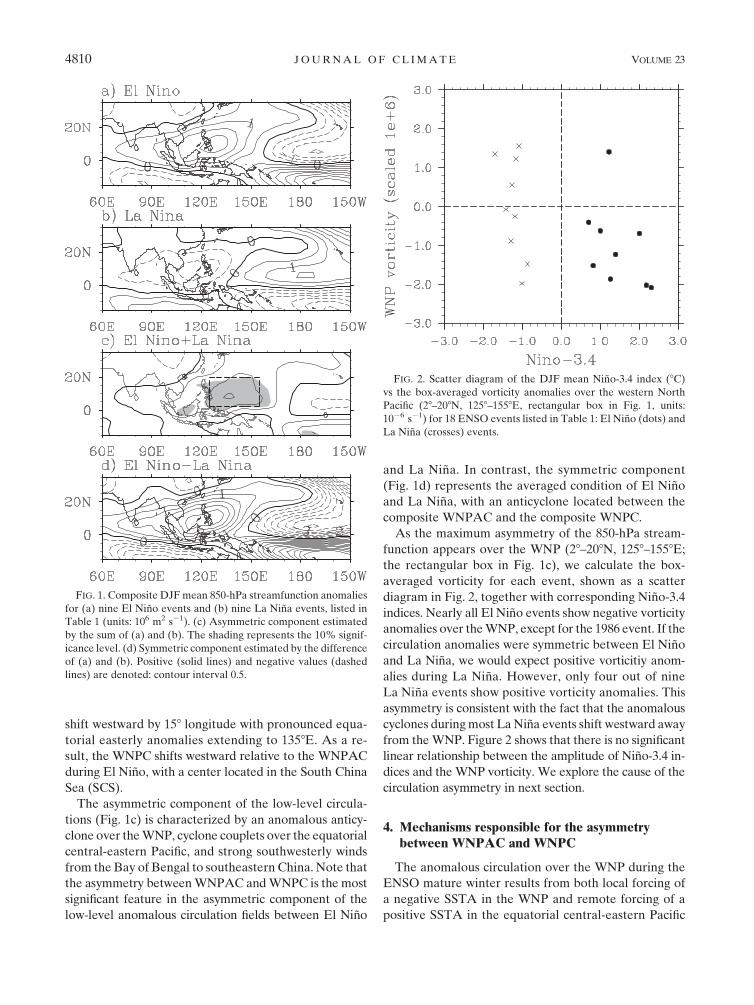
shift westward by 158 longitude with pronounced equa-
torial easterly anomalies extending to 1358E. As a re-
sult, the WNPC shifts westward relative to the WNPAC
during El Nino, with a center located in the South China
Sea (SCS).
The asymmetric component of the low-level circula-
tions (Fig. 1c) is characterized by an anomalous anticy-
clone over the WNP, cyclone couplets over the equatorial
central-eastern Pacific, and strong southwesterly winds
from the Bay of Bengal to southeastern China. Note that
the asymmetry between WNPAC and WNPC is the most
significant feature in the asymmetric component of the
low-level anomalous circulation fields between El Nino
and La Nina. In contrast, the symmetric component
(Fig. 1d) represents the averaged condition of El Nino
and La Nina, with an anticyclone located between the
composite WNPAC and the composite WNPC.
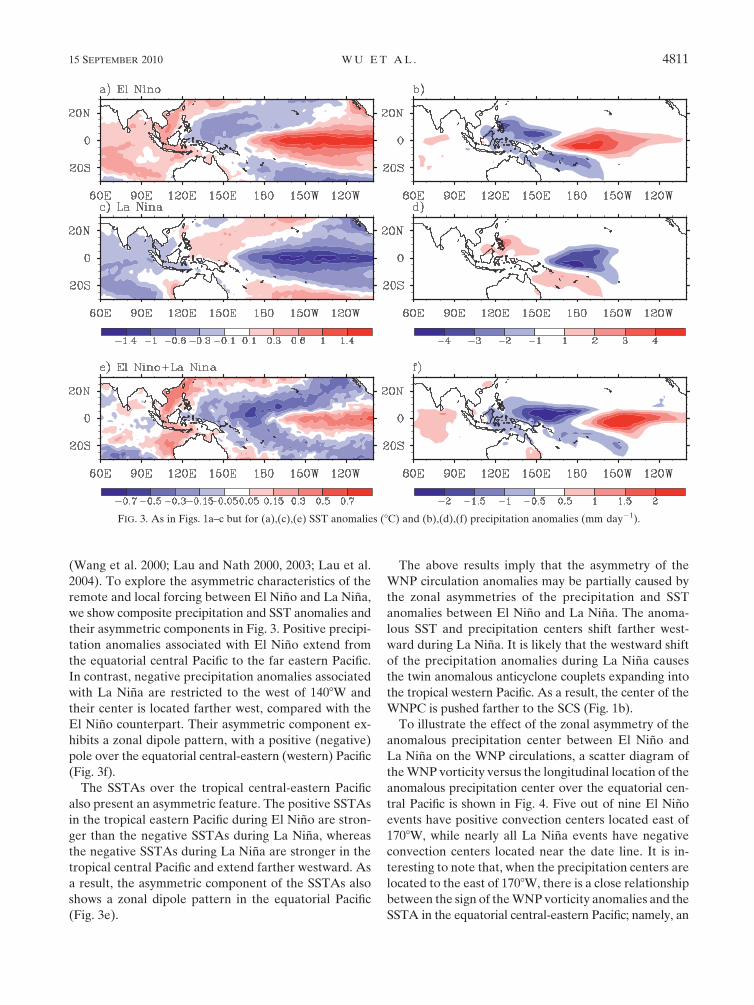
As the maximum asymmetry of the 850-hPa stream-
function appears over the WNP (28–208N, 1258–1558E;
the rectangular box in Fig. 1c), we calculate the box-
averaged vorticity for each event, shown as a scatter
diagram in Fig. 2, together with corresponding Nino-3.4
indices. Nearly all El Nino events show negative vorticity
anomalies over the WNP, except for the 1986 event. If the
circulation anomalies were symmetric between El Nino
and La Nina, we would expect positive vorticitiy anom-
alies during La Nina. However, only four out of nine
La Nina events show positive vorticity anomalies. This
asymmetry is consistent with the fact that the anomalous
cyclones during most La Nina events shift westward away
from the WNP. Figure 2 shows that there is no significant
linear relationship between the amplitude of Nino-3.4 in-
dices and the WNP vorticity. We explore the cause of the
circulation asymmetry in next section.
4. Mechanisms responsible for the asymmetrybetween WNPAC and WNPC
The anomalous circulation over the WNP during the
ENSO mature winter results from both local forcing of
a negative SSTA in the WNP and remote forcing of a
positive SSTA in the equatorial central-eastern Pacific
FIG. 1. Composite DJF mean 850-hPa streamfunction anomalies
for (a) nine El Nino events and (b) nine La Nina events, listed in
Table 1 (units: 106 m2 s21). (c) Asymmetric component estimated
by the sum of (a) and (b). The shading represents the 10% signif-
icance level. (d) Symmetric component estimated by the difference
of (a) and (b). Positive (solid lines) and negative values (dashed
lines) are denoted: contour interval 0.5.
FIG. 2. Scatter diagram of the DJF mean Nino-3.4 index (8C)
vs the box-averaged vorticity anomalies over the western North
Pacific (28–208N, 1258–1558E, rectangular box in Fig. 1, units:
1026 s21) for 18 ENSO events listed in Table 1: El Nino (dots) and
La Nina (crosses) events.
4810 J O U R N A L O F C L I M A T E VOLUME 23
(Wang et al. 2000; Lau and Nath 2000, 2003; Lau et al.
2004). To explore the asymmetric characteristics of the
remote and local forcing between El Nino and La Nina,
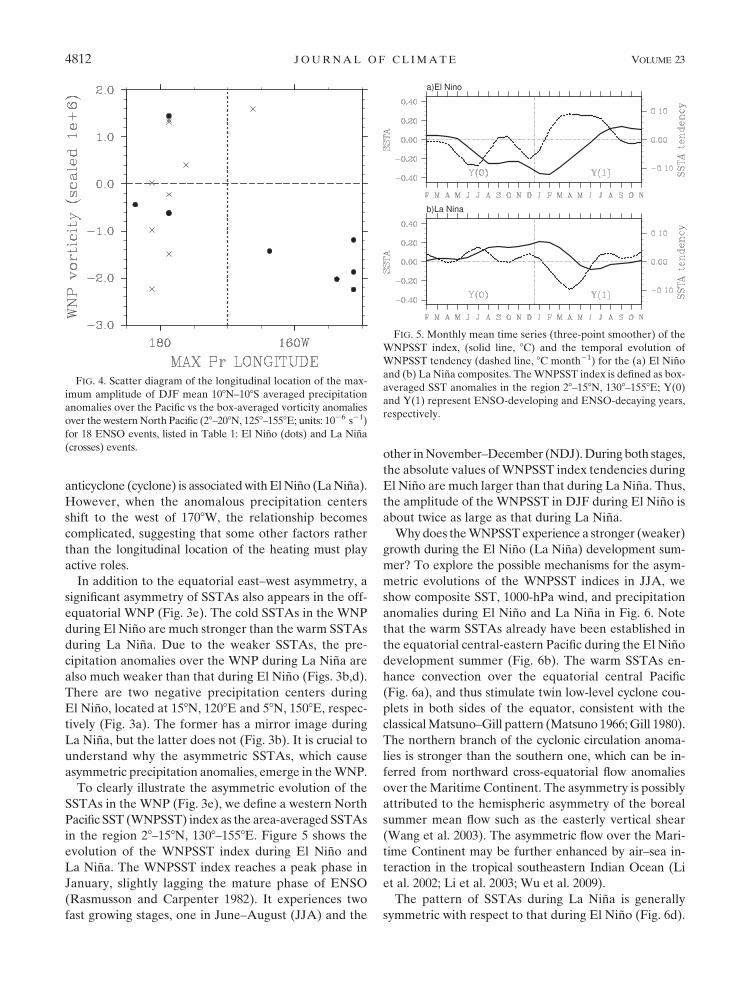
we show composite precipitation and SST anomalies and
their asymmetric components in Fig. 3. Positive precipi-
tation anomalies associated with El Nino extend from
the equatorial central Pacific to the far eastern Pacific.
In contrast, negative precipitation anomalies associated
with La Nina are restricted to the west of 1408W and
their center is located farther west, compared with the
El Nino counterpart. Their asymmetric component ex-
hibits a zonal dipole pattern, with a positive (negative)
pole over the equatorial central-eastern (western) Pacific
(Fig. 3f).
The SSTAs over the tropical central-eastern Pacific
also present an asymmetric feature. The positive SSTAs
in the tropical eastern Pacific during El Nino are stron-
ger than the negative SSTAs during La Nina, whereas
the negative SSTAs during La Nina are stronger in the
tropical central Pacific and extend farther westward. As
a result, the asymmetric component of the SSTAs also
shows a zonal dipole pattern in the equatorial Pacific
(Fig. 3e).
The above results imply that the asymmetry of the
WNP circulation anomalies may be partially caused by
the zonal asymmetries of the precipitation and SST
anomalies between El Nino and La Nina. The anoma-
lous SST and precipitation centers shift farther west-
ward during La Nina. It is likely that the westward shift
of the precipitation anomalies during La Nina causes
the twin anomalous anticyclone couplets expanding into
the tropical western Pacific. As a result, the center of the
WNPC is pushed farther to the SCS (Fig. 1b).
To illustrate the effect of the zonal asymmetry of the
anomalous precipitation center between El Nino and
La Nina on the WNP circulations, a scatter diagram of
the WNP vorticity versus the longitudinal location of the
anomalous precipitation center over the equatorial cen-
tral Pacific is shown in Fig. 4. Five out of nine El Nino
events have positive convection centers located east of
1708W, while nearly all La Nina events have negative
convection centers located near the date line. It is in-
teresting to note that, when the precipitation centers are
located to the east of 1708W, there is a close relationship
between the sign of the WNP vorticity anomalies and the
SSTA in the equatorial central-eastern Pacific; namely, an
FIG. 3. As in Figs. 1a–c but for (a),(c),(e) SST anomalies (8C) and (b),(d),(f) precipitation anomalies (mm day21).
15 SEPTEMBER 2010 W U E T A L . 4811
anticyclone (cyclone) is associated with El Nino (La Nina).
However, when the anomalous precipitation centers
shift to the west of 1708W, the relationship becomes
complicated, suggesting that some other factors rather
than the longitudinal location of the heating must play
active roles.
In addition to the equatorial east–west asymmetry, a
significant asymmetry of SSTAs also appears in the off-
equatorial WNP (Fig. 3e). The cold SSTAs in the WNP
during El Nino are much stronger than the warm SSTAs
during La Nina. Due to the weaker SSTAs, the pre-
cipitation anomalies over the WNP during La Nina are
also much weaker than that during El Nino (Figs. 3b,d).
There are two negative precipitation centers during
El Nino, located at 158N, 1208E and 58N, 1508E, respec-
tively (Fig. 3a). The former has a mirror image during
La Nina, but the latter does not (Fig. 3b). It is crucial to
understand why the asymmetric SSTAs, which cause
asymmetric precipitation anomalies, emerge in the WNP.
To clearly illustrate the asymmetric evolution of the
SSTAs in the WNP (Fig. 3e), we define a western North
Pacific SST (WNPSST) index as the area-averaged SSTAs
in the region 28–158N, 1308–1558E. Figure 5 shows the
evolution of the WNPSST index during El Nino and
La Nina. The WNPSST index reaches a peak phase in
January, slightly lagging the mature phase of ENSO
(Rasmusson and Carpenter 1982). It experiences two
fast growing stages, one in June–August (JJA) and the
other in November–December (NDJ). During both stages,
the absolute values of WNPSST index tendencies during
El Nino are much larger than that during La Nina. Thus,
the amplitude of the WNPSST in DJF during El Nino is
about twice as large as that during La Nina.
Why does the WNPSST experience a stronger (weaker)
growth during the El Nino (La Nina) development sum-
mer? To explore the possible mechanisms for the asym-
metric evolutions of the WNPSST indices in JJA, we
show composite SST, 1000-hPa wind, and precipitation
anomalies during El Nino and La Nina in Fig. 6. Note
that the warm SSTAs already have been established in
the equatorial central-eastern Pacific during the El Nino
development summer (Fig. 6b). The warm SSTAs en-
hance convection over the equatorial central Pacific
(Fig. 6a), and thus stimulate twin low-level cyclone cou-
plets in both sides of the equator, consistent with the
classical Matsuno–Gill pattern (Matsuno 1966; Gill 1980).
The northern branch of the cyclonic circulation anoma-
lies is stronger than the southern one, which can be in-
ferred from northward cross-equatorial flow anomalies
over the Maritime Continent. The asymmetry is possibly
attributed to the hemispheric asymmetry of the boreal
summer mean flow such as the easterly vertical shear
(Wang et al. 2003). The asymmetric flow over the Mari-
time Continent may be further enhanced by air–sea in-
teraction in the tropical southeastern Indian Ocean (Li
et al. 2002; Li et al. 2003; Wu et al. 2009).
The pattern of SSTAs during La Nina is generally
symmetric with respect to that during El Nino (Fig. 6d).
FIG. 4. Scatter diagram of the longitudinal location of the max-
imum amplitude of DJF mean 108N–108S averaged precipitation
anomalies over the Pacific vs the box-averaged vorticity anomalies
over the western North Pacific (28–208N, 1258–1558E; units: 1026 s21)
for 18 ENSO events, listed in Table 1: El Nino (dots) and La Nina
(crosses) events.
FIG. 5. Monthly mean time series (three-point smoother) of the
WNPSST index, (solid line, 8C) and the temporal evolution of
WNPSST tendency (dashed line, 8C month21) for the (a) El Nino
and (b) La Nina composites. The WNPSST index is defined as box-
averaged SST anomalies in the region 28–158N, 1308–1558E; Y(0)
and Y(1) represent ENSO-developing and ENSO-decaying years,
respectively.
4812 J O U R N A L O F C L I M A T E VOLUME 23
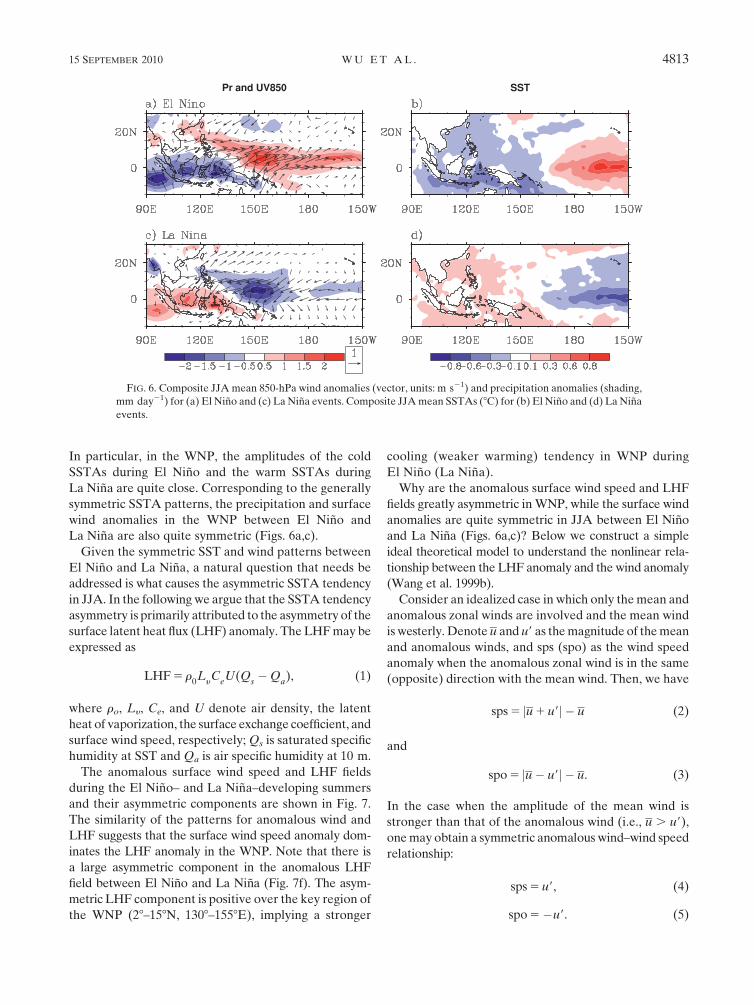
In particular, in the WNP, the amplitudes of the cold
SSTAs during El Nino and the warm SSTAs during
La Nina are quite close. Corresponding to the generally
symmetric SSTA patterns, the precipitation and surface
wind anomalies in the WNP between El Nino and
La Nina are also quite symmetric (Figs. 6a,c).
Given the symmetric SST and wind patterns between
El Nino and La Nina, a natural question that needs be
addressed is what causes the asymmetric SSTA tendency
in JJA. In the following we argue that the SSTA tendency
asymmetry is primarily attributed to the asymmetry of the
surface latent heat flux (LHF) anomaly. The LHF may be
expressed as
LHF 5 r0L
yC
eU(Q
s�Q
a), (1)
where ro, Ly, Ce, and U denote air density, the latent
heat of vaporization, the surface exchange coefficient, and
surface wind speed, respectively; Qs is saturated specific
humidity at SST and Qa is air specific humidity at 10 m.
The anomalous surface wind speed and LHF fields
during the El Nino– and La Nina–developing summers
and their asymmetric components are shown in Fig. 7.
The similarity of the patterns for anomalous wind and
LHF suggests that the surface wind speed anomaly dom-
inates the LHF anomaly in the WNP. Note that there is
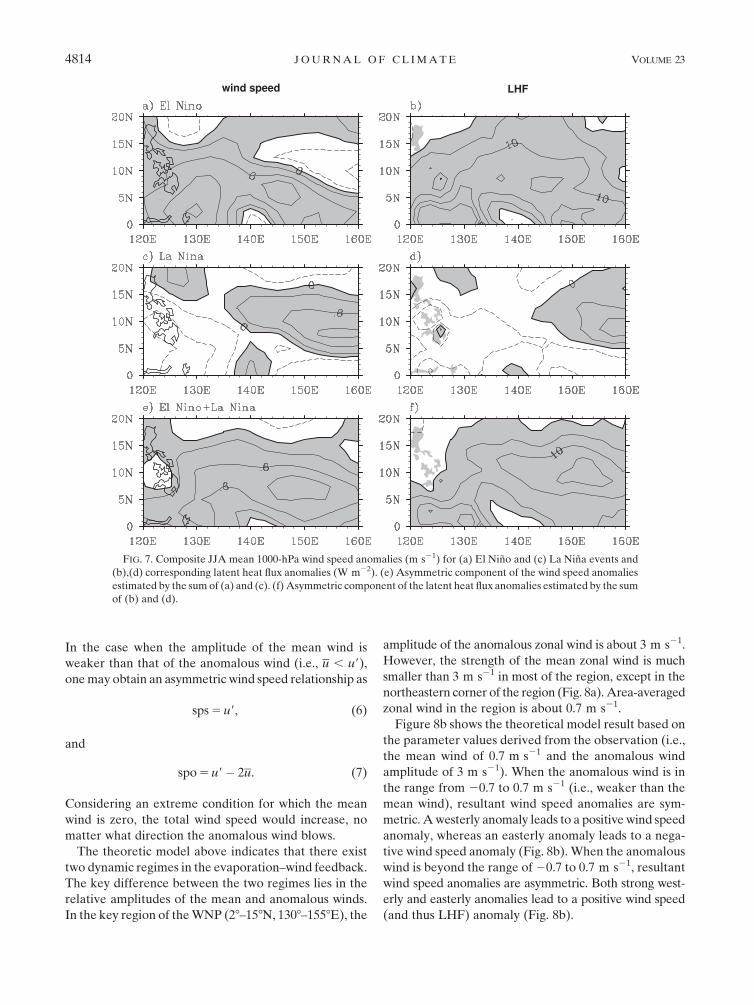
a large asymmetric component in the anomalous LHF
field between El Nino and La Nina (Fig. 7f). The asym-
metric LHF component is positive over the key region of
the WNP (28–158N, 1308–1558E), implying a stronger
cooling (weaker warming) tendency in WNP during
El Nino (La Nina).
Why are the anomalous surface wind speed and LHF
fields greatly asymmetric in WNP, while the surface wind
anomalies are quite symmetric in JJA between El Nino
and La Nina (Figs. 6a,c)? Below we construct a simple
ideal theoretical model to understand the nonlinear rela-
tionship between the LHF anomaly and the wind anomaly
(Wang et al. 1999b).
Consider an idealized case in which only the mean and
anomalous zonal winds are involved and the mean wind
is westerly. Denote u and u9 as the magnitude of the mean
and anomalous winds, and sps (spo) as the wind speed
anomaly when the anomalous zonal wind is in the same
(opposite) direction with the mean wind. Then, we have
sps 5 u 1 u9j j � u (2)
and
spo 5 u� u9j j � u. (3)
In the case when the amplitude of the mean wind is
stronger than that of the anomalous wind (i.e., u . u9),
one may obtain a symmetric anomalous wind–wind speed
relationship:
sps 5 u9, (4)
spo 5�u9. (5)
FIG. 6. Composite JJA mean 850-hPa wind anomalies (vector, units: m s21) and precipitation anomalies (shading,
mm day21) for (a) El Nino and (c) La Nina events. Composite JJA mean SSTAs (8C) for (b) El Nino and (d) La Nina
events.
15 SEPTEMBER 2010 W U E T A L . 4813
In the case when the amplitude of the mean wind is
weaker than that of the anomalous wind (i.e., u , u9),
one may obtain an asymmetric wind speed relationship as
sps 5 u9, (6)
and
spo 5 u9� 2u. (7)
Considering an extreme condition for which the mean
wind is zero, the total wind speed would increase, no
matter what direction the anomalous wind blows.
The theoretic model above indicates that there exist
two dynamic regimes in the evaporation–wind feedback.
The key difference between the two regimes lies in the
relative amplitudes of the mean and anomalous winds.
In the key region of the WNP (28–158N, 1308–1558E), the
amplitude of the anomalous zonal wind is about 3 m s21.
However, the strength of the mean zonal wind is much
smaller than 3 m s21 in most of the region, except in the
northeastern corner of the region (Fig. 8a). Area-averaged
zonal wind in the region is about 0.7 m s21.
Figure 8b shows the theoretical model result based on
the parameter values derived from the observation (i.e.,
the mean wind of 0.7 m s21 and the anomalous wind
amplitude of 3 m s21). When the anomalous wind is in
the range from 20.7 to 0.7 m s21 (i.e., weaker than the
mean wind), resultant wind speed anomalies are sym-
metric. A westerly anomaly leads to a positive wind speed
anomaly, whereas an easterly anomaly leads to a nega-
tive wind speed anomaly (Fig. 8b). When the anomalous
wind is beyond the range of 20.7 to 0.7 m s21, resultant
wind speed anomalies are asymmetric. Both strong west-
erly and easterly anomalies lead to a positive wind speed
(and thus LHF) anomaly (Fig. 8b).
FIG. 7. Composite JJA mean 1000-hPa wind speed anomalies (m s21) for (a) El Nino and (c) La Nina events and
(b),(d) corresponding latent heat flux anomalies (W m22). (e) Asymmetric component of the wind speed anomalies
estimated by the sum of (a) and (c). (f) Asymmetric component of the latent heat flux anomalies estimated by the sum
of (b) and (d).
4814 J O U R N A L O F C L I M A T E VOLUME 23
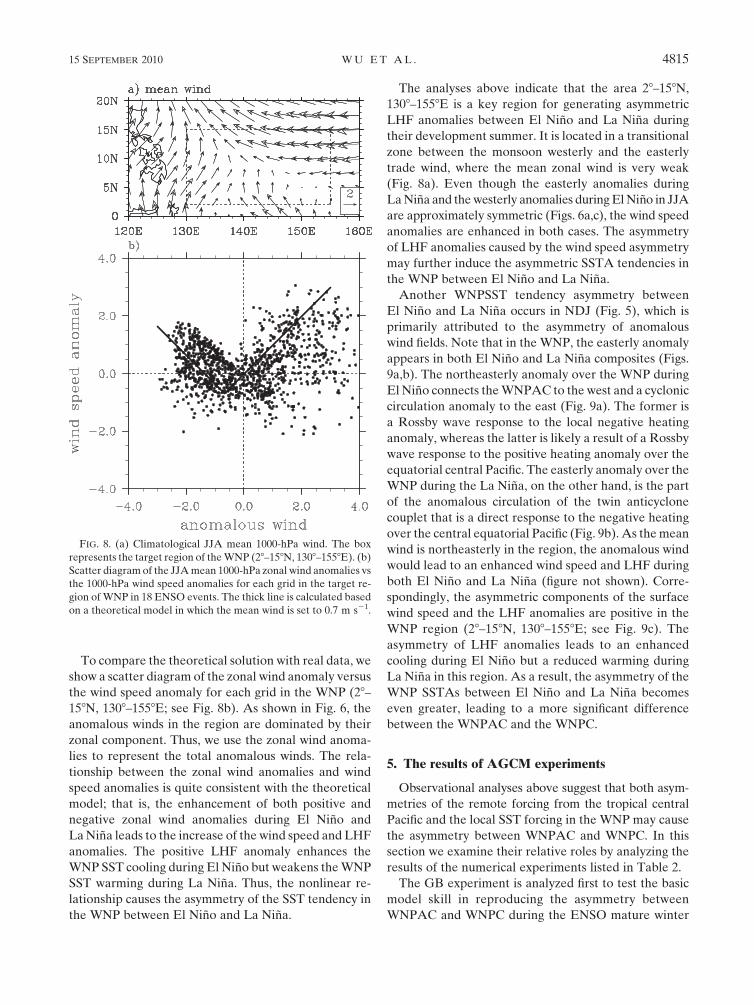
To compare the theoretical solution with real data, we
show a scatter diagram of the zonal wind anomaly versus
the wind speed anomaly for each grid in the WNP (28–
158N, 1308–1558E; see Fig. 8b). As shown in Fig. 6, the
anomalous winds in the region are dominated by their
zonal component. Thus, we use the zonal wind anoma-
lies to represent the total anomalous winds. The rela-
tionship between the zonal wind anomalies and wind
speed anomalies is quite consistent with the theoretical
model; that is, the enhancement of both positive and
negative zonal wind anomalies during El Nino and
La Nina leads to the increase of the wind speed and LHF
anomalies. The positive LHF anomaly enhances the
WNP SST cooling during El Nino but weakens the WNP
SST warming during La Nina. Thus, the nonlinear re-
lationship causes the asymmetry of the SST tendency in
the WNP between El Nino and La Nina.
The analyses above indicate that the area 28–158N,
1308–1558E is a key region for generating asymmetric
LHF anomalies between El Nino and La Nina during
their development summer. It is located in a transitional
zone between the monsoon westerly and the easterly
trade wind, where the mean zonal wind is very weak
(Fig. 8a). Even though the easterly anomalies during
La Nina and the westerly anomalies during El Nino in JJA
are approximately symmetric (Figs. 6a,c), the wind speed
anomalies are enhanced in both cases. The asymmetry
of LHF anomalies caused by the wind speed asymmetry
may further induce the asymmetric SSTA tendencies in
the WNP between El Nino and La Nina.
Another WNPSST tendency asymmetry between
El Nino and La Nina occurs in NDJ (Fig. 5), which is
primarily attributed to the asymmetry of anomalous
wind fields. Note that in the WNP, the easterly anomaly
appears in both El Nino and La Nina composites (Figs.
9a,b). The northeasterly anomaly over the WNP during
El Nino connects the WNPAC to the west and a cyclonic
circulation anomaly to the east (Fig. 9a). The former is
a Rossby wave response to the local negative heating
anomaly, whereas the latter is likely a result of a Rossby
wave response to the positive heating anomaly over the
equatorial central Pacific. The easterly anomaly over the
WNP during the La Nina, on the other hand, is the part
of the anomalous circulation of the twin anticyclone
couplet that is a direct response to the negative heating
over the central equatorial Pacific (Fig. 9b). As the mean
wind is northeasterly in the region, the anomalous wind
would lead to an enhanced wind speed and LHF during
both El Nino and La Nina (figure not shown). Corre-
spondingly, the asymmetric components of the surface
wind speed and the LHF anomalies are positive in the
WNP region (28–158N, 1308–1558E; see Fig. 9c). The
asymmetry of LHF anomalies leads to an enhanced
cooling during El Nino but a reduced warming during
La Nina in this region. As a result, the asymmetry of the
WNP SSTAs between El Nino and La Nina becomes
even greater, leading to a more significant difference
between the WNPAC and the WNPC.
5. The results of AGCM experiments
Observational analyses above suggest that both asym-
metries of the remote forcing from the tropical central
Pacific and the local SST forcing in the WNP may cause
the asymmetry between WNPAC and WNPC. In this
section we examine their relative roles by analyzing the
results of the numerical experiments listed in Table 2.
The GB experiment is analyzed first to test the basic
model skill in reproducing the asymmetry between
WNPAC and WNPC during the ENSO mature winter
FIG. 8. (a) Climatological JJA mean 1000-hPa wind. The box
represents the target region of the WNP (28–158N, 1308–1558E). (b)
Scatter diagram of the JJA mean 1000-hPa zonal wind anomalies vs
the 1000-hPa wind speed anomalies for each grid in the target re-
gion of WNP in 18 ENSO events. The thick line is calculated based
on a theoretical model in which the mean wind is set to 0.7 m s21.
15 SEPTEMBER 2010 W U E T A L . 4815
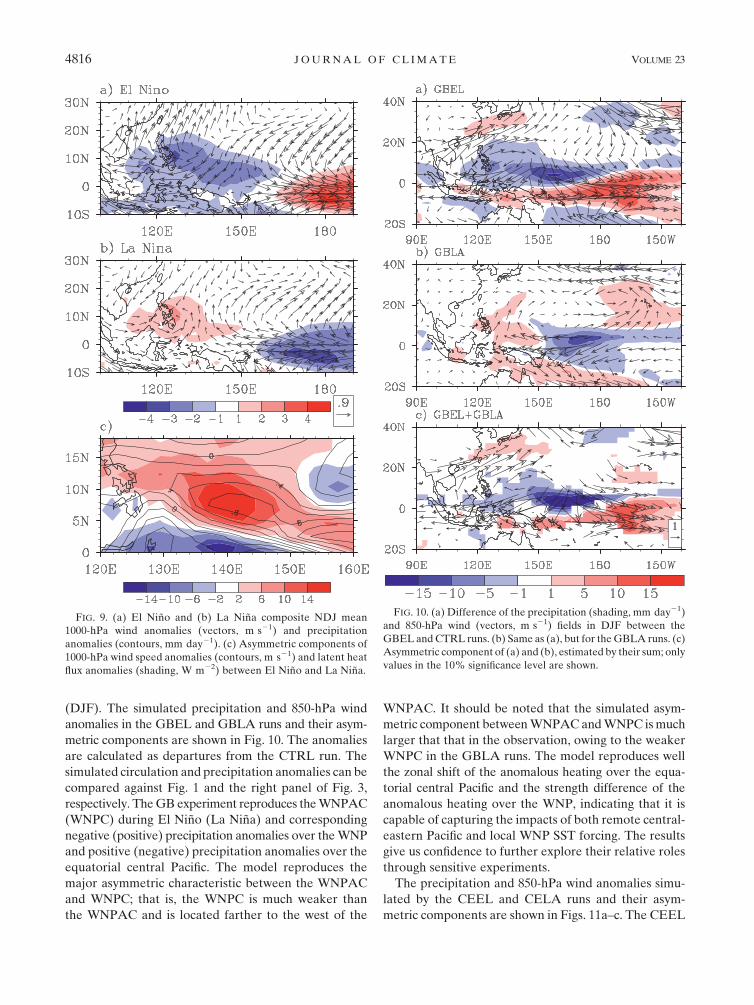
(DJF). The simulated precipitation and 850-hPa wind
anomalies in the GBEL and GBLA runs and their asym-
metric components are shown in Fig. 10. The anomalies
are calculated as departures from the CTRL run. The
simulated circulation and precipitation anomalies can be
compared against Fig. 1 and the right panel of Fig. 3,
respectively. The GB experiment reproduces the WNPAC
(WNPC) during El Nino (La Nina) and corresponding
negative (positive) precipitation anomalies over the WNP
and positive (negative) precipitation anomalies over the
equatorial central Pacific. The model reproduces the
major asymmetric characteristic between the WNPAC
and WNPC; that is, the WNPC is much weaker than
the WNPAC and is located farther to the west of the
WNPAC. It should be noted that the simulated asym-
metric component between WNPAC and WNPC is much
larger that that in the observation, owing to the weaker
WNPC in the GBLA runs. The model reproduces well
the zonal shift of the anomalous heating over the equa-
torial central Pacific and the strength difference of the
anomalous heating over the WNP, indicating that it is
capable of capturing the impacts of both remote central-
eastern Pacific and local WNP SST forcing. The results
give us confidence to further explore their relative roles
through sensitive experiments.
The precipitation and 850-hPa wind anomalies simu-
lated by the CEEL and CELA runs and their asym-
metric components are shown in Figs. 11a–c. The CEEL
FIG. 9. (a) El Nino and (b) La Nina composite NDJ mean
1000-hPa wind anomalies (vectors, m s21) and precipitation
anomalies (contours, mm day21). (c) Asymmetric components of
1000-hPa wind speed anomalies (contours, m s21) and latent heat
flux anomalies (shading, W m22) between El Nino and La Nina.
FIG. 10. (a) Difference of the precipitation (shading, mm day21)
and 850-hPa wind (vectors, m s21) fields in DJF between the
GBEL and CTRL runs. (b) Same as (a), but for the GBLA runs. (c)
Asymmetric component of (a) and (b), estimated by their sum; only
values in the 10% significance level are shown.
4816 J O U R N A L O F C L I M A T E VOLUME 23
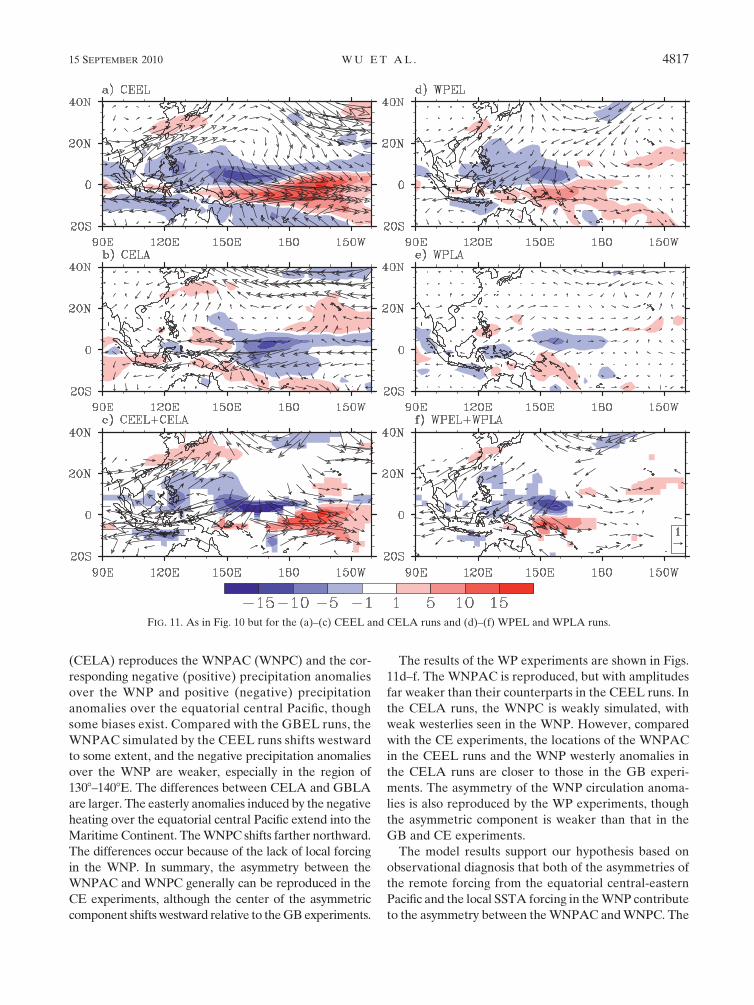
(CELA) reproduces the WNPAC (WNPC) and the cor-
responding negative (positive) precipitation anomalies
over the WNP and positive (negative) precipitation
anomalies over the equatorial central Pacific, though
some biases exist. Compared with the GBEL runs, the
WNPAC simulated by the CEEL runs shifts westward
to some extent, and the negative precipitation anomalies
over the WNP are weaker, especially in the region of
1308–1408E. The differences between CELA and GBLA
are larger. The easterly anomalies induced by the negative
heating over the equatorial central Pacific extend into the
Maritime Continent. The WNPC shifts farther northward.
The differences occur because of the lack of local forcing
in the WNP. In summary, the asymmetry between the
WNPAC and WNPC generally can be reproduced in the
CE experiments, although the center of the asymmetric
component shifts westward relative to the GB experiments.
The results of the WP experiments are shown in Figs.
11d–f. The WNPAC is reproduced, but with amplitudes
far weaker than their counterparts in the CEEL runs. In
the CELA runs, the WNPC is weakly simulated, with
weak westerlies seen in the WNP. However, compared
with the CE experiments, the locations of the WNPAC
in the CEEL runs and the WNP westerly anomalies in
the CELA runs are closer to those in the GB experi-
ments. The asymmetry of the WNP circulation anoma-
lies is also reproduced by the WP experiments, though
the asymmetric component is weaker than that in the
GB and CE experiments.
The model results support our hypothesis based on
observational diagnosis that both of the asymmetries of
the remote forcing from the equatorial central-eastern
Pacific and the local SSTA forcing in the WNP contribute
to the asymmetry between the WNPAC and WNPC. The
FIG. 11. As in Fig. 10 but for the (a)–(c) CEEL and CELA runs and (d)–(f) WPEL and WPLA runs.
15 SEPTEMBER 2010 W U E T A L . 4817
numerical experiments demonstrate that the remote forc-
ing from the equatorial central-eastern Pacific play greater
roles than the local WNP SST.
6. Impact of the asymmetry on ENSO phasereversal
Previous studies noted the essential role of equatorial
zonal wind stress over the equatorial western Pacific in
ENSO phase reversal (Weisberg and Wang 1997a,b; Kim
and Lau 2001; Lau and Wu 2001; Kug and Kang 2006).
To investigate relationship between the WNPC/WNPAC
and the zonal wind stress anomalies over the equatorial
western Pacific, we show the scatter diagram of the box-
averaged zonal pseudo–wind stress anomalies over the
equatorial western Pacific (58S–58N, 1258–1558E) versus
850-hPa vorticity anomalies over the WNP (28–208N,
1258–1558E; see Fig. 12). Their correlation coefficient
reaches 0.79, which is statistically significant at the 1%
level, indicating that the WNP vorticity accounts for
about half of the variance of the zonal wind stress over
the equatorial western Pacific during the ENSO mature
winter.
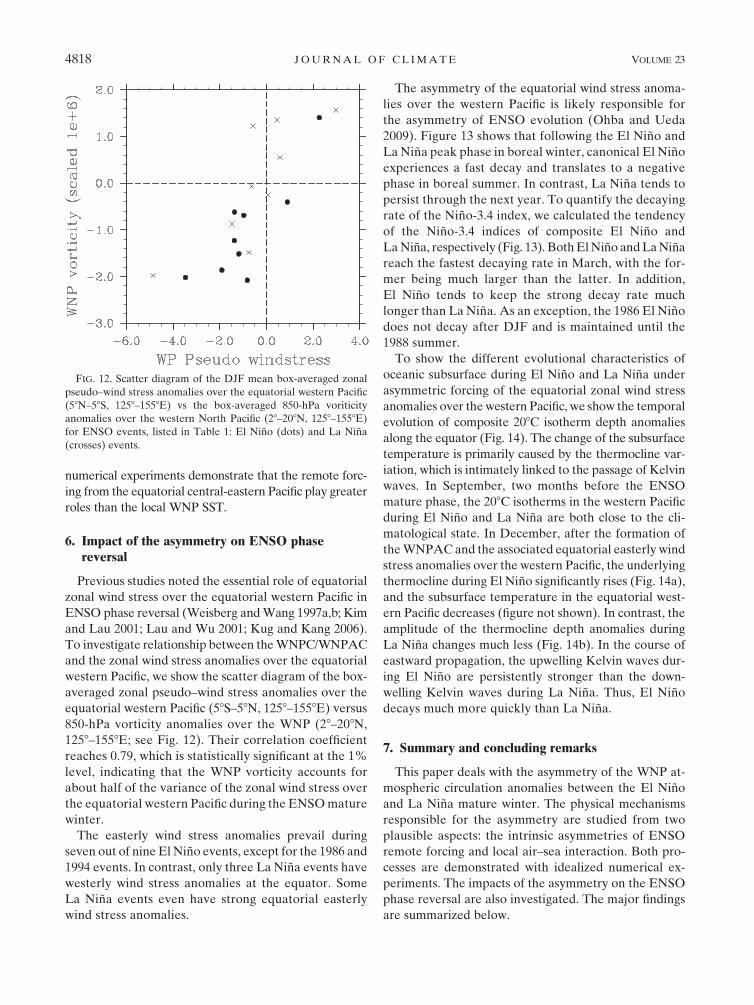
The easterly wind stress anomalies prevail during
seven out of nine El Nino events, except for the 1986 and
1994 events. In contrast, only three La Nina events have
westerly wind stress anomalies at the equator. Some
La Nina events even have strong equatorial easterly
wind stress anomalies.
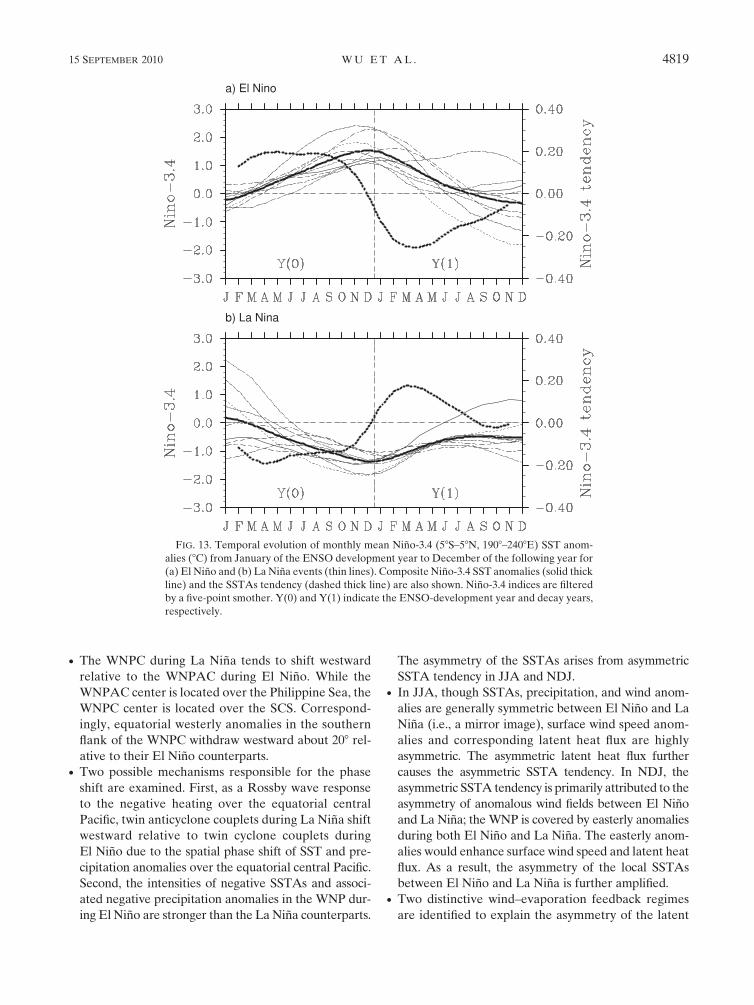
The asymmetry of the equatorial wind stress anoma-
lies over the western Pacific is likely responsible for
the asymmetry of ENSO evolution (Ohba and Ueda
2009). Figure 13 shows that following the El Nino and
La Nina peak phase in boreal winter, canonical El Nino
experiences a fast decay and translates to a negative
phase in boreal summer. In contrast, La Nina tends to
persist through the next year. To quantify the decaying
rate of the Nino-3.4 index, we calculated the tendency
of the Nino-3.4 indices of composite El Nino and
La Nina, respectively (Fig. 13). Both El Nino and La Nina
reach the fastest decaying rate in March, with the for-
mer being much larger than the latter. In addition,
El Nino tends to keep the strong decay rate much
longer than La Nina. As an exception, the 1986 El Nino
does not decay after DJF and is maintained until the
1988 summer.
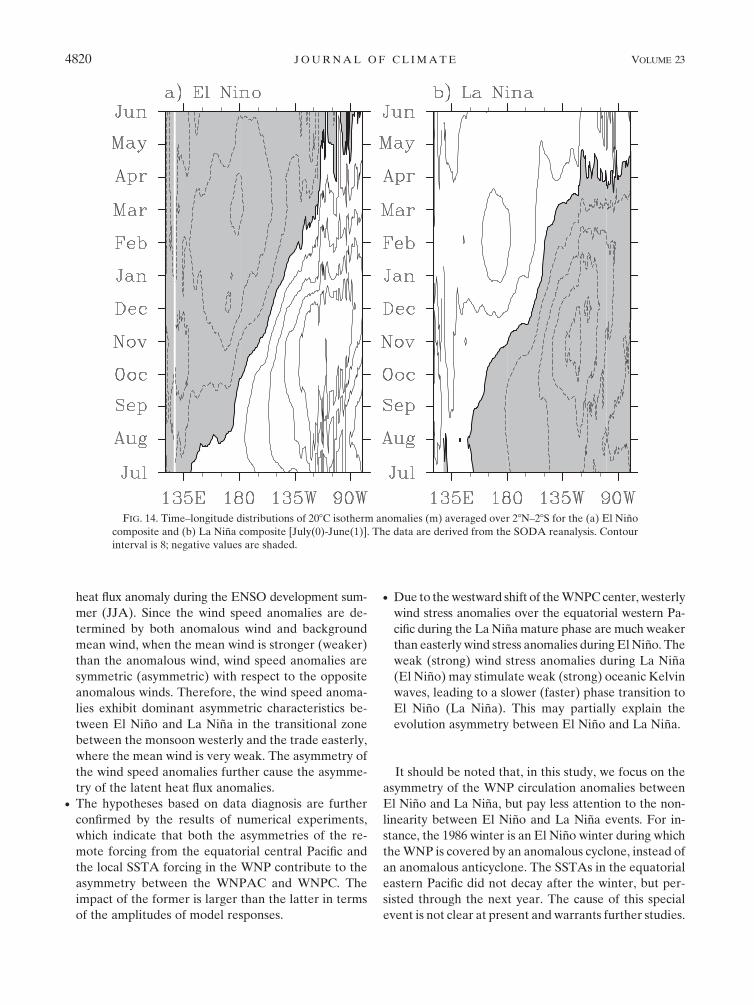
To show the different evolutional characteristics of
oceanic subsurface during El Nino and La Nina under
asymmetric forcing of the equatorial zonal wind stress
anomalies over the western Pacific, we show the temporal
evolution of composite 208C isotherm depth anomalies
along the equator (Fig. 14). The change of the subsurface
temperature is primarily caused by the thermocline var-
iation, which is intimately linked to the passage of Kelvin
waves. In September, two months before the ENSO
mature phase, the 208C isotherms in the western Pacific
during El Nino and La Nina are both close to the cli-
matological state. In December, after the formation of
the WNPAC and the associated equatorial easterly wind
stress anomalies over the western Pacific, the underlying
thermocline during El Nino significantly rises (Fig. 14a),
and the subsurface temperature in the equatorial west-
ern Pacific decreases (figure not shown). In contrast, the
amplitude of the thermocline depth anomalies during
La Nina changes much less (Fig. 14b). In the course of
eastward propagation, the upwelling Kelvin waves dur-
ing El Nino are persistently stronger than the down-
welling Kelvin waves during La Nina. Thus, El Nino
decays much more quickly than La Nina.
7. Summary and concluding remarks
This paper deals with the asymmetry of the WNP at-
mospheric circulation anomalies between the El Nino
and La Nina mature winter. The physical mechanisms
responsible for the asymmetry are studied from two
plausible aspects: the intrinsic asymmetries of ENSO
remote forcing and local air–sea interaction. Both pro-
cesses are demonstrated with idealized numerical ex-
periments. The impacts of the asymmetry on the ENSO
phase reversal are also investigated. The major findings
are summarized below.
FIG. 12. Scatter diagram of the DJF mean box-averaged zonal
pseudo–wind stress anomalies over the equatorial western Pacific
(58N–58S, 1258–1558E) vs the box-averaged 850-hPa voriticity
anomalies over the western North Pacific (28–208N, 1258–1558E)
for ENSO events, listed in Table 1: El Nino (dots) and La Nina
(crosses) events.
4818 J O U R N A L O F C L I M A T E VOLUME 23
d The WNPC during La Nina tends to shift westward
relative to the WNPAC during El Nino. While the
WNPAC center is located over the Philippine Sea, the
WNPC center is located over the SCS. Correspond-
ingly, equatorial westerly anomalies in the southern
flank of the WNPC withdraw westward about 208 rel-
ative to their El Nino counterparts.d Two possible mechanisms responsible for the phase
shift are examined. First, as a Rossby wave response
to the negative heating over the equatorial central
Pacific, twin anticyclone couplets during La Nina shift
westward relative to twin cyclone couplets during
El Nino due to the spatial phase shift of SST and pre-
cipitation anomalies over the equatorial central Pacific.
Second, the intensities of negative SSTAs and associ-
ated negative precipitation anomalies in the WNP dur-
ing El Nino are stronger than the La Nina counterparts.
The asymmetry of the SSTAs arises from asymmetric
SSTA tendency in JJA and NDJ.d In JJA, though SSTAs, precipitation, and wind anom-
alies are generally symmetric between El Nino and La
Nina (i.e., a mirror image), surface wind speed anom-
alies and corresponding latent heat flux are highly
asymmetric. The asymmetric latent heat flux further
causes the asymmetric SSTA tendency. In NDJ, the
asymmetric SSTA tendency is primarily attributed to the
asymmetry of anomalous wind fields between El Nino
and La Nina; the WNP is covered by easterly anomalies
during both El Nino and La Nina. The easterly anom-
alies would enhance surface wind speed and latent heat
flux. As a result, the asymmetry of the local SSTAs
between El Nino and La Nina is further amplified.d Two distinctive wind–evaporation feedback regimes
are identified to explain the asymmetry of the latent
FIG. 13. Temporal evolution of monthly mean Nino-3.4 (58S–58N, 1908–2408E) SST anom-
alies (8C) from January of the ENSO development year to December of the following year for
(a) El Nino and (b) La Nina events (thin lines). Composite Nino-3.4 SST anomalies (solid thick
line) and the SSTAs tendency (dashed thick line) are also shown. Nino-3.4 indices are filtered
by a five-point smother. Y(0) and Y(1) indicate the ENSO-development year and decay years,
respectively.
15 SEPTEMBER 2010 W U E T A L . 4819
heat flux anomaly during the ENSO development sum-
mer (JJA). Since the wind speed anomalies are de-
termined by both anomalous wind and background
mean wind, when the mean wind is stronger (weaker)
than the anomalous wind, wind speed anomalies are
symmetric (asymmetric) with respect to the opposite
anomalous winds. Therefore, the wind speed anoma-
lies exhibit dominant asymmetric characteristics be-
tween El Nino and La Nina in the transitional zone
between the monsoon westerly and the trade easterly,
where the mean wind is very weak. The asymmetry of
the wind speed anomalies further cause the asymme-
try of the latent heat flux anomalies.d The hypotheses based on data diagnosis are further
confirmed by the results of numerical experiments,
which indicate that both the asymmetries of the re-
mote forcing from the equatorial central Pacific and
the local SSTA forcing in the WNP contribute to the
asymmetry between the WNPAC and WNPC. The
impact of the former is larger than the latter in terms
of the amplitudes of model responses.
d Due to the westward shift of the WNPC center, westerly
wind stress anomalies over the equatorial western Pa-
cific during the La Nina mature phase are much weaker
than easterly wind stress anomalies during El Nino. The
weak (strong) wind stress anomalies during La Nina
(El Nino) may stimulate weak (strong) oceanic Kelvin
waves, leading to a slower (faster) phase transition to
El Nino (La Nina). This may partially explain the
evolution asymmetry between El Nino and La Nina.
It should be noted that, in this study, we focus on the
asymmetry of the WNP circulation anomalies between
El Nino and La Nina, but pay less attention to the non-
linearity between El Nino and La Nina events. For in-
stance, the 1986 winter is an El Nino winter during which
the WNP is covered by an anomalous cyclone, instead of
an anomalous anticyclone. The SSTAs in the equatorial
eastern Pacific did not decay after the winter, but per-
sisted through the next year. The cause of this special
event is not clear at present and warrants further studies.
FIG. 14. Time–longitude distributions of 208C isotherm anomalies (m) averaged over 28N–28S for the (a) El Nino
composite and (b) La Nina composite [July(0)-June(1)]. The data are derived from the SODA reanalysis. Contour
interval is 8; negative values are shaded.
4820 J O U R N A L O F C L I M A T E VOLUME 23
While the endeavor in this regard has been puzzling
owing to the limitation of sample size, a long-term coupled
model simulation may help us to understand the issue.
In addition, we only focus on the tropical processes in
our analysis above. It was found that during the fall of
El Nino events, the East Asian trough deepens, which
may enhance cold air outbreaks and initiate the WNPAC
(Wang and Zhang 2002). In fact, by checking the com-
posite maps for the September–October mean 500-hPa
geopotential height anomalies for El Nino and La Nina,
we note that the deepening of the East Asian trough
during El Nino is much stronger than the shoaling of
the trough during La Nina. This asymmetric character-
istic may also contribute to the asymmetry between the
WNPAC and WNPC. More detailed analysis of this
midlatitude impact is needed in future work.
Acknowledgments. This work was supported by NSFC
Grants 40628006, 40821092, and 40523001, the National
Basic Research Program of China (2006CB403603),
RandD Special Fund for Public Welfare Industry (me-
teorology; GYHY200706010, GYHY200806010). TL
was supported by ONR Grants N000140710145 and
N000140810256 and by the International Pacific Re-
search Center, which is sponsored by the Japan Agency
for Marine-Earth Science and Technology (JAMSTEC),
NASA (NNX07AG53G), and NOAA (NA17RJ1230).
REFERENCES
An, S.-I., and F.-F. Jin, 2004: Nonlinearity and asymmetry of
ENSO. J. Climate, 17, 2399–2412.
——, Y. G. Ham, J. S. Kug, F. F. Jin, and I. S. Kang, 2005: El Nino–
La Nina asymmetry in the Coupled Model Intercomparison
Project simulations. J. Climate, 18, 2617–2627.
Burgers, G., and D. B. Stephenson, 1999: The normality of El Nino.
Geophys. Res. Lett., 26, 1027–1030.
Carton, J. A., G. Chepurin, and X. H. Cao, 2000: A Simple Ocean
Data Assimilation analysis of the global upper ocean 1950–95.
Part II: Results. J. Phys. Oceanogr., 30, 311–326.
Chang, C. P., Y. S. Zhang, and T. Li, 2000a: Interannual and in-
terdecadal variations of the East Asian summer monsoon and
tropical Pacific SSTs. Part I: Roles of the subtropical ridge.
J. Climate, 13, 4310–4325.
——, ——, and ——, 2000b: Interannual and interdecadal varia-
tions of the East Asian summer monsoon and tropical Pacific
SSTs. Part II: Meridional structure of the monsoon. J. Climate,
13, 4326–4340.
Chang, P., J. Li, and H. Li, 1997: A decadal climate variation in
the tropical Atlantic Ocean from thermodynamic air–sea in-
teractions. Nature, 385, 516–518.
Chen, J. M., T. Li, and C. F. Shih, 2007: Fall persistence barrier of
sea surface temperature in the South China Sea associated
with ENSO. J. Climate, 20, 158–172.
Chen, M., P. Xie, J. E. Janowiak, and P. A. Arkin, 2002: Global
land precipitation: A 50-yr monthly analysis based on gauge
observations. J. Hydrometeor., 3, 249–266.
Chou, C., 2004: Establishment of the low-level wind anomalies over
the western North Pacific during ENSO development. J. Cli-
mate, 17, 2195–2212.
Duchon, C., 1979: Lanczos filtering in one and two dimensions.
J. Appl. Meteor., 18, 1016–1022.
Gill, A. E., 1980: Some simple solutions for heat-induced tropical
circulation. Quart. J. Roy. Meteor. Soc., 106, 447–462.
Hoerling, M. P., A. Kumar, and M. Zhong, 1997: El Nino, La Nina,
and the nonlinearity of their teleconnections. J. Climate, 10,
1769–1786.
Jin, F.-F., S.-I. An, A. Timmermann, and J. Zhao, 2003: Strong
El Nino events and nonlinear dynamical heating. Geophys.
Res. Lett., 30, 1120, doi:10.1029/2002GL016356.
Kalnay, E., and Coauthors, 1996: The NCEP/NCAR 40-Year Re-
analysis Project. Bull. Amer. Meteor. Soc., 77, 437–471.
Kang, I.-S., and J.-S. Kug, 2002: El Nino and La Nina sea surface
temperature anomalies: Asymmetry characteristics associated
with their wind stress anomalies. J. Geophys. Res., 107, 4372,
doi:10.1029/2001JD000393.
Kim, K. M., and K. M. Lau, 2001: Dynamics of monsoon-induced
biennial variability in ENSO. Geophys. Res. Lett., 28, 315–318.
Kug, J.-S., and I.-S. Kang, 2006: Interactive feedback between
ENSO and the Indian Ocean. J. Climate, 19, 1784–1801.
Lau, K. M., and H. T. Wu, 2001: Principal modes of rainfall–SST
variability of the Asian summer monsoon: A reassessment of
monsoon–ENSO relationship. J. Climate, 14, 2880–2895.
Lau, N.-C., and M. J. Nath, 2000: Impact of ENSO on the vari-
ability of the Asian–Australian monsoons as simulated in
GCM experiments. J. Climate, 13, 4287–4309.
——, and ——, 2003: Atmosphere–ocean variations in the Indo-
Pacific sector during ENSO episodes. J. Climate, 16, 3–20.
——, and ——, 2006: ENSO modulation of the interannual and
intraseasonal variability of the East Asian monsoon—A
model study. J. Climate, 19, 4508–4530.
——, and H. Wang, 2004: Simulations by a GFDL GCM of ENSO-
related variability of the coupled atmosphere–ocean system
in the East Asian monsoon region. East Asian Monsoon,
C.-P. Chang, Ed., World Scientific Series on Meteorology of
East Asia, Vol. 2, World Scientific, 271–300.
Li, T., 1997: Air–sea interactions of relevance to the ITCZ: The
analysis of coupled instabilities and experiments in a hybrid
coupled GCM. J. Atmos. Sci., 54, 134–147.
——, Y. S. Zhang, E. Lu, and D. Wang, 2002: Relative role of
dynamic and thermodynamic processes in the development
of the Indian Ocean dipole. Geophys. Res. Lett., 29, 2110,
doi:10.1029/2002GL015789.
——, B. Wang, C. P. Chang, and Y. S. Zhang, 2003: A theory for the
Indian Ocean dipole-zonal mode. J. Atmos. Sci., 60, 2119–
2135.
Li, Y., R. Lu, and B. Dong, 2007: The ENSO–Asian monsoon in-
teraction in a coupled ocean–atmosphere GCM. J. Climate, 20,
5164–5177.
Matsuno, T., 1966: Quasi-geostrophic motions in the equatorial
area. J. Meteor. Soc. Japan, 44, 25–42.
Ohba, M., and H. Ueda, 2009: Role of nonlinear atmospheric re-
sponse to SST on the asymmetric transition process of ENSO.
J. Climate, 22, 177–192.
Rasmusson, E. M., and T. H. Carpenter, 1982: Variations in tropical
sea surface temperature and surface wind fields associated with
the Southern Oscillation/El Nino. Mon. Wea. Rev., 110, 554–584.
Rayner, N. A., D. E. Parker, E. B. Horton, C. K. Folland,
L. V. Alexander, D. P. Rowell, E. C. Kent, and A. Kaplan,
2003: Global analyses of sea surface temperature, sea ice, and
15 SEPTEMBER 2010 W U E T A L . 4821
night marine air temperature since the late nineteenth cen-
tury. J. Geophys. Res., 108, 4407, doi:10.1029/2002JD002670.
Roeckner, E., and Coauthors, 1996: The atmospheric general cir-
culation model ECHAM-4: Model description and simulation
of present-day climate. Max-Planck-Institute for Meteorology
Rep. 218, 90 pp. [Available online at http://www.mpimet.mpg.de/
fileadmin/publikationen/Reports/MPI-Report_218.pdf.]
Sui, C.-H., P.-H. Chung, and T. Li, 2007: Interannual and inter-
decadal variability of the summertime western North Pacific
subtropical high. Geophys. Res. Lett., 34, L11701, doi:10.1029/
2006GL029204.
Wang, B., and Q. Zhang, 2002: Pacific–east Asian teleconnection.
Part II: How the Philippine Sea anomalous anticyclone is es-
tablished during El Nino development. J. Climate, 15, 3252–
3265.
——, R. G. Wu, and X. H. Fu, 2000: Pacific–East Asian tele-
connection: How does ENSO affect East Asian climate?
J. Climate, 13, 1517–1536.
——, ——, R. Lukas, and S. I. An, 2001: A possible mechanism for
ENSO turnabout. Dynamics of Atmospheric General Circu-
lation and Climate, IAP/Academia Sinica, Ed., China Mete-
orological Press, 552–578.
——, ——, and T. Li, 2003: Atmosphere–warm ocean interaction
and its impacts on Asian–Australian monsoon variation.
J. Climate, 16, 1195–1211.
Wang, C. Z., R. H. Weisberg, and J. I. Virmani, 1999a: Western
Pacific interannual variability associated with the El Nino–
Southern Oscillation. J. Geophys. Res., 104, 5131–5149.
——, ——, and H. J. Yang, 1999b: Effects of the wind speed–
evaporation–SST feedback on the El Nino–Southern Oscil-
lation. J. Atmos. Sci., 56, 1391–1403.
Weisberg, R. H., and C. Z. Wang, 1997a: A western Pacific oscil-
lator paradigm for the El Nino Southern Oscillation. Geophys.
Res. Lett., 24, 779–782.
——, and ——, 1997b: Slow variability in the equatorial west-
central Pacific in relation to ENSO. J. Climate, 10, 1998–2017.
Wu, B., and T. J. Zhou, 2008: Oceanic origin of the interannual and
interdecadal variability of the summertime western Pacific
subtropical high. Geophys. Res. Lett., 35, L13701, doi:10.1029/
2008GL034584.
——, ——, and T. Li, 2009: Contrast of rainfall–SST relationships
in the western North Pacific between the ENSO developing
and decaying summers. J. Climate, 16, 4398–4405.
Wu, R., Z.-Z. Hu, and B. P. Kirtman, 2003: Evolution of ENSO-
related rainfall anomalies in East Asia. J. Climate, 16, 3742–
3758.
Xie, S.-P., 1999: A dynamic ocean–atmosphere model of the
tropical Atlantic decadal variability. J. Climate, 12, 64–70.
——, and S. G. H. Philander, 1994: A coupled ocean–atmosphere
model of relevance to the ITCZ in the eastern Pacific. Tellus,
46A, 340–350.
Zhang, R. H., and A. Sumi, 2002: Moisture circulation over East
Asia during El Nino episode in northern winter, spring and
autumn. J. Meteor. Soc. Japan, 80, 213–227.
——, ——, and M. Kimoto, 1996: Impact of El Nino on the East
Asian monsoon: A diagnostic study of the ’86/87 and ’91/92
events. J. Meteor. Soc. Japan, 74, 49–62.
Zhou, T. J., and R. C. Yu, 2005: Atmospheric water vapor transport
associated with typical anomalous summer rainfall pat-
terns in China. J. Geophys. Res., 110, D08104, doi:10.1029/
2004JD005413.
——, B. Wu, and B. Wang, 2009a: How well do atmospheric gen-
eral circulation models capture the leading modes of the in-
terannual variability of Asian–Australian monsoon? J. Climate,
22, 1159–1173.
——, and Coauthors, 2009b: Why the western Pacific subtropical
high has extended westward since the late 1970s. J. Climate, 22,
2199–2215.
4822 J O U R N A L O F C L I M A T E VOLUME 23