ams suite machinery health manager 5.2 and 5.3 new .../media/resources... · new features and...
TRANSCRIPT
White Paper S-NSF051509
May 2009
AMS® Suite: Machinery Health® Manager
5.2 and 5.3 New Features and Enhancements
This paper describes the new features in AMS Machinery Manager 5.2 and 5.3.
© 2009 Emerson Process Management. All rights reserved. The contents of this publication are presented for informational purposes only, and while effort has been made to ensure their accuracy, they are not to be construed as warranties or guarantees, express or implied, regarding the products or services described herein or their use or applicability. All sales are governed by our terms and conditions, which are available on request. We reserve the right to modify or improve the designs or specifications of our products at any time without notice.
AMS, Machinery Health, WirelessHART and PeakVue are marks of Emerson Process Management. All other marks are the property of their respective owners.
White Paper February 2009 – Page 2
© 2009 Emerson Process Management. All rights reserved.
www.assetweb.com/mhm
New Features and Enhancements AMS® Suite: Machinery Health® Manager 5.2 and 5.3
The AMS Machinery Manager 5.2 and 5.3 releases are the result of customer input that was collected during plant visits and documented by our customer support staff and project management teams. Users of every experience level will appreciate the enhancements contained in these releases. While there are several new features in the software release, the most significant are found in the vibration module. These features include a new home for the Autoplot functionality, a sub-navigator system, new vibration plot navigation tools and a Parameter Status Profile plot. Also introduced is a Parameter Status Profile plot, colored waterfall plots, setting of RPM on multiple active spectrum/waveform plots, a last survey notes indicator, new orbit display options, edit/calculation capabilities for trend alarm limits directly from the plot, and improved fault frequencies. AMS Machinery Manager now supports MODBUS import of process and vibration data from the CSI 6500 Machinery Health Monitor, the CSI 9420 Wireless Vibration Transmitter, and the CSI 9210 Machinery Health Transmitter. This functionality allows users to compare both process and vibration data for comprehensive analysis. In addition, process data from any WirelessHART™-enabled transmitter can be imported into AMS Machinery Manager through the Smart Wireless Gateway.
Vibration Analysis Enhancements for 5.2
Autoplot
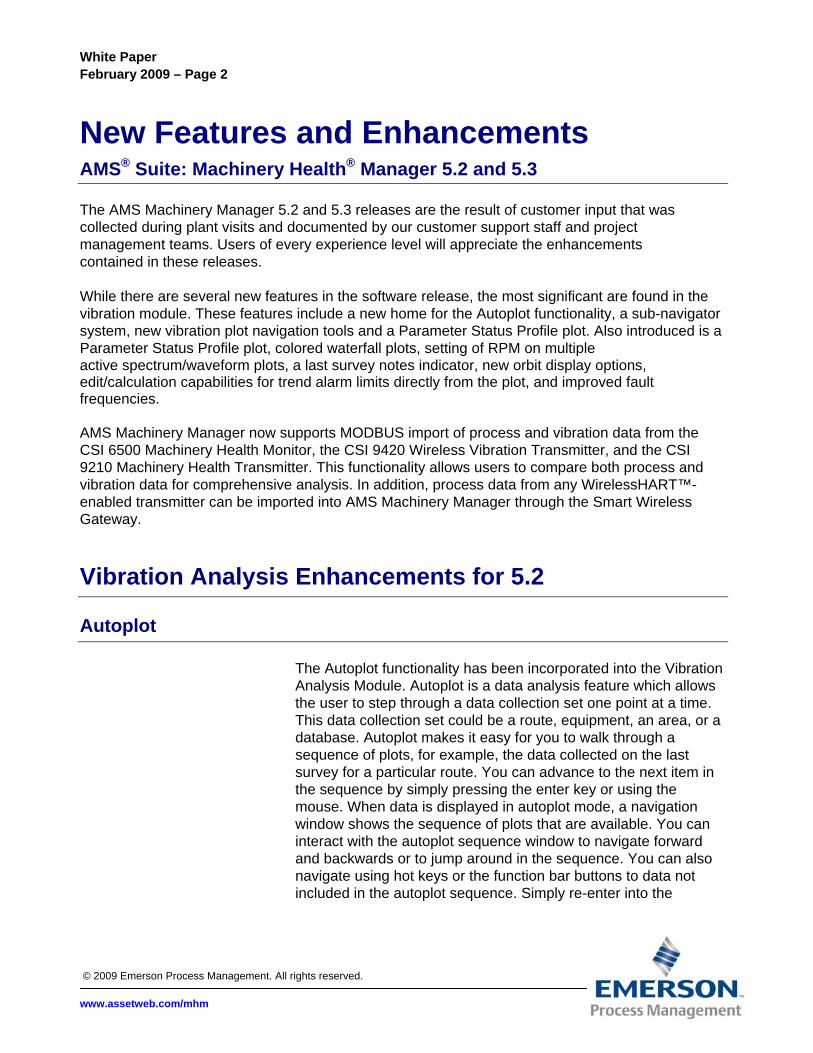
The Autoplot functionality has been incorporated into the Vibration Analysis Module. Autoplot is a data analysis feature which allows the user to step through a data collection set one point at a time. This data collection set could be a route, equipment, an area, or a database. Autoplot makes it easy for you to walk through a sequence of plots, for example, the data collected on the last survey for a particular route. You can advance to the next item in the sequence by simply pressing the enter key or using the mouse. When data is displayed in autoplot mode, a navigation window shows the sequence of plots that are available. You can interact with the autoplot sequence window to navigate forward and backwards or to jump around in the sequence. You can also navigate using hot keys or the function bar buttons to data not included in the autoplot sequence. Simply re-enter into the
White Paper February 2009 – Page 3
© 2009 Emerson Process Management. All rights reserved.
www.assetweb.com/mhm
autoplot mode by selecting the enter key or an item in the autoplot sequence window.
Point Details on Spectra, Waveforms and Trends
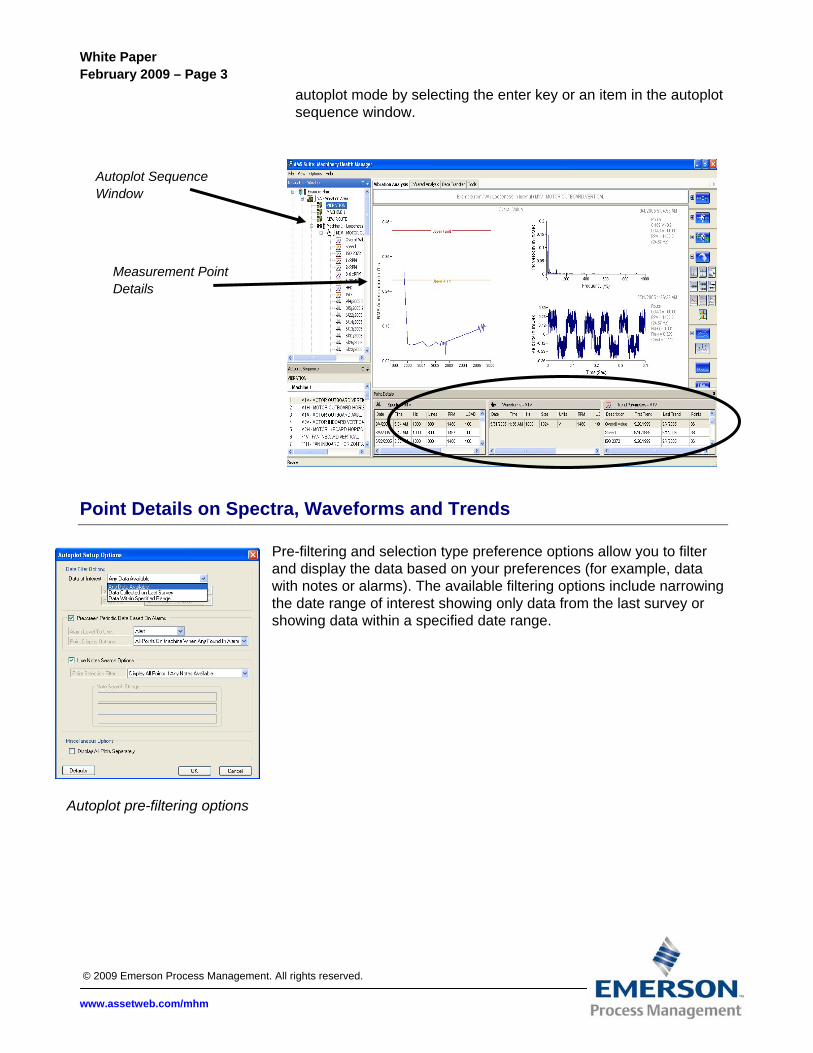
Pre-filtering and selection type preference options allow you to filter and display the data based on your preferences (for example, data with notes or alarms). The available filtering options include narrowing the date range of interest showing only data from the last survey or showing data within a specified date range.
Autoplot pre-filtering options
Autoplot Sequence Window
Measurement Point Details
White Paper February 2009 – Page 4
© 2009 Emerson Process Management. All rights reserved.
www.assetweb.com/mhm
Plot Navigation
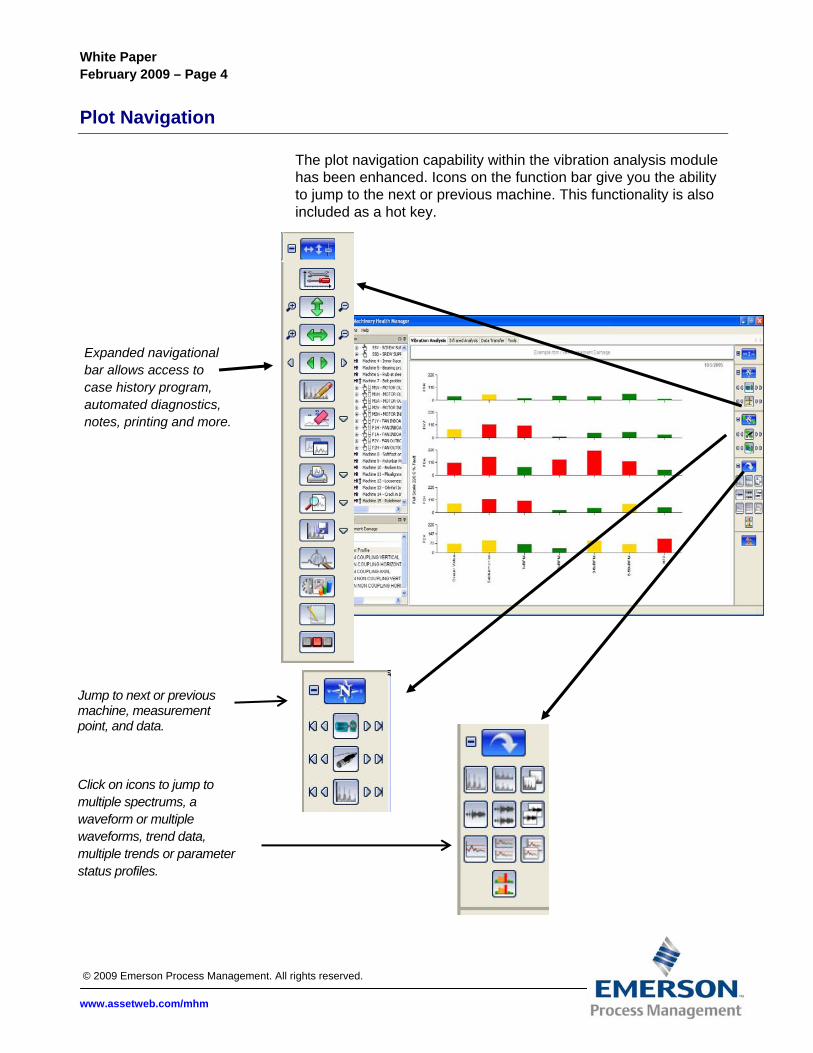
The plot navigation capability within the vibration analysis module has been enhanced. Icons on the function bar give you the ability to jump to the next or previous machine. This functionality is also included as a hot key.
Expanded navigational bar allows access to case history program, automated diagnostics, notes, printing and more.
Jump to next or previous machine, measurement point, and data.
Click on icons to jump to multiple spectrums, a waveform or multiple waveforms, trend data, multiple trends or parameter status profiles.
White Paper February 2009 – Page 5
© 2009 Emerson Process Management. All rights reserved.
www.assetweb.com/mhm
For alternative navigation, you can also display a list of points without using the navigator. These new navigation tools allow you to easily change the multiple spectral display format between “separate” and “together”. Once you have the plot(s) you want on the screen, expand any plot to a full screen for a better view of your data.
Alarm Limit Calculation Utility
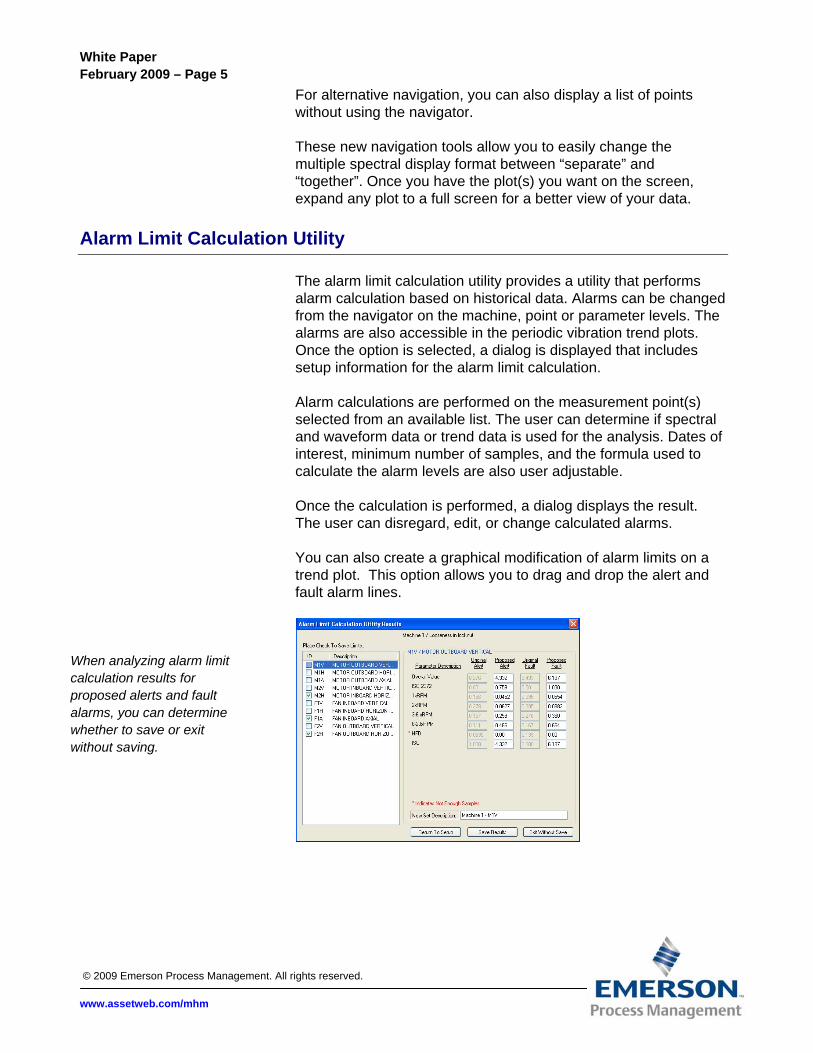
The alarm limit calculation utility provides a utility that performs alarm calculation based on historical data. Alarms can be changed from the navigator on the machine, point or parameter levels. The alarms are also accessible in the periodic vibration trend plots. Once the option is selected, a dialog is displayed that includes setup information for the alarm limit calculation. Alarm calculations are performed on the measurement point(s) selected from an available list. The user can determine if spectral and waveform data or trend data is used for the analysis. Dates of interest, minimum number of samples, and the formula used to calculate the alarm levels are also user adjustable.
Once the calculation is performed, a dialog displays the result. The user can disregard, edit, or change calculated alarms. You can also create a graphical modification of alarm limits on a trend plot. This option allows you to drag and drop the alert and fault alarm lines.
When analyzing alarm limit calculation results for proposed alerts and fault alarms, you can determine whether to save or exit without saving.

White Paper February 2009 – Page 6
© 2009 Emerson Process Management. All rights reserved.
www.assetweb.com/mhm
Display Calculated Trend from Single Spectrum, Multiple Spectrum and Cascade
An option to display a calculated trend for the frequency or order of interest is available when a single cursor is displayed on a spectrum. If the x-axis is in frequency units, the plot will be frequency based or if the x-axis is in orders, the calculated trend will be order-based. When a reference cursor is visible in addition to the primary cursor, you have two additional options for calculated trends. One option allows the calculation of a trend for the spectral band.
The second option gives you the ability to trend the maximum spectral amplitude in the identified band.
Additional calculated trend options are available when a reference cursor and primary cursor are available. Options include maximum band amplitude and total band energy.
Calculated total energy band
White Paper February 2009 – Page 7
© 2009 Emerson Process Management. All rights reserved.
www.assetweb.com/mhm
Improved Fault Frequency Labeling and Display
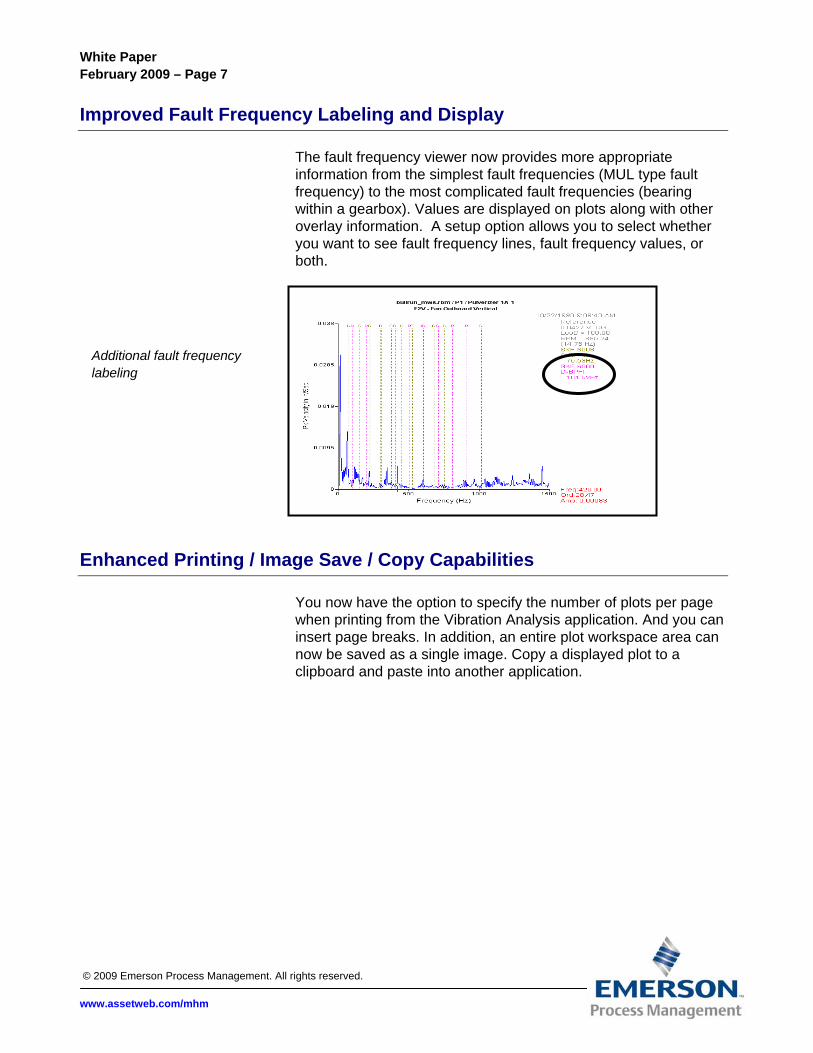
The fault frequency viewer now provides more appropriate information from the simplest fault frequencies (MUL type fault frequency) to the most complicated fault frequencies (bearing within a gearbox). Values are displayed on plots along with other overlay information. A setup option allows you to select whether you want to see fault frequency lines, fault frequency values, or both.
Enhanced Printing / Image Save / Copy Capabilities You now have the option to specify the number of plots per page when printing from the Vibration Analysis application. And you can insert page breaks. In addition, an entire plot workspace area can now be saved as a single image. Copy a displayed plot to a clipboard and paste into another application.
Additional fault frequency labeling
White Paper February 2009 – Page 8
© 2009 Emerson Process Management. All rights reserved.
www.assetweb.com/mhm
Data Transfer Functions for the CSI 2130
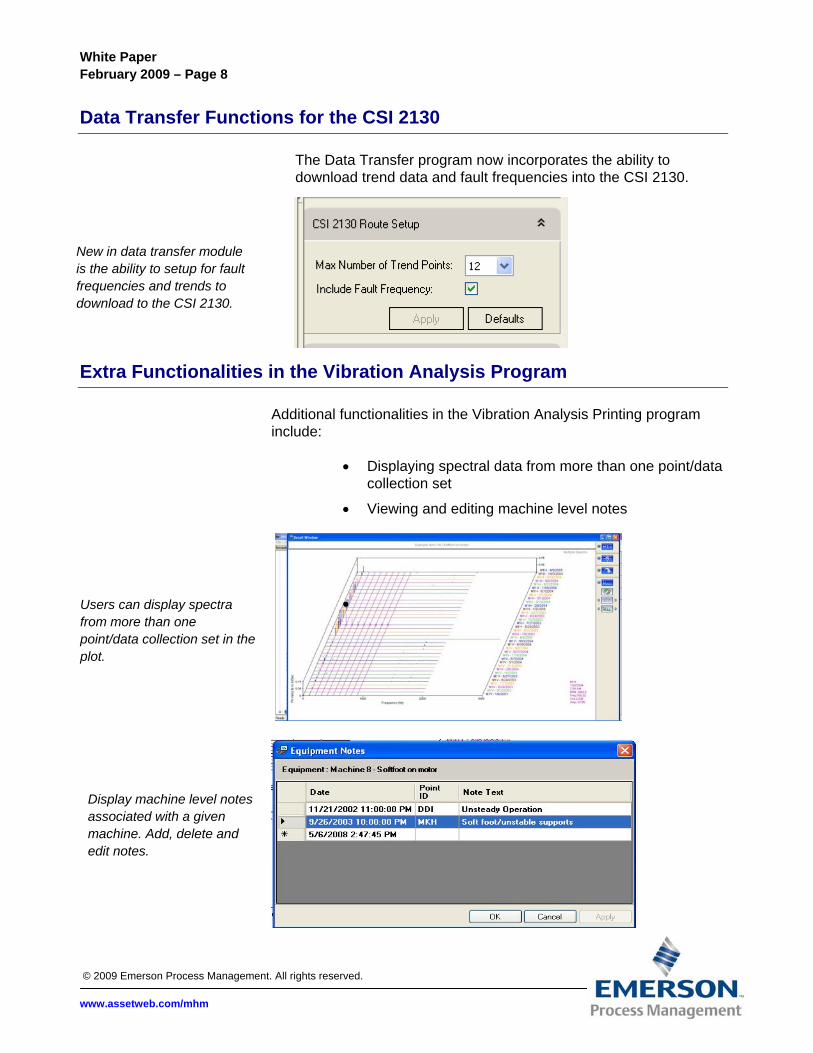
The Data Transfer program now incorporates the ability to download trend data and fault frequencies into the CSI 2130.
Extra Functionalities in the Vibration Analysis Program
Additional functionalities in the Vibration Analysis Printing program include:
• Displaying spectral data from more than one point/data
collection set
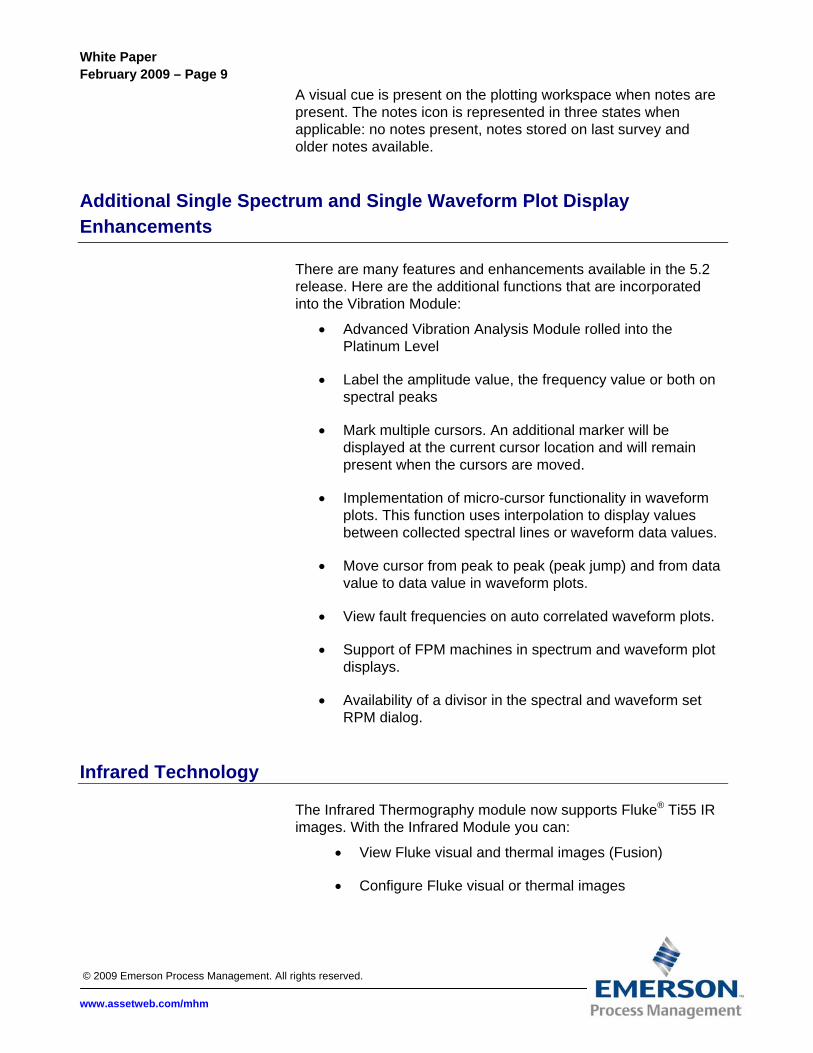
• Viewing and editing machine level notes
•
New in data transfer module is the ability to setup for fault frequencies and trends to download to the CSI 2130.
Users can display spectra from more than one point/data collection set in the plot.
Display machine level notes associated with a given machine. Add, delete and edit notes.
White Paper February 2009 – Page 9
© 2009 Emerson Process Management. All rights reserved.
www.assetweb.com/mhm
A visual cue is present on the plotting workspace when notes are present. The notes icon is represented in three states when applicable: no notes present, notes stored on last survey and older notes available.
Additional Single Spectrum and Single Waveform Plot Display Enhancements
There are many features and enhancements available in the 5.2 release. Here are the additional functions that are incorporated into the Vibration Module:
• Advanced Vibration Analysis Module rolled into the Platinum Level
• Label the amplitude value, the frequency value or both on spectral peaks
• Mark multiple cursors. An additional marker will be displayed at the current cursor location and will remain present when the cursors are moved.
• Implementation of micro-cursor functionality in waveform plots. This function uses interpolation to display values between collected spectral lines or waveform data values.
• Move cursor from peak to peak (peak jump) and from data value to data value in waveform plots.
• View fault frequencies on auto correlated waveform plots.
• Support of FPM machines in spectrum and waveform plot displays.
• Availability of a divisor in the spectral and waveform set RPM dialog.
Infrared Technology
The Infrared Thermography module now supports Fluke® Ti55 IR images. With the Infrared Module you can:
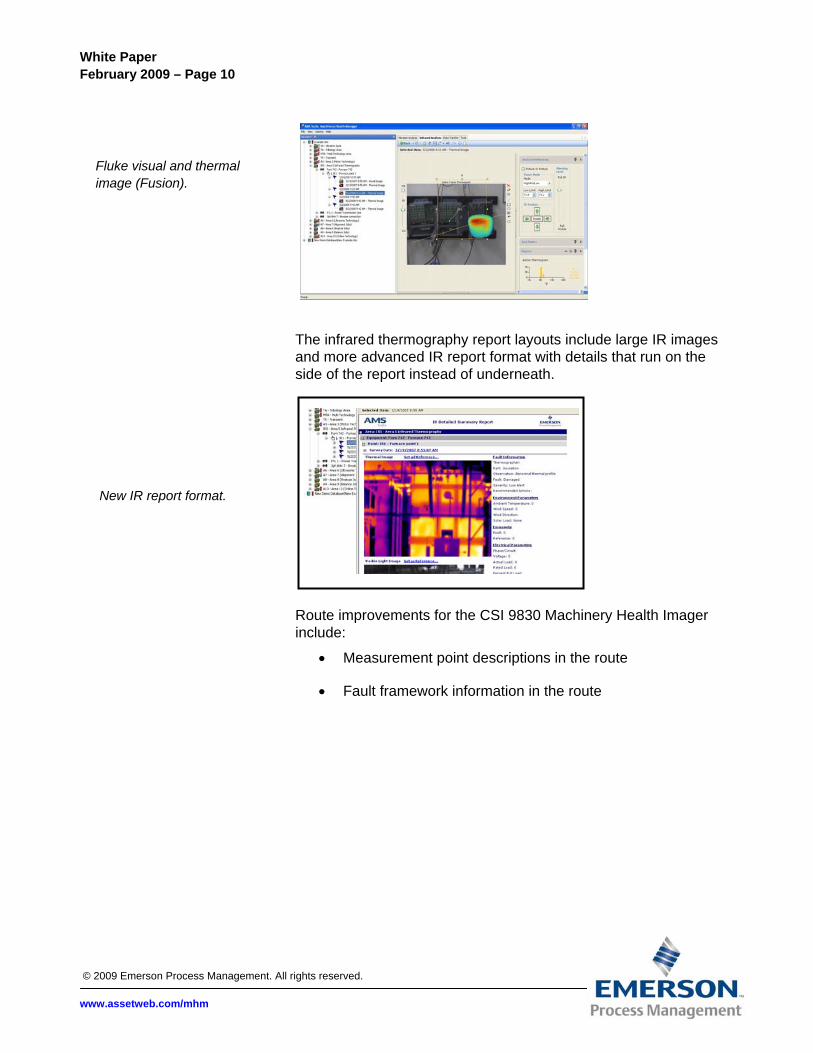
• View Fluke visual and thermal images (Fusion)
• Configure Fluke visual or thermal images
White Paper February 2009 – Page 10
© 2009 Emerson Process Management. All rights reserved.
www.assetweb.com/mhm
The infrared thermography report layouts include large IR images and more advanced IR report format with details that run on the side of the report instead of underneath.
Route improvements for the CSI 9830 Machinery Health Imager include:
• Measurement point descriptions in the route
• Fault framework information in the route
Fluke visual and thermal image (Fusion).
New IR report format.
White Paper February 2009 – Page 11
© 2009 Emerson Process Management. All rights reserved.
www.assetweb.com/mhm
AMS Machinery Manager 5.3 Enhancements Set RPM on Multiple Active Spectrum / Waveform Plots
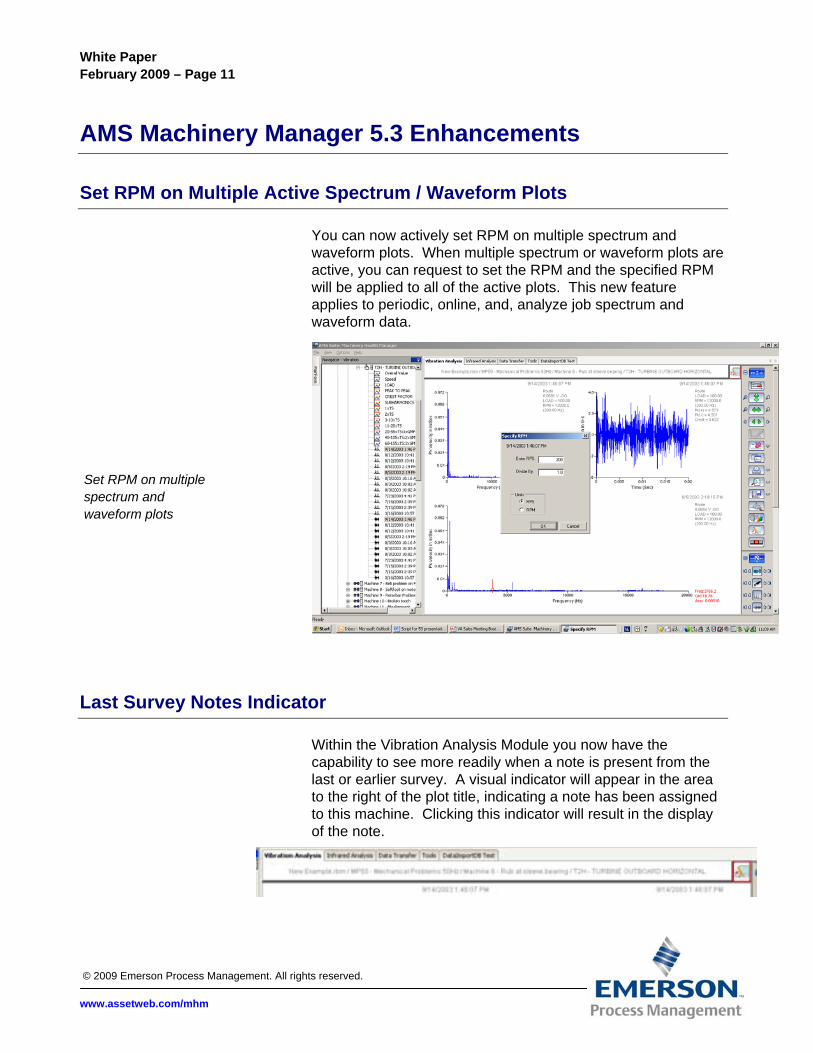
You can now actively set RPM on multiple spectrum and waveform plots. When multiple spectrum or waveform plots are active, you can request to set the RPM and the specified RPM will be applied to all of the active plots. This new feature applies to periodic, online, and, analyze job spectrum and waveform data.
Last Survey Notes Indicator
Within the Vibration Analysis Module you now have the capability to see more readily when a note is present from the last or earlier survey. A visual indicator will appear in the area to the right of the plot title, indicating a note has been assigned to this machine. Clicking this indicator will result in the display of the note.
Set RPM on multiple spectrum and waveform plots
White Paper February 2009 – Page 12
© 2009 Emerson Process Management. All rights reserved.
www.assetweb.com/mhm
Specify Trend Parameters of Interest
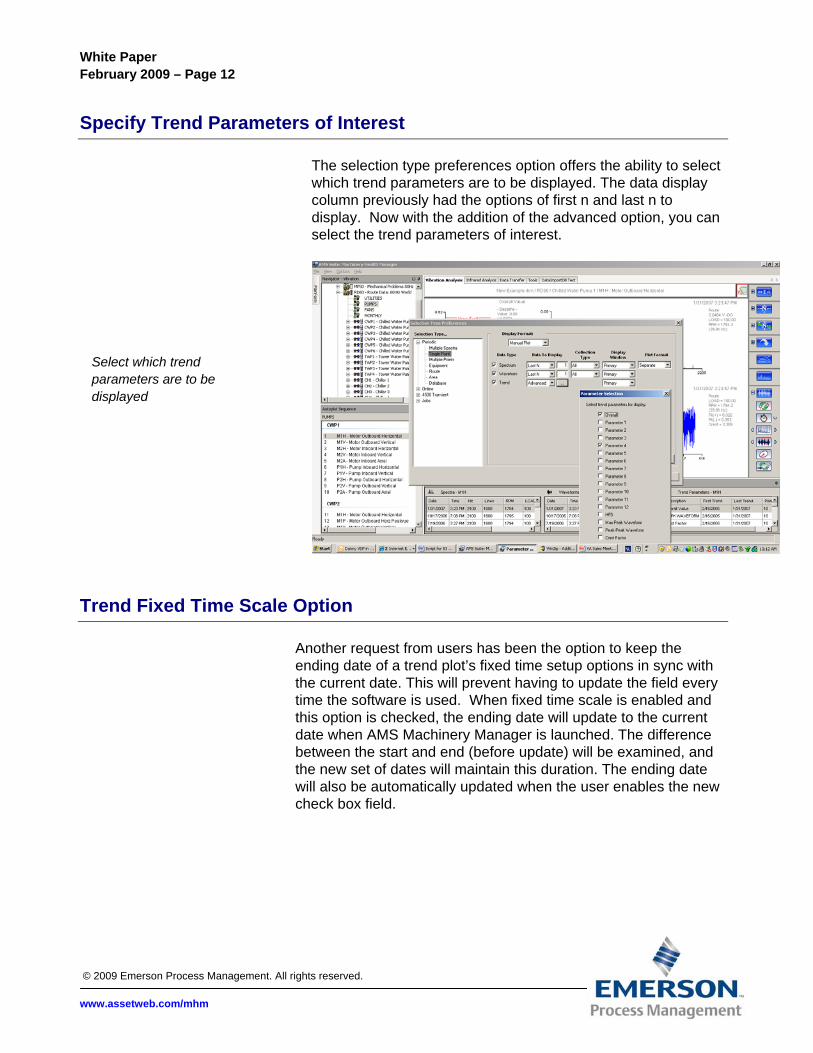
The selection type preferences option offers the ability to select which trend parameters are to be displayed. The data display column previously had the options of first n and last n to display. Now with the addition of the advanced option, you can select the trend parameters of interest.
Trend Fixed Time Scale Option
Another request from users has been the option to keep the ending date of a trend plot’s fixed time setup options in sync with the current date. This will prevent having to update the field every time the software is used. When fixed time scale is enabled and this option is checked, the ending date will update to the current date when AMS Machinery Manager is launched. The difference between the start and end (before update) will be examined, and the new set of dates will maintain this duration. The ending date will also be automatically updated when the user enables the new check box field.
Select which trend parameters are to be displayed
White Paper February 2009 – Page 13
© 2009 Emerson Process Management. All rights reserved.
www.assetweb.com/mhm
Modbus Import of Process and Vibration Data
AMS Machinery Manager now supports Modbus import of process and vibration data from the CSI 6500 Machinery Health Monitor, the CSI 9420 Wireless Vibration Transmitter, and the CSI 9210 Machinery Health Transmitter. This functionality allows users to compare both process and vibration data for comprehensive analysis. Since vibration and temperature data can be assessed in AMS Machinery Manager, trips to the field can be reduced to only when the machines are in alarm. In addition, process data from any WirelessHART™-enabled transmitter can be imported into AMS Machinery Manager through the Smart Wireless Gateway.
New Orbit Display Options
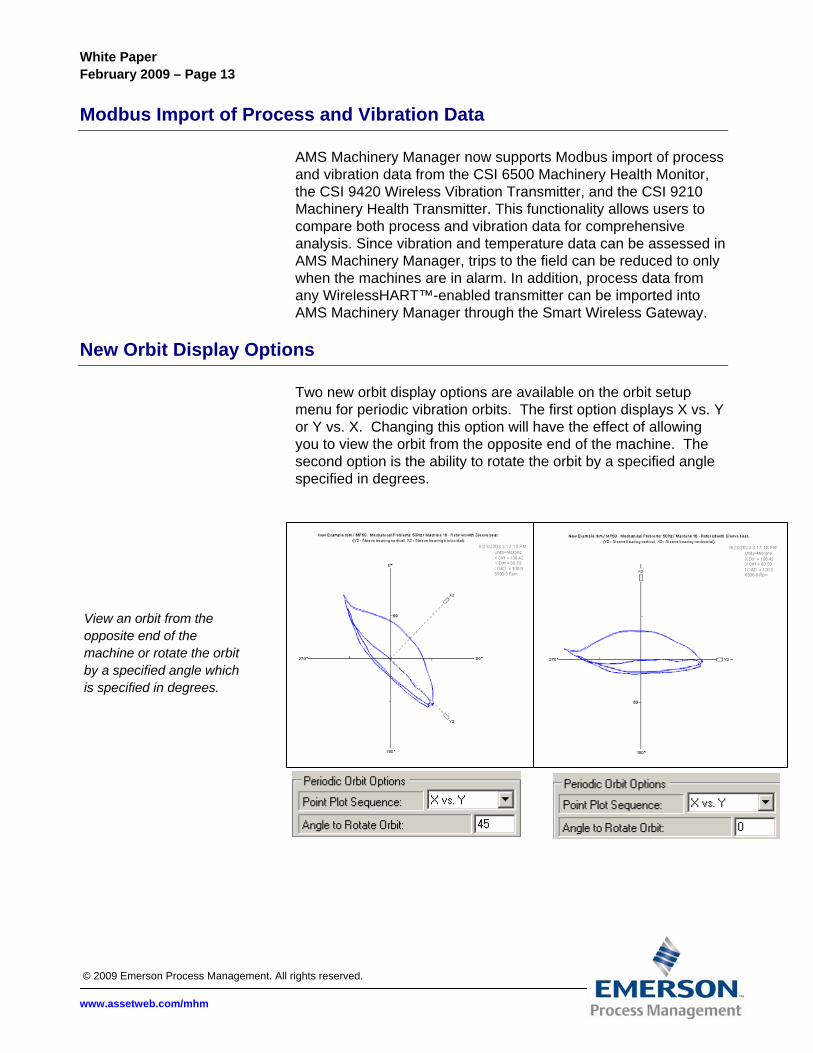
Two new orbit display options are available on the orbit setup menu for periodic vibration orbits. The first option displays X vs. Y or Y vs. X. Changing this option will have the effect of allowing you to view the orbit from the opposite end of the machine. The second option is the ability to rotate the orbit by a specified angle specified in degrees.
View an orbit from the opposite end of the machine or rotate the orbit by a specified angle which is specified in degrees.
White Paper February 2009 – Page 14
© 2009 Emerson Process Management. All rights reserved.
www.assetweb.com/mhm
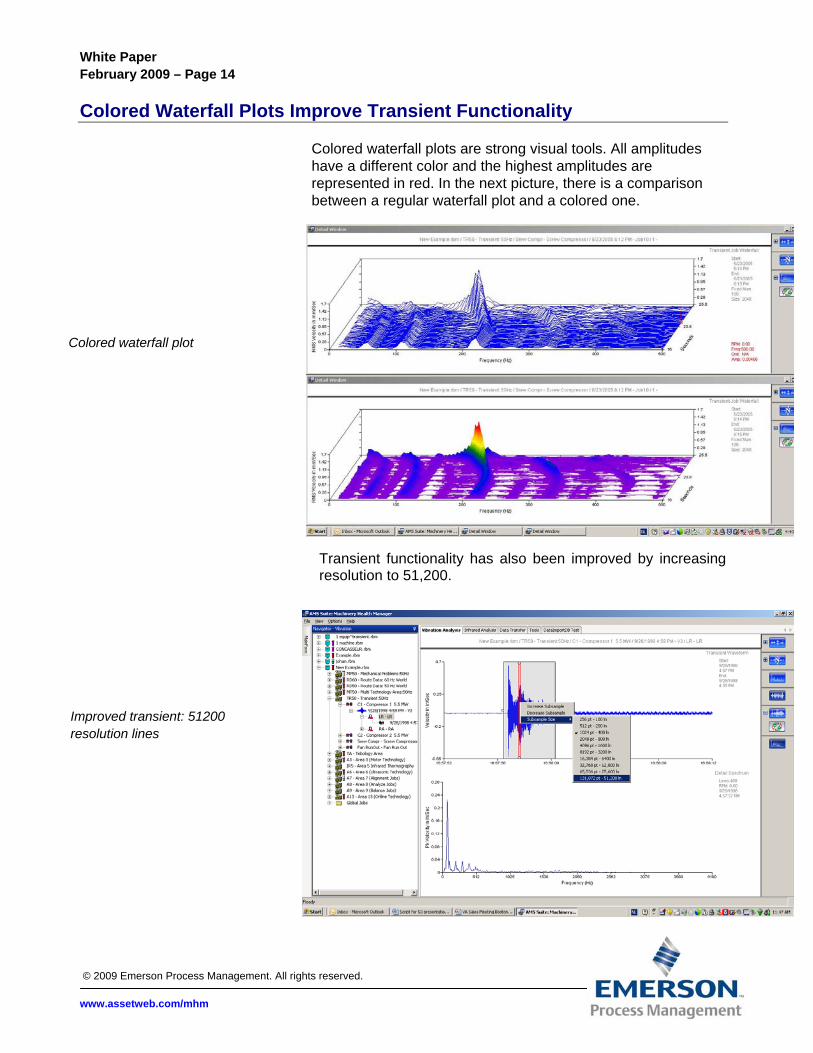
Colored Waterfall Plots Improve Transient Functionality
Colored waterfall plots are strong visual tools. All amplitudes have a different color and the highest amplitudes are represented in red. In the next picture, there is a comparison between a regular waterfall plot and a colored one.
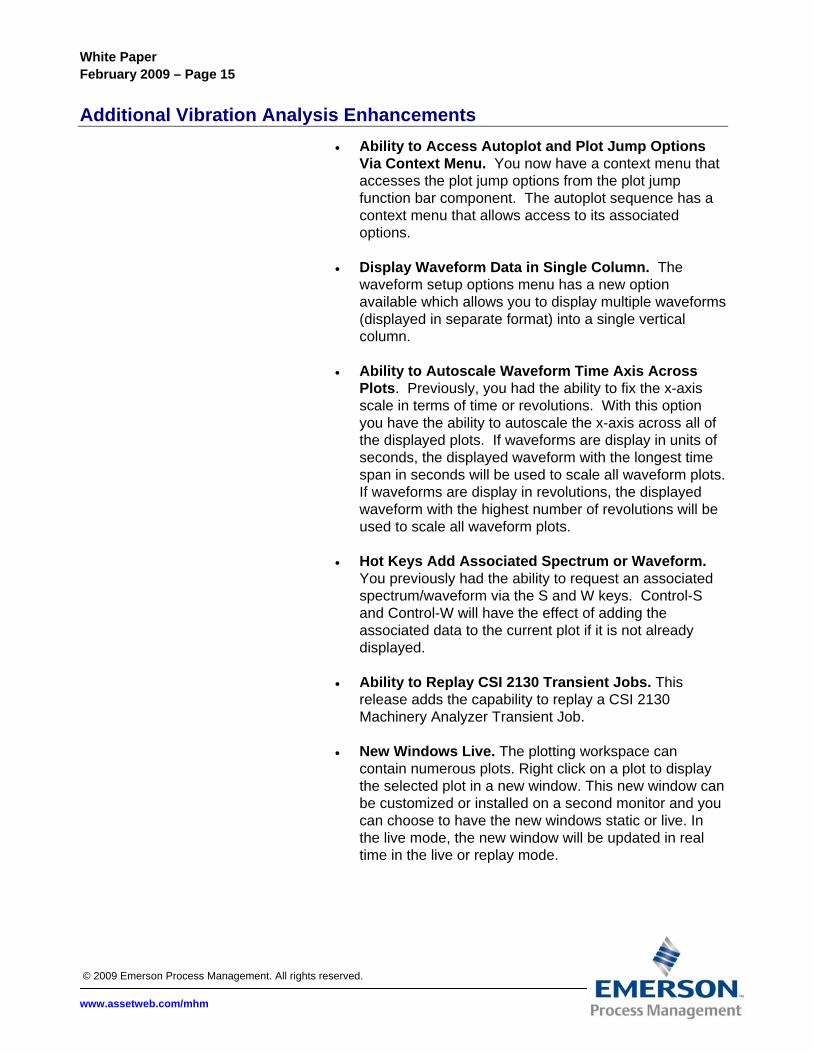
Transient functionality has also been improved by increasing resolution to 51,200.
Colored waterfall plot
Improved transient: 51200 resolution lines
White Paper February 2009 – Page 15
© 2009 Emerson Process Management. All rights reserved.
www.assetweb.com/mhm
Additional Vibration Analysis Enhancements
• Ability to Access Autoplot and Plot Jump Options Via Context Menu. You now have a context menu that accesses the plot jump options from the plot jump function bar component. The autoplot sequence has a context menu that allows access to its associated options.
• Display Waveform Data in Single Column. The
waveform setup options menu has a new option available which allows you to display multiple waveforms (displayed in separate format) into a single vertical column.
• Ability to Autoscale Waveform Time Axis Across
Plots. Previously, you had the ability to fix the x-axis scale in terms of time or revolutions. With this option you have the ability to autoscale the x-axis across all of the displayed plots. If waveforms are display in units of seconds, the displayed waveform with the longest time span in seconds will be used to scale all waveform plots. If waveforms are display in revolutions, the displayed waveform with the highest number of revolutions will be used to scale all waveform plots.
• Hot Keys Add Associated Spectrum or Waveform.
You previously had the ability to request an associated spectrum/waveform via the S and W keys. Control-S and Control-W will have the effect of adding the associated data to the current plot if it is not already displayed.
• Ability to Replay CSI 2130 Transient Jobs. This
release adds the capability to replay a CSI 2130 Machinery Analyzer Transient Job.
• New Windows Live. The plotting workspace can
contain numerous plots. Right click on a plot to display the selected plot in a new window. This new window can be customized or installed on a second monitor and you can choose to have the new windows static or live. In the live mode, the new window will be updated in real time in the live or replay mode.
White Paper February 2009 – Page 16
© 2009 Emerson Process Management. All rights reserved.
www.assetweb.com/mhm
AMS Suite: Machinery Health Manager powers PlantWeb with predictive and proactive maintenance through condition monitoring of mechanical equipment to improve availability and performance.
Emerson Process Management Asset Optimization Division 835 Innovation Drive Knoxville, TN 37932 T) 865-675-2400 F) 865-218-1401