amtrak food and beverage services and section...
TRANSCRIPT

Amtrak Food and Beverage Services and Section 209
a business within a business
Tom HallChief, Customer Service
33
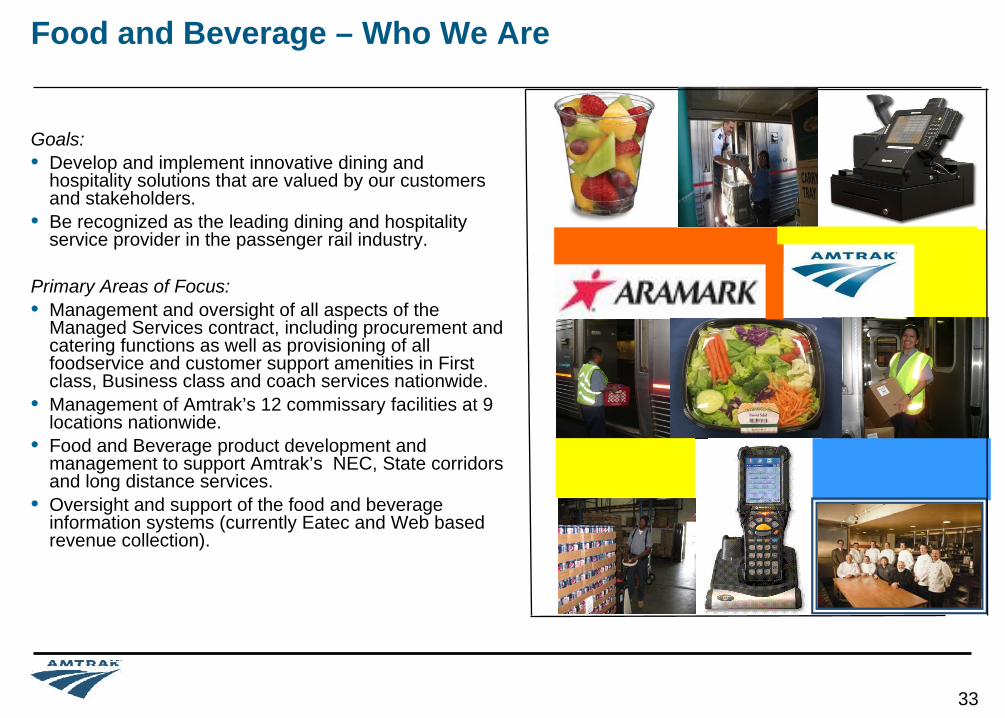
Food and Beverage – Who We Are
Goals:• Develop and implement innovative dining and
hospitality solutions that are valued by our customers and stakeholders.
• Be recognized as the leading dining and hospitality service provider in the passenger rail industry.
Primary Areas of Focus:• Management and oversight of all aspects of the
Managed Services contract, including procurement and catering functions as well as provisioning of all foodservice and customer support amenities in First class, Business class and coach services nationwide.
• Management of Amtrak’s 12 commissary facilities at 9 locations nationwide.
• Food and Beverage product development and management to support Amtrak’s NEC, State corridors and long distance services.
• Oversight and support of the food and beverage information systems (currently Eatec and Web based revenue collection).

F&B Is An Integrated Part of Our Product Offering
• Pillar of the Brand Architecture and customer experience
• On corridor service, the café car and the option of food service is a key differentiator from competing modes
• Even on corridor service, lack of food service can adversely affect ticket revenues
• In addition to Section 209, PRIIA requires Amtrak to improve Customer Satisfaction scores, including for food service
“Human, not cargo”You can eat when you want, rest when you want, and decide how you’ll spend
the time you get back
34
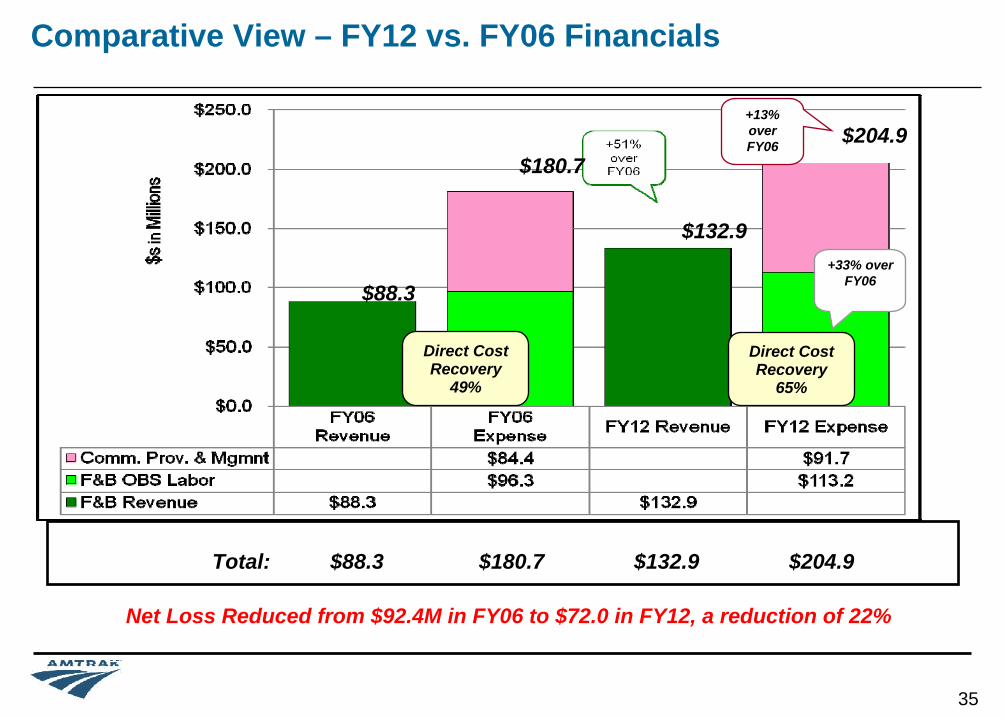
Net Loss Reduced from $92.4M in FY06 to $72.0 in FY12, a reduction of 22%
Comparative View – FY12 vs. FY06 Financials
$88.3
$180.7
$132.9
$204.9
Direct Cost Recovery
65%
+33% over FY06
Direct Cost Recovery
49%
+13% over FY06
Total: $88.3 $180.7 $132.9 $204.9
35

Food & Beverage and PRIIA Section 209
• F&B Revenue – credited to States– For NEC base-increment trains, revenue pro-rated at same % as supply expense
• Route Costs– OBS Crew – APT family 301_1– OBS Provisions – APT family 301_2
• Additives– OBS and commissary management and supervision – 10% of OBS Crew &
Provisions– Consistent for all routes– Since additive is fixed, incentive for Amtrak to manage these costs
Source: Section 209 Final Policy
36

Food & Beverage Functions
• Commissary Operations Management– Warehouse Logistics & Inventory Control– Provisioning of all food service, feature cars, and special trains– ARAMARK/Amtrak Safe-2-Safer Program
• Culinary Development and Supply Chain Management– Supply Chain Management– Product Specifications and Product Preparation Standards– Product Mix / Menu Pricing– Development and distribution of printed collateral materials– Access to the Amtrak Culinary Advisory Team
Prominent well-respected chefs, restaurateurs, and authors who drive ideation and differentiate on-board menus.
37

Food & Beverage Functions
• Corporate Support– Business Planning and Contract Management– Business Analytics and Decision Support– Information Systems Support (WIMS/POS)– Regulatory Compliance – FDA, Amtrak Public Health, DOT, FMCSA, etc.– Facility and Asset Management
38

Amtrak Commissaries
Boston
Miami
New York (Sunnyside & NYP)
Sanford
Washington (Ivy City & Union Station)
Chicago (Main & CUS)
Los Angeles
New Orleans
Oakland
Seattle
39
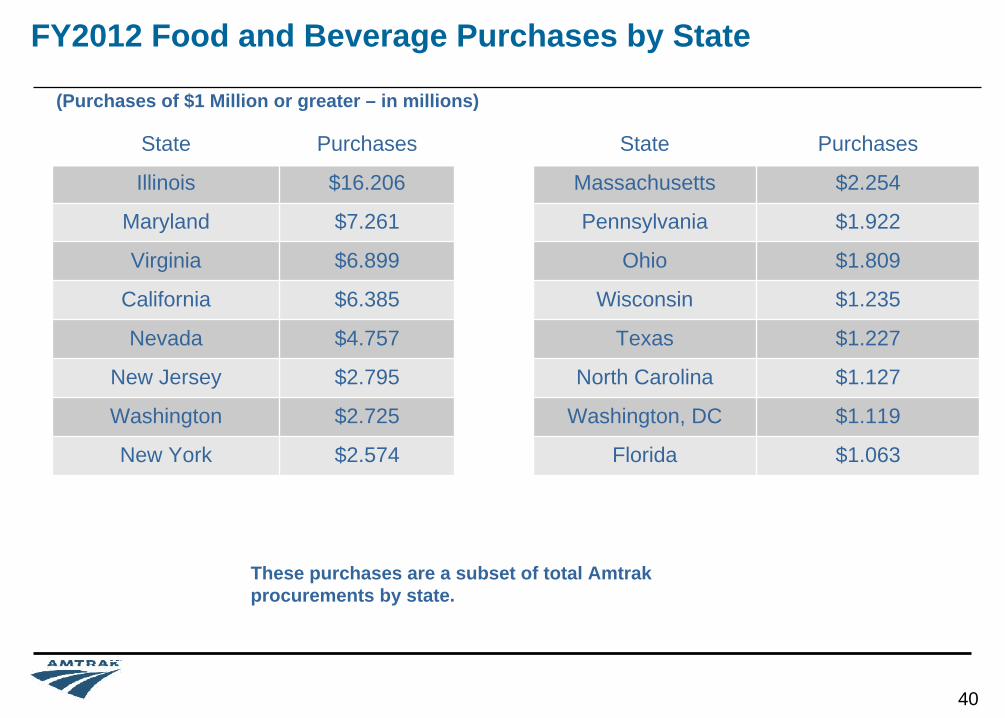
FY2012 Food and Beverage Purchases by State
State Purchases
Illinois $16.206
Maryland $7.261
Virginia $6.899
California $6.385
Nevada $4.757
New Jersey $2.795
Washington $2.725
New York $2.574
State Purchases
Massachusetts $2.254
Pennsylvania $1.922
Ohio $1.809
Wisconsin $1.235
Texas $1.227
North Carolina $1.127
Washington, DC $1.119
Florida $1.063
(Purchases of $1 Million or greater – in millions)
40
These purchases are a subset of total Amtrak procurements by state.

ARAMARK – Our Partner in Commissary Operations
• 502 ARAMARK employees at Amtrak’s commissaries
• ARAMARK employs 250,000 people in 22 countries
• Over $2.5B in annual spend related to food and beverage
• ARAMARK serves 2 billion meals each year
• Numerous affiliations in F&B and hospitality industry that can be leveraged to Amtrak’s benefit
• ARAMARK provides food service in over 2,000 hospitals and senior living communities, and over 5,400 business dining accounts
The team,the process,
the delivery,the experience
41

Key Contract Provisions Between Amtrak and ARAMARK
• Stock Ownership Model– Amtrak owns the inventory throughout the process, and contractor has specific performance management goals (i.e.
inventory turns, days of inventory on hand).
• Management Fee Structure– Management Fee is a fixed dollar amount with annual increases tied to CPI not to exceed five percent (5%) & a ten percent
(10%) portion is placed “at risk” based on overall KPI performance
• Incentive Structure– Ten percent (10%) of annual Management Fee and linkage to overall KPI performance – paid quarterly.
• Key Performance Indicators– FDA & Public Health Inspections, Stock Costs Savings, Condemnage Savings and Inventory Control.
• Term Of Agreement– Five (5) years and nine (9) months with two (2), two (2) year extension periods.
42

09/26/2007 NCR Proprietary
Future View – FY13 - FY15 F&B Improvements
• POS– Records on board sales, spoilage and temperature monitoring data– Improves customer experience by eliminating paper-intensive LSA
processes – Provides data for back-end auditing and reporting
• Food & Beverage Management System (FBS)– Provides database to track menu items, maintain product
specifications and forecast food production quantities
• WIMS– Automates commissary inventory ordering and receiving– Tracks the provisioning and return-to-stock functions for trains– Provides a perpetual inventory value
43
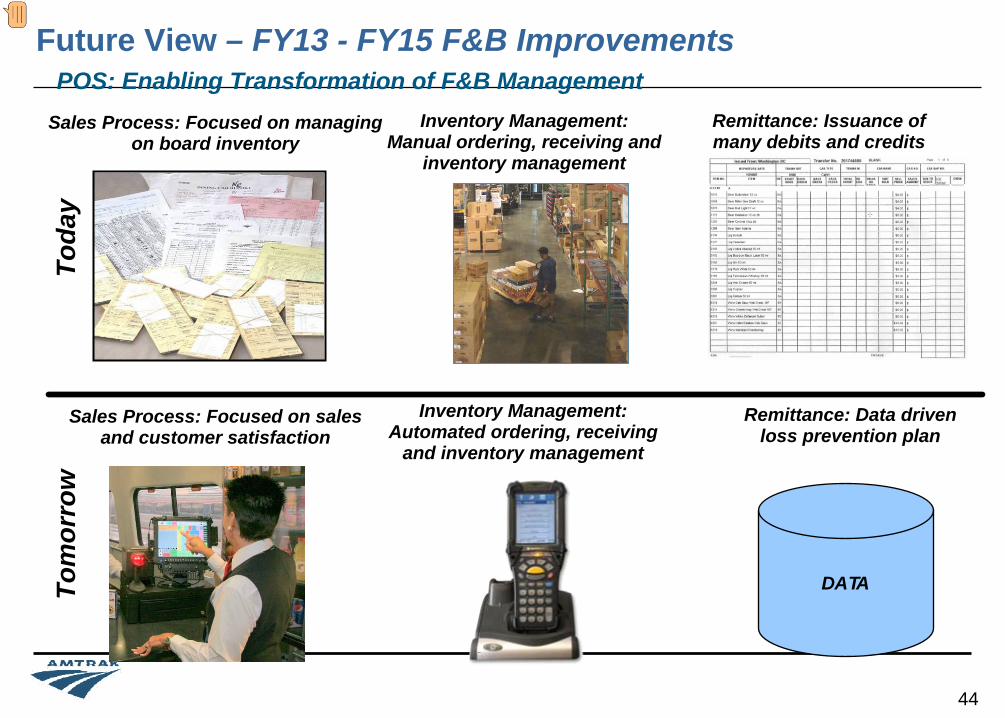
Sales Process: Focused on managing on board inventory
Toda
y
Sales Process: Focused on sales and customer satisfaction
Inventory Management: Manual ordering, receiving and
inventory management
Remittance: Issuance of many debits and credits
Inventory Management: Automated ordering, receiving
and inventory management
Remittance: Data driven loss prevention plan
Tom
orro
w
DATA
POS: Enabling Transformation of F&B ManagementFuture View – FY13 - FY15 F&B Improvements
44

CSPMI Business Intelligence Application: Consolidates information from many sources and delivers new business insights
On-Time Performance / Station Minutes of Delay
CSI Scores
Passenger Capacity / Equipment Type
LSA/Chef:Performance: Sales,
Spoilage, Backorders
Warehouse:PAR Fulfillment,
Spoilage, Inventory, Return to Stock
Sales:Pricing, Margin Analysis, PAR Optimization
CSPMIOne-Stop
Employee Hours Worked by Departure
OBS Crew Schedules
Customer Complaints & Praise
F&B Warehouse:Inventory Data /
Vendor / Purchasing
F&B Onboard:Train Inventory / Usage by
Departure & Employee
F&B Financial:Costs / Selling Prices /
Sales / Spoilage
Passenger Counts, Revenue, O/D, Class of
Service
Management:Product Mix,,
Staffing Levels, Spoilage Analysis
45

Fresh Food Case Study
2011 Program• Three different Vendors, wide disparity in quality,
and customer acceptance:– Panache Creative Cuisine Sandwiches and
Salads (Acela Café)– GateGourmet Flight Kitchen (NER - Regional
Café)– Modified Atmospheric Packaging (MAP)
Frozen Sandwiches (NEC - Off Corridor)• 32 different SKU’s used to generate business and
“inefficiency”• Rotating cycles (2 or 3 week) were used to increase
variety
2012 Program• Panache Creative Cuisine program on all Café’s
– Acela– Northeast Regional– Off - Spine
• 15 SKU’s consisting of best selling items have produced record revenue
• One continuous cycle
Significant improvement in revenue, net profit, and decreased spoilage compared to 2011 results.
2011 2012 Change# SKUs 32 15 -53%Sales ($) $1,046,167 $2,081,743 99%Net Margin $299,487 $790,042 164%Margin % 28.6% 38.0% 33%Spoilage Rate 22% 11% -50%
January to June
46

How can we optimize F&B on your route?
• Improve food quality– Identify product mix that is highly valued, reflects the region, and is consumer relevant…
• Increase revenues– Continue to leverage the strength of national branded menu items to increase average spend
and drive organic growth; DiGiorno, Sara Lee, Gatorade, etc.– Utilizing business analytics (CSPMI) and decision support modeling to drive targeted pricing
actions and achieving 2% – 5% annual growth.
• Reduce costs– Standardizing where possible to enhance cross-utilization, minimize SKUs, take advantage of
economies of scale, and enhance margin contribution.– Continue to analyze all menus to ensure targeted Cost of Goods Sold is maintained by
category to achieve overall lower product cost for entire portfolio.
47

How can we optimize F&B on your route?
• Supply Chain Resources– Leverage ARAMARK’s $2.5B buying power– Participation in ARAMARK Buying programs– Access to ARAMARK Preferred Supplier Network– Access to consumer information (e.g. menu trends, brand preferences)– RFP Development– Development of printed collateral materials and the fulfillment thereof to field units
• Improve OBS Staff and Management Development– Development and implementation of a hospitality training program focused on frontline
leadership skills, sales and service techniques, cooking, preparation and plating principles and controlling the bottom line.
48