amu quarterly report page 1 of 27 applied …science.ksc.nasa.gov/amu/fy08/amu_q4_08.pdf · amu...
TRANSCRIPT

AMU Quarterly Report Page 1 of 27
1980 N. Atlantic Ave., Suite 230 Coca Beach, FL 32931 (321) 783-9735, (321) 853-8202 (AMU)
Applied Meteorology Unit (AMU) Quarterly Report Fourth Quarter FY-08 Contract NNK06MA70C 31 October 2008
Distribution: NASA HQ/M/AA/W. Gerstenmaier NASA KSC/AA/R. Cabana NASA KSC/MK/L. Cain NASA KSC/LX/P.Phillips NASA KSC/PH/ R. Willcoxon NASA KSC/PH-A2/D. Lyons NASA KSC/PH/M. Leinbach NASA KSC/PH/S. Minute NASA KSC/VA/S. Francois NASA KSC/VA-2/C. Dovale NASA KSC/KT/D. Bartine NASA KSC/KT-C/J. Perotti NASA KSC/KT-C-H/J. Madura NASA KSC/KT-C-H/F. Merceret NASA KSC/KT-C-H/J. Wilson NASA JSC/MA/W. Hale NASA JSC/WS8/F. Brody NASA JSC/WS8/R. Lafosse NASA JSC/WS8/B. Hoeth NASA JSC/WS8/K. Van SpeyBroeck NASA MSFC/EV44/D. Edwards NASA MSFC/EV44/B. Roberts NASA MSFC/EV44/R. Decker NASA MSFC/EV44/H. Justh NASA MSFC/MP71/G. Overbey NASA MSFC/SPoRT/W. Lapenta NASA DFRC/RA/E. Teets NASA LaRC/M. Kavaya 45 WS/CC/A. Boerlage 45 WS/DO/J. Alexander 45 WS ADO/C. Lovett 45 WS/DOU/C. Parks 45 WS/DOR/M. McAleenan 45 WS/DOR/M. Buchanan 45 WS/DOR/G. Strong 45 WS/DOR/P. Phan 45 WS/DOR/F. Flinn 45 WS/DOR/ T. McNamara 45 WS/DOR/J. Tumbiolo 45 WS/DOR/K. Winters 45 WS/SYA/B. Boyd 45 WS/SYR/W. Roeder 45 RMS/CC/W. Rittershaus 45 SW/CD/G. Kraver 45 SW/SESL/D. Berlinrut 45 SW/XPR/R. Hillyer 45 OG/CC/B. Gruber 45 OG/TD/C. Olive CSR 4500/J. Saul CSR 7000/M. Maier SMC/RNP/S. Exum SMC/RNP/T. Knox SMC/RNP/R. Bailey SMC/RNP (PRC)/K. Spencer HQ AFSPC/A3FW/J. Carson HQ AFWA/A3/5/M. Surmeier HQ AFWA/A8TP/G. Brooks HQ AFWA/A5R/M. Gremillion HQ USAF/A30-W/R. Stoffler HQ USAF/A30-WX/M. Zettlemoyer HQ USAF/A30-WX/L. Zuccarello NOAA “W/NP”/L. Uccellini NOAA/OAR/SSMC-I/J. Golden NOAA/NWS/OST12/SSMC2/J. McQueen NOAA Office of Military Affairs/M. Babcock NWS Melbourne/B. Hagemeyer NWS Melbourne/D. Sharp NWS Melbourne/S. Spratt NWS Melbourne/P. Blottman NWS Melbourne/M. Volkmer
This report summarizes the Applied Meteorology Unit (AMU) activities for the fourth quarter of Fiscal Year 2008 (July - September 2008). A detailed project schedule is included in the Appendix.
Executive Summary
Task Peak Wind Tool for User Launch Commit Criteria (LCC) Goal Update the Phase I cool season climatologies and distributions of
5-minute average and peak wind speeds. The peak winds are an important forecast element for the Expendable Launch Vehicle and Space Shuttle programs. The 45th Weather Squadron (45 WS) and the Spaceflight Meteorology Group (SMG) indicate that peak winds are a challenging parameter to forecast. The Phase I climatologies and distributions helped alleviate this forecast difficulty. Updating the statistics with more data and new time stratifications will make them more robust and useful to operations.
Milestones Completed a first draft of the graphical user interface (GUI) and delivered it to the 45 WS for review. Began running scripts for the 4-hour prognostic probabilities.
Discussion The GUI outputs the climatologies and probabilities for all the LCCtowers in the cool season. The prognostic and modeled probabilities arenot yet available. It takes 33 to 36 minutes to process the 4-hour scripts, which is 10 to 12 minutes longer than the 2-hour scripts.
Task Anvil Forecast Tool in AWIPS Phase II Goal Update the Anvil Forecast Tool in the Advanced Weather Interactive
Processing System (AWIPS) to make it faster and more user-configurable. The tool is used by SMG during shuttle launch and landing operations to determine the threat from natural or triggered lightning due to flight through anvil cloud. SMG requested that the tool be modified to allow user-defined atmospheric pressure levels and model gridded data files.
Milestones Delivered the final versions of the software, installation instructions, and User Guide to SMG. Completed and distributed the final report.
Discussion The final report was reviewed by the AMU and AMU customers. The report was distributed after modifications based on the reviews were completed.
Continued on Page 2

AMU Quarterly Report Page 2 of 27
Executive Summary, continued Distribution (continued from Page 1) NWS Southern Region HQ/“W/SR”/ S. Cooper NWS Southern Region HQ/“W/SR3” D. Billingsley NWS/“W/OST1”/B. Saffle NWS/”W/OST12”/D. Melendez NSSL/D. Forsyth 30 WS/DO/J. Kurtz 30 WS/DOR/D. Vorhees 30 WS/SY/M. Schmeiser 30 WS/SYR/G. Davis 30 WS/SYS/J. Mason 30 SW/XPE/R. Ruecker Det 3 AFWA/WXL/K. Lehneis NASIC/FCTT/G. Marx 46 WS//DO/J. Mackey 46 WS/WST/E. Harris 412 OSS/OSW/P. Harvey 412 OSS/OSWM/C. Donohue UAH/NSSTC/W. Vaughan FAA/K. Shelton-Mur FSU Department of Meteorology/H. Fuelberg ERAU/Applied Aviation Sciences/ C. Herbster ERAU/CAAR/I. Wilson NCAR/J. Wilson NCAR/Y. H. Kuo NOAA/FRB/GSD/J. McGinley Office of the Federal Coordinator for Meteorological Services and Supporting Research/R. Dumont Boeing Houston/S. Gonzalez Aerospace Corp/T. Adang ITT/G. Kennedy Timothy Wilfong & Associates./T. Wilfong ENSCO, Inc/J. Clift ENSCO, Inc./E. Lambert ENSCO, Inc./A. Yersavich ENSCO, Inc./S. Masters
Task Completion of the Edward Air Force Base (EAFB) Statistical Guidance Wind Tool
Goal Develop a GUI, similar to that used by SMG for Kennedy Space Center (KSC) landing forecasts, using the Edwards Air Force Base (EAFB) wind tower data already quality-controlled and analyzed at Marshall Space Flight Center. SMG forecasters indicate that peak winds are a challenging parameter to forecast at EAFB. The development of a GUI that displays peak wind climatology and likelihood will help forecasters evaluate Flight Rules when the shuttle lands at EAFB.
Milestones Completed final version of the GUI and submitted to the forecasters at SMG for review. Completed a draft version of the final report that is currently undergoing customer review.
Discussion The GUI is similar to the tool used for the KSC landing forecasts. It allows users to display both climatologies and probabilities of exceeding peak-wind thresholds for all months at the EAFB runway towers.
Task Peak Wind Tool for General Forecasting, Phase II Goal Update the tool used by the 45 WS to forecast the peak wind speed for
the day on KSC/Cape Canaveral Air Force Station (CCAFS) during the cool season months October-April. The tool forecasts the timing of the peak wind speed for the day, the associated average speed, and provides the probability of issuing wind warnings in the KSC/CCAFS area using observational data available for the 45 WS morning weather briefing. The period of record will be expanded to increase the size of the data set used to create the forecast equations, new predictors will be evaluated, and the performance of the Phase I and Phase II tools will be compared to determine if the updates improved the forecast.
Milestones Obtained wind tower, sounding, and surface observation data for the period October 1996 to April 2008. Interpolated 1000-ft sounding data from October 1996 to April 2008 to 100-ft increments.
Discussion The 1000-ft sounding data was interpolated to 100-ft increments in order to calculate the new predictors. The interpolated data will be compared to corresponding 100-ft sounding data available only from October 2002 to April 2008. If no significant differences are found, the interpolated data will be included in the data set for the period October 1996 to April 2002. Otherwise, only 100-ft sounding data from October 2002 to April 2008 will be used in the task.
Continued on Page 3

AMU Quarterly Report Page 3 of 27
Task Volume Averaged Height Integrated Radar Reflectivity (VAHIRR)Goal Develop an automated algorithm to create the VAHIRR product for the
Weather Surveillance Radar 1988 Doppler weather radar. The lightning LCC (LLCC) for anvil clouds have incorporated the VAHIRR quantity to safely reduce unnecessary launch delays and scrubs. VAHIRR is expected to be included in the debris cloud LLCC soon. The VAHIRR provisions of the LLCC must currently be evaluated manually. The automated product will reduce the Launch Weather Officer's workload and chances for error in evaluating the LLCC.
Milestones Completed and distributed the final report.
Discussion The final report was reviewed by the AMU customers. After modifications based on the review were made, the report was distributed.
Task VAHIRR Cost Benefit Analysis Goal Conduct a cost-benefit analysis to assess the value of using VAHIRR in
support of launch operations at the Eastern Range and Western Range. VAHIRR was developed from the Airborne Field Mill program to correlate operational weather observations with in-cloud electric fields capable of rocket triggered lightning in anvil clouds. It has been used as an input to assess LLCC since 2005. If the analysis reveals positive results, funding for development of an automated algorithm may be sought.
Milestones Obtained additional launch weather summaries for previous launches from the 30 WS and 45 WS. Calculated VAHIRR for all valid cases. Began writing final report.
Discussion Using additional launch weather summaries, calculated VAHIRR for the cases with sufficient data. Summarized results of the VAHIRR calculations, which indicated VAHIRR provided relief from the anvil cloud LLCC 28.6% of the time and, therefore, would have allowed a launch to proceed that was otherwise “NO GO” due to the anvil cloud LLCC. The final report will be finished in October 2008.
Continued on Page 4
Executive Summary, continued

AMU Quarterly Report Page 4 of 27
Task WRF Wind Sensitivity Study at Edwards Air Force Base Goal Assess different high-resolution model configurations to determine
which is best to assist SMG in their short-term wind forecasts at EAFB for shuttle landings. The focus will be on “wind cycling” cases, in which the wind speed and direction oscillate over a period of time. Accurate forecasts are needed for EAFB in cases where the shuttle cannot land at KSC due to adverse weather conditions.
Milestones Continued to identify and collect data for candidate wind cycling days from April 2008 to present. Finished configuring the latest version of the Local Analysis and Prediction System (LAPS) for the EAFB area and began configuring the latest version of the Advanced Regional Prediction System (ARPS) Data Analysis System (ADAS).
Discussion Two more wind cycling case days were identified. The latest version of LAPS was configured to ingest all available high-resolution datasets in the EAFB area including the local wind tower data. The latest version of ADAS is being currently being configured to ingest the same high-resolution datasets used in the LAPS analyses. Six WRF model configurations with varying dynamical cores, initializations, and physics will be run for each candidate day.
Executive Summary, continued TABLE of
CONTENTS SHORT-TERM FORECAST IMPROVEMENT
Peak Wind Tool for User LCC.................................5
Anvil Forecast Tool in AWIPS Phase II ..............6
Completion of the EAFB Statistical Guidance Wind Tool .................................7
Peak Wind Tool for General Forecasting, Phase II ......7
INSTRUMENTATION AND MEASUREMENT
Volume Averaged Height Integrated Radar Reflectivity (VAHIRR)......8
VAHIRR Cost Benefit Analysis...........................8
MESOSCALE MODELING
WRF Wind Sensitivity Study at EAFB......................... 15
AMU CHIEF’S TECHNICAL ACTIVITIES...................................... 20
AMU OPERATIONS ..... 21
REFERENCES.............. 22
LIST OF ACRONYMS .. 23
APPENDIX A ................ 24
AMU Quarterly Report Page 5 of 27
Special Notice to Readers Applied Meteorology Unit (AMU) Quarterly Reports are now available on the Wide World Web (www) at http://science.ksc.nasa.gov/amu/.
The AMU Quarterly Reports are also available in electronic format via email. If you would like to beadded to the email distribution list, please contact Ms. Winifred Crawford (321-853-8130,[email protected]). If your mailing information changes or if you would like to be removedfrom the distribution list, please notify Ms. Crawford or Dr. Francis Merceret (321-867-0818,[email protected]).
The AMU has been in operation since September 1991. Tasking is determined annually with reviews atleast semi-annually. The progress being made in each task is discussed in this report with the primaryAMU point of contact reflected on each task.
Background
AMU ACCOMPLISHMENTS DURING THE PAST QUARTER
SHORT-TERM FORECAST IMPROVEMENT Peak Wind Tool for User LCC (Ms. Crawford)
The peak winds are an important forecast element for the Expendable Launch Vehicle and Space Shuttle programs. As defined in the Launch Commit Criteria (LCC) and Shuttle Flight Rules (FR), each vehicle has peak wind thresholds that cannot be exceeded in order to ensure safe launch and landing operations. The 45th Weather Squadron (45 WS) and the Spaceflight Meteorology Group (SMG) indicate that peak winds are a challenging parameter to forecast, particularly in the cool season. To alleviate some of the difficulty in making this forecast, the AMU calculated cool season climatologies and distributions of 5-minute average and peak winds in Phase I (Lambert 2002). The 45 WS requested that the AMU update these statistics with more data collected over the last five years, using new time-period stratifications, and a new parametric distribution. These modifications will likely make the statistics more robust and useful to operations. They also requested a graphical user interface (GUI) similar to that developed in Phase II (Lambert 2003) to display the wind speed climatologies and probabilities of meeting or
exceeding certain peak speeds based on the average speed.
Graphical User Interface
Ms. Crawford completed a first draft of the Excel GUI to display the climatology and probability values for the LCC towers, and gave a copy of the GUI to the 45 WS for review. The forms for the climatology portion of the GUI were shown in the previous AMU Quarterly Report (Q3 FY-08). Figure 1 shows the initial form for choosing the probabilities. The Forecast Interval choice is for the diagnostic (0 hours) or prognostic (2, 4, 8, or 12 hours) probabilities. The prognostic probabilities are not yet available. The distribution choices are the observed probabilities or those modeled with the Gumbel distribution (AMU Quarterly Report Q2 and Q3 FY-08). Once the user completes making choices and clicks the “Get Speeds…” button, the form in Figure 2 is displayed. This form allows the user to choose the mean and peak speeds of interest. The choices in the initial form (Figure 1) determine the range of mean speeds in the drop-down list, and the choice of mean speed determines the range of peak speeds. Clicking the “Get Probability…” button outputs the Requested Probabilities shown in Figure 3. User-input from the first two forms is repeated at the top, and the probability is displayed in large font.

AMU Quarterly Report Page 6 of 27
Figure 1. The Probability tab in the initial form.
Figure 2. The form to choose the mean and peak speeds.
Figure 3. The output form showing the probability of meeting or exceeding 23 kts when the mean speed is 16 kts at Tower 0393 in November.
Prognostic Probability Status
Ms. Crawford began running the scripts for the 4-hour probabilities. Due to the large amount of data I/O the procedure requires, it takes 33 to 36 minutes to process the data for one hour/two sensors/one month/13 years. This is 10 to 12 minutes longer than the 2-hour scripts. Ms. Crawford is running the scripts on three PCs in the AMU to expedite completing the scripts.
Contact Ms Crawford at 321-853-8130 or [email protected] for more information.
Anvil Forecast Tool in AWIPS Phase II (Mr. Barrett)
The forecasters at SMG and 45 WS have identified anvil forecasting as one of their most challenging tasks when predicting the probability of LCC or FR violations due to the threat of natural or triggered lightning. In response, the AMU developed an anvil threat corridor graphic that can be overlaid on satellite imagery using the Meteorological Interactive Data Display System (MIDDS). This tool helps forecasters estimate the location of thunderstorms that might produce an anvil threat one, two, and three hours into the future. It has been used extensively in launch and landing operations. The SMG is depending more on the Advanced Weather Interactive Processing System (AWIPS) during operations. In Phase I of this task (Barrett et al. 2007), the AMU
transitioned the anvil tool from MIDDS to AWIPS. For Phase II, SMG requested the AMU modify the tool to read model gridded data from user-defined files instead of hard-coded files, and to allow the user to modify the atmospheric pressure levels used in the tool.
Status
Mr. Barrett delivered the software, installation instructions, and User Guide to SMG. He completed the final report, submitted it for internal AMU and external customer review, and made modifications based on the reviews. He then distributed the report to the AMU customers and, after receiving NASA approval, made the report available to the public on the AMU website.
Contact Mr. Barrett at 321-853-8205 or [email protected], for more information.

AMU Quarterly Report Page 7 of 27
Completion of the Edward Air Force Base (EAFB) Statistical Guidance Wind Tool (Mr. Dreher)
The peak winds near the surface are an important forecast element for Space Shuttle landings. As defined in the Shuttle FR, there are peak wind thresholds that cannot be exceeded in order to ensure the safety of the shuttle during landing operations. Occasionally, the shuttle must land at EAFB in southern California when weather conditions at Kennedy Space Center (KSC) violate the FR. Peak winds are a challenging parameter to forecast for SMG, especially due to the complex topography in and around EAFB. To alleviate the difficulty in making such wind forecasts, the AMU developed a PC-based GUI for displaying peak wind climatology and probabilities of exceeding peak-wind thresholds for the Shuttle Landing Facility (SLF) at KSC (Lambert 2003). In 2004 Marshall Space Flight Center (MSFC) began work to replicate the AMU tool using the wind towers at EAFB. They completed the analysis and quality control of the data, but due to higher priority work did not start development of the GUI. The goal of this task is to create a GUI using the EAFB wind tower data that have already been quality-controlled and analyzed by MSFC personnel.
Status
Mr. Dreher completed testing the GUI and delivered it to SMG. Mr. Lafosse of SMG notified Mr. Dreher that they will not receive an expected system-wide upgrade to Microsoft® Office 2007 from Office 2003 until at least October 2008. Mr. Dreher discovered that the GUI originally created in Microsoft® Excel 2007 is not backward-compatible to Excel 2003 due to an issue with the point-click-drag buttons in the PivotTables. Therefore, he created and submitted two versions of the GUI to the forecasters SMG. Each version allows the forecasters to access the GUI through either Excel 2003 or 2007. The forecasters indicated that the GUI appears to be working correctly in both versions at SMG.
Mr. Dreher completed a draft version of the final report that was reviewed internally by the AMU. He submitted the report for external customer review. Once those reviews and modifications are completed the report will be submitted to AMU customers and to NASA for approval.
For more information contact Mr. Dreher at [email protected] or 321-853-8105.
Peak Wind Tool for General Forecasting, Phase II (Mr. Barrett)
The expected peak wind speed for the day is an important element in the daily morning forecast for ground and space launch operations at KSC and Cape Canaveral Air Force Station (CCAFS). The 45 WS must issue forecast advisories for KSC/CCAFS when they expect peak gusts to exceed 35 kt, 50 kt, and 60 kt thresholds at any level from the surface to 300 ft. In Phase I of this task (Barrett and Short 2008), the AMU developed a tool to help forecast the highest peak non-convective wind speed, the timing of the peak speed, and the average wind speed at the time of the peak wind from the surface to 300 ft on KSC/CCAFS for the cool season (October – April). For Phase II, the 45 WS requested that additional observations be used in the creation of the forecast equations by expanding the period of record (POR). In Phase I, the data set included observations from October 2002 to February 2007. In Phase II, observations from March and April 2007 and October 2007 to April 2008 will be
added. To increase the size of the data set even further, the AMU will consider adding data prior to October 2002. Additional predictors will be evaluated, including wind speeds between 500 ft and 3000 ft, static stability classification, Bulk Richardson Number, mixing depth, vertical wind shear, inversion strength and depth, wind direction, synoptic weather pattern and precipitation. Using an independent data set, the AMU will compare the performance of the Phase I and II tools to determine if the peak wind speed. The final tool will be a user-friendly GUI to output the forecast values.
In Phase I, the tool was delivered as a GUI in Microsoft Excel. The tool will be delivered as a Microsoft Excel GUI in Phase II. In addition, at the request of the 45 WS, the AMU will make the tool available in MIDDS, their main weather display system. This will allow the tool to ingest observational and model data automatically, and provide the ability to produce 5-day forecasts quickly.

AMU Quarterly Report Page 8 of 27 Mr. Barrett gathered wind tower, sounding,
and surface observation data for cool seasons from October 1996 to April 2008. The wind tower and sounding data were obtained from Computer Sciences Raytheon, while the surface observations were obtained from the 14th Weather Squadron (Strategic Climatic Information Service, formerly the Air Force Combat Climatology Center).
The 45 WS requested the sounding data to be in 100-ft increments before calculating the predictors. The data between October 1996 and April 2002 are only available in 1000-ft increments, while data between October 2002 and
April 2008 are available in both 1000-ft and 100-ft increments. Mr. Barrett interpolated the 1000-ft sounding data from October 1996 to April 2008 to 100-ft increments. He will compare the interpolated data to the 100-ft sounding data for the period October 2002 to April 2008. If no significant differences between the interpolated and 100-ft sounding data are found, he will include the interpolated data from October 1996 to April 2002 in the data set. Otherwise, only 100-ft sounding data from October 2002 to April 2008 will be used in the task.
Contact Mr. Barrett at 321-853-8205 or [email protected], for more information.
INSTRUMENTATION AND MEASUREMENTVolume Averaged Height Integrated Radar Reflectivity (VAHIRR) Algorithm (Mr. Barrett, Ms. Miller, Ms. Charnasky, Dr. Merceret, and Mr. Gillen)
Lightning LCC (LLCC) are used for all launches, whether Government or commercial, using a Government or civilian range (Willett et al. 1999). Shuttle lightning FR are also used for all landings. These rules are designed to avoid natural and triggered lightning strikes to space vehicles, which can endanger the vehicle, payload, and general public. The current LLCC for anvil clouds, meant to avoid triggered lightning, have been shown to be overly restrictive. They ensure safety, but falsely warn of danger and lead to costly launch delays and scrubs. A new LLCC for anvil clouds, and an associated radar-derived quantity (VAHIRR) needed to evaluate that new LLCC, were developed using data collected by the Airborne Field Mill (ABFM) research program managed by KSC (Dye et al. 2006, 2007). Dr. Harry Koons of Aerospace Corporation conducted a risk analysis of the VAHIRR parameter. The results indicated that relaxation of the LLCC based on VAHIRR would pose a negligible risk of flying through hazardous electric fields.
Mr. Barrett updated the final report based on feedback by SMG and the 45 WS. He distributed the completed report to AMU customers, and made the report available to the public on the AMU website after receiving NASA approval.
For more information, contact Mr. Barrett at [email protected] or 321-853-8205, or Dr. Merceret at [email protected] or 321-867-0818.
VAHIRR Cost-Benefit Analysis (Dr. Bauman)
The LLCC are designed to prevent space launch vehicles from flight through environments conducive to natural or triggered lightning. To assure avoidance of a triggered lightning event, the LLCC are extremely conservative. Some of these rules have had such high safety margins that they prohibited flight under conditions that are now thought to be safe 90% of the time (Merceret et al. 2006). The LLCC for anvil clouds was upgraded in the summer of 2005 to incorporate results from the ABFM experiment at the Eastern Range. Numerous combinations of parameters were considered to develop the best correlation of operational weather observations to in-cloud electric fields capable of rocket triggered lightning in anvil clouds. VAHIRR was the best metric found. The KSC Weather Office is considering seeking funding for development of an automated VAHIRR algorithm for the new 45 WS RadTec 43/250 weather radar and Weather Surveillance Radar–1988 Doppler (WSR-88D) radars. Before developing an automated algorithm, the AMU was tasked to determine the frequency with which VAHIRR would have allowed a launch to safely proceed during weather conditions otherwise deemed “red” by the Launch Weather Officer. To do this, Dr. Bauman calculated VAHIRR values manually based on candidate cases from past launches with known LLCC violations. An automated algorithm may be developed if the analyses from past launches show VAHIRR would have provided a significant cost benefit by allowing a launch to proceed.

AMU Quarterly Report Page 9 of 27 Data
Dr. Bauman received additional launch summaries from the 45 WS and 30th Weather Squadron (30 WS), resulting in 14 launch countdown summaries from the 45 WS and 5 from the 30 WS. The launch attempts occurred between December 2001 and June 2007. These summaries helped Dr. Bauman determine when the LLCC were “red” due to anvil cloud. He used WSR-88D radar reflectivity, cloud-to-ground lightning strikes, soundings and satellite imagery data to calculate VAHIRR.
Based on the candidate cases provided and data availability, Dr. Bauman calculated VAHIRR for six Eastern Range (ER) launch countdowns, but no Western Range (WR) launch countdowns. Although more than six ER countdowns had anvil cloud LLCC violations, radar data was not available during some periods when anvil cloud was observed. Also, some of the 45 WS launch summaries did not have enough detail to identify the time periods of the LLCC violations due to anvil cloud. During the WR countdowns, there were no LLCC violations due to anvil cloud. The LLCC violations were due to other issues such as the thick cloud rule or precipitation rule and therefore did not qualify for this task.
Manually Calculating VAHIRR
Mr. McNamara and Ms. Winters of the 45 WS provided Dr. Bauman with step-by-step instructions for calculating VAHIRR manually. The first step in the process requires conditions that violate the anvil rule are within 5 NM of the flight path. These conditions were not determined by the AMU but were provided in the launch weather summaries. If the launch weather summary identified a period as “red for anvil cloud” then the first step in the process was satisfied and the rest of the steps were then evaluated.
The stand-off criteria used to calculate VAHIRR requires vehicle clearances in both the horizontal and vertical. In order to determine if anvil cloud, radar reflectivities, lightning or the average cloud bases and tops had occurred within the specified distances, construction of a graphical overlay in the GR2Analyst software was required. The maximum clearance required is 10.8 NM for lightning from any given point along the vehicle’s trajectory, resulting in a spherical
stand-off region. The radius of the sphere is 10.8 NM (65,622 ft) from the launch vehicle at all times. Therefore, the stand-off sphere moves with the vehicle as it moves downrange and gains altitude. Figure 4 shows a conceptual diagram of a nominal space shuttle launch trajectory for an International Space Station destination. According to the rules for calculating VAHIRR, the altitude at which VAHIRR can no longer be calculated is approximately 66,000 ft. Therefore, when the shuttle reaches an altitude of approximately 132,000 ft, it is 10.8 NM above this point and it is no longer possible to calculate VAHIRR. At this point the shuttle is about 28 NM downrange from the launch site. Therefore, the total horizontal distance where VAHIRR must be calculated along the launch trajectory is a corridor about 38 NM in length and 10.8 NM to either side of the launch trajectory ground track.
Figure 4. Diagram of a nominal space shuttle launch trajectory for an International Space Station destination. The blue circles each have a radius of 10.8 NM, which represents the clearance required to meet VAHIRR criteria.
Dr. Bauman developed a 2-D representation of Figure 4 to use as a VAHIRR overlay in the GR2Analyst software with radar and lightning plots, shown in Figure 5. The distance from the launch site to the end of the flight path is about 28 NM, which is the point where VAHIRR criteria can no longer be evaluated due to the vehicle’s altitude. The three range rings and associated corridors of 3 NM, 5 NM and 10.8 NM help evaluate the VAHIRR clearance criteria.

AMU Quarterly Report Page 10 of 27
Launch Site
Flight Path
3 NM Corridor
5 NM Corridor
10.8 NM Corridor
Figure 5. GR2Analyst main window showing the VAHIRR overlay used for a space shuttle launch to the International Space Station at a 51° azimuth. The red dot shows the location of the launch site and the red line represents the flight path from the launch site to 28 NM downrange. The circles represent radii of 3 (black), 5 (olive), and 10.8 NM (gray) from the center of the launch pad and the 28 NM downrange point, and the connecting tangential lines of the same colors represent the corridor.
Anvil Cloud
When conditions are met that violate the anvil rule, anvil cloud within 5 NM of the flight path must be located at altitudes colder than 0° C., Dr. Bauman displayed the Level II WSR-88D reflectivity data from the Melbourne, FL radar on the overlay (Figure 5) to determine if anvil cloud was within 5 NM of the flight path. This is shown as the area within the olive-colored range rings and connecting lines in Figure 5. Dr. Bauman determined the altitude of the freezing level by plotting the sounding taken at CCAFS (XMR) from the rawinsonde released closest to the time of the radar volume scan under scrutiny.
To determine if anvil cloud occurred above the freezing level within 5 NM of the flight path, Dr. Bauman first displayed the 0.5° tilt of radar reflectivity with the overlay in Figure 5 to locate areas of precipitation. Next, he used the Volume
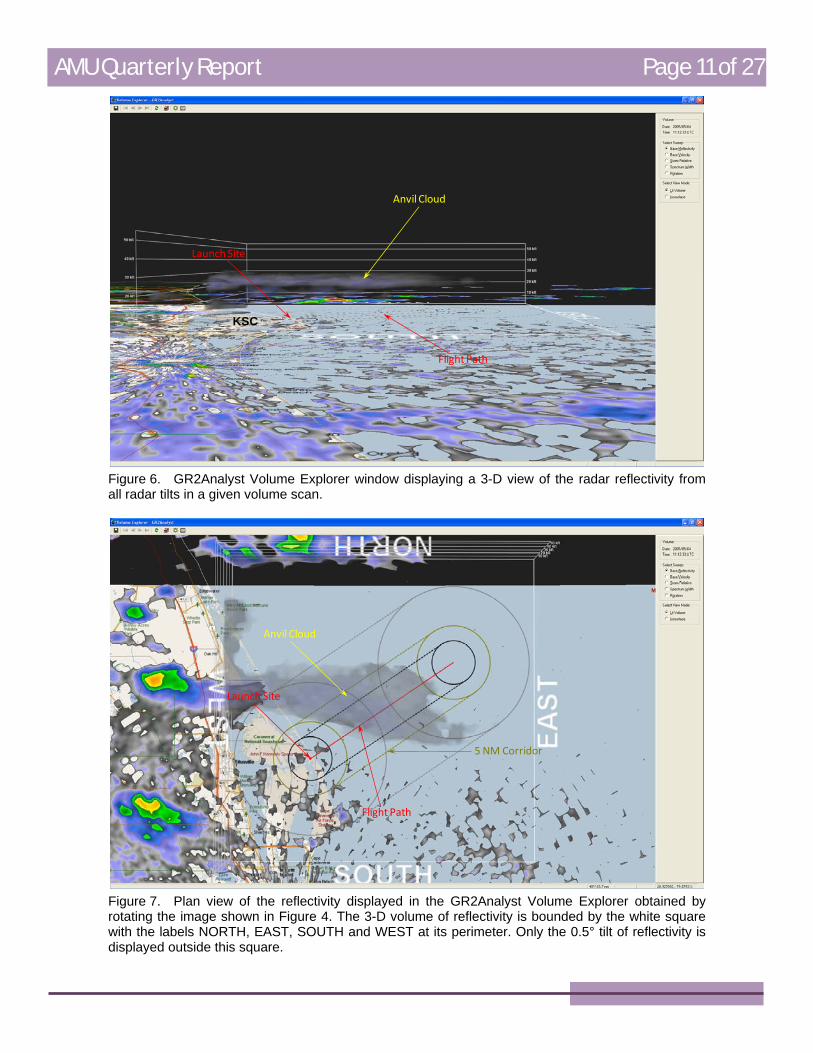
Mode selection in GR2Analyst to draw a box encompassing the outermost range rings in the overlay, which opened the Volume Explorer window as shown in Figure 6. The Volume Explorer provides a 3-D view of the radar reflectivity from all radar tilts in a given volume scan. Figure 6 shows anvil cloud in the vicinity of KSC at altitudes of about 18,000 to 31,000 ft. Then, he rotated the image to a plan view of the radar reflectivity as shown in Figure 7. This provides a view of the location of the anvil cloud relative to the flight path, the 5 NM range rings and associated 5 NM corridor. In this example, anvil cloud was within 5 NM of the flight path. The XMR sounding indicated the freezing level was at 12,600 ft. Therefore all of the anvil cloud was above the freezing level, which allowed the VAHIRR calculation to continue.
AMU Quarterly Report Page 11 of 27
Launch Site
Flight Path
Anvil Cloud
KSC
Figure 6. GR2Analyst Volume Explorer window displaying a 3-D view of the radar reflectivity from all radar tilts in a given volume scan.
Launch Site
Flight Path
5 NM Corridor
Anvil Cloud
Figure 7. Plan view of the reflectivity displayed in the GR2Analyst Volume Explorer obtained by rotating the image shown in Figure 4. The 3-D volume of reflectivity is bounded by the white square with the labels NORTH, EAST, SOUTH and WEST at its perimeter. Only the 0.5° tilt of reflectivity is displayed outside this square.
AMU Quarterly Report Page 12 of 27 Reflectivity above 13,123 ft
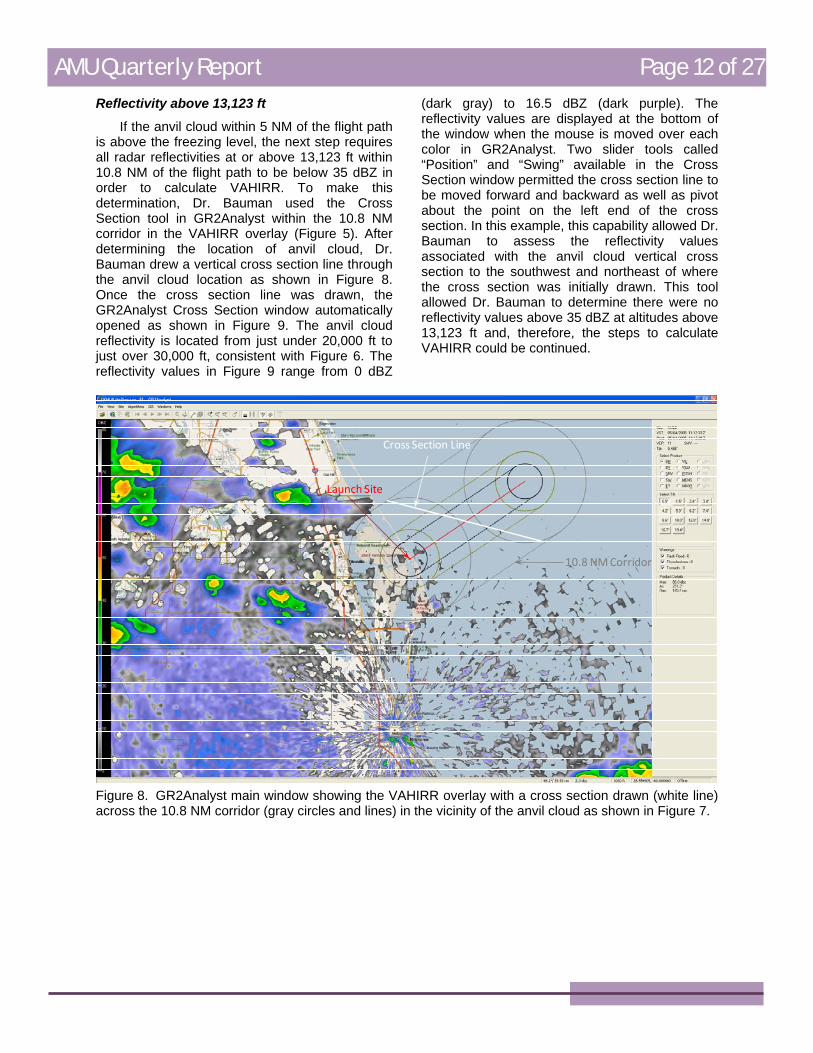
If the anvil cloud within 5 NM of the flight path is above the freezing level, the next step requires all radar reflectivities at or above 13,123 ft within 10.8 NM of the flight path to be below 35 dBZ in order to calculate VAHIRR. To make this determination, Dr. Bauman used the Cross Section tool in GR2Analyst within the 10.8 NM corridor in the VAHIRR overlay (Figure 5). After determining the location of anvil cloud, Dr. Bauman drew a vertical cross section line through the anvil cloud location as shown in Figure 8. Once the cross section line was drawn, the GR2Analyst Cross Section window automatically opened as shown in Figure 9. The anvil cloud reflectivity is located from just under 20,000 ft to just over 30,000 ft, consistent with Figure 6. The reflectivity values in Figure 9 range from 0 dBZ
(dark gray) to 16.5 dBZ (dark purple). The reflectivity values are displayed at the bottom of the window when the mouse is moved over each color in GR2Analyst. Two slider tools called “Position” and “Swing” available in the Cross Section window permitted the cross section line to be moved forward and backward as well as pivot about the point on the left end of the cross section. In this example, this capability allowed Dr. Bauman to assess the reflectivity values associated with the anvil cloud vertical cross section to the southwest and northeast of where the cross section was initially drawn. This tool allowed Dr. Bauman to determine there were no reflectivity values above 35 dBZ at altitudes above 13,123 ft and, therefore, the steps to calculate VAHIRR could be continued.
Launch Site
10.8 NM Corridor
Cross Section Line
Figure 8. GR2Analyst main window showing the VAHIRR overlay with a cross section drawn (white line) across the 10.8 NM corridor (gray circles and lines) in the vicinity of the anvil cloud as shown in Figure 7.

AMU Quarterly Report Page 13 of 27
Launch Site
Flight Path
Anvil Cloud
Cross Section Line
10.8 NM Corridor
Figure 9. GR2Analyst Cross Section window depicting the anvil cloud in the vertical cross section of reflectivity along the cross section line within the 10.8 NM corridor. The cross section line (thick horizontal solid white line) extends from northwest on the left of the image to the southeast on the right. Increasing altitude is from the bottom to top of the cross section area.
Natural Lightning In order to calculate VAHIRR, natural lightning
must not have occurred within 10.8 NM of the flight path within the last 5 minutes. Dr. Bauman separated the daily Cloud-to-Ground Lightning Surveillance System (CGLSS) data into individual files of 5-minute time intervals ending at the time of each WSR-88D volume scan he evaluated. He formatted to 5-minute data files so they could be read by the GR2Analyst software and subsequently displayed with the radar reflectivity. This allowed Dr. Bauman to assess whether or not each lightning strike in a 5-minute period prior to the radar volume scan occurred within 10.8 NM of the flight path.
Anvil Cloud Thickness If the three criteria described above are met,
the final step is to determine the thickness of the anvil cloud to calculate VAHIRR. To do so, Dr. Bauman had to establish the average height of the cloud tops and bases. The average cloud tops are determined by using the highest extent of 0 dBZ reflectivities within the specified volume. The average cloud bases are determined by using the lowest extent of 0 dBZ reflectivities within the
specified volume or the 0° C level, whichever is highest. The specified volume is defined as 3 NM left, right, above and below the flight path. To determine the average cloud tops and bases, Dr. Bauman used the Cross Section tool in GR2Analyst within the 3 NM corridor in the VAHIRR overlay (Figure 5). The cross section line was drawn along the flight path to keep it within the defined specified volume of 3 NM.
The resulting GR2Analyst Cross Section window is shown in Figure 10. The reflectivity indicates the average anvil cloud tops were located at about 29,500 ft. The average anvil cloud bases were located at about 21,000 ft, which was above the freezing level of 12,600 ft. In this example, Dr. Bauman determined the anvil cloud thickness was about 8,500 ft. Once the anvil cloud thickness was known, he needed to determine the maximum reflectivity value of the anvil cloud to calculate the final VAHIRR value. He moved the cross section line forward and backward parallel to the flight path in order to sample the entire anvil cloud within the specified volume of 3 NM. In this example the maximum reflectivity was 16.5 dBZ.

AMU Quarterly Report Page 14 of 27
Launch Site Flight Path
Average anvilcloud thickness
Cross Section Line3 NM Corridor
Average anvil cloud top height
Average anvil cloud base height
Altitude
Figure 10. GR2Analyst Cross Section window depicting the anvil cloud in the vertical cross section of reflectivity along the flight path within the 3 NM corridor. The cross section line (thick horizontal solid white line) extends from 3 NM southwest of the launch site on the left of the image to 3 NM northeast of the end of the flight path (horizontal red line) on the right. The freezing level (0° C) is shown by the horizontal dashed white line.
Preliminary Results
The 45 WS launch weather summaries from the six launch operations with usable data identified LLCC as red for anvil cloud for 2,314 minutes. All necessary data required to calculate VAHIRR was available 74% of that time. This included 344 usable volume scans of WSR-88D data. Based on the 344 radar volume scans, VAHIRR could not be calculated 27.6% of the time due to reflectivity values > 35 dBZ above 13,123 ft within 10.8 NM of the flight path and
9.3% of the time due to lightning within 10.8 NM of the flight path. Therefore, VAHIRR was calculated for 217 of the 344 usable radar volume scans. The results from these VAHIRR calculations indicated VAHIRR provided relief from the anvil cloud LLCC 28.6% of the time and therefore would have allowed a launch to proceed that was otherwise “NO GO” due to the anvil cloud LLCC.
For more information contact Dr. Bauman at [email protected] or 321-853-8202.
AMU Quarterly Report Page 15 of 27
MESOSCALE MODELING WRF Wind Sensitivity Study at EAFB (Dr. Watson and Dr. Bauman)
Occasionally, the shuttle must land at EAFB in Southern California when weather conditions at KSC violate the FR. However, the complex terrain in and around EAFB makes forecasting surface winds a challenge for SMG. In particular, wind “cycling cases”, in which the wind speeds and directions oscillate among towers near the EAFB runway, present a challenging forecast problem for shuttle landings. An accurate depiction of the winds along the runway is crucial in making the landing decision. Global and national scale models cannot properly resolve the wind field due to their coarse horizontal resolutions, so a properly tuned high-resolution mesoscale model is needed. The Weather Research and Forecasting (WRF) model meets this requirement. It has two dynamical cores and two options for initialization, as well as a number of different model parameterizations within each core. This provides SMG with a lot of flexibility as well as challenges. The goal of this task is to assess the different configurations available and determine which will best predict surface wind speed and direction at EAFB. Specifically, the AMU was tasked to 1) compare the model performance among different combinations of the dynamical cores and initializations, and 2) compare model performance while varying the physics options.
The Modeling System
The WRF model is the next generation community mesoscale model designed to enhance collaboration between the research and operational sectors. The WRF model has two dynamical cores -- the Advanced Research WRF (ARW) and the Non-hydrostatic Mesoscale Model (NMM). There are also two options for a “hot-start” initialization of the WRF model – the Local Analysis and Prediction System (LAPS) and the Advanced Regional Prediction System (ARPS) Data Analysis System (ADAS). Both LAPS and ADAS are three-dimensional weather analysis systems that integrate multiple meteorological data sources into one analysis over the user’s domain of interest. These analysis systems allow mesoscale models to benefit from the addition of high-resolution data sources in their initial conditions.
Wind Cycling Case Days
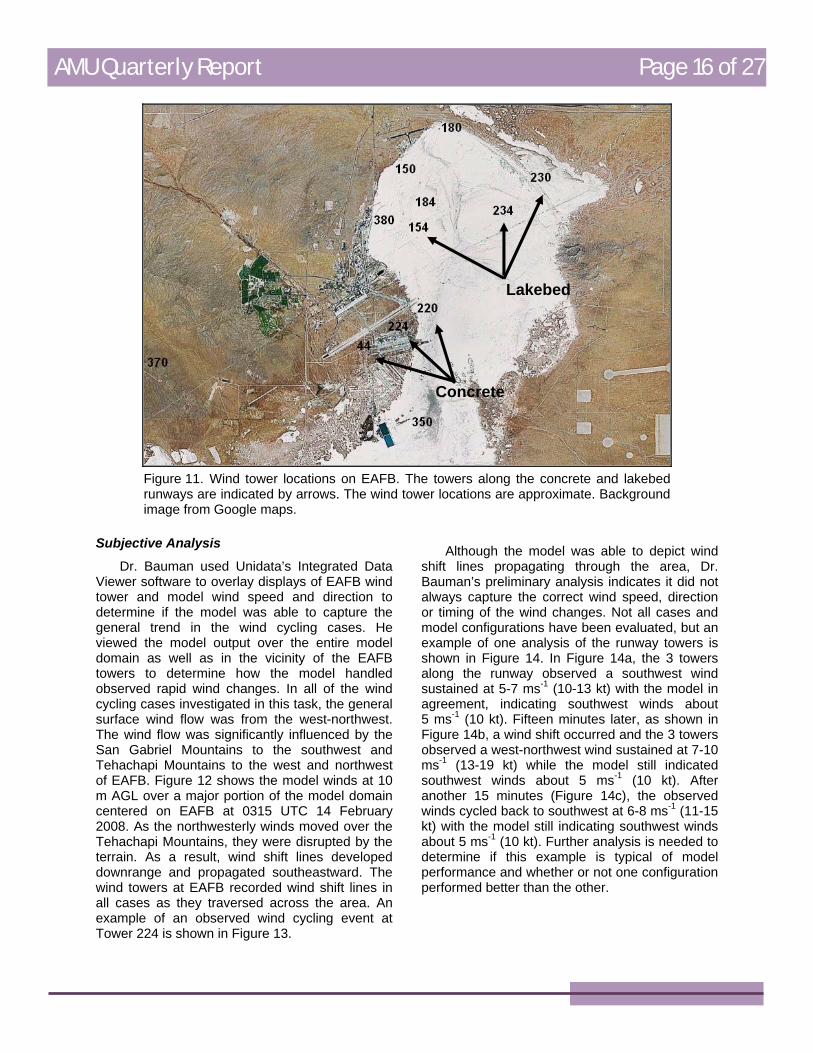
Wind cycling events occur when there is an oscillation in wind direction and/or wind speed among the wind tower network near the EAFB runway complex. Figure 11 shows the approximate locations of the towers along the EAFB runway complex. During these cycling events, the wind speed and direction reported from the towers near the concrete runway (Towers 44, 220, 224) are noticeably different than that reported from towers near the lakebed runway (Towers 154, 230, 234). These events usually occur from 90 minutes up to a 4 hour or longer period and most often occur when the prevailing wind is from the northwest or west-northwest.
In addition to the seven wind cycling case days previously identified, Dr. Watson randomly chose two null case days, or non-wind cycling days for this study: 9 June 2007 and 11 November 2007. All LAPS-ARW, ADAS-ARW, and LAPS-NMM configurations were completed for the wind cycling and null case days. These included: • LAPS-ARW with the Yonsei University
planetary boundary layer (PBL) scheme and MM5 similarity surface layer scheme (LAPSARW_Yonsei),
• LAPS-ARW with the Mellor-Yamada-Janjic PBL scheme and ETA similarity surface layer scheme (LAPSARW_MYJ),
• LAPS-NMM with the National Center for Environmental Prediction (NCEP) Global Forecast Systems (GFS) PBL scheme and NCEP GFS surface layer scheme (LAPSNMM_GFS),
• LAPS-NMM with the Mellor-Yamada-Janjic PBL scheme and ETA similarity surface layer scheme (LAPSNMM_MYJ),
• ADAS-ARW with the Yonsei University PBL scheme and MM5 similarity surface layer scheme (ADASARW_Yonsei), and
• ADAS-ARW with the Mellor-Yamada-Janjic PBL scheme and ETA similarity surface layer scheme (ADASARW_MYJ).
All other physics parameters were the same for each model run.
AMU Quarterly Report Page 16 of 27
Lakebed
Concrete
Figure 11. Wind tower locations on EAFB. The towers along the concrete and lakebed runways are indicated by arrows. The wind tower locations are approximate. Background image from Google maps.
Subjective Analysis
Dr. Bauman used Unidata’s Integrated Data Viewer software to overlay displays of EAFB wind tower and model wind speed and direction to determine if the model was able to capture the general trend in the wind cycling cases. He viewed the model output over the entire model domain as well as in the vicinity of the EAFB towers to determine how the model handled observed rapid wind changes. In all of the wind cycling cases investigated in this task, the general surface wind flow was from the west-northwest. The wind flow was significantly influenced by the San Gabriel Mountains to the southwest and Tehachapi Mountains to the west and northwest of EAFB. Figure 12 shows the model winds at 10 m AGL over a major portion of the model domain centered on EAFB at 0315 UTC 14 February 2008. As the northwesterly winds moved over the Tehachapi Mountains, they were disrupted by the terrain. As a result, wind shift lines developed downrange and propagated southeastward. The wind towers at EAFB recorded wind shift lines in all cases as they traversed across the area. An example of an observed wind cycling event at Tower 224 is shown in Figure 13.
Although the model was able to depict wind shift lines propagating through the area, Dr. Bauman’s preliminary analysis indicates it did not always capture the correct wind speed, direction or timing of the wind changes. Not all cases and model configurations have been evaluated, but an example of one analysis of the runway towers is shown in Figure 14. In Figure 14a, the 3 towers along the runway observed a southwest wind sustained at 5-7 ms-1 (10-13 kt) with the model in agreement, indicating southwest winds about 5 ms-1 (10 kt). Fifteen minutes later, as shown in Figure 14b, a wind shift occurred and the 3 towers observed a west-northwest wind sustained at 7-10 ms-1 (13-19 kt) while the model still indicated southwest winds about 5 ms-1 (10 kt). After another 15 minutes (Figure 14c), the observed winds cycled back to southwest at 6-8 ms-1 (11-15 kt) with the model still indicating southwest winds about 5 ms-1 (10 kt). Further analysis is needed to determine if this example is typical of model performance and whether or not one configuration performed better than the other.

AMU Quarterly Report Page 17 of 27
EAFB
Tehachapi Pass
ADAS ARW10 m AGL Winds0315Z 14 Feb 08
Figure 12. Satellite map of EAFB and surrounding area with 10 m AGL model output winds displayed (cyan). Wind shift lines are indicated by the dashed red lines. Red arrows show approximate propagation direction of the wind shift lines.
0.00
2.00
4.00
6.00
8.00
10.00
12.00
14.00
0:00
1:00
2:00
3:00
4:00
5:00
6:00
7:00
8:00
9:00
10:00
11:00
12:00
13:00
14:00
15:00
16:00
17:00
18:00
19:00
20:00
21:00
22:00
23:00
Average Spee
d (m
/s)
Time (UTC)
Tower 224 22 Dec 06
Wind Cycling Event
Figure 13. Wind speed plot from EAFB Tower 224 showing a wind cycling event that occurred from 0830 – 1750 UTC.

AMU Quarterly Report Page 18 of 27
Figure 14. Wind tower plots (red) and model forecast winds at 10 m AGL (blue) over a 30-min period from 1045 – 1115 UTC.
Objective Analysis a Dr. Watson downloaded and configured the
latest version of the Model Evaluation Tools (MET) software. This software was developed by the National Center for Atmospheric Research (NCAR) Developmental Testbed Center. It is a state-of-the-art suite of verification tools that use output from the WRF model to compute standard verification scores comparing gridded model data to point or gridded observations. Each statistic computed for this task will compare the gridded WRF model data, available every 15 minutes, to the observations from the 12 EAFB wind towers.
Figures 15, 16, and 17 show examples of some of the output statistics available in the MET software using data from the 22 December 2006 wind cycling case in which wind cycling occurred from forecast hour 3 through 12. The statistics compare all 12 towers combined to the corresponding locations in the model forecast output at 15-minute intervals. Towers that indicated wind cycling events were not separated from those that did not indicate wind cycling. Thus, the objective analysis can not reveal whether the wind cycling phenomena was captured, it can only show how well the model performed overall. The subjective analysis can be used to determine if the model captured the wind cycling events. However, comparison of the objective analyses between the null and wind cycling cases may help determine whether the model is adept at forecasting a mesoscale process such as wind cycling.
b
Figure 15 shows the forecast mean wind speed versus the observed mean wind speed at the 12 tower locations during the 12-hour forecast for all WRF model configurations. Figure 16 shows the forecast mean and observed wind speed at the 12 tower locations versus forecast hour during the 12-hour forecast for all WRF configurations, and the mean error versus forecast hour for all model configurations is shown in Figure 17. It is apparent from these figures that all WRF forecasts under-predict the wind speed at the towers. However, Figure 16 shows all model configurations caught the trend of increased wind speed between forecast hours 0645 and 1115 except the LAPSNMM_GFS run. Based on these preliminary results, the LAPSNMM_GFS was the worst performer on this day.
c
For more information contact Dr. Watson at [email protected] or 321-853-8264 or Dr. Bauman at [email protected] or 321-853-8202.

AMU Quarterly Report Page 19 of 27
0
2
4
6
8
10
12
14
0 2 4 6 8 10 12
Observed Wind Spee
d (m
/s)
Forecast Wind Speed (m/s)
Forecast vs. Observed Mean
14
LAPSARW_Yonsei LAPSARW_MYJ ADASARW_Yonsei
ADASARW_MYJ LAPSNMM_GFS LAPSNMM_MYJ Figure 15. Mean forecast vs. observed wind speed (m/s) for all 12 towers locations for all model configurations during the 12-hour forecast on 22 December 2006.
0
2
4
6
8
10
12
14
0000
0100
0200
0300
0400
0500
0600
0700
0800
0900
1000
1100
1200
Wind Spee
d (m
/s)
Forecast Hour
Forecast and Observed Mean
LAPSARW_Yonsei
LAPSARW_MYJ
ADASARW_Yonsei
ADASARW_MYJ
LAPSNMM_GFS
LAPSNMM_MYJ
OBS
Figure 16. Mean forecast and observed wind speed (m/s) vs. forecast hour for all 12 towers locations for all model configurations on 22 December 2006.

AMU Quarterly Report Page 20 of 27
‐10
‐8
‐6
‐4
‐2
0
2
4
0000
0100
0200
0300
0400
0500
0600
0700
0800
0900
1000
1100
1200
Forecast Hour
Mean Error
LAPSARW_Yonsei LAPSARW_MYJ ADASARW_Yonsei
ADASARW_MYJ LAPSNMM_GFS LAPSNMM_MYJ Figure 17. Mean forecast error vs. forecast hour for all 12 towers locations for all model configurations on 22 December 2006.
AMU CHIEF’S TECHNICAL ACTIVITIES (Dr. Merceret) Dr. Merceret completed studying the
probability distribution of gust factors (GF) in hurricanes Frances and Jeanne (2004). He did not find a standard probability distribution that fit all cases well, but built models based on both the Gaussian distribution of GF and the lognormal distribution of (GF-1). He determined that the two models worked equally well overall, although the Gaussian model fit some data better and the lognormal model fit others better. Using both models, Dr. Merceret developed a tool in Excel® for the 45 WS to determine the probability of
exceeding a stated peak wind threshold given a stated mean wind.
Dr. Merceret received wind tower data collected during Hurricane Wilma from Ms. Winters of the 45 WS. He used the Wilma data to perform an independent verification of the hurricane gust factor tool. The tool performed very well on the Wilma data. Dr. Merceret prepared a manuscript describing the development and performance of the tool for submission to the National Weather Digest.

AMU Quarterly Report Page 21 of 27
AMU OPERATIONS IT Communications
Mr. Barrett worked on issues related to the switchover to the NASA network, including Windows group policy, computer security, and computer backups.
Conferences and Meetings
AMU team members prepared two posters and one oral presentation for the 33rd National Weather Association Annual Meeting in Louisville, KY in October as follows:
• Drs. Watson and Bauman completed a poster titled “Performance of a Local Mesoscale Model with Data Denial”,
• Mr. Barrett completed a poster titled “Displaying Composite and Archived Soundings in the Advanced Weather Interactive Processing System”, and
• Ms. Crawford completed a presentation titled “Developing a Peak Wind Probability Forecast Tool for Kennedy Space Center and Cape Canaveral Air Force Station”.
General
Mr. Barrett installed the Weather Event Simulator to used for the development and testing of AWIPS applications. The AMU installed new equipment LAN racks, purchased by the 45 WS, in the AMU lab area after electricians completed moving outlets to provide power for the new configuration. The new racks are better suited to AMU equipment needs, have more usable space than the old racks and have a smaller footprint.
The AMU was evacuated 19 – 22 August due to Tropical Storm Fay. Dr. Bauman powered down all the AMU computer equipment and covered it with plastic for protection from water damage on Tuesday morning, 19 August. All AMU computers were restarted when the AMU Team came back to work on Monday, 25 August.

AMU Quarterly Report Page 22 of 27
REFERENCESBarrett, J. H., W. H. Bauman, and J. Keen, 2007:
Anvil Tool in the Advanced Weather Interactive Processing System: Phase I Final Report. NASA Contractor Report CR-2007-214729, Kennedy Space Center, FL, 26 pp. [Available from ENSCO, Inc., 1980 N. Atlantic Ave., Suite 230, Cocoa Beach, FL, 32931, and on the AMU website at http://science.ksc.nasa.gov/amu/final.html]
Barrett, J. H. and D. A. Short, 2008: Peak Wind Tool for General Forecasting Final Report. NASA Contractor Report CR-2008-214743, Kennedy Space Center, FL, 59 pp. [Available from ENSCO, Inc., 1980 N. Atlantic Ave., Suite 230, Cocoa Beach, FL, 32931 and http://science.ksc.nasa.gov/amu/final.html]
Dye, J. E., M. G. Bateman, D. M. Mach, C. A. Grainger, H. J. Christian, H. C. Koons, E. P. Krider, F. J. Merceret, and J. C. Willett, 2006: The scientific basis for a radar-based lightning launch commit criterion for anvil clouds. Preprint 8.4, 12th Conf. on Aviation, Range, and Aerospace Meteorology, Atlanta, GA, Amer. Meteor. Soc., 4 pp. [Available online at: http://ams.confex.com/ams/pdfpapers/100563.pdf]
Dye, J. E., M. G. Bateman, H. J. Christian, E. Defer, C. A. Grainger, W. D. Hall, E. P. Krider, S. A. Lewis, D. M. Mach, F. J. Merceret, J. C. Willett, and P. T. Willis, 2007: Electric fields, cloud microphysics and reflectivity in anvils of Florida thunderstorms, J. Geophys. Res., 112, D11215, doi10.1029/2006JD007550.
Lambert, W., 2002: Statistical Short-Range Guidance for Peak Wind Speed Forecasts on Kennedy Space Center/Cape Canaveral Air Force Station: Phase I Results. NASA Contractor Report CR-2002-211180, Kennedy Space Center, FL, 39 pp. [Available from ENSCO, Inc., 1980 N. Atlantic Ave., Suite 230, Cocoa Beach, FL 32931 and http://science.ksc.nasa.gov/amu/final.html.]
Lambert, W., 2003: Extended Statistical Short-Range Guidance for Peak Wind Speed Analyses at the Shuttle Landing Facility: Phase II Results. NASA Contractor Report CR-2003-211188, Kennedy Space Center, FL, 27 pp. [Available from ENSCO, Inc., 1980 N. Atlantic Ave., Suite 230, Cocoa Beach, FL 32931 and http://science.ksc.nasa.gov/amu/final.html.]
Merceret, F. J., M. McAleenan, T. M. McNamara, J. W. Weems, and W. P. Roeder, 2006: Implementing the VAHIRR Launch Commit Criteria Using Existing Radar Products. Preprints, 12th Conf. on Aviation, Range and Aerospace Meteorology, Atlanta, GA, Amer. Meteor. Soc., 8 pp. [Available online at: http://ams.confex.com/ams/pdfpapers/98076.pdf]
Willett, J. C., H. C. Koons, E. P. Krider, R. L. Walterscheid, and W. D. Rust, 1999: Natural and Triggered Lightning Launch Commit Criteria (LLCC), Aerospace Report A923563, Aerospace Corp., El Segundo, CA, 23 pp.

AMU Quarterly Report Page 23 of 27
List of Acronyms 30 SW 30th Space Wing 30 WS 30th Weather Squadron 45 RMS 45th Range Management Squadron 45 OG 45th Operations Group 45 SW 45th Space Wing 45 SW/SE 45th Space Wing/Range Safety 45 WS 45th Weather Squadron ABFM Airborne Field Mill Program ADAS ARPS Data Analysis System AFSPC Air Force Space Command AFWA Air Force Weather Agency AMS American Meteorological Society AMU Applied Meteorology Unit ARPS Advanced Regional Prediction System ARW Advanced Research WRF AWIPS Advanced Weather Interactive
Processing System CCAFS Cape Canaveral Air Force Station CSR Computer Sciences Raytheon EAFB Edwards Air Force Base, CA ER Eastern Range FR Flight Rules FSU Florida State University FY Fiscal Year GF Gust Factor GSD Global Systems Division GUI Graphical User Interface JSC Johnson Space Center KSC Kennedy Space Center LAPS Local Analysis and Prediction System
LCC Launch Commit Criteria LLCC Lightning LCC MET Model Evaluation Tools MIDDS Meteorological Interactive Data Display
System MSFC Marshall Space Flight Center NCAR National Center for Atmospheric
Research NM Nautical Miles NMM Non-hydrostatic Mesoscale Model NOAA National Oceanic and Atmospheric
Administration NWS National Weather Service PC Personal Computer POR Period of Record SLF Shuttle Landing Facility SMC Space and Missile Center SMG Spaceflight Meteorology Group SPoRT Short-term Prediction Research and
Transition USAF United States Air Force UTC Universal Coordinated Time VAHIRR Volume Averaged Height Integrated
Radar Reflectivity WRF Weather Research and Forecasting
Model WR Western Range WSR-88D Weather Surveillance Radar 1988
Doppler XMR CCAFS Sounding 3-letter Identifier
AMU Quarterly Report Page 24 of 27
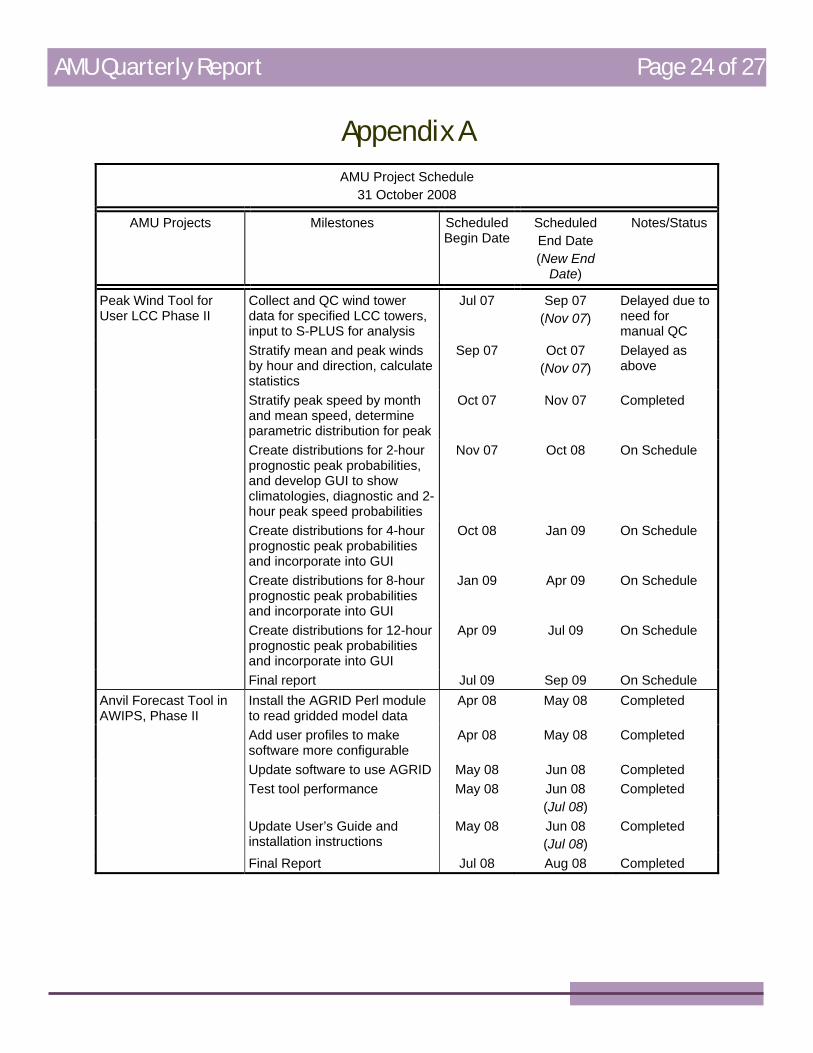
Appendix A AMU Project Schedule
31 October 2008
AMU Projects Milestones Scheduled Begin Date
Scheduled End Date (New End
Date)
Notes/Status
Peak Wind Tool for User LCC Phase II
Collect and QC wind tower data for specified LCC towers, input to S-PLUS for analysis
Jul 07 Sep 07 (Nov 07)
Delayed due to need for manual QC
Stratify mean and peak winds by hour and direction, calculate statistics
Sep 07 Oct 07 (Nov 07)
Delayed as above
Stratify peak speed by month and mean speed, determine parametric distribution for peak
Oct 07 Nov 07 Completed
Create distributions for 2-hour prognostic peak probabilities, and develop GUI to show climatologies, diagnostic and 2-hour peak speed probabilities
Nov 07 Oct 08 On Schedule
Create distributions for 4-hour prognostic peak probabilities and incorporate into GUI
Oct 08 Jan 09 On Schedule
Create distributions for 8-hour prognostic peak probabilities and incorporate into GUI
Jan 09 Apr 09 On Schedule
Create distributions for 12-hour prognostic peak probabilities and incorporate into GUI
Apr 09 Jul 09 On Schedule
Final report Jul 09 Sep 09 On Schedule Anvil Forecast Tool in AWIPS, Phase II
Install the AGRID Perl module to read gridded model data
Apr 08 May 08 Completed
Add user profiles to make software more configurable
Apr 08 May 08 Completed
Update software to use AGRID May 08 Jun 08 Completed Test tool performance May 08 Jun 08
(Jul 08) Completed
Update User’s Guide and installation instructions
May 08 Jun 08 (Jul 08)
Completed
Final Report Jul 08 Aug 08 Completed

AMU Quarterly Report Page 25 of 27
AMU Project Schedule 31 October 2008
AMU Projects Milestones Scheduled Begin Date
Scheduled End Date (New End
Date)
Notes/Status
EAFB Statistical Guidance Wind Tool
Acquire, examine, and format data obtained from MSFC into Excel
May 08 May 08 Completed
Create Excel PivotTables and modify PC-based GUI code
May 08 Sep 08 Completed
Test PC-based GUI Sep 08 Sep 08 Completed Final Report Oct 08 Nov 08 On Schedule Peak Wind Tool for General Forecasting - Phase II
Collect wind tower data, CCAFS soundings, and SLF observations
Sep 08 Sep 08 Completed
Interpolate 1000-ft sounding data to 100-ft increments for October 1996 to April 2008. Compare interpolated data to 100-ft sounding data for October 2002 to April 2008.
Sep 08 Oct 08 On Schedule
QC SLF observations Oct 08 Nov 08 On Schedule QC wind tower data Nov 08 Jan 09 On Schedule Create prediction equations for
peak winds Feb 09 Apr 09 On Schedule
Create and test Excel GUI application
May 09 Jun 09 On Schedule
Compare Phase I and II tools using 2 cool-seasons of 45 WS-issued wind warnings/advisories
Jul 09 Aug 09 On Schedule
Compare Phase I and II tools to either MOS or model forecast winds
Sep 09 Oct 09 On Schedule
Compare Phase I and II tools to wind tower climatology from AMU’s Peak Wind for User LCC task
Nov 09 Dec 09 On Schedule
Transition tool to MIDDS to provide 5-day peak wind forecasts, using model data
Jan 10 Jun 10 On Schedule
Final Report and training Jul 10 Sep 10 On Schedule

AMU Quarterly Report Page 26 of 27
AMU Project Schedule 31 October 2008
AMU Projects Milestones Scheduled Begin Date
Scheduled End Date (New End
Date)
Notes/Status
Volume-Averaged Height Integrated Radar Reflectivity (VAHIRR)
Acquisition and setup of development system and preparation for Technical Advisory Committee meeting
Mar 05 Apr 05 Completed
Software Recommendation and Enhancement Committee meeting preparation
Apr 05 Jun 05 Completed
VAHIRR algorithm development
May 05 Oct 05 (Jul 06)
Completed
ORPG documentation updates Jun 05 Oct 05 (Sep 06)
Completed
Configure ORPG and AWIPS system in the AMU for live data testing.
Oct 05 Jan 06 (Apr 07)
Completed
Conduct Acceptance Test Procedures
May 07 Aug 07 (Jan 08)
Completed
Preparation of products for delivery and memorandum
Oct 05 Jan 06 (Jul 08)
Completed
VAHIRR Cost-Benefit Analysis
Identify Potential Cases and Acquire Data
Jun 08 Jul 08 Completed
Calculate VAHIRR for Cases Jul 08 Aug 08 Completed Compile and Analyze Results Aug 08 Sep 08 Completed Final Report Sep 08 Oct 08 On Schedule WRF Wind Sensitivity Study at Edwards AFB (EAFB)
Identify wind cycling cases at EAFB and archive data
Jan 08 Jun 08 Completed
Compare multiple model configurations and physical parameterization settings to predict wind speed and direction at EAFB
Mar 08 Nov 08 On Schedule
Final report and recommendations
Nov 08 Dec 08 On Schedule

AMU Quarterly Report Page 27 of 27
NOTICE
Mention of a copyrighted, trademarked, or proprietary product, service, or document does not constitute endorsement thereof by the author, ENSCO, Inc., the AMU, the National Aeronautics and Space Administration, or the United States Government. Any such mention is solely for the purpose of fully informing the reader of the resources used to conduct the work reported herein.