an abstract of the thesis of browning inhibition
TRANSCRIPT

AN ABSTRACT OF THE THESIS OF
Ling Wen for the degree of Doctor of Philosophy in Food Science and Technologypresented on June 18, 2001. Title: Pineapple Juice: Phenolic Composition and EnzymaticBrowning Inhibition.
Abstractapproved:
Ronald E. Wrolstad
The phenolic profile of pineapple juice was analyzed by reverse-phase HPLC/Diode
Array Detector, and 9 major peaks accounting for 70% of total peak area were
characterized. None of these peaks are represented by the pineapple phenolics reported to
be present by previous workers. Most of the major peaks are not typically considered as
phenolic compounds by the commonly accepted definition, and these peaks are: two
aromatic amino acids -- tyrosine and tryptophan, dimethylhydroxylfuranone (DMHF) and
its fi-glucoside, and serotonin. One of the major peaks is characterized as a p-coumaric
acid-like compound because they have very similar 'UV spectra and retention times. This
is possibly why p-coumaric acid has been reported in the literature. The other three peaks
are sinapyl derivatives with amino acid or peptides, and they are: S-sinapyl-L-cysteine,
N-L-y-glutamyl-S-sinapyl-L-cysteine, and S-sinapyl glutathione. This is the first time to
report their existence in nature. Their structures were elucidated from UV spectra, acid
hydrolysis and subsequent amino acid analysis, mass spectrometry, and 1D/2D NMR
Spectroscopy. These sinapyl derivatives are possibly unique to pineapple, and may serve
as marker compounds for pineapple juice.

A phenolic compositional database of these 9 major peaks have been created from 54
commercial authentic pineapple juice concentrates, which consist of major commercial
varieties and have been collected over 3 consecutive years from the most significant
growing regions around the world. Means and standard deviations were as follows
(mg/l00 mL single-strength juice, normalized to 12.8 °Brix): tyrosine, 3.6(1.4);
serotonin, 1.8(0.8); dimethylhydroxylfuranone, 1.4(0.7); dimethylhydroxylfuranone
glucoside, 6.2(3.0); tryptophan, 2.2(0.9); S-sinapyl-L-cysteine, 1.1(0.6); N-y-L-glutamyl-
S-sinapyl-L-cysteine, 2.3(1.1); S-sinapyl glutathione, 5.4(1.4); and a p-coumaric acid-
like phenolic compound (calculated as p-coumaric acid), 0.5(0.4). This information will
be useful for evaluation of authenticity and quality.
Pineapple juice has been demonstrated to have enzymatic browning inhibition
activity, but the information about the nature of the inhibitor(s) is very limited. In order to
characterize the m ajor inhib itor(s) in p ineapple j uice, three different p ineapple j uices,
fresh, canned, and frozen concentrate, were investigated by using a combination of
fractionation methods. It was found: The inhibition activity could be mainly contributed
by protease in fresh juice, by artificially added ascorbic acid in canned juice, and possibly
by a p ossibly v ery p olar o rganic acid (neither ascorbic acid nor citric acid) in frozen
concentrate.

Pineapple Juice: Phenolic Composition and Enzymatic Browning Inhibition
by
Ling Wen
A THESIS
submitted to
Oregon State University
in partial fulfillment ofthe requirements for the
degree of
Doctor of Philosophy
Completed June18, 2001Commencement June, 2002
Doctor of Philosophy thesis of Ling Wen presented on June 18, 2001
APPROVED:
\‘ .,(A4ksia E_ U)NANIteitMajor Professor, representing Food Science and Technology
Dean of Gra•t chool
I understand that my thesis will become part of the permanent collection of Oregon StateUniversity libraries. My signature below authorizes release of my thesis to any readerupon request.
Ling Wen, Author
ACKNOWLEDGMENTS
I want to express my deepest gratitude to Dr. Ronald E. Wrolstad, for his
unconditional support and guidance during all of my years at Oregon State University. He
is the most enjoyable person to work with, and he also gave me a lot of personal help
beyond academia.
Thank you also to all the friends I met here at FST. Among them, a special thanks to
Bob Durst for his excellent technical advise and friendship. He is a kind of the guy whom
you can always rely on when something is broken in the laboratory. Also, thanks go to all
my labmates, Monica Giusti, Lucho Rodrigues-Saoma, Eric Fan-Chiang, Xialing Dong,
Jung-Min Lee, Myriam Kucza, Keith Klesk, Arusa Chaovanalikit, Maria Widyasari,
Thanyaporn Siriwoharn, visiting scientists Gtete Skrede, Feryl Karadeniz, who gave me
help and made my experience in the laboratory more enjoyable.
I also want to thank the FST faculty and staff, especially to Anita Brown for her great
help.
I want to thank the Washington-Oregon Tree Fruit Commission for its fmancial
support, the National Food Processor Association and Dole Food Company for providing
pineapple juice samples.
Finally, I want to thank my wife, my children and m y p arents for t heir 1 ove and
support.

CONTRIBUTIONS OF AUTHORS
Dr. Ronald E. Wrolstad was involved in the design, analysis, and writing of each
manuscript. Dr. Victor L. Hsu ran most of NMR experiments and assisted in NNIR data
interpretation in chapter 1E.

TABLE OF CONTENTSPage
CHAPTER I. INTRODUCTION 1
CHAPTER II. LITERATURE REVIEW 3
PHENOLICS 3
Definition 3Classification 3Importance to juice 4Relationship to health 4Analysis 9
ENZYMATIC BROWNING 10
Mechanism 10Inhibition 13
PINEAPPLE JUICE 16
Production and horticultural aspects 16General composition 17Phenolics 18Enzymatic browning inhibition activity 20
CHAPTER III. CHARACTERIZATION OF SINAPYL DERIVATIVESIN PINEAPPLE (Ananas comosus [L.] Merin) JUICE 21
ABSTRACT 22
INTRODUCTION 22
MATERIALS AND METHODS 23
Source 23Extraction 23Semi-preparative HPLC 23Analytical HPLC 24Acid hydrolysis 24Amino acid analysis 24Mass spectrometry 25NMR 25
RESULTS AND DISCUSSION 26

TABLE OF CONTENTS (CONTINUED)
ABBREVIATIONS USED 37
REFERENCES 38
ACKNOWLEDGEMENT 38
CHAPTER IV. PHENOLIC COMPOSITION OF AUTHENTICPINEAPPLE JUICE 39
ABSTRACT 40
INTRODUCTION 40
MATERIALS AND METHODS 44
Source 44Sample preparation 44Standards 46HPLC analytical system 46Characterization of major peaks 47Characterization of DMHF-glucoside 47Retention characterization by ion-exchange 48Quantification of HPLC 48Antioxidant activity analysis 48Statistical analysis 49
RESULTS AND DISCUSSION 49
Sample preparation for HPLC 50Aromatic amino acids 56Serotonin 56DMHF and its glucoside 57Sinapyl derivatives 58Peak 7 59Effect of year and variety on each peak 59Pattern recognition analysis 61
CONCLUSIONS 64
REFERENCES 67
ACKNOWLEDGMENTS 69
TABLE OF CONTENTS (CONTINUED)
CHAPTER V. ISOLATION OF ENZYMATIC BROWNING INHIBITORSFROM PINEAPPLE JUICE 71
ABSTRACT 72
INTRODUCTION 72
MATERIALS AND METHODS 73
Source 73Juice preparation 73Pineapple model solution (MODEL) 74Extraction of apple PPO 74Characterization of apple PPO 74Juice fractionation 75Semi-preparative C 18 HPLC separation 77Amino column HPLC separation 77Measurement of browning inhibition by puree assay 78Measurement of browning inhibition by PPO enzyme assay 78Measurement of browning inhibition by slice assay 78
RESULTS AND DISCUSSION 79
Apple PPO characterization and assay condition selection 79Enzymatic browning inhibition of different pineapple juices 79Fractionation 82HPLC fractionation 86
CONCLUSIONS 87
REFERENCES 89
ACKNOLWDGEMENT 90
CHAPTER VI. SUMMARY 91
BIBLIOGRAPHY 92
APPENDIX 99

LIST OF FIGURES
Figure Page
11.1 Basic structure and numbering of flavonoids 8
11.2 Enzymatic browning reaction 11
II.3 Proposed kinetic scheme depicting the mechanism ofoxidation of o-diphenol 12
Il1.1 Analytical C 18 reverse-phase HPLC of pineapple juice 28
Semi-preparative C 18 reverse-phase HPLC of pineapple juice(after C18 cartridge fractionation) 29
III.3 Acid hydrolysis pattern of compounds 2 and 3 30
Partial structure of doubly linked 15,16-dihydrobiliverdin 31
III.5 Structure of compounds 1, 2 and 3 33
111.6 UV spectrum of compound 1 36
IV.1 Chemical structures of all the identified phenolic peaks in pineapple juice 51
IV.2 HPLC of pineapple juice concentrate 52
IV.3 UV spectrum of peak 7 62
IV.4 Cluster display of pattern recognition analysis ofpineapple concentrate samples 65
V.1 Outline of fractionation of pineapple juice 76
V.2 Dependence of PPO activity on pH and substrate concentration 80
V.3 Enzymatic inhibition result of preliminary fractionation of pineapple juice.Sample: Frozen pineapple juice concentrate; Inhibition assay: puree assay 84
V.4 Enzymatic inhibition result of preliminary fractionation of pineapple juice.Sample: Different pineapple juices; Inhibition assay: PPO assay 85
V.5 HPLC fractionation of enzymatic browning inhibitor(s) 88

LIST OF TABLES
Table Page
11.1 Main classes of phenolic compounds 5
11.2 Classification of flavonoids 6
11.3 Procedures used to limit browning 14
11.4 Summary of reported phenolic composition of pineapple 19
HU 1 H NMR data for compoundsl, 2 and 3 27
13C NMR spectral data for compound 2 34
111.3 Cross-peaks in HMBC spectra of compound 2 35
IV.l Summary of reported phenolic composition of pineapple 42
IV.2 Source of pineapple juice concentrate 45
W.3 Summary of phenolic content of pineapple juice 53
W.4 Summary of phenolic content of pineapple 55
W.5 Antioxidant activity of sinapyl derivatives 60
W.6 Analysis of variance for effect of year and variety on phenolic concentration 63
W.7 Coefficients for multiple variable analysis (PCA and CVA) 66
V.1 Effect of enzymatic browning inhibition of different pineapple juices 81

PINEAPPLE JUICE: PHENOLIC COMPOSITION AND ENZYMATICBROWNING INHIBITION
CHAPTER I. INTRODUCTION
An earlier work from our laboratory (Lozano-de-Gonzalez et al., 1993) demonstrated
that pineapple juice was an effective enzymatic browning inhibitor in b oth fresh and
dried apples, but we had very limited information as to the nature of the inhibitor(s).
Since some phenolic compounds can act as the substrates for the enzymatic browning
while some other ones act as inhibitors, it would be very helpful if the phenolic
composition of pineapple juice were known. Coincidentally in 1996, the National Food
Processor Association (NFPA) had just finished a collaborative study on the general
composition of commercially made authentic pineapple juice concentrate, and the
phenolic composition of these samples was highly desired to make this compositional
database complete. NFPA asked our laboratory to help on this project. Because of the
mutual benefits, we were pleased to participate in the project.
While pineapple juice is a major commercial product in international commerce, its
phenolics profile has not been well characterized, and only a few papers have been
published on the phenolic composition of pineapple fruit (Macheix et al, 1990), juice
(Fernandez de Simon et al., 1992) and shell fiber (Larrauri et al, 1997). We found,
however, in a preliminary investigation of pineapple juice phenolics by reverse phase
HPLC/DAD, that the retention time and UV spectra of the major peaks did not match the
phenolic compounds previously reported to be present. In this study, we conducted
extensive analyses of the pineapple juice phenolic profile, and 9 major peaks accounting
2
for 70% of total peak area were characterized. A phenolic compositional database of 54
authentic p ineapple juice concentrates, which consisted of major commercial varieties
and were collected over 3 years from significant growing regions around the world, was
established.
In addition to the characterization and quantification of the phenolics, we wanted to
know their possible role in inhibiting enzymatic browning. By using a combination of
different fractionation methods, we proceeded to investigate what fractions and classes of
compounds could potentially inhibit enzymatic browning.
3
CHAPTER II. LITERATURE REVIEW
PHENOLICS
Definition (Robards et al.,1999).
There is s ome c ontroversy a bout the de fmition o f phenolics. Phenolic compounds
form one of the main classes of secondary metabolites with a large range of structures
and functions, but generally possessing an aromatic ring bearing one or more hydroxy
substituents. This definition is not entirely satisfactory, however, since it inevitably
includes compounds such as oestrone, the female sex hormone that is principally
terpenoid in origin. For this reason, a definition based on metabolic origin is preferable,
the plant phenols being regarded as those substances derived from the shikimate pathway
and phenylpropanoid metabolism.
Classification
Natural polyphenols can range from simple molecules, such as phenolic acids, to
highly polymerized compounds, such as tannins. They occur primarily in conjugated
form, with one or more sugar residues linked to hydroxyl groups, although direct linkages
of the sugar unit to an aromatic carbon atom also exist. The associated sugars can be
present as monosaccharides, disaccharides, or even as oligosaccharides, and glucose is
the most common sugar residue. Associations with other compounds, such as carboxylic
and organic acids, amines, and lipids, and linkage with other phenols are also common
(Bravo, 1998).

4
According to Harborne (1989), polyphenols can be divided into at least 10 different
classes depending on their basic chemical structure. Table II.1 illustrates the basic
chemical structure of the main polyphenolic compounds. Flavonoids, which constitute the
most important single group, can be further subdivided into 13 classes, with more than
6467 known flavonoids described by 1999 (Harborne and Baxter, 1999) (Table II.2). In
order to simplify the drawing of chemical structures, only the skeleton s tructures are
shown in Tables 1 and 2, and there should be at least one hydroxyl group attached to the
aromatic ring.
Importance to juice
Fruit phenolic compounds are relevant in terms of quality, as they have a role in the
visual appearance (pigmentation, browning and haze), taste (astringency) and health-
promoting properties (free-radical scavengers) of different products (Synge, 1975; Siebert
and Lynn, 1997; Tomas-BarberAn and Robins, 1997). Because of the quality concerns,
the effect of processing on phenolic composition have been extensively investigated
(Spanos and Wrolstad, 1990a, 1990b; Spanos et al., 1990).
Because of their ubiquity, specificity and multiplicity, phenolic composition is very
useful for the purpose of authenticity of fruit products and detection of adulteration
(Kirkesy et al., 1995; Rouseff, 1988; Wrolstad et al., 1995).
Relationship to health
Bravo (1998) has given a general review on the nutritional significance of phenolics,
and Harborne and Williams (2000) have given a review specifically on the medicinal

OH
Table 11.1. Main classes of phenolic compounds (adapted from Bravo et al., 1998)
Class Basic Skeleton Basic Structure
5
Simple phenols
Benzoquinones
Phenolic acids
Acetophenones
Phenylacetic acids
Hydroxycinnamic acids
Phenylpropenes
Coumarins, isocoumarins
Chromones
Naftoquinones
Xanthones
Stilbenes
Anthroquinones
Flavonoids
Lignans, neolignans
Lignins
C6
C6
C6-C1
C6-C2
C6-C2
C6-C3
C6-C3
C6-C3
C6-C3
C6-C4
C6-C1-C6
C6-C2-C6
C6-C2-C6
C6-C3-C6
(C6-C3)2
(C6-C3)n

Isoflavonoids
Biflavonoids
Proanthocyandinsorcondensed tannins
6
Table 11.2. Classification of flavonoids (adapted from Bravo et al., 1998)
Flavonoid
Basic Structure Flavonoid Basic Structure
Chalcones
Dihydrochalcones
Aurones
Flavones
Flavonols
Dihydroflavonol
Flavanones
Flavanol
Flavandiol orleucoanthocyanidin
Anthocyanidin
7
properties of flavonoids. The following discussion is mainly taken from these two papers.
Polyphenols traditionally have been considered antinutrients by animal nutritionists,
because of the adverse effect of tannins, one type of polyphenol, on protein digestibility.
However, recent interest in food phenolics has increased greatly owing to their
antioxidant capacity (free radical scavenging and metal chelating activities) and their
possible beneficial implications in human health, such as in the treatment and prevention
of cancer; cardiovascular disease, and other pathologies. Much of the literature refers to a
single group of plant phenolics, the flavonoids (Rice-Evans and Packer, 1998; Frankel et
al., 1995, Hertog et al., 1997; Hertog et al., 1995).
Phenolic antioxidants function as terminators of free radicals and chelators of metal
ions t hat are capable of catalyzing lipid oxidation. However, under certain conditions
(high concentrations of phenolic antioxidants, high pH, presence of iron), phenolic
antioxidants can initiate an autooxidation process and behave like prooxidants (Shahidi
and Wanasundara, 1992).
The efficiency of polyphenols as antioxidant compounds greatly depends on their
chemical structure. Phenol itself is inactive as antioxidant, but ortho- and para-
diphenolics have antioxidant capacity, which increases with the substitution of hydrogen
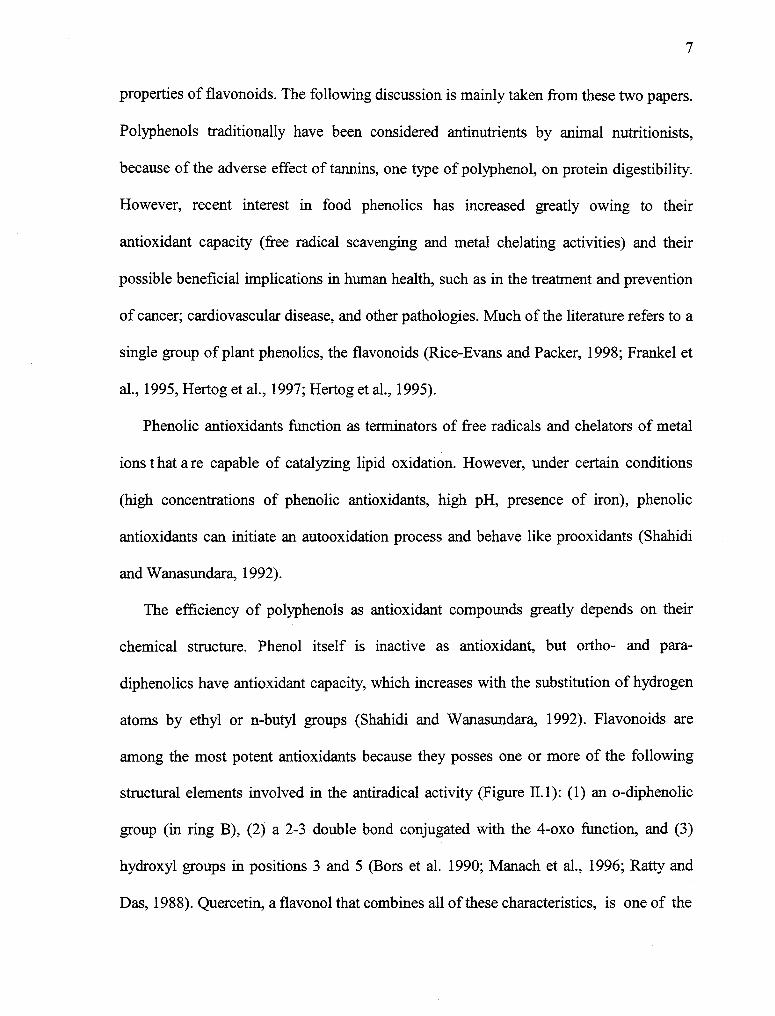
atoms by ethyl or n-butyl groups (Shahidi and Wanasundara, 1992). Flavonoids are
among the most potent antioxidants because they posses one or more of the following
structural elements involved in the antiradical activity (Figure II.1): (1) an o-diphenolic
group (in ring B), (2) a 2-3 double bond conjugated with the 4-oxo function, and (3)
hydroxyl groups in positions 3 and 5 (Bors et al. 1990; Manach et al., 1996; Ratty and
Das, 1988). Quercetin, a flavonol that combines all of these characteristics, is one of the

Figure II. 1. Basic structure and numbering of flavonoids.
3'
4
8

9
most potent natural antioxidants. Also, the antioxidant efficiency of flavonoids is directly
related with their degree of hydroxylation (Ratty and Das, 1988), but there is some
controversy about the relationship between antioxidant activity and glycosylation. Ratty
and Das (1988) and Acker et al. (1996) found that aglycones are more effective than the
corresponding glycoside, whereas Wang et al. (1997) and Tsuda et al. (1994) found that
this was not necessarily true. The controversy could be caused by the different methods
used to measurement antioxidant activity.
Analysis
Phenolics can be quantified as total, as subgroups, or as individual compounds. Total
phenolics can be analyzed by the Folin reaction, vanillin reaction, titanium chloride and
Prussian blue. The Folin reaction is the most general purpose while the other methods are
either not general purpose, or the intensity of developed color depends on chemical
structures (Shahidi and Naczk, 1995), although the last two methods can give comparable
or more sensitive results than the Folin procedure in some cases (Harborne, 1989). The
disadvantage of the Folin assay is the interference of reducing substances such as
ascorbic acid (Shahidi and Naczk, 1995). Sometimes, measurement of a subgroup of
phenolics, for e xample, a nthocyanins, is de sired. Guis ti and Wrolstad (2001) gave an
extensive description about the procedure of measuring total anthocyanins. If analysis of
individual phenolics is needed, chromatographic methods such as HPLC, TLC and GC
are used, with HPLC as the predominant method (Kirksey et al., 1995). When HPLC is
used with a diode array detector, it c an b e us ed t o r esolve the c oelution p roblem b y
checking peak purity (Spanos and Wrolstad, 1990a, 1990b; Spanos et al., 1990). Most

10
often, fractionation or purification is required to achieve satisfactory separation on HPLC
because of the complexity of the phenolic profile found in most fruit and vegetable
products. For example, to analyze procyanidins in apple, grape and pear juice, the other
interfering phenolic compounds can be removed by using Sephadex LH-20 (Spanos and
Wrolstad, 1990a, 1990b; Spanos et al., 1990).
ENZYMATIC BROWNING
Basically, enzymatic browning can be defined as the initial enzymatic oxidation of
phenols into slightly colored quinones (Nicolas et al.,1994). These quinones are t hen
subjected to further reactions, enzymatically catalyzed or not, leading to the formation of
pigments. With a few exceptions (prunes, raisins, dates, apple juice etc.), enzymatic
browning is generally considered as degradation and lower quality with regard to
appearance, taste and nutritional characteristics.
Mechanism
Enzymatic browning is mainly associated with polyphenol oxidases, which are able to
act on phenols in the presence of oxygen. Two kinds of enzymes are classified under this
trivial name (Nicolas et al., 1994). The first class, catechol oxidases (E.C. 1.10.3.1),
catalyzes two distinct reactions (Figure II.2a): the hydroxylation of monophenols into o-
diphenols (reaction 1) and the oxidation of o-diphenols into o-quinones (reaction 2).
These two enzymatic reactions consume oxygen and are referred to as monophenolase (or

OH
OH Laccase + H20
0OH 1/2 02
Figure 11.2 Enzymatic browning reaction (Adapted from Nicolas et al., 1994).
11
OH OH1/2 02
+ H20Cresolase
(1)
1/2 02
Catecholase
(2)
a) Reactions catalyzed by polyphenoloxidase (E.C. 1.14.18.1 and E.C. 1.10.3.1).(1) Hydroxylation of monophenol to o-diphenol; (2) dehydrogenation of o-diphenol to o-quinone.
b) Reactions catalyzed by laccases (E.C. 1.10.3.2)

2H+
H 0 0
/°\ / \ (:) /,- CU Cu_—
/ IT ,c)II \H
—,CU Cu—/ II
MET
(A)
HO
(B)
O d+\ 0
,CU I CU—/ II II \
d"
+
+ H20
H
O
- CU/ II 9
12
Figure 11.3. Proposed kinetic scheme depicting the mechanism of oxidation of o-diphenol(catechol; top(A) and monophenol; bottom (B)) for Neurospora crassa polyphenoloxidase. (taken from Whitaker and Lee, 1995).
0 0 H+
—,Cu Cu— 'h•- • /Cu Tr\--/ II \ 1/1- —,C I Cu_—U/ II \
DEOXY OXY
13
cresolase) activity and o-diphenolase (or catecholase) activity, respectively (the former is
not always present). The second class, laccases (E.C. 1.10.3.2), oxidizes o-diphenols as
well as p-diphenols (Figure II.2b), and it is not common in fruits although there are
reports of its existence in peach and apricot (Walker, 1995).
The nomenclature of these enzymes is somewhat confusing since in addition to the
two numbers E.C. 1.10.3.1 and E.C. 1.10.3.2, a third one exists, E.C. 1.14.18.1. It is
referred to as monophenol monooxygenase (tyrosinase) and corresponds to the same
enzymes as E.C. 1.10.3.1, which always catalyze the hydroxylation of monophenols
(Nicolas et al., 1994).
Although peroxidases (EC 1.11.1.7) are distributed widely and they can also be
considered as participating in enzymatic browning, they generally appear to be little
involved in enzymatic browning of fruits and vegetables following a mechanical stress.
The explanation could be that the peroxidase activity is limited by the internal level of
hydrogen peroxide (Nicolas et al., 1994).
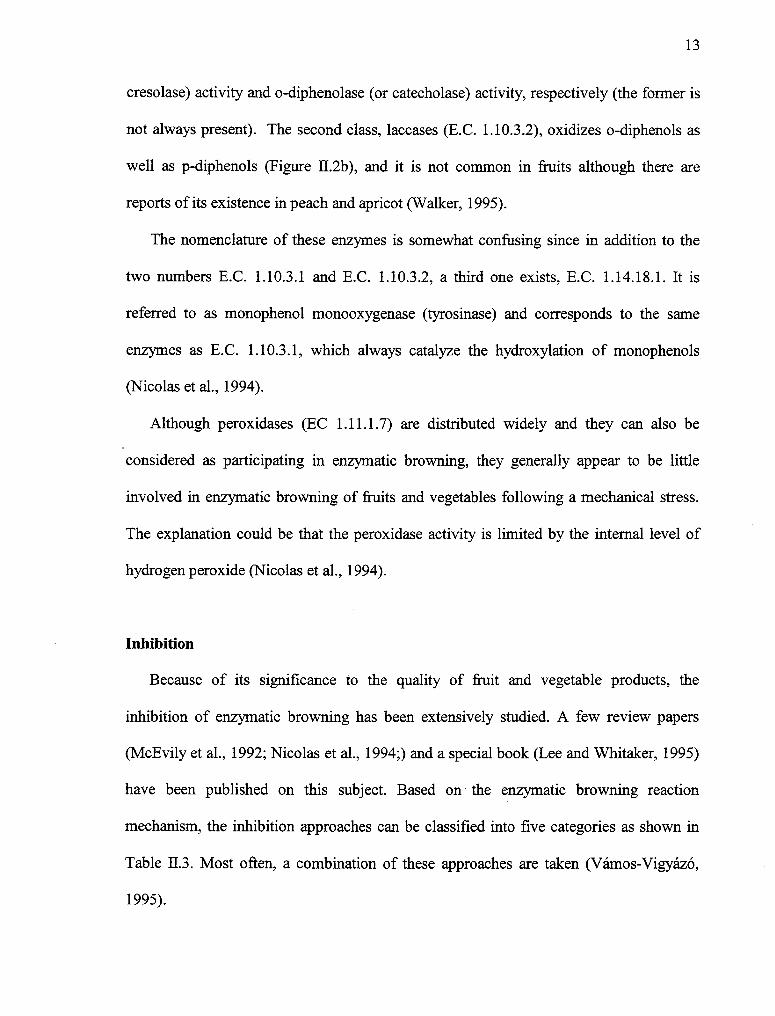
Inhibition
Because of its significance to the quality of fruit and vegetable products, the
inhibition of enzymatic browning has been extensively studied. A few review papers
(McEvily et al., 1992; Nicolas et al., 1994;) and a special book (Lee and Whitaker, 1995)
have been published on this subject. Based on the enzymatic browning reaction
mechanism, the inhibition approaches can be classified into five categories as shown in
Table II.3. Most often, a combination of these approaches are taken (Vämos-VigyazO,
1995).

14
Table Procedures used to limit browning (adapted from Macheix et al., 1990)
Mechanism Experimental conditions
Inhibition of o-DPO NaC1', CaC1240, S023 , low pH37'38'
hightemperature20 '21 , drying, NaOH2'4, metal chelator(sodium diethyldithiocarbamate)35, hormones(gibberellic acid, ethephon) 22, p-coumaric acid6, 4-hexylresorcino1 15 ' 16, unsaturated dicarboxylicacids7'8 , salicylhydroxamic acid23, protease 15
Exclusion of oxygen Controlled atmospheres25 '"'2i , high concentration ofsugars5, paraffin36
Reduction or trapping of quinones Ascorbic acid and derivatives 14' 16, glutathione / 1 ' 18 ,cysteine 17,18 ' 19, N-acetylcysteine11,12,13, 17, 18,, SO2 andmetasulfites 15,17,18,39,polyvinylpyrrolidone28'29,cyclodextrin24
Modification of substrates methylation by O-methyltransferase9, oxidative ring-opening by protocatechute-3,4,-dioxygenasel°
Removal of browning Unitrafiltration31,32,33, resins 30, clarification34,centrifugation33
1. El-Shimi, 1993. 31. Golc.men et al., 1998.2. Sapers and Miller, 1993. 32. Constenla and DLozano, 1995.3. Sayavedra-Soto and Montgomery, 1986. 33. Sapers, 1992.4. Angel and Ben-Shalom, 1979. 34. Dawes et al., 1994.5. Grncarevic and Hawker, 1971. 35. Wesche-Ebeling and Montgomery, 1990.6. Walker and Wilson, 1975. 36. Bhat and Chandel, 1991.7. Janovitz-Klapp et al., 1990. 37. Zemel et al., 1990.8. Son et al., 2000. 38. Tronc et al., 1997.9. Finkel and Nelson, 1963. 39. Taylor et a1.,1986.10. Kelly and Finkle, 1969. 40. Vamos-VigyazO, 1995.11. Buta et al., 1999.12. Edwards and Wedzicha, 1997.13. Friedman,1996.14. Walker1977.15. McEvily et al., 1992.16. Sapers et al., 1989.17. Molnar-Perl and Friedman,1990a18. Molnar-Perl and Friedman,1990b.19. Robert et al., 1996.20. Chan and Yang,197121. Pardon et al., 1975.22. Paulson et al., 1980.23. Allan and Walker, 1988.24. Billaud et al., 1995.25. Smyth and Cameron, A.C., 1988.26. Sapers and Miller, R.L. 1988.27. Gunes and Lee, 1997.28. Okamura and Watanabe, 1981.29. Van Buren et al., 1976.30. Kagami et al., 1968.

15
The PPO inhibitors can be further classified into three subcategories based on the
inhibition mechanism: metal chelators such as sodium diethylthiocarbamate (removing
the copper ion from PPO), substrate analog such as p-coumaric acid, and compounds
such as sulfites which modify the protein structure of PPO.
Sulfites are very effective anti-browning agents, and they are the most widely used
agents in foods to control enzymatic browning (Lambrecht, 1995). They inhibit
enzymatic browning by inhibiting PPO and form a quinone-sulfite complex (Haisman,
1974). However, the concerns over the allergenic reactions in an ever-expanding
asthmatic population promoted the Food and Drug Administration (FDA) to limit the use
of sulfites in fresh fruit and vegetable products (Sapers et al., 1995).
Due to the limitation of sulfites, great efforts have been made to develop sulfite
alternatives. One of such alternatives is 4-hexylresorcinol, which is a synthetic analog to
the enzymatic browning inhibitors isolated from fig (McEvily et al., 1992). 4-
Hexylresorcinol has been demonstrated to inhibit the enzymatic browning in apple (Buta
et al., 1999; Luo and Barbosa-Canovas, 1995), and in pear (Dong et al., 2000; Sapers and
Miller, 1995). However, there are concerns for the use of 4-hexylresorcinol. One concern
is that it may have influence on sensory properties, and Dong et al. (2000) detected the
flavor difference when comparing the treated samples and controls, although it is not
clear if the difference was caused by 4-hexylresorcinol. Another concern is that it is a
synthetic chemical and its future approval of use to fresh fruit and vegetable products is
not clear, although it has been approved to inhibit the blackspot in shrimp (Lambrecht,
1995).

16
Both a scorbic a cid and it s is omer, e rythorbic a cid, have been used to prevent the
enzymatic browning because of their ability to reduce the o-quinones back to diphenols.
However, there are serious shortcomings of either ascorbic acid or erythorbic acid as an
antibrowning agent because they can be easily oxidized by endogenous enzymes, as well
as decomposed by iron or copper-catalyzed autooxidation (McEvily et al., 1992). To
overcome this shortcoming, derivatives of ascorbic acid with increased stability have
been developed, and these derivatives are: ascorbyl phosphate esters (Sapers and Miller,
1992; McEvily et al., 1992) and ascorbyl fatty acid esters (McEvily et al., 1992). The
usage of these derivatives to fruit and vegetables need approval.
However, if avoiding or reducing these treatments during a process is desired, the
long-term solution should be chosen, consisting of selecting and cloning cultivars which
have low browning potential because of low phenolic substrate contents or weak o-DPO
activity. Care must be taken that the other sensory qualities of the fruit and the agronomic
qualities of the plants selected this way are not seriously altered (Macheix et al., 1990).
PINEAPPLE JUICE
Production and horticultural aspects (Abd Shukor et al., 1998)
The geographic origin of pineapple (Ananas comosus [L.] Merr.) is believed to be in
South America, in the region encompassing central and southern Brazil, northern
Argentina and Paraguay. It was rapidly spread in the 15th and 16th centuries by the

17
Portuguese to Africa, India, and later to China and Japan, and by the Spanish to Europe
and the Philippines.
Besides banana, pineapple is perhaps the most popular fruit from the tropics. The
world production of pineapple was estimated to be 11.5 million m.t. in 1992. Thailand
was the largest producer with almost 2 million m.t., followed by the Philippines, China,
Brazil and India.
The fresh pineapple trade varies from 500K to 600K m.t./year. The major exporters
are the Philippines, Hawaii, Ivory Coast, and Mexico. The major importer is E.E.C,
followed by Japan.
For canned pineapple fruit and juices, the trade volume was just over a million
m.t./year. The major importer of canned pineapple was the USA followed by the E.E.C.
The main exporters are Thailand, closely followed by Philippines.
Cayenne is the most important group of pineapple and it is grown for both canning
and fresh fruit. More than 70% of the pineapple grown in the world is from this group.
The majority of large producing countries like Thailand, Philippines, Indonesia and
Australia grow Cayenne for fresh fruit as well as for their canning industry. Varieties or
variants of Cayenne includes Smooth Cayenne, Hilo, Kew, Champaka and Sarawak.
The Queen cultivars are quite extensively cultivated over the world for fresh fruit.
Varieties in this group include Moris, Mauritius, MacGregor, Ripley Queen and
Alexandra.
The Spanish cultivars are not widely cultivated in the world. It is the main canning
cultivar in Malaysia. The common varieties in this group are Singapore Spanish, Ruby,
18
red Spanish, Masmerah, Gandul, Hybrid 36, Selangor Gr een, Na ngka and B etik. T he
Gandul is currently the most widely grown variety for canning in Malaysia.
General composition
Several papers have been published on the general composition of pineapple juice
such as minerals, sugar profile, organic acid profile, and amino acid profile, and physical
properties such as pH, Brix, %ash and titratable acidity (Elkins et al., 1997; Hodgeson &
Hodgson, 1993; Pilando and Wrolstad, 1992; Wallach and Faethe, 1988). Three sugars,
sucrose, glucose and fructose have been reported. As to amino acids, there is some
controversy about presence of tryptophan. Except for Dizy et al. (1992), tryptophan was
not reported being present by other investigators (Elkins et al., 1997; Hodgeson and
Hodgson, 1993; Wallach and Faethe, 1988). Citric acid is the predominant organic acid
(70.1%), followed by malic acid (28.6%) and quinic acid (1.2%) (Pilando and Wrolstad,
1992).
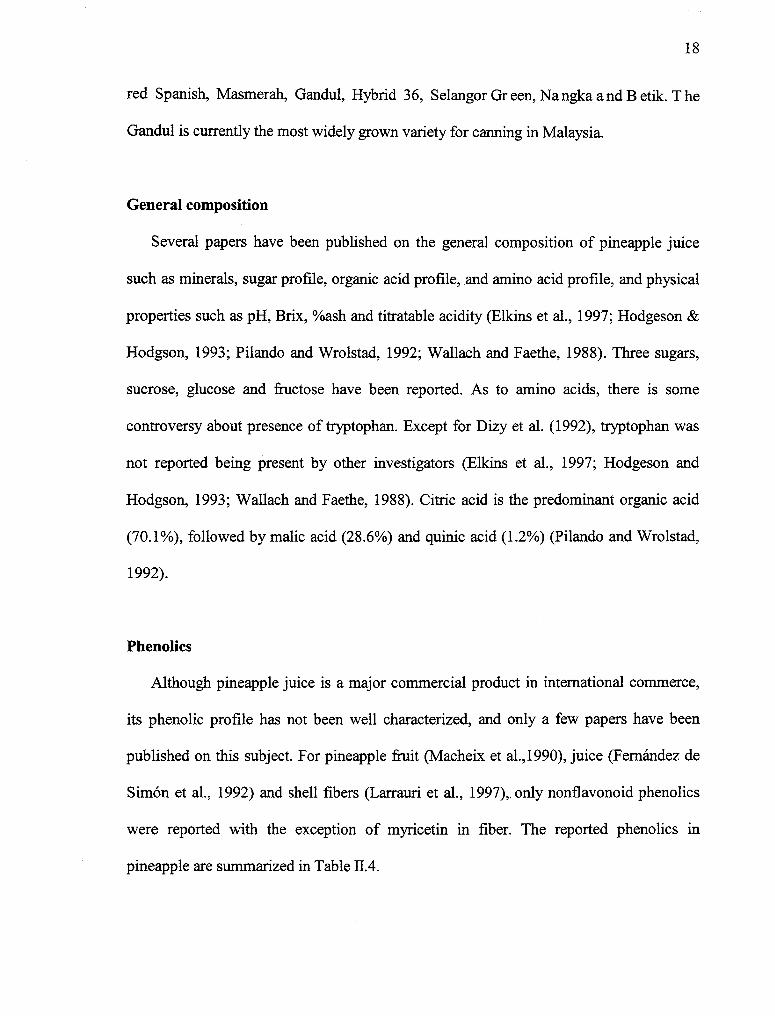
Phenolics
Although pineapple juice is a major commercial product in international commerce,
its phenolic profile has not been well characterized, and only a few papers have been
published on this subject. For pineapple fruit (Macheix et al.,1990), juice (Fernandez de
Simon et al., 1992) and shell fibers (Larrauri et al., 1997), only nonflavonoid phenolics
were reported with the exception of myricetin in fiber. The reported phenolics in
pineapple are summarized in Table 11.4.

Table 11.4. Summary of reported phenolic composition of pineapple
PhenolicsCategory
Fruit' Juice2 Shell fiber3trans-Cinnamic acid xp-Coumaric acidCaffeic acid
x xx
x
Ferulic acidSinapic acid
x xx
p-Coumaroylquinic aciddi-p-Coumaroylquinic acidp-Coumaroyl glucoseCaffeoyl glucose
xxxx
x
FeruloylglucoseSinapoyl glucosep-Hydroxybenzoic acidp-Hydroxybenzoic aldehydeSyringic acid
xx
x
xxx
Salicylic acidTannic acidTyramineMyricetin
xx
x1.Macheix and others 19902. Fernandez de Simon and others 19923. Larrauri and others 1997
19

20
Gardner et al. (2000) investigated the relationship between composition and
antioxidant activity of several juices, orange, apple, pineapple, grapefruit and vegetable
juice. It was found that the antioxidant activity of citrus juices is mainly (>66%)
attributed to ascorbic acid, whereas ascorbic acid contributes less than 5% to the other
products, and 0.8% to pineapple juice. Most of the antioxidant activity is believed to be
due to phenolic compounds in pineapple juice.
Enzymatic browning inhibition activity
Lozano-de-Gonzalez et al. (1993) reported that pineapple juice was an effective
browning inhibitor in both fresh and dried apples. Pineapple juice was fractionated using
various size and charge separation procedures. All fractions inhibited enzymatic
browning of crude apple extracts by at least 26%. The results indicate that the inhibitor is
a neutral compound of low molecular weight.
CHAPTER III
CHARACTERIZATION OF SINAPYL DERIVATIVES IN PINEAPPLE (Ananascomosus [L.] Merin) JUICE
Ling Wenl , Ronald E. Wrolstad l*, and Victor L. Hsu2
21
'Department of Food Science and Technology , Oregon State University2Department of Biochemistry and Biophysics, Oregon State University
Oregon State University, Corvallis, OR 97331-6602.
An extract from a publication in Journal of Agriculture and Food Chemistry, 1999,47(3):850-853
22
ABSTRACT
Three previously unidentified phenolic compounds were found in pineapple (Ananas
comosus [L.] Mai11) juice in substantial concentrations, and were isolated by semi-
preparative reverse phase HPLC. The structures were elucidated from UV spectra, acid
hydrolysis and subsequent amino acid analysis, mass spectrometry, and two-dimensional
NMR Spectroscopy. The compounds are identified as: S-sinapyl-L-cysteine, N-L-y-
glutamyl-S-sinapyl-L-cysteine, and S-sinapyl glutathione.
KEY WORDS: Pineapple juice, Ananas comosus [L.] Merill, phenolics, sinapyl
derivatives, glutathione
INTRODUCTION
While pineapple (Ananas Comosus [L.] Merin) juice is a major commercial product in
international commerce, its phenolics profile has not been well characterized, and only a
few papers have been published on the phenolic composition of pineapple fruit (Macheix
et al, 1990), juice (Fernandez de Simon et al, 1992) and shell fiber (Larrauri et al, 1997).
We found, however, in a preliminary investigation of pineapple juice phenolics by reverse
phase HPLC/DAD, that the retention time and UV spectra of the major peaks did not
match the phenolic compounds previously reported to be present. Three late-eluting peaks
had identical UV spectra with a maximum absorption at 285 nm, suggesting the
possibility of their being derivatives of the same basic phenolic compound. This
publication reports the structures of these three new phenolic compounds which were
determined by mass spectrometric and heteronuclear two-dimensional NMR techniques
combined with acid hydrolysis and subsequent amino acid analysis.
23
MATERIALS AND METHODS
Source
Authentic pineapple juice concentrate samples were provided by the National Food
Processors Association (Washington, D.C.) and Dole Food Company, Inc. (Westlake
Village, CA), and stored at -20 °C until analysis.
Extraction
Pineapple juice concentrate (400 g) was diluted 4 fold with de ionized w ater, and
ultracentrifuged at 23,000 g for 20 min. The supernatant was collected and filtered
through Whatman #1 filter paper with Celite diatomaeous earth filtration aid (Celite
Corp., CA). The filtrate (100 mL) was passed through a Me0H activated C18 cartridge
(5 g resin) from Alltech Associates (Deerfield, IL), followed by a 100 mL 0.01% aqueous
HC1 wash and then eluted with 50 mL Me0H. The Me0H eluate was combined and kept
at -100C overnight, then passed through a 0.45 urn Millipore HA membrane to remove
the white precipitate which had formed, presumably polysaccharides or proteins. The
filtrate was rotary evaporated to dryness at 35 °C, then dissolved in 10 mL 0.01% aqueous
HC1: Me0H (70: 30), and filtered through a 0.45 um Millipore HV membrane prior to
semi-preparative HPLC isolation.
Semi-preparative HPLC
Two Dynamax SD-300 pumps were used with a semi-preparative Microsorb C18
column (25 cm x 21.4 mm, 5 gm) from Rainin Instrument Co. (Woburn, MA). The end of
the column was connected to a flow divider, which split 1 mL/min flow to a HP 1040A
Diode Array Detector (DAD) with detection at 280 nm and the rest of flow (19 mL/min)
to an o utlet for m anual p eak c ollection. T he following gradient e mploying s olvent A
24
(methanol) and solvent B (0.07 M K-PO 4 buffer, pH 2.4) was used: 7 min from 35 to
45% solvent A, then 3 min from 45 to 48% solvent A and holding for 5 min. The peak
purity was verified by analytical HPLC. Each peak collected from the preparative HPLC
was rotary evaporated at 35 °C for 10 min to remove Me0H, then extracted with an
Alltech C18 cartridge (5 g). The Me0H eluate from the cartridge was rotary evaporated to
dryness and stored at -15 °C until analysis. Approximately 5 mg of compound 1, 50 mg
of compound 2, and 50 mg of compound 3 were isolated.
Analytical HPLC
A Supelco LC-18 column (25 cm x 4.6 mm, 5 gm) was used with a HP 1040A DAD set
at 280 nm. Flowrate: 1.0 mL/min; Injection: 50 gL. The following gradient employing
methanol (solvent A), acetonitrile (solvent B) and solvent C (0.07 M K-PO 4 buffer, pH
2.4) was used: 10 min from 10% A/0% B to 22% A/0% B, then 25 min from 22% A/0%
B to 22% A/25% B, the remainder being C.
Acid hydrolysis
About 0.5 mg each of compound 2 and 3 were acid hydrolyzed in a Teflon-lined
screw-cap test tube with 5 mL 2 N HC1 at 100 °C for 30 min in the dark (10 min N2
flushing before hydrolysis), then cooled in ice-bath and extracted with a C18 Sep-Pak
(360 mg resin) from Waters Associates (Milford, MA). The Me0H eluate of the Sep-Pak
was rotary evaporated to dryness and dissolved in 0.01% aqueous HC1 and subjected to
HPLC analysis using the same conditions as stated above.
Amino acid analysis
200 gL of the Me0H eluate from the isolation step above was transferred to a 1.5 mL
Teflon-lined screw-cap reaction tube, flushed dry with N2, dissolved in 120 pi 6 N HC1,
N2 flushed for another min and then capped. The hydrolysis was performed in a heating

25
block at 95 °C for 3 hrs. The hydrolysate was subjected to amino acid analysis by PITC
derivatization as described by Hagen et al. (1993), and the identity of hydrolyzed amino
acids were confirmed by spiking the sample with the standard PITC derivatives prepared.
Mass spectrometry
Electrospray ionization MS (ESI-MS) were performed on a Perkin Elmer Sciex API
III+ triple quadrupole ionspray mass spectrometer (Ontario, Canada) by pneumatically
assisted electrospray. The operating conditions were standard. Tandem MS/MS were
recorded on the same instrument with Ar-N 2 (9:1) as target gas. The collision energy was
15 or 25 V. Operating conditions were standard. The FAB-MS sample was prepared in a
matrix of 0.1 N toluenesulfonic acid in 1:1 glycerol: 3-nitrobenzyl alcohol, and the
positive spectra was recorded on a Kratos M550TC instrument (Manchester, UK) at a
scan speed of 10 sec/decade using a resolution of 1100, with the gun producing a 7 KV
beam of Xenon atoms.
NMR
1 H (600 MHz) and 13 C (150 MHz) NMR spectra were recorded at 25 °C on a Bruker
DRX 600 NMR Spectrometer (Billierica, MA). A mixed solvent was used
(D20:CD3OD:CF3COOD - 60 :30:10 b y volume) and the residual D 20 resonance was
used as internal chemical shift reference. 1 H- 1H COSY and TOCSY, 1 H- 13C HMQC and
HMBC experiments were performed using standard pulse sequence. Spectral widths of
10 and 200 ppm were used in the 1 H and 13C dimensions, respectively.
S-sinapyl-L-cysteine (compound 1): A slightly yellow solid, ESI-MS m/z: 314.0
(MH±), 192.8 (MB+ - cysteine), 160.8. MS/MS of daughter ion (m/z 192.8, collision
energy 25 volts) m/z (rel. int.): 192.8 (20), 161.2(100), 143.2 (15), 133.2(100), 115.0
(60), 105.2 (100), 79.0 (15), 55.0 (8). UV spectrum: see Figure 6; k max nm: 285 (mobile
phase). 1 H NMR: see Table 1.
26
S-sinapyl glutathione (compound 2): A slightly yellow solid, ESI-MS m/z: 500.0
(MH+), 308.0 (Glutathione •H+), 192.8 (MH+ - Glutathione). UV spectrum: the same as
compound 1. 1 H and 13 C NMR: see Table 1 and 2. 1 H - 13C HMQC: see Table 3.
N-L-glutamyl-S-sinapyl-L-cysteine (compound 3): A slightly yellow solid, ESI-MS
m/z: 442.8 (MH+), 250.8 (Glu-Cys•11+), 192.8 ( MH+ - Glu-Cys). FAB-MS m/z
443.1473 (calculated for Ci9H2708N2Si: 443.1458; deviation : -3.4 ppm). UV spectrum:
the same as compounds 1 and 2. 1 H NMR: see Table 1.
Sinapyl alcohol standard (Aldrich, Milwaukee, WI): ESI-MS m/z: 193.0 (ME1+-H20).
MS/MS (collision energy 15 volts) m/z (rel. int.): 192.8 (16), 161.2 (80), 143.2 (5), 133.2
(83), 115.0 (45), 105.2 (100), 79.0 (10), 55.0 (5). UV spectrum: the same as other sinapyl
derivatives (mobile phase).
RESULTS AND DISCUSSION
Figure 1 shows the analytical HPLC chromatogram of pineapple juice with peaks 1, 2
and 3 being the compounds investigated. The identities of other peaks and their
concentration range for 54 authentic pineapple juice concentrate samples will be reported
in another publication. Figure 2 is the semi-preparative HPLC chromatogram of
pineapple juice after C18 cartridge fractionation which permitted collection of peaks 1, 2
and 3 without impurities as determined by analytical HPLC. Figure 3 shows the acid
hydrolysis pattern of compounds 2 and 3. The acid hydrolysis of compound 2 generated
compound 1, 3 and an additional compound with the same UV spectrum. Acid hydrolysis
of compound 3 only generated compound 1. Compound 1 was no longer hydrolyzed by

27
Table fill. 1 H NMR data for compoundsl, 2 and 3 [ ppm inD20:CD3OD:CF3COOD (600 MHz)]
H 1 2 3
2, 6 6.44 s 6.35 s 6.40 s
7 6.13 d(15.6) 6.04 d (15.6) 6.08 d (15.6)
8 5.78 dt (15.6, 7.8) 5.69 dt (15.6, 7.8) 5.73 dt (15.6, 7.8)
9 3.07 d (7.8) 2.94 d (7.8) 3.00 d (7.8)
1",2" 3.54s 3.47s 3.51s
2' 3.58 s
4' 3.95 dd (7.8, 4.2) 4.20 t (6.6) 4.26 dd (8.4, 4.8)
6' 2.18 t (7.2) 2.21 t (7.2)
7' 1.86 dt (7.2, 7.2),
1.80 dt (7.2, 7.2)
1.90 dt (7.2, 7.2),
1.84 dt (7.2, 7.2)
8' 3.69 t (6.6) 3.74 t (6.6)
10' 2.86 dd (15.0, 4.2),
2.71 dd (15.0, 7.8)
2.60 dd (13.8, 4.8),
2.44 dd (13.8, 8.4)
2.69 dd (13.8, 4.8),
2.52 dd (13.8, 8.4)
Coupling const. (J in Hz) given in parenthesesChemical shifts assigned by comparison to chemical shift pattern of compounds1, 2, 3 and glutathione standard, and also from COSY, TOCSY, HMQC and HMBC data

280 nm
28
Figure Analytical C18 reverse-phase HPLC of pineapple juice. Peak identity: (1)S-sinapyl-L-cysteine; (2) S-sinapyl glutathione; (3) N-L-y-glutamyl-S-sinapyl-L-cysteine.
400
300Ea)
2004200
100
10 20
30
Time (minutes)

Figure I11.2. Semi-preparative C 18 reverse-phase HPLC of pineapple juice (after C18
cartridge fractionation). Peak identity: (1) S-sinapyl-L-cysteine; (2) S-sinapylglutathione; (3) N-L-y-glutamyl-S-sinapyl-L-cysteine.
4000 280 nm 2 3
< 3000.
as2000.
O
< 1000.
0
4 8
12
Time (minutes)
29

Glutamic acid
Compound 3MH+ 442.8
Figure HI 3. Acid hydrolysis pattern of compounds 2 and 3.
30
aCompound 4*same uv spectrum ascompounds 1, 2 and 3
Glutamic acidGlutamic acidGlycine/
Compound 1MH+ 313.0
* not found in analytical HPLC of pineapple juice

Figure D1.4. Partial structure of doubly linked 15,16-dihydrobiliverdin. (Redrawn fromWemmer, D. E.; Wedemayer, G. J .; Glazer, A. N. 1993. Phycobilins of cryptophyceanAlgae. J. Biol. Chem. 268(3): 1658-1669).
O
H2 <— 5 (ppm): 2.91, 2.69in DMSO-d6
S
31
32
acid. The odd-number in molecular weight differences between compounds 2 and 3, and
also between compound 3 and 1, as determined by ESI-MS, suggested the differences
were caused by amino acid residues - glutamic acid and glycine. The release of those
same amino acids from compounds 2 and 3 with acid hydrolysis was confirmed by amino
acid analysis. Compound 1 has an odd-number molecular weight, so it should contain
an odd-number of nitrogens and it is also possibly an amino acid derivative of a basic
phenolic c ompound. Gl utathione ( Glu-Cys-Gly) is commonly found in plants, so it is
possible that compound 2 is glutathionyl derivative of a phenolic compound, such as
glutathionyl caftaric acid, which has been identified in grape juice (Cheynier et al, 1986).
This structural proposal is in agreement with the ESI-MS fragmentation pattern of the
three compounds. The ESI-MS shows a fragment dissociation of 121 units from
compound 1 which is the molecular weight of cysteine, 307 units (glutathione) from
compound 2 and 250 units (Glu-Cys) from compound 3.
The molecular weight of compound 3 as determined by FAB-MS is 443.1473, with
several different formulas being possible. The formula (C 19H2708N2S 1 , MB+) was
chosen based on the evidence for one sulfur atom (isotopic ratio 32S: 34S - 100:4.4) and
the maximum UV absorption at 285 nm. The proton NMR spectra of compounds 1, 2 and
3 exhibit the characteristic pattern of Cys, Glu-Cys-Gly, Glu-Cys except that the two 13
methylene protons of Cys were split (see Table 1). However, this splitting has been
previously reported for a conjugated di-peptide with similar type of structure (see Figure
4, Wemmer et al, 1993). The proton NMR spectra of these three compounds also exhibit
the same resonances with chemical shifts at 6.4, 6.0, 5.5, 3.5 and 3.0 ppm. The 6.4 ppm
chemical shift is the characteristic resonance of aromatic protons, while 6.0 and 5.5 ppm
shifts are traits of double-bond protons. The final structure (Figure 5) was established by
13C NMR (Table 2), HMQC and HMBC (Table 3). The sinapyl core structure was further
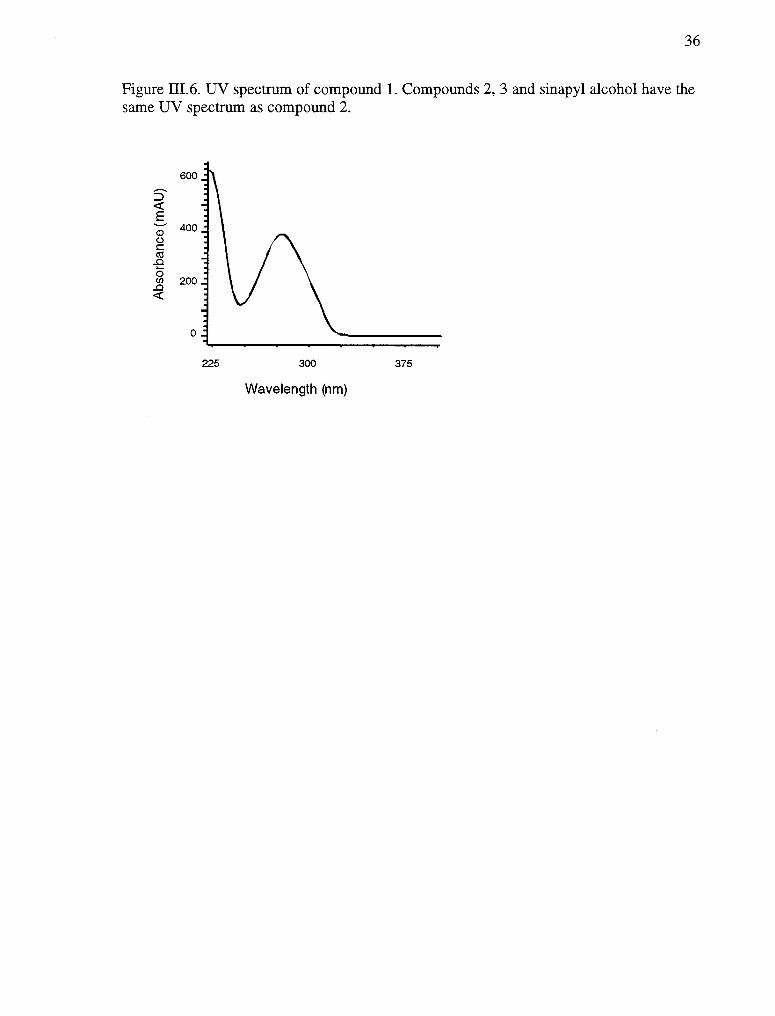
confirmed by the same UV spectrum (Figure 6) and fragmentation pattern as sinapyl
alcohol standard. It was found that the two protons at the C-2 and C-6 positions

Figure 111.5. Structure of compounds 1, 2 and 3.
0II 4'
Ri— C — CH — NHR23' I
10' CH2
1" 2"MeO 4 OMe
OH
Compound 1 2 3
1' 2'OH HOOC—CH2— NH —
NH0
R2 H—C—CH2—CH2— CH 8'5 6' 7'
COOH9'
1' 2'HOOC — CH2— NH
33

34
Table 13C NMR spectral data for compound 2[ ppm in D20:CD3 OD:CF3 COOD (150 MHz)]
C ppm
1 128.7
2 104.0
3 147.7
4 134.3
5 147.7
6 104.0
7 132.6
8 123.6
9 34.0
1", 2" 56.3
1' 172.6
2' 41.0
3' 172.7
4' 53.2
5' 174.0
6' 31.0
7' 25.5
8' 52.2
9' 171.2
10' 31.9
1' and 3' are overlapping

Table 111.3. Cross-peaks in HMBC spectra of compound 2
H
C
3-bond 2-bond
2, 6
7
6, 2, 4,
2, 6, 9
7 3,
1
5
8 1 9
9 7,10' 8
1",2" 3, 5
2' 3' (?)
4'
6'
7'
8'
10'
5'
8'
5', 9'
6'
9, 3'
3',
5',
6',
7',
4'
10'
7'
8'
9'
35
36
Figure 111.6. UV spectrum of compound 1. Compounds 2, 3 and sinapyl alcohol have thesame UV spectrum as compound 2.
225
300
375
Wavelength (nm)
37
could undergo deuterium exchange under very acidic condition when kept at room
temperature for over two days. This exchange was followed by 1 H NMR resulting in the
almost complete loss of proton chemical shifts at 6.4 ppm. The deuterium exchange was
further confirmed by 2 mass units increase in the fragment ion corresponding to the
sinapyl moiety [m/z (without deuterium exchange): 193] in the ESI-MS. This deuterium
exchange can be used to establish the fragmentation pathway during MS/MS by
comparing the fragmentation pattern of the compound with that of the deuterium-
exchanged compound.
Glutathione is a common reducing compound in biological systems. It is involved in
biosynthesis and metabolism, and also plays a role in plant protection. For the
glutathionyl derivative of caftaric acid identified in grape juice (Cheynier et al, 1986),
glutathione was directly attached to the aromatic ring as a reducing agent after the
oxidation of caftaric acid. The mechanism for the formation of the glutathionyl derivative
of sinapyl alcohol in pineapple juice is not known. Furthermore, it is not clear if
compounds 1 and 3 are formed independently or if they are the hydrolytic products of
compound 1. To our knowledge, this is the first report of the presence of glutathionyl
derivatives of sinapyl alcohol.
ABBREVIATIONS USED
COSY: correlation spectroscopy; TOCSY: total correlation spectroscopy; HMQC:
heteronuclear multiple bond quantum correlation; HMBC: heteronuclear multiple bond
correlation; ESI-MS: electrospray ionization mass spectrometry; FAB-MS: fast atom
bombardment mass spectrometry.

38
REFERENCES
Cheynier, V. E.; Trousdale, E. K.; Singleton, V. L.; Salgues, M. J.; Wylde, R. 1986.Characterization of 2-S-glutathionylcaftaric acid and its hydrolysis in relation to grapewines. J. Agri. Food Chem. 34(2): 217-221.
Fernandez de Simon, B.; Perez-Ilzarbe J.; Hernandez, T.; Gomez-Cordoves, C.; Estrella,I. 1992. Importance of phenolic compounds for the characterization of fruit juices. J.Agr. Food Chem. 40(9): 1531-1535.
Hagen, S. R.; Augustin, J.; Grings, S.; Tassinari, P. 1993. Precolumn phenylisocyanatederivatization and liquid chromatography of free amino acids in biological samples.Food Chem. 46(3): 319-323.
Larrauri, J. A.; Ruperez, P.; Saura-Calixto, F. 1997. Pineapple shell as a source of dietaryfiber with associated polyphenols. J. Agri. Food Chem. 45(10): 4028-4031.
Macheix, J. J.; Fleuriet, A.; Billot, J. 1990. Fruit Phenolics. Boca Raton, FL: CRC Press,Inc. 378p.
Wemmer, D. E.; Wedemayer, G. J .; Glazer, A. N. 1993. Phycobilins of cryptophyceanAlgae. I Biol. Chem. 268(3): 1658-1669.
ACKNOWLEDGMENT
This work was funded by the Washington-Oregon Tree Fruit Commission, and the
pineapple juice concentrate samples were supplied by the National Food Processors
Association (NFPA) and Dole Food Company, Inc. This is technical paper no. 11,377
from Oregon Agricultural Experiment Station. We thanks D. A. Griffin for recording the
ESI-MS and tandem MS/MS, B. Arbogast for recording the FAB-MS, R. W. Durst for
help in HPLC, L. E. Rodriguez-Saona for help in amino acid analysis, S. Lam and S.
Watts for recording some of the NMR spectra, M. M. Guisti for help in NMR data
analysis, and J. F. Stevens for help in MS data analysis.

CHAPTER IV
PHENOLIC COMPOSITION OF AUTHENTIC PINEAPPLE JUICE
39
Ling Wen and Ronald E. Wrolstad
Department of Food Science & Technology, Oregon State University
Corvallis, OR 97331-6602
Accepted by Journal of Food Science
40
ABSTRACT
The phenolic composition of authentic pineapple juice concentrate was analyzed by
HPLC. Nine major peaks accounting for 70% of total peak area were characterized and
their concentrations measured in 54 commercial samples. Means and standard deviations
were as follows (mg/100 mL single-strength juice, normalized to 12.8 °Brix): tyrosine,
3.6(1.4); serotonin, 1.8(0.8); dimethylhydroxylfuranone, 1.4(0.7);
dimethylhydroxylfuranone Aglucoside, 6.2(3.0); tryptophan, 2.2(0.9); S-sinapyl-L-
cysteine, 1.1(0.6); N-y-L-glutamyl-S-sinapyl-L-cysteine, 2.3(1.1); S-sinapyl glutathione,
5.4(1.4); and a p-coumaric acid-like phenolic compound (calculated as p-coumaric acid),
0.5(0.4). This information will be useful for evaluation of authenticity and quality.
Keywords: pineapple juice, concentrate, phenolics, sinapyl, composition
INTRODUCTION
Although pineapple (Ananas comosus [L.] Merr.) juice is a major commercial product
in international commerce, its phenolic profile has not been well characterized, and only
a few papers have been published on this subject. For pineapple fruit (Macheix et al.
1990), juice (Fernandez de Simon et al. 1992) and shell fibers (Larrauri et al. 1997), only
nonflavonoid phenolics were reported with the exception of myricetin in fiber. The
reported phenolics in pineapple are summarized in Table 1V.1. The phenolic composition
is very useful for establishing authenticity of juice (Kirksey et al. 1995) and evaluating
the effect of processing on juice quality (Spanos and Wrolstad 1990a, 1990b; Spanos et

41
al. 1990). In addition, many phenolics are believed to provide healthy benefits as
reviewed by Ho et al. (1992).
However, in our preliminary examination of pineapple juice phenolics by reverse-
phase HPLC coupled with a photodiode array detector, we found that the retention times
and UV spectra of the major peaks did not match the phenolic compounds previously
reported to be present. Further investigation (Wen et al. 1999) identified 3 new sinapyl
derivatives with amino acids as major compounds: S-sinapyl-L-cysteine, N-y-L-glutamyl-
S-sinapyl-L-cysteine and S-sinapyl glutathione.
Interestingly, some phenolic compounds have been reported in pineapple juice
volatiles. Chavicol (p-allylphenol) was isolated and identified by Silverstein et al. (1965).
Ethylphenol was tentatively identified by headspace GC/MS for whole intact fruit
(Takeoka et al. 1989). Eugenol, vanillin and 4-ally1-2,6-dimethoxyphenol were identified,
and phenol, 4-hydroxybenzaldehyde and syringaldehyde were tentatively identified in
either free or glycosidically bound form or both forms at 10 ppb levels for fresh
pineapple juice (Wu et al. 1991).

Table IV.1. Summary of reported phenolic composition of pineapple
CategoryPhenolics Fruita Juiceb Shell fiber'trans-Cinnamic acid xp-Coumaric acidCaffeic acid
x xx
x
Ferulic acidSinapic acid
x xx
p-Coumaroylquinic aciddi-p-Coumaroylquinic acidp-Coumaroyl glucoseCaffeoyl glucose
xxxx
x
FeruloylglucoseSinapoyl glucosep-Hydroxybenzoic acidp-Hydroxybenzoic aldehyde
xx
x
xx
Syringic acidSalicylic acidTannic acidTyramineMyricetin
x
xx
xa.Macheix et al. 1990b. Fernandez de Simon et al. 1992c. Larrauri et al. 1997
42
43
Some compounds, which are not normally considered as typical phenolic compounds,
appear as peaks in HPLC analysis of phenolics. They are benzaldehyde (Wu et al. 1991),
tyrosine (Hodgson and Hodgson 1993; Elkins et al. 1997), dimethylhydroxylfuranone
(Rodin et al. 1965; Ohta et al. 1987; Lee and Nagy 1987; Wu et al. 1991) and its fi-
glucoside (Wu et al. 1991), and hydroxylmethylfurfural (Dizy et al. 1992). Serotonin, the
brain neurotransmitter, was also reported in pineapple juice (Bruce 1960; Feldman and
Lee 1985). Many other aromatic nonphenolic compounds have been summarized b y
Hodgson and Hodgson (1993) for pineapple volatiles, and they are fl-phenylethanol,
cinnamic acid, 1-coumarilic acid, 2-phenylethyl acetate, ethyl benzoate and methyl
benzoate.
The objective of this study was to characterize the major peaks in the HPLC of
pineapple juice and to establish a compositional database for commercially produced
pineapple juice concentrate. It is an integrated part of the National Food Processors
Association (NFPA)'s effort to establish a compositional database for commercial
pineapple juice concentrate (Elkins et al. 1997). The report by Elkins et al. (1997)
summarized the measurements on pH, Brix, ash%, titrable acidity, minerals, sugar
profile, organic acid profile, and amino acid profile for these same samples.

44
MATERIALS AND METHODS
Source
Authentic commercially produced pineapple juice concentrate samples (n = 54) were
supplied by NFPA and stored at –15 °C until analyzed. The source of these samples is
listed in Table IV.2. A total of 54 representative samples were collected over 3 years
from significant growing regions around the world. The supplier was required to
guarantee the authenticity of the sample. Some processing techniques, which may have
significant effect on composition, such as ion-exchange, added pectin and/or the addition
of acid, were not allowed for the production of the samples for this study. The detailed
source and processing information can be found in Elkins et al. (1997). In addition, one
additional juice concentrate and one canned juice were supplied by Dole Food Co.,
Inc. (Westlake Village, CA), and one fresh pineapple (c.v. Smooth Cayenne, Maui,
Hawaii) was purchased from a local supermarket.
Sample preparation
The pineapple juice concentrate was diluted 4 times with deionized water,
ultracentrifuged at 23000 g, and the supernatant was collected. Fresh pineapple was cut
into cubes and blended into puree, then ultracentrifuged and the supernatant was
collected. There is no need of ultracentrifugation for canned juice. Each sample was
filtered through a 0.45 pm HA membrane (Millipore Corp., Bedford, MA) before HPLC
analysis.
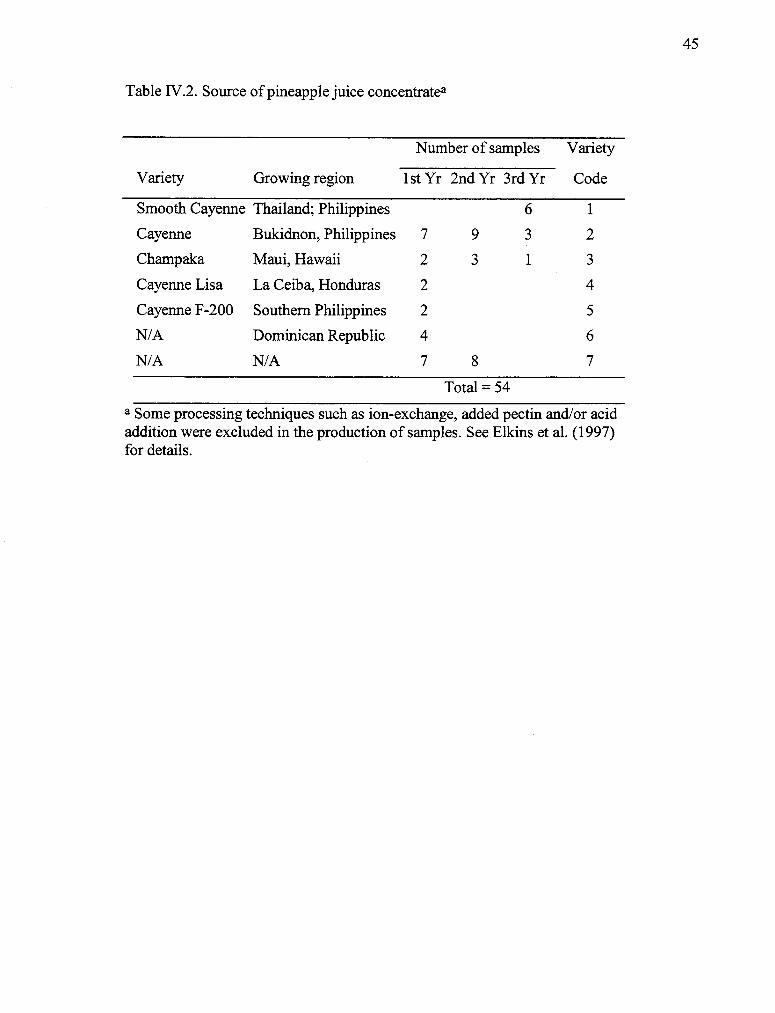
Table IV.2. Source of pineapple juice concentratea
Variety
Number of samples Variety
CodeGrowing region 1st Yr 2nd Yr 3rd Yr
Smooth Cayenne Thailand; Philippines 6 1
Cayenne Bukidnon, Philippines 7 9 3 2
Champaka Maui, Hawaii 2 3 1 3
Cayenne Lisa La Ceiba, Honduras 2 4
Cayenne F-200 Southern Philippines 2 5
N/A Dominican Republic 4 6
N/A N/A 7 8 7
Total = 54
a Some processing techniques such as ion-exchange, added pectin and/or acidaddition were excluded in the production of samples. See Elkins et al. (1997)for details.
45

46
Standards
All chemical standards were purchased from Sigma Chemical Co. (St. Louis, MO),
except that dimethylhydroxylfuranone (DMHF) was purchased from Aldrich
(Milwaukee, WI) and N-y-L-glutamyl-S-sinapyl-L-cysteine was isolated as described
(Wen et al. 1999). Tyrosine (13.9 mg), serotonin (5.9 mg), DMHF (18.1 mg), tryptophan
(6.2 mg), p-coumaric acid (6.7 mg) and S-sinapyl glutathione (10.6 mg) were dissolved
in less than 5 mL Me0H, then brought up to 100 mL in a volumetric flask with 0.01%
aqueous HC1 and filtered through a 0.45 pm HA membrane. This is the 1st standard
solution, which was subsequently diluted 8/12, 4/12 and 1/12 of the stock solution. A
total of 4 standard solutions were used.
HPLC analytical system
A Perkin-Elmer Series 400 liquid chromatograph equipped with a 1040A Hewlett-
Packard photodiode array detector and a Gateway 2000 computer system with Hewlett-
Packard HPLC2D Chemstation software was used. Juice samples (50 ,uL) were injected
via a Beckman autosampler in double-injection mode. Peaks were monitored by their
absorbance at 280 and 320 nm and quantified by their integrated peak areas using
external standards. Absorbance between 200 and 400 nm was recorded for all peaks. To
isolate the phenolics, a Supelco (Bellefonte, PA) LC-18 column (25 cm x 4.6 mm, 5 pm)
was used with a flow rate of 1.0 mL/min at ambient temperature. The following gradient
using methanol (solvent A), acetonitrile (solvent B) and solvent C (0.07 M K-PO4 buffer,
pH 2.4) was used: 10 min from 10% A/0% B/90% C to 22% A/0% B/78% C, 25 min
from 22% A/0% B/78% C to 22% A/ 25% B/53% C.

47
Characterization of major peaks
Peak assignments were made by co-chromatography with authentic standards (when
available) and matching UV spectra. For some peaks, further characterization approaches
such as enzymatic hydrolysis (see below) or retention behavior on ion-exchange resins
(see below) were applied.
Characterization of DMHF-glucoside
The glucosidic DMHF was extracted from pineapple juice and enzymatically
hydrolyzed using a slightly modified method from Wu et al. (1991). Pineapple juice
supernatant (100 mL) was passed through a Me0H-activated C18 cartridge (5 g resin)
from Alltech Associates (Deerfield, IL) under slight vacuum, and the direct eluate was
collected. A total of 3 separations were conducted and 300 mL direct eluate was
collected. The direct eluate was passed through 20 mL XAD-1180 (Alltech Associates)
resin , which was packed in a 1 cm ID column that had been extensively washed with 200
mL Me0H followed by 200 mL deionized water before application of sample. The )(AD
resin was washed by 200 mL deionized water, followed by 300 mL hexane, and the
DMHF-Glucoside was eluted with 300 mL Me0H. The methanolic eluate was rotary-
evaporated to dryness at 35 °C and then dissolved in 5 mL 0.2 M citrate-phosphate buffer
(pH 5.0) and 1 mL was added to 5.5 mg almond glucosidase (Sigma) and hydrolyzed
overnight at 37 °C. The aglycone was confirmed by spiking with the standard.

48
Retention characterization by ion-exchange
CM Sephadex C-25 (Sigma Chemical Co., St Louis, MO) and BioRex-5 (chloride
form; Bio-Rad Laboratories, Richmond, CA) resins were swollen in deionized water
overnight, and slurry-packed in disposable Poly-Prep chromatography columns (0.8 x 4
cm graduated column with an integral 10-mL reservoir, Bio-Rad Laboratories) with 1.4
mL final wet volume for CM Sephadex C-25 and 1.2 mL for BioRex-5. The column bed
was rinsed with 10 mL deionized water and 5 mL sample was carefully applied. The first
1.5 mL was discarded and the rest of the sample was collected and analyzed by HPLC.
Quantification of HPLC
External standards were used for calculation. The standard solutions were inserted
into running sequence after every 4 samples. All samples and standards were kept frozen
when not running. Except that p-coumaric acid was based on 320 nm absorption, all other
peaks were based on 280 nm absorption. Tyrosine, tryptophan, serotonin, DMHF and S-
sinapyl glutathione were each directly calculated from their standard curves. DMHF-
GLU was calculated from the DMHF standard curve with the assumption of identical
absorption behaviors. S-sinapyl-L-cysteine and N-y-L-glutamyl-S-sinapyl-L-cysteine
were calculated using S-sinapyl glutathione as standard with molecular weight correction.
The p-coumaric acid-like compound was based on p-coumaric acid standard.
Antioxidant activity analysis
Antioxidant capacity (AOC) was measured using a Photochem photo-
chemiluminometer (FAT, Berlin, Germany). Photo-chemiluminescent (PCL) assay is

49
based on continuous generation of free radicals (superoxide) in the solution of photo-
sensitiser (luminol) by UV irradiation which is paralleled by simultaneous measurement
of light emission produced by luminol during its interaction with superoxide radical
causing delay in light output and/or decrease in its intensity which are proportional to the
concentration of antioxidant. AOC is measured as an inhibition (I) of light output: I = 1-
A/A0, where A is an area under the kinetic curve of light output in the p resence o f
assayed sample, and AO is an area of control (blank) sample. AOC of samples was
expressed as Trolox equivalent of antioxidant capacity (TEAC), namely, calculated molar
amount of Trolox with AC corresponding to 1 mole of assayed compound when plotted
against Trolox standard calibration curve. PCL assay was conducted for both water-based
and Me0H-based solution with triplicate measurements.
Statistical analysis
The analysis was conducted using SAS statistical software (SAS Institute Inc., Cary,
NC) with the supplied ANOVA, PRINCOMP and DISCRIM procedures for analysis of
variance, principal component analysis and canonical variable analysis, respectively.
RESULTS AND DISCUSSION
Fig. IV.2 is a typical HPLC chromatogram of pineapple juice phenolics. Nine major
peaks were characterized, and their concentrations are summarized in Table IV.3 for all
54 samples. For comparison, an additional authentic pineapple concentrate, a canned
50
pineapple juice (single-strength) and a fresh pineapple juice were also analyzed. All the
nine major phenolic peaks were also found in these 3 samples, and the concentration also
fell within the range of the concentrate samples. The existence of all the major peaks in
fresh pineapple means that none of these peaks was an artifact generated by processing.
Since only one fresh juice sample was analyzed, no comparisons between fresh and
concentrate samples are attempted in this discussion. Table IV.4 is a summary of the
values reported in the literature for comparison with this investigation.
Sample preparation for HPLC
Cilliers and Van Niekerk (1984) described difficulties working with viscous tropical
juices, such as pineapple juice, for HPLC analysis. Lee et al. (1986) reported that
preliminary sample purification with the clarification agents (Carrez reagents: 30% zinc
acetate and 15% potassium ferrocyanide) could remove the pulp, fat, protein and
carotenoids. However, in this investigation, it was found that a pretreatment approach
with ultracentrifugation and membrane filtration is sufficient, and no interference was
observed for HPLC analysis of pineapple juice phenolics with continuous autosampler
injection over 1 week.

OH
N-g-L-glutamyl-S-sinapyl-L-cysteine
OHS-sinapyl glutathione
ysCH2
MeO OMeOH
S-sinapyl-L-cysteine
MeO OMe MeO OMe
Glu—Cys—GlyCH2S
CH2
Figure IV.1. Chemical structures of all the identified phenolic peaks in pineapple juice.
51
HOOC—CH —CH214H2
tyrosine
OH HOOC—CH—CH2—CH2NI H2tryptophan
CH2 —CH2 —CH2NH2
serotonin
Glucose.
H3C O CH3 H3 0CH3dimethylhydroxylfuranone dimethyihydroxylfuranone
Aglucoside
OOHp-coumaric acid

400-
4280 nm 6
52
Figure IV.2. HPLC of pineapple juice concentrate.Peak assignment: I. tyrosine, 2. serotonin, 3. dimethylhydroxylfuranone 8-glucoside, 4.dimethylhydroxylfuranone, 5. tryptophan, 6. S-sinapyl-L-cysteine, 7. a p-coumaric acid-like phenolic compound, 8. N-y-L-glutamyl-S-sinapyl-L-cysteine, 9. S-sinapylglutathione.
8 9
Time (min)
53
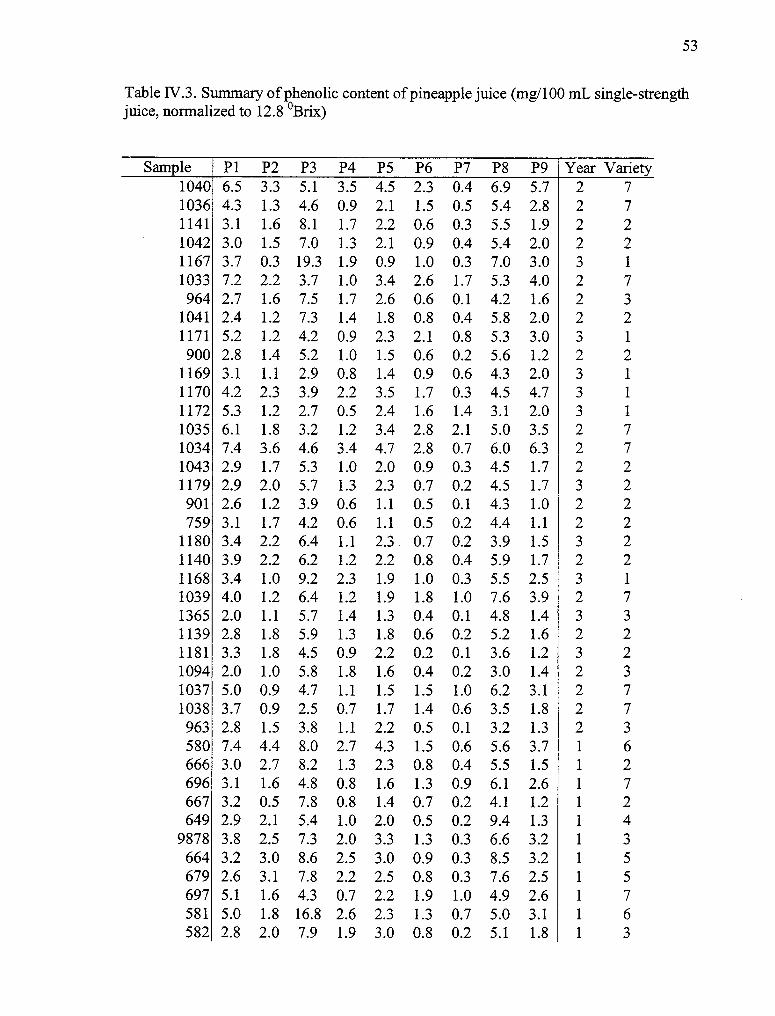
Table IV.3. Summary of phenolic content of pineapple juice (mg/100 mL single-strengthjuice, normalized to 12.8 °Brix)
Sample P1 P2 P3 P4 P5 P6 P7 P8 P9 Year Variety1040 6.5 3.3 5.1 3.5 4.5 2.3 0.4 6.9 5.7 2 71036 4.3 1.3 4.6 0.9 2.1 1.5 0.5 5.4 2.8 2 71141 3.1 1.6 8.1 1.7 2.2 0.6 0.3 5.5 1.9 2 21042 3.0 1.5 7.0 1.3 2.1 0.9 0.4 5.4 2.0 2 21167 3.7 0.3 19.3 1.9 0.9 1.0 0.3 7.0 3.0 3 11033 7.2 2.2 3.7 1.0 3.4 2.6 1.7 5.3 4.0 2 7964 2.7 1.6 7.5 1.7 2.6 0.6 0.1 4.2 1.6 2 3
1041 2.4 1.2 7.3 1.4 1.8 0.8 0.4 5.8 2.0 2 21171 5.2 1.2 4.2 0.9 2.3 2.1 0.8 5.3 3.0 3 1900 2.8 1.4 5.2 1.0 1.5 0.6 0.2 5.6 1.2 2 2
1169 3.1 1.1 2.9 0.8 1.4 0.9 0.6 4.3 2.0 3 11170 4.2 2.3 3.9 2.2 3.5 1.7 0.3 4.5 4.7 3 11172 5.3 1.2 2.7 0.5 2.4 1.6 1.4 3.1 2.0 3 11035 6.1 1.8 3.2 1.2 3.4 2.8 2.1 5.0 3.5 2 71034 7.4 3.6 4.6 3.4 4.7 2.8 0.7 6.0 6.3 2 71043 2.9 1.7 5.3 1.0 2.0 0.9 0.3 4.5 1.7 2 21179 2.9 2.0 5.7 1.3 2.3 0.7 0.2 4.5 1.7 3 2901 2.6 1.2 3.9 0.6 1.1 0.5 0.1 4.3 1.0 2 2759 3.1 1.7 4.2 0.6 1.1 0.5 0.2 4.4 1.1 2 2
1180 3.4 2.2 6.4 1.1 2.3 0.7 0.2 3.9 1.5 3 21140 3.9 2.2 6.2 1.2 2.2 0.8 0.4 5.9 1.7 2 21168 3.4 1.0 9.2 2.3 1.9 1.0 0.3 5.5 2.5 3 11039 4.0 1.2 6.4 1.2 1.9 1.8 1.0 7.6 3.9 2 71365 2.0 1.1 5.7 1.4 1.3 0.4 0.1 4.8 1.4 3 31139 2.8 1.8 5.9 1.3 1.8 0.6 0.2 5.2 1.6 2 21181 3.3 1.8 4.5 0.9 2.2 0.2 0.1 3.6 1.2 3 21094 2.0 1.0 5.8 1.8 1.6 0.4 0.2 3.0 1.4 2 31037 5.0 0.9 4.7 1.1 1.5 1.5 1.0 6.2 3.1 2 71038 3.7 0.9 2.5 0.7 1.7 1.4 0.6 3.5 1.8 2 7963 2.8 1.5 3.8 1.1 2.2 0.5 0.1 3.2 1.3 2 3580 7.4 4.4 8.0 2.7 4.3 1.5 0.6 5.6 3.7 1 6666 3.0 2.7 8.2 1.3 2.3 0.8 0.4 5.5 1.5 1 2696 3.1 1.6 4.8 0.8 1.6 1.3 0.9 6.1 2.6 1 7667 3.2 0.5 7.8 0.8 1.4 0.7 0.2 4.1 1.2 1 2649 2.9 2.1 5.4 1.0 2.0 0.5 0.2 9.4 1.3 1 4
9878 3.8 2.5 7.3 2.0 3.3 1.3 0.3 6.6 3.2 1 3664 3.2 3.0 8.6 2.5 3.0 0.9 0.3 8.5 3.2 1 5679 2.6 3.1 7.8 2.2 2.5 0.8 0.3 7.6 2.5 1 5697 5.1 1.6 4.3 0.7 2.2 1.9 1.0 4.9 2.6 1 7581 5.0 1.8 16.8 2.6 2.3 1.3 0.7 5.0 3.1 1 6582 2.8 2.0 7.9 1.9 3.0 0.8 0.2 5.1 1.8 1 3
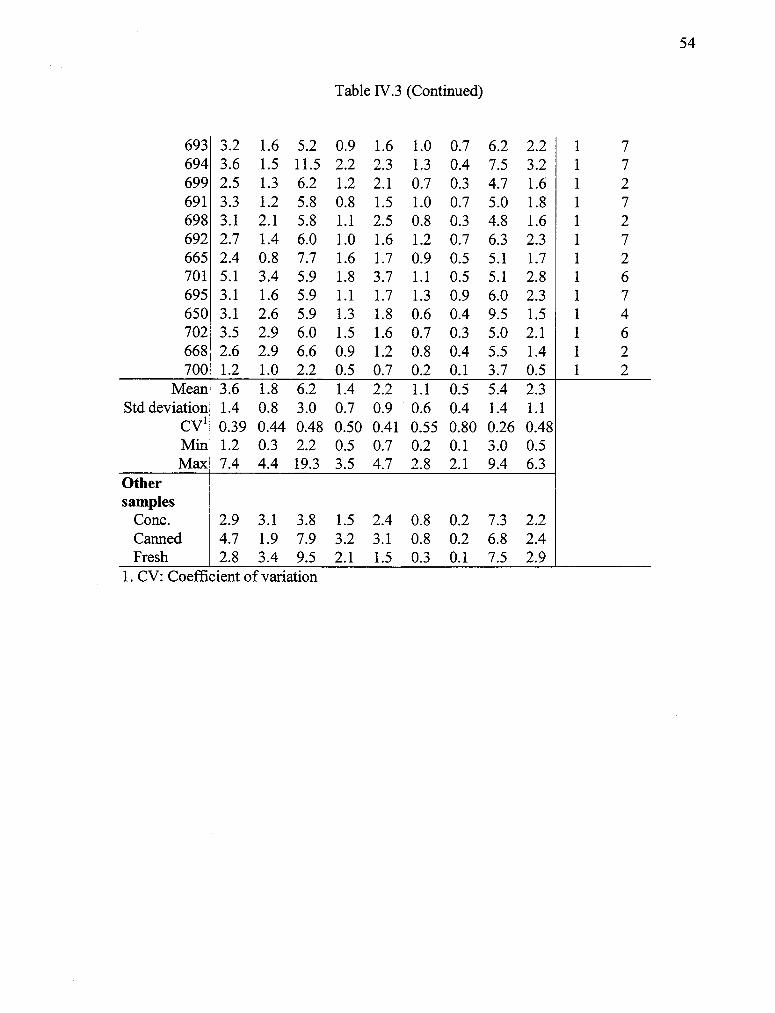
Table IV.3 (Continued)
693 3.2 1.6 5.2 0.9 1.6 1.0 0.7 6.2 2.2 1 7694 3.6 1.5 11.5 2.2 2.3 1.3 0.4 7.5 3.2 1 7699 2.5 1.3 6.2 1.2 2.1 0.7 0.3 4.7 1.6 1 2691 3.3 1.2 5.8 0.8 1.5 1.0 0.7 5.0 1.8 1 7698 3.1 2.1 5.8 1.1 2.5 0.8 0.3 4.8 1.6 1 2692 2.7 1.4 6.0 1.0 1.6 1.2 0.7 6.3 2.3 1 7665 2.4 0.8 7.7 1.6 1.7 0.9 0.5 5.1 1.7 1 2701 5.1 3.4 5.9 1.8 3.7 1.1 0.5 5.1 2.8 1 6695 3.1 1.6 5.9 1.1 1.7 1.3 0.9 6.0 2.3 1 7650 3.1 2.6 5.9 1.3 1.8 0.6 0.4 9.5 1.5 1 4702 3.5 2.9 6.0 1.5 1.6 0.7 0.3 5.0 2.1 1 6668 2.6 2.9 6.6 0.9 1.2 0.8 0.4 5.5 1.4 1 2700 1.2 1.0 2.2 0.5 0.7 0.2 0.1 3.7 0.5 1 2
Mean 3.6 1.8 6.2 1.4 2.2 1.1 0.5 5.4 2.3Std deviation 1.4 0.8 3.0 0.7 0.9 0.6 0.4 1.4 1.1
CV1 0.39 0.44 0.48 0.50 0.41 0.55 0.80 0.26 0.48Min 1.2 0.3 2.2 0.5 0.7 0.2 0.1 3.0 0.5Max 7.4 4.4 19.3 3.5 4.7 2.8 2.1 9.4 6.3
Othersamples
Conc. 2.9 3.1 3.8 1.5 2.4 0.8 0.2 7.3 2.2Canned 4.7 1.9 7.9 3.2 3.1 0.8 0.2 6.8 2.4Fresh 2.8 3.4 9.5 2.1 1.5 0.3 0.1 7.5 2.9
1. CV: Coefficient of variation
54

55
Table IV.4. Summary of phenolic content of pineapple (mg/100 mL single-strength juice,or mg/100 g fruit)
Compound Value Reference CommentTyrosine 5.8 1 juice, average of several reports
4.5 2 juice, average of 1st and 2nd years1.1 3 juice
Tryptophan n.d.a 1 juicen.d. 2 juicen.d. 4 juice0.3 3 juice
Serotonin 2.4 5 canned juice1.2 5 fresh juice1.7 6 fruit3.2 6 fruit pulp edge0.9 6 fruit core center0.3 6 fruit peel
DMHF 0.07 7 fruit1.4 8 fresh juice2.3 8 canned juice
DMHF glucoside 0.05 7 fruitp-Coumaric acid 2.8 9 juicea. not detected1. Hodgson and Hodgson 19932. Elkins et al. 19973. Dizy et al. 19924. Fontana et al. 19935. Bruce 19606. Feldman and Lee 19857. Wu et al. 19918. Lee and Nagy 19879. Fernandez de Simon et al. 1992

56
Aromatic amino acids
Two of the major peaks were free aromatic amino acids, tyrosine (peak 1) and
tryptophan (peak 5). Although tyrosine is commonly reported in pineapple juice, there is
disagreement with respect to tryptophan (see Table IV.3b). With the exception of Dizy et
al. ( 1992), others have not reported the existence of tryptophan (Fontana et al. 1993;
Hodgson and Hodgson 1993; Elkins et al. 1997). The average concentration of tyrosine
for all the concentrate samples in this investigation was 3.6, which is close to the reported
average (4.5) for 1st and 2nd year samples by Elkins et al. (1997). Hodgson and Hodgson
(1993) summarized a higher average value (5.8) and Dizy et al. (1992) reported a much
lower average value (1.1). Considering that tyrosine in this investigation has a range of
1.2-7.8, all of the reported values are in general agreement. However, it is different for
tryptophan. Tryptophan had an average concentration of 2.2 in this investigation, which
is much higher than that reported by Dizy et al. (1992) at 0.3. The difference might have
been caused by difference in methodology and/or sample source variation. We measured
tryptophan directly by HPLC whereas other investigators used methods employing
derivatization.
Serotonin
The identity of serotonin was confirmed by its retention on cation exchange resin
such as CM Sephadex. The average serotonin concentration value for this concentrate
database is 1.8, which is in agreement with the average values reported for fresh (1.2)
and canned juices (2.4) in the literature (see Table IV.3b). The existence of serotonin in
pineapple juice was first reported by Bruce (1960). Feldman and Lee (1985) investigated

57
serotonin content in whole pineapple fruit and also its distribution in the fruit. The
reported v alue for w hole fruit is 1. 7 mg/ 100 g fruit, which is in agreement with this
investigation assuming that most of the serotonin is extracted in juice processing. The
pulp edge has the highest concentration (3.15 mg/100 g), core center next (0.87 mg/100
g), and peel least (0.27 mg/100 g). Serotonin can also be found in nuts, other fruits such
as plantain, banana, Kiwi fruit, plums and tomatoes, and vegetables such as eggplant and
broccoli. Nuts usually have a much higher value than fruits and vegetables, and
vegetables are much lower values than fruits. Pineapple has a high serotonin
concentration in the fruit category (Feldman and Lee 1985). Ingestion of food rich in
serotonin will result in an increase in urinary 5-hydroxyindoleacetic acid excretion, which
causes misdiagnosis of malignant carcinoid tumors (Bruce 1960; Feldman and Lee 1985).
Serotonin is also a phylogenetically primitive neurotransmitter, which may play a central
role in the relationship between food and brain organization (Blundell 1992). Although a
high concentration of serotonin has been found in pineapple juice concentrate, as to the
authors' knowledge, no research has been conducted to determine whether the serotonin
in juice is absorbed and transported to brain.
DMHF and its glucoside
The neutral characteristic of DMHF and its glucoside was also confirmed by not
being r etained b y e ither anion e xchange r esin BioRex-5 or anion exchange resin CM
Sephadex. DMHF was first reported in pineapple in 1965, and it was characterized as a
remarkably intense aroma (described as "burnt pineapple" or "fruity caramel") and a high
degree of instability in air (Rodin et al. 1965; Silverstein 1971). It was also found in beef

58
broth (Tonsbeek et al. 1968; Silverstein 1971) and maple syrup (Underwood et al. 1968;
Silverstein 1971). In both of the latter cases, "cooking" is required to generate this
compound. But in pineapple its genesis must be different because of its existence in fresh
pineapple juice. The glucosidic form of DMHF was first reported in strawberry (Mayerl
et al. 1989) and then in pineapple (Wu et al. 1990). The average value for DMHF in this
database is 1.4, which is much higher than that reported by Wu et al. (1991) at 0.07 for
fruit. A study by Lee and Nagy (1987) gave similar values for DMHF, which is 1.4 for
fresh pineapple juice and 2.3 for canned juice (Table IV.3b). The average value for
glucosidic DMHF in this database is 6.2, which is also much higher than that reported by
Wu et al. (1991) at 0.05 for fruit.
Sinapyl derivatives
We were the first to identify these sinapyl compounds (peaks 6, 8 and 9) in pineapple
(Wen et al. 1999). To our knowledge, their presence has not been reported in any other
natural products. They are the major compounds, compromising about 36% of the total
measured compounds on weight base and 46% of the total peak area in the pineapple
juice concentrate data base (Table IV.3). Their presence in comparable amounts in fresh
and canned pineapple juice suggests that processing is not required for their formation.
Their s tructures s uggest t hat t hey m ay have antioxidant properties. Their antioxidant
activities were measured under both aqueous and organic solvent systems (Table IV.5).
In the aqueous system, they have slightly higher antioxidant activity than the Trolox
standard, while in the organic system, they have much higher activity than Trolox. The
antioxidant activity is possibly caused by its substructure of S-allyl-L-cysteine, which is
59
the major antioxidant in garlic (Imai et al. 1994; Lin 1994). Since their structure also
contains a conjugated benzyl group, sinapyl derivatives are expected to have higher
antioxidant activity than S-allyl-L-cysteine.
Peak 7
This peak has almost identical retention time and very similar UV spectra as p-
coumaric acid (see Fig. IV.3 for a spectral comparison). This is possibly whyp-coumaric
acid was reported in fruit (Macheix et al. 1990), juice (Fernandez de Simon et al. 1992)
and shell fibers (Larrauri et al. 1997). The exact chemical structure of this compound was
not determined in this investigation. This peak is simply reported as a p-coumaric acid-
like compound and quantified as p-coumaric acid. The average peak 7 value in this
database is 0.5 (estimated as p-coumaric acid) with a range of 0.1-2.1, which is lower
than that reported for juice and nectar by Fernandez de Simon et al. (1992) at a range of
1.1-4.4 (2 juices and 2 nectars).
Effect of year and variety on each peak
Only c.v. Cayenne has collection covering all the 3 years, so only this variety was
investigated for the effect of year on each individual peak concentration, and the results
are summarized in Table IV.6. While peak 8 has the lowest variation coefficient (Table
W.3), it is the only peak that is significantly affected by year (probability 5 0.05). For the
effect of variety on each individual peak, only the first 3 varieties are analyzed because of
the limitation of sample size for other varieties. It was found that peaks 1, 4, 6, 7 and 9
are affected by variety at 0.05 significant level (Table W.6).
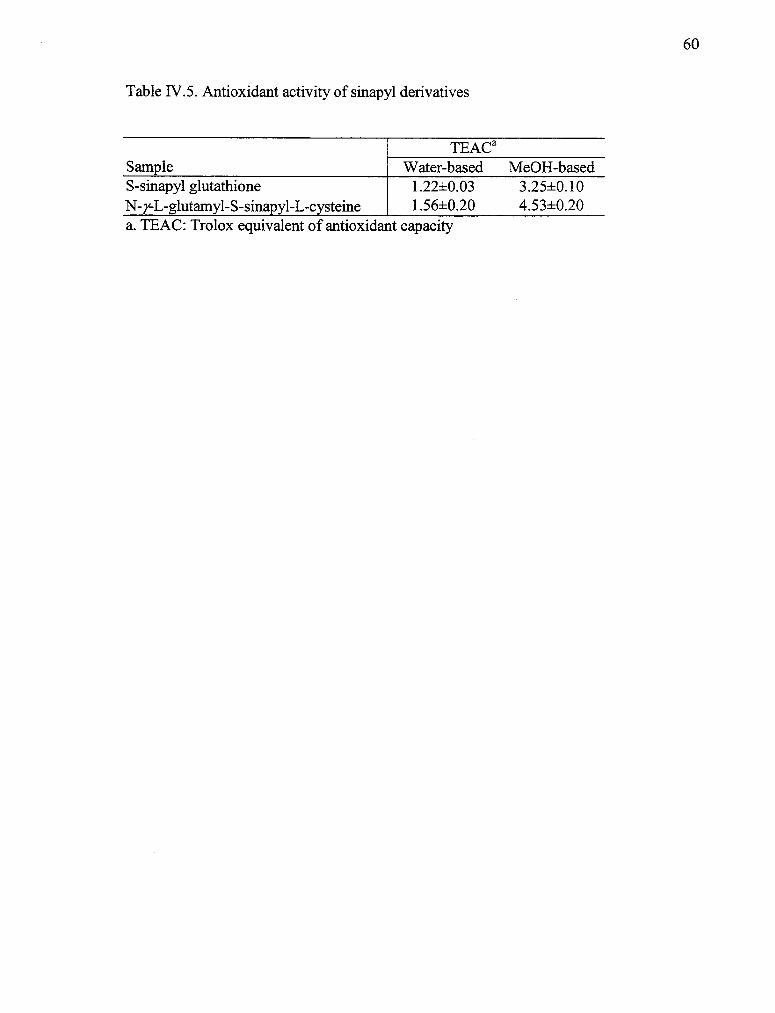
SampleS-sinapyl glutathioneN-y-L-glutamyl-S-sinapyl-L-cysteine
TEACaWater-based Me0H-based
1.22±0.03 3.25±0.10
1.56±0.20 4.53±0.20
Table rv.5. Antioxidant activity of sinapyl derivatives
a. TEAC: Trolox equivalent of antioxidant capacity
60

61
Pattern recognition analysis
Pattern recognition methods have been used to differentiate between different
varieties, different geographical origins and to detect adulteration (Pilando and Wrolstad
1992; Dizy et al. 1992; Nagy and Wade 1995; Aires-De-Sousa 1996). Principal
component analysis was conducted on all 54 samples to examine the relationships
among the variables. Canonical variable analysis was conducted on the 3 major varieties
(variety 1, 2 a nd 3) t o examine if they can be separated. The scores for the 3 major
varieties from the first 2 principal components are plotted in Fig. IV.4a (see Table IV.7
for the loading coefficients). Variety 2 and variety 3 are not separable while variety 1 has
some s eparation from v ariety 2 a nd 3. The first principal component, which explains
48.5% of the total variance, is mainly related to aromatic amino acids and two of the
sinapyl derivatives. The second principal component, which explains 21.9% of the total
variance, is correlated to DMHF and its glucoside and peak 7. The scores of the first 2
canonical variables for the samples are plotted in Fig. IV.4b (see Table IV.7 for
coefficients). Variety 1 can be completely separated from variety 2 and variety 3, while
variety 2 and variety 3 have limited separation. The first canonical variable is highly
correlated to tyrosine, 2 of the sinapyl derivatives and peak 7, while the second canonical
variable is related to DMHF glucoside and tryptophan.

Figure IV.3. UV spectrum of peak 7.
- - - p-Coumaric acid
62
I I
240 280 320 360
Wavelength (nm)

63
Table 1V.6. Analysis of variance for effect of year and variety on phenolic concentration
Peak No. 1 2 3 4 5 6 7 8 9Prob. (year) 0.18 0.60 0.74 0.93 0.26 0.49 0.21 0.04 0.53Prob. (variety) 0.00 0.25 0.78 0.03 0.23 0.00 0.00 0.68 0.00

64
CONCLUSIONS
A total of 9 major phenolic compounds were characterized and quantified for a large
set (n = 54) of authentic pineapple juice concentrate samples. These 9 peaks were present
in all concentrate samples, and they were also present in fresh and canned pineapple
juices. None of the pineapple phenolics reported to be present by previous workers are
represented by these 9 major compounds which represent approximately 70% of the
total peak area. Three sinapyl derivatives, which compromise 32% of the total peak area,
are unique to pineapple juice, and they may serve as marker compounds for pineapple
juice.

PR I N25
3
2
0
- 1
-2
-3
- 4
- 5
a)
5
....../..-i..i. A
;■. t AA. AAA;S*--44-.. i A
.... N.
-5 -4 -3 -2 -1 0
*
2-•
...........
•,•••,• ..... •••••- ........ •
b)
*
*
65
Figure IV.4. Cluster display of pattern recognition analysis of pineapple concentratesamples. a. 1st vs 2nd principal component scores for 3 major varieties; b. 1st vs 2ndcanonical variables for the 3 major varieties. See Table IV.1 for the variety code. *Variety 1, A Variety 2, + Variety 3.
PRIN1
CAN 1

66
Table IV.7. Coefficients for multiple variable analysis (PCA and CVA)
Peak No.1 2 3 4 5 6 7 8 9
PCAPRIN1 0.4266 0.2950 0.0272 0.3199 0.4168 0.4090 0.2510 0.1579 0.4458PRIN2 -0.1931 0.2637 0.4752 0.4586 0.0852 -0.3069 -0.4957 0.3308 0.0160
CVACAN1 0.7097 -0.3326 0.1377 0.1761 0.0787 0.7681 0.6381 0.0910 0.7245CAN2 -0.1128 0.0554 0.0714 0.7212 0.4969 0.0151 -0.2513 -0.2342 0.2598
67
REFERENCES
Aires-De-Sousa, J. 1996. Verifying wine origin: a neural network approach. Am J EnolVitic 47(4):410-414.
Blundell, J.E. 1992. Serotonin and the biology of feeding. Am J Clin Nutr 55(1 suppl.):155S-159S.
Bruce, D.W. 1960. Serotonin in pineapple. Nature 188:147.
Cilliers, J.J.L.; van Niekerk, P.J. 1984. Liquid chromatographic determination ofhydroxymethyfurfural in fruit juices and concentrates after separation on two columns.J. Assoc. Anal. Chem. 67(6):1037-1039.
Dizy, M.; Martin-Alvarez, P.J.; Cabezudo, M.D.; P olo, M .C. 1992. Gr ape, apple andpineapple juice characterisation and detection of mixtures. J. Sci. Food Agric.60(1):47-53.
Elkins, E.R.; Lyon, R.; Huang, C.J.; Matthys, A. 1997. Characterization of commerciallyproduced pineapple juice concentrate. J. Food Compos. Anal. 10(4):285-298.
Feldman, J.M.; Lee, E.M. 1985. Serotonin content of foods: effect on urinary excretionof 5-hydroxyindoleacetic acid. Am. J. Clin. Nutr. 42(4):639-643.
Fernandez de Simon, B.; Perez-Ilzarbe, J.; Hernandez, T.; Gomez-Cordoves, C.; Estrella,I. 1992. Importance of phenolic compounds for the characterization of fruit juices. J.Agric. Food Chem. 40(9):1531-1535.
Fontana, A.J.; Howard, L.; Criddle, R.S.; Hansen, L.D.; Wilhelmsen, E. 1993. Kinetics ofdeterioration of pineapple concentrate. J. Food Sci. 58(6):1411-1417.
Ho, C.T.; Lee, C.Y.; Huang, M.T. 1992. Phenolic compounds in food and their effects onhealth II: Antioxidants and cancer prevention. ACS Symposium Series 506.Washington, DC: American Chemical Society. 402 p.
Hodgson, A.S.; Hodgson, L.R. 1993. Pineapple juice. In: Nagy S, Chen CS, Shaw PE,editors. Fruit juice processing technology. Auburndale, FL: Agscience, Inc. p 378-435.
Imai, J.; Ide, N.; Nagae, S.; Moriguchi, T.; Matsuura, H.; Itakura, Y. 1994. Antioxidantand radical scavenging effects of aged garlic extract and its constituents. Planta Med.60(5):417-420.
Kirksey, S.T. Jr; Schwartz, J.0.; Hutfilz, J.A.; Gudat, M.A.; Wade, R.L. 1995. HPLCanalysis of polyphenolic compounds for juice autheniticity, In: Nagy S, Wade RL,

68
editors. Methods to detect adulteration of fruit juice beverages. Vol L Auburndale, FL:. Agscience, Inc. p 145-166.
Larrauri,J.A.; Ruperez, P.; Saura-Calixto, F. 1997. Pineapple shell as a source of dietaryfiber with associated polyphenols. J. Agric. Food Chem., 45(10):4028-4031.
Lee, H.S.; Nagy, S. 1987. High-performance liquid chromatography of 2,5-dimethy1-4-hydroxy-3-(2H)-furanone in pineapple and grapefruit juices. J. Food Sci. 52(1):163-165.
Lee, H.S.; Rouseff, R.L.; Nagy, S. 1986. HPLC determination of furfural and 5-hydroxymethylfurfural in citrus juices. J. Food Sci. 51(4):1075-1076.
Lin, R.I.S. 1994. Phytochemicals and antioxidants. In: Goldberg I, editor. Functionalfoods: Designer foods, pharmafoods, nutraceuticals, New York: Chapman & Hall, Inc.p 393-452.
Macheix, J.J.; Fleuriet, A.; Billot, J. 1990. Fruit phenolics. Boca Raton, FL : CRC Press,Inc. 378 p.
Mayerl, F.; Naf, R.; Thomas, A.F. 1989. 2,5-Dimethyl-4-hydroxy-3(2H)-furanoneglucoside: Isolation from strawberries and synthesis. Phytochemistry, 28(2):631-633.
Meiselman, H.L.; Lieberman, H.R. 1994. Mood and performance foods. In: Goldberg I,editor. Functional foods: Designer foods, pharmafoods, nutraceuticals, New York:Chapman & Hall, Inc. p 126-150.
Nagy, S.; Wade, R..L. 1995. Methods to detect adulteration of fruit juice beverages. VolI. Auburndale, FL: Agscience, Inc. 452 p.
Ohta, H.; Kinjo, S.; Osjima Y. 1987. Glass capillary gas chromatographic analysis ofvolatile components of canned Philippine pineapple juice. J. Chrom. 409(13):409-412.
Pilando, L.S.; Wrolstad, R.E. 1992. The effectiveness of pattern recognition, sugar,
nonvolatile acid, and 13C/12C analyses for detecting adulteration in apple juice. J.Food Comp. Analy. 5(1):10-24.
Rodin, J.0.; Himel, C.M.; Silverstein, R.M. Leeper, R.W.; Cortner, W.A. 1965. Volatileflavor and aroma components of pineapple. I. Isolation and tentative identification of2,5-dimethyl-4-hydroxy-3(2H)-furanone, J. Food Sci., 30(2):280-285.
Silverstein, R.M. 1971. The pineapple: Flavor. In: Hulme AC, Editor. The biochemistryof fruits and their products. Vol 2. New York: Academic Press. p 325-331.

69
Silverstein, R.M.; Rodin, J.0.; Himel, C.M.; Leeper, R.W. 1965. Volatiles flavor andaroma components of pineapple: II. Isolation and identification of chavicol and y-caprolactone. J. Food Sci. 30(4):668-672.
Spanos, G.A.; Wrolstad, R.E. 1990a. Influence of variety, maturity, processing andstorage on the phenolic composition of pear juice. J. Agric. Food Chem. 38(3):817-824.
Spanos, G.A.; Wrolstad, R.E. 1990b. Influence of processing and storage on the phenoliccomposition of Thompson seedless grape juice. J. Agric. Food Chem. 38(7):1565-1571.
Spanos, G.A.; Wrolstad, R.E.; Heatherbell, D.A. 1990. Influence of processing andstorage on the phenolic composition of apple juice. J. Agric. Food Chem. 38(7):1572-1579.
Takeoka, G.; Buttery, R.G.; Flath, R.A.; Teranishi, R.; Wheeler, E.L.; Wieczorek, R.L.;Guentert, M. 1989. Volatile constituents of pineapple (Ananas Comosus [L] Merr.). In:Teranishi, R.; Buttery, R.G.; Shahidi, F. Editors. Flavor chemistry: Trends anddevelopments. ACS Symposium Series 388. Washington, DC: American ChemicalSociety. p 223-237.
Tonsbeek, C.H.T.; Planken, M.J.; Weerdhof, T.V.D. 1968. Components contributing tobeef flavor: Isolation of 4-hydroxy1-5-methy1-3(21])-furanone and its 2,5-dimethylhomolog from beef broth. J. Agric. Food Chem 16(6):1016-1021.
Underwood, J.C.; Filipic, V.J.; Bell, R.A. 1969. GLC profile of maple syrup. J. Assoc.Off. Anal. Chem. 52(4):717-719.
Wen, L.; Wrolstad, R.E.; Hsu, V.L. 1999. Characterization of sinapyl derivatives inpineapple (Ananas Comosus [L] Merr.) juice. J. Agric. Food Chem. 47(3):850-853.
Wu, P.; Kuo, M.C.; Zhang, K.Q.; Hartman, T.G.; Rosen, R.T.; Ho, C.T. 1990. Analysisof glycosidically bound 2,5-dimethyl-4-hydroxy-3(2H)-furanone in pineapple. Perfum.Flavor 15(1):51-53.
Wu, P.; Kuo, M.C.; Zhang, K.Q.; Hartman, T.G.; Rosen, R.T.; Ho, C.T. 1991. Free andglycosidically bound aroma compounds in pineapple (Ananas comosus L. Men.). J.Agric. Food Chem. 39(1):170-172.
70
ACKNOWLEDGMENTS
This research was supported by a grant from the Washington-Oregon Tree Fruit
Commission. Pineapple juice concentrate samples were supplied by the National Food
Processors Association (NFPA). The antioxidant activities were measured by I. Vadim of
Linus Pauling Institute at Oregon State University. We thank R. W. Durst for help with
the HPLC analyses and C. Pereira for statistical advice. This is technical paper no.
11768 from the Oregon Agricultural Experiment Station.

CHAPTER V
ISOLATION AND CHARACTERIZATION OF ENZYMATIC BROWNINGINHIBITORS FROM PINEAPPLE JUICE
Ling Wen and Ronald E. Wrolstad
Department of Food Science & Technology, Oregon State UniversityCorvallis, OR 97331-6602
71
To be submitted to Journal of Food Science

72
ABSTRACT
The major enzymatic browning inhibitors of different pineapple juices (fresh, canned and
frozen concentrate) were characterized. The inhibition activity in fresh juice was from a
high molecular weight fraction and possibly a protease enzyme. In canned juice, added
ascorbic acid was a main inhibitor. In juice concentrate, a very polar organic acid (other
than ascorbic, citric, malic or oxalic acid) possessed the major inhibitory activity.
KEY WORDS: apple, enzymatic browning inhibition, pineapple juice
INTRODUCTION
Fruits and vegetables are very important in our diet to maintain health, and the
convenience of fresh-cut fruits and vegetables has greatly promoted their consumption.
However, the choice of fresh-cut products is still very limited, and one of the main
obstacles is the immediate development of enzymatic browning on the cut and peeled
surfaces (Sapers and others 1995). Sulfites are effective anti-browning agents. However,
the concerns over the allergenic reactions in an ever-expanding asthmatic population
promoted the Food and Drug Administration (FDA) to limit the use of sulfites in fresh
fruit and vegetable products.
The limitation of use of sulfites has stimulated active research for sulfite alternatives
as there is a great interest in the new product group of fresh-cut fruits and vegetables. An
approach our laboratory favors is to find natural browning inhibitors to serve as

73
alternatives to synthetic chemicals. Our laboratory previously demonstrated that
pineapple juice could inhibit the enzymatic browning in apple (Lozano-de-Gonzalez and
others 1993), but we had very limited information as to the nature of the inhibitor(s).
The objective of this study is to characterize the major enzymatic browning
inhibitor(s) in pineapple juice. Three different types of pineapple juices have been
investigated, and they are: frozen pineapple juice concentrate (CONC), fresh pineapple
juice (FRESH) and canned pineapple juice (CAN). The enzymatic browning inhibition
activities of these juices were measured, then their fractionation behaviors were
investigated and compared, and fmally the identified active fraction was further
fractionated by HPLC methodology.
MATERIALS AND METHODS
Source
Frozen pineapple juice concentrate and canned pineapple juice were supplied by Dole
Food Co., Inc. (Westlake Village, CA). Fresh pineapple (c.v. Smooth Cayenne, Maui,
Hawaii) and Red Delicious apples (grown in Washington) were purchased from a local
supermarket.
Juice preparation
The pineapple juice concentrate was diluted 4 times with deionized water, then
ultracentrifuged at 23000 g and the supernatant was collected. Fresh pineapple was cut
into cubes and blended into puree, then ultracentrifuged and the supernatant was

74
collected. There is no need of ultracentrifugation for canned juice. All the samples were
subjected to 0.45 gm HA membrane filtration (Millipore Corp., Bedford, MA).
Pineapple model solution (MODEL)
A "model" pineapple juice solution was prepared, which was composed of naturally
occurring sugars and acids as reported by Pilando and Wrolstad for pineapple juice
concentrate (1992). The concentration of individual compounds is (per100 mL): citric
acid, 0.69g; malic acid, 0.28g; quinic acid, 0.0118g; fumaric acid, 32.0 mg; shikimic
acid, 0.16 mg; ascorbic acid, 3 mg; sucrose, 6.76g; glucose, 2.79g; fructose, 3.25g.
The control solution was adjusted to pH 3.5 with 10% KOH.
Extraction of apple PPO
Apple PPO was isolated following a slightly modified procedure reported by Marques
and others (1994). Apple flesh (200 g) was blended with 200 mL cold 0.1 M Na-Pi buffer
(pH 6.5) with added sorbitol (0.1 M) and ascorbic acid (0.02 M). The puree was filtered
through 3-layers of cheesecloth and ultracentrifuged at 6000 g at 4 °C for 10 min. The
thylakoid pellet was collected and washed three times with Na-Pi buffer. PPO was
extracted from the pellet with 1.5 % Triton X-110 (Sigma, St. Louis) in Na-Pi buffer, and
then separated from Triton X-110 by phase separation. The enzyme was fmally filtered
through glass wool, and kept frozen until use.
Characterization of apple PPO
Dependence of PPO activity on pH and substrate concentration were conducted in
Mcllvaine's buffer (0.1 M Phosphate, 0.1 M citrate, pH adjusted to the required by adding

75
KOH) with two substrates, 4-methylcatechol and catechol. The enzyme reaction was
conducted in a Shimadzu UV160U spectrophotometer with detection wavelength set at
412 nm and temperature maintained at 25 ± 0.1 °C. Temperature dependence was not
tested.
Juice fractionation
The fractionation (Fig V.1) was conducted with a combination of C 1 8 cartridge (5 g
resin) from Alltech Associates (Deerfield, IL), XAD-1180 (Alltech Associates) and
BioRex-5 anion exchange resin (Chloride form, Bio-Rad Laboratories, Richmond,
CA). Before sample application, the C 18 cartridge was cleaned with 50 mL Me0H,
followed by 20 mL deionized water. The XAD-1180 resins was mixed with 3 volumes of
Me0H and the slurry was packed into a 1.5 cm id column with a fmal wet volume of 25
mL. The XAD-1180 column was cleaned with 250 mL Me0H, followed with 100 mL
deionized water. The BioRex-5 resin was mixed with deionized water, kept overnight,
and then the slurry was packed into a 1.5 cm id column with a fmal wet volume of 20 mL.
Before use, the BioRex-5 resin (20 mL) was converted to the phosphate form by eluting
sequentially with 400 mL 1M KOH, 100 mL K 2HPO4 and 100 mL deionized water. The
isolated active fraction was further fractionated by semi-preparative C18 HPLC (reverse
phase) and analytical amino column HPLC (normal phase).

76
Figure V.1. Outline of fractionation of pineapple juice
a) Membrane filtrationPineapple Juice
-O.Membrane (MW Cutoff 10K)
-0,Filtrate
120 ml Filtrate/Pineapple juice b) C 18 Fractionation
C 18 cartridge(5 g) —0.. Discarding first 20 ml, collecting rest (C18DE)
-0.120 ml 0.01% aqu. HC1 —01. Discarding first 20 ml, collecting rest (C18H20)
-arotary evaporated to dry50 mL Me0H elution —0. Collect all
dissolved in 120 ml 0.01% aqu. HC1(C isMet)
c) XAD-1180 Fractionation150 ml
may..
XAD-1180(25 ml) —O. Discarding first 20 ml, collecting rest (XADDE)
150 ml water wash --0.- Discarding first 20 ml, collecting rest (XADH2O)
.0.,
300 ml Me0H elution —0. rotary evaporated to dry, dissolved in 150 ml DI water ( XADMet )
130 ml XADDE/ C18Met
-0,BioRex-5 n20 ml; in HPO42- form)
-0,130 ml water wash —0. first 30 ml
..0.ml
d) BioRex-5
—0. first 30 ml discarded, collect rest
discarded, collect rest (BRH2O)
filtrate
Fractionation
(BRDE)
rotary evaporatedto 130 ml(BRSA)filtrate
(50:50)
130 10% H2SO4 i100 ml Me0H
Precipitate
100 ml MeOH:water

77
Semi-preparative C18 HPLC separation
A Dynamax SD-300 pump was used with a semi-preparative Microsorb C18 column
(25 cm x 21.4 mm, 5 mm) from Rainin Instrument Co. (Woburn, MA) with a manual
injection loop of 1 mL. The end of the column was connected to a flow divider, which
split 1 mL/min flow to a HP 1040A Diode Array Detector (DAD) with detection at 214
nm and the rest of flow (19 mL/min) to an outlet for a Gilson Model. 203 Microfraction
collector with 0.5 min for each fraction. An isocratic solvent system was used, and it was
27.2 g KH2PO4 (pH 2.4). Each injection was 1 mL. A total of 80 mL was collected for
each fraction, which was rotovaporated to 20 mL and then 40 mL Me0H was added and
filtered. Another 40 mL Me0H was added to the filtrate and then filtered again. The pH
of final filtrate was adjusted to 4.5 with 10% KOH, and then rotovaporated at 45 °C to 5
mL, and pH was adjusted again to 4.5 with 10% KOH.
Amino column HPLC separation
An Alltech Econosphere NH2 column (25 cm x 4.6 mm, 5 mm) was used with a HP
1040A DAD set at 214 nm. Flowrate: 1.0 mL/min; Injection: 50 pL. An isocratic solvent
acetonitrile : 0.05 M KH2PO4 buffer (pH 2.4) (75: 25). The above mentioned Gilson
microfraction collector was used with 0.5 min for each fraction. Injection volume : 25 pL.
A total of 7.5 mL was collected for each fraction, which was then rotovaporated to 0.5
mL.

78
Measurement of browning inhibition by puree assay
The method of Amiot and others (1995) was used with some modification. One apple
was peeled and cored using a manual peel/corer, and divided into four portions. For each
apple, four solutions were tested. Water (positive control), NaF-thiourea (negative
control), and two different sample solutions. Individual portions were blended with one of
the respective solutions, and kept at room temperature for 30 min with occasional
agitation. Color was measured as CIE LC*h* values by HunterLab ColorQUEST system.
The browning inhibition was expressed as:
C* 0 — C sample Inhibition% – X 100Co–Ci
whereas 0 = negative control; 1 = positive control
Measurement of browning inhibition by PPO enzyme assay
Apple PPO (20 IA) and test fraction (0.5 mL) were added to 2.5 mL substrate (2.4 mM
4-methylcatechol in 0.1 M citrate-phosphate buffer at pH 4.5) with temperature
maintained at 25 ± 0.1 °C. A412 change was recorded for the first minute. The
inhibition is expressed as:
(water)Inhibition% – x100
sample) 412 --M412 /Min(—M /min
412 /mm(water)M
Measurement of browning inhibition by slice assay
Red delicious apple was peeled by a manual peeler, and cut into small slices 2.0 x
2.0 x0 .3 cm). Four slices were dipped into each solution for 5 mM, wiped with Kimberly

79
tissue, and transferred to 15 x 10 cm sealable plastic bag, vacuum-sealed and refrigearted
(5 °C). One apple was us ed for o ne c omparison study. B rowning w as determined b y
observation with a scale of 1-9, with 9 representing most serious browning and 1 being no
observed browning. A value of less than 5 means some browning but still acceptable.
RESULTS AND DISCUSSION
Apple PPO characterization and assay condition selection
The dependence of apple PPO activity on pH and substrate concentration for 4-
methylcatechol and catechol is shown in Fig V.2. 4-Methylcatechol has much broader pH
range of stable activity than catechol, and its stable pH range is also compatible with the
pH of apple (about 3.5), so 4-methylcatechol is preferred over catechol for this
experiment. 4-Methylcatechol has a much lower apparent Km (4 mM) than catechol (30
mM), and these values agree with that reported by Richard-Forget (see Nicolas and others
1994) (4.7-4.9 for 4-methylcatechol and 20.3 for catechol). Since the inhibitor
concentration is usually low, it is very insensitive to detect the inhibition fraction using
PPO assay at the concentration of maximum activity, so a lower 4-methylcatechol
concentration of 2.4 mM is chosen instead.
Enzymatic browning inhibition of different pineapple juices
Table V. 1 shows that all the pineapple juices have enzymatic browning inhibition
activity comparing to the water control. Water, instead of the pineapple model solution,
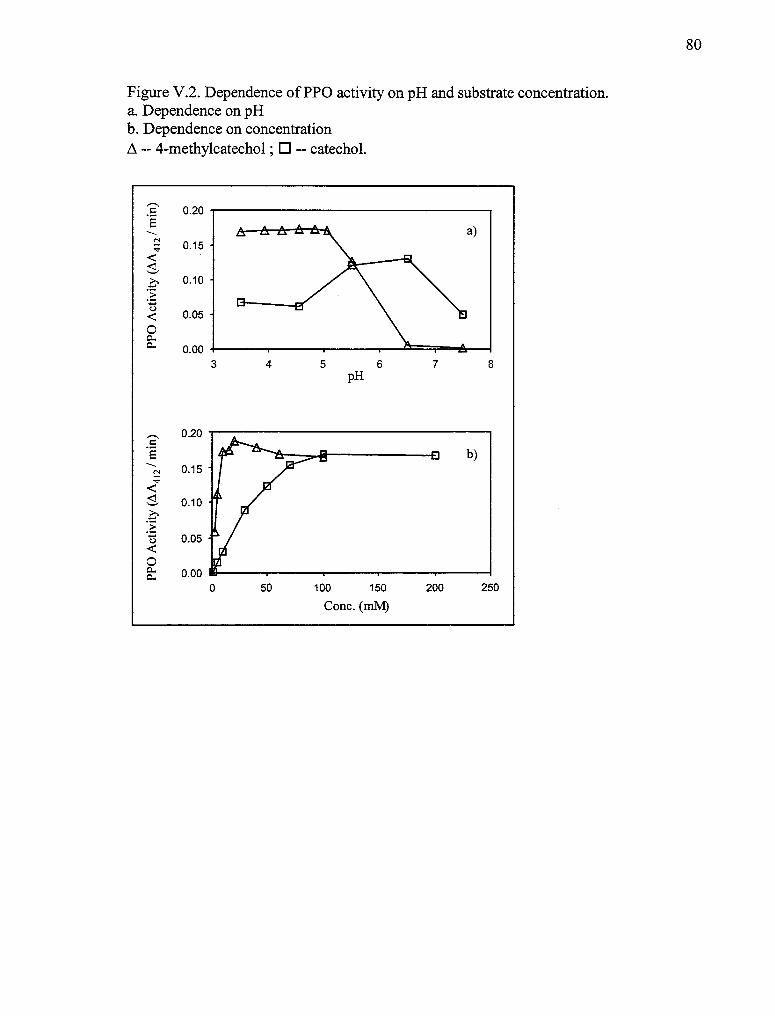
a)
0.00 -ii3 4 5 6 7 8
pH
0.20
0.15
0.10 -
0.05
0 50 100 150 200 250
Conc. (mM)
b)
Figure V.2. Dependence of PPO activity on pH and substrate concentration.a. Dependence on pHb. Dependence on concentrationA -- 4-methylcatechol ; q -- catechol.
80
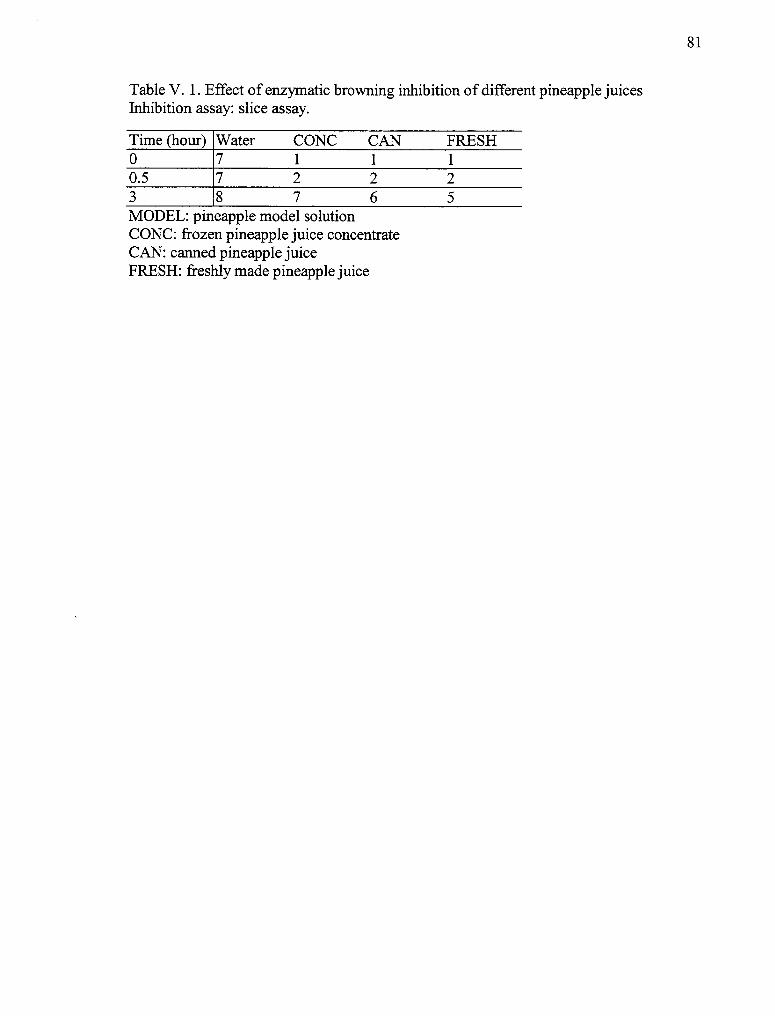
Table V. 1. Effect of enzymatic browning inhibition of different pineapple juicesInhibition assay: slice assay.
Time (hour) Water CONC CAN FRESH0 7 1 1 10.5 7 2 2 23 8 7 6 5MODEL: pineapple model solutionCONC: frozen pineapple juice concentrateCAN: canned pineapple juiceFRESH: freshly made pineapple juice
81

82
was chosen as the control because the answer of interest was if pineapple juice had
enzymatic browning inhibition activity. Among the different pineapple juices, fresh
pineapple juice has the highest inhibition activity, and canned pineapple juice has higher
activity than frozen juice concentrate.
Fractionation
Fig V.3 is the result of fractionation of pineapple juice concentrate, the enzymatic
browning inhibition being measured by the puree assay. The puree assay method was
chosen because it gave less variable results than the slice assay and it was more consistent
with visual observations of browning than the PPO assay. C18 resin was used to separate
polar and non-polar fractions. XAD-1180 was used to separate moderately non-polar
components from polar components. BioRex-5 was used to separate organic acids from
other components. This fractionation approach was satisfactory as the major browning
inhibition component was always retained in one of the fractions at each fractionation
step. The results show that the major browning inhibitor was a very polar negative-
charged ion, possibly an organic acid. Some of the fractions promoted browning, which
could be caused by experimental error or by matrices in the fractions. This paper did not
attempt to explain it. There is some consideration with respect to the BioRex-5 resin used
in fractionation. The BioRex-5 was specially treated by phosphate salt, which is intended
to replace the CF counter-ion of BioRex-5 with phosphate. Otherwise, CF would be
eluted by organic acids and cause the increased enzymatic browning inhibition of the
direct eluate from BioRex-5 resin. In this study, when the BioRex-5 resin was not treated
with phosphate, a 20% inhibition increase was observed for the pineapple model solution.
In Lozano-de-Gonzalez and others paper (1993), the acclaimed unknown neutral

83
component, which has browning inhibition in addition to ascorbic acid, is very possibly
caused by the eluted Cl" counter-ion.
Fig V.4 gives the results for the fractionation of different pineapple juices and the
model solution, along with their respective enzymatic browning inhibition as measured
by the PPO enzyme assay. The PPO enzyme assay was chosen because it is more
repeatable t han the p uree a ssay. 0 therwise it is very difficult to compare the
inhibition results of different fractions by either the puree assay or the slice assay because
of the natural variability in experimental materials used for repeated assays. The
pineapple model solution was used as a control to reflect the contribution of known
sugars and organic acids (including ascorbic acid) in pineapple juice to browning
inhibition, and it did not show any observable inhibition for each fraction. All the three
pineapple juices showed similar patterns except for the membrane filtration step. The
membrane filtration reduces the inhibition activity of fresh pineapple juice to the same
level as frozen pineapple juice concentrate, which is not affected by membrane filtration.
This reduction is caused by high molecular weight material and could very possibly be
native protease enzymes. McEvily e t a 1. ( 1992) r eported t hat p rotease e nzymes could
inhibit PPO by protein hydrolysis. The inhibition activity of canned pineapple juice can
be caused by the high content of added ascorbic acid, and possibly the metal ions
produced by the reaction between pineapple juice and the metal can.

100 80 -60 -40 -20 -
0 Frozen pineapple juice concentrate
C18
10080604020
0 vmr-20
C18DE C i8H20 C 18Met
XAD-1180
10080604020
0-20
XADDE XADH2 O XADMet
BioRex-5
4 4
BRDE
BRH20 BRSA
10080604020
0-20
Figure V.3. Enzymatic inhibition result of preliminary fractionation of pineapple juice.Sample: Frozen pineapple juice concentrate; Inhibition assay: puree assay.
84
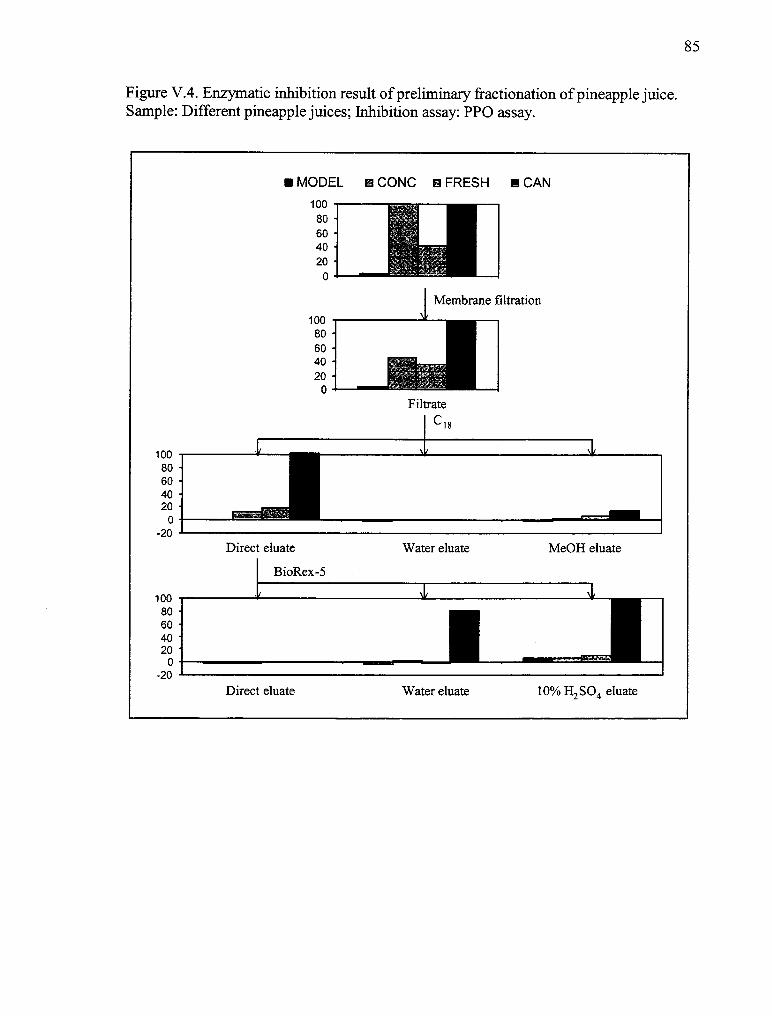
I,
• MODEL m CONC is FRESH e CAN
FiltrateCis
4
Direct eluate Water eluate Me0H eluate
BioRex-5
Direct eluate Water eluate 10% H2 SO4 eluate
10080604020
0-20
10080604020
0-20
10080604020
0
10080604020
0
Figure V.4. Enzymatic inhibition result of preliminary fractionation of pineapple juice.Sample: Different pineapple juices; Inhibition assay: PPO assay.
85
86
Since the enzymatic browning inhibition activity of fresh and canned pineapple juices
mainly came from protease and added ascorbic acid, the active fraction of frozen
pineapple juice concentrate was chosen as the desired material for further characterization
of browning inhibitor(s) by HPLC methodology.
HPLC fractionation
The results are shown in Fig V.S. The inhibition was measured by the PPO enzyme
assay because of the volume limitation of each fraction. The active fraction was not
retained by the C18 column, eluting within 3 min. This active fraction cannot be any of the
reported organic acids in pineapple juice (citric, ascorbic, malic, quinic, fumaric or
shikimic acids) since they all have longer retention times on this column (data not
shown). F urther fractionation o f t his no n-retained fraction w as a chieved on an amino
column. The separation may be achieved by two modes, ion-exchange and hydrogen-
binding. According to its behavior, this active inhibitor is possibly a very polar organic
acid. Because of the low concentration, high polarity and the high salt content in the
mobile phase, it is very difficult to recover the active inhibitor, so no further effort was
made to determine its identity. Son and others (2000) reported that t he a ntibrowning
activity of rhubarb juice is caused by oxalic acid, a very polar organic acid. Son and
others (2001) also compared the enzymatic browning inhibition activity of oxalic acid
with 12 other natural carboxylic acids, and they found that both oxalic acid and
oxalacetic acid have strong antibrowning activity while others have medium or very weak
antibrowning activity. However, the unknown inhibitor in this investigation can not be
either oxalic acid or oxalacetic acid because these two compounds would have different
elution behaviors on the amino column.

87
CONCLUSIONS
The pineapple juice fraction having the greatest apple PPO inhibiting activity is a
"polar, negatively charged" fraction. In addition to ascorbic acid, this fraction contained
an unidentified polar organic acid with high inhibiting activity. The compound is none of
the commonly reported organic acids in pineapple juice.

min10 12
Corresponding Inhibition
S' 3000;215 nm
8 2000;
'5 1000
0
a) C 1 8 HPLC fractionation
citric acidascorbic acid
200
Ug 100O
-tz
215 nm b) -NH2 HPLC fractionation
2
4
6
8 min
80 Corresponding Inhibition
further fractionated by -NH2 HPLC
Figure V.5. HPLC fractionation of enzymatic browning inhibitor(s).
a. C18 HPLC fractionation.b. Amino column HPLC fractionation.
88

89
REFERENCES
Amiot, M.J.; Tacchini, M.; Aubert, S.Y.; Oleszek,W. 1985. Influence of cultivar,maturity stage, and storage conditions on phenolic composition and enzymaticbrowning of pear fruits. J Agri Food Chem 43(5): 1132-1137.
Lozano-de-Gonzalez, P.G.; Barrett, D.M.; Wrolstad, R.E.; Durst, R.W. 1993. Enzymaticbrowning inhibited in fresh and dried apple rings by pineapple juice. J Food Sci 58(2):399-404.
Marques, L.; Fleuriet, A.; Cleyet-Marel, J.C.; Macheix, J.J. 1994. Purification of an applepolyphenoloxidase isoform resistant to SDS-proteinase K digestion. Phytochem36(5):1117-1121.
McEvily, A. J.; I yengar, R .; 0 twell, W .S. 1992. Inhibition o f e nzymatic b rowning infoods and beverages. Crit. Rev. Food Sci. Nutr. 32(3):253-273.
Nicolas, J.J.; Richard-Forget, F.C.; Goupy, P.M.; Amiot, M.-J.; Aubert, SY. 1994.Enzymatic browning reactions in apple and apple products. C rit. R ev. F ood S ci.Nutr., 34(2):109-157.
Son, S.M.; Moon, K.D.; Lee, C.Y. 2000. Rhubarb juice as a natural antibrowning agent.J Food Sci 65(7):1288-1289.
Son, S.M.; Moon, K.D.; Lee, C.Y. 2001. Inhibitory effects of various antibrowningagents on apple slices. Food Chem 73:23-30.
Pilando, L.S.; Wrolstad, R.E. 1992. The effectiveness of pattern recognition, sugar,nonvolatile acid, and 13C/ 12C analyses for detecting adulteration in apple juice. J FoodComp Analy 5(1):10-24.
Sapers, G.M.; Miller, R.L.; Choi, S.W. 1995. Prevention of enzymatic browning inprepeeled potatoes and minimally processed mushrooms. In: Lee CY, Whitaker JR,editors. Enzymatic browning and its prevention. ACS symposium series 600.Washington, DC : American Chemical Society. p 223-239.
90
ACKNOWLEDGMENT
This research was financially supported by Washington-Oregon Tree Fruit Commission.
Frozen pineapple juice was supplied by Dole Food Company. We thank R.W. Durst for
help with HPLC analyses. This is technical paper no. from the Oregon Agricultural
Experiment Station.

91
CHAPTER VI. SUMMARY
Nine major peaks accounting for 70% of total peak area in the phenolic profile of
pineapple juice have been characterized, and none of these peaks are represented by the
pineapple phenolics reported to be present by previous workers. Of these nine peaks,
three are newly identified sinapyl derivatives, which compromise 32% of the total peak
area. Their structures were elucidated from UV spectra, acid hydrolysis and subsequent
amino acid analysis, mass spectrometry, and two-dimensional NMR Spectroscopy.
These derivatives are unique to pineapple juice, and they may serve as marker
compounds for pineapple juice.
A phenolic compositional database is established for commercially produced
pineapple juice concentrates (n = 54), which have been collected over 3 years from
significant growing regions around the world.
The major enzymatic browning inhibitor in frozen pineapple juice is a very polar,
possibly organic acid, which is none of the commonly reported organic acids in pineapple
juice such citric acid and ascorbic acid. The major inhibitor is protease in fresh pineapple
juice and is ascorbic acid in canned pineapple juice.

92
BIBLIOGRAPHY
Abd Shukor, A.R.; Faridah, A.; Abdullah, H.; Chan, Y.K. 1998. Pineapple. In: Shaw,P.E.; Chn, H.T. Jr.; Nagy, S. Editors. Tropical and subtropical fruits. Auburndale, FL:Agscience, Inc., p.137-190.
Acker, S.A.B.E. van ; Berg, D.-J. van den; Tromp, M.N.J.L.; Griffieon, D.H.; Bennekom,W.P. van; Vijgh, W.J.F. van der; Bast, A. 1996. Structural aspects of antioxidantactivity of flavonoids. Free radic. Biol. Med. 20(3):331-342.
Allan, A.C.; Walker, J.R.L. 1988. the selective inhibition of catechol oxidase bysalicylhydroxamic acid. Phytochemistry. 27(10):3075-3076.
Angel, S.; Ben-Shalom, N. 1979. Research on olive quality in Israel for processing. I.prevention of brown spotting in green olives for puckling. Confructa, 24(1):79-82.
Bhat, S .R.; C handel, K .P.S. 1991. A no vel technique to overcome browning in tissueculture. Plant cell reports. 10(6/7): 358-361.
Billaud, C.; Regaudie, E.; fayad, N.; Richard-Forget, F.; Nicolas, J. 1995. Effect ofcylcodetxtrins on polyphenol oxidation catalyzed by apple polyphenol oxidase. In:Lee, C.Y.; Whitaker, J.R. Editors. Eznymatic browning and its prevention.Washington, DC: American Chemical Society. p. 295-312.
Bors, W.; Heller W.; Michel, C.; Saran, M. 1990. Flavonoids as antioxidants:Determination of radical-scavenging efficiencies. Methopds Enzymol. 186:343-355.
Bravo, L. 1998. Polyphenols: chemistry, dietary sources, metabolism, and nutritionalsignificance. Nutrition reviews. 56(11): 317-333.
Buta, J.G.; Moline, H.E. ; Spaulding, D.W. ; Wang, C.Y. 1999. Extending storage life offresh-cut apples using natural products and their derivatives. J. Agri. Food Chem.47(1):1-6.
Chan, J .H.T.; Y ang, H .Y. 1971. I dentification and c haracterization o f s ome oxidizingenzymes of McFarlin cranberry. J. Food Sci. 36(1):169-173.
Constenla, D.T.; Lozano, J.E. 1995. Effect of ultrafiltration on concentrated apple juicecolour and turbidity. hit. J. Food Sci. Technol. 30(1): 23-30.
Dawes, H.; Struebi, P.; Keene, J. 1994. Kiwifruit juice clarification using a fungalproteolytic enzyme. J. Food Sci. 59(4): 858-861.

93
Dizy, M.; Martin-Alvarez, P.J.; Cabezudo, M.D.; Polo, M .C. 1992. Gr ape, apple andpineapple juice characterisation and detection of mixtures. J. Sci. Food Agri.60(1):47-53.
Dong, X.; Wrolstad, R.E.; Sugar, D. 2000. Extending the shelf life of fresh-cut pears. J.Food SCi. 65(1):181-186.
Edwards, A.S.; Wedzicha, B.L. 1997. Uptake and thiol anti-browning agents by cabbageon blanching and reactivity during dehydration. Food chem. 59(3):453-457.
El-Shimi, N.M. 1993. Control of enzymatic browning in apple slices by using ascorbicacid under different conditions. Plant Foods Hum. Nutr. 43(1):71-76.
Elkins, E.R.; Lyon, R.; Huang, C.J.; Matthys, A. 1997. Characterization of commerciallyproduced pineapple juice concentrate. J. Food Compos. Anal. 10(4):285-298.
Enzyme Nomenclature, Recommendations of the Nomenclature Committee of theInternational Union of Biochemistry, 1992, Published for the International Union ofBiochemistry, Academic Press, San Diego, CA.
Fernandez de Simon, B.; Perez-Ilzarbe J.; Hernández T.; Gomez-Cordoves C.; Estrella I.1992. Importance of phenolic compounds for the characterization of fruit juices. J.Agr. Food Chem. 40(9):1531-1535.
Finkel, B.J.; Nelson, R.F. 1963. Enzymatic reactions with phenolic compounds: effect of0-methyltransferase on a natural substrate of fruit polyphenol oxidase. Nature.197:902-903.
Frankel, E.N.; Waterhouse, A.L.; Teissedre, P.L. 1995. Principal phenolicphytochemicals in selected California wines and their antioxidant activity ininhibiting oxidation of human low density lipoprotein, J. Agri. Food Chem., 43(4):890-894.
Friedman, M. 1996. Food browning and its prevention: an overview. J. Agri. Food Chem.44(3): 631-653.
Gardner, P.T.; White T.A.C.; McPhail, D.B.; Duthie, G.G. 2000. The relativecontribution of vitamin C, carotenoids and phenolics to the antioxidant potential offruit juices. Food Chem. 68(4):471-474.
Giusti, M. M.; Wrolstad, R. E. 2001. Unit F2.2 Anthocyanins characterization andmeasurement with UV-Visible spectroscopy. In: R. E. Wrolstad (Ed). Currentprotocols in food analytical chemistry . New York, NY: John Wiley & Sons, NY. Inpress.
94
Gokmen, V.; Borneman, Z. ; Nijhuis, H.H. 1998. Improved ultrafiltration for colorreduction and stabilization of apple juice. J. Food Sci. 63(3): 504-507.
Grncarevic, M.; Hawker, J.S. 1971. Browning of Sultana grape berries during drying. J.Sci. food Agric. 22(5):270-272.
Gunes, G.; Lee, C.Y. 1997. Color of minimally processed potatoes as affected bymodified atmosphere packaging and antibrowning agents. J. Food Sci. 62(3): 572-575, 582.
Haisman, D.R. 1974. The effect of sulphur dioxide on oxidising enzyme systems in planttissues. J. SCi. Food Agric. 25(7): 803-810.
Harbome, J.B. 1989. Methods in plant biochemistry. I: plant phenolics. London:Academic Press.
Harbome, J.B.; Baxter, H. 1999. Handbook of Natural Flavonoids. 2 vols. Wiley,Chichester.
Harbome, J.B.; Williams C.A. 2000. Advances in flavonoid research since 1992.Phytochem. 55(6):481-504.
Hertog, M.G.L.; Van Poppel, G.; Verhoeven, D. 1997. Potentially anticarcinogenicsecondary metabolites from fruit and vegetables. In: Tomas-Barberan, F.A.; Robins,R.J. Editors. Phytochemistry of fruit and vegetables. Oxford: Clarendon Press. p. 313-330.
Hertog, M.G.L.; Kronhout, D.; Aravanis, C.; Blackburn, H.; Buzina, R.; Fidanza, F.;Giampaoli, S.; Jansen, A.; Menotti, A.; Nedeljkovic, S.; Pekkarinen, M.; Simic, B.S.;Toshima, H.; Feskens, E.J.M.; Holtman, P.C.H.; Katan, M.B. 1995. Flavonoid intakeand long-term risk of coronary heart disease and cancer in the seven countries study,Archives in Internal Medicine, 155:381-386.
Hodgson, A.S.; Hodgson, L.R. 1993. Pineapple juice. In: Nagy, S.; Chen, C.S.; Shaw,P.E. Editors. Fruit Juice Processing Technology. Auburndale, FL: Agscience, Inc. p378-435.
Janovitz-Klapp, A.H.; Richard, F.C.; Goupy, P.M.; Nicolas, J.J. 1990. Inhibition studieson apple polyphenol oxidase. J. Agric. Food Chem. 38(4):926-931.
Kagami, M.; Amano, Y .; S aito, H . 1968. 0 n the removal o f c olor from wine. X VII.Studies on the application of ion exchange process to fermentation industries. J.Ferment. Technol. 46:153-155.
Kelly, S.H.; Finkle, B.J. 1969. Action of a ring cleaving oxygenase in preventingoxidative darkening of apple juice. J. Sci. Food Agric. 20:629-632.

95
Kirksey, S.T. Jr.; Schwartz, J.0.; Hutfilz, J.A.; Gudat, M.A.; Wade, R.L. 1995. HPLCanalysis of polyphenolic compounds for juice authenticity. In: Nagy, S.; Wade,R.L.Editors. Methods to detect adulteration of fruit juice beverages. Vol I.Auburndale, FL: Agscience, Inc. p. 145-166.
Lambrecht, H.S. 1995. Ulfite substitutes for the prevention of enzymatic browning infoods. In: In: Lee, C.Y.; Whitaker, J.R. Editors. Eznymatic browning and itsprevention. Washington, DC: American Chemical Society. p. 313-323.
Larrauri, Ruperez, P.; Saura-Calixto, F. 1997. Pineapple shell as a source of dietaryfiber with associated polyphenols. J. Agric. Food Chem., 45(10):4028-4031.
Lee, C.Y.; Whitaker, J.R. Editors. Enzymatic browning and its prevention. Washington,DC: American Chemical Society. 338p.
Lozano-de-Gonzalez, P.G. ; Barrett, D.M. ; Wrolstad, R.E. ; Durst, R.W. 1993.Enzymatic browning inhibited in fresh and dried apple rings by pineapple juice. J.Food Sci. 58(2): 399-404.
Luo, Y. ; Barbosa-Canovas, G.V. 1995. Inhibition of apple-slice browning by 4-hexylresorcinol. In: Lee, C.Y.; Whitaker, J.R. Editors. Eznymatic browning and itsprevention. Washington, DC: American Chemical Society. p. 240-250.
Macheix, J-J.; Fleuriet, A.; Billot, J. 1990. Fruit Phenolics. CRC Press, Inc., Boca Raton,FL. 3'78p.
Manach, C.; Regerat, F.; Texier, 0. 1996. Bioavailability, metabolism, and physiologicalimpact of 4-oxo-flavonoids. Nutr. Res. 16(3):517-544.
McEvily, A. J.; I yengar, R .; 0 twell, W .S. 1992. Inhibition o f e nzymatic browning infoods and beverages. Crit. Rev. Food Sci. Nutr. 32(3):253-273.
Molnar-Perl, I.; Friedman, M. 1990a. Inhibition of browning by sulfur amino acids. 2.fruit juices and protein-containing foods. J. Agric. food Chem. 38(8):1648-1651.
Molnar-Perl, I.; Friedman, M. 1990b. Inhibition of browning by sulfur amino acids. 3.Apples and potatoes. J. Agric. food Chem. 38(8):1652-1656.
Nicolas, II; Richard-Forget, F.C.; Goupy, P.M.; Amiot, M.-J.; Aubert, SY. 1994.Enzymatic browning reactions in apple and apple products. C rit. R ev. F ood S ci.Nutr., 34(2):109-157.
Okamura, S.; Watanabe, M. 1981. Determination of phenolic cinnamates in white wineand their effect on wine quality. Agric. Biol. Chem. 45(9):2063-2070.

96
Pardon, M.P.; Lozano, J.A.; Gonzalez, A.G. 1975. Properties of o-diphenol: 02oxidoreductase from Musa cavendishii. Phytochemistry, 14(9):1959-1963.
Paulson, A.T.; Vanderstoep, J.; Porritt, S.W. 1980. Enzymatic browning of peaches:effect of gibberellic acid and etephon on phenolic compounds and polyphenol oxidaseactivity. J. Food Sci. 45(2):341-45, 351.
Pilando, L.S.; Wrolstad, R.E. 1992. The effectiveness of pattern recognition, sugar,nonvolatile acid, and 13C/12C analyses for detecting adulteration in apple juice. J.Food Comp. Analy. 5(1):10-24.
Ratty, A.K.; Das, N.P. 1988. Effects of flavonoids on nonenzymic lipid peroxidation:structure activity relationship. Biochem. Med. Metab. Biol., 39:69-79.
Rice-Evans, C.; Packer, L. Editors. 1998. Flavonoids in health and disease. New York :Marcel Dekker, 541 p.
Robards, K.; Prenzler, P.D.; Tucker, G.; Swatsitang, P.; Glover, W. 1999. Phenoliccompounds and their role in oxidative processes in fruits. Food Chemistry, 66(4):401-436.
Robert, C.; Richard-Forget, F.; Rough, C.; Pabion, M.; Cadet, F. 1996. A kinetic study ofthe inhibition of palmito polyphenol oxidase by L-cysteine. Int. J. Biochem. CellBiol. 28(4):457-463.
Rouseff, R.L. 1988. Differentiating citrus juics using flavonone glycoside conecentrationprofiles. In: Nagy, S.; Attaway, J.A.; Rhodes, M.E. Editors. Adulteration of fruit juicebeverages. New York: Marcel Dekker, Inc. p. 49-66.
Sapers, G.M. 1992. Control of enzymatic browning in raw fruit juice by filtration andcentrifugation. Journal of food processing and preservation. 15(6): 443-456.
Sapers, G.M. ; Miller, R.L. 1988. Browning inhibition in fresh-cut pears. J. Food Sci.63(2):342-346.
Sapers, G.M.; Miller, R.L. 1992. Enzymatic browning control in potato with ascorbicacid-2-phosphates. J. Food Sci. 57(5): 1132-1135.
Sapers, G.M.; Miller, R.L. 1993. Control of enzymatic browning in pre-peeled potatoesby surface digestion. J. Food Sci. 58(5):1076-1078.
Sapers, G.M.; Miller, R.L. 1998. Browning inhibition in fresh-cut p ears. J . F ood S ci.63(2): 342-346.
Sapers, G.M.; Hicks, K.B.; Philips, J.G.; garzarella, L.; Pondish, D.L.; Matulaitis, R.M.;McCormack, T.J.; Sondey, S.M.; Seib, P.A.; El-Ataway, Y.S. 1989. Control of

97
enzymatic browning in apple with ascorbic acid derivatives, polyphenol oxidaseinhibitors, and complexing agents. J. Food Sci. 54(4):997-1002.
Sayavedra-Soto, L.A. ; Montgomery, M.W. 1986. Inhibition of polyphenoloxidase b ysulfite. J. Food Sci. 51(6): 1531-1536.
Shahidi, F.; Wanasundara P.K.J.P.D. 1992. Phenolic antioxidants. Crit. Rev. Food Sci.Nutr. 32(1):67-103.
Siebert, K.J.; Lynn, P.Y. 1997. Formation of protein-polyphenol haze in beverages. J.Agri. Food Chem. 45(11): 4275-4280.
Smyth, A.B.; Song, J. ; Cameron, A.C. 1988. Modified atmosphere packaged cut iceberglettuce: effect o f t emperature and 0 2 p artial pressure o n respiration and quality. J.Agric. Food Chem. 46(11): 4556-4562.
Son, S.M.; Moon, K.D.; Lee, C.Y. 2000. Rhubarb juice as a natural antibrowning agent. JFood Sci 65(7):1288-1289.
Spanos, G.A.; Wrolstad, R.E. 1990a. Influence of variety, maturity, processing andstorage on the phenolic composition of pear juice. J. Agri. Food Chem. 38(3):817-824.
Spanos, G.A.; Wrolstad, R.E. 1990b. Influence of processing and storage on the phenoliccomposition of T hompson Seedless g rape j uice. J . Agri. F ood C hem. 38( 7):1565-1571.
Spanos, G.A.; Wrolstad, R.E.; Heatherbell, D.A. 1990. Influence of processing andstorage on the phenolic composition of apple juice. J. Agri. Food Chem. 38(7):1572-1579.
Synge, R.L.M. 1975. Interactions of polyphenols with proteins in plants and plantproducts, Qual. Plant. Plant Foods Hum. Nutr., 24(3/4):337-350.
Taylor, S.L.; Higley, N.A. ; Bush, R.K. 1986. Sulfites in foods: uses, analytical methods,residues, fate, exposure assessment, metabolism, toxicity, and hypersensitivity. Adv.Food Res. 30: 1-76.
Tronc, J.-S.; Lamarche, F.; Makhlouf, J. 1997. Enzymatic browning inhibition in cloudyapple juice by electrodialysis. J. Food Sci. 62(1):75-78, 112.
Tsuda, T.; Watanabe, M. ; Ohshima, K . ; No rinobu, S . ; C hoi, S .W. ; K awakishi, S . ;Osawa, T. 1994. Antioxidative activity of the anthocyanin pigments cyanidin 3-0-beta-D-glucoside and cyanidin. J. Agric. Food Chem. 42(11): 2407-2410.
98
Van Buren, J.P.; de Vos, L.; Pilnik. 1976. Polyphenols in Golden Delicious apple juice inrelation to method of preparation. J. Agric. Food Chem. 24(3):448-451.
Vamos-VigyazO, L. 1995. Prevention of enzymatic browning in fruits and vegetables. In:Lee, C.Y.; Whitaker, J.R. Editors. Eznymatic browning and its prevention.Washington, DC: American Chemical Society. p. 49-62.
Walker, J.R.L.; Wilson, E.L. 1975. Studies on the enzymic browning of apples. Inhibitionof apple o-diphenol oxidase by phenolic acids. J. Agri. Food Chem. 26(12):1825-1831.
Walker, J.R.L. 1977. Enzymic browning in foods: Its chemistry and control. FoodTechnol. N.Z. 12(3):19, 21-22, 24-25.
Walker, J.R.L. 1995. Enzymatic browning in fruits: Its biochemistry and control. In: Lee,C.Y.; Whitaker, J.R. Editors. Eznymatic browning and its prevention. Washington,DC: American Chemical Society. p. 8-22.
Wallrauch, S.; Faethe, W. 1988. Amino acids: criteria for the evaluation of fruit juices.In: Nagy, S.; Attaway, J.A.; Rhodes, M.E. Editors. Adulteration of fruit juicebeverages. New York: Marcel Dekker, Inc. p. 21-48.
Wang, H.; Cao, G.; Prior, R.L. 1997. Oxygen radical absorbing capacity of anthocyanins.J. Agric. Food Chem. 45(2): 304-309.
Wesche-Ebeling, P. ; Montgomery, M.W. 1990. Strawberry polyphenoloxidase:extraction and partial characterization. J. Food Sci. 55(5): 1320-1324, 1351.
Wrolstad, R.E.; Hong, V.; Boyles, M.J.; Durst, R.W. 1995. use of anthocyanin pigmentanalyses for detecting adulteration in fruit juices. In: Nagy, S.; Wade, R.L.Editors.Methods to detect adulteration of fruit juice beverages. Vol I. Auburndale, FL:Agscience, Inc. p. 260-286.
Zemel, G.P.; Sims, C.A.; Marshall, M.R.; Balaban, M. 1990. Low pH inactivation ofpolyphenol oxidase in apple. J. Food Sci. 55(2):562-563.

99
APPENDIX

100
NATURAL ANTIBROWNING AND ANTIOXIDANT COMPOSITIONS ANDMETHODS FOR MAKING THE SAME
Ronald E. Wrolstad and Ling Wen
Department of Food Science and Technology , Oregon State University
Patent No.: US 6,224,926 B1Date of Patent: May 1, 2001
Application No.: 09/378,986Filed: August 23, 1999
101
ABSTRACT
The present invention, provides natural-source compositions having consistent,
effective antibrowning and antioxidant characteristics. Additionally, the present
invention provides methods for making the antibrowning/antioxidant compositions of the
present invention. More specifically, the present invention provides natural-source,
browning and oxidizing inhibitor compositions comprising S-sinapyl-L-cysteine, N-L-y-
glutamyl-S-sinapyl-L-cysteine, S-sinapyl glutathione, or various mixtures thereof.
Methods for making such natural, antibrowning/antioxidant compositions from pineapple
juice and/or from pineapple processing plant waste streams include efficient and effective
separation of the present invention compositions from unwanted sugars, acids, phenolic
compounds, and other undesirable compounds present in pineapple juice and/or pineapple
processing plant waste streams.
FIELD OF THE INVENTION
This invention relates to natural antibrowning, antioxidant compositions for foods,
and methods for making the same.

102
BACKGROUND AND SUMMARY OF THE INVENTION
The food industry is concerned with how quickly most fruits (and various fruit
products) become discolored upon exposure to air. The discoloration upon exposure to
air is caused by a chemical reaction known as oxidation. Oxidation (typically indicated
by discoloration) of fruits involves an enzyme-catalyzed oxidation of phenolic
compounds present in the fruit. Browning of fruits is also a concern of the food industry.
Browning of a fruits typically occurs following a mechanical injury to the fruit, such as
during the harvesting or processing of such foods.
Bisulfite compounds are currently used to inhibit the enzymatic oxidation and
browning in "fresh-cut" and processed fruits. Since a segment of the population is
hypersensitive to sulfites, however, food processors prefer to avoid using sulfite
compounds. Further, concern over labeling requirements for sulfur dioxide (due to
allergic reactions by many users) also causes food processors to avoid its usage. It is
particularly desirable in the food industry that an oxidation/browning inhibitor
composition be derived from a natural source, rather than a synthetic chemical. That is,
main-line food processing companies are seeking effective, natural alternatives to
synthetic food additives. Additionally, the FDA typically requires less extensive testing
information for a preparation derived from a natural source than for a preparation derived
from a synthetic chemical. This is particularly true if the "natural source" is a common
foodstuff.
Other currently available oxidation and browning inhibitors include, for example, 4-
hexyl resorcinol, sulfurdioxide metal chelators such as citric acid and phosphates in
combination with ascorbic acid. Oxidation and browning inhibitors such as citric acid
103
and phosphates in combination with ascorbic acid, however, are not sufficiently effective.
The use of inhibitor 4-hexyl resorcinol is limited in the United States to use with shrimp.
Additionally, even if 4-hexyl resorcinol is approved for use with fruits and fruit products,
many food processors will likely be reluctant to use it because it is derived from a
synthetic chemical rather than from a natural source.
Pineapple juice has also been shown to inhibit browning and oxidation of fresh fruit
(P.G. Lozano-de-Gonzalez, D.M. Barrett, R.E. Wrolstad, and R.W. Durst, Enzymatic
Browning Inhibited in Fresh and Dried Apple Rings by Pineapple Juice, J. Food Sci. Vol.
58, pp. 399-404 (1993)). The antibrowning/antioxidant effectiveness of pineapple juice
is, however, unacceptably variable for use in the food industry. That is, the effectiveness
of pineapple juice for such purposes varies from one type of pineapple to another, and
from one pineapple to another within a particular pineapple type. The effectiveness of the
pineapple juice as an antibrowning/antioxidizing agent also varies depending upon where
the pineapple was grown.
The present invention provides natural-source compositions having effective and
consistent antibrowning and antioxidant characteristics. Additionally, the present
invention provides methods for making the antibrowning/antioxidant compositions of the
present invention. More specifically, the present invention provides natural browning and
oxidizing inhibitor compositions comprising S-sinapyl-L-cysteine, N-L-y-glutamyl-S-
sinapyl-L-cysteine, S-sinapyl glutathione, or various mixtures thereof.
Methods for making such natural, antibrowning/antioxidant compositions from
pineapple juice and/or from pineapple processing plant waste streams are also provided.
The present invention provides methods for making antibrowning/antioxidant
compositions that are efficiently and effectively separated from sugars, acids, and other

104
phenolic compounds present in pineapple juice and/or pineapple processing plant waste
streams.
More specifically, one method of the invention generally includes centrifuging and
filtering a quantity of pineapple juice to obtain a filtrate. The filtrate is applied to a resin
column. The resin column is washed with acidified water to remove undesirable
constituents, such as sugars, acids, and other polar compounds. The constituents of the
antibrowning/antioxidant compositions are eluted from the column using a suitable media
such as an alcohol. The eluate constituents are evaporated to dryness and re-dissolved in
a liquid, such as water. The re-dissolved constituents are applied to an anion-exchange
resin column. The anion-exchange resin column is washed to remove undesirable,
neutral phenolic compounds. The anion-exchange resin column is then treated with an
acidic liquid, such as sulfuric acid. The acidic liquid elutes the remaining constituents
from the c olumn t o produce a n e luate. T he e luate is neutralized t o form o ne o f the
present invention antibrowning/antioxidant compositions. One or more of the individual
constituents of the neutralized eluate may be isolated to make alternative embodiments of
the antibrowning/antioxidant compositions of the present invention.
The foregoing and other features and advantages of the present invention will become
more apparent from the following detailed description, drawings, and examples of the
browning, oxidation inhibiting compositions and methods for preparing the same.

105
BRIEF DESCRIPTION OF THE DRAWINGS
FIG. 1 is a HPLC chromatogram of an antibrowning/antioxidant composition of the
present invention.
FIG. 2 is a semi-preparative HPLC chromatogram of another composition of the
present invention.
FIG. 3 illustrates an acid hydrolysis pattern of another composition of the present
invention.
FIG. 4 is the identification of compounds as identified in an ultra-violet spectrum of
another composition of the present invention.
DETAILED DESCRIPTION
The present invention provides natural antibrowning and antioxidant compositions for
use with fruits and fruit products.
As used herein, "antibrowning" means the reduction of or substantial inhibition of
browning of fruits exposed to mechanical injury. Also as used herein, "antioxidizing"
means the reduction of or substantial inhibition of oxidation (i.e., the ability to trap free-
radicals) of fruits exposed to air or other oxygen sources.
As used herein, an "isolated" constituent or component means a constituent of
pineapple juice that has been substantially separated from other constituents in pineapple
juice. The terms "substantially separated," "purified" or "purified component" do not
mean absolute purity or separation. Rather, the substantial separation, purification or
purity of a component mean more concentrated than when in a prior solution from which

106
the component was separated. Thus, for example, a purified phenolic compound is a
phenolic compound wherein the concentration of the phenolic compound is greater than
the concentration of the phenolic compound when in its natural environment, such as in
pineapple juice.
Also as used herein, a "natural" antibrowning/antioxidizing composition is a
composition isolated from a natural source rather than a synthetic source. Natural source
food preparations are much more readily received by the consumers and, thus, the food
processors. That is, a significant portion of the consuming public has the perception that
food additives or food preparatives from a natural source are better for health reasons
than synthetic additives and preparatives.
Antibrowning and antioxidant capabilities of a composition is typically determined by
comparison to the antibrowning and antioxidant capabilities of TROLOX. TROLOX, an
excellent antioxidant, is a water-and methanol-soluble analog of alpha-tocopherol (i.e., 6-
hydroxy-2, 5, 7, 8-tetramethylchroman-2-carboxylic acid) available from Aldrich of
Milwaukee, Wisconsin. TROLOX is widely used by persons skilled in the art, as a
reference s tandard for m easuring c omparative antioxidant capacity. TROLOX has an
activity equal to 1 in comparison to other antibrowning/antioxidant compositions. The
antioxidant capacity (AOC) of a composition is referred to as a TEAC value, i.e.,
TROLOX Equivalent of Antioxidant Capacity. In other words, the antioxidant capacity
of a composition is typically expressed as the calculated molar amount of TROLOX with
AOC corresponding to 1 mole of assayed composition.
Specifically, a photo-chemiluminometer is typically used to measure the antioxidant
capacity of particular compositions. Such a technique permits measurement of
antioxidant capacity of water-soluble, lipid-soluble, and protein-associated compositions.

107
Using such techniques, superoxide radicals are generated in a photo-sensitizer (e.g.,
luminol) solution using ultra-violet irradiation. The antioxidant capacity is measured as
inhibition of light output: I = 1 - A/A0 wherein A is equal to the area under the
chemiluminescense emission curve and is expressed as TROLOX Equivalent of
Antioxidant Capacity (i.e., TEAC).
The antioxidant capacity of compositions is also often determined by measuring the
compositions' oxygen-radical absorbance capacity (ORAC). Quantitating the ORAC of
antioxidants is based on the use of beta-phycoerythrin (beta-PE) as an indicator protein,
2,2'-azobis(2-amidinopropane) dihydrochloride (AAPH) as a peroxyl radical generator,
the TROLOX as a control standard. As in the TEAC assay, results are expressed relative
to the antioxidant activity of TROLOX, where 1 ORAC unit equals the net protection
produced by 1 :M TROLOX.
The natural antibrowning and antioxidant compositions of the present invention
comprise at least one compound having antibrowning/antioxidizing properties. The
compositions of the present invention may be made from natural sources, such as
pineapples, pineapple juice, or pineapple process plant waste streams. The
antibrowning/antioxidizing compositions include S-sinapyl-L-cysteine, S-sinapyl
glutathione, N-L-y-glutamyl-S-sinapyl-L-cysteine, or various combinations of these
sinapyl compounds (having various relative concentrations of the sinaply compounds).
S-sinapyl-L-cysteine is typically a slightly yellow solid having a chemical structure
substantially as shown in FORMULA 1.

108
0I I 4'
HO—C—CH—NH23' I
io'CH2
S
1" 2"MeO 4 OMe
OH
FORMULA 1
wherein MeO and OMe represent methoxy groups.
S-sinapyl glutathione is typically a slightly yellow solid having a chemical structure
substantially as shown in FORMULA 2.
NH20 01' 2' I I 4' II
HOOC—CH2—NH—C—CH—NH—C—CH2—CH2—CH 8'3' I 5' 6' 7' I
10'CH2 COOH9'S
1" 2"MeO 4 OMe
OH
FORMULA 2
wherein MeO and OMe represent methoxy groups.
N-L-y-glutamyl-S-sinapyl-L-cysteine is typically a slightly yellow solid having a
chemical structure substantially as shown in FORMULA 3.

109
01' 2' II 4'
HOOC—CH2—NH—C—CH—NH23'
10'CH2
S
1" 2"MeO 4 OMe
OH
FORMULA 3
wherein MeO and OMe represent methoxy groups.
Methods for making the antibrowning, antioxidant compositions of the present
invention generally comprise isolation of desirable constituents of extracted pineapple
juice and/or pineapple processing waste streams. Although any type of pineapple may be
used to practice the methods of the present invention, pineapples found to be useful in
practicing the methods include: champaka, cayenne, champaka-smooth cayenne, cayena
Lisa, cayenne F-200, and smooth cayenne. Likewise, waste streams from the processing
of such pineapples may also be used to make the compositions of the present invention.
Suitable pineapples may first be washed with water or chlorinated water to eliminate
extraneous matter and particulates. The pineapples (or pineapple waste stream solutions)
may be stored at about 4°C until the pineapples (or waste stream solutions) are to be
treated. Alternatively, the pineapples (or waste stream solutions) may be treated
immediately following the wash. The pineapple skins and tops may be removed. The
pineapples are then preferably cut into smaller pieces, ground, or The pineapple pieces or
puree may then be extracted to obtain a pineapple juice solution. Typically, the pineapple

110
pieces or puree are pressed using a conventional juice hydraulic press. The pineapple
juice concentrate is diluted with deionized water. Dilution of the pineapple concentrate is
preferable as the concentrate is typically too viscous for efficient subsequent filtration and
resin treatments. Single strength values are acceptable (about 10° brix to about 15° brix
has been found to be useful), but a higher range of from about 10° brix to about 25° brix
will work. The diluted pineapple juice is ultracentrifuged to remove particulates, e.g.,
high molecular weight proteins and poly-saccharides. The resulting supernatant is
collected and filtered to remove remaining or residual particulates.
The filtrate is then passed through a suitable resin, such as a methanol activated C18
resin. The C18 resin is a silica-based resin having long carbon chains (i.e., 18 carbon
atoms) covalently bonded to silica. (Such resins are available from Alltech Associates of
Deerfield, Illinois). Other suitable silica resins, however, may be used to practice the
methods of the present invention. The C 18 resin is then preferably washed with an acidic
solution, e.g., 0.01% aqueous HC1 to remove undesirable compounds, such as sugars,
acids, and other polar compounds.
The constituents of the antibrowning/antioxidizing compositions are then eluted from
the C 18 r esin us ing a s uitable m edia, such as methylalcohol. The resulting eluate is
preferably stored at about -10°C for a period of about 12 hours. Although storage at
about -10°C is not critical, low-temperature storage seems to hasten precipitation of un-
wanted materials. The temperature and time period the eluate is stored is not critical, but
a temperature within a range of from about -15°C to about 5°C has been found to be
useful. The eluate is then passed through a filter media, such as a 0.45 :M membrane
filter to remove precipitate. Without being tied to any particular theory, the inventor
believes the precipitate comprises polysaccharides or proteins. The filtrate is collected
111
and is preferably evaporated to dryness using a rotary evaporator at about 35°C. Other
suitable evaporation methods may be used.
The evaporate is re-dissolved in water or an acidic solution. Re-dissolution in an
aqueous acidic solution is preferred for dissolving sinapyl compounds for application to
resin. The compounds should be in an aqueous solution for later application to an anion-
exchange resin. The sinapyl compounds with their carboxylic acid (anions) will
exchange with anions on the resin. It has been found that a more effective evaporation
takes place if the sinapyl compounds are re-dissolved in a neutral or acidic environment.
The solution including the re-dissolved constituents is applied to an anion-exchange
resin (e.g., a BIOREX-5 anion-exchange column available from Bio-Rad Laboratories, of
Richmond, California). The anion-exchange resin is washed with water to remove
neutral phenolic compounds. The composition constituents are then eluted from the
anion-exchange resin, preferably using an acidic solution, e.g., a hydrochloric acid
solution having a pH of about 1 or less. The eluate is then adjusted to a pH of from about
3 to about 5, and preferably to a pH of about 3.5. The pH of the eluate is adjusted with a
basic solution, such as sodium hydroxide or other alkalizing agents such as potassium
hydroxide. The eluate is then preferably filtered, preferably through a 0.45 :m membrane.
The resulting antibrowning/antioxidation composition may then be used and/or individual
components of the composition or combinations of components of the composition may
be isolated to form alternative embodiments of the composition of the present invention.
One or more of the sinapyl components of the composition may be isolated or separated
using any of a variety of suitable methods, such as by high-performance liquid
chromatography (HPLC) or by electrophoresis.

112
Although the method set forth above produces consistent and effective antibrowning,
antioxidant compositions, if desired, the concentration of the antibrowning, antioxidation
components oft he resulting c ompositions m ay b e de termined using analytical HPLC.
The resulting compositions may have effective antibrowning, antioxidant characteristics
over a broad pH range (i.e., within the range of food product pH values). Food products
are typically at a pH range of from about 3 to about 8.
Examples
The National Food Processors Association (of Washington, D.C.) and Dole Food
Company, Inc. (of Westlake Village, CA), provided fifty-four pineapple juice concentrate
samples. The pineapple juice samples were stored at about -20°C until use. The
pineapple samples were mainly three varieties: Cayenne (from Bukidnon, Philippines),
Smooth Cayenne (from Thailand and Philippines), and Champaka (from Maui, Hawaii).
About 400 g of pineapple juice concentrate was diluted four fold with deionized
water. The diluted pineapple juice was ultracentrifuged at about 23,000 g for about 20
minutes. The supernatant was collected and filtered through Whatman #1 filter paper
with a CELITE diatomaceous earth filtration aid (available from Celite Corp. of
California). About 100 mL of the filtrate was passed through a methylalcohol activated
C18 resin having about 5 g resin (C18 resin available from Alltech Associates of
Deerfield, Illinois). The activated C18 resin was then washed with about 100 mL of
about 0.01% aqueous HC1 and then eluted with about 50 mL of methylalcohol. The about
50 mL of methylalcohol eluate was combined with the about 100 mL of about 0.01% HCI
eluate and the eluate mixture was stored for about 12 hours at about -10°C. The eluate
mixture was then filtered using a 0.45 gm Millipore HA membrane (available from

113
Millipore) to remove precipitate. The filtrate was rotary evaporated substantially to
dryness at about 35°C and re-dissolved in about 10 mL of about 0.01% aqueous
HC1:Methylalcohol (at a ratio of about 70:30). The aqueous HCI:Methylalcohol solution
was filtered with a 0.45 :m Millipore HA membrane prior to semi-preparative HPLC
isolation.
Isolation of Sinapyl Compounds Using Semi-Preparative HPLC
Two Dynamax SD-300 pumps (available from Dynamax Corp. of Houston, Texas)
were used with a semi-preparative Microsorb C18 column (25 cm x 21.4 mm, 5 :m)
(available from Rainin Instrument Co. of Woburn, Massachusetts). The end of the C18
column was connected to a flow divider that split a 1 mL/min flow to a HP 1040A Diode
Array Detector (DAD) (available from Hewlett Packard of Corvallis, Oregon) having a
detection at 280 nm. The remainder of flow, at 19 mL/min, was directed to an outlet for
manual peak collection. The following gradient employing solvent A (methanol) and
solvent B (0.07 M K-PO4 buffer, pH 2.4) was used: 7 minutes from 35% to 45% solvent
A, then 3 minutes from 45% to 48% solvent A and holding for 5 minutes. Three sinapyl
compounds were isolated and identified (i.e., compound 1, S-sinapyl-L-cysteine,
compound 2, S-sinapyl glutathione, and compound 3, N-L-y-glutamyl-S-sinapyl-L-
cysteine).
The peak solution purity was verified by analytical HPLC as shown in Fig. 1
(discussed below). Each peak solution collected from the preparative HPLC (i.e., each of
the three isolated sinapyl compounds) was rotary evaporated at about 35°C for about 10
minutes to remove methylalcohol. The isolated solutions were then extracted with a 5 g

114
C18 resin (available from Alltech Associates, Inc. of Deerfield, Illinois). The
methylalcohol eluate from the C18 resin was rotary evaporated to dryness and stored at
about -15°C until analysis. As shown on the chromatograph of Fig. 1, peaks 1, 2 and 3
were obtained. The three peak solutions (i.e., compound 1, S-sinapyl-L-cysteine,
compound 2, S-sinapyl glutathione, and compound 3, N-L-y-glutamyl-S-sinapyl-L-
cysteine) were further analyzed by analytical HPLC (as discussed below).
Analysis of Isolated Compounds 1, 2, and 3 by Analytical HPLC
A Supelco LC-18 column (25 cm x 4.6 mm, 5 :m) was used with a HP 1040A DAD
set at 280 nm. The flowrate was set at about 1.0 mL/min, the injection was set at about
50 :L. The following gradient employing methanol (solvent A), acetonitrile (solvent B)
and solvent C (0.07 M K-PO4 buffer, pH 2.4) was used: 10 minutes from 10% solvent
A/0% solvent B to 22% solvent A/0% solvent B, then 25 minutes from 22% solvent
A/0% solvent B to 22% solvent A/25% solvent B, the remainder being solvent C.
Approximately 5 mg of compound 1, 50 mg of compound 2, and 50 mg of compound 3
were isolated and identified. Compound 1 was identified as S-sinapyl-L-cysteine;
compound 2 was identified as S-sinapyl glutathione, and compound 3 was identified as
N-L-y-glutamyl-S-sinapyl-L-cysteine.
Structural Analysis of Isolated Sinapyl Compounds 2 and 3 by Acid hydrolysis
About 0.5 mg each of compound 2 and compound 3 were acid hydrolyzed in a
TEFLON-lined, screw-cap test tube with about 5 mL of about 2 N HC1 at about 100°C for
about 30 minutes in the dark (about 10 minutes N2 flushing before hydrolysis). The

115
solution was cooled in ice-bath and extracted with C18 Sep-Pak (360 mg resin) (available
from W aters As sociates of Milford, Massachusetts). The methylalcohol eluate of the
Sep-Pak was rotary evaporated to dryness and re-dissolved in an about 0.01% aqueous
HC1 solution and analyzed by HPLC using the same conditions as described above.
Sinapyl compounds 2 and 3 of the present invention were identified. The acid hydrolysis
pattern of the sinapyl compounds was thus determined, as shown in Fig. 3.
Structural Analysis of Sinapyl Compounds by Amino Acid Analysis
About 200 IAL of the methylalcohol eluate from the isolation step above was
transferred to a 1.5-mL TEFLON-lined screw-cap reaction tube. The eluate was flushed
dry with N2, dissolved in about 120 :L of an about 6 N HC1 solution and flushed with N2
for about one minute and the tube was capped. Hydrolysis was performed in a heating
block at about 95°C for about 3 hours. An amino acid analysis was performed on the
hydrolysate using a PITC derivatization as described b y H agen e t a 1. in F ood Chem.
46:319-323, 1993. The identity of hydrolyzed amino acids were confirmed by spiking
sample with the standard PITC derivatives.
Structural Analysis of Sinapyl Compounds by Mass Spectrometry
Electrospray ionization mass spectrometry (ESI-MS) were performed using a Perkin
Elmer Sciex API III+ triple quadrupole ionspray mass spectrometer (available from
Perkin Elmer of Ontario, Canada) by pneumatically assisted electrospray to determine the
molecular weights of the sinapyl compounds. The operating conditions were standard, as
known to persons skilled in the art. Tandem MS/MS were recorded on the same

116
instrument using Ar-N2 (9:1) as a target gas mixture. The collision energy was at about
15 to about 25 V. Operating conditions were again standard, as known to persons skilled
in the art. A fast atom bombardment mass spectrometry sample was prepared in a matrix
of about a 0.1 N toluenesulfonic acid solution in 1:1 glycerol/3-nitrobenzyl alcohol
solution. The positive spectra were recorded on a Kratos M550TC instrument (available
from Kratos Analytical, Ltd. of Manchester, England) at a scan speed of about 10
sec/decade us ing a resolution of 1100 with a gun producing a 7 KV beam of Xenon
atoms.
Structural Analysis of Sinapyl Compounds by Nuclear Magnetic Resonance (NMR)
NMR was used to confirm the glutathione structure in peak 1 of Figs. 1 and 2 and to
confirm the sinapyl structure of compounds 1, 2, and 3 of the present invention.
Referring to Table 1, 1H (600 MHz) and 13C (150 MHz) NMR spectra were recorded at
about 25°C using a Bruker DRX 600 NMR Spectrometer (available from Bruker
Instruments, Inc. of Billierica, Massachusetts). A mixed solvent comprising
D20:CD3OD:CF3COOD at about 60:30:10 by volume and a residual D 20 resonance was
used as internal chemical shift reference. A 1 H- 1 H correlation spectroscopy (COSY) and
a total correlation spectroscopy (TOCSY), a 1 H- 13C heteronuclear multiple bond quantum
correlation (HMQC), and a heteronuclear multiple bond c orrelation ( HMBC) a nalysis
were performed using a standard pulse sequence, as known to persons skilled in the art.
Spectral widths of about 10 ppm and 200 ppm were used in the 1 H and 13 C dimensions,
respectively.
S-sinapyl-L-cysteine, compound 1, was identified as, a slightly yellow solid, having
the following parameters: ESI-MS m/z of 314.0 (MH +), 192.8 (MHO' - cysteine), 160.8

117
MS/MS of daughter ion (m/z 192.8, collision energy 25 volts) m/z (rel. int.): 192.8 (20),
161.2(100), 143.2 (15), 133.2(100), 115.0 (60), 105.2 (100), 79.0 (15), 55.0 (8). An
ultraviolet spectrum showed a ?max of 285 nm (mobile phase). For the 1 11 NMR results,
see Table 1.
S-sinapyl glutathione, compound 2, was identified as a slightly yellow solid having
the following parameters: ESI-MS m/z 500.0 (MH +), 308.0 (Glutathione-H+), 192.8
(Mkt - Glutathione). An ultraviolet spectrum was obtained that was identical to that UV
spectrum from compound 1, as discussed above. For the 1 Hand 13C NMR results see
Tables 1 and 2. For the 1 H - 13C HMQC results see Table 3.
N-L-y-glutamyl-S-sinapyl-L-cysteine, compound 3, was also identified as a slightly
yellow solid having the following parameters: ESI-MS m/z of 442.8 (MH+), 250.8 (Glu-
Cys-H+), 192.8 (MH+ - Glu-Cys). A FAB-MS m/z of about 443.1 (calculated for
Ci9H2708N2S 1 : 443.1458; deviation: -3.4 ppm). An ultraviolet spectrum of N-L-y-
glutamyl-S-sinapyl-L-cysteine is the same as for compounds 1 and 2. For the 1 11 NMR
results see Table 1. The 1 11 NMR results provide information for interpretation of the
ultraviolet spectra. Such measurements give the electromagnetic information
characteristics of different protons.
Results for mass spectral analysis of a sinapyl alcohol standard (available from
Aldrich of Milwaukee, Wisconsin) had the following parameters: ESI-MS m/z of 193.0
(MI-1±-H20), a MS/MS (collision energy 15 volts) m/z (rel. int.) of 192.8 (16), 161.2
(80), 143.2 (5), 133.2 (83), 115.0 (45), 105.2 (100), 79.0 (10), 55.0 (5) and an ultraviolet
spectrum that was the same as other sinapyl derivatives (in the mobile phase). Sinapyl
alcohol was used as a reference standard. Sinapyl alcohol's structural similarity to the

118
sinapyl compounds of the present invention provide appropriate reference points for
interpretation of ultraviolet and mass spectral data.
Table 1 1 1-1 NMR Data for Compounds 1, 2 and 3*
H Compound 1* Compound 2* Compound 3*2,6 6.44s 6.35 s 6.40 s7 6.13 d(15.6) 6.04 d (15.6) 6.08 d (15.6)8 5.78 dt (15.6, 7.8) 5.69 dt (15.6, 7.8) 5.73 dt (15.6, 7.8)9 3.07 d (7.8) 2.94 d (7.8) 3.00 d (7.8)1',2" 3.54s 3.47 s 3.51 s2' _ 3.58 s4' 3.95 dd (7.8, 4.2) 4.20 t (6.6) 4.26 dd (8.4, 4.8)6' 2.18 t (7.2) 2.21 t (7.2)7' 1.86 dt (7.2, 7.2),
1.80 dt (7.2, 7.2)1.90 dt (7.2, 7.2),1.84 dt (7.2, 7.2)
8' 3.69 t (6.6) 3.74 t (6.6)10' 2-.86 dd (15.0, 4.2),
2.71 dd (15.0, 7.8)2.60 dd (13.8, 4.8),2.44 dd (13.8, 8.4)
2.69 dd (13.8, 4.8),2.52 dd (13.8, 8.4)
Coupling constant (J in Hz) given in parenthesesChemical shifts assigned by comparison to chemical shift pattern of compounds.*Compound 1 is S-sinapyl-L-cysteine; compound 2 is S-sinapyl glutathione; compound 3is N-L-y-glutamyl-S-sinapyl-L-cysteine.
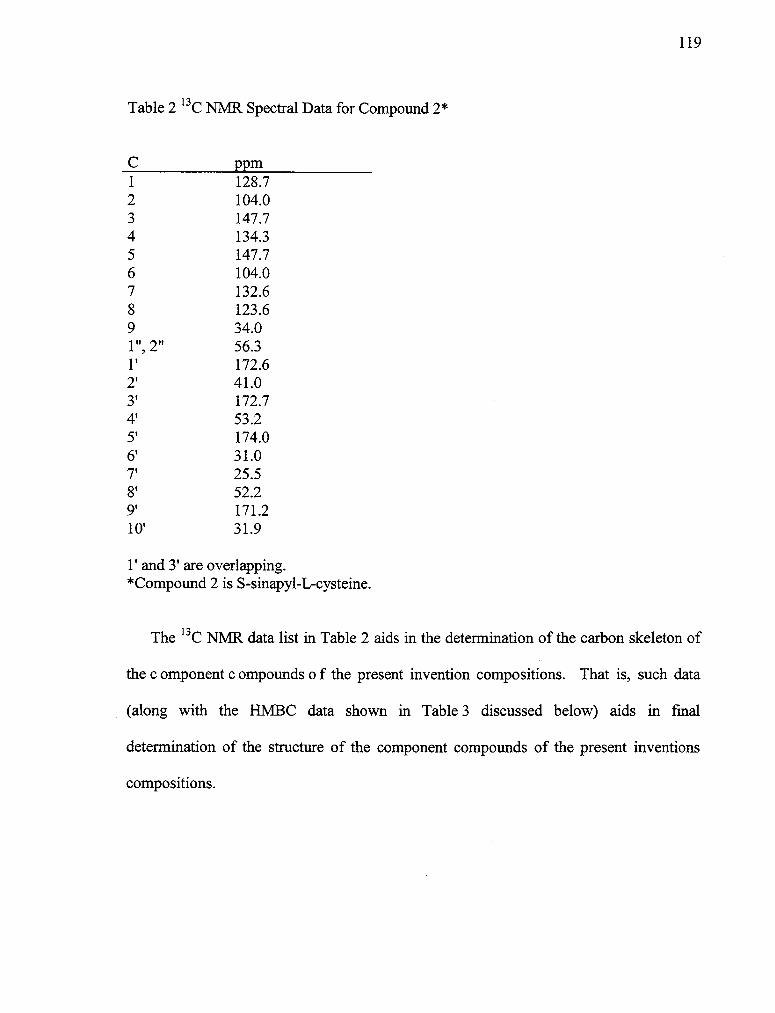
119
Table 2 13C NMR Spectral Data for Compound 2*
C ppm1 128.72 104.03 147.74 134.35 147.76 104.07 132.68 123.69 34.01",2" 56.31' 172.62' 41.03' 172.74' 53.25' 174.06' 31.07' 25.58' 52.29' 171.210' 31.9
1' and 3' are overlapping.*Compound 2 is S-sinapyl-L-cysteine.
The 13C NMR data list in Table 2 aids in the determination of the carbon skeleton of
the c omponent c ompounds o f the present invention compositions. That is, such data
(along with the HMBC data shown in Table 3 discussed below) aids in fmal
determination of the structure of the component compounds of the present inventions
compositions.

120
Table 3 Cross-Peaks in HMBC Spectra of Compound 2*
HC
3-bond 2-bond2, 678
6,2,1
2, 4,6, 9
7 3,19
5
91", 2"2'
7,3,3'
10'5
8
1' (?)4'6'7'8'10'
5'8'5',6'9,
9'
3'
3',5',6',7',4'
10'7'8'9'
*Compound 2 is S-sinapyl-L-cysteine.
The heteronuclear multiple bond correlation (HMBC) data shown in Table 3 is the
resulting data of an NMR technique useful for identifying the neighboring carbon to a
proton of component compounds of the present invention compositions.
Antioxidant Properties of the Present Invention Compositions
Sample Preparation for Measurement of Antioxidant Properties
About 4.2 ml of methanol and about 10 liters of about 1N HC1 were added to about
2.1 mg of S-sinapyl glutathione (having a molecular weight of about 499). The mixture
was vortexed until the S-sinapyl compound was completely dissolved (1 mM final).
About 4.98 ml of methanol and about 10 liters of about 1N HC1 were added to about
2.2 mg of N-L-7-glutamyl-S-sinapyl-L-cysteine (having a molecular weight of about 442).
The mixture was vortexed until the sinapyl compound was completely dissolved (1 mM
final).

121
Prior to the ACW analysis, the 1 mM solutions of N-L-y-glutamyl-S-sinapyl-L-
cysteine and S-sinapyl glutathione were diluted about 1:100 with methanol (about 0.01
mM final) and then about 10 liters of sample (at about 0.1 nmol) were assayed. Prior to
ACL analysis, the 1 mM solutions of N-L-y-glutamyl-S-sinapyl-L-cysteine and S-sinapyl
glutathione were diluted about 1:10 with methanol (about 0.1 mM final) and then about
10 liters of sample (at about 1 nmol) were assayed.
Antioxidant Capacity Water Soluble Assay (Water Based PCL Assay)
Assayed compounds compete with photo-sensitizer (luminol) for interaction with
superoxide radicals produced by UV irradiation, resulting in a delay of the propagating
phase of kinetic curve of chemiluminescence. The delay was expressed as a lag-time in
seconds. TROLOX, an excellent antioxidant, a water-and methanol-soluble analog of
alpha-tocopherol (i.e., 6-hydroxy-2, 5, 7, 8-tetramethylchroman-2-carboxylic acid), was
used as a reference antioxidant (TROLOX is available from Aldrich of Milwaukee,
Wisconsin). A calibration curve for TROLOX was generated by plotting a shift in lag-
time (lag sample versus lag control) against the amount of TROLOX taken for the assay.
The results are expressed as a molar ratio of (antioxidant capacity) AOC of the assayed
compound of the present invention to the AOC of TROLOX. In the water-based PCL
assay, TROLOX mimics the AOC of ascorbic acid, a known antioxidant. Comparison of
present compositions to TROLOX are discussed below and tabulated in Table 4.
Antioxidant Capacity Lipid Soluble Assay (Me0H Based PCL Assay)
Assayed compounds compete with photo-sensitizer (luminol) for interaction with
superoxide radicals produced by UV irradiation resulting in an inhibition of the intensity

122
of chemiluminescent signal. The measured parameter was an area under the kinetic curve
of the light output (A). Inhibition (I) of chemiluminescence was calculated as 1=1-A/&
wherein Ao is the area under the control (the non-antioxidant present) curve. A
calibration curve was generated from a plot of the inhibition versus the amount of
TROLOX. The results (mean) are expressed as a molar ratio of the AOC of the assayed
compound of the present invention to the AOC of TROLOX. In the Me0H-based PCL
assay, TROLOX mimics the AOC of alpha-tocopherol. Comparison of present
compositions to TROLOX are discussed below and tabulated in Table 4.
Antioxidant Effectiveness of the Present Invention Sinapyl Compositions
The antioxidant capacity (AOC) of two of the three sinapyl derivatives (S-sinapyl
glutathione, and N-L-y-glutamyl-S-sinapyl-L-cysteine) was m easured in w ater-soluable
and methanol-soluble photo-chemiluminescent assays. AOCs of the sinapyl
compositions of the present invention were expressed in AOCs of TROLOX (i.e., the
standard or reference antioxidant).
As shown in Table 4, both S-sinapyl glutathione, and N-L-y-glutamyl-S-sinapyl-L-
cysteine de monstrated antioxidant c apacities c omparable to that of TROLOX, both in
water and in methanol soluble assays. There also appears to be positive health benefits of
such antioxidant compositions of the present invention.

123
Table 4 Antioxidant activity of sinapyl compounds
AOC (mol of sample necessary to matchAOC of 1 mol of TROLOX) Water-Based PLC Me0H-BasedAssay* PLC Assay* 1.22±0.03 3.25±0.101.56±0.20 4.53±0.20
Sample
S-sinapyl glutathioneN-L-y-glutamyl-S-sinapyl-L-cysteine
*Data represent mean ±SD from triplicate measurements.
Results of Isolation and Identification of the Present Invention Compositions
S-sinapyl-L-cysteine, S-sinapyl glutathione, and N-L-y-glutamyl-S-sinapyl-L-cysteine
were extracted from pineapple juice or pineapple process waste streams and analyzed as
discussed above. Figure 1 shows the analytical HPLC chromatogram of pineapple juice
with peaks 1, 2 and 3 being the three phenolic compounds (i.e., S-sinapyl-L-cysteine, S-
sinapyl glutathione, N-L-y-glutamyl-S-sinapyl-L-cysteine). Figure 2 shows a semi-
preparative HPLC chromatogram of pineapple juice after a C18 resin fractionation that
resulted in isolation of the three compounds (i.e., S-sinapyl-L-cysteine, S-sinapyl
glutathione, N-L-y-glutamyl-S-sinapyl-L-cysteine) (labeled peaks 1, 2 and 3) without
impurities.
Figure 3 shows a resulting acid hydrolysis pattern of compounds 2 and 3 (i.e., S-
sinapyl glutathione, N-L-y-glutamyl-S-sinapyl-L-cysteine, respectively). The acid
hydrolysis of compound 2 generated compounds 1, 3, and an additional compound having
an identical ultraviolet spectrum. Acid hydrolysis of compound 3 (i.e., N-L-y-glutamyl-S-
sinapyl-L-cysteine) generated only compound 1 (i.e., S-sinapyl-L-cysteine).
Proton NMR spectra of S-sinapyl-L-cysteine, N-L-y-glutamyl-S-sinapyl-L-cysteine,
and S-sinapyl glutathione all exhibit resonances with chemical shifts at 6.4, 6.0, 5.5, 3.5
124
and 3.0 ppm. The 6.4 ppm chemical shift is the characteristic resonance of aromatic
protons, while 6.0 and 5.5 ppm shifts are traits of double-bond protons. The final
structure was established using 13C NMR (see Table 2), HMQC and HMBC (see Table
3). The same ultraviolet spectrum (resulting structure identification shown in Fig. 4) and
fragmentation pattern as a sinapyl alcohol standard further confirmed the sinapyl core
structure of the sinapyl compounds of the present compositions. The two protons at the
C-2 and C-6 positions undergo deuterium exchange under very acidic condition when
kept at room temperature for over two days. This exchange was followed by /H NMR
resulting in the almost complete loss of proton chemical shifts at 6.4 ppm. The deuterium
exchange was further confirmed by 2 mass units increase in the fragment ion
corresponding to the sinapyl moiety [m/z (without deuterium exchange): 193] in the ESI-
MS. This deuterium exchange can be used to establish the fragmentation pathway during
MS/MS by comparing the fragmentation pattern of the compound with that of the
deuterium-exchanged compound.
Whereas the invention has been described with reference to particular compositions
and methods, it will be understood that the invention is not limited to those particular
compositions and methods. On the contrary, the invention is intended to encompass all
modifications, alternatives, and equivalents as may be included within the spirit and
scope of the invention as defined by the appended claims.
CLAIMS AS ALLOWED

125
1. An antibrowning and antioxidant composition comprising:
a sinapyl compound that has been isolated from a natural source.
2. The composition of claim 1, wherein the natural source comprises pineapple juice.
3. The composition of claim 1, wherein the sinapyl compound isolated from a
natural source further comprises a compound selected from a group consisting essentially
of S-sinapyl-L-cysteine, N-L-y-glutamyl-S-sinapyl-L-cysteine, S-sinapyl glutathione, and
mixtures thereof.
4. The composition of claim 1, wherein the natural source comprises pineapple juice
and the sinapyl compound isolated from the natural source comprises a compound
selected from a group consisting essentially of S-sinapyl-L-cysteine, N-L-y-glutamyl-S-
sinapyl-L-cysteine, S-sinapyl glutathione, and mixtures thereof.
5. An antibrowning and antioxidant food preparative composition for use with fruit
and fruit products, comprising:
a mixture of S-sinapyl-L-cysteine, N-L-y-glutamyl-S-sinapyl-L-cysteine, and S-
sinapyl glutathione, isolated from a natural source.
6. The composition of claim 5, wherein the mixture of S-sinapyl-L-cysteine, N-L-y-
glutamyl-S-sinapyl-L-cysteine, and S-sinapyl glutathione is isolated from pineapple juice.
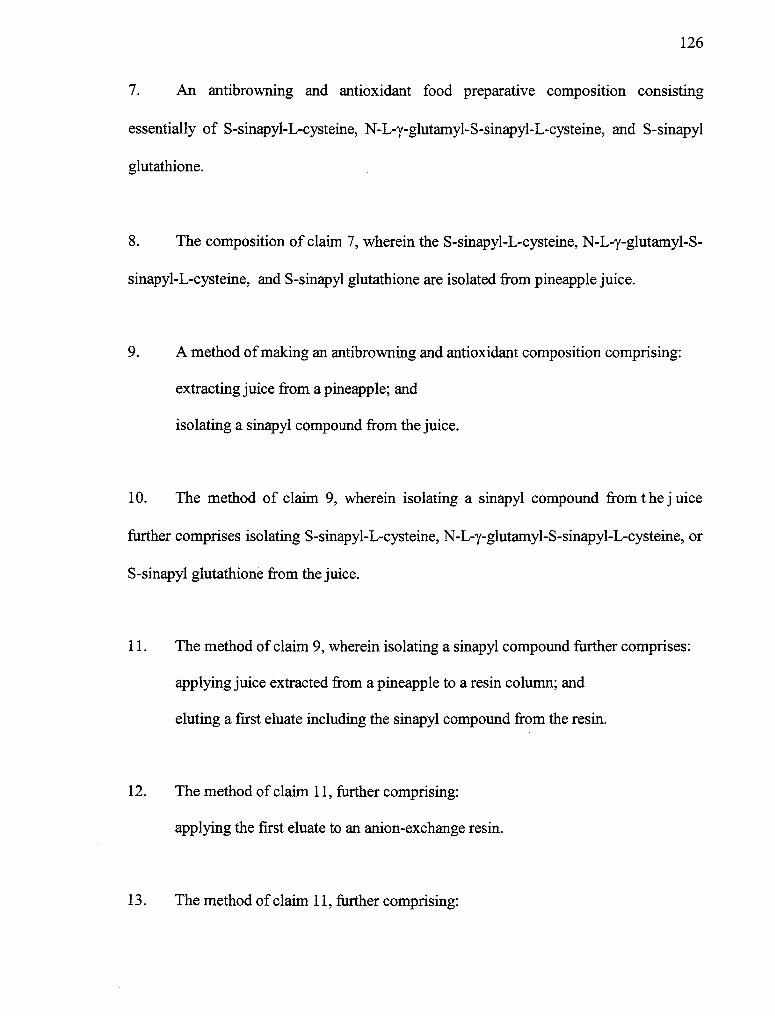
126
7. An antibrowning and antioxidant food preparative composition consisting
essentially of S-sinapyl-L-cysteine, N-L-y-glutamyl-S-sinapyl-L-cysteine, and S-sinapyl
glutathione.
8. The composition of claim 7, wherein the S-sinapyl-L-cysteine, N-L-y-glutamyl-S-
sinapyl-L-cysteine, and S-sinapyl glutathione are isolated from pineapple juice.
9. A method of making an antibrowning and antioxidant composition comprising:
extracting juice from a pineapple; and
isolating a sinapyl compound from the juice.
10. The method of claim 9, wherein isolating a sinapyl compound from the j uice
further comprises isolating S-sinapyl-L-cysteine, N-L-y-glutamyl-S-sinapyl-L-cysteine, or
S-sinapyl glutathione from the juice.
11. The method of claim 9, wherein isolating a sinapyl compound further comprises:
applying juice extracted from a pineapple to a resin column; and
eluting a first eluate including the sinapyl compound from the resin.
12. The method of claim 11, further comprising:
applying the first eluate to an anion-exchange resin.
13. The method of claim 11, further comprising:
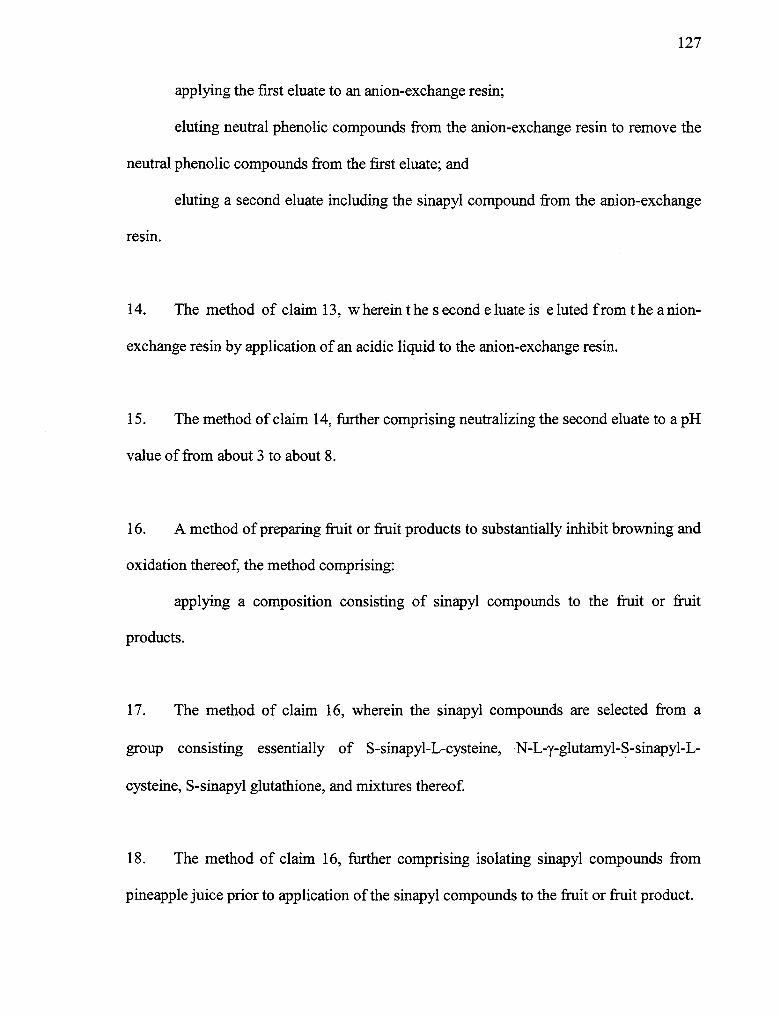
127
applying the first eluate to an anion-exchange resin;
eluting neutral phenolic compounds from the anion-exchange resin to remove the
neutral phenolic compounds from the first eluate; and
eluting a second eluate including the sinapyl compound from the anion-exchange
resin.
14. The method of claim 13, w herein the s econd e luate is e luted from the a nion-
exchange resin by application of an acidic liquid to the anion-exchange resin.
15. The method of claim 14, further comprising neutralizing the second eluate to a pH
value of from about 3 to about 8.
16. A method of preparing fruit or fruit products to substantially inhibit browning and
oxidation thereof, the method comprising:
applying a composition consisting of sinapyl compounds to the fruit or fruit
products.
17. The method of claim 16, wherein the sinapyl compounds are selected from a
group consisting essentially of S-sinapyl-L-cysteine, N-L-y-glutamyl-S-sinapyl-L-
cysteine, S-sinapyl glutathione, and mixtures thereof.
18. The method of claim 16, further comprising isolating sinapyl compounds from
pineapple juice prior to application of the sinapyl compounds to the fruit or fruit product.
128
19. The method of claim 16, further comprising:
isolating S-sinapyl-L-cysteine, N-L-y-glutamyl-S-sinapyl-L-cysteine, S-sinapyl
glutathione, and mixtures thereof from pineapple juice prior to application of such sinapyl
compounds to the fruit or fruit product.
20. A method of preparing fruit or fruit products to substantially inhibit browning and
oxidation thereof, the method comprising:
applying a composition consisting essentially of sinapyl compounds to the fruit or
fruit products, wherein the sinapyl compounds are selected from a group consisting of S-
sinapyl-L-cysteine, N-L-y-glutamyl-S-sinapyl-L-cysteine, S-sinapyl glutathione, and
mixtures thereof.
21. The method of claim 20, further comprising isolating sinapyl compounds from
pineapple juice prior to application of the sinapyl compounds to the fruit or fruit product.
22. An antibrowning and antioxidant food preparative composition for use with fruit
and fruit products, comprising:
a mixture of S-sinapyl-L-cysteine, N-L-y-glutamyl-S-sinapyl-L-cysteine, and S-
sinapyl glutathione, extracted from a natural source, wherein the mixture provides
consistent antibrowing and antioxidation regardless of the composition of natural source
from which it is extracted.