an abstract of the thesis of for the
TRANSCRIPT

AN ABSTRACT OF THE THESIS OF
JOHN PIERCE WALRADT for the Ph. D. (Name of student) (Degree)
in FOOD SCIENCE presented on ^w ^ /j (Major) $Date)
Title: FLAVOR CHEMISTRY OF POPCORN
Abstract approved: „ ^, t,f ^ * ' Dr. Robert C. Lind
Popcorn was popped conventionally in oil and in a microwave
oven without oil. Volatile components were collected by condensa-
tion of popper headspace gases and by vacuum steam distillation of
a slurry of ground, popped corn in distilled water. The organic
compounds were extracted from the aqueous condensate and vacuum
distillate with diethyl ether. The concentrated ether extracts were
analyzed by a coupled gas chromatograph-mass spectrometer utiliz-
ing three different procedures. These were: (1) a 300 foot by 0. 01
inch ID capillary column, into which samples were injected with a
50:1 inlet split, with the effluent end connected directly to the ion
source of the mass spectrometer; (2) the same directly coupled
capillary column but with samples previously trapped from a packed
column introduced without splitting; (3) mass spectrometric analysis
of a portion (5 to 10%) of the effluent stream from a 12 foot by 1/8
inch OD packed column.
Thirty-six compounds were positively identified by comparison

of their spectra with reference spectra. Relative retention time
coincidence with known compounds confirmed the mass spectral
identifications. Those compounds positively identified include pyra-
zine, 2, 5-dimethyl pyrazine, 2, 3-dimethyl pyrazine, 2-ethyl-5-
methyl pyrazine, 2-ethyl-3, 6-dimethyl pyrazine, 2-pentyl furan,
furfural, 2-acetyl furan, 5-methyl furfural, furfuryl alcohol, 5-hy-
droxymethyl furfural, acetaldehyde, 2-methyl propanal, S-methyl
butanal, pentanal, hexanal, benzaldehyde, phenylacetaldehyde,
diacetyl, ethyl acetate, methyl palmitate^diethylphthalate, ethanol,
hexane, acetic acid', hexanoic acid, palmitic acid, Y-kutyrolactone,
N-furfuryl pyrrole, N-furfuryl pyrrole-2-aldehyde, 2-acetyl pyrrole,
pyrrole-2-aldehyde, 4-vinyl-2-methoxyphenol, 4-vinylphenol, and
vanillin. Another 20 compounds were tentatively identified on the
basis of their mass spectra. These were 2, 3, 5-trimethyl pyrazine,
2-acetyl pyrazine, (5-methyl-2-furyl)-(2 furyl)-me thane, 5-methyl-
2-acetyl furan, bi-(5-methyl-2-furyl)-methane, 4-hydroxy-2, 5 -
dimethyl-3 (2Ii)-furanone, heptanal, ethyl formate, pyridine, thi-
azole, benzothiazole, ethylbenzene, a dichlorobenzene, N-ethyl-
pyrrole-2-aldehyde, N-isoamyl-pyrrole-2-aldehyde, 5-methyl-
pyrrole-2^aldehyde, 2-formyl-5-methylthiophene, 2-ethyl-5-butyl-
thiophene, phenol, and 2-methoxyphenol.
It is believed that pyrazines, furans, carbonyls, and phenolic
compounds make important contributions to the flavor and aroma of

popcorn. The presence of many of the compounds identified can be
explained by their production during popping from precursors in the
popcorn kernels by Maillard browning reactions, Strecker degrada-
tion of amino acids, thermal oxidation and .hydrolysis of lipids, and
direct thermal degradation of plant constituents.

Flavor Chemistry of Popcorn
by
John Pierce Walradt
A THESIS
submitted to
Oregon State University
in partial fulfillment of the requirements for the
degree of
Doctor of Philosophy
June 1969
r-
APPROVED;
f^l 1/ =—:: -^ ' -~ - - Assistant Professor of Food Science and 'Jj@^?mology
in charge of major
Head of Department of F&fa Science and Technology
Dean of Graduate School
Date thesis is presented /fl&fogj ^f
Typed by Opal Grossnicklaus for John Pierce Walradt

ACKNOWLEDGMENT
I would like to express my appreciation to Dr. R. C Lindsay
for his helpful suggestions and guidance during the course of this
work and to Dr. L. M. Libbey for his persevering assistance in
obtaining and interpreting the mass spectra.
I would also like to thank the other members of my graduate
committee, Dr. Harry Freund and Dr. P. H. Weswig, who contrib-
uted their time and talents to my education and direction., The co-
operation and suggestions of the staff members and graduate students
in the Department of Food Science and Technology is gratefully ac-
knowledged.
The cooperation of Crookham Company, Caldwell, Idaho, who
contributed the hybrid popcorn is greatly appreciated.
Thanks are due the National Aeronautics and Space Administra-
tion for the training grant which supported this work.
My deepest appreciation to my wife, Anne, for her patience,
encouragement, and willing assistance during my graduate career.
TABLE OF CONTENTS
INTRODUCTION 1
REVIEW OF LITERATURE 2
Composition of Corn 2 Flavor Investigations in Heat Processed Foods 3
Cooked Corn 3 Roasted Barley 4 Bread 4 Potato Products 5 Roasted Peanuts 6 Cocoa and Chocolate 7 Coffee 8 Tea 9 Volatiles from Cooking Oils 10 Flavor Studies in Model Systems 11
EXPERIMENTAL 15
Receipt and Storage of Popcorn 15 Analysis of Popper Headspace Condensate 15
Popping Apparatus--Oil Popped Corn 15 Aqueous Condensate Analysis--Oil"Popped Corn 16
Mass Spectrometry 17 Ether Extract Analysis--Oil Popped Corn 19
Steam Stripping Oil 19. Collection of Volatiles--Ether Extraction 20 GC and Mass Spectrometric Analysis 21
Popping Apparatus--Microwave Oven 23 Ether Extract Analysis--Microwave Popped Corn 24
Trapped Fractions by GC-MS Analysis 24 Whole Extract by Coupled Capillary Column
GC-MS 25 Acidic and Basic Fractions by Packed Column
GC-MS 28 Infrared Spectra 29
Preparation and Analysis of Vacuixm Steam Distillate 30 Distillation 31 Extraction 32 Packed Column GC-MS Analysis 32
TABLE OF CONTENTS (CONTINUED)
Synthesis of Reference Compounds 33 Furan-2-glyoxal 33 N-furfuryl pyrrole 34 N-furfuryl pyrrole-2-carboxaldehyde 34 Z, 3-Dihydrobenzofuran 35 4-Vinyl-2-methoxyphenol 36 4-Vinylphenol 3 7 2, 3-Dimethyl-5, 6-dihydropyrazine 3 7
RESULTS AND DISCUSSION 39
Identification of Compounds 39 Aqueous Condensate--Oil Popped Corn 39 Ether Extract--Oil Popped Corn 40 Ether Extract--Microwave Popped Corn 41
Trapped Fractions by GC--MS 41 Whole Extract by Coupled Capillary Column
GC--MS 44 Packed Column GC--MS 46 Infrared Spectra 53
Reference Compounds 5 7 Furan-2-glyoxal 5 7 N-furfuryl pyrrole 58 N-furfuryl pyrrole-2-carboxaldehyde 60 4-Vinyl-2-methoxyphenol 63 4-Vinylphenol 65 2, 3-Dimethyl-5, 6-dihydropyrazine 66 2-Acetyl pyrazine 67
Origin and Significance of Compounds 68 Furans 68 Pyrazine s 69 Pyrroles 70 Aldehydes 70 Phenols 71 Acids 72
SUMMARY AND CONCLUSIONS 73
BIBLIOGRAPHY 74
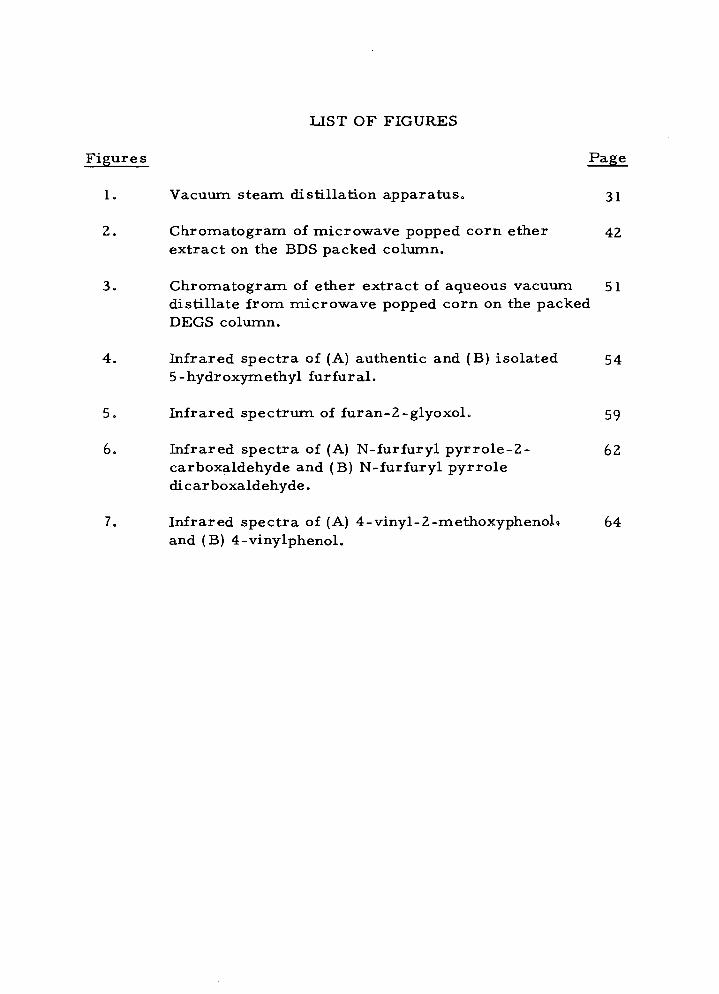
LIST OF FIGURES
Figures Page
1. Vacuum steam distillation apparatus. 31
2. Chromatogram of microwave popped corn ether 42 extract on the BDS packed column.
3. Chromatograxn of ether extract of aqueous vacuum 51 distillate from microwave popped corn on the packed DEGS column.
4. Infrared spectra of (A) authentic and (B) isolated 54 5-hydroxymethyl furfural.
5. Infrared spectrum of furan-2-glyoxol. 59
6. Infrared spectra of (A) N-furfuryl pyrrole-2- 62 carboxaldehyde and (B) N-furfuryl pyrrole dicarboxaldehyde.
7. Infrared spectra of (A) 4-vinyl-2-methoxyphenol<i 64 and (B) 4-vinylphenol.
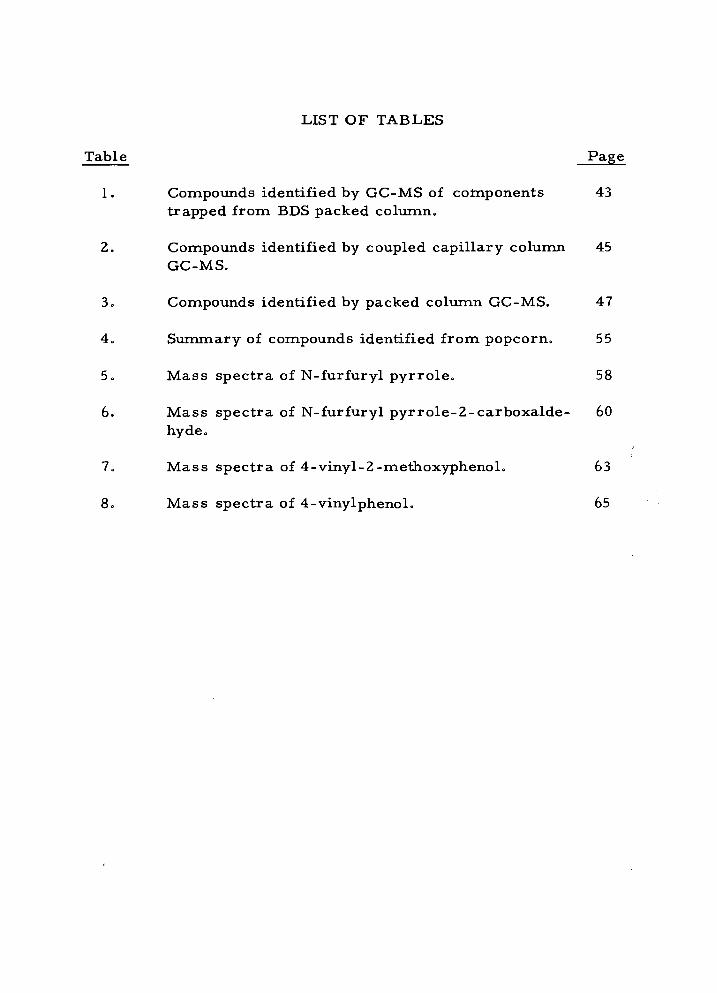
LIST OF TABLES
Table Page
1. Compounds identified by GC-MS of cotnponents 43 trapped from BDS packed column.
2. Compounds identified by coupled capillary column 45 GC-MS.
3. Compounds identified by packed column GC-MS. 47
4. Summary of compounds identified from popcorn. 55
5. Mass spectra of N-furfuryl pyrrole. 58
6. Mass spectra of N-furfuryl pyrrole-2-carboxalde- 60 hyde.
7. Mass spectra of 4-vinyl-2-methoxyphenol. 63
8. Mass spectra of 4-vinylphenol. 65

FLAVOR CHEMISTRY OF POPCORN
INTRODUCTION
Popcorn is one of many popular food items in which the charac-
teristic flavor is produced during heat processing. Modifications of
the typical popcorn flavor can be made by altering the type of popping
oil used, and by the addition of certain seasonings.
Since the unique flavor and aroma of popcorn has such wide
appeal, it would be useful to learn the identity of the principal chem-
ical compounds which contribute to the flavor. Perhaps, then, this
flavor could be more carefully controlled and exploited more fully as
a flavoring agent for completely new, fabricated food products. Such
a study should also contribute to the understanding of the mechanisms
by which heat-induced flavor changes occur in other foods.
REVIEW OF LITERATURE
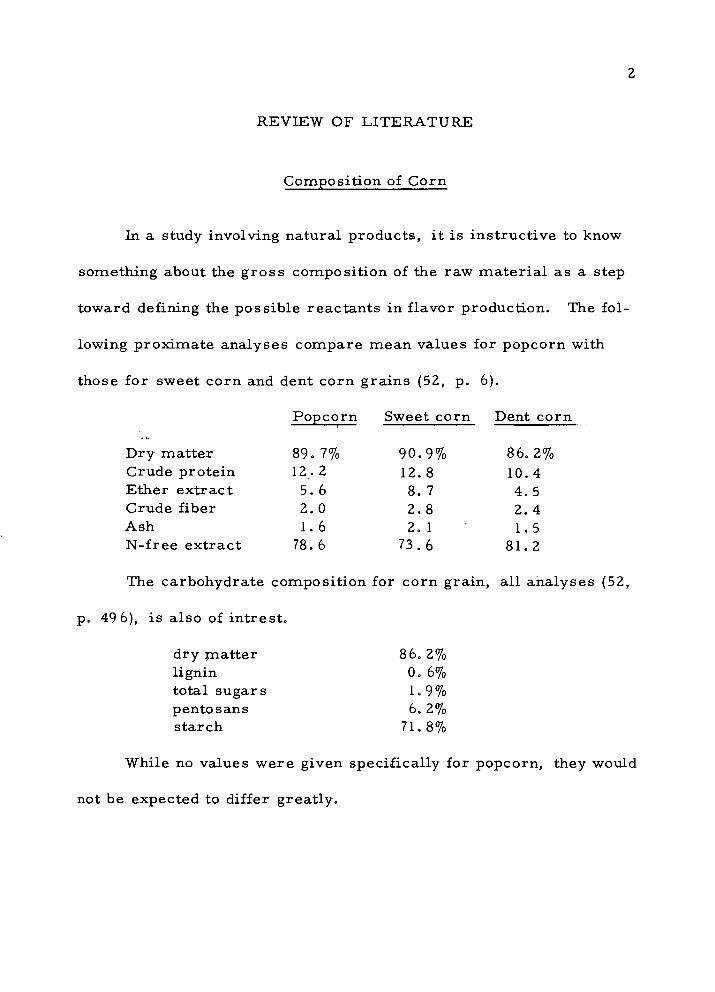
Composition of Corn
In a study involving natural products, it is instructive to know
something about the gross composition of the raw material as a step
toward defining the possible reactants in flavor production. The fol-
lowing proximate analyses compare mean values for popcorn with
those for sweet corn and dent corn grains (52, p. 6).
Popcorn Sweet corn Dent corn
Dry matter 89.7% 90.9% 86.2% Crude protein 12.2 12.8 10.4 Ether extract 5.6 8.7 4.5 Crude fiber 2.0 2.8 2.4 Ash 1.6 2. 1 1.5 N-free extract 78.6 73.6 81.2
The carbohydrate composition for corn grain, all analyses (52,
p. 49 6), is also of intrest.
dry matter 86. 2% lignin 0. 6% total sugars 1.9% pentosans 6. 2% starch 71.8%
While no values were given specifically for popcorn, they would
not be expected to differ greatly.
Flavor Investigations in Heat Processed Foods
Since no basic studies identifying the flavor components of pop-
corn were found in the literature, a survey was made of the available
information on other food items which have received a high heat treat-
ment, usually in a low moisture state, and which might be expected
to develop similar types of flavor compounds by analogous pathways.
Cooked Corn
Steinke and Paulson (76) identified p-vinylphenol and 4-vinyl-
guaiacol in condensed steam from cooking corn. The assumption
that these phenols could arise by thermal decarboxylation of p-cou-
maric acid and ferulic acid, respectively, was supported by the pro-
duction of phenolic compounds in an autoclaved, dilute, aqueous solu-
tion of the acids. Ferulic acid, p-coumaric acid, and vanillin were
determined in corn before and after cooking. All three compounds
shewed five- to ten-fold increases on cooking. Concentration esti-
mates for each compound were between 15 and 39 |J.g per gram of corn
cooked at 250 ° F. , and between 27 and 52 \xg per gram of corn cooked
at 280 0F.
Dimethyl sulfide has been reported as a constituent of canned
or heated sweet corn (4). The authors also showed the presence of
S-methylmethionine sulfonium salt, a heat-labile compound which

decomposes to yield homoserine and dimethyl sulfide in unheated corn.
Roasted Barley
Roasted barley (Mugi-cha) flavor has been investigated by
Japanese workers (70, 87) with the resulting identification of 35 com-
pounds. The earlier study (70) identified only NaOH and Na2C03
soluble components. Thus, all the 28 reported compounds were
carboxylic acids, phenols, or phenolic acids. The second paper (87)
reported the identification of furfural, 2 methylbutanal, 2-methyl-
propanal, 3-methylbutanal, 2, 3-pentanedione, ethylglyoxal, and
pyruvaldehyde as their mono- or bis-2, 4-dinitrophenylhydrazones.
Removal of the carbonyl compounds resulted in loss of the character-
istic roasted barley aroma.
Bread
The literature on bread flavor was reviewed through 19 65 by
Coffman (11) with the observation that, in spite of the number of
compounds identified up to then, a synthetic bread flavor could not
yet be formulated. The development of flavor in bread is attributed
to two main sources: the products of the yeast fermentation, and
products of the Maillard browing reaction in crust formation. The
Strecker degradation of amino acids during baking is also an impor-
tant source of aldehydes derived from the parent amino acids as

5
shown in both model systems (64) and bread systems (66).
Two compounds with "cracker or bread-like" aromas have
been isolated from freshly baked bread and proline-containing model
systems (34, 33). They are 1, 4, 5, 6-tetrahydro-2-acetopyridine and
N-acetonylpyrroline.
Potato Products
Self (68) reviewed the knowledge of flavor in potato products
through 1965 including a discussion of amino acids, sugars, and
lipids as possible precursors of flavors produced in cooking. The
flavor of potato chips has been studied (10, 16, 53) with the result that
2, 4-decadienal and seven substituted pyrazine isomers are believed
to make the most important contribution to desirable potato chip
flavor. The pyrazines found were 2, 5-dimethyl-, 2, 6-dimethyl-,
2-ethyl-, 2, 3, 5, trimethyl-, 2-ethyl-5-methyl-, 2, 5-diethyl-,
2-ethyl-3, 6-dimethyl pyrazine. Methods for synthesis of these
compounds are also given (10). The 2, 4-decadienal is believed to
originate mainly from the decomposition of linoleic acid under the
conditions of deep fat frying. Its flavor and odor properties are
described as "deep fat fried" in character with a flavor threshold
in water of 0. 5 parts per billion (53). The flavor of 2, 5-dimethyl-
pyrazine at a conpentration of 10 p. p.m. in oil was described as
"earthy" and "raw potato" (16).
The use of microwave finishing of potato chips has been

reported (22) to yield more uniformly colored chips than conventional
deep frying even when reducing sugars were as high as 0. 5%. The
microwave finished chips showed lower losses of amino acids and
sugars than those prepared by conventional deep fat frying.
Roasted Peanuts
Pyrazine derivatives identified from roasted peanuts (methyl, -
2, 5-dimethyl-, 2 methyl-5-ethyl-, trimethyl-, and either 2, 5-dimeth-
yl-3-ethyl- or 2, 6-dimethyl-3-ethyl pyrazine) have been deemed to be
among the "character impact" compounds of typical roasted peanut
flavor (50). N-methyl pyrrole, identified along with the pyrazines,
was not considered to be an important contributor to roasted aroma.
Based on quantitative studies of the amino acid and monosaccharide
content of peanuts before and after roasting and the previously identi-
fied flavor compounds, a possible mechanism for the formation of
pyrazine isomers from those precursors was postulated (57), From
low water content model system studies where amino acids were
reacted with C-labeled glucose (and vice-versa, with labeled
amino acids and unlabeled glucose), it was determined that the
structure of the nitrogen source influenced the quantitative distri-
bution of pyrazines formed but that the major source of carbon atoms
in pyrazine molecules was the sugar (43). Ammonium ions were
shown not to be the common intermediate through which nitrogen

7
entered the ring.
Benzaldehyde, phenylacetaldehyde, 2-methyl propanal, 2-meth-
yl butanal, and 3-methyl butanal were among other compounds identi-
fied from roasted peanuts (51). Phenylacetaldehyde was believed to
be of considerable importance to the sweet bouquet of roasted peanut
aroma while the low molecular weight aldehydes contributed to the
harsh aroma associated with warm, freshly roasted peanuts.
Pecan nut volatiles have been studied (65) and acetaldehyde,
dimethyldisulfide, and methanol identified in the unroasted nuts.
Nine pyrazine compounds from roasted pecans were tentatively iden-
tified from their mass spectra. Several compounds, presumed to be
artifacts, including carbon disulfide, Freon 11, chloroform and other
laboratory solvents, were encountered in this work. Rubber tubing
used in the sweeping gas line was thought to be the source of carbon
disulfide.
Cocoa and Chocolate
Several research groups have recently reported a large number
of compounds identified in work on the flavor of cocoa and chocolate
(84, 85, 23, 49, 60). Van Praag, Stein, andTibbetts (85) suggested that
the following compounds contributed to cocoa aroma: acetaldehyde,
2-methyl propanal, 2-methyl butanal, benzaldehyde, phenylacetalde-
hyde, 5-methyl-2-phenyl-2-hexenal, 2-furfural, methyl disulfide, 11

8
alkyl-substituted pyrazines, acetic acid, and isopentyl acetate.
The possible precursors for formation of flavor in roasting of
cocoa beans have been studied and amino acids and sugars have been
shown to be important precursors (63). Van Praag, Stein, and
Tibbetts (85) in model system studies observed a similar series of
pyrazines formed from each of six different neutral amino acids and
ammonia when reacted with fructose in aqueous solutions. They
assumed that ammonia was an intermediate and stated that, quali-
tatively, the composition of the pyrazine mixture did not depend sig-
nificantly upon the amino acid involved.
Coffee
The accumulated information available on coffee flavor up to
19 66. was reviewed by Gianturco (25) with a total of 103 reported
compounds listed. Stoffelsma et^aL (78) have concluded that at
least 318 volatile constituents are known to occur in roasted coffee
up to late 19 68. They have also stated that at least a qualitative
similarity exists between the aroma oil prepared from a steam dis-
tillate of roasted and ground coffee and the aroma complex obtained
by stripping the volatile fraction of expelled coffee oil.
In spite of the 318 constituents known in coffee volatiles, it has
not yet been possible to reconstitute a complete coffee aroma. Some
reasons for this (which apply to most complex flavors and aromas)
are (a) no single component responsible for the aroma of coffee has
been found, (b) problems of aroma component stability must be
solved, and(c) probably important aroma components remain to be
detected and identified (78).
Feldman, Ryder, and Kung (19) have reported on a study under-
taken to determine the importance of non-volatile compounds to the
flavor of coffee. Non-volatile acids, both phenolic and non-phenolic,
are reported to be important in the flavor along with non-volatile
products from the Maillard browing reactions.
Many of the recent publications on coffee flavor (78, 77, 24, 7,
28, 79) contain valuable data (mass and infrared spectra, GLC reten-
tion times, synthetic methods) which have been especially helpful in
the current investigation of popcorn flavor.
Tea
Although.t:eais not a high carbohydrate product processed strict-
ly by heating as most of the products reviewed, many of the volatile
compounds identified (8, 6) are common to the group. While furan
compounds are common in tea, pyrazine derivatives have not yet
been identified as important flavor compounds. This absence (or
very low level) must surely be one of the significant differences
when the flavors and aromas of coffee, peanuts, and tea are com-
pared, for example.
10
Volatiles from Cooking Oils
The oils used in cooking of foods such as potato chips or pop-
corn are a possible source of flavor compounds. The flavorful com-
ponents could be contained in the oil, generated from precursors in
the oil during heating, or they could be the result of autoxidative
processes during and after cooking. Nawar (55) has recently re-
viewed thermal degradations of lipids with much of the reported work
being done with model systems.
Crude coconut oil volatiles were investigated by Allen (1) who
identified the Cy, CQ, CI I, C13, and Cic methyl ketones and the C/,
Cg, CIQ, CJT* and C14 delta-lactones. The flavor properties of
lactones, also found in butter and heat-treated dairy products, have
been reported by Siek et al. (72). The presence of lactones and
methyl ketones in coconut oil and their desirable flavor contribution
probably accounts for the preference of many popcorn processors
for coconut oil.
The volatile decomposition products of corn oil in a simulated
restaurant deep frying use were analyzed with the resultant identifi-
cation of 30 acidic (39) and 45 non-acidic compounds (44). Another
20 compounds were tentatively identified. In a similar study using
a hydrogenated cottonseed oil, 38 acidic compounds (88) and 61 non-
acidic compounds (58) were identified. The studies indicated that the
11
hydrogenated cottonseed oil was more stable towards autoxidation,
but more susceptible to hydrolysis, than unhydrogenated corn oil.
From a flavor viewpoint, many of the compounds identified would
be expected to contribute significantly to the flavor and aroma of
food products cooked under commercial conditions in the oils. In
cooking popcorn, specifically, the oil is actually used only once for
a short period of time at the high (180 " C to 2 60 0 C) temperatures
employed (82). This type of use is not apt to result in the formation
of oil decomposition products to the extent indicated in the studies
on corn and hydrogenated cottonseed oil used in deep frying.
Flavor Studies in Model Systems
Since the production of flavor in heat-induced or non-enzymatic
browning reactions has appeared so complex, various types of model
systems have been devised in an attempt to simplify the study of such
reactions. Hodge (32) has reviewed the literature through 19 65 as
it pertains to flavor production from caramelization of sugars,
Maillard browning reactions of reducing sugars and amines, and
Strecker degradation of amino acids. All the pathways, as defined
by the above mentioned names, in most cases occur in an inseparable
combination. For instance, the Strecker degradation requires a
conjugated dicarbonyl to react with the a -amino acids in order to
produce aldehydes of one less carbon atom. Such dicarbonyls (and

12
furfurals) are produced as products and intermediates in carameliza-r
tion and Maillard reactions. Hodge (33) considers the Maillard reac-
tions to be the most important flavor producing reactions in foods on
drying, processing, and cooking. The reaction of proline and hydrox-
yproline with carbohydrates is considered very important among mod-
el systems that represent cereal flavor producing reactions (33).
An interesting side effect of non-enzymatic browning reaction
products is their antioxidant effect on unsaturated fats. Evidence has
been published (42) which implies that the antioxidant activity is more
strongly associated with the non-dializable melanoidin fraction than
with reductones as previously thought.
Sugar-amine interactions in model systems were reviewed in
depth by Reynolds in 19 68 (59), drawing together the present knowl-
edge in this field. The author points out that the results of some
model system studies must be interpreted somewhat carefully when
extrapolating the results back to food products because of the differ-
ent reaction conditions which prevail. Recent publications dealing
with volatile compounds from heated glucose (86) and base-catalyzed
fructose degradation (79) have appeared.
The studies of pyrazine formation from sugar-amino acid sys-
tems (43, 85) have been mentioned previously with respect to the work
on peanut and chocolate flavor precursors. These studies have been
some of the most interesting and fruitful from the standpoint of

13
partially defining formation mechanisms of roasted-type-flavors.
Since pyrrole compounds, especially 2-acetyl pyrrole and de-
rivatives of pyrrole-2-carboxaldehyde have been identified as prod-
ucts from sugar-amine browning systems (37,46), a further study
was made by Kato and Fujimaki (38). Their isolated products were
N-substituted pyrrole-2-aldehydes where the N-alkyl groups was from
the orjginal alkyl amine. Reactivities of amines in terms of yield of
pyrrolealdehyde and absorbance at 470 mp. were in the order of n-
n-butylamine > methylamine, P-alanine > glycine > DL-alanine.
Their results indicate that furfural and pyrrolealdehydes are by-
products in melanoidin formation formed possibly from a 3, 4-dideoxy-
pentosulose-3-ene intermediate.
A study of thermal degradation of amino acids (62) by pyrolysis
followed by analysis in a coupled GC-mass spectrometer showed the
following compounds to be unique for each amino acid listed:
glycine acetone alanine acetaldehyde (3 alanine acetic acid valine 2-methyl propanal norvaline n-butanal leucine 3-methyl butanal isoleucine 2-methyl butanal serine pyrazine threonine 2-ethylethyleneimine taurine thiophene methionine methyl propyl sulfide cystine methyl thiophene phenylalanine benzene tyro sine toluene tryptophan ammonia, CO2
14
proline pyrrole hydroxyproline methanol, N-methyl pyrrole
Acetonitrile and carbon dioxide also appeared in the pyrolzate of all
amino acids.
Volatile compounds produced from the thermal degradation of
starch at temperatures between 1 75 ° and 400 0 C. have been reviewed
by Greenwood (29). Those compounds known include acetaldehyde,
furan, propanal, acetone, acrolein, 2-methyl furan, butanal, 2-buta-
none, 2, 5-dimethyl furan, pentanal, 2-pentanone, 3-pentanone,
2-propanone, formaldehyde, formic acid, acetic acid, and furfural.
Ferulic acid and p-coumaric acid occur widely as esters in
vascular plants (56) along with a variety of similar compounds impli-
cated as intermediates in the biosynthesis of lignins. The thermal
decomposition of ferulic acid (4-hydroxy-3-methoxycinnamic acid)
has been investigated (21) and the following compounds identified as
thermal decomposition products; 4-methylguaiacol, 4-ethylguaiacol,
4-vinylguaiacol, vanillin, 4-hydroxy-3-methoxyacetophenone, and
vanillic acid. Many of these and other phenolic compounds were
identified in hickory smoke condensates (20). They are now quite
well established as being produced from lignin or lignin precursors
present in the plant tissue.
15
EXPERIMENTAL
Receipt and Storage of Popcorn
Fifty pounds of hybrid popcorn was received and sealed in num-
ber 10 "C" enameled cans under nitrogen. The cans were stored at
ambient temperature in the laboratory and opened just prior to use.
These steps -were taken to preserve the proper moisture content and
to minimize chances of contamination from sources such as solvents
in laboratory air.
Analysis of Popper Headspace Condensate
Popping Apparatus--Oil Popped Corn
An electric home popcorn popper of 2 1/2 qt capacity made of
aluminum was utilized. The cover was modified to accept sweeping
gas inlet and outlet tubes of 1/8 inch OD stainless steel tubing. After
being swept from the popper by gentle suction from an aspirator,
volatiles were collected in a trap filled with glass beads which was
cooled in a bath of dry ice and 2-methoxy-ethanol (methyl cellosolve).
A water safety trap was used to prevent back surges from the aspir-
ator into the cold trap. The entire apparatus was placed in a clean
Robust white hulless, lot #36735, White Cloud variety, sup- plied by Crookham Company, Caldwell, Idaho.
16
fume hood in a laboratory where solvents were not used.
The popper was charged with approximately 40 ml of a com-
2 mercial cottonseed oil and allowed to preheat for 2 to 3 min at which
time 60-70 g of popcorn was added. Suction was applied from the
time the first kernel popped until popping was judged complete.
Aqueous Condensate Analysis--Oil Popped Corn
The volatile material collected in the glass bead cold trap from
three batches of popcorn totaled 20-25 ml in volume and was termed
the aqueous condensate. The aqueous condensate was subjected to
gas-liquid chromatography (GLC) utilizing the on-column trapping
technique of Morgan and Day (54). Twelve ml samples of aqueous
condensate were added to screw-capped vials (Kimble No. 60957,
size 1) containing approximately 1 mg of tetradecanol to control
foaming during collection of volatiles. The vials were sealed with
screw caps fitted with silicone rubber liners and shaken vigorously
to disperse the tetradecanol. Operating parameters for the analysis
were as follows:
Entrainment apparatus
purge time and rate 10 min at 8 ml/min of N_
water bath temperature 80 0 C ± 3 " C
2 Wesson Sales Co. , Fullerton, California. Purchased in
gallon lots from local suppliers.

17
GL.C apparatus
Instrument Aerograph 204-IB
Detector and temperature Flame ionization, 210 °C
Injector temperature 200 0C
Column 3% 1, 2, 3-Tris (2-cyanoethoxy)
propane on 100-120 mesh AW-
DMCS Chromosorb G, 12 feet x
1/8 inch OD
Flow rate 20 ml/min of N?
Column temperature Programmed from 40 0 C to 125 ° C
at 2 0 /min, then held at 125 0 C
Seven fractions were trapped as they eluted from the effluent
splitter in stainless steel traps six inches long and 0. 03 inch ID
which were cooled with dry ice. These fractions were transferred,
as described by Scanlan, Arnold, and Lindsay (67), to a capillary
column connected to the high vacuum system of an Atlas CH-4 mass
spectrometer.
Mass Spectrometry. The operating conditions for the gas chro-
matographic-mass spectral (GC-MS) analysis of traps designated 1, 2,
5, and 7 obtained as outlined above are given below. Traps 3, 4, and
6 -were not used because water eluted along with the other components
in them. Trap 5 was found to contain a large amount of water when
analyzed.
18
Instrument
Column
Column temperature
Flow rate
GC
F and M 810, inlet system modi-
fied as in (67)
300 feet x 0. 01 inch ID coated
with butanediol succinate (BDS)
60° isothermal for traps 1, 2,
and 5
87° isothermal for trap 7
1 ml/min of Helium
MS
Filament current
Electron voltage
Accelerating voltage
Analyzer pressure
Multiplier voltage
Scanning speed
20 eV source 45 |xA
70 eV source 10 |j.A
20 eV and 70 eV
3000 V
-6 1.5x10 Torr
1.60 KV
2. 5 sec from m/e 25 to m/e 250
and 5. 0 sec from m/e 25 to m/e
250 for compounds with longer
retention times
The Atlas CH-4 is a Nier-type (9 inch, 60 degree sector),
single-focusing mass spectrometer. It was equipped with a double
19
ion source into which the total effluent was directed from the capil-
lary column. Since the 20 eV source operates at less than the ioniza-
tion potential of the carrier gas (Helium), but above that of organic
compounds, it is used as a GC detector. The 70 eV source pro-
vides the ionization used to obtain mass spectra.
Spectra were taken whenever the 20 eV readout gave any indi-
cation of a peak, with an effort made to obtain spectra at the peak
apex and, where possible, on the leading and trailing edges to help
pinpoint incompletely resolved components. Spectra were also taken
at intervals during a run at points where there appeared to be no
peaks; these spectra served as backgrounds enabling one to monitor
and subtract column bleed and other background mass peaks from
the sample component spectra.
Ether Extract Analysis--Oil Popped Corn
Steam Stripping of Oil . Since a GC analysis of the fresh com-
mercial cottonseed oil by the on-column trapping technique had shown
several peaks, the oil was steam stripped under vacuum to remove
those volatile compounds which did not originate in the popping oper-
ation itself.
The apparatus utilized for vacuum steam stripping of the com-
mercial cottonseed oil was the same as that described by Siek and
Lindsay (71) for removal of volatiles from butter oil. Six liters of

20
oil placed in the 12 liter flask were degassed for one hour at room
temperature. The temperatures were then raised on the steam gen-
erator and oil flask. With a system pressure of 1-2 m Hg (at the
pump end of the system), the oil was stripped at 200° C for 1 hr;
the temperature was then lowered to 180° C and stripping continued
for 3 hr. The system was opened and 1. 2 ml (about 0. 02%) of Tenox
2 antioxidant in 3 ml of ethanol was added to the oil. With power to
the steam generator and oil flask heating mantles off, the oil was
distilled for one hour to remove the ethanol. The oil was cooled and
stored in sealed glass bottles in the dark. The flavor of the stripped
oil was much more bland than that of the original oil.
Collection of the Volatiles--Ether Extraction. Water eluting
from the column in the gas chromatographic analysis of aqueous con-
densate by the on-column trapping procedure interfered with mass
spectrometric analysis of the eluted fractions. For this reason, a
source of volatile compounds free from water was desired. Ether
extraction of the aqueous condensate provided a water-free sample,
and furthermore, allowed the recovery of larger quantities of mater-
ial, especially higher boiling components.
Corn was popped as previously described using the steam
•^Eastman Chemical Products, Inc., Kingsport, Tenn. Tenox 2 is a food grade antioxidant containing 20% BHA, 6% propyl gallate, 4% citric acid, and 70% propyleneglycol.

21
stripped cottonseed oil, and the aqueous condensate was collected in
the same manner. The contents of the cold trap (glass beads and
aqueous condensate) were extracted three times with 65 ml portions
of diethyl ether. The ether extract was dried over anhydrous sodi-
um sulfate in the cold for at least four hours, then filtered through
glass -wool plug. Ether was removed by slowly refluxing through a
small condenser with a calcium chloride drying tube. When concen-
trated to about 5 ml, the extract was transferred to a chromato-
graphic storage tube^ and further concentrated with a slow stream
of dry Nitrogen gas to a volume of 20-50 (j.!. The sample was held
at 5-6° C until used for G.C analysis.
GC and Mass Spectrometric Analysis. Samples of the ether
extract prepared from corn popped in stripped cottonseed oil were
chromatographed twice on each of two different packed columns.
GC Conditions
Instrument Aerograph 204- 1 B
Detector and temperature Flame ionization, 230 "C
Injector temperature 230 0 C
Effluent splitter 9:1 ratio, 225 0C
^B and A Anhydrous Reagent, Allied Chemical Co. , Morris- town, N. J. Purchased from local suppliers in 1 lb containers.
Kontes Glass Company, Vineland, N. J. Catalog number K-42256.

22
BDS column (B)
Apiezon column (A)
Temperature program
2.5% Butanediol succinate on
100-120 mesh AW-DMCS Chro-
mosorb G, 12 feet long x 1/8
inch OD, Flow rate--20 ml/min
at 100 "C.
2. 5% Apiezon L.on 100-120 mesh
AW-DMCS Chromosorb G, 12 feet
long x 1/8 inch OD, Flow rate--
20 ml/min at 100° C.
55 ' C to 200 0 C at 2 ° /min, hold
at 200 " C. Same for both column &
The first run on each column (2. 5-3 fj.1 sample size) was rriade with
two persons evaluating the aroma of the gas stream from the effluent
splitter. Subsequently, a 6 |JL1 sample was injected on each column
and a fraction trapped from each column during the time that the
most popcorn-like aromas had previously been noted as eluting.
These fractions were stored in a freezer until subjected to GC-MS
analysis. Operating conditions for the GC-MS were the same as
previously described except for the capillary column operating tem-
peratures. These isothermal temperatures were 83 0 C for the frac-
tion trapped from the BDS column and 100° C for the fraction trapped
from the Apiezon L column.

23
Popping Apparatus--Microwave Oven
Because several compounds had been encountered in the previ-
ous work which were thought to arise from the oil used in popping
(40, 45), a method was needed to pop the corn without the need for
oil as a medium for heat transfer. The microwave oven unit avail-
able, a Model 1161 Ratheon Radarange, fulfilled this need. The oven
was thoroughly cleaned and an all glass apparatus assembled for con-
taining the popping corn and collecting the headspace volatiles.
A round Pyrex glass Z qt pan seven inches in diameter and four
inches deep with a small pouring lip served at the popping container
with the lid being a piece of plate glass eight inches square. Two
pieces of 3 mm glass tubing were inserted through the stainless steel
mesh grill in the oven door and into the pouring lip opening in the
pyrex popper. One of these tubes carried Nitrogen sweep gas into
the popper, and the other was connected to the cold traps and aspi-
rator to allow collection of the volatiles produced. Two cold traps
were connected in series: the first contained no packing material
and was cooled by an ice-water and salt mixture, while the second
was filled with glass beads and cooled by a dry ice-ethanol bath.
The trapping system was all glass, fitted by means of standard taper
or ball and socket joints which were not greased. A one inch long
piece of Tygon tubing was used to connect the first cold trap to the
24
glass tube reaching through the oven door into the popper. Suction
was supplied by a water aspirator connected to the exit of the second
cold trap.
Before each use all the glassware, including the glass beads,
was washed thoroughly in hot detergent solution, rinsed in tap and
distilled water, and dried in a 100 " C hot air oven. After removal
from the oven, each piece was rinsed with diethyl ether to insure
removal of any traces of grease.
Approximately 600 g of corn could be popped before the second
trap accumulated enough water to freeze solid. The corn was popped
in batches of 60 to 70 g which required about 80 sec at the "high"
heat setting on the oven. Nitrogen was bled slowly into the popper
to reduce the risk of drawing contaminated room air into the cold
traps. Aspirator suction was applied from the time the first kernel
popped until the oven timer turned off.
Corn popped in the microwave oven did not expand quite as
fully as that popped in oil, and approximately 10% of the kernels
did not pop. If the oven were left on until all the kernels popped,
considerable scorching of the earlier popped kernels occurred.
This was accompanied by a strong burned odor.
Ether Extract Analysis--Microwave Popped Corn
Trapped Fractions by GC-MS Analysis . The aqueous

25
condensate obtained from the headspace as the corn was popped in
the microwave oven was extracted with diethyl ether as described
for the oil popped corn,. The extract was dried, concentrated, and
chromatographed on the BDS and Apiezon L. packed columns in the
Aerograph 204 under the same conditions outlined on page 19. After
an initial rxm. to evaluate the aroma of the eluting fractions, another
run was made in which successive fractions were trapped in the
stainless steel traps for GC-MS analysis in the manner previously
described. Instrumental conditions were the same except for the
BDS capillary column temperature which was controlled isotherm-
ally as shown below.
Traps A-1, B-l, and B-2 90oC
Traps B-3, B-4, and B-5 147° C
Traps B-6, B-7, B-8, and B-9 180° C
Traps B-l0 and B-l 1 185 °C
Trap B-12 1750C
The fraction designated A was trapped from the Apiezon L
packed column, and those designated B were obtained from the
BDS column.
Whole Extract by Coupled Capillary Column GC-MS. The
aqueous condensate from microwave popped corn was extracted for
24 hours in a 250 ml continuous liquid-liquid extractor with freshly
26
distilled anhydrous reagentdiethyl ether. The extract was dried over
^2804 for 12 hr at 5-6° C. The ether was removed by distillation
through a 1 cm x 60 cm glass helix-filled column with a fractionating
head. The drop ratio at the fractionating head was controlled elec-
tronically at a ratio of about 3:1 with the larger part being directed
back down the column. Ten to 12 hr was required to remove 200 ml
of ether. The extract was evaporated to 5-10 ml, then transferred
to a chromatographic sample tube and further concentrated in a slow
Nitrogen stream to about 20 p.1.
Preliminary investigation allowed conditions to be established
utilizing a Perkin-Elmer model 226 gas chromatograph with a 300
foot x 0. 01 inch ID capillary column coated with butanediol succinate.
BDS Capillary--Perkin Elmer 226
Injection block temperature 230 * C
Detector temperature 240 ° C
Injection Split 100:1
Carrier gas Nitrogen, 40 psi (approx.
2 ml/min)
Temperature Program 60 ° C to 200 0 C at 1 ° /
min, hold at 200 0 C
A control sample of the B and A Anhydrous Reagent ether, when evaporated to~20-50 \ili was found to cohtain BHT. This was removed by a simple distillation.
27
Retention time data were obtained on the BDS capillary column
using the above conditions. These retention times were used to sub-
stantiate those obtained on the capillary column GC-MS system which
was operated under the conditions outlined below for three separate
runs.
GC Conditions
Instrument
Column and dimensions
Temperature program
Flow rate
Injector split and
temperature
F and M 810
Butanediol succinate 300 foot x
0. 01 inch ID
First and second runs: 60° C to
200 0 C at 1 ° /min- -hold
Third run; 150° C hold for 10 mir^
then 4 " /min to 200 0 C and hold
2. ml /min, initially, of Helium
50:1, 230oC
MS Conditions
Filament current 20 eV source 50 \xA
70 eV source 25 jiA, 1st run
40 |JLA, 2nd run
34 |JLA, 3rd run
All other operating conditions for the Atlas CH-4 mass spec-
trometer were the same as previously listed on page 18.

28
Ether extracts were evaporated under a Nitrogen stream until
no further volume reduction could be achieved. Sample sizes injected
for the three GC-MS analyses were 1 ^1, 4. 5 jxl, and 3 |j.l.
Acidic and Basic Fractions by Packed Column GC-MS. The
aqueous condensate from microwave popped corn (pH approx. ?• 0)
was acidified to pH2 (pH paper) with 10% HC1, then extracted three
times in a separatory funnel with 25 ml portions of freshly distilled
diethyl ether to yield a fraction enriched in acidic and neutral com-
pounds. The aqueous solution was then adjusted to pH 9-10 with
sodium carbonate powder and extracted four times with 25 ml por-
tions of freshly distilled diethyl ether to yield a fraction enriched in
basic compounds.
Ether was removed from both fractions on the column and frac-
tionating head as previously described; they were then transferred
to chromatographic sample tubes and concentrated under a Nitrogen
stream as much as possible prior to GC-MS analysis as described
below.
The Atlas CH-4 mass spectrometer was fitted with an EC-1
inlet valve which could be adjusted to allow from 5% to 10% of the
GC column effluent to enter the dual ion source. The remaining 90-
95% of the effluent was directed through a heated tube so that the
odor of the components being analyzed could be evaluated simul-
taneously. The strip chart output from the 20 eV ion source

29
provided a gas chromatogram. In actual operation, the 20 eV source
signal/noise ratio was extremely small, rendering all but the largest
peaks indistinguishable. As a result, reliance was placed on odor
assessment to detect the presence of components in the effluent.
Operating conditions for the mass spectrometer were the same as
described on page 18 except that the 70 eV filament current was 30
|JLA. Operating conditions for the gas chromatograph were as follows:
Instrument F and M 810
Injection port temperature 232 0 C
Transfer line temperature 210° -250° C
Column 5% Diethyleneglycol succinate
(DEGS) on 100-120 mesh AW-
DMCS Chromosorb G
Column dimensions
Flow rate
Temperature program
12 feet x 1/8 inch OD stainless
steel
25 ml/min Helium measured at
100° C
60 0 C to 200 " C at 2 0 /min, hold
at 200 0C
Infrared Spectra. Infrared spectra were obtained for some of
the large peaks late in the DEGS column chromatogram from the
ether extract of microwave popped corn aqueous condensate. The
compounds were trapped from the effluent splitter on the Aerograph
30
204 in 1/16 inch by 12 inch glass capillary tubes cooled with crushed
dry ice. The compounds were washed carefully from the tubes onto
a 5 mm etched square in the center of a sodium chloride plate with
a small amount of ether or acetone. Careful evaporation of the
solvent left a thin film of the compound suitable for obtaining the
infrared spectrum using a Beckman Model IRS spectrophotometer
equipped with a 5x KBr lens type beam condenser.
Preparation and Analysis of Vacuum Steam Distillate
Distillation
A diagram of the reduced pressure steam distillation apparatus
used for recovery of volatiles from popped corn is shown in Figure 1.
The foam traps were included as a precautionary measure, but no
foaming occurred. They did serve to prevent any particulate mater-
ial from the bumping action from being carried over into the conden-
sate traps.
Popped corn was prepared by grinding a total of approximately
900 g (weight before popping) in an auger-type food grinder (Enter-
prise Model 2112, 1/3 HP) so that the largest particles were 2-4 mm
in size. The ground popcorn was then slurried in nine liters of glass-
distilled water and poured into the 22 liter distillation flask. To the
steam generator was added 1500 ml of glass distilled water and a

K
A - B - C - D ■ E - F - G - H -
U K -
steam generator safety trap distillation flask thermometer foam traps water cooled condensers dry ice cooled trap dry ice ethanol cooled trap liquid nitrogen cooled traps to vacuum pump
Figure 1. Vacuum steam distillation apparatus.

32
few boiling chips. The cold traps were cooled and degassing begun
slowly to prevent violent bumping of the popcorn slurry. Power v/as
applied to the heating mantle on the distillation flask at a rate suffici-
ent to maintain the slurry at a temperature of 20-24° C. The steam
generator was heated sufficiently to keep the water boiling at a steady
rate. With a system pressure of near 1 mm Hg at the pump end of
the system, distillation was continued for 4 hr.
Extraction
The aqueous condensate from traps G, H, and I in Figure 1
was combined, saturated with sodium chloride, placed in a 3 liter
capacity liquid-liquid extractor, and extracted with a total of 500 ml
of freshly distilled anhydrous reagent diethyl ether for 24 hr. The
ether extract was dried over sodium sulfate and concentrated to
approximately 15 ml using the column and fractionating head as
described on page 22. The extract was then divided into two equal
portions in separate chromatographic samples tubes, one of which
was stored without concentrating at 5-6° C for future packed column
GC-MS analysis. The other portion was concentrated and subjected
to GC analysis on several different columns.
Packed Column GC-MS Analysis
The ether extract of the aqueous distillate obtained from

33
microwave popped corn was analyzed under conditions identical to
those described for the acidic and basic fractions on page 28 and 29.
The ether extract of the distillate from oil-popped corn was
analyzed by gas chromatography only. The chromatograms were
cornpared to those obtained from microwave popped corn under simi-
lar conditions.
Synthesis of Reference Compounds
Furan-2-glyoxal
The method of Kipnis and Ornfelt (41) involving selenium diox-
ide oxidation of the methyl group of 2-acetyl fur an to an aldehyde
was used to prepare furan-2-glyoxaL In a 250 ml 3-neck flask fitted
with a reflux condenser, sealed stirrer, and thermometer was placed
8. 75 g (0. 087 mole) of SeO?, 55 ml dioxane and 1. 6 ml of water. The
mixture was stirred at 50 ° C until solution was complete. Then 9- 5
g (0. 086 mole) of 2-acetyl furan was added and the mixture refluxed
with stirring for four hours. The reaction mixture was filtered
through a bed of Celite filter aid to remove the SeCU, and the solvent
was removed on a rotary evaporator. Vacuum distillation of the
residue through a 10 cm Vigreux column yielded 5 g of a yellow oil
(46% yield) which boiled at approximately 59 0 C at a pressure of
4 mm. A mass spectrum of the product was obtained by GC-MS

34
utilizing the 300 foot x 0. 01 inch ID BDS capillary column operated
isothermally at 149 0 Co Packed column GC was used to determine
product purity.
N-furfuryl pyrrole
The method reported by Gianturco et al. (2 7) was utilized.
One-half mole each of furfurylamine (48.5 g) and 2, 5-dimethoxy-
tetrahydrofuran (66. 0 g) was mixed with 15 ml of glacial acetic acid
and refluxed for 30 min. The mixture was cooled and adjusted to
pH 9 with 30% NaOH. The mixture was steam distilled, the distil-
late was extracted with redistilled diethyl ether, and the ether was
removed on the rotary evaporator. The yield was 52 g (70%) of a
clear liquid. The product was repeatedly chromatographed on a
12 foot x 1/8 inch OD, 5% DEGS column, and the pure N-furfuryl
pyrrole was trapped in glass melting point capillaries. The above
pure samples were used to obtain mass and infrared spectra as well
as a refractive index.
N-furfuryl pyrrole-2-carboxaldehyde
This method, utilizing a Vilsmeier reaction to formylate
N-furfuryl pyrrole prepared previously, was adapted from that of
Silver stein, Ryskiewicz, and Willard (74). In a 250 ml 3-neck flask
fitted with a condenser and drying tube, a sealed stirrer, and a

35
dropping funnel was placed 11. 7 g (0. 16 mole) of dimethylformamide.
The solution was stirred and cooled on an ice bath to 5 " C while 24. 6 g
(0. 16 mole) of phosphorous oxychloride was added slowly. The ice
was removed and the mixture stirred 10 min. The temperature was
increased slowly while 22. 1 g (0. 15 mole) of N-furfuryl pyrrole was
added dropwise over a period of about 30 min. The mixture was
stirred for an additional hour with the temperature held at 60 0 C.
A cold solution of 85 g of sodium acetate in 100 ml of water was
added through the condenser. The mixture was heated to boiling,
held for 10 min, then cooled to room temperature. The mixture
was extracted with redistilled diethyl ether, dried over sodium
sulfate, and the ether removed to yield about 5 g of viscous, dark
colored product. Vacuum distillation of the crude product was at-
tempted, but it did not completely separate the reaction products.
The 2 g of recovered material formed mixed crystals on standing
which were analyzed by preparative GC. The two predominant
components were trapped for infrared and mass spectrometric
analysis.
2, 3-Dihydrobenzofuran
The synthesis of 2, 3-dihydrobenzofuran was accomplished by
catalytic hydrogenation of benzofuran in ethyl acetate solution. Ten
milligrams of the catalyst, 5% Palladium on BaSO^, was added to

36
15 ml of ethyl acetate containing 1 ml of benzofuran in a 50 ml flask.
A teflon coated stirring bar was added, and the flask was connected
to a hydrogenation apparatus described by Farquhar et al. (18). The
hydrogen pressure over the surface of the stirred solution at room
temperature corresponded to a 30 cm head of water. No further
hydrogen was taken up after 18 hr at 25 " C, so the flask was removed,
the solution filtered to remove the catalyst, and the ethyl acetate
taken off on the rotary evaporator. The remaining liquid was ana-
lyzed by preparative gas chromatography with the 2, 3-dihydrobenzo-
furan peak being trapped for mass spectral analysis.
4 -V inyl - 2 -methoxyphenol
The preparation of 4-vinyl-2-methoxyphenol . (p-vinyl guaiacol)
was performed by the thermal decarboxylation of 4-hydroxy-3-
methoxycinnamic acid (ferulic acid) (21). The reaction was per-
formed in a nine inch disposable glass pipette (Scientific Products
no. P-5210-2) into which a loose glass wool plug was inserted as
far as possible from the large end. Approximately 300 mg of ferulic
acid was placed in the large end against the plug and a length of heat-
er tape was wrapped tightly around the area containing the sample
and the glass wool plug. A thermocouple was placed against the
glass beneath the heater tape and connected to a pyrometer for a
temperature monitor. A powerstat was used to control the current

37
through the heater tape to maintain the temperature between 200° C
and 250 0 C. Dry Nitrogen gas at a flow rate of 20 ml/min was passed
through the reaction chamber to sweep the liberated p-vinyl guaiacol
out through the drawn-out portion of the pipette into a 1/16 inch x
12 inch glass capillary tube connected by means of a short sleeve of
1/16 inch ID Teflon tubing. The droplets were collected in the capil-
lary tube When the reaction was completed, one end of the tube was
sealed in a flame and the tube was centrifuged to concentrate the
product at the sealed end. The product purity was greater than 99%
as judged by gas chromatography. Infrared and mass spectra were
obtained on the product without further purification.
4- Vinylphenol
The thermal decarboxylation of p-hydroxycinnamic acid (p-
coumaric acid) to yield p- vinylphenol was performed in the same
apparatus under the same conditions as described for preparation
4-vinyl-2-methoxyphenol. The product, which formed a white solid
at room temperature, was obtained in about 95% purity as shown by
GC. Mass spectra and infrared spectra were obtained on the product,
2, 3 Pimethyl-5, 6-dihydropyrazine
This compound, an intermediate in the synthesis of 2, 3-
dimethyl pyrazine, was prepared as described by Ishiguro and

38
Matsumura (35). Briefly, the method consisted of slowly adding 20 g
of diacetyl in 160 ml of ether to a stirred solution of 18. 5 g of ethyl-
enediamine and 200 nil of ether. A white precipitate formed which
was recovered by filtration of the ether solution. Several attempts
to recrystallize the pure dihydropyrazine from a mixture of ether
and isopropanol were made. Mass spectra of the material obtained
indicated that any heating of the reaction mixture (which eventually
resulted in a clear solution) decreased the percentage of the 2, 3-
dimethyl-5, 6-dihydropyrazine, and concurrently produced 2, 3-
dimethyl pyrazine.

39
RESULTS AND DISCUSSION
Identification of Compounds
Aqueous Condensate--Oil Popped Corn
Of the fractions trapped from the direct analysis of the aqueous
condensate, only the first two did not contain a considerable quantity
of water which tailed extremely on the packed Tris column. The
main constituents of traps 1 and 2 were pentanal and hexanal, respec-
tively, as determined by comparison of their mass spectra with refer-
ence spectra (2). Acetaldehyde, acetone, diacetyl, 3-methyl butanal,
and Freon 12, all present in small amounts, were also identified on
the basis of their mass spectra.
The presence of water eluting from the packed Tris column
interfered with the mass spectral analysis of components eluting after
about six minutes from the starting point. Thus, those components
which were judged to have more important odor properties could not
be subjected to mass spectrometry with this technique.
The presence of Freon 12 was observed frequently when samples
were introduced into the mass spectrometer from the 1/16 inch OD by
six inch stainless steel traps. The origin of the Freon 12 could not
be determined, although the dry ice used to cool the traps was sus-
pected as a possible source. A silicone contaminant (3) was also

40
frequently observed early in the capillary column chromatogram when
using the trapping technique.
The presence of the large amounts of pentanal and hexanal
relative to other components in the packed column chromatogram
was taken as an indication of oxidative breakdown of the oil used (40).
It appeared that these compounds would have to be minimized to facil-
itate analysis for the compounds produced from the popcorn itself. For
this reason a quantity of the cottonseed oil was vacuum steam stripped
to remove at least those volatile compounds which were initially pres-
ent. The steam stripped cottonseed oil had a very bland taste com-
pared to a Scimple of untreated oil. Later, the microwave oven proved
to be effective in popping the corn without the use of oil.
Ether Extract--Oil Popped Corn
The ether extraction of organic compounds from the aqueous
popper headspace condensate allowed the isolation of volatile organic
compounds free from water and in higher yield than the previous
method. The ether extract aroma was intensely "nutty and popcorny."
Sniffing the effluent gas stream from the ether extract on the BDS
and Apiezon L packed columns indicated that there was at least one
area of each chromatogram which had odors reminiscent of popcorn.
These areas were trapped in the stainless steel traps and subjected
to GC--MS analysis. Furfural and 2-pentyl furan were identified in
41
both fractions on the basis of their mass spectra with retention times
in agreement with those of known compounds run on both the packed
columns and a BDS capillary column. In addition, acetyl pyrazine-
(MW 122), 2-pentyl thiophene-(MW 154), and n-dodecane-MW 170)
were tenatively identified from their mass spectra. The largest
component in each fraction was 2-pentyl furan which has been re-
ported as being responsible for the "grassy or beany" character of
reverted soybean oil (75). The 2-pentyl furan was also isolated from
slightly oxidized soybean and cottonseed oils as well as thermally
oxidized corn oil and hydrogenated cottonseed oil (45). The flavor
threshold of 2-pentyl furan in oil was reported to be 1 ppm. In the
chromatograms of popcorn flavor isolates, popcorn-like aromas
were noted slightly before and after the 2-pentyl furan peak. How-
ever, it is believed that 2-pentyl furan does not, itself, contribute
significantly, to the rich, desirable, fresh popcorn aroma.
Ether Extract--Microwave Popped Corn
Trapped Fractions by GC--MS. Figure 2 shows the chromato-
gram of the ether extract obtained on the BDS packed column and
shows the areas which were trapped for subsequent GC--MS analy-
sis. Table 1 lists the compounds identified in each trap and the
information on which the identification was based. The very large
quantities of 3, 5-di-tert-butyl-4-hydroxytoluene (BHT) were traced
to the anhydrous diethyl ether (47). In all subsequent work the ether

42
2 O c CO UJ Pi Pi Ul Q OS O U w
IT lb 3b
x320 xl28
"75" 40 50 60
Time (min. )
Figure 2. Chromatogram of microwave popped corn ether extract on the BDS packed column.

Table 1. Compounds identified by GC-MS of trapped fractions.
Fraction Compound MS identification
MS Fraction reference
Compound MS MS identification reference
A-l
B-l
B-2
B-3
2-Methyl propanal + 13 Diacetyl + 13 Ethanol + 13 Ethyl benzene tentative 13 Heptanal tentative 13 2-Acetyl furan + 13 2-Acetyl pyrazine tentative
Ethanol + 13 2-Methoxy ethanol + 13
2-Pentyl. furan + 6 2, 3 Dimethyl pyrazine tentative 7 2, 5 Dimethyl pyrazine + 7
Diacetyl + 13 Hexane + 13 a-dichloro benzene tentative 13 2-Ethyl-5-methyl
pyrazine tentative 7 Furfural + 13 2-Acetyl furan + 13 Benzaldehyde + 13
B-4
B-5
B-6
B-7
B-ll
2-Pentyl furan + 6 Furfural + 13 2-Ethyl-3, 6-dimethyl
pyrazine tentative 7 2-Acetyl furan tentative 13 Benzaldehyde + 13 Furfuryl alcohol + 13 5-Methyl furfural tentative 13
Furfural + 13 5-Methyl furfural + 13 Furfuryl alcohol + 13 2-Methoxy phenol tentative 13 V -butyrolactone + 14 Bi-(5-methyl-2-furyl)-
methane + 79
/ -butyrolactone + 14 5-Methyl-2-acetyl furan tentative 79 Hexanoic acid + 13
3, 5-di-tert-butyl-4- hydroxytoluene + 13
2-Acetyl pyrrole + 9 Pyrrole-2-carboxaldehyde + 9
Methyl palmitate + 14 Diethyl phthalate + 13
44
was freshly distilled before each use. Even though the ether had
been redistilled, small quantities of BHT were still observed occa-
sionallyo The 2-methoxy ethanol is believed to be an artifact since
considerable quantities of it were in use in the laboratories during
this phase of the work.
Whole Extract by Coupled Capillary Column GC--MS. By
directly injecting samples of the ether extract into the capillary col-
umn (50; 1 inlet split ratio) and utilizing a temperature program, it
was hoped to obtain a more coherent picture of its composition.
Three separate analyses were made using this technique. Table Z
lists the compounds identified by comparison of their mass spectra
with reference spectra and supporting retention times where com-
pounds were available. GC confirmation (+) indicates that relative
retention times for authentic compounds were within 5% of the values
for the compounds in the extract.
The number of peaks obtained on the capillary column was con-
siderably fewer than observed on a packed column with the same ether
extract. Apparently, the limited capacity and dynamic range of the
0. 01 inch ID capillary columns allows only the larger components to
be seen when much of the volume of sample injected is sblvent. Every
attempt was made to reduce the ether volume, but the extract became
brown or black, very viscous, and difficult to handle with a syringe.
At that point, ether and furfural made up a large part of the mixture.

45
Table 2. Compounds identified by coupled capillary column GC-MS.
Compound MS identification
MS reference
GC confirmation
Acetaldehyde
Ethyl formate
Ethyl acetate
2- or 3-Methyl butanal
Diacetyl
Ethanol
2, 5-Dimethyl pyrazine
2, 3-Dimethyl pyrazine
2-Ethyl-5-methyl pyrazine
2-Ethyl-3, 6-dimethyl pyrazine
Furfural
2, 3, 5-Trimethylpyrazine
Benzaldehyde
Acetyl furan
5-Methyl furfural
Furfuryl alcohol
Phenol
y - Butyrolactone
BHT
2-Acetyl pyrrole
Pyrrole-2-carboxaldehyde
Methyl palmitate
Di ethyl phthalate
+
tentative
+
tentative
+
+
+
tentative
tentative
tentative
+
tentative
tentative
tentative
+
+
tentative
+
+
+
tentative
+
+
13 +
13
13 +
13 +
13 +
13 +
7 +
7
7
7
13 +
7
13
13 +
13 +
13 +
13
14 +
13 +
9 +
9 +
14 +
13 +

46
A 600 foot x Oo 02 inch ID capillary column was tried without an
injection split and found to have considerably better dynamic range
than the 0.01 inch ID columns. Operating difficulties involved when
this column was connected to the mass spectrometer were not com-
pletely resolved. A small bore packed column (3% Carbowax 20-M
on 100-120 mesh Aeropak 30, 20 feet x 0o 047 inch ID) was tried and
found to be quite effective in separating the components. However,
it was thought that the greater sample capacity of a 1/8 inch OD
packed column would be desirable when operating in conjunction with
the mass spectrometer. The 12 foot x 1/8 inch OD 5% DEGS column
was found to resolve the mixture nearly as well as the smaller bore
packed column, so it was utilized in subsequent GC--MS applications.
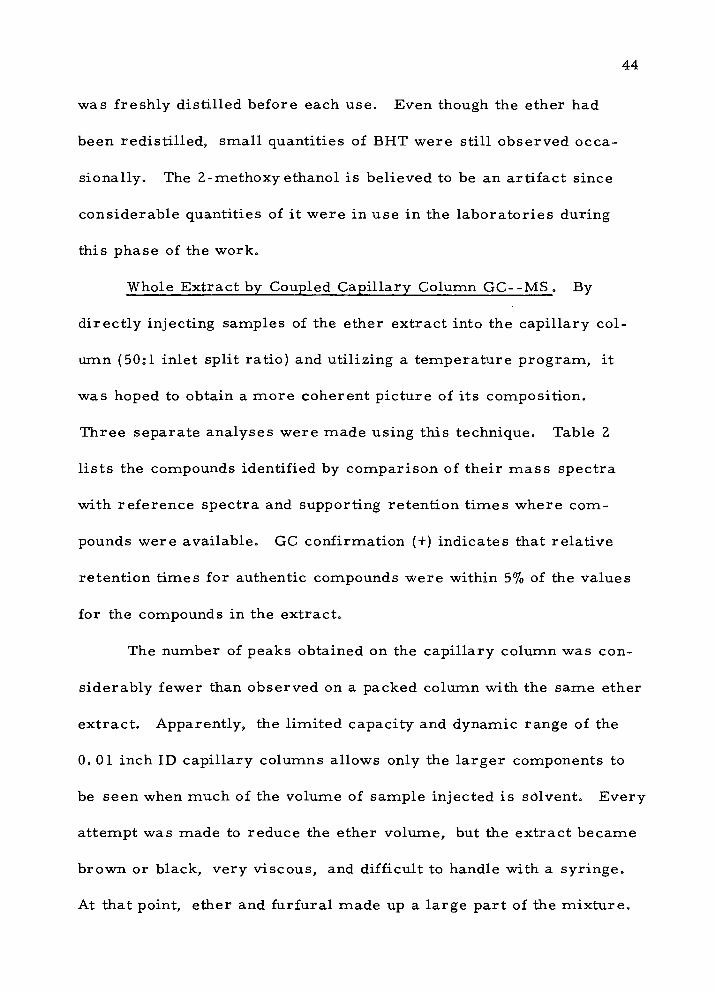
Packed Column GC--MS. Table 3 includes the compounds iden-
tified using the packed DEGS column connected through the EC-1 inlet
valve to the mass spectrometer. The vacuum distillate as well as
the acidic and basic fractions from microwave popped corn were
analyzed utilizing this system.. Table 3 indicates in which of the
samples each compound was found to be present. Figure 3 shows
a chromatogram of the aqueous distillate ether extract from the vacu-
um steam distillation of microwave popped corn. The numbers of
the peaks refer to the numbered compounds listed in Table 3. The
table includes the relative retention time (tp/to) values on the DEGS
column which were calculated with furfural = 1. 000. Since

Table 3. Compounds identified by packed column GG-MS.
Compound Peak Relative Retention MS Aroma (Fig. 3) extract authentic identification agreement
Found in MS distillate acidic fraction basic fraction reference
Ether Ethyl acetate Chloroform Unknown, MW 98 Pyridine Unknown, MW 95 Pyrazine Unknown, MW 111 Thiazole Unknown, MW 99 Unknown, MW 124 Unknown, MW 96 2-Methyl pyrazine Unknown, MW 99 Unknown, MW 110 Unknown, MW 86 2, 5-Dimethyl pyrazine 2, 3-Dimethyl pyrazine 2-Ethyl-5-methyl pyrazine 2, 3, 5-Trimethyl pyrazine Acetic acid 2-Ethyl-3, 6-dimethyl pyrazine Unknown, MW 122 Unknown, MW 140 Unknown, MW 150 Unknown, MW 169 Furfural Unknown, MW 120 2-Acetyl furan
0.113 0.128 0.407 0.424 0.487 0.512 0.548 0.562 0.562 0.562 0.575 0.611 0.622 0.626 0.698 0.718 0.783 0.807 0.827 0.842 0.885 0.885 0.911 0.956 1.000 1.000 1.032 1.105
0.097 0.116
0.483
0.506
0.550
0.606
0.703 0.756 0.803 0.846 0.835 0.881
1.000
1.109
+ + +
tentative
tentative
+ + +
tentative +
+ + +
+ +
+ +
+ +
+ +
+ + +
+ +
+ + + +
+ +
+ + +
+ +
+ +
+ + + + +
+ + +
+ + + + + + + + +
+ + + +
13 13 13
13
7
14
7 7 7
28 13
7
13
13
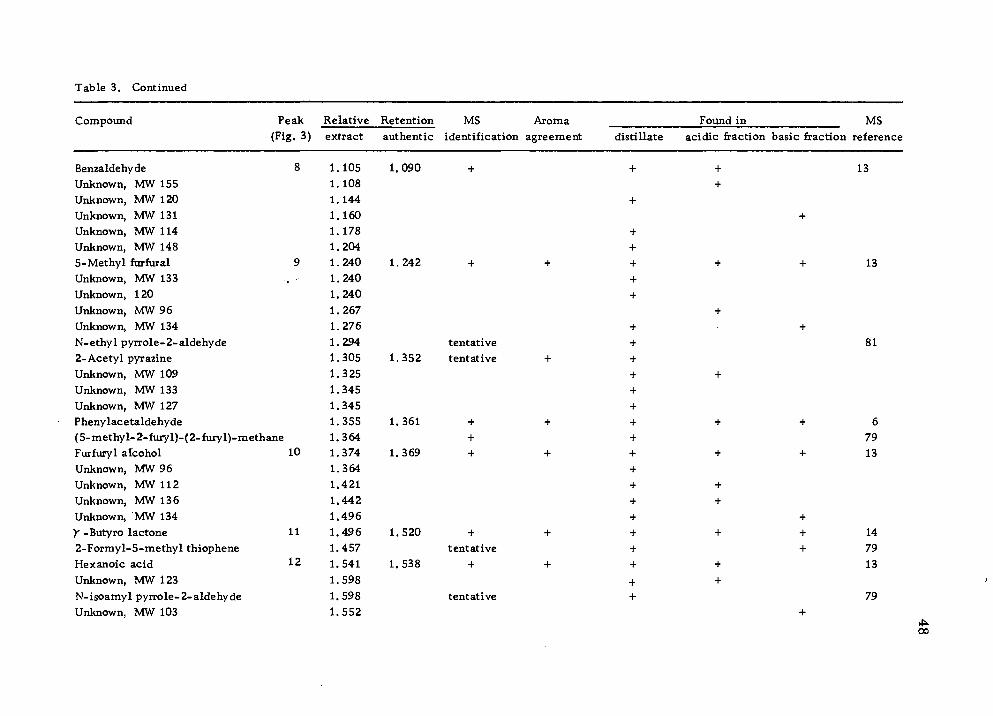
Table 3. Continued
Compound Peak Relative Retention MS Aroma (Fig. 3) extract authentic identification agreement distillate
Found in MS acidic fraction basic fraction reference
Benzaldehyde 8 Unknown, MW 155 Unknown, MW 120 Unknown, MW 131 Unknown, MW 114 Unknown, MW 148 5-Methyl furfural 9 Unknown, MW 133 . ■ Unknown, 120 Unknown, MW 96 Unknown, MW 134 N-ethyl pyrrole-2-aldehyde 2-Acetyl pyrazine Unknown, MW 109 Unknown, MW 133 Unknown, MW 127 Phenylacetaldehyde (5-methy 1- 2-furyl)-( 2- furyl)-methane Furfuryl alcohol 10 Unknown, MW 96 Unknown, MW 112 Unknown, MW 136 Unknown, MW 134 Y - Butyro lactone 11 2-Formyl-5-methyl thiophene Hexanoic acid 12 Unknown, MW 123 N-isoamyl pyrrole-2-aldehyde Unknown, MW 103
105 108 144 160 178
1.204 1.240 1.240 1.240 1.267 1.276 1.294 1.305 1.325 1.345 1.345 1.355 1.364 1.374 1.364 1.421 1.442 1.496 1.496 1.457 1.541 1.598 1.598 1.552
1.090
1.242
tentative 1.352 tentative
1.361
1.369
+ +
1.520 + tentative
1.538 +
tentative
+ + + + +
+ + + + + + + + + + + + + + + + + +
+ +
13
+ +
+ +
+ + +
13
81
6 79 13
14 79 13
79
00

Table 3. Continued
Compound Peak Relative Retention MS
(Fig. 3) extract authentic identificatio
Unknown, MW 95 1.630 BHT 1.647 1.653 + Unknown, MW 84 1.649 ,»- . . N-furfuryl pyrrole 13 1.682 1.684 + 2-Ethyl-5-butyl thiophene 1.713 tentative Unknown, MW 130 1.809 Unknown, MW 109 1.809 An unknown acid 1.854 Benzothizole 1.874 1.802 tentative Unknown, MW 120 1.915 2-Acetyl pyrrole 14 1.915 1.921 + Unknown, MW 146 1.969 Pyn'ole-2-carboxaldehyde 15 1.995 2.027 + Unknown, MW 160 2.002 Unknown, MW 98 2.027 4-Hydroxy-2, 5-dimethyl-3(2H)- ■ furanone 2.002 2.013 tentative Unknown, MW 85 2.057 Unknown, MW 124 2.027 „
Unknown, MW 149 2.117 5-Methyl-2-pyrrolealdehyde 2.157 tentative 4-Vinyl-2-methoxy phenol 16 2.217 2.207 + Unknown, MW 99 2.399 Unknown, MW 126 2.392 N-furfuryl pyrrole-2-carboxaldehyde 17 2.415 2.407 + Unknown, MW 164 2.603 4-Vinyl phenol 18 2.601 2.434 + Unknown, MW 149 2.650 Unknown, MW 177 2.650 Unknown, MW 68 2.774 Unknown, MW 222 2.683
Aroma agreement
Found in MS distillate acidic fraction basic fraction reference
+ + + +
+ + + + + + +
+ + + +
+ + + + +
+ + + +
+ +
+ + + + +
+ + +
+ +
+ +
13
79 13
13
9
9
73
81 79
79
Table 3. Continued
Compound Peak Relative Retention MS Aroma Found in MS (Fig. 3) extract authentic identification agreement distillate acidic fraction basic fraction reference
Unknown, MW 131 2.939 + Unknown, MW 149 3.013 + Unknown, MW 97 3.482 + Vanillin 19 3.578 3.358 + + + + 13 A phthalate 3.645 + 3 Palmitic acid 4.158 3.634 + + 13
o

51
2 O o- w OS
OS UJ Q a; o u w OS
10 20 30 40
Figure 3. Chromatogram of ether extract of aqueous vacuum distillate from microwave popped corn on the DEGS packed column.

52
temperature programming over a very wide range was employed, the
relative retention time values are subject to some variation from one
run to another and from one instrument to another. The most varia-
tion is encountered in very early peaks and very late peaks and is
caused largely by small variations in the initial and final temperatures
attained by the gas chromatograph. Because of this variation, elution
order, odor, and quantitative differences among the peaks -were used
along with relative retention times to substantiate the mass spectral
identifications.
Tentative mass spectral identifications are given where the
spectra were either very weak or were of a mixture of several com-
pounds so that a positive match with reference spectra was not possi-
ble. Some spectra were not interpretable or no reference spectra
were available for them and in these cases the probable molecular
weight of the compound is given. A positive mass spectral identifi-
cation indicates good agreement with reference spectra. When com-
paring with reference spectra, some allowances necessarily must be
made for background interferences and small variations in the intensi-
ties of the various mass peaks due to differing instruments and condi-
tions. When the relative retention time of a reference compound
(synthesized by published methods or obtained from commercial
sources) is in agreement with that of the sample compound on which
a positive mass spectral identification was made, the compound is

53
considered to be positively identified. Chloroform was determined
to be a contaminant in the lot of diethyl ether used for the three
samples in this phase of the work.
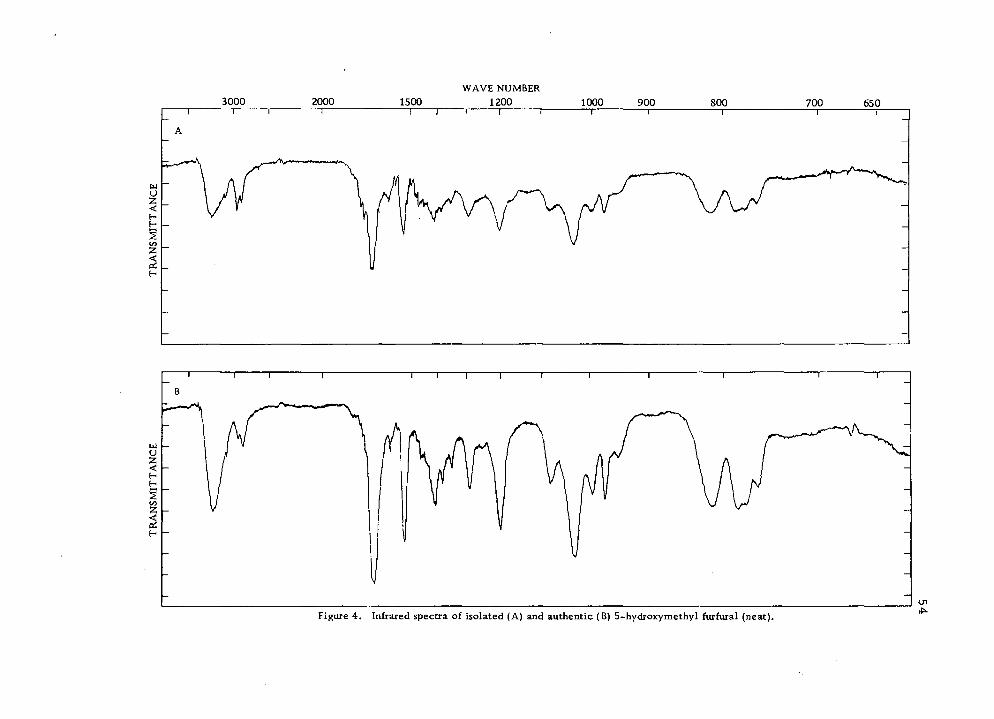
Infrared Spectra. Since the sample requirement for good infra-
red spectra is considerably higher than that needed for GC or mass
spectral analysis, an insufficient amount of most compounds was
eluted from the column for infrared spectra. This is especially true
if the components are impure and must be rechromatographed on a
different column and trapped again. Such a procedure was not used
successfully in this study. Usable infrared spectra were obtained
for 5-hydroxymethylfurfural, and two later eluting components thought
to be long chain fatty acids based on the characteristic broad OH-
stretching region, carbonyl band, and remaining spectral character-
istics (12).
Figure 4 compares the infrared spectra of authentic 5-hydroxy-
methylfurfural with that isolated from the microwave popped corn
aqueous condensate ether extract. On the basis of the closely match-
ing infrared spectra and corresponding relative retention times (tpAp)
Authentic = L. 541, (tp/tp) unknown = 1. 541, based on acetyl pyrrole -
1. 000) this compound was positively identified as 5-hydroxymethyl-
furfural.
Table 4 is the summary of all the compounds identified in this
study. An asterisk denotes compounds for which insufficient data is
WAVE NUMBER 1200
Figure 4. Infrared spectra of isolated (A) and authentic (B) S-hydroxymethyl furfural (neat).

Table 4. Summary of compoimds identified from popcorn.
Compound MS identification BDS
capillary
GC confirmation BDS packed
Apiezon L packed
DECS packed
Aroma
Acetaldehyde *Ethyl formate Ethyl acetate 2-Methyl propanal Diacetyl Ethanol 3-Methyl butanal Pentanal Hexanal 2-Pentyl furan
*Heptanal Hexane
*Pyridine Pyrazine
*Thiazole *Ethyl benzene *A dichlorobenzene
2-Methyl pyrazine 2, 5-Dimethyl pyrazine 2, 3-Dimethyl pyrazine 2-Ethyl-5-methyl pyrazine
*2, 3, 5-Trimethyl pyrazine Acetic acid 2-Ethyl-3, 6-dimethyl pyrazine Furfural 2-Acetyl furan Benzaldehyde 5-Methyl furfural
*2-Pentyl thiophene *n-Dodecane
+ tentative
+ + + + + + + +
tentative +
tentative +
tentative tentative tentative
+ + + +
tentative + + + + + +
tentative tentative
+ + + + + +
+ +
+ + +
+ + +
+ + + + + + + + + + +
+ + +
+ + +
+ + + +
U1

Table 4. Continued
Compound MS identification
GC confi irmation BDS BDS Apiezon L DECS
capillary packed packed packed
*2-Acetyl pyrazine tentative + + *N- Ethyl pyrrole-2-aldehyde tentative Phenyl acetaldehyde + +
*(5-Methyl-2-furyl)-(2-furyl)-methane + Furfuryl alcohol + + +
*2-Methoxy phenol tentative Y - Butyrolactone + + + *5-Methyl-2-acetyl furan tentative *Bi-(5-methyl-2-furyl)-methane + *2-Formyl-5-methyl thiophene tentative Hexanoic acid + +
*Phenol tentative *N-Isoamyl pyrrole-2-aldehyde tentative N-Furfuryl pyrrole + +
*2-Ethyl-5-butyl thiophene tentative *Ben20thiazole tentative + 2-Acetyl pyrrole + + + Pyrrole- 2-carboxaldehyde + + +
*4-Hydroxy.^5-dimethyl-3(OT>-furanone tentative + *5-Methyl-pyrrole-2-aldehyde " tentative 4-Vinyl-2-methoxy phenol + + N- fur fury Ipyrrole- 2- aldehyde + + 4-Vinyl phenol + + Vanillin + + + +
#5-Hydroxymethyl furfural • + Methyl palmitate + + Di ethyl phthalate + +
Palmitic acid + +
Aroma
+ +
+ +
* Indicates compounds tentatively identified + Indicates compound identified by matching infrared spectra

57
available for a positive identification.
Keference Compounds
Many of the compounds indicated by the mass spectral data
were not commercially available. Some of the pyrazine deriva-
tives needed for retention time verification and odor assessment
were kindly supplied by Dr. Michael E. Mason of International
Flavors and Fragrances, Union Beach, New Jersey. Included
were 2, 3-dimethyl pyrazine, 2, 3, 5-trimethyl pyrazine, 2-ethyl-5.-
methyl pyrazine, 2-ethyl-3, 6-dimethyl pyrazine, 2-ethyl-3, 5-
dimethyl pyrazine, and acetyl pyrazine. Seven other compounds
were synthesized by the methods cited from the literature.
Furan-2-glyoxal
This compound was first suspected as being a product from
a glucose-glycine model browning system. Several weak mass
spectra from the popcorn extracts had also shown compounds of
molecular weight 124. Relative retention times (tR/tR = 1.720
relative to furfural on the DEGS column) later ruled out the possi-
ble identification of furan-2-glyoxal in popcorn volatiles.
The mass spectrum of the furan-2-glyoxal obtained by BDS

58
capillary column GC--MS under conditions similar to those previ-
ously described were as follows:
m/e 95 (100%), 39 (70%), 38 (20%), 37 (15%), 67 (9%),
124 (molecular ion, 7%), 96 (7%), 51 (5%), 68 (3%), 66(3%)
The compound is a viscous yellow oil with a weak aroma similar in
character to the acetyl furan from which it was prepared. The final
product after vacuum distillation consisted of 9 1. 2% furan-2-glyoxal
and 8. 7% acetyl furan. The infrared spectrum is shown in Figure 5.
N-furfuryl pyrrole
The mass spectrum of N-furfuryl pyrrole in popcorn volatiles
was the key to its identity. The unknown spectrum was simple and
agreed well with the published spectrum (79).. The mass spectrum of
the synthesized compound is compared with that from the popcorn
sample and the published spectrum in Table 5;
Table 5. Mass spectra of N-furfuryl pyrrole.
m/e % Relative intensity Synthetic Ref. (79) Popcorn
81 100 100 100 147 (molecular ion) 33 42 38 53 29 22 53 27 17 9 30 39 10 5 7 58.5 3 2 5
148 5 6

aDN
VX
XIW
SN
VH
l
60
The refractive index was determined to be 1. 5311 which com-
pared closely to the literature (26) value of 1.5317. The infrared
spectrum of synthesized N-furfuryl pyrrole was virtually identical
to the published spectrum (26).
N-furfuryl pyrrole-2-carboxaldehyde
The synthesis of this compound was accomplished, but the pre-
dominant product of the formylation reaction was one with a molecular
weight of 203 which appeared to be the dialdehyde derivative. The two
products were separated by GC, and mass and infrared spectra were
obtained on the pure fractions. The mass spectryim for synthesized
N-furfuryl pyrrole-2-carboxaldehyde is compared to that from pop-
corn and from the literature (79) in Table 6.
Table 6. Mass spectra of N-furfuryl pyrrole-2-carboxaldehyde.
m/e % Relative intensity Synthetic Reference (79) Popcorn
81
175 (molecular ion)
53
27
39
146
94
118
176
100 100
27 32
27 25
14 14
10 8
1 2
2 2
1 2
3
100
15
37
22
14
2
3
2
2
61
The mass spectrum of the other reaction product, tentatively
identified as an N-furfuryl pyrrole dicarboxaldehyde, is as follows:
m/e 109 (100%), 53 (55%), 203 (molecular ion, 50%), 94 (49%),
28 (37%), 110 (35%), 81 (32%), 27 (31%), 39 (25%), 51 (24%\
52 (20%), 27 (20%), 43 (18%), 174 (10%), 95 (10%), 79 (10%),
and 38 (10%).
No attempt was made to determine the position of substitution of the
two aldehyde groups on the molecule. The infrared spectra of N-
furfuryl pyrrole-2-carboxaldehyde and the dialdehyde derivative are
shown in Figure 6. The infrared spectrum of N-furfuryl pyrrole-2-
carboxaldehyde is in agreement with published data (79). No evidence
for the presence of the N-furfuryl pyrrole dicarboxaldehyde in popcorn
was found.
2, 3-Dihydrobenzofuran
On the basis of a mass spectrum, 2, 3-dihydrobenzofuran was
suspected as a possible constituent of the popcorn volatiles. The
compound was prepared by catalytic hydrogenation, and, although
the yield achieved was only about 2%, sufficient material was puri-
fied by preparative GC for mass spectral analysis and retention
times. The mass spectrum matched the literature data (79) for
2, 3 dihydrobenzofuran found in coffee volatiles. The retention time
(relative to furfural) on the DEGS column was 1.220 compared to
1 8 re a
■8 re o tt
p > 2
5 o s p a
re cr
•< a re » 9 a i o o cr
o a
TR
AN
SM
ITT
AN
CE
Z9

63
2. 650 for the suspected unknown compound. Thus, 2, 3-dihydrobenzo-
furan was excluded as a possible popcorn flavor component.
4-Vinyl- 2 -methoxyphenol
Pure 4-vinyl-2-methoxyphenol was easily prepared by thermal
decarboxylation of ferulic acid. Its relative retention time of 2. 20 7
(furfural = 1. 000) on the DEGS column matched that of a compound
previously tentatively identified in popcorn volatiles by mass spec-
trometry. The mass spectrum of the synthesized 4-vinyl-2-methoxy-
phenol is compared with the spectrum of the compound from popcorn
and literature data in Table 7.
Table 7. Mass spectra of 4-vinyl-2-methoxyphenol.
m/e % Relative intensity Synthetic ReferenC' e(79) Popcorn
150 (molecular ion) 100 100 100 135 81 70 91 107 43 24 56 77 38 21 65 51 31 9 40 39 22 8 39 63 12 5 20 89 7 4 11 27 12 4 23
The infrared spectrum of the synthesized 4-vinyl-2-methoxy-
phenol is shown in Figure 7(A). The odor of 4-vinyl-2-methoxy-
phenol is ..intensely clove-like as it elutes from the GC column.
On standing when exposed to room air, the purified compound was

HD
NV
J.XIW
SNV
H1
HO
NV
lXIIA
iSN
VH
l
65
observed to be slowly oxidized to vanillin. This observation, based
on aroma, was verified by GC retention times.
4-Vinylphenol
The 4-vinylphenol, prepared form p-hydroxy.cinnamic acid, had
a retention time on the DEGS column of 2. 434 (furfural = 1. 000) which
\ compared favorably with the value of 2. 650 for the previously men-
tioned unknown of molecular weight 120. Comparison of the mass
spectra, shown in Table 8, confirms the identity of the unknown as
4-vinylphenoh Observation of the characteristic smoky, phenolic
odor of the compound from popcorn volatiles, eluting from the GC
column at the appropriate retention time, served as further confirma-
tion of its identity.
Table 8. Mass spectra of 4-vinylphenol.
m/e % Relative intensity Synthetic Popcorn
120 (molecular ion) 100 100
91 43 54
39 23 44
65 22 34
119 22 24
107 (impurity) 13
51 11 20
63 11 20
94 10 13
121 10 10
66
The peak at m/e 107 is probably due to a small amount of
4-ethyl phenol (MW 122) present in the sample as an impurity from
synthesis since a loss of 13 from the molecular ion is not likely. The
spectra of o-ethyl phenol and m-ethyl phenol ( 13 ) show m/e 107 as
the base peak with the molecular ion at m/e 122 about 30 to 40% as
strong. Assuming that 4-ethyl phenol also follows that pattern, its
presence as a contaminant is verified and accounts for the m/e 107
in the spectrum of 4-vinylphenol. Figure 7(B) shows the infrared
spectrum of GC purified 4-vinylphenol taken as a thin film on a salt
plate.
2, 3-Dimethyl-5, 6-dihydropyrazine
Since Bondarovich et al. (7) had observed that some of the inter-
mediates in the systhesis of pyrazines had "popcorn-like" aromas,
the synthesis of one of the intermediate dihydropyrazines was at-
tempted. The white crystalline product obtained from a condensa-
tion of diacetyl and ethylene diamine was estimated to be about 40%
2, 3-dimethylpyrazine and 60% 2, 3-dimethyl-5, 6-dihydropyrazine
based on the relative intensity of the molecular ion peaks from the
mass spectrum. The observed odor of the product was variable. An
odor described as popcorny or unpleasant, amine-like was perceived.
This observation appeared to depend on the concentration and the
degree of olfactory fatigue of the observer. The crystalline material.

67
on standing at room temperature, readily darkened and appeared to
slowly form a brown, viscous polymer. The popcorn-like aroma
was no longer evident after about two weeks. The dihydro pyrazines
are quite unstable and, therefore, would be difficult to utilize in a
flavoring application unless some method of stabilization could be
employed.
2-Acetyl pyrazine
A patent has been issued (61) covering the use of 2-acetyl
pyrazine, 5-methyl-2-acetyl pyrazine, and 6-methyl-2-acetyl pyra-
zine in food products and tobacco to impart a popcorn-like flavor and
aroma. The 2-acetyl pyrazine obtained from Dr. Mason was found
to have a very pleasing aroma much like fresh buttered popcorn.
When higher concentrations of the material were present (produced
by heating some of the crystals or sniffing the GC effluent), the odor
became harsh and even unpleasant. While acetyl pyrazine was not
positively identified in this study as a constituent of popcorn volatiles,
some indications of its possible presence were noted; (1) a compound
with a weak mass spectrum (mixed with other compounds) which
indicated the possible presence of acetyl pyrazine was obtained from
the "popcorny" smelling fraction trapped from the Apiezon L packed
column, (2) the relative retention time of acetyl pyrazine, 1. 352
(furfural = 1. 000). on the DEGS column was in agreement with the

68
repeatedly observed "popcorn-like" aroma emerging with a relative
retention time of 1. 338 on the same column. No discreet peak could
be associated with the popcorn-like aroma, so it may be due to either
a very low concentration of a highly odorous compound (possible 2-
acetyl pyrazine) or a mixture of two or more incompletely resolved
components.
The mass spectrum determined for known acetyl pyrazine is as
follows:
m/e 43 (100%), 80 (52%), 122 (molecular ion, 46%), 28 (44%),
52 (43%), 53 (36%), ?9 (28%), 94 (21%), 26 (18%), 42 (12%),
39 (8%), 81 (7%), 38 (7%), and 107 (6%).
Origin and Significance of Compounds
Furans
The concentration of furfural found was at least ten fold greater
than that of any of the other compounds isolated from popcorn. Plant
materials such as corn bran and popcorn cobs are reported to produce
furfural in yields of 19. 6% and 23. 0%, respectively, as estimated by
the A. O. A. C. method (17). The pentosans are considered to be the
chief precursors of furfural from these materials. It is probable
that the furan compounds arise largely from the carbohydrate mater-
ial contained in the corn kernel or the hull material as a result of the
69
applied heat during popping. The various model system studies which
have been conducted bear this out (32, 86, 59, 30, 29, 69, 46). The
Maillard browning pathways also allow for formation of various furan
derivatives (32), with an amino compound participating in the sugar
degradation.
In relation to popcorn flavor, furfural is definitely an impor-
tant contributor, both from the standpoint of its concentration and
flavor properties. The nutty, rich aroma of 5-methyl furfural must
surely be significant in the overall "smooth" desirable aroma of pop-
corn. The 4-hydroxy-2, 5-dimethyl-3(2H)-furanone has been isolated
from pineapple (73), beef broth (83), and as a decomposition product
from rhamnose (32). It has a pleasant caramel odor and could con-
tribute similarly to popcorn aroma.
Pyrazines
The various pyrazine derivatives are probably responsible for
the characteristic background nutty aroma of popcorn. It is possible
that acetyl pyrazine, or some other yet unidentified derivative, actu-
ally contributes directly to the unique "popcorny" aroma.
Pyrazines have been shown to arise from non-enzymatic brown-
ing reactions in model system studies (15, 85, 43) from amino acids
and sugars. One of the mechanisms proposed for this formation (5 7)
suggests that the final formation of methyl substituted pyrazines is by
70
condensation of two small (2-4 carbon) compounds previously formed
by cleavage of unsaturated ketoamines. This is in agreement with
the suggestions of Dawes and Edwards (15) and seems reasonable in
light of some of the condensation reactions employed in the labora-
tory synthesis of pyrazines (35, 48).
Pyrroles
The extent of the contribution of the identified pyrrole deriva-
tives to popcorn flavor is not clear. N-furfuryl pyrrole has a strong,
green or hay-like aroma, and could easily make a contribution.
Pyrrole derivatives have been isolated from model sugar-
amino acid browning systems (46, 3 7, 38). A mechanism has been
proposed (38) for the formation of N-substituted pyrrole-2-aldehydes
which is analogous to the formation of furfural in carbohydrate-amine
browning reactions. A specific route for formation of N-furfuryl
pyrrole derivatives has not been established.
Aldehydes
The most important source of acetaldehyde, 2-methyl propanal,
2-methyl butanal, and phenylacetaldehyde is probably the Strecker
degradation of alanine, valine, leucine, and phenylalanine, respec-
tively. This oxidative degradation of a -amino acids can be catalyzed
by a compound containing a -CsO-CsO- or a -CsO-fCHsCH) -CsO
71
grouping. These groupings are found in the sugar-derived intermedi-
ates in non-enzymatic browning and caramelization reactions and in
furfural (32).
The 2-methyl propanal and 2-methyl butanal probably make
important contributions to "malty" notes in popcorn aroma. Phenyl-
acetaldehyde possesses a very heavy floral scent which, in the small
amounts present, probably blends into the background flavor. Straight
chain aldehydes including pentanal, hexanal, and heptanal probably
contribute to the flavor of corn that has been popped in oil. Their
origin is primarily from the thermal oxidation of unsaturated fatty
acids (40). Unpon standing after popping, the level of such fat oxida-
tion products would normally increase. This may be partially re-
sponsible for the eventual onset of a "stale" flavor.
Phenols
Three phenolic compounds were identified including 4-vinyl-2-
methoxyphenol, 4-vinylphenol and vanillin. All three of these would
be expected to contribute to the flavor and aroma. The 4-vinyl-2-
methoxyphenol has a very pleasant clove-like aroma while 4-vinyl-
phenol possesses an unpleasant smoky and phenolic aroma.
As was demonstrated by the methods of synthesis, 4-vinyl-2-
methoxyphenol can be produced by the action of heat on ferulic acid
and 4-vinylphenol can be produced analagously fromp-hydroxycinnamic

72
acid (76, 20). Exposure to air was observed to cause the oxidation of
4-vinyl-2-methoxyphenol to vanillin. The presence of ferulic acid
and p-hydroxycinnamic acid in corn grain has been shown by Steinke
and Paulson (76).
Acids
Three fatty acids, acetic, hexanoic, and hexadecanoic (palmitic)
were identified. Acetic and hexanoic acids are believed to contribute
to the flavor and aroma of popcorn while the contribution of palmitic
acid is probably small.
Acetic acid is known to occur as a product of carbohydrate
browning reactions (69, 80, 86, 46). While Sugisawa (80) reported
identifying acids from formic through n-valeric from decomposition
of glucose caramel, no mention could be found of the identification of
hexanoic acid from model systems. From these results, it would
seem reasonable that the six carbon acid could also be formed in
these systems. Palmitic acid probably arises from triglyceride
hydrolysis (55) since corn oil usually contains about 10% palmitic
acid (5).
Gamma-butyrolactone probably contributes "richness" to the
overall flavor and aroma of popcorn. It has been identified as a
product from heated glucose (69) and sucrose pyrolysis (36), so its
formation by nonenzymatic browning reactions during popping seems
reasonable.
73
SUMMARY AND CONCLUSIONS
Thirty-six compounds were positively identified and another 20
compounds tentatively identified by coupled gas chromatography-mass
spectrometry in the study of popcorn volatiles.
It is believed that compounds containing the pyrazine ring are
of primary importance in the flavor of popcorn,, Furfural is the most
abundant single compound and, along with other furan compounds,
constitutes an important contribution to popcorn flavor. The origin
of the pyrazines, furans, and pyrrole compounds is probably Maillard
browning which involves the carbohydrate and protein or amino acid
constituents of the corn kernel. Phenolic compounds including 4-vinyl-
Z-methoxyphenol, 4-vinylphenol, and vanillin which probably arise
from the decomposition of lignin or lignin precursors in the kernel
are also important in the overall flavor.
There remains unidentified a considerable number of compounds
for which inadequate data was obtained or reference spectra or chem-
icals were not available to verify possible identities. Among those
incompletely characterized compounds are undoubtedly some which
are important contributors to popcorn flavor.
74
BIBLIOGRAPHY
1. Allen, R. R. Volatile flavor constituents in coconut oil. Chem- istry and Industry, September 4, 1965, p. 15 60.
2. American Society for Testing and Materials. Index of mass spectral data. Philadelphia, 1963. 244 p.
3. Biemann, Klaus. Mass spectrometry. Organic chemical appli- cations. New York, McGraw-Hill, 1962. 370 p.
4. Bills, D. D. and T. W. Keenan. Dimethyl sulfide and its pre- cursor in sweet corn. Journal of Agricultural and Food Chem- istry 16^643-645. 1968.
5. Blanck, Fred C. (ed. ). Handbook of food and agriculture. New York, Reinhold, 19 55. 1039 p.
6. Bondarovich, H. A. et al. Some aspects of the chemistry of tea. A contribution to the knowledge of the volatile constitu- ents. Journal of Agricultural and Food Chemistry 15;36-47. 1967.
7. Bondarovich, H. A. et al. Volatile constituents of coffee. Pyrazines and other compounds. Journal of Agricultural and Food Chemistry 15:1093-1099. 1967.
8. Bricout, J„ et al. Sur la composition de I'arfrme de the noir II. Helvitica Chimica Acta 50:1517-1522. 1967.
9. Budzikiewicz, Herbert, Carl Djerassi and Dudley H. Williams. Mass spectrometry of organic compounds. San Francisco, Holden-Day, 1967. 690 p.
10. Chang, Stephen S. Volatile flavor components of potato chips. In: Proceedings of the 1 7th National Potato Utilization Confer- ence, Presque Isle, Maine, 1967. [Washington, D. C. ] U. S. Dept. of Agriculture, Agricultural Research Service, p. 82-88.
11. Coffman, J. Robert. Bread flavor. In: Symposium on foods: The chemistry and physiology of flavors, ed. by H. W. Schultz, E. A. Day and L.. M. Libbey. Westport, Conn., Avi, 1967. p. 185-202.

75 12. Colthup, Norman B., Lawrence H. Daly and Stephen D.
Wiberley. Introduction to infrared and raman spectroscopy. New York, Academic, 1964. 511 p.
13. Cornu, A. and R. Massot. Compilation of mass spectral data. London, Hey den and Son, 1966. 617 p.
14. Cornu, A. and R. Massot. First supplement to compilation of mass spectral data. London, Heyden and Son, 1967. 138 p.
15. Dawes, I. W. and R. A. Edwards. Methyl substituted pyrazines as volatile reaction products of heated aqueous aldose, amino- acid mixtures. Chemistry and Industry, December 31, 1966, p. 2203.
16. Deck, R. E. and S. S. Chang. Identification of 2, 5-dimethyl- pyrazine in the volatile flavor compounds of potato chips. Chemistry and Industry, July 24, 1965, p. 1343-1344.
17. Dunlop, A. P. and F. N. Peters. The furans. New York, Reinhold, 1953. 867 p.
18. Farquar, J. W. et aL, The analysis of fatty acid mixtures by gas-liquid chromatography. Nutritional Reviews, sup., part II, 17;1=30. 1959.
19. Feldman, J. R?, W, S. Ryder and J. T. Kung. The impor- tance of non-volatile compounds to the flavor of coffee. Paper no. 70 presented at the 156th National Meeting of the American Chemical Society, Atlantic City, New Jersey, Sept. 11, 1968. (Preprint)
20. Fiddler, Walter et ah Composition of hickory sawdust smoke. Furans and phenols. Journal of Agricultural and Food Chem- istry 14;659-662. 1966.
21. Fiddler, Walter et_al_. Thermal decomposition of ferulic acid. Journal of Agricultural and Food Chemistry 15:757-761. 1967.
22. Fitzpatrick, Thomas J. and William L. Porter. Microwave finishing of potato chips. Effect on the amino acids and sugars. American Potato Journal 45; 103-110. 1968.
23. Flament, I., B. Willhalm and M. Stoll. Recherches sur les aromes. Sur I'arome du cacao. III. Helvitica Chimica Acta 50:2233-2243. 1967.

76
24. Gautschi, M. et al. New developments in coffee aroma re- search. Journal of Agricultural and Food Chemistry 15:15-23. 1967.
25. Gianturco, M. A. Coffee flavor. In: Symposium on foods: The chemistry and physiology of flavors, ed. by H. W. Schultz, E. A. Day, and L. M. Libbey. Westport, Conn., Avi, 1967. p. 431-449.
26. Gianturco, M. A. , P. Friedel and A. S. Giammarino. The volatile constituents of coffee. III. The structure of two heterocyclic compounds and the synthesis of tetrahydrofuran- ones. Tetrahedron 20:1763-1772. 1964.
27. Gianturco, M. A. et al. The volatile constituents of coffee. IV. Furanic and pyrrolic compounds. Tetrahedron 20:2951- 2961. 1964.
28. Goldman, I. M. et al. Racherches sur les aromes. Sur 1'arome de cafe. II. Pyrazines et pyridines. Helvitica Chimica Acta 50:694-705. 1967.
29. Greenwood, C. T. The thermal degradation of starch. Ad- vances in Carbohydrate Chemistry 22:483-515. 1967.
30. Heyns, K., R. Stute and H. Paulsen. Braunungsreaktionen und Fragmentierungen von Kohlenhydraten. Teil I. Die fluchtigen Abbauprodukte der Pyrolyse von D-glucose. Carbohydrate Re- search 2:132-149. 1966.
31. Heyns, K., R. Stute and H. Scharmann. Massenspektro- metrische Untersuchungen. XII. Die massenpektren von Furanen. Tetrahedron 22:2223-2235. 1966.
32. Hodge, John E. Nonenzymatic browning reactions. In: Sympo- sium on foods: The chemistry and physiology of flavors, ed. by H. W. Schultz, E. A. Day and L. M. Libbey. Westport, Conn., Avi, 1967. p. 465-491.
33. Hodge, J. E. , F. D. Mills and B. E. Fisher. Compounds of browned flavor derived from sugar-amine reactions. Paper to be presented at the 54th Annual Meeting, American Associ- ation of Cereal Chemists, Chicago, Illinois, April 2 7-May 1, 1969. (Preprint)

77
34. Hunter, I. R. et al_. Production of bread-like aromas from proline and glycerol. Cereal Science Today 11:493-501. 1966.
35. Ishiguro, Takeo and Masaki Matsiamura. Synthesis of piperaz- ines. VIII. Synthesis of a (trans)-- and (3 (cisj--2, 3-dimethyl- piperazines. Yakugaku Zasshi 78s229-231. 1958. (Abstracted in Chemical Abstracts 52;ll6li. 1958. )
36. Johnson, R. R. , E. D. Alford and G. W. Kinzer. Formation of sucrose pyrolysis products. Journal of Agricultural and Food Chemistry 17:22-24. 1969-
37. Kato, Hiromichi. Chemical studies on amino-carbonyl reac- tion. Part III. Formation of substituted pyrrole-2-aldehydes by reaction of aldoses with alkylamines. Agricultural and Biological Chemistry (Tokyo) 31:1086-1090. 1967.
38. Kato, Hiromichi and Masao Fujimaki. Formation of N-substi- tuted pyrrole-2-aldehydes in the browning reaction between D-xylose and amino compounds. Journal of Food Science 33: 445-449. 1968.
39. Kawada, Tsukasa et al. Chemical reactions involved in the deep fat frying of foods. II. Identification of acidic volatile decomposition products of corn oil. Journal of the American Oil Chemists' Society 44:131-135. 1967.
40. Keeney, Mark. Secondary degradation products. In: Sympo- sium on foods: Lipids and their oxidation, ed. by H. W. Schultz, E. A. Day and R. O. Sinnhuber, Westport, Conn. , Avi, 1962. p. 79-89.
41. Kipnis, Frank and John Ornfelt. Furan-2-glyoxaL Journal of the American Chemical Society 70:3948-3949. 1948.
42. Kirigaya, Norimasa, Hiromichi Kato and Masao Fujimaki. Studies on antioxidant activity of nonenzymic browning reac- tion products. Part I. Relations of color intensity and reduc- tones with antioxidant activity of browning reaction products. Agricultural and Biological Chemistry (Tokyo) 32:287-290. 1968.
43. Koehler, P. E., M. E. Mason and J. A. Newell. Formation of pyrazine compounds in sugar-amino acid model systems. Paper no. 113 presented at the 156th national meeting of the

78 American Chemical Society, Atlantic City, New Jersey, Sept. 13, 1968. (Preprint)
44. Krishnamurthy, R. G. and Stephen S. Chang. Chemical reac- tions involved in the deep fat frying of foods. III. Identifica- tion of nonacidic volatile decomposition products of corn oil. Journal of the American Oil Chemists' Society 44; 136-140. 1967.
45. Krishnamurthy, R. G. et al. Identification of 2-pentyl furan in fats and oils and its relationship to the reversion flavor of soy- bean oil. Journal of Food Science 32;372-3 74. 1967.
46. Langner, Ernst H. and Joseph Tobias. Isolation and charac- terization of ether soluble sugar-amino acid interaction prod- ucts. Journal of Food Science 32:495-502. 1967.
47. Libbey, L. M. and J. P. Walradt. 3, 5-di-tert-butyl-4-hydroxy- toluene (BHT) as an artifact from diethyl ether. Lipids 3;56l. 1968.
48. Marion, Jean Paul. Synthesis of ethyl-trimethyl-pyrazine, a new constituent of cocoa aroma. Chimia 21:510-511. 19 67.
49. Marion, J. P. et al. Sur la composition de 1'arome de cacao. Helvitica Chimica Acta 50:1509-1516. 1967.
50. Mason, M. E., Bobby Johnson and Maynard Hamming. Peanut compounds, flavor components of roasted peanuts. Some low molecular weight pyrazines and a pyrrole. Journal of Agricul- tural and Food Chemistry 14:454-460. 1966.
51. Mason, M. E., Bobby Johnson and Maynard C. Hamming. Peanut components, volatile components of roasted peanuts. The major monocarbonyls and some noncarbonyl components. Journal of Agricultural and Food Chemistry 15:66-73. 1967.
52. Miller, Donald F. (comp. ). Composition of cereal grains and forages. Washington, D. C., National Academy of Sci- ences- -National Research Council, 1958. 663 p. (Publica- tion 585)
53. Mookherjee, B. D., R. E. Deck and S. S. Chang. Food flavor changes, relationship between monocarbonyl compounds and flavor of potato chips. Journal of Agricultural and Food Chem- istry 13:131-134. 1965.

79
54. Morgan, M. E. and E. A. Day. Simple on-column trapping procedure for gas chromatographic analysis of flavor volatiles. Journal of Dairy Science 48:1382-1384. 1965.
55. Nawar, Wassef W. Thermal degradation of lipids. A Review. Journal of Agricultural and Food Chemistry 17:18-21. 1969.
56. Neish, A. C. Coumarins, phenylpropanes, and lignin. In: Plant biochemistry, ed. by James Bonner and J. E. Varner. New York, Academic, 1065. p. 581-617.
5 7. Newell, Jon A. , Michael E. Mason and Ralph S. Matlock. Precursors of typical and atypical peanut flavor. Journal of Agricultural and Food Chemistry 15:767-772. 1967.
58. Reddy, B. R. etal. Chemical reactions involved in;the deep fat frying of foods. V. Identification of nonacidic volatile decomposition products of hydrogenated cottonseed oil. Jour- nal of the American Oil Chemists' Society 45:629-631. 1968.
59. Reynolds, T. M. Nonenzymic browning; Sugar-amine interac- tions. In: Symposium on foods: Carbohydrates and their roles, ed. by H. W. Schultz, R. F. Cain and R. E. Wrolstad. West- port, Conn., Avi, 1969. (In press)
60. Rizzi, George P. The occurrence of simple alkyl pyrazines in cocoa butter. Journal of Agricultural and Food Chemistry 15:549-551. 1967.
61. Roberts, Donald L. Process of imparting a popcorn-like flavor and aroma to foodstuffs and tobacco by incorporating pyrazine derivatives therein and the resulting products. U. S. patent 3,402, 051. Sept. 17, 1968.
62. Robertson, D. H. and C. Merritt, Jr. Some studies in the thermal degradation of amino acids, peptides and proteins. In: Proceedings of the International Symposium on Macro- molecular Chemistry of the International Union of Pure and Applied Chemistry and the Chemical Society of Japan, Tokyo and Kyoto, 1966. (Preprint)
63. Rohan, T. A. and T. Stewart. Precursors of chocolate aroma. Studies in the degradation of amino acids during the roasting of Accra cocoa beans. Journal of Food Science 32:625-629. 1967.

80
64. Rooney, Lloyd W. , Ali Salem and John A. Johnson. Studies of the carbonyl compounds produced by sugar-amino acid reactions. I. Model systems. Cereal Chemistry 44:539-550. 1967.
65. Rudolph, C. J., M. E. Mason and G. V. Odell. Investigation of compounds responsible for aroma in pecan nuts. Paper no. 117 presented at the 156th national meeting of the American Chemical Society, Atlantic City, New Jersey, Sept. 13, 1968. (Preprint)
66. Salem, Ali, Lloyd W. Rooney and John A. Johnson. Studies of the carbonyl compounds produced by sugar-amino acid reac- tions. II. In bread systems. Cereal Chemistry 44:5 76-583. 1967.
67. Scanlan, R. A., R. G. Arnold and R. C. Lindsay. Collecting and transferring packed-column gas chromatographic fractions to capillary columns for fast-scan mass spectral analysis. Journal of Gas Chromatography 6:372-373. 1968.
68. Self, R. Potato flavor. In: Symposium on foods: The chemis- try and physiology of flavors, ed. by H. W. Schultz, E. A. Day and L. M. Libbey. Westport, Conn., Avi, 1967. p. 364-389.
69. Shaw, Philip E., James H. Tatum and Robert E. Berry. Base- catalyzed fructose degradation and its relation to nonenzymic browning. Paper no. 116 presented at the 15 6th national meet- ing of the American Chemical Society, Atlantic City, New Jersey, Sept. 13, 1968. (Preprint)
70. Shimisu, Yasuo et al. Studies on flavor of roast barley (so- called mugi-cha) I. Separation and identification of sodium carbonate and sodium hydroxide-soluble components of mugi- cha. Nippon Hogeikagaku Kaishi 41:654-659. 1967. (Ab- stracted in Biological Abstracts 49:49868. 1968)
71. Siek, T. J. and R. C. Lindsay. Volatile components of milk fat steam distillates identified by gas chromatography and mass spectrometry. Journal of Dairy Science 51:1887-1896. 1968.
72. Siek, T. J. et_ al. Flavor properties of gamma- and delta-lac- tones: Comparison with other normal aliphatic volatile com- pounds. Submitted to Journal of Food Science, August 1968.

81
73. Silver stein, Robert M. Pineapple flavor. In: Symposium on foods: The chemistry and physiology of flavors, ed. by H. W. Schultz, E. A. Day and L. M. Libbey. Westport, Conn. , Avi, 1967. p. 450-461.
74. Silverstein, Robert M. , Edward E. Ryskiewicz and Constance Willard. 2-Pyrrolealdehyde (Z-Pyrrole-carboxaldehyde). Organic Syntheses 36:74-77. 1956.
75. Smouse, Thomas H. and Stephen S. Chang. A systematic char- acterization of the reversion flavor of soybean oil. Journal of the American Oil Chemists' Society 44:509-514. 1967.
76. Steinke, R. D. and Mark C. Paulson. Phenols from grain, the production of steam-volatile phenols during the cooking and alcoholic fermentation of grain. Journal of Agricultural and Food Chemistry. 12:381-387. 1964.
77. Stoffelsma, J. and J. Pypker. Some new constituents of roast- ed coffee. Recueil des Travaux Chimiques des Pays-Bas 87: 241-242. 1968.
78. Stoffelsma, J. et ah New volatile components of roasted coffee. Journal of Agricultural and Food Chemistry 16:1000- 1004. 1968.
79. Stoll, M. et ed. Recherches sur les arcSmes. Sur I'arome de Cafe. I. Helvitica Chimica Acta 50:628-694. 1967.
80. Sugisawa, Hiroshi. The thermal degradation of sugars. II. The volatile decomposition products of glucose caramel. Jour- nal of Food Science 31:381-385. 1966.
81. Tatum, James H., Philip E. Shaw and Robert E. Berry. Some compounds formed during nonenzymic browning of orange pow- der. Journal of Agricultural and Food Chemistry 15:773-775. 1967.
82. Thomas, W. I. Relation of sample size and temperature to volumetric expansion of popcorn. Food Technology 12:514- 517. 1958.
83. Tonsbeek, Christian H. T. , Arie J. Plancken and Tenn v. D. Weerdhof. Components contributing to beef flavor. Isolation of 4-hydroxy-5-methyl-3(2H)-furanone and its 2, 5-dimethyl
82
homolog from beef broth. Journal of Agricultural and Food Chemistry 16:1016-1021. 1968.
84. Van der Wal, B. et al. Some new constituents of roasted cocoa. Recueil des Travaux Chimiques des Pays-Bas 8 7;238-240. 1968.
85. van Praag, Michel, Herbert S. Stein and Merrick S. Tibbetts. Steam volatile aroma constituents of roasted cocoa beans. Journal of Agricultural and Food Chemistry 16:1005-1008. 1968.
86. Walter, R. H. and I. S. Fagerson. Volatile compounds from heated glucose. Journal of Food Science 33:294-29 7. 1968.
87. Wang, Pao-shui, Hiromichi Kato and Masao Fujimaki. Studies on flavor components of roasted barley. Part II. The major volatile carbonyl compounds. Agricultural and Biological Chemistry (Tokyo) 32:501-506. 1968.
88. Yasuda, Kosaku, B. R. Reddy and S. S. Chang. Chemical reactions involved in the deep fat frying of foods. IV. Identi- fication of acidic volatile decomposition products of hydrogenat- ed cottonseed oil. Journal of the American Oil Chemists' Soci- ety 45:625-629. 1968.