an accurate qrs complex and p wave detection in …...2019/10/10 · the qrs-complex (the qrs...
TRANSCRIPT
Received August 16, 2019, accepted September 1, 2019, date of publication September 6, 2019, date of current version September 20,2019.
Digital Object Identifier 10.1109/ACCESS.2019.2939943
An Accurate QRS Complex and P Wave Detectionin ECG Signals Using Complete EnsembleEmpirical Mode Decomposition with AdaptiveNoise ApproachMD BILLAL HOSSAIN1, (Graduate Student Member, IEEE),SYED KHAIRUL BASHAR1, (Graduate Student Member, IEEE),ALLAN J. WALKEY2, DAVID D. MCMANUS3,AND KI H. CHON 1, (Senior Member, IEEE)1Department of Biomedical Engineering, University of Connecticut, Storrs, CT 06269, USA2Department of Medicine, Boston University School of Medicine, Boston, MA 02118, USA3Division of Cardiology, University of Massachusetts Medical School, Worcester, MA 01655, USA
Corresponding author: Ki H. Chon ([email protected])
This work was supported by NIH under Grant R01 HL136660.
ABSTRACT We developed a novel method for QRS complex and P wave detection in the electrocar-diogram (ECG) signal. The approach reconstructs two different signals for the purpose of QRS and Pwave detection from the modes obtained by the complete ensemble empirical mode decomposition withadaptive noise, taking only those modes that best represent the signal dynamics. This approach eliminatesthe need for conventional filtering. We first detect QRS complex locations, followed by removal of QRScomplexes from the reconstructed signal to enable P wave detection. We introduce a novel method of Pwave detection from both the positive and negative amplitudes of the ECG signal and an adaptive P wavesearch approach to find the true P wave. Our detection method automatically identifies P waves withoutprior information. The proposed method was validated on two well-known annotated databases—the MITBIH Arrythmia database (MITDB) and The QT database (QTDB). The QRS detection algorithm resultedin 99.96% sensitivity, 99.9% positive predictive value, and an error of 0.13% on all validation databases.The P wave detection method had better performance when compared to other well-known methods. Theperformance of our P wave detection on the QTDB showed a sensitivity of 99.96%, a positive predictivevalue of 99.47%, and the mean error in P peak detection was less than or equal to one sample (4 ms) onaverage.
INDEX TERMS Complete ensemble empirical mode decompositionwith adaptive noise, CEEMDAN, ECG,QRS complex, P wave, signal reconstruction.
I. INTRODUCTIONElectrocardiogram (ECG) signals are widely used for detec-tion and diagnosis of various cardiac arrhythmias. The mainadvantage of ECGmeasurement is its noninvasiveness. Auto-matic detection of different arrhythmias from ECG signalshas been a major research focus for the last few decades.While various algorithms have been developed, there con-tinues to be a need for more accurate methods for detect-ing the QRS complex, P wave, and T wave from ECGdata. Proper detection of QRS complex locations enables
The associate editor coordinating the review of this manuscript andapproving it for publication was Kemal Polat.
accurate estimation of heart rates (HR) and identification ofabnormalities in heart rhythms (e.g. atrial fibrillation (AF),premature ventricular contraction (PVC), and prematureatrial contraction (PAC)).
One of the major cardiac arrhythmias is atrial fibrilla-tion (AF), which causes more than 750,000 hospitaliza-tions and contributes to 130,000 deaths each year [1], [2].When AF occurs, it is characterized by irregular RR inter-vals and absence of P waves in the ECG. Using onlythe irregularity of RR intervals cannot accurately captureatrial fibrillation (AF) rhythm, especially in the presenceof premature ventricular contraction (PVC) and premature
VOLUME 7, 2019 This work is licensed under a Creative Commons Attribution 4.0 License. For more information, see http://creativecommons.org/licenses/by/4.0/ 128869

M. B. Hossain et al.: Accurate QRS Complex and P Wave Detection in ECG Signals Using Complete EEMD
atrial contraction (PAC) [3]. When PAC and PVC are present,discrimination of P waves can be used in conjunction withirregular RR intervals for even more accurate AF detection.Unfortunately, detection of a P waves is challenging due tothe low amplitude and susceptibility of P waves to noise andmotion artifact contamination, especially when ECG data arecollected fromwearable devices. Moreover, P wave morphol-ogy changes from subject to subject and depends on ECG leadplacement. For example, P waves can be normal, inverted,or biphasic. Thus, automated detection of P waves is quitechallenging, especially from wearable devices.
There have been several notable prior approaches to Pwavedetection. An adaptive filter-based technique is proposedin [4], which can be easily implemented and does not requirea priori information about the ECG signal. Unfortunately,this technique requires a reference signal. A low pass dif-ferentiation technique is proposed in [5], an approach thatis robust to waveform variation. However, this method issensitive to noise and its arbitrary threshold value used inthis method sometimes leads to P wave detection error. Thepattern recognition-based approach in [6] is overly sensitiveto noise and has insufficient accuracy for clinical use. Otherapproaches include a neural network with wavelet transformto detect recurrent patterns in the ECG in [7], an evolutionaryoptimization-based approach [8], and a Bayesian approach inassociation with Gibbs sampler [9]. Most of these methodsare computationally intensive and they require a large com-puter memory size, limiting utility for some wearable deviceapplications. The extended Kalman filter (EKF) approachproposed in [10] has been found to be quite effective inP wave detection. However, this approach needs to initializeparameters associated with the algorithm and they may varydepending on the type of ECG signals. A differential evolu-tion (DE) optimization strategy proposed in [11] has showna good accuracy in P wave detection. However, this methodis computationally expensive and phase assignment methoddescribed in this paper depends on accurate detection of Rpeaks, which may lead to problem when there are ectopicbeats in ECG (e.g. PAC/PVC). Real time ECG delineationproposed in [12], [13] can detect P wave with a reasonableaccuracy but their performance degrade significantly withincreased amount of noise.
Several methods have been proposed for QRS complexdetection as well. These include wavelet transform meth-ods [14]–[16], a derivative method [17], an adaptive filter-ing method [18], an empirical mode decomposition (EMD)method [19], a hidden Markov model approach [20], anda slope and amplitude method [21]. Many of these meth-ods require prior information about the ECG and are notadaptive to fluctuations in the ECG amplitude. Some arecomputationally expensive, while many of them also requirea training period. Most wavelet analysis is sensitive to intra-subject and inter-subject variations and fails to capture signalcharacteristics if waveforms do not match the chosen motherwavelet. Moreover, a simple EMD technique has a modemixing problem.
In this paper we proposed an efficient method to detectQRS complexes and P waves using the complete ensem-ble empirical mode decomposition with adaptive noise(CEEMDAN) method. Two separate signals are recon-structed for the QRS complexes and P waves, respectively,from different modes obtained by CEEMDAN decomposi-tion. The QRS complexes and P waves are then detected fromtheir respective signals. We used two well-known manuallyannotated ECG databases for validation of our proposedmethod.
The rest of the paper is organized as follows: in the Mate-rials and Methods section, we describe our algorithms forQRS complex and P-wave detection. The performance of ouralgorithms and comparison with other established algorithmsare presented in the Results section and perspectives areprovided in the Discussion section. Finally, a summary of ourfindings is provided in the Conclusions section.
II. MATERIAL AND METHODSA. DESCRIPTION OF DATASETSTwo well-known datasets have been used in this study todevelop and validate the proposed QRS complex and P wavedetection method.
1) MIT BIH ARRHYTHMIA DATABASEThe MIT-BIH arrythmia database consists of 48 half-hourslong datasets of two channel ambulatory ECG recordingswhich are obtained from 47 different subjects [22]. Out of 47subjects 25 were male aged 32 to 89 and 22 were femaleaged 22 to 89 (ECG records 201 and 202 came from thesame male subject). The source of the ECGs included inMITDB is a set of over 4000 long-term Holter recordingsthat were obtained by the Beth Israel Hospital ArrhythmiaLaboratory between 1975 and 1979, of which approximately60 % were obtained from inpatients and rest were obtainedfrom outpatients. 23 records of the database were chosen atrandom from this set with an intension to serve as a repre-sentative sample of the variety of waveforms and artifact thatan arrhythmia detector might encounter in routine clinical usewhile remaining 25 records were selected from the same set toinclude complex ventricular, junctional, and supraventriculararrhythmias and conduction abnormalities. The recordingswere digitized with a sampling frequency of 360 samplesper second and resolution of 11 bits over a 11 mv range.Each recording contains two leads: modified limb lead IIand one of V1, V2, V4 and V5 leads. For each of therecording there are two or more cardiologist’s annotations.Finally, disagreements among the annotations were resolvedto obtain a computer- readable reference annotations for eachbeat (approximately 110000 beats) which is included with thedatabase. This database has been widely used for validationof QRS detection algorithms [23].
2) THE QT DATABASEThe QT Database includes ECGs which were chosen to rep-resent a wide variety of QRS and ST-Tmorphologies. The QTDatabase contains 105 recordings which were primarily col-
128870 VOLUME 7, 2019
M. B. Hossain et al.: Accurate QRS Complex and P Wave Detection in ECG Signals Using Complete EEMD
lected from some existing databases, including the MIT-BIHArrhythmia Database, the European Society of CardiologyST-T Database, and several other ECG databases collected atBoston’s Beth Israel Deaconess Medical Center [22], [24].Some of the ECG records were also collected from holterrecordings of patients who experienced sudden cardiac deathduring the recordings, and age-and-gender matched patientswithout diagnosed cardiac disease. All the recordings weresampled at 250 Hz. Each of the records has at least 30 beatsannotated by cardiologists (ref1) who identified the begin-ning, peak and end of the P-wave, the beginning and end ofthe QRS-complex (the QRS fiducial mark, typically at theR wave peak, was given by an automated QRS detector),the peak and end of the T wave, and (if present) the peak andend of the U wave. The QTDB also includes an additionalannotation performed by a second cardiologist (ref2) for11 records out of total 105.The remaining 94 records haveonly a single set of expert annotations.
3) THE MIT-BIH NOISE STRESS TEST DATABASEThe MIT-BIH Noise Stress Test Database includes 12 half-hour ECG recordings and 3 half-hour recordings of noise intypical ambulatory ECG recordings [22], [25]. The noisesinclude baseline wander, muscle artifact and electrodemotionartifact which were made using physically active volunteersand standard ECG recorders, leads, and electrodes; the elec-trodes were placed on the limbs in positions in which sub-jects’ ECGs were not visible. Calibrated amounts of differentlevels of noise were added to the two clean ECG recordings(118,119) from the MIT-BIH Arrhythmia Database. Differ-ent levels of noise were added to each of the recordings tomake 6 different signals with different Signal-to-noise ratios(SNRs) (24, 18, 12, 6, 0, and 6 dB). All the ECG signalswere sampled with a sampling frequency of 360 samplesper second. The database contains beat annotations for eachof the files.
B. EMDHuang et al. [26] proposed the Hilbert-Huang transform,which is a signal processing tool that consists of two parts:EMD and the Hilbert transform. The latter is used to create ananalytical signal from real-valued data. In EMD, a signal x (t)is decomposed into a few intrinsic mode functions (IMFs).All the IMFs satisfy two conditions: (i) the number of extremaand number of zero crossings must be equal or differ by atmost one, and (ii) the mean value of the upper and lowerenvelops of a time series is zero. The IMFs can be extractedusing an iterative algorithm called the sifting algorithm. Theprocess is as follows.
1. Set r (t) = x (t)2. Find local maxima and minima of r(t)3. Find upper and lower envelops U(t) and L(t), respec-
tively4. Calculate mean value of upper and lower envelopes
µ =U (t)+ L(t)
2
5. Subtract the mean µ from the residue signal r(t)
IMF (t) = r (t)− µ
6. Update r(t), r (t) = r (t)−IMF(t) and go to step 2 andcontinue the process until the IMF satisfies conditions(i) and (ii).
This sifting process is continued until the stopping criteriais reached. The residue rK (t) after extraction of K IMFsbecomes either an IMF or a monotonic function. Thus, theoriginal signal x(t) can be reconstructed using all the IMFsand the final residue rK (t) is defined as follows:
x (t) =K∑k=1
IMFk (t)+ rK (t) (1)
where K is the number of IMFs.
C. CEEMDAN ALGORITHMOne of the major problems of EMD is called ‘mode mix-ing.’ For example, in the presence of disparate amplitudeoscillations in the original signal, similar oscillations are alsoobserved in the different modes. In order to overcome thisproblem, a new method called the Ensemble Empirical ModeDecomposition (EEMD) was proposed in [27], where EMDis performed over an ensemble of the signal plus Gaussianwhite noise (GWN). However, EEMD suffers from otherissues. For example, different realizations of the signal plusGWN may lead to a different number of modes and thereconstructed signal may also contain the residual noise.
These issues led to the development of the CompleteEnsemble Empirical Mode Decomposition with AdaptiveNoise (CEEMDAN) [28]. The CEEMDAN algorithm startsby assuming ηj(.) is the operator that produces the j-th modeobtained by EMD for a given signal. Then, the CEEMDANalgorithm is organized as follows:
1. Decompose N realizations x (t) + β0wi(t) by EMDand calculate their first mode. Then the first IMF ofCEEMDAN is given by
ˆIMF1 (t) =1N
N∑i=1
IMF i1 (t)
2. Calculate the first residue r1(t) using
r1 (t) = x (t)− ˆIMF1 (t)
3. Decompose realizations r1 (t)+ β1η1(wi(t)) where i=1, 2, 3, . . . , N and find their first mode. Then the secondIMF can be computed as follows
IMF2 (t) =1N
N∑i=1
η1(r1 (t)+ β1η1(wi (t)
))
4. For k = 2, . . . , K calculate the k-th residue using
rk (t) = rk−1 (t)− IMFk−1 (t)
VOLUME 7, 2019 128871
M. B. Hossain et al.: Accurate QRS Complex and P Wave Detection in ECG Signals Using Complete EEMD
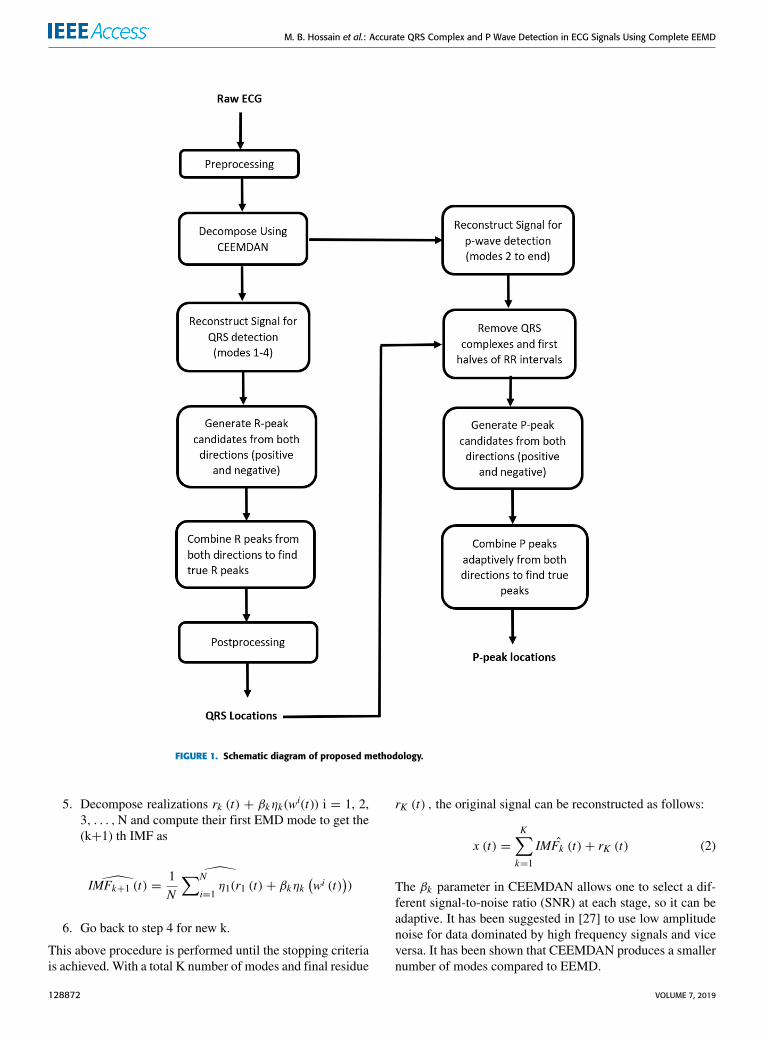
FIGURE 1. Schematic diagram of proposed methodology.
5. Decompose realizations rk (t) + βkηk (wi(t)) i = 1, 2,3, . . . ,N and compute their first EMD mode to get the(k+1) th IMF as
IMFk+1 (t) =
1N
∑N
i=1η1(r1 (t)+ βkηk
(wi (t)
))
6. Go back to step 4 for new k.
This above procedure is performed until the stopping criteriais achieved. With a total K number of modes and final residue
rK (t) , the original signal can be reconstructed as follows:
x (t) =K∑k=1
ˆIMFk (t)+ rK (t) (2)
The βk parameter in CEEMDAN allows one to select a dif-ferent signal-to-noise ratio (SNR) at each stage, so it can beadaptive. It has been suggested in [27] to use low amplitudenoise for data dominated by high frequency signals and viceversa. It has been shown that CEEMDAN produces a smallernumber of modes compared to EEMD.
128872 VOLUME 7, 2019

M. B. Hossain et al.: Accurate QRS Complex and P Wave Detection in ECG Signals Using Complete EEMD
FIGURE 2. Output of preprocessing stage using subject sel32m (highly affected by baseline wandering). (a) ECG with baseline wander. (b) PreprocessedECG signal.
D. DESCRIPTION OF ALGORITHMFig. 1 shows a flowchart representation of the proposedmethodology to detect QRS complexes and P waves. Thedifferent stages of the proposed methodology consist of:preprocessing, CEEMDAN decomposition, different signalreconstructions for QRS and P wave detection, QRS detec-tion, QRS complex removal for P wave detection, P wavedetection from both negative and positive sides of the signal,and adaptive combining of P waves detected from two sidesto find the true P waves. The detailed descriptions of eachstep are given in the following subsections.
1) PREPROCESSINGIn this stage baseline drift is removed from the raw ECGand the signal is standardized to zero mean and unit standarddeviation. For baseline drift removal we use two moving win-dow median filters with window sizes of 200 ms and 600 ms.The ECG signal is passed through these two different movingwindowmedian filters and then the average of the two outputsis subtracted from the original signal. The moving windowmedian filtering method has been found quite effective inremoving baseline wander [29]. Fig. 2 shows ECG signalsafter performing median filtering on the subject (Sel32) fromthe QTDB database.
2) DECOMPOSITION OF ECG USING CEEMDANThe preprocessed ECG signal is decomposed into a fewmodes using CEEMDAN. Fig. 3 shows an ECG signal for thesubject Sel16273, and all the modes obtained using CEEM-DAN decomposition. This figure clearly shows that the firstfew modes contain the high frequency components of thesignal while the last few modes carry the low frequencyinformation of the signal. Therefore, the first few modes are
FIGURE 3. CEEMDAN decomposition of preprocessed ECG. The first row isthe ECG signal which is decomposed into modes.
primarily used for QRS detection. It should be noted thatthe first mode (second row) mostly consists of noise. Thus,we use modes 2-5 to reconstruct the signal for QRS complexdetection, and all the modes except the first mode are usedto reconstruct the signal for subsequent P-wave detection.As the first mode of CEEMDAN carries the high frequencycomponent and exhibits characteristics of high-frequencynoise, reconstruction of the signal by leaving out the firstmode improves the SNR significantly. Consequently, furtherfiltering of the signal is not needed. Figs. 4(b) and 4(c)show reconstructed signals for QRS and P-wave detection,respectively. The reconstructed signal for the QRS complex
VOLUME 7, 2019 128873
M. B. Hossain et al.: Accurate QRS Complex and P Wave Detection in ECG Signals Using Complete EEMD
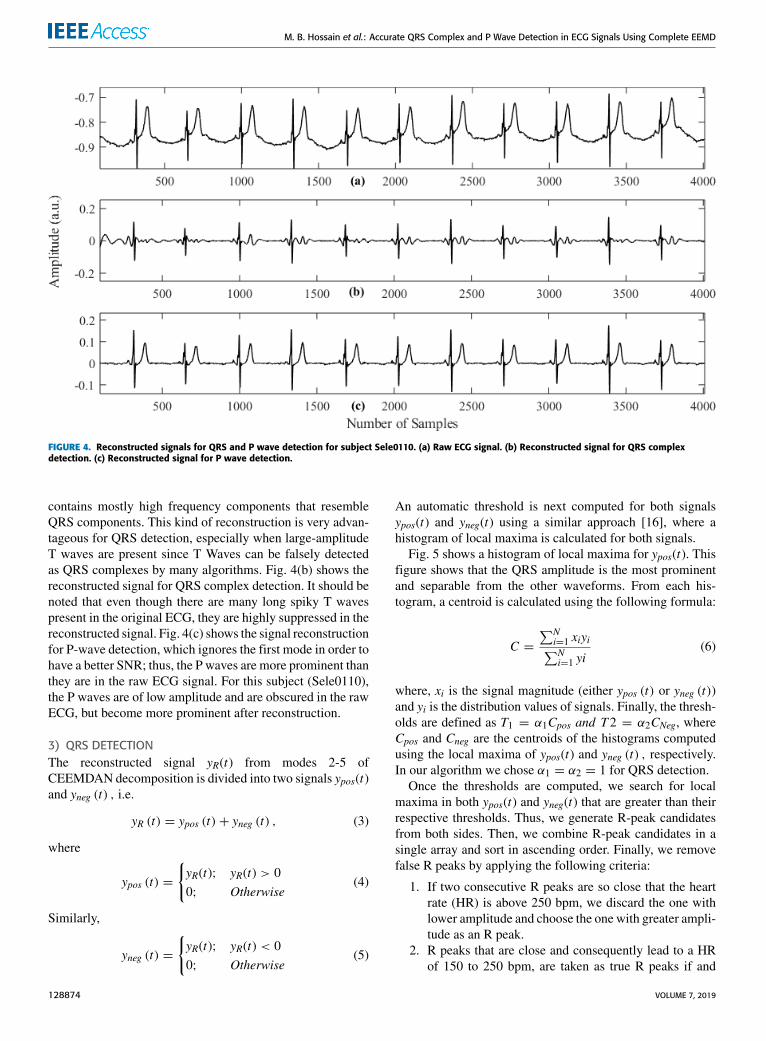
FIGURE 4. Reconstructed signals for QRS and P wave detection for subject Sele0110. (a) Raw ECG signal. (b) Reconstructed signal for QRS complexdetection. (c) Reconstructed signal for P wave detection.
contains mostly high frequency components that resembleQRS components. This kind of reconstruction is very advan-tageous for QRS detection, especially when large-amplitudeT waves are present since T Waves can be falsely detectedas QRS complexes by many algorithms. Fig. 4(b) shows thereconstructed signal for QRS complex detection. It should benoted that even though there are many long spiky T wavespresent in the original ECG, they are highly suppressed in thereconstructed signal. Fig. 4(c) shows the signal reconstructionfor P-wave detection, which ignores the first mode in order tohave a better SNR; thus, the P waves are more prominent thanthey are in the raw ECG signal. For this subject (Sele0110),the P waves are of low amplitude and are obscured in the rawECG, but become more prominent after reconstruction.
3) QRS DETECTIONThe reconstructed signal yR(t) from modes 2-5 ofCEEMDAN decomposition is divided into two signals ypos(t)and yneg (t) , i.e.
yR (t) = ypos (t)+ yneg (t) , (3)
where
ypos (t) =
{yR(t); yR(t) > 00; Otherwise
(4)
Similarly,
yneg (t) =
{yR(t); yR(t) < 00; Otherwise
(5)
An automatic threshold is next computed for both signalsypos(t) and yneg(t) using a similar approach [16], where ahistogram of local maxima is calculated for both signals.
Fig. 5 shows a histogram of local maxima for ypos(t). Thisfigure shows that the QRS amplitude is the most prominentand separable from the other waveforms. From each his-togram, a centroid is calculated using the following formula:
C =
∑Ni=1 xiyi∑Ni=1 yi
(6)
where, xi is the signal magnitude (either ypos (t) or yneg (t))and yi is the distribution values of signals. Finally, the thresh-olds are defined as T1 = α1Cpos and T2 = α2CNeg, whereCpos and Cneg are the centroids of the histograms computedusing the local maxima of ypos(t) and yneg (t) , respectively.In our algorithm we chose α1 = α2 = 1 for QRS detection.Once the thresholds are computed, we search for local
maxima in both ypos(t) and yneg(t) that are greater than theirrespective thresholds. Thus, we generate R-peak candidatesfrom both sides. Then, we combine R-peak candidates in asingle array and sort in ascending order. Finally, we removefalse R peaks by applying the following criteria:
1. If two consecutive R peaks are so close that the heartrate (HR) is above 250 bpm, we discard the one withlower amplitude and choose the one with greater ampli-tude as an R peak.
2. R peaks that are close and consequently lead to a HRof 150 to 250 bpm, are taken as true R peaks if and
128874 VOLUME 7, 2019

M. B. Hossain et al.: Accurate QRS Complex and P Wave Detection in ECG Signals Using Complete EEMD
FIGURE 5. Histogram of local maxima of ypos for subject Sel16273.
FIGURE 6. QRS complex detection on. (a) Subject Sele0110 (QTDB).(b) Subject 228m (MITDB). (c) Subject 210m (MITDB).
only if they satisfy the amplitude threshold of 60% ofthe mean of R-peak amplitudes.
Fig. 6 shows some of the critical cases where our algorithmcan successfully detect QRS complexes. Fig. 6(a) showsthe case of a spiky long T wave, which sometimes causesfalse positives for many existing algorithms. Fig. 6 (b) and(c) show the case where there are inconsistent R peaks withlow amplitude and high baseline wandering. In each of thecases, the proposed method detected R peaks without anyfalse positives.
4) P WAVE DETECTIONAs stated in the previous section, for P wave detection wereconstruct the signals by taking all modes from CEEMDAN
except the first. This is because a P wave amplitude is usuallylow compared to a QRS complex and it is affected by thefiltering procedure. After QRS locations have been deter-mined, the QRS complexes and the first half of each RRinterval are removed from the reconstructed signal for P wavedetection.
Then we divide the signal into two separate signals whichcontain positive and negative portions of the original signal,respectively. Then we generate P peak candidates from bothsides using a similar approach as the QRS detection in theprevious section (except α1 = α2 = 0.5). Finally, we extracttrue P peak locations using an adaptive heuristic methodwhich is described as follows:
1. Identify the P peak candidates within each RR intervalfrom both positive and negative sides.
2. Calculate the PR interval for each candidate and findthe deviation from the average PR interval of the pre-vious M (in our case M = 10) P waves.
3. If, for any candidate, the deviation goes above a thresh-old (±20 samples), it is discarded.
4. If more than one candidate satisfies the threshold,the one which has the smallest deviation is taken as thetrue P peak unless, for each of them, deviations are verylow (e.g. ± 8 samples). In the latter case, the one thathas the smallest deviation from the average amplitudeof the previous M P waves is taken as the true P peak.
The main advantage of this P wave detection algorithm is thata P wave is detected from both sides (positive and negative)and then they are combined adaptively to find the true Pwave. When we detect a P wave from the positive side,the negative amplitudes of the signal are not considered.Thus, if there is any spiky negative peak in the negative sideof the signal, which is most likely due to noise, it will notaffect the P wave detection, and similarly for the negativeside. Finally, we combine P wave candidates adaptively sothat the falsely detected peaks get filtered out in this pro-cess. Fig. 5 shows sample outputs of our P wave detec-tion algorithm on the subject Sel16272. The red dots in theupper plot represent P peaks detected from the positive sideand the green dots represent the P peak candidates detectedfrom the negative side. Fig. 7 (b) shows the true P peaksthat are detected after adaptive combining of the P wavecandidates.
One other advantage of our algorithm is that we can auto-matically classify P wave types. For example, if the P wavesare normal, we get consistent P peaks from the positive side,while for inverted P waves we get consistent P peaks fromthe negative side. In the case of biphasic P waves, we getP peaks from both sides. Fig. 6 shows P peak candidates inthree different cases (normal, inverted and biphasic). Here,red and green dots represent P peaks detected from positiveand negative sides, respectively. As we can see, when thereare normal P peaks, we get consistent P peak candidates fromthe positive side (a) and when there are inverted P waves weget P peak candidates from the negative side (b). In the case
VOLUME 7, 2019 128875

M. B. Hossain et al.: Accurate QRS Complex and P Wave Detection in ECG Signals Using Complete EEMD
FIGURE 7. Example of P wave detection on subject Sel16272. (a) P peakcandidates from positive and negative side (red and green dotsrespectively). (b) P peaks after adaptive true peak search.
FIGURE 8. P wave candidates detected for different types of P waves.(a) Normal P wave. (b) Inverted P wave. (c) Biphasic P wave (Red dotrepresents P-wave candidates from positive side and green dotrepresents P-wave candidates from the negative side).
of biphasic P waves we obtain consistent P peak candidatesfrom both the positive and negative sides (c).
E. VALIDATIONFor validation of our algorithmwe used theMIT-BIH arrhyth-mia database (MITDB) and the QT database (QTDB), whichare both publicly available. We used the MITDB for QRSdetection validation only and the QTDB for both QRS andP wave detection validation.
In order to make a fair comparison of our proposed methodwith the published methods, we only used the first channelof each recording for QRS detection. It should be noted thatwe excluded the ventricular flutter beats present in recording207, as mentioned in other works [15]. For QRS complexdetection in QTDB, we used 80 recordings (86,989 beats)and for P wave detection, we used 97 annotated recordings(3,194 beats). For QRS detection on QTDB, again, we onlyused the first channel in order to compare our algorithmwith the published works. For P wave detection we only
considered those data where annotations were available.In the case of P wave detection, we considered the detectedP wave as a true positive only if it was within the annotatedboundary of P onsets and offsets. As alreadymentioned previ-ously, QTDB has only 11 records for which there are two dif-ferent set of annotations. The rest of the records have only oneset of annotations (ref1). Therefore, in order to be consistent,we only used the first annotations. Our proposed algorithmfor P wave detection works for only one lead while the anno-tations were performed using all available leads. Therefore,in order to compare our automatic P wave detection withthe manual annotations, we get P peak location using bothchannels and finally for each point we chose the channelthat gives less deviation from manual annotations in P peakposition.
In order to asses QRS detection performance, we calcu-lated the total number of false positives (FP), false nega-tives (FN), and true positives (TP) and defined the followingparameters.
Sensitivity (se) =TP
TP+ FN× 100% (7)
PositvePredictivity (PPV ) =TP
TP+ FP× 100% (8)
Accuracy =TP
TP+ FP+ FN× 100% (9)
F1 = 2×PPV × SePPV + SE
(10)
III. RESULTSThe performance of our proposed QRS and P wave detectionmethods are given in Tables 1 and 2, respectively. For QRSdetection the entire data were used to evaluate the algorithm’sperformance.
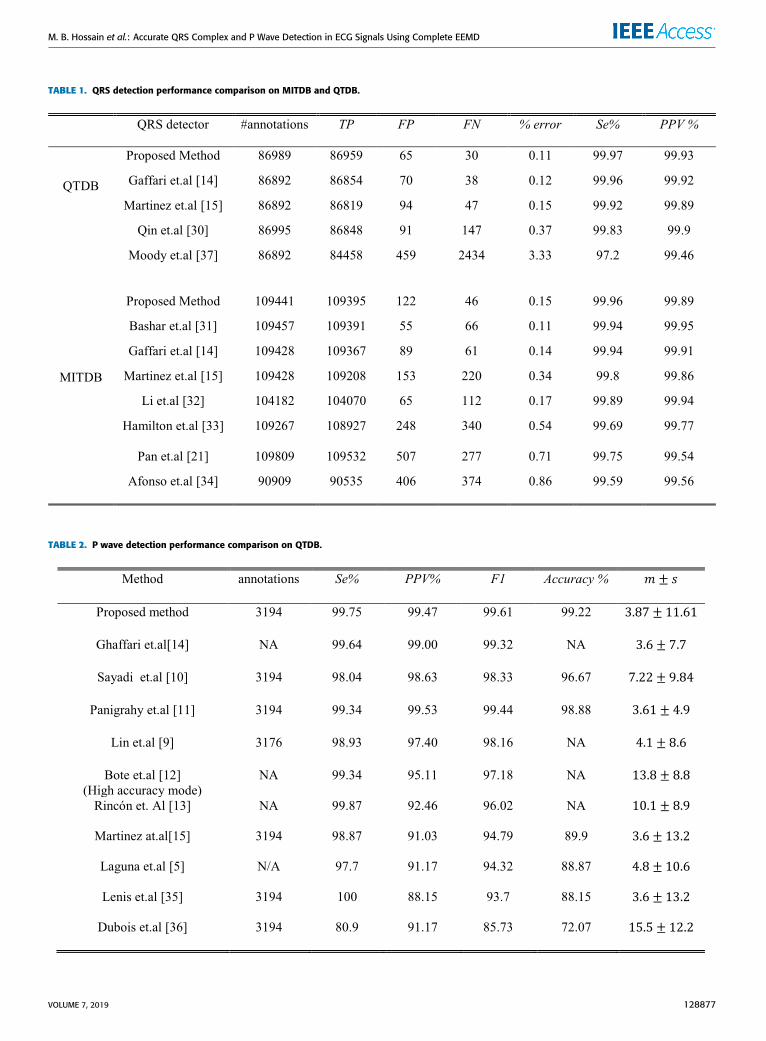
For theMITDB, our proposedQRS detector has the highestsensitivity (99.96%) among the published works. The PPVand percentage of error are 99.89% and 0.15%, respectively.Most of the false positives were due to spiky high frequencynoise and low amplitude R peaks. For the QTDB, our pro-posed algorithm is again found to be the most accurate inQRS detection among the published works. In the QTDB,the QRS detector has a sensitivity of 99.97%, positive pre-dictivity (PPV) of 99.93%, and error rate of 0.11%. It isfound to be very effective in detecting QRS complexes evenwhen there are some challenging scenarios including a lowamplitude QRS complex and in the presence of tall and spikyT waves.
For P wave detection evaluation, we compared our pro-posed method with other published methods in terms of sen-sitivity (Se), positive predictivity (PPV), detection accuracy,F1 score, and mean (m) and standard deviation of the dif-ference between annotated time and the algorithm’s detectedtime for P peaks. Table 2 shows the performance of P-wavedetection for the proposed algorithm. Our P wave detectionmethod has a sensitivity of 99.75%, PPV of 99.47%, accuracy99.22%, and F1 score of 99.61%. Overall performance of the
128876 VOLUME 7, 2019
M. B. Hossain et al.: Accurate QRS Complex and P Wave Detection in ECG Signals Using Complete EEMD
TABLE 1. QRS detection performance comparison on MITDB and QTDB.
TABLE 2. P wave detection performance comparison on QTDB.
VOLUME 7, 2019 128877
M. B. Hossain et al.: Accurate QRS Complex and P Wave Detection in ECG Signals Using Complete EEMD
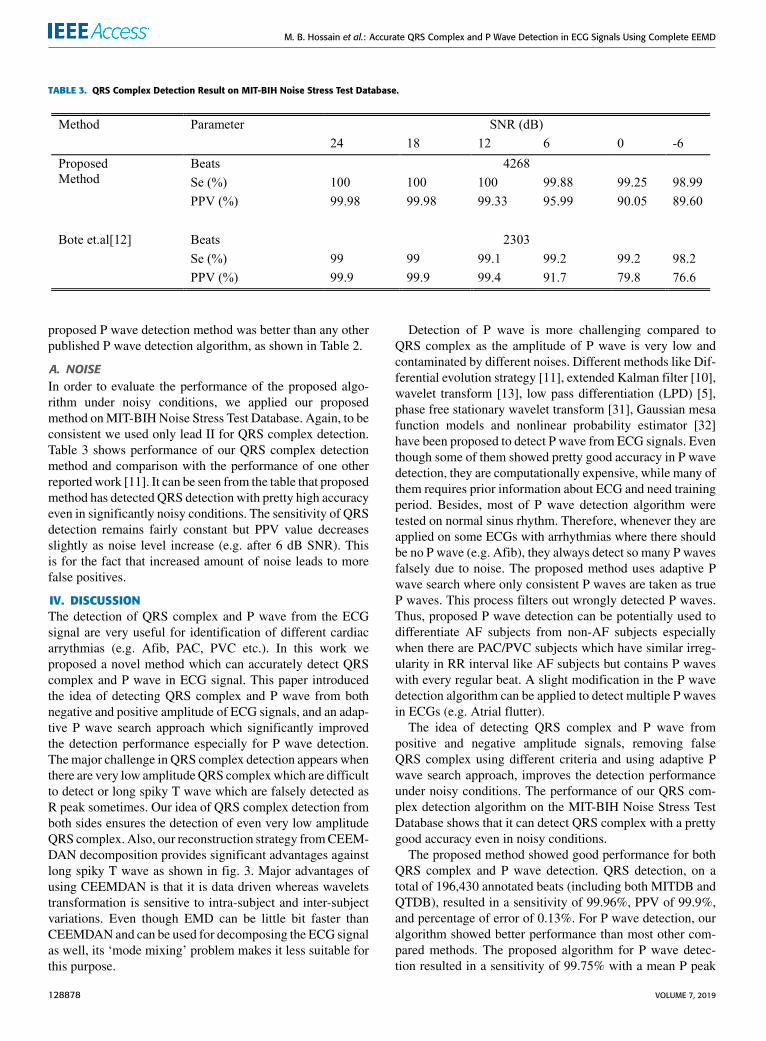
TABLE 3. QRS Complex Detection Result on MIT-BIH Noise Stress Test Database.
proposed P wave detection method was better than any otherpublished P wave detection algorithm, as shown in Table 2.
A. NOISEIn order to evaluate the performance of the proposed algo-rithm under noisy conditions, we applied our proposedmethod onMIT-BIHNoise Stress Test Database. Again, to beconsistent we used only lead II for QRS complex detection.Table 3 shows performance of our QRS complex detectionmethod and comparison with the performance of one otherreportedwork [11]. It can be seen from the table that proposedmethod has detected QRS detection with pretty high accuracyeven in significantly noisy conditions. The sensitivity of QRSdetection remains fairly constant but PPV value decreasesslightly as noise level increase (e.g. after 6 dB SNR). Thisis for the fact that increased amount of noise leads to morefalse positives.
IV. DISCUSSIONThe detection of QRS complex and P wave from the ECGsignal are very useful for identification of different cardiacarrythmias (e.g. Afib, PAC, PVC etc.). In this work weproposed a novel method which can accurately detect QRScomplex and P wave in ECG signal. This paper introducedthe idea of detecting QRS complex and P wave from bothnegative and positive amplitude of ECG signals, and an adap-tive P wave search approach which significantly improvedthe detection performance especially for P wave detection.Themajor challenge in QRS complex detection appears whenthere are very low amplitudeQRS complexwhich are difficultto detect or long spiky T wave which are falsely detected asR peak sometimes. Our idea of QRS complex detection fromboth sides ensures the detection of even very low amplitudeQRS complex. Also, our reconstruction strategy fromCEEM-DAN decomposition provides significant advantages againstlong spiky T wave as shown in fig. 3. Major advantages ofusing CEEMDAN is that it is data driven whereas waveletstransformation is sensitive to intra-subject and inter-subjectvariations. Even though EMD can be little bit faster thanCEEMDAN and can be used for decomposing the ECG signalas well, its ‘mode mixing’ problem makes it less suitable forthis purpose.
Detection of P wave is more challenging compared toQRS complex as the amplitude of P wave is very low andcontaminated by different noises. Different methods like Dif-ferential evolution strategy [11], extended Kalman filter [10],wavelet transform [13], low pass differentiation (LPD) [5],phase free stationary wavelet transform [31], Gaussian mesafunction models and nonlinear probability estimator [32]have been proposed to detect P wave from ECG signals. Eventhough some of them showed pretty good accuracy in P wavedetection, they are computationally expensive, while many ofthem requires prior information about ECG and need trainingperiod. Besides, most of P wave detection algorithm weretested on normal sinus rhythm. Therefore, whenever they areapplied on some ECGs with arrhythmias where there shouldbe no P wave (e.g. Afib), they always detect so many P wavesfalsely due to noise. The proposed method uses adaptive Pwave search where only consistent P waves are taken as trueP waves. This process filters out wrongly detected P waves.Thus, proposed P wave detection can be potentially used todifferentiate AF subjects from non-AF subjects especiallywhen there are PAC/PVC subjects which have similar irreg-ularity in RR interval like AF subjects but contains P waveswith every regular beat. A slight modification in the P wavedetection algorithm can be applied to detect multiple P wavesin ECGs (e.g. Atrial flutter).
The idea of detecting QRS complex and P wave frompositive and negative amplitude signals, removing falseQRS complex using different criteria and using adaptive Pwave search approach, improves the detection performanceunder noisy conditions. The performance of our QRS com-plex detection algorithm on the MIT-BIH Noise Stress TestDatabase shows that it can detect QRS complex with a prettygood accuracy even in noisy conditions.
The proposed method showed good performance for bothQRS complex and P wave detection. QRS detection, on atotal of 196,430 annotated beats (including both MITDB andQTDB), resulted in a sensitivity of 99.96%, PPV of 99.9%,and percentage of error of 0.13%. For P wave detection, ouralgorithm showed better performance than most other com-pared methods. The proposed algorithm for P wave detec-tion resulted in a sensitivity of 99.75% with a mean P peak
128878 VOLUME 7, 2019
M. B. Hossain et al.: Accurate QRS Complex and P Wave Detection in ECG Signals Using Complete EEMD
detection error of approximately one sample (4 ms) andstandard deviation less than or equal to 3 samples. Ourapproach also showed effective P wave detection for differentP wave types (i.e. normal, inverted and biphasic). Moreover,the adaptive search for true P peaks used in this work waseffective in reducing the number of false positives to a greatextent.
There are few limitations in our proposed method whichwe observed so far. One limitation is that we chose typicalpeak value around the P wave as the P peak which maynot be necessarily true always. We think this can be onereason why mean and standard deviation of P peak detectionerror is slightly worse than some of the published works.Secondly, even though our QRS detection achieved highestsensitivity (99.96%) among the published works in MITDB,it also detected more false positives (122) than some of thepublished methods. One possible reason for this can be thatwe developed our QRS and P wave detection algorithm basedon QTDB, and while evaluating performance on MITDB wedid not tune our algorithm any further.
V. CONCLUSIONIn this paper we presented a CEEMDAN-based QRS andP wave detector. Reconstruction of the signals for QRS andP wave detection using different subsets of modes fromCEEMDAN allowed better detection of these waveforms.We introduced the idea of P wave detection from both sides(positive and negative) and adaptive P peak search, which alsoenabled significant improvement in P-wave detection accu-racy when compared to other published algorithms. We val-idated our QRS detection on a total of 196,430 annotatedbeats and P wave detection on 3,194 beats. In both cases,we obtained promising results. In many cases, especially in Pwave detection, our algorithm performed significantly betterthan the published algorithms. Moreover, we showed that ourP wave detection algorithm can identify different types of Pwaves and automatically differentiate them. Future studiesshould apply our novel algorithm to improve arrhythmiadetection, for example P wave detection can potentially beused to differentiate irregular RR intervals as atrial fibrillation(if no P waves are present) or premature atrial or ventric-ular beasts (irregular beats among normal sinus beats withP waves), or estimation of PR intervals used for diagnosis ofeither AV delay, AV block, or ventricular pre-excitation.
REFERENCES[1] C. T. January, L. S. Wann, J. S. Alpert, H. Calkins, J. E. Cigarroa,
J. C. Cleveland, Jr., J. B. Conti, P. T. Ellinor, M. D. Ezekowitz, M. E. Field,K. T. Murray, R. L. Sacco, W. G. Stevenson, P. J. Tchou, C. M. Tracy,and C. W. Yancy, ‘‘2014 AHA/ACC/HRS guideline for the managementof patients with atrial fibrillation: Executive summary: A report of theAmerican College of Cardiology/American Heart Association Task Forceon practice guidelines and the heart rhythm society,’’ J. Amer. CollegeCardiol., vol. 64, no. 21, pp. 2246–2280, Dec. 2014.
[2] D. Mozaffarian et al., ‘‘Executive summary: Heart disease and strokestatistics–2015 update,’’Circulation, vol. 131, no. 4, p. e29-322, Jan. 2015.
[3] J. W. Chong, N. Esa, D. D. McManus, and K. H. Chon, ‘‘Arrhythmiadiscrimination using a smart phone,’’ IEEE J. Biomed. Health Inform.,vol. 19, no. 3, pp. 815–824, May 2015.
[4] N. V. Thakor and Y.-S. Zhu, ‘‘Applications of adaptive filtering to ECGanalysis: Noise cancellation and arrhythmia detection,’’ IEEE Trans.Biomed. Eng., vol. 38, no. 8, pp. 785–794, Aug. 1991.
[5] P. Laguna, R. Jané, and P. Caminal, ‘‘Automatic detection of waveboundaries in multilead ECG signals: validation with the CSE database,’’Comput. Biomed. Res. Int. J., vol. 27, no. 1, pp. 45–60, Feb. 1994.
[6] P. Trahanias and E. Skordalakis, ‘‘Syntactic pattern recognition ofthe ECG,’’ IEEE Trans. Pattern Anal. Mach. Intell., vol. 12, no. 7,pp. 648–657, Jul. 1990.
[7] K. Sternickel, ‘‘Automatic pattern recognition in ECG time series,’’Comput. Methods Programs Biomed., vol. 68, no. 2, pp. 109–115,May 2002.
[8] J. Dumont, A. I. Hernández, and G. Carrault, ‘‘Improving ECG beats delin-eation with an evolutionary optimization process,’’ IEEE Trans. Biomed.Eng., vol. 57, no. 3, pp. 607–615, Mar. 2010.
[9] C. Lin, C. Mailhes, and J.-Y. Tourneret, ‘‘P- and T-wave delineation inECG signals using a Bayesian approach and a partially collapsed Gibbssampler,’’ IEEE Trans. Biomed. Eng., vol. 57, no. 12, pp. 2840–2849,Dec. 2010.
[10] O. Sayadi and M. B. Shamsollahi, ‘‘A model-based Bayesian frameworkfor ECG beat segmentation,’’ Physiol. Meas., vol. 30, no. 3, pp. 335–352,Feb. 2009.
[11] D. Panigrahy and P. K. Sahu, ‘‘P and T wave detection and delineationof ECG signal using differential evolution (DE) optimization strategy,’’Australas. Phys. Eng. Sci. Med., vol. 41, no. 1, pp. 225–241, Mar. 2018.
[12] J. M. Bote, J. Recas, F. Rincón, D. Atienza, and R. Hermida, ‘‘A mod-ular low-complexity ecg delineation algorithm for real-time embeddedsystems,’’ IEEE J. Biomed. Health Inform., vol. 22, no. 2, pp. 429–441,Mar. 2018.
[13] F. Rincón, J. Recas, N. Khaled, and D. Atienza, ‘‘Development and evalua-tion of multilead wavelet-based ECG delineation algorithms for embeddedwireless sensor nodes,’’ IEEE Trans. Inf. Technol. Biomed., vol. 15, no. 6,pp. 854–863, Nov. 2011.
[14] A. Ghaffari, M. R. Homaeinezhad, M. Khazraee, and M. M. Daevaeiha,‘‘Segmentation of holter ECG waves via analysis of a discrete wavelet-derived multiple skewness–kurtosis based metric,’’ Ann. Biomed. Eng.,vol. 38, no. 4, pp. 1497–1510, Apr. 2010.
[15] J. P. Martínez, R. Almeida, S. Olmos, A. P. Rocha, and P. Laguna,‘‘A wavelet-based ECG delineator: Evaluation on standard databases,’’IEEE Trans. Biomed. Eng., vol. 51, no. 4, pp. 570–581, Apr. 2004.
[16] M. Yochum, C. Renaud, and S. Jacquir, ‘‘Automatic detection of P, QRSand T patterns in 12 leads ECG signal based on CWT,’’ Biomed. SignalProcess. Control, vol. 25, pp. 46–52, Mar. 2016.
[17] N. M. Arzeno, Z.-D. Deng, and C.-S. Poon, ‘‘Analysis of first-derivativebased QRS detection algorithms,’’ IEEE Trans. Biomed. Eng., vol. 55,no. 2, pp. 478–484, Feb. 2008.
[18] K. Arbateni andA. Bennia, ‘‘Sigmoidal radial basis functionANN for QRScomplex detection,’’ Neurocomputing, vol. 145, pp. 438–450, Dec. 2014.
[19] H. Xing and M. Huang, ‘‘A new QRS detection algorithm based onempirical mode decomposition,’’ in Proc. 2nd Int. Conf. Bioinf. Biomed.Eng., 2008, pp. 693–696.
[20] G. de Lannoy, B. Frenay, M. Verleysen, and J. Delbeke, ‘‘Supervised ECGdelineation using the wavelet transform and hidden Markov models,’’ inProc. 4th Eur. Conf. Int. Fed. Med. Biol. Eng., 2009, pp. 22–25.
[21] J. Pan and W. J. Tompkins, ‘‘A real-time QRS detection algorithm,’’ IEEETrans. Biomed. Eng., vol. BME-32, no. 3, pp. 230–236, Mar. 1985.
[22] A. L. Goldberger, L. A. Amaral, L. Glass, J. M. Hausdorff, P. C.Ivanov, R. G. Mark, J. E. Mietus, G. B. Moody, C. K. Peng, andH. E. Stanley, ‘‘PhysioBank, PhysioToolkit, and PhysioNet: Componentsof a new research resource for complex physiologic signals,’’ Circulation,vol. 101, no. 23, pp. e215–e220, Jun. 2000.
[23] G. B. Moody and R. G. Mark, ‘‘The impact of the MIT-BIH arrhyth-mia database,’’ IEEE Eng. Med. Biol. Mag., vol. 20, no. 3, pp. 45–50,May 2001.
[24] P. Laguna, R. G. Mark, A. Goldberg, and G. B. Moody, ‘‘A databasefor evaluation of algorithms for measurement of QT and other waveformintervals in the ECG,’’ in Proc. Comput. Cardiol., 1997, pp. 673–676.
[25] G. B. Moody, W. Muldrow, and R. G. Mark, ‘‘A noise stress test forarrhythmia detectors,’’Comput. Cardiol., vol. 11, no. 3, pp. 381–384, 1984.
[26] N. E. Huang, Z. Shen, S. R. Long, M. C. Wu, H. H. Shih, Q. Zheng,N.-C. Yen, C. C. Tung, and H. H. Liu, ‘‘The empirical mode decompositionand the Hilbert spectrum for nonlinear and non-stationary time seriesanalysis,’’ Proc. Roy. Soc. London A, Math., Phys. Eng. Sci., vol. 454,no. 1971, pp. 903–995, Mar. 1998.
VOLUME 7, 2019 128879

M. B. Hossain et al.: Accurate QRS Complex and P Wave Detection in ECG Signals Using Complete EEMD
[27] Z. Wu and N. E. Huang, ‘‘Ensemble empirical mode decomposition:A noise-assisted data analysis method,’’ Adv. Adapt. Data Anal., vol. 1,no. 1, pp. 1–41, Jan. 2009.
[28] M. E. Torres, M. A. Colominas, G. Schlotthauer, and P. Flandrin,‘‘A complete ensemble empirical mode decomposition with adaptivenoise,’’ in Proc. IEEE Int. Conf. Acoust., Speech Signal Process. (ICASSP),May 2011, pp. 4144–4147.
[29] A. E. Awodeyi, S. R. Alty, and M. Ghavami, ‘‘Median filter approach forremoval of baseline wander in photoplethysmography signals,’’ in Proc.Eur. Modelling Symp., 2013, pp. 261–264.
[30] Q. Qin, J. Li, Y. Yue, and C. Liu, ‘‘An adaptive and time-efficientECG R-peak detection algorithm,’’ J. Healthcare Eng., vol. 2017,Sep. 2017, Art. no. 5980541. Accessed: May 14, 2019 [Online]. Available:https://www.hindawi.com/journals/jhe/2017/5980541/
[31] S. K. Bashar, Y. Noh, A. J. Walkey, D. D. McManus, and K. H. Chon,‘‘VERB: VFCDM-based electrocardiogram reconstruction and beat detec-tion algorithm,’’ IEEE Access, vol. 7, pp. 13856–13866, 2019.
[32] C. Li, C. Zheng, and C. Tai, ‘‘Detection of ECG characteristic points usingwavelet transforms,’’ IEEE Trans. Biomed. Eng., vol. 42, no. 1, pp. 21–28,Jan. 1995.
[33] P. S. Hamilton and W. J. Tompkins, ‘‘Quantitative investigation of QRSdetection rules using the MIT/BIH arrhythmia database,’’ IEEE Trans.Biomed. Eng., vol. BME-33, no. 12, pp. 1157–1165, Dec. 1986.
[34] V. X. Afonso, W. J. Tompkins, T. Q. Nguyen, and S. Luo, ‘‘ECG beatdetection using filter banks,’’ IEEE Trans. Biomed. Eng., vol. 46, no. 2,pp. 192–202, Feb. 1999.
[35] G. Lenis, N. Pilia, T. Oesterlein, A. Luik, C. Schmitt, and O. Dössel,‘‘P wave detection and delineation in the ECG based on the phase freestationary wavelet transform and using intracardiac atrial electrograms asreference,’’ Biomed. Eng./Biomedizinische Tech., vol. 61, no. 1, pp. 37–56,Feb. 2016.
[36] R. Dubois, P. Maison-Blanche, B. Quenet, and G. Dreyfus, ‘‘AutomaticECG wave extraction in long-term recordings using Gaussian mesa func-tion models and nonlinear probability estimators,’’ Comput. Methods Pro-grams Biomed., vol. 88, no. 3, pp. 217–233, Dec. 2007.
[37] G. B. Moody and R. G. Mark, ‘‘Development and evaluation of a 2-leadECG analysis program,’’ in Proc. Comput. Cardiol., 1982, pp. 39–44.
MD BILLAL HOSSAIN received the B.S. degreein electrical and electronic engineering from theBangladesh University of Engineering and Tech-nology. He is currently pursuing the Ph.D. degreewith the University Connecticut, Storrs, CT, USA.
SYED KHAIRUL BASHAR received the B.S.degree in electrical and electronic engineeringfrom the Bangladesh University of Engineeringand Technology. He is currently pursuing the Ph.D.degree with the University of Connecticut, Storrs,CT, USA.
ALLAN J. WALKEY is currently an Assistant Professor of medicine with theBoston University School of Medicine. His research interests involve cardiaccomplication of critical illness, critical care epidemiology, and comparativeeffectiveness research methodology.
DAVID D. MCMANUS is currently an Associate Professor of medicine withthe University of Massachusetts Medical School, Worcester, MA, USA. Hisresearch interests include arrhythmia ablation, brady and tachyarrhythmias,and cardiac devices.
KI H. CHON received the B.S. degree in electrical engineering from theUniversity of Connecticut, Storrs, CT, USA, the M.S. degree in biomedicalengineering from the University of Iowa, Iowa City, and the M.S. degree inelectrical engineering and the Ph.D. degree in biomedical engineering fromthe University of Southern California, Los Angeles.
He is currently the John and Donna Krenicki Chair Professor and theHead of biomedical engineering with the University of Connecticut. He isa Co-Founder of Mobile Sense Technologies, TIP Center, Farmington, CT,USA. The company has recently been granted both NIH and NSF SBIRgrants. He is a fellow of the American Institute of Medical and Biologi-cal Engineering and the International Academy of Medical and BiologicalEngineering. He has chaired many international conferences, including theProgram Co-Chair for the IEEE EMBS Conference, NYC, in 2006, and theConference Chair for the 6th International Workshop on Biosignal Interpre-tation, New Haven, CT, USA, in 2009. He was an Associate Editor of theIEEE TRANSACTIONS ON BIOMEDICAL ENGINEERING, from 2007 to 2013.
128880 VOLUME 7, 2019