an acoustic analysis of siwu · pdf filean acoustic analysis of siwu vowels pascal kpodo...
TRANSCRIPT

Nordic Journal of African Studies 22(3): 177–195 (2013)
An Acoustic Analysis of Siwu Vowels Pascal KPODO
University of Education, Winneba, Ghana
ABSTRACT This paper presents a systematic description of the 11 vowel phonemes (seven oral and four nasal vowels) of Siwu, the language of the people of Akpafu and Lolobi through a spectrographic analysis. The paper determines on scientific basis, the underlying acoustic parameters that characterize the vowel system of Siwu. The result of the study defines the acoustic vowel space of the language and shows that, the vowels are adequately dispersed within the vowel space as predicted by the maximal dispersion theory. The result further reveals that there are no significant dialectal differences between the two towns, (Akpafu and Lolobi) that constitute the Siwu language community – on the acoustic level. Keywords: Siwu, spectrographic analysis, vowel space, dispersion.
1. INTRODUCTION The main aim of this paper is to establish a precise and systematic description of the quality of the vowels of the Siwu language through spectrographic analysis. The study will determine on scientific basis the underlying acoustic parameters that characterize the vowel system of the language.
Siwu is one of the Ghana-Togo Mountain languages (GTM). These languages, formerly called Togorestsprachen (Togo Remnant Languages) and Central Togo languages, are a group of about fourteen languages spoken in the mountains of the Ghana-Togo borderland. These languages are part of the Kwa subgroup of the Volta-Comoe branch of the Niger Congo language family.
Siwu is spoken by the people of Akpafu and Lolobi. Siwu is closely related to Sɛkpɛle (the language of the people of Likpe) and Lelemi. According to the 2000 population census, there are about 16,779 indigenous speakers of Siwu in the Hohoe district of the Volta Region. The people of Akpafu and Lolobi call themselves Mawu. Akpafu and Lolobi represent two mutually intelligible dialect areas of the Siwu language. The Mawu people live in eight towns within the Hohoe district of the Volta region. Along the Hohoe-Jasikan road, lie Mempeasem, Todzi and Odomi. The rest are Hunyasem, Adorkor, Ashiambi, Sɔkpoo and Kumasi. All eight Siwu towns are located within 7-15 miles north of Hohoe. The boundaries of Akpafu and Lolobi traditional areas stretch along the mountains north of Santrokofi, and the ridges up to the forest reserve, east of Nkonya. They share a common boundary with Bowiri and Buem to the north, Likpe to the east and to the south Ewe (for Lolobi) and Santrokofi (for Akpafu).

Nordic Journal of African Studies
178
The Mawu people are peasant farmers who grow hilly crops such as brown rice, cocoa, corn, cassava, yam, and plantain. Besides farming, the Mawu people take pride in having been involved in an indigenous iron industry, which collapsed toward the end of the nineteenth century due to the influx of cheap European steel products. Remains of iron mining, smelting, and forging activities can still be seen in Todzi, the oldest Mawu town and the only one that is still atop the mountain (All Mawu towns were once located on top of the mountains).
The Siwu language, according to the classification by Heine (1968), belongs to the Na-Togo Sub-group of the Ghana Togo Mountain languages. Just like Santrokofi, Logba and Avatime, almost all the speakers of Siwu are bilingual in Siwu and Ewe (the predominant language in the region). Siwu has a seven phonemic oral vowel system which consists of [i, e, ɛ, a, u, o, ɔ]. These vowels are traditionally classified as high front [i], high back [u], mid front [e, ɛ] mid back [o, ɔ] and the central low [a].
Since spectrographic analysis became available, there is the natural tendency to try to relate what was known as articulatory properties to what is now being investigated as acoustic or spectral properties (Delattre 1951). Strengthening the position, Ladefoged (1993), asserts that the traditional articulatory description of vowels is not very satisfactory. He points out that vowels described as “high” across languages do not have the same height, and that the so-called “back” vowels vary considerably in their degree of backness. He maintains that the front/back and high/low dimensions used to contrast vowels of languages are best described using acoustic terms. Referring to the height of the tongue and the front/back description of vowels, Ladefoged states that "There is no doubt these terms are appropriate for describing the relationships between different vowel qualities, but to some extent, phoneticians may have been using these terms and labels to specify acoustic dimensions rather than as descriptions of actual tongue positions".
Lado (1957) presented a systematic technique to compare two sound systems. In the tradition of contrastive analysis, Lado predicted that careful analysis of two separate sound systems of (L1 and L2) will allow the prediction, detection and correction of pronunciation problems for L2 learners. He suggested that such analysis must involve many factors relating to the sound system, such as phonetics, phonemic sequences of phonemes and intonation patterns. For Lado, the goal of such analysis is to improve foreign language instruction and create better learning materials for learners.
According to Akpanglo-Nartey (2006), the main concern of every language teacher is that he presents the structure of the language(s) he teaches as truthfully as possible. He adds that an accurate description of the language must be made available to the language teacher at all levels of grammar including, phonetic, phonological, morphological, syntactic and semantic levels. In the light of this, the present study will help in the design and development of syllabus for the teaching and learning of English as a second language with this
An Acoustic Analysis of Siwu Vowels
179
language community. It will also help in the design and development of syllabus for the teaching and learning of Siwu as courses of study in this language community.
Since it has been established that there are quality differences among vowels transcribed with similar symbols in different languages, there is the need for an adequate instrumental study to give precise and systematic description of the vowels of each language. The present study will therefore show these differences.
2.1 DATA COLLECTION The speakers were randomly picked and interviewed. Out of the interview 40 speakers, 20 males and 20 females who are between the ages of 20 and 60years were selected from the two main towns of the Siwu language community for the recording; that is, 10 males and 10 females from each town in order to ensure gender balance among speakers. The equal number of males and females is to ensure balanced frequency values for the vowels. This is because for female voices, the formant frequency values are about 10 to 15% higher, on account of the fact that the resonance cavities in the female vocal tract are smaller (shorter) by about 10 to 15% than those of male speakers. Many studies of vowel quality that confirm this cross-linguistic difference in the vowels of males and females abounds in the literature: (Chiba & Kajiyama, 1941; Fant, 1960, 1965, 1975; Cox, 2002). Even though Akpanglo-Nartey, R. A. (2012) agrees with the finding that gender affects vowel quality, she found that the difference between male and female are not consistent for all vowel types and thus concludes that gender may not be entirely responsible for such differences. The effect of gender is not discussed in the present paper. However, in order to get frequency values that will be the truest representation of a people of a language community, there must be a balance between the male and female population. All the selected subjects demonstrated normal speech and hearing abilities. The subjects are all natives who have been living in these towns and have been using the Siwu language for their daily interactions.
The procedure in this study is modeled after Peterson & Barney (1952), replicated by Wells, (1962). Wells conducted a spectrographic study on the pure vowels of British English as embedded in /h-d/ monosyllabic words. He noted that vowels are found to be characterized by peaks of energy around the frequencies corresponding to the natural frequencies of the supraglottal cavities, as they move during the articulation of the sounds concerned and these frequency bands are the formants. He also noted that different vowels are characterized by different formant frequencies and by peaks of energy at different frequencies. According to his explanation, different shapes of the vocal tract and the different positions of the tongue are characterized by their varying corresponding frequency responses and pass bands which give rise to different

Nordic Journal of African Studies
180
formants. He stated that in order to be able to specify the vowel sounds of a language in acoustic terms, it is necessary to state, among other things, the frequencies of at least some of the formant characteristics of those vowels.
The study analyzed the 11 vowel phonemes of the Siwu language. These include seven oral and four nasal vowels. These vowels were placed in CV contexts for production. Words exemplifying the seven oral and four nasal vowel contrasts were selected such that the target vowels are preceded by [b]. The combination of the target vowels and the consonants resulted in the following series of words; bi, be, bɛ, ba, bɔ, bo, bu, bı,̃ bɛ̃, bã, bɔ̃, for both oral and nasal vowels. The words containing the target vowels were embedded in the carrier frame, “kpere—tutuutu” meaning ‘say—exactly’ where the target vowel occupies the blank space. Each sentence containing the target vowel was written on a card and was presented to the speakers to read. Each sentence repeated three times yielding a total of 33 tokens of target vowels per speaker, that is, 11 vowels in three repetitions for each vowel. 660 vowel tokens were obtained for the 11 vowels for each dialect community of Siwu. In all, 1320 vowel tokens were elicited from the 40 native speakers who were selected from Akpafu and Lolobi.
The subjects were made to read the carrier sentences as naturally as possible for the recording. The English gloss of each test word containing the target vowels was written in parenthesis beneath each test word. This is to eliminate any type of ambiguity that may occur as a result of tonal variations.
The recordings were made by a Sony IC recorder in a quiet room. The volume of the microphone was controlled and a consistent mouth-to-microphone distance was maintained for all speakers.
2.2 DATA PRESENTATION Measurements of vowels were taken using a computer-based acoustic analysis system (Kay Elemetrics, CLS-4500). Each vowel sample was fed from the Sony IC recorder (IDC-MS 252) into a computer interfaced with a Computerized Speech Lab (CSL-4500) at a sampling rate of 11025Hz. The Computerized Speech Lab (CSL) produces a graphic display of a speech sample which is conventionally called a spectrogram.
Formant resonances of vowels and the effects of changes in pitch and vocal effort were exemplified in spectrograms of natural speech. The spectrograph provides a spectral analysis (spectrogram) of the energy present at each frequency or band of frequencies within a complex acoustic signal. It is possible to analyze sounds so that one can measure the actual frequencies of formants. Vowels are segmented to show the visual representation of their component formant frequencies in wideband spectrograms. The first two formants were measured using the Kay Elemetrics Multi Speech System. For each vowel token, a steady state portion was found near the midpoint of the vowel. The midpoints

An Acoustic Analysis of Siwu Vowels
181
of the target vowels were selected so as to minimize the influence of the adjacent segments and also minimize any transitional effect on the vowels.
Figure 1 shows the spectrogram for a male speaker from Lolobi producing the vowel [o] in the utterance “kpere bo tutuutu” in three repetitions with the waveform in the top box and the wideband spectrographic representation in the bottom box.
Figure 1. Waveform and spectrogram of Lolobi male speaker 2 saying ‘kpere bο tutuutu’ in three repetitions. Waveforms and spectrograms are very useful representations in an acoustic study. The waveforms show variations in air pressure as the speaker makes the utterances. Periods of vibration of the vocal cords were shown by vertical pulses whereas period of silence are shown by a single horizontal line. The wideband spectrogram also shows vertical striations which represent the vibrations of the vocal cords during the utterance. The signals in both boxes were synchronized, mapping each waveform onto its spectrographic representation.
On the spectrogram, a time scale (with an arbitrary starting point) is shown along the bottom of the picture, and the vertical scale shows the frequencies in Hertz (Hz). The relative intensity of each component frequency is shown by the darkness of the mark. As a result, the formants show up as dark horizontal bars. From the bottom of the horizontal bar, the first two formants are said to determine the quality of vowels whereas the higher ones: fourth, fifth, etc. are not known to be linguistically significant.
The First formant, (F1), inversely corresponds to vowel height (openness) while the second formant, (F2), corresponds to backness. The formant frequency values of formant one (F1) and formant two (F2) of the individual vowels per dialect were tabulated. The distance between formants two and one were also
calculated. The distance between F1 and F2 (F2') is found to be more directly related to vowel frontness than the F2 (Lindau, 1978; Clark & Yallop, 1990). Formant one values were plotted on the vertical axis (ordinate) against the
difference between formants two and one (F2-F1) F2' on the horizontal axis (abscissa).

Nordic Journal of African Studies
182
The Statistical Program for Social Sciences (SPSS) software package was used for the analysis. A one-way analysis of variance (ANOVA) was conducted to determine the means and standard deviation values for each vowel (oral and nasalized) and variations within the language. This information was used for the description of the vowels. Tukey Post Hoc tests for significant differences were performed separately on F1 and F2 values for overlapping vowel pairs.
3. RESULTS Formant frequency values for the two lowest formants (F1 and F2) were measured. The F2' (F2-F1) values for each of the three repetitions of each vowel per speaker was calculated. The results of these measurements are presented in a form of tables and figures. The tables contain the means and standard deviations of the F1 and F2' (F2-F1) of all vowel tokens.
The figures present the F1 values plotted against the F2' values which are on the vertical and the horizontal axes respectively. The means and the standard
deviations of F1 and F2' were used in the plotting of the vowels on the Bark scale and also in drawing Ellipses for each vowel. Ellipses were drawn using
two standard deviation values of F1 and F2', covering about 97% of the area within which tokens of each vowel were scattered. Levels of significance are used to show significant differences between the vowels of the individual communities as well as between the two communities. All the descriptions of vowels are based on normalized data taking into consideration, the means, standard deviations and the level of significance.
3.1 AKPAFU VOWELS Table 1. F1 and F2̍ means and standard deviations of the formant frequency values of each oral vowel of Akpafu.
F i e ɛ a ɔ o u
F1 Mean 309 406 549 729 583 404 333
Std.Dev. 40 46 57 81 70 50 41
F2ˈ Mean 1995 1745 1411 805 449 501 521
Std.Dev. 224 212 172 145 87 63 107
Table 1 presents the summary of the means and standard deviations of F1 and
F2' values of each of the seven oral vowels uttered by the twenty speakers of the Akpafu town. These values are used in plotting the vowel points indicated on the Akpafu vowel chart (Figure 2) described here. Figure 2 shows the Akpafu oral

An Acoustic Analysis of Siwu Vowels
183
F2’(F2-F1)Hz
(F1
)Hz
vowel space plotted as ellipses using two standard deviation values of an average of 58 tokens per vowel. The ellipses cover about 97% of the areas within which the tokens of each vowel are located. The ellipses drawn around the individual vowels reveal that there are overlaps between adjacent front vowels as well as the adjacent back vowels. The overlapping between the front vowels are similar to the overlapping of the back vowels.
Figure 2. Ellipses of Akpafu oral vowels.
Figure 2 shows the mean plots of each of the seven oral vowels of Akpafu uttered by the twenty speakers. There are three front vowels [i, e, ɛ], three back vowels [u, o, ɔ] and one central vowel [a]. The front high vowel [i] is more front than [e] which is located below it. [i] is located at 309Hz on the vertical axis and at 1995Hz on the horizontal axis. [ɛ] is located below [e] and slightly less front. The space between [e] and [ɛ] is wider than the space between [i] and [e]. [a] which is located at 729Hz on the vertical axis and at 805Hz on the horizontal axis, is positioned far below [ɛ] and [ɔ]. Table 2. F1 and F2ɑ means and standard deviations of the formant frequency values of each nasal vowel of the Akpafu dialect of Siwu. F
ı ̃ ɛ ̃ ã ɔ ̃F1 Mean 390 464 685 543
Std.Dev. 34 64 59 87
F2ˈ Mean 1872 1734 689 403
Std.Dev. 362 161 79 75

Nordic Journal of African Studies
184
F2’(F2-F1)Hz
(F1
)Hz
F2’(F2-F1)Hz
On the part of the back vowels, the high front vowel [u] is located high above and less back than [o]. The back high vowel [u] is slightly lower than its front counterpart, [i]. The space between [u] and its adjacent vowel [o] is similar to the space between their front counterparts [i] and [e]. [ɔ] is located far below [o]. It is the most back of the three back vowels.
Table 2 further presents the summary of the means and the standard deviations of the F1 and F2ˈ values of each of the four nasal vowels of Akpafu. The nasal vowels include [ı]̃, [ɛ]̃, [ã] and [ɔ̃]. Ellipses drawn around these vowels show a strong overlap between [ı]̃ and [ɛ]̃.
Figure 3. Ellipses of Akpafu nasal vowels. As can be seen from figure 3, Akpafu has two front nasal vowels, [ĩ, ɛ]̃, one back nasalized vowel, [ɔ̃] and one central nasal vowel [ã]. [ĩ] is a high front vowel which located above and slightly more front than [ɛ]̃. The ellipses show [ã] standing distinctly separate from its comparable vowel, [ɔ̃]. [ã] is located at the low central position of the nasal vowel space. [ɔ̃] is a mid-low back vowel.
Figure 4 shows the comparison between the oral and nasal vowels of Akpafu. As indicated by the figure, the differences between the oral vowels and the nasal counterparts do not follow any systematic pattern. While the front high vowel [i] is higher and more front than its nasal counterpart [ı]̃, the mid-low front vowel [ɛ] is rather lower and less front than its nasal counterpart [ɛ]̃. [a] is lower and less back than its nasal counterpart[ã]. [ɔ] and [ɔ]̃ seemed to be located at almost the same position in terms of height with the nasal [ɔ̃] occurring just a little more back.

An Acoustic Analysis of Siwu Vowels
185
F2’(F2-F1)Hz
F1
Hz
F2’(F2-F1)Hz
Oral Nasalized
Figure 4. Akpafu oral and nasal vowel space.
3.2 LOLOBI VOWELS The vowels of Lolobi were recorded from twenty speakers (ten men and ten women) between the ages of 20 and 60years. All the speakers were natives of Lolobi who spent almost all their lives within the Lolobi community. The results obtained after normalizing the data are presented in the Tables 3–4 and Figure 5–8. Table 3. F1 and F2ɑ means and standard deviations of the formant frequency values of each oral vowel of Lolobi.
F
i e ɛ a ɔ o u
F1 Mean 314 406 549 770 583 404 333
Std.Dev. 40 46 57 81 70 50 41
F2ˈ Mean 1992 1745 1411 726 449 501 521
Std.Dev. 224 212 172 145 87 63 107
Table 3 presents the summary of the means and standard deviations of F1 and
F2ɑ values of each of the seven oral vowels uttered by the twenty speakers from the Lolobi dialect community.

Nordic Journal of African Studies
186
F2’(F2-F1)Hz
(F1
)Hz
Figure 5. Ellipses of Lolobi vowels. Figure 5 shows the vowel space of Lolobi vowels plotted using the means and standard deviations of the F1 and F2ˈ values presented in table 3 above. The ellipses show an overlap between adjacent vowels such as [i, e] and [e, ɛ] in the front as well as [u, o] and [o, ɔ] at the back region of the vowel space. The ellipsis drawn around [a] stands alone even though it can be inferred that there is a slight interdependence between [a] and [ɔ] in terms of height.
Lolobi has three front vowels [i, e, ɛ], three back vowels [u, o, ɔ] and one central vowel, [a]. The front high vowel, [i] is higher and clearly more front than its comparable vowel, [e]. [i] which is located at 314Hz on the vertical axis and at 1992Hz on the horizontal axis is also slightly higher than its back counterpart, [u]. [i], [e] and [ɛ] are clearly distinct from one another. The figure shows that, the distance between [i] and [e] is similar to the distance between [e] and [ɛ]. [a] is located very low, at 770Hz on the vertical axis and 726Hz on the horizontal axis. As already seen in the ellipses of this dialect, (figure 3.2.1), the production of [a] is quite unstable, since it can be uttered at a point as low as 900Hz and as high as 600Hz in the F1 dimension. Even though the high back vowel [u] a little lower than its front counterpart, it is distant enough from [a] as to allow a distinctive distribution of [o] and [ɔ] in between them. However, the space between [u] and [o] is not as wide as the space between their front counterparts, [i] and [e]. The space between [o] and [ɔ] is wider than the space between [u] and [o]. [ɔ] is the most back of all the back vowel with [u] being the least back.

An Acoustic Analysis of Siwu Vowels
187
F2’(F2-F1)Hz
F1
Hz
Table 4. F1 and F2ɑ means and standard deviations of the formant frequency values of each nasal vowel of the Lolobi dialect of Siwu.
F
ı ̃
ɛ ̃ ã ɔ ̃
F1 Mean 402 523 723
543
Std.Dev. 47 97 58.71
87
F2ˈ Mean 1883 1586 646
403
Std.Dev. 348 245 63.25
75
The means and standard deviations of the F1 and F2ɑ of the formant frequency values of the nasalized vowels uttered by the speakers of Lolobi are presented in table 4.
Figure 6. Ellipses of Lolobi nasal vowels. Lolobi nasal vowel space as shown by the ellipses is quite similar to that of the Akpafu nasal vowel space. There is an overlap between the ellipses drawn around [ı̃] and [ɛ]̃. The ellipses of [ı]̃ and [ɛ]̃ are quite big suggesting that the tokens of these two vowels cover very wide areas. Some tokens of [ĩ] scatter between 1200Hz and 2600Hz in the F2ˈ dimension whilst the tokens of [ɛ]̃ scattered between 300Hz and 700Hz in the F1 dimension.

Nordic Journal of African Studies
188
F2’(F2-F1)HzF2’(F2-F1)Hz
(F1
)Hz
Oral Nasalized
Figure 7. Lolobi oral and nasal vowel space. A comparison between the oral and the nasal vowel spaces of Lolobi is displayed in figure 7. [ı]̃ is lower than its oral counterpart. [ı]̃ is located at the same place as [e] on the vertical axis. [ɛ]̃ is rather higher than its oral counterpart, thereby shrinking the space between itself and [ı̃]. While [ı]̃ is less front than its oral counterpart, [ɛ]̃ is rather more front than its oral counterpart, [ɛ]. On the part of the central low nasalized vowel [ã], it is located higher and less central than its oral counterpart. [ɔ]̃ is also higher and more back than its oral counterpart. The distance between [a] and [ɔ] is very similar to the distance between their nasalized counterparts [ã] and [ɔ̃].

An Acoustic Analysis of Siwu Vowels
189
F2’(F2-F1)Hz
F1
Hz
3.3 THE VOWELS OF SIWU Table 5. F1 and F2ɑ means and standard deviations of the formant frequency values of each oral vowel of Siwu.
F
i e ɛ a ɔ o u
F1 Mean 310 403 537 766 572 414 326
Std.Dev. 50 46 64 79 64 57 55
F2ˈ Mean 1993 1750 1431 765 411 469 514
Std.Dev. 256 198 181 158 94 78 95
The Siwu language is made up of two dialects, Akpafu and Lolobi. Table 5
presents the means and standard deviations of F1 and F2ɑ values of the seven oral vowels of the Siwu uttered by the twenty speakers each from Akpafu and Lolobi.
Figure 8. Ellipses of Siwu vowels. Figure 8 presents the vowels of Siwu plotted as ellipses using the means and standard deviation values of an average of 116 tokens per vowel. The ellipses show an overlap between almost all adjacent vowels. This suggests that there is an intersection of the areas covered by the tokens of [i - e], [e - ɛ], [u - o] as well as [o - ɔ]. The ellipses drawn around the front high vowel, [i] and the low central vowel [a], are very wide because of the difference between female and male values.

Nordic Journal of African Studies
190
The mean locations of the vowels of Siwu as produced by the twenty speakers from Akpafu and Lolobi established that Siwu has three front and three back vowels as well as one central vowel. The highest front vowel is [i] which is also the most front of the three front vowels. It is located at 310Hz on the vertical axis and at 1993Hz on the horizontal axis. The front high vowel [i] is also slightly higher than its back counterpart [u]. The low central vowel [a] is very distant from [i] thereby allowing a fairly remote distribution of [e] and [ɛ] in between them. [a] is located at 766Hz on the vertical axis and at 765Hz on the horizontal axis. [e] is located higher and more front than [ɛ]. The space between [e] and [ɛ] is slightly wider than the space between [i] and [e].
The low central vowel [a] is slightly closer to [ɔ] than it is to [ɛ]. [ɔ] is the most back of three back vowels and is located below [o]. The back high vowel [u] is the least back and the highest of the back vowels. [u] is located at 326Hz on the vertical axis and at 514Hz on the horizontal axis. Just like their front counterparts, the space between [ɔ] and [o] is wider than that of [u] and [o]. It is clearly observable that all the front vowels are slightly higher than their back counterparts. The three point vowels [i, a, u] are located at the three corners of the vowel space with the other vowels occurring in between them. Table 6. F1 and F2ɑ means and standard deviations of the formant frequency values of each nasal vowel of Siwu. F
ı ̃ ɛ ̃ ã ɔ ̃
F1 Mean 396 488 704 543
Std.Dev. 41 82 60 84
F2ˈ Mean 1878 1673 667 403
Std.Dev. 343 206 73 72
Table 6 presents the summary of the means and standard deviations of the F1
and F2ɑ values of each of the nasal vowels uttered by the twenty speakers from Siwu. These nasal vowels include two front vowels, [ı]̃, [ɛ]̃, one central vowel [ã] and one back vowel [ɔ̃].

An Acoustic Analysis of Siwu Vowels
191
F2’(F2-F1)Hz
(F1
)Hz
F2’(F2-F1)Hz
Figure 9. Ellipses of the nasal vowels of Siwu.
Figure 9 shows the means and standard deviations of F1 and F2ɑ of the Siwu nasal vowels plot as ellipses using two standard deviations. [ı̃], the high front vowel is located at 396Hz on the vertical axis and at 343Hz on the horizontal. [ɛ]̃ is located closer to [ı]̃ than to [ã] since there is no vowel in between [ı]̃ and [ɛ]̃. This explains why the ellipses of [ı]̃ and [ɛ]̃ overlapped Table 7. Results of Tukey Post Hoc comparing F1 and F2ɑ means values separately for the oral vowels of Siwu. Vowel F1/Height F2ɑ/Backness i – e 0.000 0.000 e - ɛ 0.000 0.000 ɛ - a 0.000 0.000 a - ɔ 0.000 0.000 ɔ - o 0.000 0.488 o – u 0.000 0.792
The results of the Post Hoc Test performed on the oral comparable vowel pairs are presented in table 7. At a confidence level of 95%, the results show that in terms of height, all the comparable vowels are clearly distinct from one another, in spite of the overlapping displayed by the ellipses. There is a slight
interdependence between [ɔ - o] in the F2ɑ dimension at 0.488.
Nordic Journal of African Studies
192
F2’(F2-F1)Hz
(F1
)Hz
F2’(F2-F1)Hz
(F1
)Hz
Akpafu Lolobi
F2’(F2-F1)Hz
(F1
)Hz
Siwu
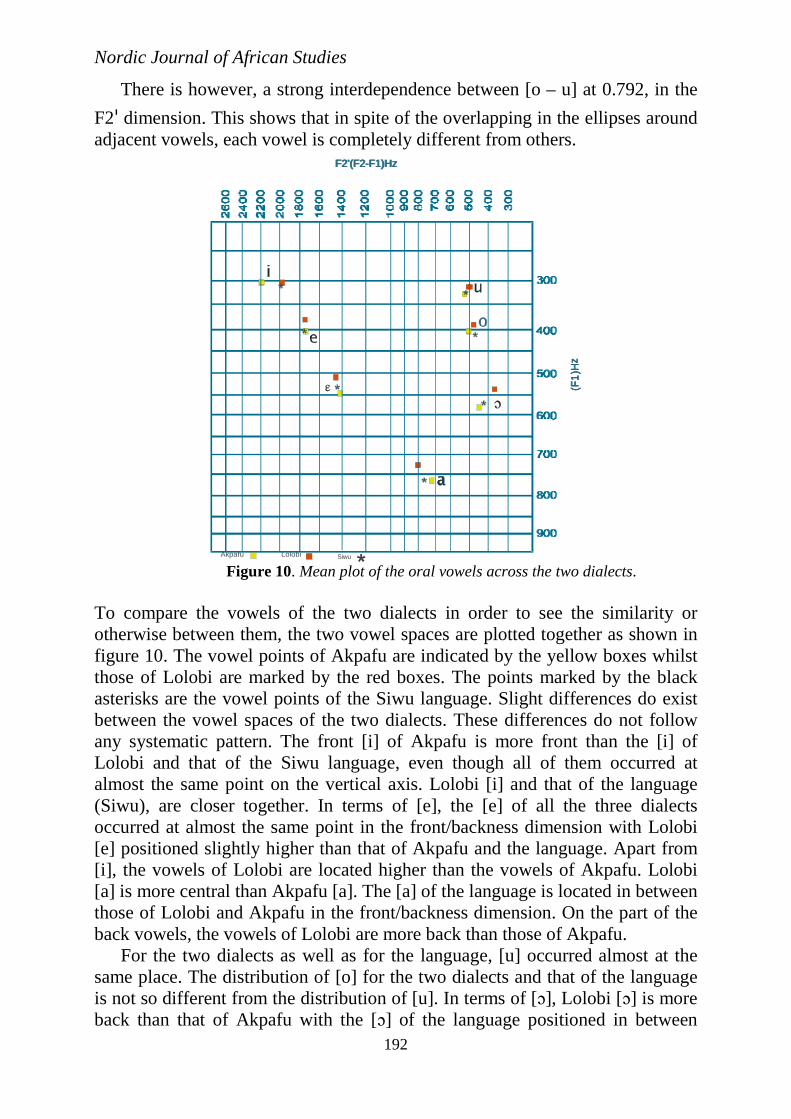
There is however, a strong interdependence between [o – u] at 0.792, in the
F2ɑ dimension. This shows that in spite of the overlapping in the ellipses around adjacent vowels, each vowel is completely different from others.
Figure 10. Mean plot of the oral vowels across the two dialects. To compare the vowels of the two dialects in order to see the similarity or otherwise between them, the two vowel spaces are plotted together as shown in figure 10. The vowel points of Akpafu are indicated by the yellow boxes whilst those of Lolobi are marked by the red boxes. The points marked by the black asterisks are the vowel points of the Siwu language. Slight differences do exist between the vowel spaces of the two dialects. These differences do not follow any systematic pattern. The front [i] of Akpafu is more front than the [i] of Lolobi and that of the Siwu language, even though all of them occurred at almost the same point on the vertical axis. Lolobi [i] and that of the language (Siwu), are closer together. In terms of [e], the [e] of all the three dialects occurred at almost the same point in the front/backness dimension with Lolobi [e] positioned slightly higher than that of Akpafu and the language. Apart from [i], the vowels of Lolobi are located higher than the vowels of Akpafu. Lolobi [a] is more central than Akpafu [a]. The [a] of the language is located in between those of Lolobi and Akpafu in the front/backness dimension. On the part of the back vowels, the vowels of Lolobi are more back than those of Akpafu.
For the two dialects as well as for the language, [u] occurred almost at the same place. The distribution of [o] for the two dialects and that of the language is not so different from the distribution of [u]. In terms of [ɔ], Lolobi [ɔ] is more back than that of Akpafu with the [ɔ] of the language positioned in between

An Acoustic Analysis of Siwu Vowels
193
them. To find out whether these differences are significant enough to make the vowels of one dialect distinctively different from the vowels of the other dialect, a pair test is conducted on the individual vowels of the two dialects. Table 8. Tukey Post Hoc Test comparing F1 and F2ɑ mean values for individual sounds across the two communities.
Vowels Communities F1/Height F2ɑ/Backness i Akpafu - Lolobi 1.000 1.000 e Akpafu - Lolobi 0.970 1.000 ɛ Akpafu - Lolobi 0.478 1.000 a Akpafu - Lolobi 0.528 0.944 ɔ Akpafu - Lolobi 0.383 0.892 o Akpafu - Lolobi 1.000 0.962 u Akpafu - Lolobi 0.999 1.000
The results of the one-way analysis of variance test carried out to determine how significantly different are the vowels of one dialect from the vowels of the other are presented in table 8. The results show that, the vowels of the two dialects are virtually the same. There is however, some slight difference between the two dialects in relation to the height of [ɛ], [ɔ] and [a]. This difference is however, not significant enough to make us consider the vowels of the two dialects as different from each other.
4. CONCLUSION There are four distinctive vowel heights established from the analysis of the Siwu vowels. The difference between the front vowels and the back vowels in terms of height, follow a systematic pattern. All the front vowels are slightly higher than their back counterparts. The high front vowel [i] is the highest and most front of the front vowels and it is also higher than its back counterpart [u]. [u] is located in the high BACK position and [ɔ] is the most back of the back vowels. The vowels of Siwu occupy quite a wide space.
On the individual dialectal level, the two dialects (Akpafu and Lolobi) use similar vowel spaces. In terms of height, all the Lolobi vowels except [i] are located slightly higher than the Akpafu vowels. It is pertinent to note that, the consistent and almost systematic difference between the vowels of the two dialects in terms of height is however insignificant. Akpafu [i] is located at the same position as Lolobi [i] in terms of height. However, Akpafu [i] is slightly more front than the Lolobi [i]. The vowel points of the two dialects are located very close to the mean plots.
Comparing the nasalized vowels to their oral counterparts in the two dialects of Siwu, it has been observed that [ɛ]̃ is located higher than its oral counterpart [ɛ].This discovery run counter to the findings of Gbegble, N. (2006) and

Nordic Journal of African Studies
194
Akpanglo-Nartey, R. A. (2006) in Ewe and GaDangme respectively in which for at least front vowels, the nasal vowels are located lower than their oral counterparts. However, according to Jackson, E. M (2008), some exceptions must be expected for whatever is considered a cross-linguistic tendency, no matter how strong. Further investigation is therefore required to be able to explain which principles are responsible for this deviation in the location of the front mid low nasal vowel in Siwu.
The vowels of Siwu, a seven oral vowel inventory language, are “sufficiently” dispersed in the acoustic vowel space confirming the claim by Lindblom (1990) that phonetic values should show more variations in small than in large systems. In spite of the slight overlaps between adjacent vowels, the Siwu space demonstrates an adaptive dispersion of vowels indicating a sufficient perceptual contrast between the vowels.
REFERENCES Akpanglo-Nartey, J.N. 2006.
Application of Phonetics in Language Education in Ghana. UEW PAL 1: 1–8.
Akpanglo-Nartey, R.A. 2012. Gender Effect on Vowel Queality:A case Study of Ghanaian English. Canadian Journal on Scientific and Industrial Research 3(3): 142–150.
2006 Vowels in GaDangme: A Spectrographic Study. Papers in Applied Linguistics 1: 9–93. University of Education, Winneba.
Chiba, T and Kajiyama M. 1941. The Vowel: its Nature and Structure. Tokyo Publishing Company, Tokyo.
Clark, J. and Yallop, C. 1990. An Introduction to Phonetics and Phonology. Oxford: Basil Blackwell.
Cox, F. 2002. A Description of Acoustic Charateristics of /hVd/ vowels in Australian English. Sydney. Macquarie University.
Delattre, P. 1951. The Psychological Interpretation of Sound Spectragrams. PMLA 66: 864–75.
Fant, G. 1960. Acoustic Theory of speech Production. The Hague: Mouton
1965 Formants and cavities. Proceedings of the Fifth International Congress of Phonetic Sciences. Basle: Karger, pp. 120–141.
1975 Non-uniform vowel normalization. Speech Transmission Laboratory, Quarterly Progress Status Report 2–3: 1–19.

An Acoustic Analysis of Siwu Vowels
195
Gbegble, Nada. 2006. Spectographic Analysis of Ewe Vowels. Papers in Applied Linguistics 1: 94–175. University of Education, Winneba.
Heine, Bernd. 1968. Die Verbreitung und Gliederung der Togorestsprachen. Berlin: Reimer.
Jackson, Eric M. 2008. Dispersion in the Vowel System of Pima. UCLA Working Papers in Phonetics 107: 31–55. http://www.escholarship.org/uc/item/3tt2m1vs.
Ladefoged, P. 1993. A Course in Phonetics. 3rd Ed. Orlando: Harcourt Brace Jovanovich College Publishers.
Lado, Robert. 1957. How to compare two sound systems. Linguistics Across Cultures: Applied Linguistics for Language Teachers. Ann Arbor: University of Michigan Press.
Lindau, M. 1978. Vowel Features. Language 54: 541–563.
Lindblom B. 1990. “Models of phonetic variation and selection.” Phonetic Experimental Research, Institute of Linguistics, University of Stockholm 11, pp. 101–118.
Peterson, G. and Barney, H.L. 1952. Control Methods Used in a Study of Vowels. Journal of the Acoustic society of America 20: 528–535.
Wells, J.C. 1962. A Study of the formants of the pure vowels of British English. University of London.
About the author: Pascal Kpodo holds an M.Phil in applied linguistics and a B.ed degree in Ghanaian Language Education from the University of Education, Winneba. Currently, he is a lecturer in the Department of Ewe Education of the University of Education, Winneba.