an algal assay technique for aquatic toxicants - illinois state water
TRANSCRIPT

REPORT OF INVESTIGATION 101
An Algal Assay Technique for Aquatic Toxicants
by WUNCHENGWANG
Title: An Algal Assay Technique forAquatic Toxicants. Abstract: A technique was developed for algal toxicity assays. Algal communities obtained from several sewage treatment plants and surface waters were the test specimens. The toxicant used was zinc acetate The techniques that were developed are relatively simple, rapid, and precise. Algal responses to toxicants were measured by changes in oxygen production, and two types of responses were observed. The variations in response are caused primarily by the degree of prior acclimation of the algae to the toxicant. Reference: Wang, Wuncheng. An Algal Assay Technique for Aquatic Toxicants. Illinois State Water Survey, Champaign, Report of Investigation 101, 1982.
Indexing Terms: Algae, algal assay, algal toxicity, methodology, oxygen production, zinc.
STATE OF ILLINOIS HON. JAMES R. THOMPSON, Governor
DEPARTMENT OF ENERGY AND NATURAL RESOURCES MICHAEL B. WITTE, B.A.. Director
BOARD OF NATURAL RESOURCES AND CONSERVATION
Michael B. Witte, B.A., Chairman
Walter E. Hanson, M.S., Engineering
Laurence L. Sloss, Ph.D., Geology
H. S. Gutowsky, Ph.D., Chemistry
Lorin I. Nevling, Ph.D., Forestry
Robert L. Metcalf, Ph.D., Biology
Daniel C. Drucker, Ph.D. University of Illinois
John C. Guyon, Ph.D. Southern Illinois University
STATE WATER SURVEY DIVISION STANLEY A. CHANGNON, JR., M.S., Chief
CHAMPAIGN 1982
Printed by authority of the State of Illinois (7-82-350)
CONTENTS
PAGE
Summary 1 Introduction 1
Scope of study 2 Justification for the study 2 Acknowledgments 3
Literature review 3 Experimental methods 4
Samples 5 Inoculation and incubation 5 Experimental design 7 Analyses 7
Results: Development of methodology 9 Blank test 9 Toxicity expression 9 Peoria samples 9 Farmington samples 13 Illinois River samples 13 Lake Eureka sample 13 Length of incubation 17 Levels of algal inoculum 17 Summary of methodology 17
Results: Causes of variations in response • 21 Theoretical considerations 21 Transinoculation without acclimation 23
Hypothesis 23 Results 23
Transinoculation with acclimation 23 Hypothesis 1 23
Results 23 Hypothesis 2 23
Results 23 Hypothesis 3 27
Results 27 Discussion 27 References 29
An Algal Assay Technique for Aquatic Toxicants
by Wuncheng Wang
SUMMARY
The objective of this study was to develop a methodology for assaying the toxic effects of selected substances on algal communities. The sources of algae included the Greater Peoria Sanitary District and Farmington sewage treatment plants, the Illinois River, and Lake Eureka. Thus heterogeneous algal communities were used in contrast to the unialgal approach. Zinc was selected as the toxicant.
Variations in results were caused by differences in the sources of algae, the season during which collections were made, the amount of inoculum, and the length of incubation. The results show that algal sources and seasonal differences are important, while the amount of inoculum and the length of incubation are less important.
During the study, it soon became obvious that the response of algae to zinc differed between the Peoria and Farmington sources. As part of this study, an attempt was made to determine the cause of this variation. To do this reliance was placed mainly on the transinoculation technique, both with and without the acclimation of algae to a new environment. The initial results established that algae, not the host water, are the cause of variations in response.
It was speculated that the algae from the Farmington source were not acclimated to zinc, whereas those from the Peoria source were so acclimated. It was subsequently found that when the Farmington algae were acclimated to high zinc concentrations, their response was similar to that of the Peoria algae, and when the Peoria algae were acclimated to low zinc concentrations, their response was like that of the Farmington-type algae. This proves that the variation of algal response to zinc in a natural environment is a function of the algae's acclimation to zinc.
INTRODUCTION
Algal assay as a means of assessing the toxicity of water-borne substances is a relatively new approach. During the late 1960s and early 1970s the major interests in algal studies were in eutrophication and resultant algal growth. In other words, algal assay procedures were used primarily for evaluating bio-stimulation effects. Through the combined efforts of a federal-industry-university joint task force, a protocol for algal assay was published (National Eutrophication Research Program, 1971). In Illinois, the State Water Survey conducted a parallel yet independent study on the algal growth potential methodology. The results were published (Wang et al., 1973) and the method was further tested (Wang, 1974). The major difference in methodologies between that
1

proposed by the joint task force and that developed by the State Water Survey is that the former adopted a single algal species approach while the latter relied on algal communities of natural origin.
Since the early 1970s our environmental awareness, resulting from several pollution incidents, has led to the passage of the Toxic Substance Control Act and other legislative measures. The act calls for "premanufacturing notification" of toxicity data for those chemical substances a company intends to market. This act is based on a noble principle, but there is a problem with it: the lack of a generally accepted testing methodology. For example, Kenaga and Moolenaar (1979) tested over 49,000 chemical compounds on the alga Chlorella and reported that only 3 compounds were toxic at concentrations less than 1 mg/1. Upon close scrutiny, however, it becomes obvious that the method they used for algal assay for toxicity is extremely crude: color change after 2 weeks of chemical treatment was the criterion of toxicity effect. Algal color is primarily due to chlorophyll pigments, which because of slow decomposition have no relation to algal viability. For example, autoclaving of algal samples produces very little color change. Does this suggest that the algae are still alive?
Although algal toxicity assay has been incorporated as a tentative procedure in Standard Methods for the Examination of Water and Wastewater (American Public Health Association, 1975), the methodology is not unlike algal productivity assays. There is an obvious need for an alternative to the Standard Methods procedure, and this report presents the detailed results of an effort to develop an alternative.
Scope of Study
The study was conducted primarily with algal samples obtained from the Peoria and Farmington sewage treatment plants. Occasionally samples were also taken from the Illinois River and Lake Eureka. The work was performed during the spring and summer of 1980, coinciding with the maximum algal growth period. The total endeavor included 1 set of algal samples from Lake Eureka, 3 from the Illinois River, 8 from Peoria, and 15 from Farmington. This report covers all essential aspects of the study.
The report is divided into two major parts. The first part deals with the development of the methodology for algal assay. Because reproducibility is of primary concern for the method, the experiments were repeated quite frequently, as indicated by the number of sample sets.
During the study, it soon became obvious that there were two modes of algal response to zinc, caused by differences in the sources of algae. These differences were investigated, and the second major part of the report presents the results of experiments designed to explain the differences. The validity of two theories was investigated.
Justification for the Study
There are several reasons for pursuing algal assays. First, algae are the primary producers in Illinois waters, and their well-being is linked directly with the health of the aquatic environment. Because of their importance as sources of dissolved oxygen
2
and their prominence as a segment in the food chain, it is important to identify their tolerance to substances that are introduced into the aquatic environment. Second, there does not appear to be a reliable methodology for assessing the effects of various substances on algae. And, finally, the work of the Water Survey on algal growth potential and acute toxicity of various substances to fishes suggests that algal assay work is a natural extension of the Survey's experience.
Acknowledgments This study was conducted under the general supervision of Ralph L. Evans,
Head of the Water Quality Section, and Stanley A. Changnon, Jr., Chief, Illinois State Water Survey. Rick Twait and Gene Brooks did all the sampling, and Davis Beuscher counted and keyed the algal samples. Special thanks are due Ken Matousek of the Greater Peoria Sanitary District for his assistance in obtaining the Peoria samples. Linda Johnson typed the original manuscript, Gail Taylor edited the manuscript, and Marilyn Innes prepared the camera copy. The illustrations were prepared by John Brother, Jr., and William Motherway, Jr.
LITERATURE REVIEW
It is not the intent here to provide an exhaustive literature review regarding algal toxicity assays. However, a brief review of relevant literature is in order to aid in developing a perspective.
A most important aspect of zinc chemistry is its solubility; its soluble form is considered more toxic than its insoluble form (Cairns et al., 1971). Reed et al. (1980) provide a rather detailed review of zinc chemistry and zinc toxicity as part of their acute toxicity work on fishes. Since zinc is an amphoteric metal, its solubility is governed by pH. Zinc does not become a part of oxidation-reduction reactions in the environment, and the extent of its chelation or complexation activity in the environment is not known. The zinc ion may be adsorbed by various particulate matter, although it is considered quite soluble.
Hendricks (1978) determined the response of Selenastrum capricornutum to zinc sulfide by observing changes in oxygen production. This is a measurement of physiological activity, in contrast to the enumeration of algal cells either by visual or electronic counting, chlorophyll measurement either in vivo or in vitro, or the gravimetric measure of algal mass. The appeal of this method is in its rapidity and precision. It is not very accurate because the useful data involve only two digits.
Cooksey and Cooksey (1978) reported on growth-limiting substances in sediment extracts by assaying the response of diatoms. Cultures were counted after one week to determine changes in density. Sediments were found to be inhibitory, stimulatory, or ineffectual depending on the season. Although the results varied, the study represents a new approach for testing the effects of environmental substrates on algae.
3

Sudo and Okada (undated) investigated the contribution of sediment to lake eutrophication by using the blue-green alga Microcystis aeruginosa, a common alga in eutrophic lakes and reservoirs in Japan. Chelating agents in Gorham's medium were found to be necessary for the growth of M. aeruginosa. It was determined that the organic substances in sediments, especially fluvic acid, play the same role as chelating agents in the growth medium.
Kamatani et al. (1979) used three species of diatoms for estimating zinc toxicity. They determined diatom growth by cell enumeration. The diatoms required 0.1 jug/1 zinc for normal growth. The growth of Thalassiosira decipiens ceased completely at 5 mg/1 of zinc. The growth of Phaeoductylum tricornutum decreased by 50 percent at 5 mg/1 zinc.
Rachlin and Farran (1974) measured the toxicity of zinc to Chlorella vulgaris by counting cells after 96 hours' exposure. They observed a 50 percent reduction in growth at a zinc concentration of 2.4 ± 0.02 mg/1.
Chiaudani and Vighi (1978) used Selenastrum capricornutum for testing the toxicity of various heavy metals. The procedures were those set forth in Standard Methods (American Public Health Association, 1975). The algal assay was made by using an electronic particle counter. They tested the metal ions Zn, Cd, Cr, Co, Ni, and Cu. What makes their paper different from others, such as those by Kamatani et al. (1979) and Rachlin and Farran (1974), is that the toxicant concentration which suppressed 50 percent of algal growth was found to be in the order of micrograms per liter. For example, the toxicity of zinc was reported to be 4.4 μg/1. This rather low value is contradictory to the results of other studies cited here. For example, Bartlett et al. (1974) found that 0.7 mg/1 zinc was algicidal and 0.1 mg/1 zinc growth was inhibiting to the same species of alga, i.e., Selenastrum capricornutum.
Most of the work on algal toxicity studies has employed a single algal species as the test specimen. The work of Goldman (1978) is a departure from the unialgal procedure. While Greene, Miller, and Shiroyama and their coworkers, in work done in 1975, 1976, and 1978, have advocated the use of a single alga, Goldman applied C-14 radioactivity measurements in monitoring the activity of a natural algal population containing many species. The logic of using a diverse algal community was consistent with the fact that the sites of conern, Castle Lake and Lake Tahoe, sustain 30 to 50 algal species. The use of unialgal experiments is appealing because of the likelihood of reproducibility. Nevertheless the validity of selecting one species to represent the whole is debatable.
The work of Miller et al. (1978) is an excellent summary of the unialgal approach, but more important is the finding, when comparing the effects of textile plant effluents on minnows and algae, that the algae are considerably less tolerant than the fish.
EXPERIMENTAL METHODS
The experimental methods used in this study are similar to those used previously in Water Survey work (Wang et al., 1973; Wang, 1974). There were certain modifications which will be described here.
4
Samples Peoria and Farmington samples were taken from sewage treatment plants. More
specifically, the Peoria sample was the supernatant from the drying bed of aged sludge material, while the Farmington sample was the effluent from a sewage lagoon. During the spring and summer, both samples developed a typical algal bloom fitting the conventional description of green pea soup. The samples were taken by the grab method.
The samples were sieved through a fine-mesh plankton net to remove debris, algal lump, and zooplankton. The healthy algal community was generally used immediately. If delay was inevitable, the samples were stored at 4°C, but not for longer than one week. If the samples were stored at 4°C, they were placed under light for at least 2 days to revitalize the organisms before inoculation.
There are two reasons for selecting sewage samples. First, sewage samples usually contain rich and balanced plant nutrients which are superior to a man-made culture medium. Second, they usually contain prolific and viable algal communities which can be used as inocula without any treatment.
The selection of Peoria and Farmington sewage samples was purely accidental, but proved to be rather fortunate. Peoria raw sewage flow is 40 percent industrial wastewater, representing industries such as heavy machinery manufacturers, breweries, etc., while the Farmington raw sewage is derived solely from rural or residential sources. It is thus of interest to compare these two sources of algae for toxicity experiments.
Because the sewage samples were too rich in nutrients and too numerous in algae to be manageable, it was necessary to dilute them. The dilution was done by using well water located on the property of the Water Survey. There are two reasons for this selection. First, well water is not chlorinated as city water is, thus eliminating a potential toxicant for algal assays. (The same reason applies to fish assays [Reed et al., 1980].) Second, well water is low in dissolved oxygen, so the diluted sewage samples can be monitored for dissolved oxygen increase as an indicator of algal activity.
Inoculation and Incubation The inoculation was done to insure high algal densities greater than 1000 counts
per ml, and frequently greater than 10,000 counts per ml. The purpose of the high level inoculation was to achieve a quick response, generally within one day, but certainly within four days. A quick response is preferred because algae have a short life cycle. Prolonged contact with a toxicant may trigger a toxicant-resistant mechanism or shift the population to a toxicant-tolerant species.
During incubation a cool-white fluorescent light was used with an intensity of 190 footcandles in the blue region (460 nm peak) and 136 footcandles in the red region (640 nm peak). The light intensity was the same as that used in a previous study (Wang et al., 1973). The difference was that the incubation was done without shaking. In addition, the BOD bottles were airtight and were placed on a counter covered with aluminum foil to reflect light and further stimulate algal growth.
Transinoculation experiments were made during the latter part of the study. Two types of transinoculation procedures were used. One involved transinoculation
5

without the acclimation of the inoculum to the host sample. In the other procedure the inoculum was acclimated to a certain degree before introducing it into the new environment.
The transinoculation without acclimation was conducted as follows (figure 1). Sewage samples from Peoria and Farmington were each sieved through a fine-mesh' plankton net as usual. The samples were each divided into two portions. One portion was autoclaved at 19 psi for 15 minutes and used as a medium. The other portion was placed under cool-white fluorescent light for two days and used as an inoculum.
The inoculum was further divided into two subportions. One portion was used as the control, and the other portion was used for transinoculation. For the control portion of the Peoria sample, a 100 ml subportion of Peoria inoculum was blended at low speed until no visible algal lumps were apparent, was diluted with 8 liters of well water, and was tested for zinc toxicity as usual. For the transinoculation, a 100 ml sub-portion of Peoria inoculum was filtered through a Whatman glass fiber filter paper GF/B. The filter paper was washed twice with deionized water. With its residue and 100 ml of deionized water, the filter was blended until uniform pulp was obtained. The mixture was sieved through a plankton net, and algae passing through the net were used as an inoculum. To the inoculum was added 400 ml of autoclaved Farmington sewage sample and 8 liters of well water. Zinc toxicity was then determined. In the case of the Farmington inoculum, algae from 400 ml of the Farmington sample were used with 100 ml of the autoclaved Peoria sample.
Figure 1. Procedures used in transinoculation without acclimation
6

It was speculated early that the algae from the Farmington source were not acclimated to zinc, whereas those from the Peoria source were so acclimated. Therefore two acclimation procedures were used in conjunction with transinoculation techniques. For acclimating the Farmington samples the following procedure was used (figure 2). Three samples, each of one liter volume, were placed under light for 5 and 12 days. One was a control; to another was added 3 mg/1 Zn(OAc)2 solution; and to the third was added 6 mg/1 Zn(OAc)2 solution. At the end of 5 and 12 days, a 400 ml sample was taken from each, filtered through a glass fiber filter, washed, blended with 200 ml of deionized water, and sieved through a plankton net. The algae in the filtrate were tested for the effects of zinc toxicity after transplantation in an autoclaved Farming-ton sample.
For acclimating the Peoria inoculum, that is, deactivating its zinc content, two 100-ml portions, of sample were used (figure 3). The one for control purposes was incubated under light for 13 days and then blended and tested for zinc toxicity. The other sample was filtered, washed, and blended, and that passing the plankton net was added to 400 ml of an autoclaved Farmington sewage sample. It was then incubated for 13 days and its response to zinc toxicity was determined.
Experimental Design The experimental design includes two sources of algae (Peoria and Farmington)
in most cases, two levels of algal inoculation, six levels of zinc toxicant, and four replications. Thus in a complete run, 96 BOD bottles are required.
A certain amount of algal sample, 100 to 1000 ml, was diluted with 8 liters of well water and well mixed. The mixture was poured into BOD bottles containing 0 , 1 , 2, 4, 6, and 8 mg/1 of zinc acetate. An oxygen probe was immediately placed into the bottle. Dissolved oxygen concentrations were recorded after one minute of stirring. This is the initial oxygen content. After a specific time of incubation, dissolved oxygen was read again after one minute of stirring. This is the final dissolved oxygen concentration. The difference between initial and final dissolved oxygen was considered representative of the magnitude of algal activity.
Analyses Alkalinity, pH, hardness, algal species, and algal population were determined
in accordance with Standard Methods (APHA, 1975). Zinc determination was performed by digesting 100 ml of sample with 4 ml of concentrated nitric acid until near dryness. To this was added 2 ml of nitric acid and 2 ml of 30 percent hydrogen peroxide, and it was then digested again. Both were done at a moderate rate. The contents were washed and made up to 10 ml for the determination of zinc by atomic absorption. All the equipment used in this particular test was washed with acid in addition to regular detergent.
The monitoring of algal growth was done by dissolved oxygen measurement. A YSI oxygen meter, model 54, equipped with a self-stirring oxygen probe, was used. This method is not very accurate because it gives only two useful digits. Its advantages, however, outweigh the disadvantages because it is fast, precise, and simple.
7
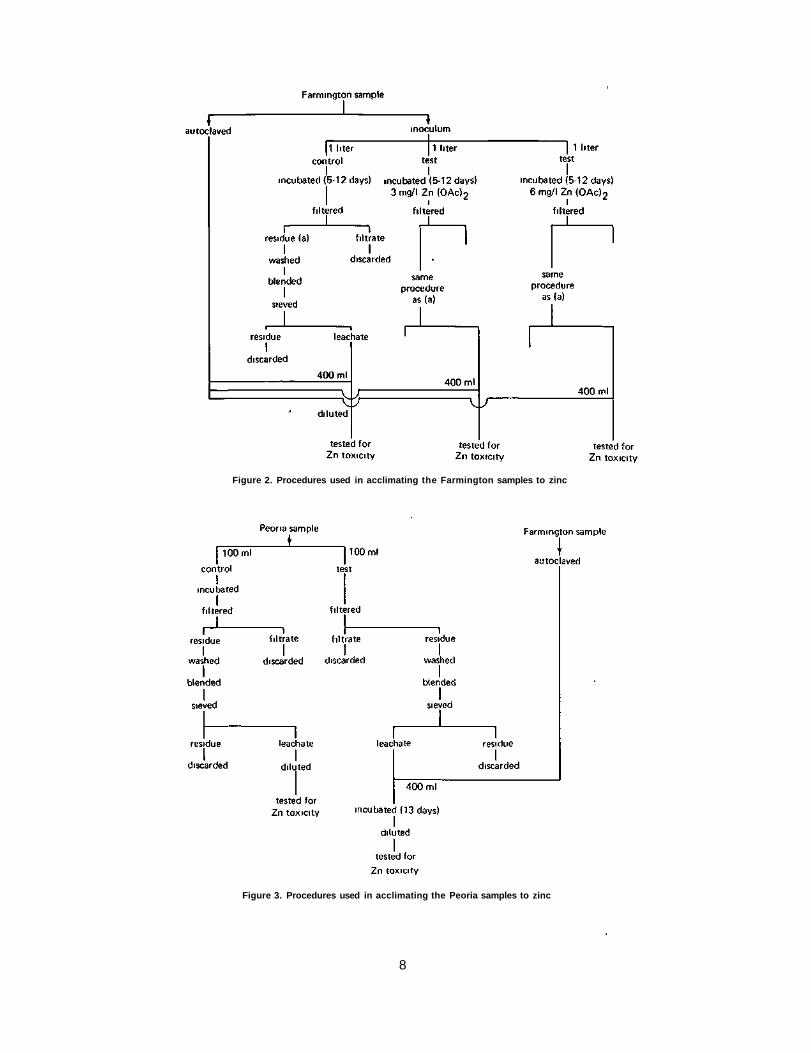
Figure 2. Procedures used in acclimating the Farmington samples to zinc
Figure 3. Procedures used in acclimating the Peoria samples to zinc
8
RESULTS: DEVELOPMENT OF METHODOLOGY
Blank Test Since zinc acetate was used as the toxicant, an oxygen demand test was per
formed on the chemical. The experiment was conducted by using duplicate deionized water samples and duplicate deionized water samples plus 4 mg/1 zinc acetate. After 24 hours, dissolved oxygen concentrations in the water samples were 7.4 and 7.5 mg/1, and in water plus zinc acetate the concentrations were also 7.4 and 7.5 mg/1. The test demonstrates that zinc acetate does not have a significant oxygen demand.
Toxicity Expression The conventional expressions used in assaying the toxicity of certain substances
to fish are based upon that concentration at which 50 percent of the test specimens survive during a specified period of time. The most frequently used terms are median tolerance limit (TLm), lethal concentration (LC50), and tolerance limit (TL50) at a time interval of 96 hours. Since it was determined here to measure the response of algal cultures to the toxicant in terms of the algae's physiological activity — that is, their capability to produce oxygen — the conventional expressions for fish assays are not applicable. The following discussion outlines the procedures used to determine the expression best suited for expressing the toxicity to algae of a toxicant in terms of. oxygen production, time, and density of culture.
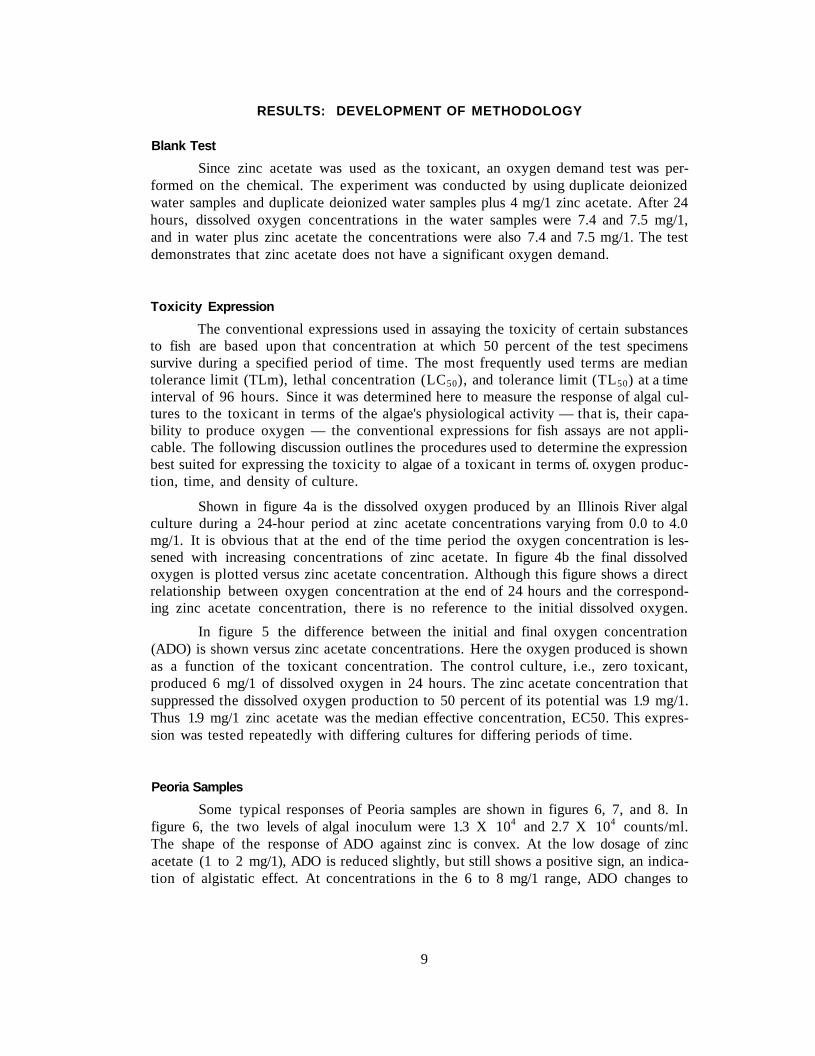
Shown in figure 4a is the dissolved oxygen produced by an Illinois River algal culture during a 24-hour period at zinc acetate concentrations varying from 0.0 to 4.0 mg/1. It is obvious that at the end of the time period the oxygen concentration is lessened with increasing concentrations of zinc acetate. In figure 4b the final dissolved oxygen is plotted versus zinc acetate concentration. Although this figure shows a direct relationship between oxygen concentration at the end of 24 hours and the corresponding zinc acetate concentration, there is no reference to the initial dissolved oxygen.
In figure 5 the difference between the initial and final oxygen concentration (ADO) is shown versus zinc acetate concentrations. Here the oxygen produced is shown as a function of the toxicant concentration. The control culture, i.e., zero toxicant, produced 6 mg/1 of dissolved oxygen in 24 hours. The zinc acetate concentration that suppressed the dissolved oxygen production to 50 percent of its potential was 1.9 mg/1. Thus 1.9 mg/1 zinc acetate was the median effective concentration, EC50. This expression was tested repeatedly with differing cultures for differing periods of time.
Peoria Samples Some typical responses of Peoria samples are shown in figures 6, 7, and 8. In
figure 6, the two levels of algal inoculum were 1.3 X 10⁴ and 2.7 X 10⁴ counts/ml. The shape of the response of ADO against zinc is convex. At the low dosage of zinc acetate (1 to 2 mg/1), ADO is reduced slightly, but still shows a positive sign, an indication of algistatic effect. At concentrations in the 6 to 8 mg/1 range, ADO changes to
9
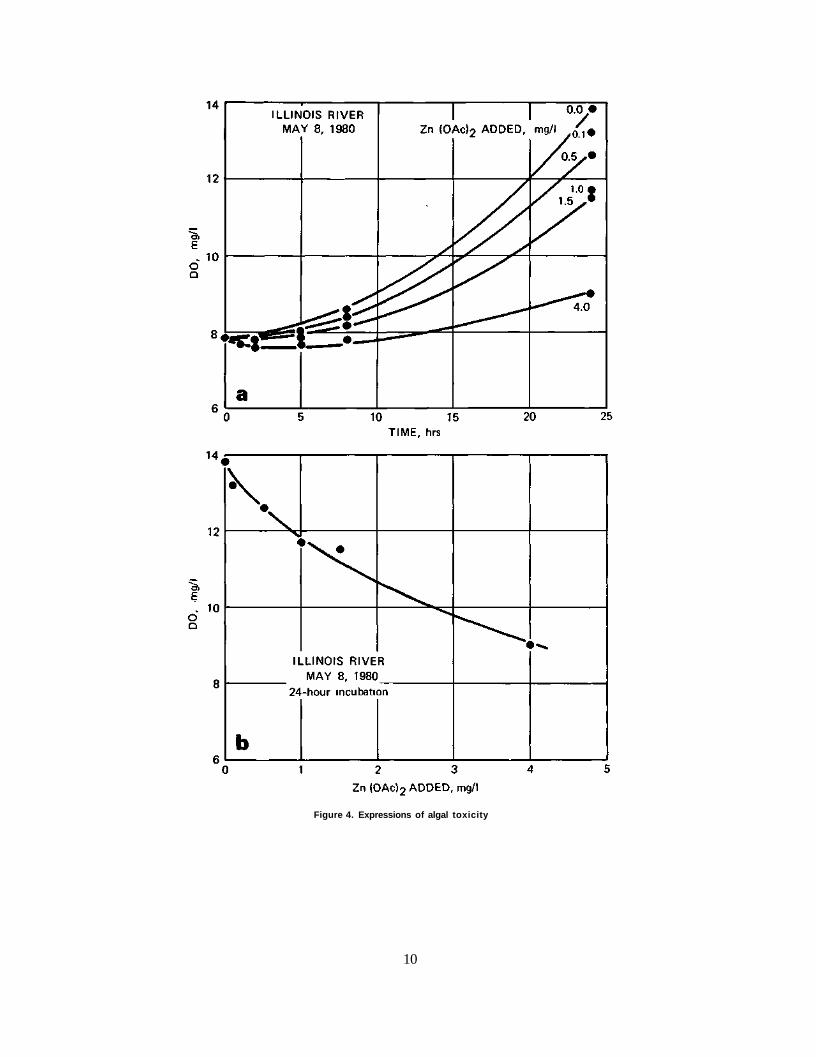
Figure 4. Expressions of algal toxicity
10
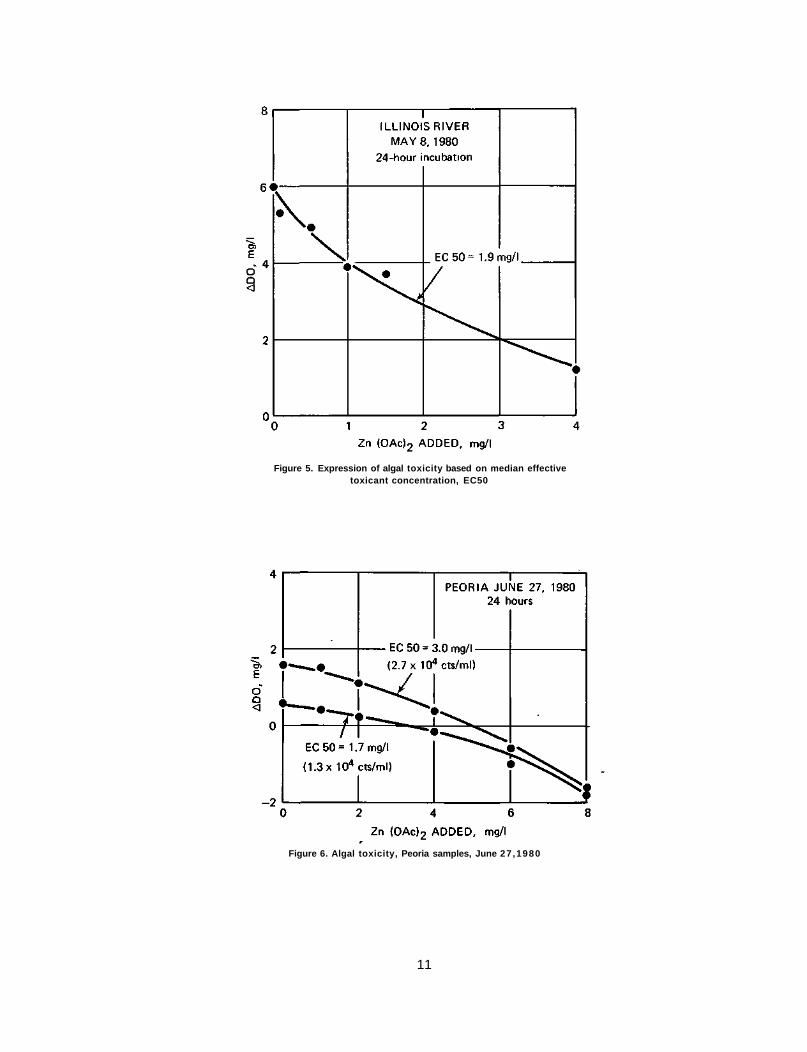
Figure 6. Algal toxicity, Peoria samples, June 27 ,1980
11
Figure 5. Expression of algal toxicity based on median effective toxicant concentration, EC50

Figure 7. Algal toxicity, Peoria samples, July 3, 1980
Figure 8. Algal toxicity, Peoria samples, July 17,1980
12

the negative side, showing the algicidal effect. At 1.3 X 10⁴ cts/ml, the EC50 = 1.7 mg/1 while at 2.7 X 10⁴ cts/ml, it is 3.0 mg/1.
As shown in figure 7, the July 3, 1980, Peoria sample depicts a similar toxicity response. The algal inoculum was slightly less, 4 X 10³ and 8 X 10³ cts/ml. The response again shows a convex-type curve. Negative ADO appeared at 6 to 8 mg/1 Zn (OAc)2. The EC50 concentrations were 2.1 and 2.8 mg/1. In this experiment, Anacystis flos-aquae, a blue-green alga, accounted for 100 percent of the population.
The July 17, 1980, Peoria sample also showed a similar response (figure 8). The determination of algal population in this run was probably erroneous because of the one-week delay before enumeration, even though the sample was kept at 4°C. The algal community was 70 percent Ourococcus bicaudatus and 30 percent Chlorella pyrenoidosa. Both lines of response are rather curvilinear, although the response with a higher algal dosage can also be taken as a linear response. The EC50 concentrations were 3.6 and 3.9 mg/1, respectively.
Farmington Samples The shape of the response curves for the Farmington samples differed from
those observed for the Peoria samples. As shown in figures 9, 10, and 11, the response curves for the Farmington samples were concave-shaped. Incubations of the samples were from 24 hours to 96 hours, with algal densities ranging from 7.6 X 10³ to 9.2 X 10⁴ cts/ml.
As shown in figure 9 the EC50 for June 27, 1980, ranged from 0.8 to 1.6 mg/1 zinc acetate with the response curves being quite similar in shape. Figures 10 and 11 show that the EC50 concentrations for July 2, 1980, ranged from 0.7 to 2.3 mg/1 zinc acetate. However for incubation times of 72 and 96 hours the response curves show a pronounced steepness at the higher concentrations.
Illinois River Samples Three samples from the Illinois River were taken and tested. The results in
figure 12 show that the pattern of response was concave, as it was for the Farmington samples. Even though the river samples were taken over a span of four months, the EC50 was almost identical: 1.8 to 1.9 mg/1 in the three samples. The three curvilinear relations are parallel. The algal species distribution of September 5, 1980, includes 40 percent Chlorella spp., 21 percent Cyclotella spp., 14 percent Ulothrix spp., 10 percent Melosira spp., 7 percent Coelastrum spp., and 7 percent Selenastrum spp. It is probable that the diverse nature of the algal community contributes to the uniform response.
Lake Eureka Sample One Lake Eureka sample was taken on September 5, 1980, and tested. The re
sponse curve for this sample, as shown in figure 13, has the convex shape typical of the Peoria sample. The EC50 was 5.0 mg/1 zinc acetate.
13
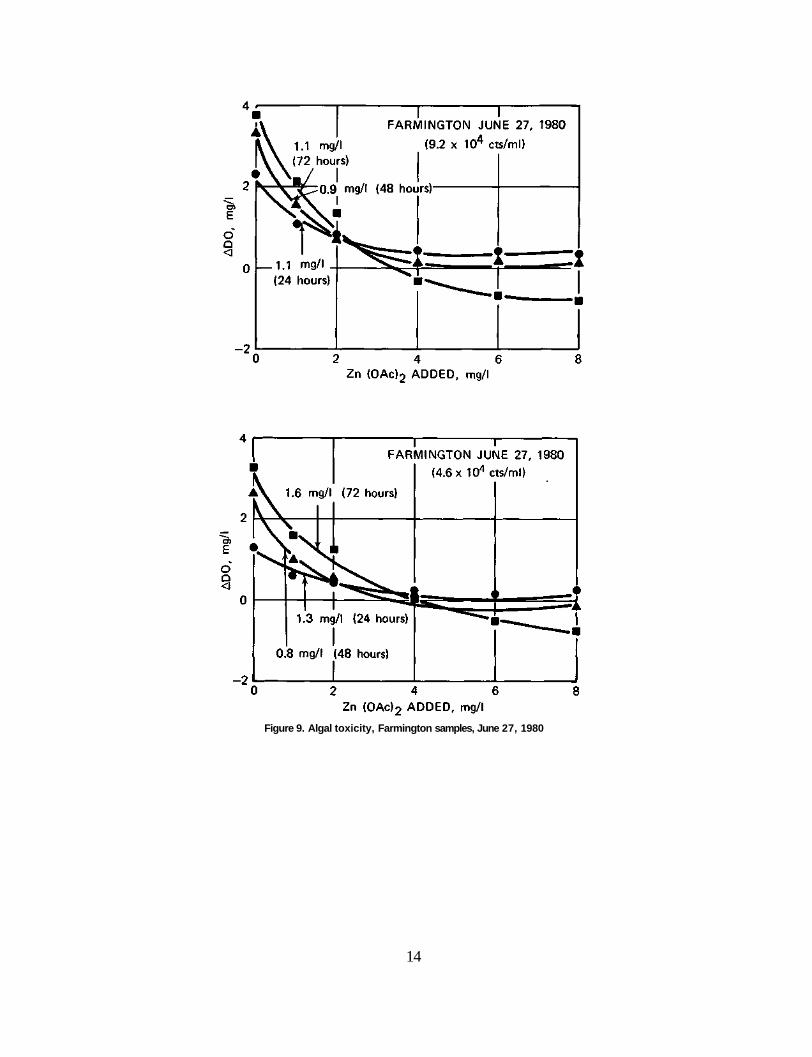
Figure 9. Algal toxicity, Farmington samples, June 27, 1980
14
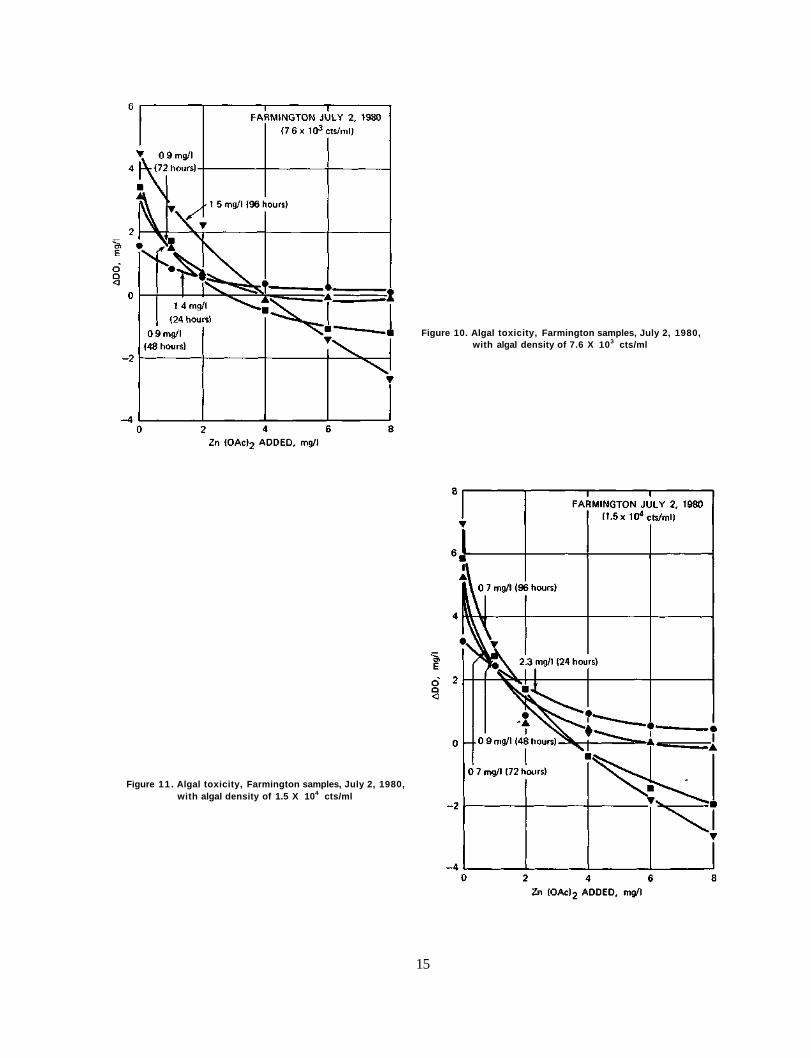
Figure 10. Algal toxicity, Farmington samples, July 2, 1980, with algal density of 7.6 X 10³ cts/ml
Figure 11 . Algal toxicity, Farmington samples, July 2, 1980, with algal density of 1.5 X 10⁴ cts/ml
15

Figure 12. Algal toxici ty, Illinois River samples
Figure 13. Algal toxicity. Lake Eureka sample
16

Length of Incubation Figures 9, 10, and 11 showed the results of extending the incubation of Farm-
ington samples from 1 day to 4 days. The response curves are all of a similar pattern. However, other samples from the same source revealed a different type of response. Figures 14 and 15 indicate the results for July 18, 1980. At 1.7 X 10⁴ cts/ml initial algal density, the 24-hr incubation gives an EC50 of 2.2 mg/1 zinc acetate. This value increases slightly to 2.3 mg/1 after 48 hrs, greatly to 3.7 mg/1 after 72 hrs, and drastically to 5.8 mg/1 after 96 hrs. Even more surprising is that the response line changes direction, from a concave shape to a convex shape, with a lengthening time of incubation. Similar tendencies were also observed at the higher inoculum level, 2.5 X 10⁴
cts/ml (figure 15), although the transformation of the response line stopped at the linear form at the 96-hr incubation time.
It is unclear what causes the transformation of response. It is speculated that during the prolonged incubation, two things might happen. First, the prolonged contact with zinc toxicant might trigger the microbial resistance mechanism, leading, for example, to the release of a detoxification substance, such as a chelating agent. Second, the multiplication or growth of resistant strains or species might take place. Given time, these possibilities may work individually or in combination.
Levels of Algal Inoculum In one sample, four levels of algal inoculum were tested. The objective was to
determine how the variation in algal inoculum affected toxicity response. The results are shown in figures 16 and 17. As shown, the EC50s for the different levels of inoculum were 1.2, 2.2, 2.0, and 2.2 for 24 hours, and 1.7, 2.3, 2.3, and 2.3 for 48 hours. This variation is considered relatively minor compared to other variables.
Summary of Methodology The overall summary of experiments conducted for methodology is included
in tables 1, 2, and 3. Table 1 contains all essential zinc toxicity data; table 2 shows algal species distribution; and table 3 contains all supporting data relevant to the experiments.
In table 1, the column showing algal density in cts/ml represents the algal population when the experiment was initiated. The change of dissolved oxygen, ADO, represents the change after a 24-hr interval. Table 1 shows that during 24 hours of incubation, the EC50 for Lake Eureka was the highest (5.0 mg/1), and the EC50s for Peoria, Farmington, and the Illinois River were 2.7, 2.1, and 1.8 mg/1, respectively. But since Lake Eureka was sampled only once, it was not clear whether this value was persistent. In view of the dynamics of algal species, it was more likely that the EC50 of 5.0 mg/1 for Lake Eureka was not a constant, but an empirical value.
Considering the variation in algal community in all three sources, it was surprising that the EC50s were so close- 1.8 ± 0.1, 2.7 ± 1.0, and 2.1 ± 0.9 mg/1 for the Illinois River, Peoria, and Farmington samples, respectively. Even the variation in the
17
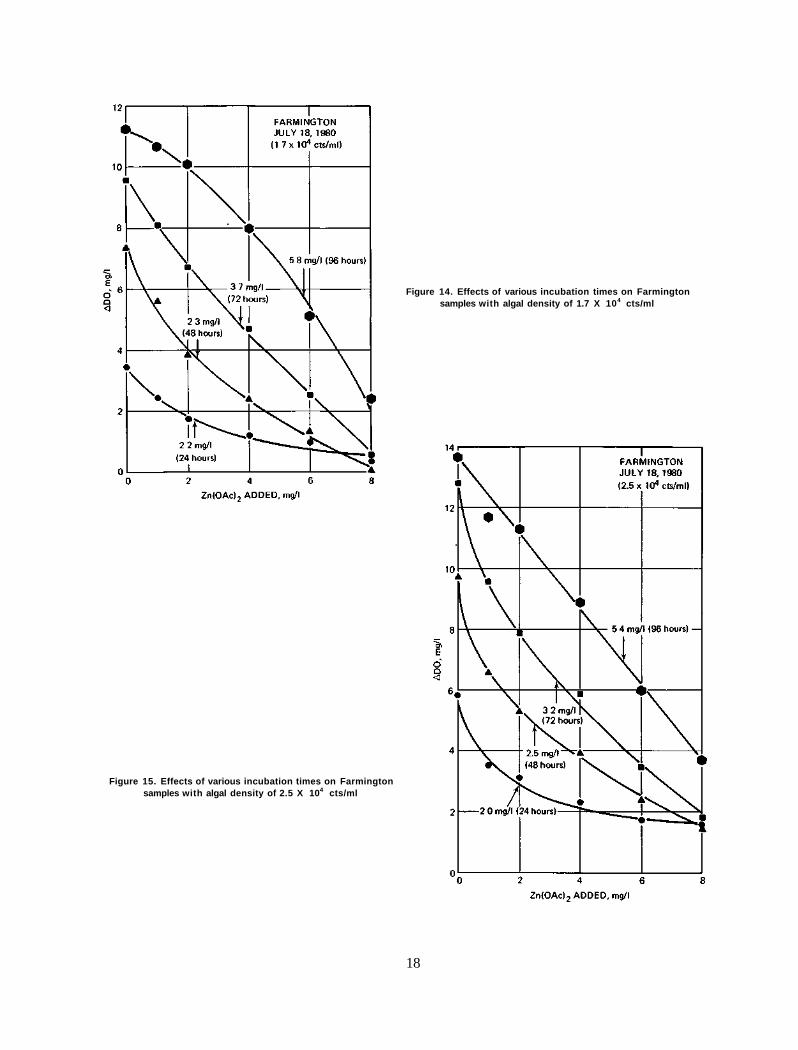
Figure 14. Effects of various incubation times on Farmington samples with algal density of 1.7 X 10⁴ cts/ml
Figure 15. Effects of various incubation times on Farmington samples with algal density of 2.5 X 10⁴ cts/ml
18
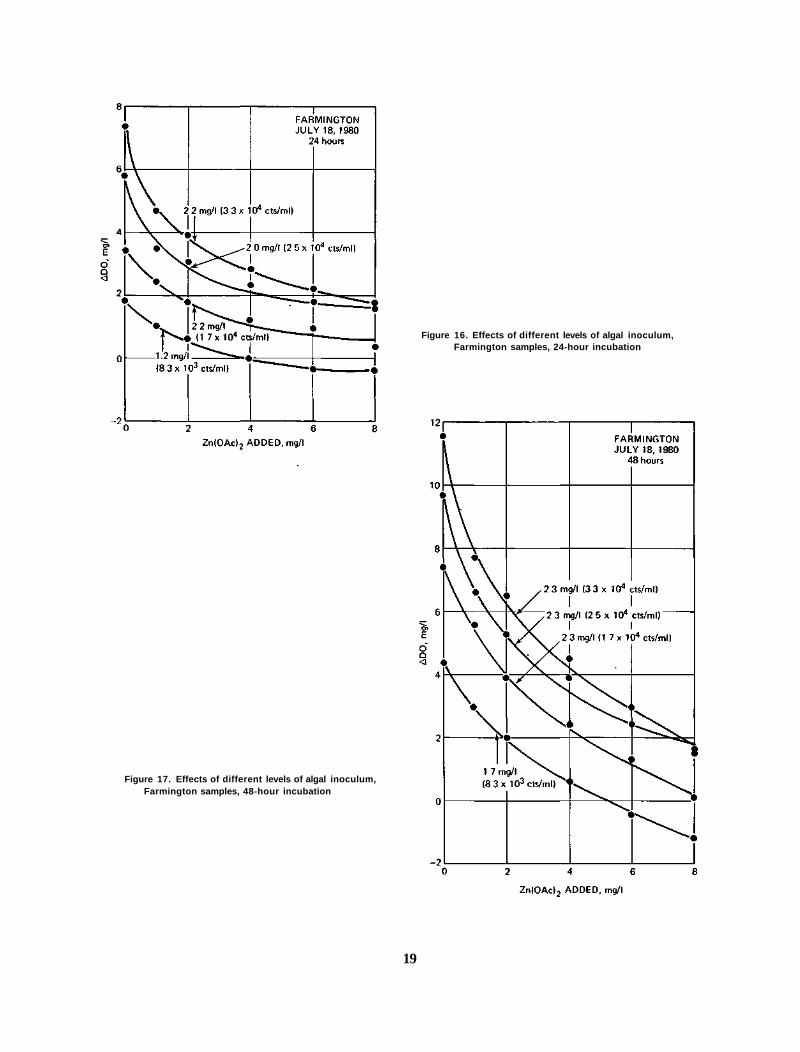
Figure 16. Effects of different levels of algal inoculum, Farmington samples, 24-hour incubation
Figure 17. Effects of different levels of algal inoculum, Farmington samples, 48-hour incubation
19

Table 1. Algal Toxicity of Zinc Ion
EC50 of Algal Zn(OAc)2
density A DO (mg/l) (cts/ml) 24 hrs 24 brs 48 brs 72 brs 96 hrs
Illinois River 5/8/80 6.0 1.9 5/27 4.0 1.8 9/5 4.6 X 10² 4.8 1.8
Average 1.8 ± 0.1
Greater Peoria Sanitary District 6/19/80 1.4 X 10⁴ 0.9 1.5 6/27 1.3 X 10⁴ 0.6 1.7
2.7 X 10⁴ 1.6 3.0 7/3 4 X 10³ 0.6 2.1
8 X 10³ 2.3 2.8 7/17* 6.5 X 102 1.3 3.6
1.3 X 1 0 3 3.3 3.9 8/7 4.3 X 10³ 1.3 2.9 Average 2.7 ± 1.0
Farmington Sewage Treatment Plant 6/9/80 11.9 3.1 6/9* 11.4 4.2 3.1 4.1 6/20 6.6 X 10⁴ 2.8 1.6 0.9 0.8
13 X 104 6.5 1.2 1.5 1.1 6/27 4.6 X 10⁴ 1.3 1.3 0.8 1.6
9.2 X 10⁴ 2.3 1.1 0.9 1.1 7/2 7.6 X l 0 3 1.6 1.4 0.9 0.9 1.5
1.5 X 10⁴ 3.2 2.3 0.9 0.7 0.7 7/18 2.1 X 10⁴ 5.0 3.0 1 9 1.8 2.7
4.1 X 10⁴ 8.7 3.0 3.1 2.9 4.1 7/18* 8.3 X 103 1.9 1.2 1.7 2.5 5.1
1.7 X 10⁴ 3.5 2.2 2.3 3.7 5.8 2.5 X 10⁴ 5.8 2.0 2.3 3.2 5.4 3.3 X l 0 4 7.4 2.2 2.3 3.3 4.3
8/7 1.3 X 10⁴ 6.0 2.1 3.6
Average 2.1 ± 0.9 1.9 + 0.9 2.1 ± 1.2 3.8 ± 1.9
Lake Eureka 9/5/80 3.8 5.0
* Samples stored at 4°C for 1 week
20

Table 2. Algal Species Distribution Algal Percent
species of total Illinois River
9/5/80 Chlorella pyrenoidosa (G) 40 Cyclotella menegbiniana (D) 21 Ulothrix zonata (G) 14
Greater Peoria Sanitary District 7/3/80 Anacystis flos-aquae (BG) 100 8/7 Scenedesmus dimorphus (G) 100 8/20* Chlorella ellipsoidea (G) 100
Farmington Sewage Treatment Plant 7/2/80 Apbanizomenon flos-aquae (BG) 69
Anacystis flos-aquae (BG) 29 7/18 Apbanizomenon flos-aquae (BG) 91 8/7 Apbanizomenon flos-aquae (BG) 90 7/11** Apbanizomenon flos-aquae (BG) 100 8/11* Chlorella ellipsoidea (G) 90
Lake Eureka 9/5/80 Coelastrum microporum (G) 100
* After 12 days incubation * * After 5 days incubation Note G = green; D = diatom, BG = blue-green
same source was relatively small — 5, 37, and 42 percent relative standard deviation for the Illinois River, Peoria, and Farmington samples — considering that the inoculum was uncontrolled. In addition, the experiment was conducted under only partial environmental control as is evidenced from the temperature variations shown in table 3.
The differing lengths of incubation of the Farmington samples — 24, 48, and 72 hours — showed little difference, as the EC50s were 2.1, 1.9, and 2.1 mg/1, respectively. As the incubation prolonged to 96 hrs, however, the EC50 changed significantly.
It is recommended that the EC50 be determined on the basis of more than one source of algae and more than one sample of algae, at incubation periods not exceeding 72 hours with an initial inoculum density greater than 1000 cells/ml.
RESULTS: CAUSES OF VARIATIONS IN RESPONSE
Theoretical Considerations The previous results show that there are two types of algal response to zinc
toxicant. One is convex or linear, such as that for the Peoria sample (figures 6, 7, and 8), and the other is concave, such as that for the Farmington sample (figures 9,10, and 11). These two types of response are consistent, not accidental. This was rather puzzling and an attempt was made to find the cause for it.
21

Table 3. Some Water Properties of the Algal Sources Alkalinity Hardness Temperature
pH (mg/l) (mg/l) (C) Illinois River
9/5/80 7.70 243 374 26-28
Greater Peoria Sanitary District 6/19/80 7.70 282 453 26-30 6/27 7.80 287 443 23-28
7.90 311 443 7/3 7.40 251 433 27.5-30
7.70 268 426 7/17* 7.65 247 423 27-28
7.60 241 434 8/7 7.80 239 395 24-27
Farmington Sewage Treatment Plant 6/9/80 8.56 317 400 24-25 6/9* 8.00 294 440 6/20 7.86 309 438 26-30
8.04 315 438 6/27 7.85 262 420 23-28
8.00 276 410 7/2 7.60 247 406 27.5-30
7.70 255 393 7/18 7.55 245 ' 400 27-28
7.60 251 389 7/18* 7.60 233 406 26-27
7.60 241 395 7.70 234 395 7.70 247 395
8/7 7.80 230 384 24-27
* Samples stored at 4° C for 1 week
There are two hypotheses which can be used to explain the different responses, one involving the media (water samples) and the other involving the algae. The hypothesis involving the media is that if the Peoria sample contained a chelating agent, while the Farmington sample did not, then the formation of chelate with zinc in the Peoria sample would reduce the toxicity at the slight dosage, and only after a large zinc addition would toxicity really take effect. On the other hand, if the Farmington sample contained no chelating substance, the addition of a small zinc amount would immediately suppress algal growth so as to show a concave response curve.
The second hypothesis deals with algae in the samples, or, more specifically, acclimation to the toxicant by algae in the sample. The Greater Peoria Sanitary District, as mentioned, receives 40 percent of its wastewater flow from industrial sources. It was speculated that zinc content in the wastewater was high, from which it would follow that the algae in the Peoria samples were well acclimated to zinc. On the other hand, Farmington algae would not be acclimated to the toxicant, because industrial wastewater flows are not significant at the sewage treatment plant, so the initial shock effect of zinc on Farmington algae would be substantial, producing a concave response curve.
22
To prove or disprove the above hypotheses the following experiments were performed.
Transinoculation without Acclimation Hypothesis
If water is the cause of the different responses of the Peoria and Farmington samples, then Peoria algae inoculated into an autoclaved Farmington sample should produce a concave response similar to that of Farmington samples; and, conversely, Farmington algae in an autoclaved Peoria sample should produce a convex or linear response curve.
Results. The results of this experiment are depicted in figures 18, 19, and 20. In figure 18, it can be seen that the Peoria inoculum in both the Peoria and Farmington samples exhibits the same response, a mildly convex or nearly linear response curve. Figures 19 and 20 show that the Farmington algae, after 24 and 48 hours of growth, also show indifference to the source of water as they respond to toxicant in a concave fashion.
The results clearly indicate that algae, not water, dictate the pattern of response to zinc toxicant.
Transinoculation with Acclimation Hypothesis 1
If algae or, more specifically, algal acclimation to the toxicant cause different responses between the Peoria and Farmington samples, it follows that the alteration of algal "diet" should change the response as well. If the Farmington sample contains less zinc content than the Peoria sample, then acclimation of the Farmington sample to a higher zinc diet should change the pattern of response from concave to convex or linear, like the response of the Peoria samples.
Results. The results are shown in figures 21 and 22. Regardless of the length of acclimation (5 or 12 days), the control sample showed a typical concave response. However, the acclimation of Farmington algae to the zinc toxicant greatly changed their response. The acclimation of algae to 3 mg/1 zinc acetate solution resulted in a change of response to linear after 5 days (figure 21) and to a very slightly concave pattern after 12 days (figure 22). The acclimation of Farmington algae to 6 mg/1 zinc acetate solution invariably altered the pattern of response to a convex one, which is typical of the response of the Peoria algae to the toxicant.
Hypothesis 2
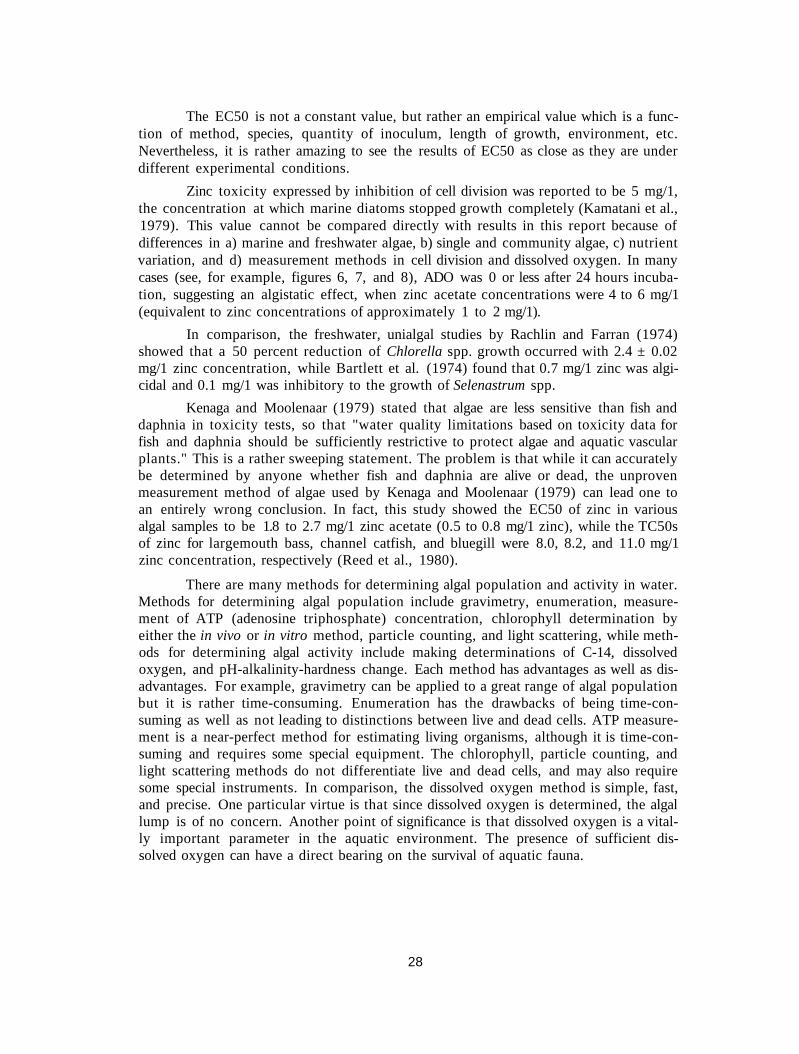
If a high zinc diet changed the response of Farmington algae to a Peoria-type response, it follows that a low zinc diet should change the response of Peoria algae to a Farmington-type response.
Results. The results of the Peoria algae experiment are shown in figure 23. The control algae depict a linearity against zinc concentration, a typical response of Peoria
23
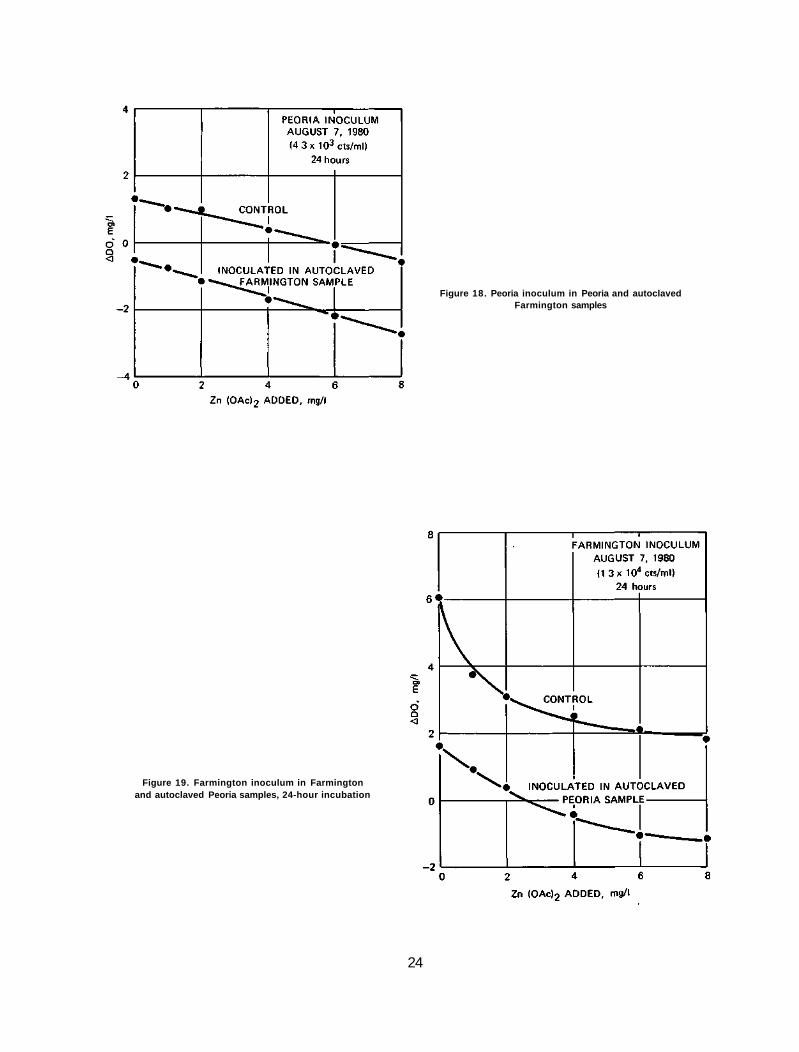
Figure 18. Peoria inoculum in Peoria and autoclaved Farmington samples
Figure 19. Farmington inoculum in Farmington and autoclaved Peoria samples, 24-hour incubation
24
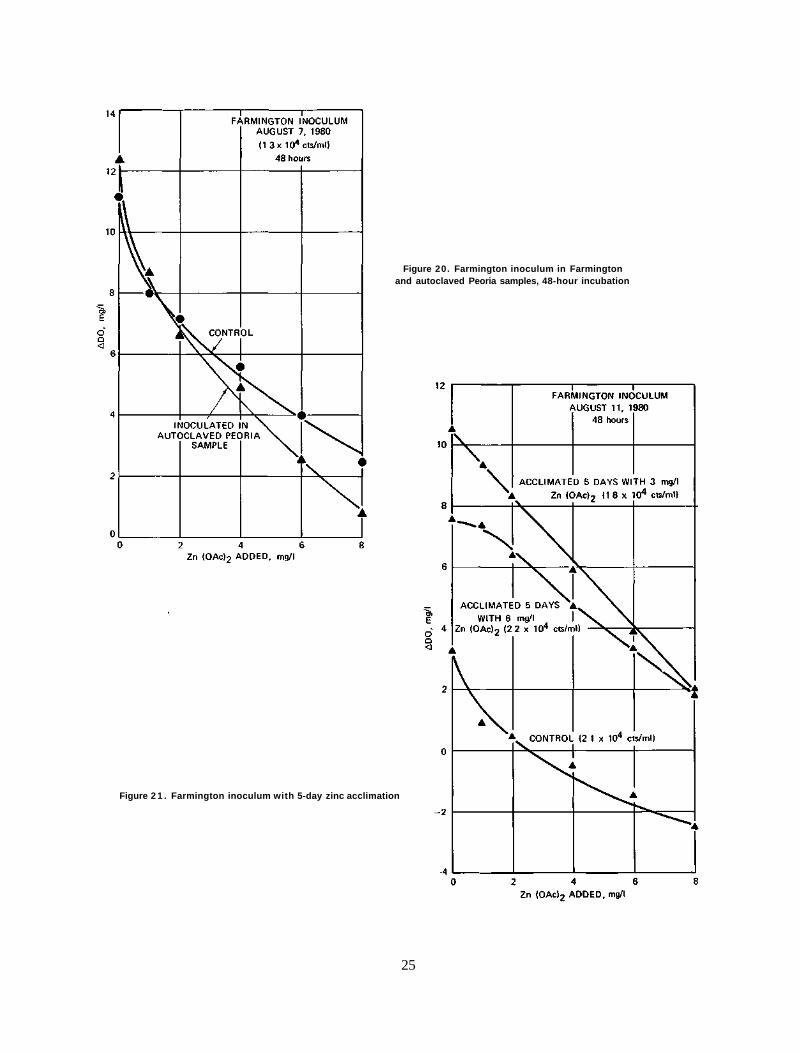
Figure 20. Farmington inoculum in Farmington and autoclaved Peoria samples, 48-hour incubation
Figure 2 1 . Farmington inoculum with 5-day zinc acclimation
25
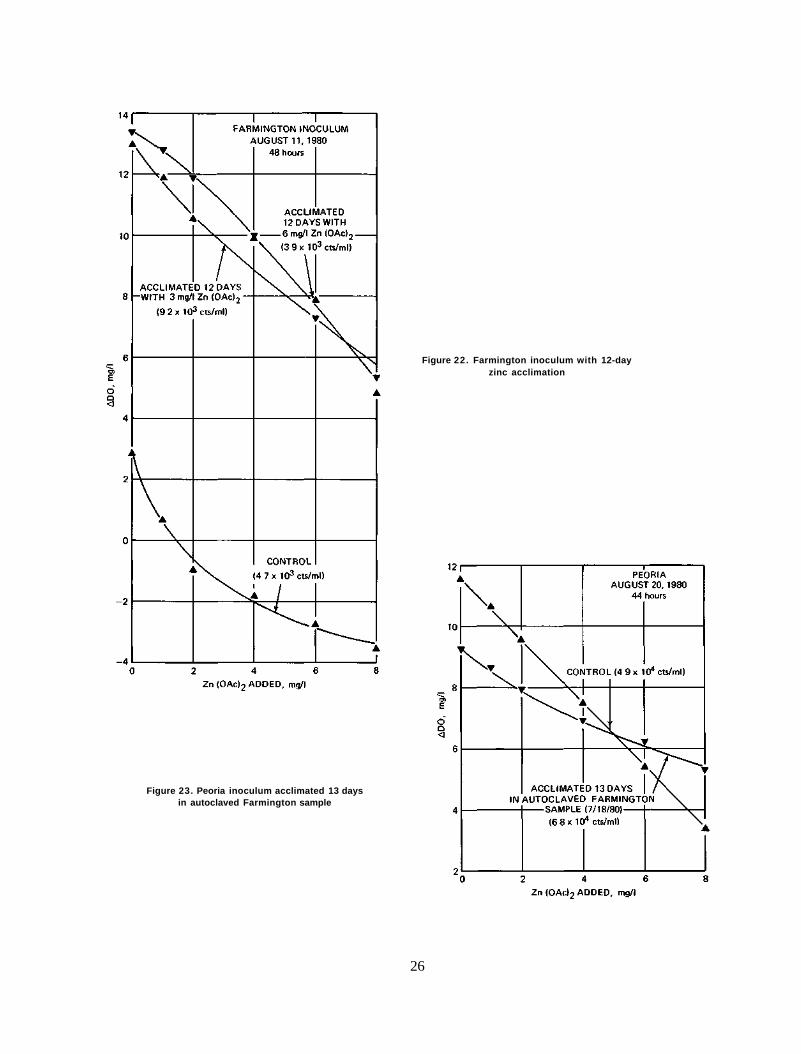
Figure 22. Farmington inoculum with 12-day zinc acclimation
Figure 23. Peoria inoculum acclimated 13 days in autoclaved Farmington sample
26
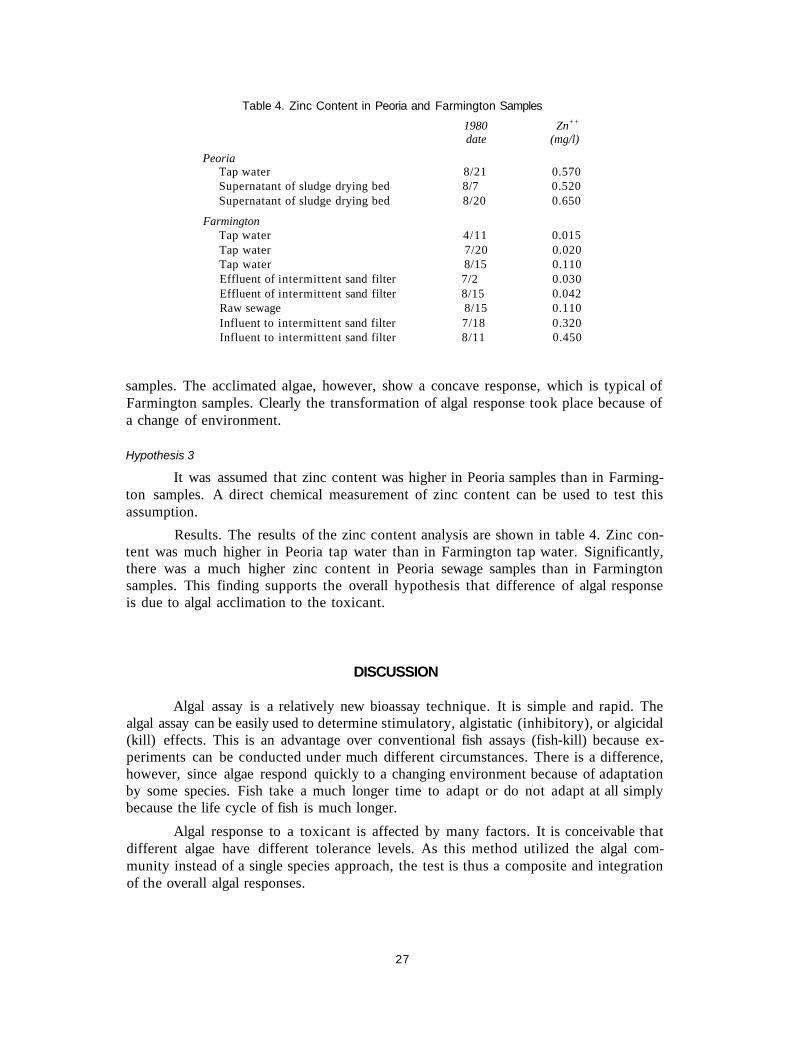
Table 4. Zinc Content in Peoria and Farmington Samples 1980 Zn++
date (mg/l) Peoria
Tap water 8/21 0.570 Supernatant of sludge drying bed 8/7 0.520 Supernatant of sludge drying bed 8/20 0.650
Farmington Tap water 4/11 0.015 Tap water 7/20 0.020 Tap water 8/15 0.110 Effluent of intermittent sand filter 7/2 0.030 Effluent of intermittent sand filter 8/15 0.042 Raw sewage 8/15 0.110 Influent to intermittent sand filter 7/18 0.320 Influent to intermittent sand filter 8/11 0.450
samples. The acclimated algae, however, show a concave response, which is typical of Farmington samples. Clearly the transformation of algal response took place because of a change of environment.
Hypothesis 3
It was assumed that zinc content was higher in Peoria samples than in Farming-ton samples. A direct chemical measurement of zinc content can be used to test this assumption.
Results. The results of the zinc content analysis are shown in table 4. Zinc content was much higher in Peoria tap water than in Farmington tap water. Significantly, there was a much higher zinc content in Peoria sewage samples than in Farmington samples. This finding supports the overall hypothesis that difference of algal response is due to algal acclimation to the toxicant.
DISCUSSION
Algal assay is a relatively new bioassay technique. It is simple and rapid. The algal assay can be easily used to determine stimulatory, algistatic (inhibitory), or algicidal (kill) effects. This is an advantage over conventional fish assays (fish-kill) because experiments can be conducted under much different circumstances. There is a difference, however, since algae respond quickly to a changing environment because of adaptation by some species. Fish take a much longer time to adapt or do not adapt at all simply because the life cycle of fish is much longer.
Algal response to a toxicant is affected by many factors. It is conceivable that different algae have different tolerance levels. As this method utilized the algal community instead of a single species approach, the test is thus a composite and integration of the overall algal responses.
27
The EC50 is not a constant value, but rather an empirical value which is a function of method, species, quantity of inoculum, length of growth, environment, etc. Nevertheless, it is rather amazing to see the results of EC50 as close as they are under different experimental conditions.
Zinc toxicity expressed by inhibition of cell division was reported to be 5 mg/1, the concentration at which marine diatoms stopped growth completely (Kamatani et al., 1979). This value cannot be compared directly with results in this report because of differences in a) marine and freshwater algae, b) single and community algae, c) nutrient variation, and d) measurement methods in cell division and dissolved oxygen. In many cases (see, for example, figures 6, 7, and 8), ADO was 0 or less after 24 hours incubation, suggesting an algistatic effect, when zinc acetate concentrations were 4 to 6 mg/1 (equivalent to zinc concentrations of approximately 1 to 2 mg/1).
In comparison, the freshwater, unialgal studies by Rachlin and Farran (1974) showed that a 50 percent reduction of Chlorella spp. growth occurred with 2.4 ± 0.02 mg/1 zinc concentration, while Bartlett et al. (1974) found that 0.7 mg/1 zinc was algi-cidal and 0.1 mg/1 was inhibitory to the growth of Selenastrum spp.
Kenaga and Moolenaar (1979) stated that algae are less sensitive than fish and daphnia in toxicity tests, so that "water quality limitations based on toxicity data for fish and daphnia should be sufficiently restrictive to protect algae and aquatic vascular plants." This is a rather sweeping statement. The problem is that while it can accurately be determined by anyone whether fish and daphnia are alive or dead, the unproven measurement method of algae used by Kenaga and Moolenaar (1979) can lead one to an entirely wrong conclusion. In fact, this study showed the EC50 of zinc in various algal samples to be 1.8 to 2.7 mg/1 zinc acetate (0.5 to 0.8 mg/1 zinc), while the TC50s of zinc for largemouth bass, channel catfish, and bluegill were 8.0, 8.2, and 11.0 mg/1 zinc concentration, respectively (Reed et al., 1980).
There are many methods for determining algal population and activity in water. Methods for determining algal population include gravimetry, enumeration, measurement of ATP (adenosine triphosphate) concentration, chlorophyll determination by either the in vivo or in vitro method, particle counting, and light scattering, while methods for determining algal activity include making determinations of C-14, dissolved oxygen, and pH-alkalinity-hardness change. Each method has advantages as well as disadvantages. For example, gravimetry can be applied to a great range of algal population but it is rather time-consuming. Enumeration has the drawbacks of being time-consuming as well as not leading to distinctions between live and dead cells. ATP measurement is a near-perfect method for estimating living organisms, although it is time-consuming and requires some special equipment. The chlorophyll, particle counting, and light scattering methods do not differentiate live and dead cells, and may also require some special instruments. In comparison, the dissolved oxygen method is simple, fast, and precise. One particular virtue is that since dissolved oxygen is determined, the algal lump is of no concern. Another point of significance is that dissolved oxygen is a vitally important parameter in the aquatic environment. The presence of sufficient dissolved oxygen can have a direct bearing on the survival of aquatic fauna.
28

REFERENCES
American Public Health Association, American Water Works Association, and Water Pollution Control Federation. 1975. Standard methods for the examination of water and wastewater. American Public Health Association, New York, NY, 1193 p., 14th edition.
Bartlett, L., F. W. Rabe, andW. H. Funk. 1974. Effects of copper, zinc, and cadmium on Selenastrum capricornutum. Water Research 8:179-185.
Cairns, J., T. K. Bahns, D. T. Burton, K. L. Dickson, R. E. Sparks, and W. T. Waller. 1971. The effect of pH, solubility, and temperature upon the acute toxicity of zinc to the bluegill sun-fish. Transactions of the Kansas Academy of Science 74:81-92.
Chiaudani, G., and M. Vighi. 1978. The use of Selenastrum capricornutum batch culture in toxicity studies. Mitt. Internat. Verein. Limnol. 21:316-329.
Cooksey, K. E., and B. Cooksey. 1978. Growth-influencing substances in sediment extracts from a subtropical wetland investigation using a diatom bioassay. J. Phycol. 14:347-352.
Goldman, C. R. 1978. The use of natural phytoplankton populations in bioassay. Mitt. Internat. Verein. Limnol. 21:364-371.
Greene, J. C, W. E. Miller, T. Shiroyama, R. A. Soltero, and K. Putnam. 1978. Use of laboratory cultures of Selenastrum, Anabaena and the indigenous isolate Sphaerocystis to predict effects of nutrient and zinc interactions upon phytoplankton growth in Long Lake, Washington. Mitt. Internat. Verein. Limnol. 21:372-384.
Hendricks, A. C. 1978. Response of Selenastrum capricornutum to zinc sulfides. Journal Water Pollution Control Federation.v.50(1):163-168.
Kamatani, A., M. Takahashi, and Y. Morita. 1979. Zinc uptake in marine diatoms. Bulletin Japanese Society of Scientific Fisheries 45 :715-719.
Kenaga, E. E., and R. J. Moolenaar. 1979. Fish and daphnia toxicity as surrogates for aquatic vascular plants and algae. Environ. Science and Technology 13:1479-1480.
Miller, W. E., J. C. Greene, E. A. Merwin, and T. Shiroyama. 1978. Toxic materials in the aquatic environment. Proc. Toxic Materials in the Aquatic Environment, Oregon State University, Corvallis, Oregon, p. 9-16.
Miller, W. E., J. C. Greene, and T. Shiroyama. 1976. Application of algal assays to define the effects of wastewater effluents upon algal growth in multiple use river systems. In Biostimulation and Nutrient Assessment, E. J. Middlebrooks, D. H. Falkenbarg, and T. E. Maloney, eds. Ann Arbor Science, Ann Arbor, Michigan, p. 77-92.
Miller, W. E., J. C. Greene, and T. Shiroyama. 1976. Use of algal assays to define trace-element limitation and heavy metal toxicity. Proc. Terrestrial and Aquatic Ecological Studies of the Northwest, Eastern Washington State College, Cheney, Washington, p. 317-325.
Miller, W. E., J. C. Greene, and T. Shiroyama. 1978. The Selenastrum capricornutum Printz algal assay bottle test experimental design, application, and data interpretation protocol. USEPA-600/9-78-018, 125 p.
Miller, W. E., J. C. Greene, T. Shiroyama, and E. Merwin. 1975. The use of algal assays to determine effects of waste discharges in the Spokane River system. Proc. Biostimulation and Nutrient Workshop, USEPA, 660/3-75-034.
National Eutrophication Research Program, USEPA. 1971. Algal assay procedure bottle test. 82 p.
29
Rachhn, J. W., and M. Farran. 1974. Growth response of the green algae Chlorella vulgaris to selective concentrations of zinc. Water Research 8:575-577.
Reed, P., D. Richey, and D. Roseboom. 1980. Acute toxicity of zinc to some fish in high alkalinity water. Illinois State Water Survey Circular 142, 21 p.
Sudo, R., and M. Okada. Undated. The contribution of sediment to lake eutropbication as determined by algal assay. Freshwater Environmental Laboratory, National Institute of Environmental Studies, Japan, 18 p.
Wang, W.-C. 1974. Effect of turbidity on algal growth. Illinois State Water Survey Circular 121, 12 p.
Wang, W.-C. W. T. Sullivan, and R. L. Evans. 1973. A technique for evaluating algal growth potential in Illinois surface waters. Illinois State Water Survey Report of Investigation 72,16 p.
30