an alternative biologistics for pharmaceutical products ... · the dosage forms into four classes...
TRANSCRIPT

An Alternative Biologistics for Pharmaceutical Products: 3D-Printed Tablets and Pills Prepared By: Ebrahim Asadi, Ph.D. Associate Professor, Department of Mechanical Engineering, University of Memphis, 301A Engineering Science Bldg., 3815 Central Avenue, Memphis, TN 38152, Tel: 901-678-3332, Email: [email protected] Sabya Mishra, Ph.D., P.E. Assistant Professor, Department of Civil Engineering, University of Memphis, 112D Engineering Science Bldg., 3815 Central Avenue, Memphis, TN 38152, Tel: 901-678-5043, Fax: 901-678-3026, Email: [email protected] Ahmad Nourian Avval Department of Mechanical Engineering, The University of Memphis, 3815 Central Avenue, Memphis, TN 38152, Email: [email protected] Sukanya Dasgupta Undergraduate Student, Department of Civil Engineering, University of Memphis, Email: [email protected] Olivia Wiseman Undergraduate Student, Department of Civil Engineering, University of Memphis, Email: [email protected]

2
TABLE OF CONTENTS LIST OF TABLES ............................................................................................................ 4
LIST OF FIGURES .......................................................................................................... 5
LIST OF EQUATIONS ..................................................................................................... 6
1. INTRODUCTION ......................................................................................................... 7
2. LITERATURE REVIEW ............................................................................................... 8
2.1 3D Printing Being a Viable Option ......................................................................... 8
2.2 Accuracy of 3D printed Oral Pill Medication ........................................................... 9
2.3 Unique Dosage Forms ......................................................................................... 10
2.4 Conventional Processes for Manufacturing Tablets ............................................. 11
2.5 Granulation .......................................................................................................... 13
2.6 Dry Granulation .................................................................................................... 14
2.7 Wet Granulation ................................................................................................... 14
2.8 Milling .................................................................................................................. 18
2.9 Compression........................................................................................................ 19
2.10 Additive Manufacturing Processes ..................................................................... 21
2.11 Common Steps in Additive Manufacturing Methods .......................................... 24
2.12 Various additive manufacturing methods used for drug product manufacturing 24
2.12.1 Room-temperature extrusion: ...................................................................... 24
2.12.2 Binder Deposition ........................................................................................ 25
2.12.3 Fused deposition modeling (FDM) .............................................................. 28
2.12.4 Materials Jetting .......................................................................................... 29
2.13 Complex Drug-Release Profiles ......................................................................... 31
2.14 Personalized Drug Dosing ................................................................................. 34
2.15 3D Printing Summary ......................................................................................... 34
2.16 Most Common Drugs Prescribed and Costs ...................................................... 35
2.17 Top Pharmaceutical Companies ........................................................................ 35
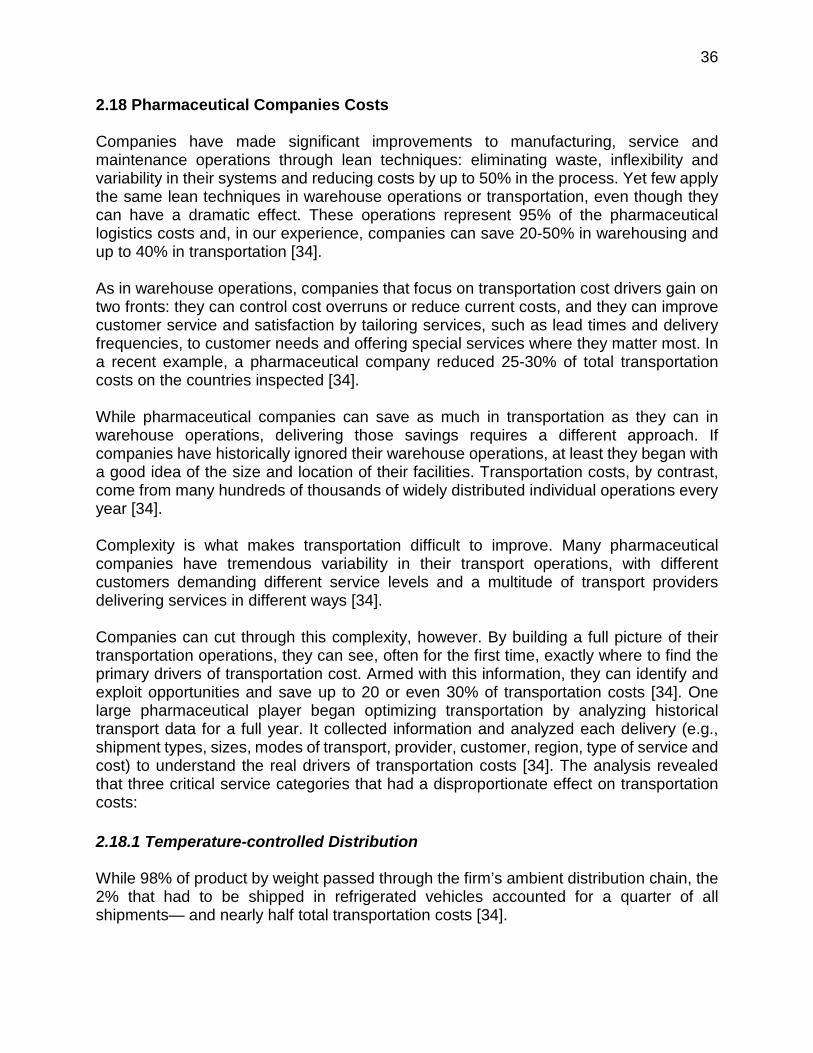
2.18 Pharmaceutical Companies Costs ..................................................................... 36
2.18.1 Temperature-controlled Distribution ............................................................ 36
2.18.2 Special delivery services ............................................................................. 37
2.18.3 Shipment size .............................................................................................. 37
2.19 3D Printer Costs ................................................................................................ 38
2.20 Profit and Advantages ....................................................................................... 39
3. METHODOLOGY ...................................................................................................... 39

3
3.1 Supply Chain ....................................................................................................... 39
3.2 Sample Drug ........................................................................................................ 41
3.2.1 Thyroid .......................................................................................................... 41
3.2.2 Levothyroxine ................................................................................................ 41
3.3 Chemical Compound ........................................................................................... 42
3.4 Trucking Cost....................................................................................................... 43
4. DATA ......................................................................................................................... 43
4.1 Cost ..................................................................................................................... 43
4.2 Experimental Conventional Path.......................................................................... 45
5. RESULTS .................................................................................................................. 46
5.1 Data Collection .................................................................................................... 46
5.2 Route Paths ......................................................................................................... 46
5.3 Cost Standard vs. 3D Printing.............................................................................. 48
5.4 Market Penetration .............................................................................................. 51
5.5 Alternate Viable Scenario .................................................................................... 51
5.5.1 Drug Choice .................................................................................................. 51
5.5.2 FedEx ............................................................................................................ 52
6. CONCLUSION .......................................................................................................... 53
REFERENCES .............................................................................................................. 55

4
LIST OF TABLES Table 1 The target dose, dimensions, theoretical volume, theoretical and measured mass of prednisolone loaded PVA tablets [8] ......................................................................... 10 Table 2 Different Ingredient of Tablet and Their Role [1, 4] ........................................... 12 Table 3 Potentials Capabilities of Additive Manufactured Drugs [20] ............................ 23 Table 4 Levothyroxine Chemical Breakdown [45] ......................................................... 42 Table 5 Weight per chemical component of C15H10I4NNaO4H2O................................... 43 Table 6 Example Route from Pharmaceutical Company to Drugstore .......................... 47 Table 7 Supply Chain Distances from Different Distribution Centers with the Total Route from Pharmaceutical Company to Drug Store. Sample total Route from Eli and Lily Company to CVS (Stage) .............................................................................................. 47 Table 8 Travel Time from Pharmaceutical Company to Drug Store (hours) .................. 49 Table 9 Example of Market Penetration for Sample Drug Store (CVS on Stage Road) 51
5
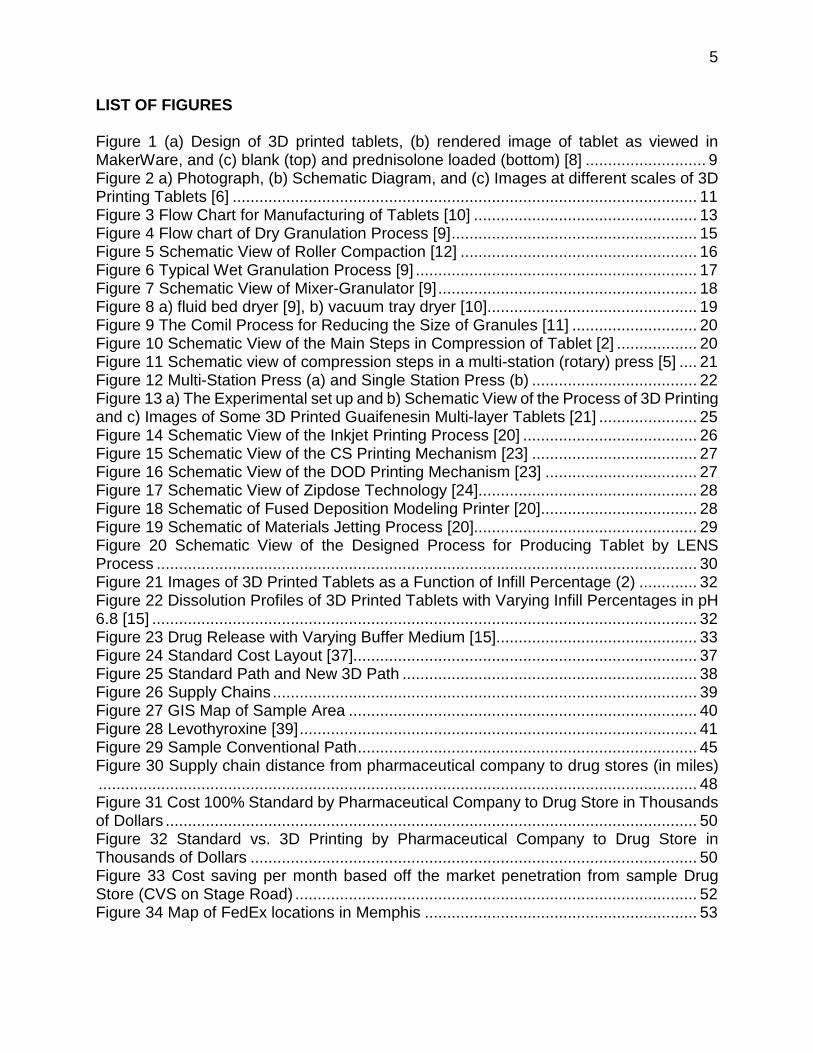
LIST OF FIGURES Figure 1 (a) Design of 3D printed tablets, (b) rendered image of tablet as viewed in MakerWare, and (c) blank (top) and prednisolone loaded (bottom) [8] ........................... 9 Figure 2 a) Photograph, (b) Schematic Diagram, and (c) Images at different scales of 3D Printing Tablets [6] ........................................................................................................ 11 Figure 3 Flow Chart for Manufacturing of Tablets [10] .................................................. 13 Figure 4 Flow chart of Dry Granulation Process [9] ....................................................... 15 Figure 5 Schematic View of Roller Compaction [12] ..................................................... 16 Figure 6 Typical Wet Granulation Process [9] ............................................................... 17 Figure 7 Schematic View of Mixer-Granulator [9] .......................................................... 18 Figure 8 a) fluid bed dryer [9], b) vacuum tray dryer [10] ............................................... 19 Figure 9 The Comil Process for Reducing the Size of Granules [11] ............................ 20 Figure 10 Schematic View of the Main Steps in Compression of Tablet [2] .................. 20 Figure 11 Schematic view of compression steps in a multi-station (rotary) press [5] .... 21 Figure 12 Multi-Station Press (a) and Single Station Press (b) ..................................... 22 Figure 13 a) The Experimental set up and b) Schematic View of the Process of 3D Printing and c) Images of Some 3D Printed Guaifenesin Multi-layer Tablets [21] ...................... 25 Figure 14 Schematic View of the Inkjet Printing Process [20] ....................................... 26 Figure 15 Schematic View of the CS Printing Mechanism [23] ..................................... 27 Figure 16 Schematic View of the DOD Printing Mechanism [23] .................................. 27 Figure 17 Schematic View of Zipdose Technology [24]................................................. 28 Figure 18 Schematic of Fused Deposition Modeling Printer [20] ................................... 28 Figure 19 Schematic of Materials Jetting Process [20].................................................. 29 Figure 20 Schematic View of the Designed Process for Producing Tablet by LENS Process ......................................................................................................................... 30 Figure 21 Images of 3D Printed Tablets as a Function of Infill Percentage (2) ............. 32 Figure 22 Dissolution Profiles of 3D Printed Tablets with Varying Infill Percentages in pH 6.8 [15] .......................................................................................................................... 32 Figure 23 Drug Release with Varying Buffer Medium [15] ............................................. 33 Figure 24 Standard Cost Layout [37]............................................................................. 37 Figure 25 Standard Path and New 3D Path .................................................................. 38 Figure 26 Supply Chains ............................................................................................... 39 Figure 27 GIS Map of Sample Area .............................................................................. 40 Figure 28 Levothyroxine [39] ......................................................................................... 41 Figure 29 Sample Conventional Path ............................................................................ 45 Figure 30 Supply chain distance from pharmaceutical company to drug stores (in miles) ...................................................................................................................................... 48 Figure 31 Cost 100% Standard by Pharmaceutical Company to Drug Store in Thousands of Dollars ....................................................................................................................... 50 Figure 32 Standard vs. 3D Printing by Pharmaceutical Company to Drug Store in Thousands of Dollars .................................................................................................... 50 Figure 33 Cost saving per month based off the market penetration from sample Drug Store (CVS on Stage Road) .......................................................................................... 52 Figure 34 Map of FedEx locations in Memphis ............................................................. 53

6
LIST OF EQUATIONS Equation 1 ....................................................................................................................... 9 Equation 2 ....................................................................................................................... 9 Equation 3 ..................................................................................................................... 10 Equation 4 ..................................................................................................................... 10 Equation 5 ..................................................................................................................... 43 Equation 6 ..................................................................................................................... 44 Equation 7 ..................................................................................................................... 44 Equation 8 ..................................................................................................................... 44 Equation 9 ..................................................................................................................... 44 Equation 10 ................................................................................................................... 44 Equation 11 ................................................................................................................... 44 Equation 12 ................................................................................................................... 45 Equation 13 ................................................................................................................... 45 Equation 14 ................................................................................................................... 45 Equation 15 ................................................................................................................... 45 Equation 16 ................................................................................................................... 45 Equation 17 ................................................................................................................... 45

7
1. INTRODUCTION The viability of using 3D printing for customized medicine, as an alternative biologistic method will be reviewed in this paper. “Traditionally, tablets and pills are made from powders in the manufacturing site of pharmaceutical companies, transported in controlled environment to pharmacies, and distributed between patients in need based on prescriptions.” With this new technology it is possible to instead get your prescription and bring it straight to the pharmacies and have them print it off right there in their store making storage less of a hassle. No longer would the pharmacies have to make sure to keep close tabs on the shelf life of the medicines because it wouldn’t be stored in such big shipments in house. Instead the pharmacies would have to have ingredients on hand to be able to print off prescriptions. Pharmaceutical companies make medicines based of a dosage that works for the average people, but what if medicines could be made and prescribed based off an individual’s needs and other medicines they had to take could be combined to produce just one pill or tablet for them to take. It would make getting children to take medicine so much more convenient if the pills and or tablets that were produced could be designed into something fun to take. 3D-printing, as known as rapid prototyping, or additive manufacturing is a newly emerging manufacturing technology that manufactures 3D shapes in a layer-by-layer fashion directly from digital drawings of seemingly complex shapes. The primary objective of this research is to identify the demand and service locations of LENS technology for a particular drug in this case levothyroxine. In order to do this an analysis of the competition of LENS technology with conventional ones by various market penetrations. The market penetrations were determined by the state of transportation network with and without LENS technology, and then ran through a cost benefit review. This was done to identify the feasibility and performance of the transportation network with LENS technology. A tablet is a pharmaceutical dosage form, which is defined as the solid unit medicine containing drug substance and some other ingredients and prepared from a powder mixture into a solid dose [1]. Regarding the physical form of the drugs, we can classify the dosage forms into four classes of solid, semi-solid, liquid and gaseous forms, among which solid dosage formulations have the highest usage rate, especially by the oral route [2]. Tablets are most widely used types of solid dosage formulations, which have been in existence since nineteenth century and are still in use. It is worth mentioning that two-thirds of all prescriptions belongs to solid dosage forms and half of these are presented as compressed tablets [3]. Tablets have some advantages, which have made them superior to other dosage formulations. Firstly, they have the best chemical, and microbiological stability because of higher resistance against temperature, humidity, oxygen and light. Secondly, tablets have better mechanical stability, as a result, they can be easily packaged, handled and shipped. In addition, they provide the best accuracy of dosage and they have the ability to release medicaments in a reproducible and predictable manner. They can also be

8
mass produced in low cost. All these advantages have made the tablets, the major types of solid dosage form widely used in today’s pharmacy [1–3]. However, tablets have some disadvantages in some cases. For example, some drugs have very low compressibility, so resist against being compressed into dense particles. Also in some cases when the drug has poor wettability, manufacturing tablets with intermediate to large dosages are very challenging for the formulators [4]. Thus, researchers are thinking of new manufacturing techniques for production of tablets, not only to tackle the abovementioned problems, but also allow us to produce personalized drugs with wider and more accurate dosage content. Recently, the researchers have turned their attention towards additive manufacturing processes and the great potential of these processes in producing a wide-range dosage of the drug, personalizing of the medicine, controlling the spatial distribution of the drug within the dosage form and the ability of producing complex shapes of pharmaceutical products for specific usages. So, in this study, firstly, we investigate the conventional methods of producing tablets, then the potential utilization of some additive manufacturing processes in producing tablets will be studied, and later on, the impact of production of tablets by additive manufacturing techniques on bio-logistics will be targeted.
2. LITERATURE REVIEW This section reflects on prior investigations done on this topic as well as other relating topics. 2.1 3D Printing Being a Viable Option Traditional manufacturing methods remain constant in companies; however, the cost of 3D printing is decreasing allowing it to be a great alternate option. 3D printing can also reduce manufacturing costs by decreasing the use of unnecessary resources. For example, a pharmaceutical tablet weighing 10 mg could potentially be custom-fabricated on demand as a 1-mg tablet. Some drugs may also be printed in dosage forms that are easier and more cost-effective to deliver to patients [5]. 3D printing technologies are already being used in pharmaceutical research and fabrication, and they promise to be transformative [6]. Advantages of 3D printing include precise control of droplet size and dose, high reproducibility, and the ability to produce dosage forms with complex drug-release profiles [7]. Complex drug manufacturing processes could also be standardized through use of 3D printing to make them simpler and more viable [6]. 3D printing technology could be very important in the development of personalized medicine, too [6].

9
2.2 Accuracy of 3D printed Oral Pill Medication Research shows different designs and elements in creating medicine tablets. Shown below in Figure 1 are the steps taken to create a pill. At first, the pill is given certain dimensions, and a rough sketch is created from that information chosen. Next, the pill is drawn in a 3D modeling software. Finally, the pill is tested to see how it responds when filled with the medication versus a blank pill.
Figure 1 (a) Design of 3D printed tablets, (b) rendered image of tablet as viewed in
MakerWare, and (c) blank (top) and prednisolone loaded (bottom) [8]
Blank and drug loaded PVA tablets were designed in an ellipse shape using Autodesk 3ds Max Design 2012 software version14.0 (Autodesk, Inc., USA) and saved in STL format (Figure 1a and 1b). The design was imported to the 3D printer’s software, Maker-Ware Version 2.4.0.17 (MakerBot Industries, LLC., USA) (Figure 1). A series of tablets with increasing volumes were printed by modifying the dimensions of the design: length, width and heights (L, H, W) without altering the ratios between these dimensions (W = H = 0.4 L). The volume of the design (V) was calculated as: Volume design [8]:
𝐯𝐯 = 𝛑𝛑𝐋𝐋𝟐𝟐𝐖𝐖𝟐𝟐𝐇𝐇 = 𝟎𝟎.𝟎𝟎𝟎𝟎𝛑𝛑𝐋𝐋𝟑𝟑 Equation 1
In order to make a correlation between the volume of the design and the mass of the printed tablet (M), a series of tablets of increased volume was printed and accurately weighed. A linear equation describing this relationship was established: Mass of the Printed Tablet [8]:
𝐦𝐦 = 𝟏𝟏.𝟎𝟎𝟑𝟑𝟐𝟐𝟐𝟐𝟎𝟎 + 𝟐𝟐𝟎𝟎.𝟖𝟖𝟖𝟖𝟖𝟖 Equation 2 Since the target dose D (mg) is calculated as:

10
Target Dose [8]:
𝐃𝐃 = 𝐌𝐌 ∗ 𝐒𝐒/𝟏𝟏𝟎𝟎𝟎𝟎 Equation 3 Where M is the mass of the tablet and S is the percentage of loading filament. Therefore, the required dimension (L) to achieve a target dose (D) from filament with loading percentage (S) can be calculated as: Required Dimension [8]:
𝐋𝐋 = �𝟐𝟐𝟐𝟐𝟏𝟏𝟎𝟎𝟎𝟎𝐃𝐃𝐒𝐒 − 𝟐𝟐𝟎𝟎.𝟖𝟖𝟖𝟖𝟖𝟖𝟏𝟏.𝟎𝟎𝟎𝟎𝟑𝟑𝟐𝟐𝟐𝟐𝛑𝛑
𝟑𝟑
Equation 4
Table 1 illustrates the details of dimensions, expected and measured mass of these tablets using equations 4 through 7 to determine the target dose, dimensions, theoretical volume, and measured mass of prednisolone loaded PVA tablets. Table 1 also shows the accuracy in with tablets can be made based on weight and dimensions. Table 1 The target dose, dimensions, theoretical volume, theoretical and measured mass of prednisolone loaded PVA tablets [8]
Tablet target dose (mg)
Dimension (L x W x H) (mm)
Tablet theoretical
volume (mm3)
Tablet theoretical mass (mg)
Tablet Measured
mass (mg) ± SD
2 8.39 x 3.36 x 3.36 74.23 101.52 102 ± 1.73 3 10.11 x 4.04 x 4.04 129.66 158.73 168.30 ± 1.43 4 11.29 x 4.52 x 4.52 180.92 211.64 216.18 ± 1.01 5 12.34 x 4.94 x 4.94 236.31 268.82 283.44 ± 5.03
7.5 14.00 x 5.60 x 5.60 344.71 380.71 396.67 ± 4.93 10 15.50 x 6.20 x 6.20 467.66 507.61 498.67 ± 5.69
From Figure 1 and Table 1 it is shown that it possible to make 3D printed tablets that are close to the accuracy of the mass chosen to print. 2.3 Unique Dosage Forms Pharmaceutical production done by 3D printing technology are currently created by inkjet-based or inkjet powder-based 3D printing, which is determined by if a material or a powder is used as the substrate [5]. Inkjet printers are used to spray formulations of medications and binders in small droplets at precise speeds, motions, and sizes onto a substrate. Spraying uniform “ink” droplets onto a liquid film that encapsulates it, forming micro particles and nanoparticles [5].In inkjet-based drug fabrication commonly used substrates include different types of cellulose, coated or uncoated paper, microporous bio ceramics, glass scaffolds, metal alloys, and potato starch films, among others [6]. Such matrices can be used to deliver small hydrophobic molecules and growth factors.

11
In powder-based 3D printing drug fabrication, the inkjet printer head sprays the “ink” onto the powder foundation. When the ink contacts the powder, it hardens and creates a solid dosage form, layer by layer that typically includes active ingredients as well as binders and other inactive ingredients. Once dry, the solid object is removed from the surrounding loose powder substrate [5]. These technologies offer the ability to create limitless dosage forms that are likely to challenge conventional drug fabrication [5]. 3D printers have already been used to produce many novel dosage forms, such as: microcapsules, hyaluronan-based synthetic extracellular matrices, antibiotic printed micro patterns, mesoporous bioactive glass scaffolds, Nano suspensions, and multilayered drug delivery devices, shown below in Figure 1. Ink drug formulations include a variety of active ingredients, such as: steroidal anti-inflammatory drugs, acetaminophen, theophylline, caffeine, vancomycin, ofloxacin, tetracycline, dexamethasone, paclitaxel, folic acid, and others [5]. Inactive ingredients used include: poly (lacticco-glycolic acid), ethanol-dimethyl sulfoxide, surfactants, Kollidon SR, glycerin, cellulose, propylene glycol, methanol, acetone, and others [5].
Figure 2 a) Photograph, (b) Schematic Diagram, and (c) Images at different scales
of 3D Printing Tablets [6]
2.4 Conventional Processes for Manufacturing Tablets The basic principles of tablet manufacturing process have not changed over the years since the inception of tablet compression. In the process of tablet manufacturing, tablets are produced by mechanically compressing the appropriate mixtures of drug substance and excipients as powder or granules between the two punches within a cylindrical die [9, 10]. Over the years, some developments have been utilized on the process of tablet manufacturing but the primary objective for these developments was focused on changing
12
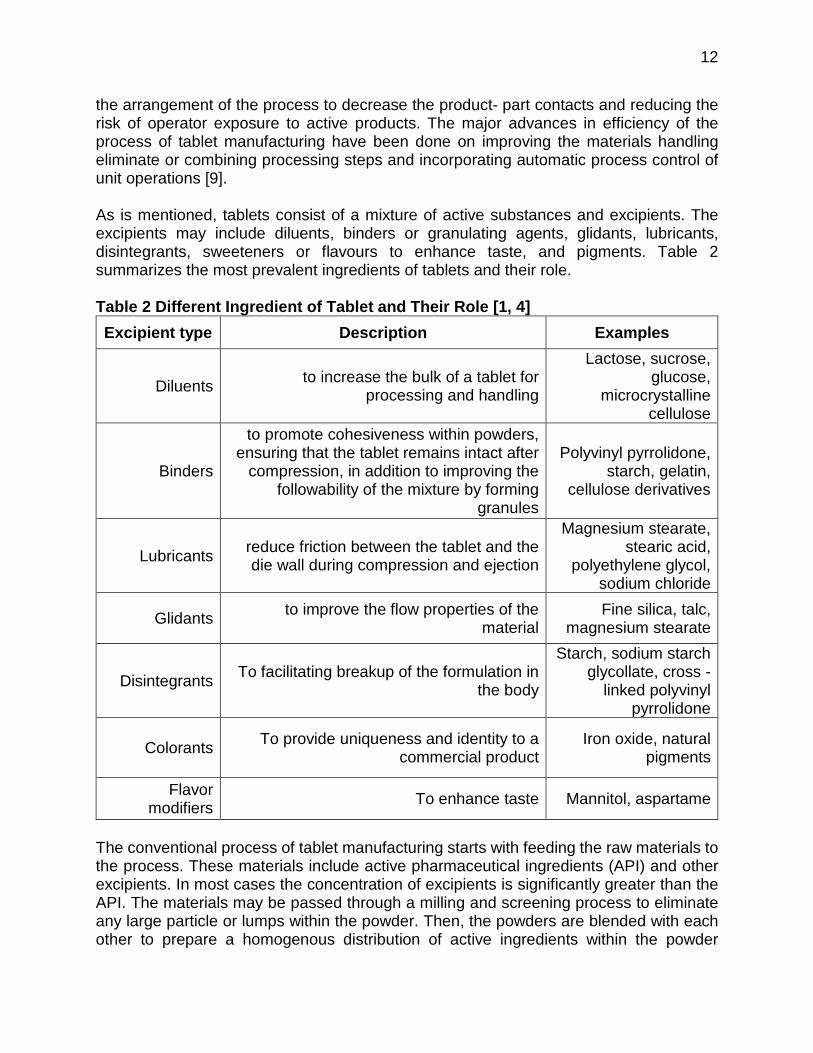
the arrangement of the process to decrease the product- part contacts and reducing the risk of operator exposure to active products. The major advances in efficiency of the process of tablet manufacturing have been done on improving the materials handling eliminate or combining processing steps and incorporating automatic process control of unit operations [9]. As is mentioned, tablets consist of a mixture of active substances and excipients. The excipients may include diluents, binders or granulating agents, glidants, lubricants, disintegrants, sweeteners or flavours to enhance taste, and pigments. Table 2 summarizes the most prevalent ingredients of tablets and their role. Table 2 Different Ingredient of Tablet and Their Role [1, 4] Excipient type Description Examples
Diluents to increase the bulk of a tablet for processing and handling
Lactose, sucrose, glucose,
microcrystalline cellulose
Binders
to promote cohesiveness within powders, ensuring that the tablet remains intact after
compression, in addition to improving the followability of the mixture by forming
granules
Polyvinyl pyrrolidone, starch, gelatin,
cellulose derivatives
Lubricants reduce friction between the tablet and the die wall during compression and ejection
Magnesium stearate, stearic acid,
polyethylene glycol, sodium chloride
Glidants to improve the flow properties of the material
Fine silica, talc, magnesium stearate
Disintegrants To facilitating breakup of the formulation in the body
Starch, sodium starch glycollate, cross -
linked polyvinyl pyrrolidone
Colorants To provide uniqueness and identity to a commercial product
Iron oxide, natural pigments
Flavor modifiers To enhance taste Mannitol, aspartame
The conventional process of tablet manufacturing starts with feeding the raw materials to the process. These materials include active pharmaceutical ingredients (API) and other excipients. In most cases the concentration of excipients is significantly greater than the API. The materials may be passed through a milling and screening process to eliminate any large particle or lumps within the powder. Then, the powders are blended with each other to prepare a homogenous distribution of active ingredients within the powder

13
mixture. Afterwards, a series of operations, called granulation, is performed to increase the bulk density and uniformity of the powder mixture and to prevent segregation of the drug. These operations may consist of slugging/roller compaction/agitating, drying milling, screening etc. Then, the mixture can be compressed to produce tablets. The produced tablets, then, may be coated. Afterward, they are packaged and sent to drug stores [2, 4, 10, 11]. The schematic of the process of tablet manufacturing is shown in Figure 3.
Figure 3 Flow Chart for Manufacturing of Tablets [10]
2.5 Granulation In most cases, direct compression of the powder mixture after blending does not results in appropriate tablets because the powder mixture is too fluffy and the compressibility of the powder mixture is weak. In addition, the active ingredients may segregate after blending. Therefore, the powder particles need to be combined in a process called granulation, which results in agglomerates, or granules, of powder blends. The bulk density of these granules is higher than that of the powder mixture and thus the flow ability and compatibility of the mixture is enhanced. Moreover, segregation of the ingredients in the blended mixture is reduced to a great extent [11, 12]. Granulation process consists of a series of operations. The design and control of these operations are significantly important in producing pharmaceuticals with high quality, because the final quality of the pharmaceuticals depends on reliable performance of these operations [9]. However, these operations are designed with regard to some limitation

14
from the type of the ingredients since some ingredients are sensitive to moisture or they are unable to withstand the elevated temperature. Generally, granulation procedure can be divided into two main groups; dry granulation and wet granulation, which are explained in the following sections. 2.6 Dry Granulation In this process, the powder particles are combined to each other by compression methods followed by milling. This process is applied mostly when the ingredients are sensitive to moisture or they cannot withstand high temperatures during drying. Dry granulation is carried out by applying mechanical force to densify and compact powders together, which forms dry granules. This compaction force can be applied by slugging punches or by roller compactors. The slugging process produces tablet-like structures, which can then be reduced to granules by milling, while the roller compactor results in flake-like compacts, which should be broken into small segments, then they can be converted into granules with desirable size distribution by the subsequent milling. It is noticeable that during dry granulation, using a dry lubricant such as magnesium stearate is compulsory to reduce the friction between the powder particles and facilitate granulation. It is also worth mentioning that dry granulation has the advantages of elimination of the granule drying step, shorter processing time and lower capital investment and utility costs. Moreover, it can be applied to moisture-sensitive APIs [11–13]. Figure 4 shows a flow diagram for a dry granulation process. In roller compaction process, powders are fed by means of horizontal/vertical spirals onto a set of counter rotating rolls. As the powders touch the surface of the rolls, they are conveyed forward with the motion of the rolls. Since the powders are pressurized on the rolls by the motion of the feeding spirals, the slipping of the powders is reduced at the surface of the rolls. When the powders reach the point where the rolls are closest together, compression occurs and a compact ribbon is formed. The compacted ribbon is then released on the other side of the rolls (Figure 5). The different equipment available for roller compaction varies mostly in terms of configuration. Rolls can be arranged either horizontally (with ribbons coming out parallel to the floor), vertically (with ribbons coming out perpendicular to the floor) or at some intermediate angle. In addition, the rolls also may be fixed with a constant roll gap throughout the process, or they can be adjustable so that the gap between the rolls can be changed during processing. They can also differ whether the surface of the rolls is smooth or knurl (rough/with grooves) or have pocket design. The operating parameter which can affect the performance of roller compaction process are the feed rate of powder to the rolls, the roll speed and the compaction pressure applied to the powder, which is a function of the roll gap [11, 13]. 2.7 Wet Granulation In wet granulation process, the dry powder mixture is blended with a liquid binding. In

15
blending the powder mixture is agitated, which cause granule nuclei to form. By continuing the agitation, these granules may grow, coalesce or break as a result of collision at high speed and significant shear. So, the final properties of the granules may
Figure 4 Flow chart of Dry Granulation Process [9]

16
Figure 5 Schematic View of Roller Compaction [12]
be influenced by the properties of the powder blend, type of binder, the binder content in the mixture, and granulation method [10, 11]. The flow chart of wet granulation is shown in Figure 6. Wet granulation can be performed using a variety of techniques and equipment but the most common method for wet granulation is the mixer-granulator. This method combines the powder mixing, wetting and granulating (Figure 7). The efficiency of these machines are so high that can perform the granulation process in a couple of minutes. The process steps for wet granulation in mixer-granulators can be summarized as follows:
• mixing of the dry ingredients by means of a high speed impeller; • Adding the liquid binder and spraying onto the dry material; • Granulation step; • Discharging the wet granules.
This method has some advantages including:
• The granulation is performed in a single unit which can be integrated with subsequent-stage equipment, thus granulation is done very fast with minimum dust emissions;
• Granule characteristics can be adjusted easily by changing step times and binder addition rates.
However, this method requires high energy input provided by the agitators. Moreover, size distribution of the powder mixture may vary during the process as a result of mechanical breakdown of ingredient particles. In addition, a non-uniform wetting may cause over-sized granules.

17
Figure 6 Typical Wet Granulation Process [9]
The produced wet granules, then requires to be dried, milled and blended with lubricants so that it can be used to produce tablets in the subsequent compression step. In most cases, however, the discharged wet granule will be further reduced in size by passage through a coarse screen sieve prior to drying, in order to improve drying rates and consistency. Drying is one of the most important operation in producing tablets. The objective of this step is to keep the residual moisture low enough to provide acceptable flow-ability and reduce the risk of deterioration. The conventional dryers, used after wet

18
granulation, include fluidized-bed dryer and vacuum tray dryer, which are shown in Figure 8.
Figure 7 Schematic View of Mixer-Granulator [9]
2.8 Milling After the granules have been produced, their size should be homogenized and reduced. This goal is accomplished through milling process. Conical screen mills, such as comils, are usually used for coarse to fine control of wet or dry granule size (Figure 9). Other milling technologies; however, may be used if a smaller final particle size is desired. In Conical screen mills, an impeller inserted into the center of a cone shaped screen. As the impeller rotates, the granules are agitated and grounded over the screen until they become smaller and smaller and can pass through the screen. The most important operating parameters include powder feed rate and agitator speed, while the design parameters such as the screen mesh size, the size of the cone, the impeller shape and the impeller to screen distance can also affect the efficiency of the process.

19
Figure 8 a) fluid bed dryer [9], b) vacuum tray dryer [10]
2.9 Compression In this step, the powder blends are compacted to form a hard compact. The compression is performed by means of a tablet press, which contains several components integrated as a single processing unit or station. At first, the powder or granular materials are conveyed into the press machine and preserved in a reservoir. The materials are then transferred from the reservoir to the die through a feed frame (feed shoe). Afterward, the materials are compressed within the die between the two punches to form a tablet. After compression, the lower punch can help the compacted tablet to be ejected from the die and the die is prepared to be filled for the next tablet compression. The schematic view of the compression process is shown in the Figure 10.

20
Figure 9 The Comil Process for Reducing the Size of Granules [11]
Figure 10 Schematic View of the Main Steps in Compression of Tablet [2]
Tablets presses are classified either single punch or multi-station rotary presses. In case of single punch machine, all of the compression is applied by the upper punch, making the single punch machine a “stamping press”. While, in multi station presses, the head of the tablet machine holds the upper punches, dies, and lower punches, which can rotate and as their head rotates, the punches are guided up and down by fixed cam tracks, which control the sequence of filling, compression and ejection. So, the multi station presses are also called rotary presses. Figure 11, shows a schematic view of the compaction process in a multi- station (rotary) press. Generally, single punch presses are primarily used in the small scale product development role. Rotary presses are engineered for fast and economical production of all kind of tablets. These machines have higher production rate and larger machines can readily produce several million tablets each in a working day. Figure 12 also shows the single punch tablet machine and rotary tablet machine.

21
Figure 11 Schematic view of compression steps in a multi-station (rotary) press
[5]
As is fore mentioned, material properties can significantly affect tableting performance. Wide particle size distributions or variability in density can result in segregation during die filling, causing non-uniform tablet composition. Low bulk density, poor compressibility or flow properties can affect die filling and the pressure profile during compaction, resulting in tablet weight variability and insufficient tablet hardness. So to tackle this problems, granulation operations are performed on the powder mixture. However, in the case of a few powder mixtures, we do not have such problems, therefore we do not need them to be granulated, and therefore they are directly compressed without the need to be granulated. This process of producing tablet without granulating is called direct compression and is only applicable to only a few powder mixtures. This process avoids the cost and inconvenience of granulation, but often requires the use of special binding agents to avoid segregation during mass flow of the mix in the tablet compression process [10, 11]. 2.10 Additive Manufacturing Processes Additive manufacturing processes are the operations of producing a 3D objects by depositing or binding materials in successive layers. Additive manufacturing was initially considered a process for rapid prototyping; however, it is now being considered a process for manufacturing process for producing complex and/or customized objects. The use of additive manufacturing techniques in engineering through biomedical applications has been drastically growing over the last 30 years [14]. The application of these technologies into the field of drug delivery has been investigated [14–19] and more recently realized

22
Figure 12 Multi-Station Press (a) and Single Station Press (b)

23
Table 3 Potentials Capabilities of Additive Manufactured Drugs [20] Benefit Category
3D Printing Capabilities
Example usage of drug
Potential Medical and economic benefits
Increased product complexity
Producing difficult-to-make shapes
• Highly porous products that orally disintegrate
• Toroidal products with approximately zero-order release
• Improved drug effectiveness
• Reduced side effect
• New Therapies based on combination products
Control the spatial distribution of API
• Excipient gradient that modify drug release
• Control over API polymorphic form during printing
personalization Producing an infinite variety of shapes with the same equipment
• Personalizes dosing for potent drugs
• Personalized dosing for growing children
• Drug-loaded implants that match the anatomy of individual patients
• Custom shapes for children
• Reduced side effects
• Appropriate doses for children
• Reduced complications after implantation
Varying composition within simple, modular design
• “Polypills” that combine different drugs and release mechanisms into single doses • Hollow products with variable in-fill to control drug release rate
• Reduces medical burden for the elderly
• Appropriate drug release based on the patient’s anatomy and drug metabolism
On-demand manufacturing
Rapid printing from digital designer
• Printing in emergency setting
• Reducing barriers to experimentation during drug product development
• Expand capabilities for surgery and emergency medicine
• Reduced time to market for new drugs

24
Table 3 Potentials Capabilities of Additive Manufactured Drugs [20] (Continued) Printing at
the point-of-care
• Drugs with limited shelf lives
• New drugs brought to market
with the FDA approval of the 3D printed tablet, Spritam (levetiracetam) [19], which emphasizes the capabilities of 3D printing to manufacture complex and customized dosage forms. The advantages of additive manufacturing techniques in producing dosage forms over traditional method are the ability to accurately control the spatial distribution of an active pharmaceutical ingredient (API) within a dosage form, produce complex geometries, deposit very small amounts of API, reduce waste and allow for rapid fabrication of varying compositions to allow for screening activities or preparation of individualized dose strengths. These benefits are summarized in Table 3. 2.11 Common Steps in Additive Manufacturing Methods Although there are a variety of additive manufacturing methods with different input materials, most 3D printing processes follow the same basic procedure, including
1- Preparing the 3D model using a Computer-Aided-Design (CAD) software; 2- Conversion of the design to a machine-readable format (STL format); 3- Raw material processing: Raw materials may be processed into granules,
filaments or binder solutions according to desired additive manufacturing process;
4- Printing process by adding raw materials layer by layer in an automatic manner to produce the desired product;
5- Removal and post processing; 2.12 Various additive manufacturing methods used for drug product manufacturing 2.12.1 Room-temperature extrusion: For the first time, this process has been utilized by S. A. Khaled and his coworkers at the University of Nottingham, UK (2014) for production of pharmaceuticals [15]. The advantage of this process is that the dosage form can be produced in a single step at a low cost using a desktop 3D printer. This process has also this potential to allow patients to be given an accurate and personalized treatment regime, which could include multiple active ingredients, either as a single blend or potentially as layers in a multi-layer printed tablet. However, the restriction of this method is that this process is excipients selected based and the feedstock for printing should have the capability to take the form of a viscous paste. This process was performed for producing guaifenesin tablets and hydroxypropyl-methylcellulose (HPMC) was used as binder. As mentioned before, this process requires

25
a viscous feedstock. The feedstock should be prepared by processing the binder(s) to achieve a gel like material. Then a paste(s) are prepared by adding API and other excipients into the gel. Regarding the desired layer composition, different pastes can be prepared. Then each paste can be filled in a separate syringe (cylinder) and printed according the given model. Figure 13 shows a photograph and also schematic diagram which was utilized by Khaled et al for producing guaifenesin tablets.
Figure 13 a) The Experimental set up and b) Schematic View of the Process of 3D
Printing and c) Images of Some 3D Printed Guaifenesin Multi-layer Tablets [21]
2.12.2 Binder Deposition Binder Deposition (inkjet printing) is the primary 3D printing technology used for pharmaceutical production on powder beds. This process, which was first developed at the Massachusetts Institute of Technology (1992), was later adopted for use as a process for drug production [14]. This process is based on the deposition of binder on the powder

26
bed. At first, a layer of powder is spread onto the powder bed, on which the samples (drug) are to be created. A print head, similar to that used in inkjet printers and can move in X–Y directions, spray formulations of drug or binders in small droplets onto the powder bed, while unbound portion of powder bed serves as the support material for proceeding layers in porous structures. When the first layer is constructed, the platform is driven down in Z direction for a one-layer-thickness and this procedure can continue until the whole sample (tablet) is produced [15, 17, 20]. The schematic view of the inkjet printing configuration is illustrated in Figure 14.
Figure 14 Schematic View of the Inkjet Printing Process [20]
The liquid formulation which can be used for printing on the powder bed may contain a binder only, and the powder bed may contain the active ingredient (API) with additional excipients, or alternatively APIs can be jetted onto powder beds as solutions or Nano-particle suspensions [21]. Producing the binder droplets to deposit is based on the Lord Rayleigh’s instability theory, which explain the breaking of a liquid stream or jet into droplets. Using this concepts, two mechanisms were developed; continuous stream (CS) and drop-on-demand (DOD) printing process [22]. In CS printing a stream of the binder is produced by applying pressure on the surface of the binder within the reservoir. The stream of binder is changed into droplets because of the surface energy and weight, which are then charged and directed using an electrostatic field to the substrate or waste (Figure 15). However, in DOD mechanism, the droplets are produced using an actuation system, which can be

27
thermal, piezoelectric etc. In thermal print mechanism, a resister is used to convert electrical pulse into heat and form a vapor bubble in the binder reservoir. This bubble can force the binder to come out of the nozzle as a droplet (Figure 16a), whilst in piezoelectric mechanism, droplets are produced as a result of deflection, which can occur in the piezoelectric element. This deflection can create a pressure wave that can eject droplets out of the nozzle (Figure 16b)
Figure 15 Schematic View of the CS Printing Mechanism [23]
Figure 16 Schematic View of the DOD Printing Mechanism [23]
It is worth mentioning that this process has been recently utilized and adopted for mass production of drugs by Aprecia Pharmaceuticals Company and FDA also approved the first 3D printed drug product (SPRITAM, levetiracetam) in 2015. In Aprecia’s 3D technology, which is also called Zipdose technology, the tablets are produced layer by layer on a rolling belt, instead of a stationary powder bed and powders layers are spread in several stations. The schematic view of Zipdose technology is shown in Figure 17.

28
Figure 17 Schematic View of Zipdose Technology [24]
2.12.3 Fused deposition modeling (FDM) This method, which is also called Fused Filament Fabrication (FFF), is developed by Scott Crump of Stratasys. It is an interesting additive manufacturing method, especially growing in pharmaceutical manufacturing. Unlike binder deposition method, which requires a powder bed, this method can print on any substrate; however, it needs a feed stock in the form of polymeric filament, which can be fused and printed in desired position. A gear system drives the filament into a heated nozzle assembly, where it can be heated by
Figure 18 Schematic of Fused Deposition Modeling Printer [20]

29
temperature control unit to a semi-molten state. Then the semi-molten material is extruded out of the nozzle and deposited horizontally to form one cross section of the part. The stage then lowers and another layer is deposited in the same way. These steps are repeated to complete the 3D structure of the tablet in a layer-by-layer manner (Figure 18). For filament preparation, a thermoplastic polymer such as polylactic acid (PLA) or acrylonitrile butadiene styrene is usually used. In addition, the method also has this advantage to create objects (tablets) from multiple material types by printing and subsequently changing the print material, which enables more user control over device fabrication. 2.12.4 Materials Jetting In this process, the feed materials are powders, which are deposited by one or more nozzles. These powders can be deposited by gravity or by using a pressurized carrier gas. While the powders are being deposited, some form of energy (Laser, UV, etc.) focused onto the material and melt them, so the melted material is deposited to on the substrate or the previously deposited part and form a monolithic part [25]. The most common method in this group is Laser Engineered Net Shaping (LENS) which uses high-powered laser beam.
Figure 19 Schematic of Materials Jetting Process [20]
Therefore, in spite of binder printing technology, this method does not require a powder bed. So the feed powder mixture should be formulated somehow to be jetted, melted and rapidly solidified. Another advantage of this process over binder jetting is resolution because in inkjet droplets the resolution is limited by the minimum size of the droplets,

30
which is about 100 μm in diameter [23]. On the other hand, this method is superior to the FDM technique in terms of using powdery material as feed and it does not need to prepare filament. The schematic of this process is shown in Figure 19. Therefore, this method has a great potential in producing bio-products and it has been also utilized for producing tissues or drug delivery systems [24]; however, to the best knowledge of the authors of this paper, there is no published work on the direct production of drugs (tablets) using this method. So, we have adopted this method and designed a device suitable for producing tablets. In our design, tablets can be produced with given shape and dosage out of powdery raw materials including active part ingredient (API), binders etc. The binders should be biodegradable polymer which can be melted by heating. The potential binder for this work is polylactic acid (PLA), which has also been used in other polymer based drugs and also has been approved by FDA for pharmaceutical applications [25]. The device consists of two or more containers (bins) for raw materials (depending on the number of ingredients) and each bin is temperature and atmosphere controlled (the atmosphere is controlled by circulation of Ozon or Nitrogen gas). The powder feedstock is transported from bins towards the nozzles by means of materials handing section, which works based on gas pressure. The flow of each kind of ingredient can be controlled according to the desired final dosage of the tablet.
Figure 20 Schematic View of the Designed Process for Producing Tablet by LENS Process

31
The powders are deposited through the nozzles into the molds, which are mounted on a roller belt. Several molds have been mounted on the roller belt. As the roller belt is rotating, the molds can go through different sections of production line:
• In the depositing section, the powders are depositing through the nozzles into the mold and are consolidated by irradiation of UV or Laser beam.
• Then the deposited tablet goes through the cooling section, in which the tablet will be allowed to cool down.
• As the rotation of the roller belt is continued, the mold reaches the end of the belt, where the molds is in a position of releasing the tablet and all the produced tablets are collected in the collecting box.
• The mold can then continue moving with the rotation of the belt, and go through the deposition section for another production round.
The schematic of the described procedure has been shown in Figure 20. 2.13 Complex Drug-Release Profiles The creation of medications with complex drug-release profiles is one of the most researched uses of 3D printing [5]. Traditional compressed dosage forms are often made from a homogeneous mixture of active and inactive ingredients, and are thus frequently limited to a simple drug-release profile [26].However, 3D printers can print binder onto a matrix powder bed in layers typically 200 micro meters thick, creating a barrier between the active ingredients to facilitate controlled drug release [26]. 3D-printed dosage forms can also be fabricated in complex geometries that are porous and loaded with multiple drugs throughout, surrounded by barrier layers that modulate release [26]. Implantable drug delivery devices with novel drug-release profiles can also be created using 3D printing [26]. Unlike traditional systemic treatments that can affect non-afflicted tissue, these devices can be implanted to provide direct treatment to the area involved [26]. Bone infections are one example where direct treatment with a drug implant is more desirable than systemic treatment [26]. Fortunately, powder-based 3D-printed bone scaffolding can be created in high-resolution models with complex geometries that mimic the natural bone extracellular matrix [26].The printing of medications with customized drug-release profiles into such bone implant scaffolds has been studied [26].One example is the printing of a multilayered bone implant with a distinct drug-release profile alternating between rifampicin and isoniazid in a pulse release mechanism [7].3D printing has also been used to print antibiotic micro patterns on paper, which have been used as drug implants to eradicate Staphylococcus epidermidis [26]. In other research concerning drug-release profiles, chlorpheniramine maleate was 3D printed onto a cellulose powder substrate in amounts as small as 10 to 12 moles to demonstrate that even a minute quantity of drug could be released at a specified time [26]. Dexamethasone has been printed in a dosage form with a two-stage release profile [7].Levofloxacin has been 3D printed as an implantable drug delivery device with pulsatile and steady-state release mechanisms [26].This study displayed improved accuracy for

32
the release of very small drug doses compared with conventionally manufactured medications, which is shown in Figure 2. It can be seen from the photographs in Figure 21 that the tablet weights and physical dimensions increased with increasing infill percentage. There is a very good linear relationship between the infill and the tablet weight (r2 = 0.9741), suggesting that it could also be possible to control the drug dose by varying the infill percentage. The infill percentage also slightly increased the thickness of the tablets (the lengths remain almost constant). For dissolution, testing tablets were selected with low (10%), medium (50%) and high (90%) infill. Dissolution tests were conducted in modified Hank’s bicarbonate buffer that has a pH of 6.8 and represents intestinal fluid of the human body [7].
Figure 21 Images of 3D Printed Tablets as a Function of Infill Percentage (2)
From Figure 22 it is shown that depending on the amount of infill a drug is produced with affects the rate at which it dissolves within the human body. Therefore, for a drug that a fast action is needed to be introduced to the body little to now infill should be added.
Figure 22 Dissolution Profiles of 3D Printed Tablets with Varying Infill
Percentages in pH 6.8 [15]

33
For a mild drug release that is to be taken every couple of hours or so would need the same small dose of infill like the 10% infill tablet shown. However, for drugs that you take once a day to help with an illness that you want the effects of the drug to last you would need a larger infill amount closer to the 90% infill tablets [15]. The dissolution data presented in Figure 22 shows that all formulations displayed sustained release of guaifenesin over a period of 12 hours. An initial burst release guaifenesin occurred from the IR layer of the formulations. This initial high amount of guaifenesin is attributed to the inclusion of the disintegrants; MCC and SSG. Disintegrants are designed to cause tablets to break up on exposure to water and rapidly release any active ingredients. The initial release of guaifenesin from the formulations with a low concentration of HPMC 2208 in GBT-HPMC(6%, w/w) and (8% w/w) GBT-HPMC was higher (75% in two hours)compared to the drug release in the same time period of 65%and 57% from GBT-HPMC (10%, w/w) and GBT-HPMC (14%, w/w),respectively. This is related to release of guaifenesin from the IRlayer. The 3D printed formulations clearly also have a different geometry and surface area compared to the standard tablets, and hence some difference in drug release as is observed would be expected [15].
Figure 23 Drug Release with Varying Buffer Medium [15]
Figure 23 therefore shows that different buffer the guaifenesin is made with has the ability to effect the rate at which it will dissolve with over time. Meaning that different buffers can

34
be included in 3D drug printing to have different drug release time for people with different metabolisms and tolerances to different drugs. 2.14 Personalized Drug Dosing The purpose of drug development should be to increase efficacy and decrease the risk of adverse reactions, a goal that can potentially be achieved through the application of 3D printing to produce personalized medications [20, 27–29]. Oral tablets are the most popular drug dosage form because of ease of manufacture, pain avoidance, accurate dosing, and good patient compliance [29]. However, no viable method is available that could routinely be used to make personalized solid dosage forms, such as tablets [29]. Oral tablets are currently prepared via well-established processes such as mixing, milling, and dry and wet granulation of powdered ingredients that are formed into tablets through compression or molds [30]. Each of these manufacturing steps can introduce difficulties, such as drug degradation and form change, possibly leading to problems with formulation or batch failures [30]. In addition, these traditional manufacturing processes are unsuitable for creating personalized medicines and restrict the ability to create customized dosage forms with highly complex geometries, novel drug-release profiles, and prolonged stability [5]. Personalized 3D-printed drugs may particularly benefit patients who are known to have a pharmacogenetic polymorphism or who use medications with narrow therapeutic indices. Pharmacists could analyze a patient’s pharmacogenetic profile, as well as other characteristics such as age, race, or gender, to determine an optimal medication doses. A pharmacist could then print and dispense the personalized medication via an automated 3D printing system. If necessary, the dose could be adjusted further based on clinical responses [5]. 3D printing also has the potential to produce personalized medicines in entirely new formulations—such as pills that include multiple active ingredients, either as a single blend or as complex multilayer or multi-reservoir printed tablets. Patients who have multiple chronic diseases could have their medications printed in one multi-dose form that is fabricated at the point of care. Providing patients with an accurate, personalized dose of multiple medications in a single tablet could potentially improve patient compliance. Ideally, compounding pharmacies could dispense 3D-printed drugs, since their customers are already familiar with purchasing customized medications [5]. 2.15 3D Printing Summary 3D printers can make useable drugs that may be customized to synthesize a patients’ necessary medication as well as dosage level. Microcapsules, hyaluronan-based synthetic extracellular matrices, antibiotic printed micro patterns, mesoporous bioactive glass scaffolds, nanosuspensions, and multilayered drug delivery devices can be printed using a 3D printer. Two aminosalicylate isomers used in the treatment of inflammatory bowel disease (IBD), 5-aminosalicylic acid (5-ASA, mesalazine) and 4-aminosalicylic acid

35
(4-ASA), were selected as model drugs. Zero infill means the tablet is hollow. The percent of infill changes the density and mechanical strength [7, 15]. The smaller the drug size the more accurate the dosage of the drugs. The size of the tablets remains constant while the weight increases with the increase of infill. The small the drug size the more accurate the drugs [8]. Infill percentages can increase the time release of such drugs. 3D printers are very close to producing drugs with identical dosages as the target dosages [8]. 2.16 Most Common Drugs Prescribed and Costs Levothyroxine is used to treat hypothyroidism, a condition in which the thyroid gland doesn’t produce enough thyroid hormone. This drug also is used to treat thyroid cancer and to help shrink an enlarged thyroid gland. The price range for this drug is between $4-$16 [31]. Hydrocodone/acetaminophen is the nation’s most popular painkiller used to treat moderate to severe pain. Hydrocodone, a narcotic analgesic, relieves pain through the central nervous system, and it also is used to stop or prevent coughing. This drug’s reputation precedes it, as it can become habit-forming when used over an extended period of time. This drug has a cost of $12 to $20 [31]. Lisinopril (which used to be sold under the brand names Zestril and Prinivil) is a high blood pressure medication. Its main function is to block chemicals in the body that trigger the tightening of blood vessels. Lisinopril also is used to treat heart failure. The cost for this drug is $4 to $12 [31]. Metoprolol, the generic version of Lopressor, is used to treat high blood pressure and also helps reduce the risk of repeated heart attack. Metoprolol also treats heart failure and heart pain, or angina. This drug costs from $4 to $13 (7). Atorvastatin, the generic of Lipitor, is prescribed to treat high cholesterol and is typically recommended in conjunction with diet changes. This drug is believed to have a variety of benefits, including helping prevent heart attacks and strokes. This drug cost from $15 to $51 [31]. 2.17 Top Pharmaceutical Companies [32] The top five pharmaceutical companies in the United States are Gilead Sciences, Johnson & Johnson, Pfizer, Roche and Novartis [33]. Gilead Sciences, headquarters located in Foster City, CA, with nine other locations, had an annual net income of $18.11 billion in 2015 and revenue of $32.64 billion. Johnson & Johnson, headquarters in New Brunswick, NJ, had an annual net income of $15.41 billion in 2015 and market cap of $313.29 billion. The market cap for Pfizer, headquarters located in New York City, NY, with 6 research and development locations, was $209.33 billion and a net income of $15.41 billion in 2015. For Roche, a Swiss company with 5 US facility locations, the net income in 2015 was $8.86 billion, with a market cap at $210.55 billion. In 2015, the net income for Novartis, another Swiss company has eleven US pharmaceutical locations, was $6.76 billion, having a market cap of $177.41 billion.
36
2.18 Pharmaceutical Companies Costs Companies have made significant improvements to manufacturing, service and maintenance operations through lean techniques: eliminating waste, inflexibility and variability in their systems and reducing costs by up to 50% in the process. Yet few apply the same lean techniques in warehouse operations or transportation, even though they can have a dramatic effect. These operations represent 95% of the pharmaceutical logistics costs and, in our experience, companies can save 20-50% in warehousing and up to 40% in transportation [34]. As in warehouse operations, companies that focus on transportation cost drivers gain on two fronts: they can control cost overruns or reduce current costs, and they can improve customer service and satisfaction by tailoring services, such as lead times and delivery frequencies, to customer needs and offering special services where they matter most. In a recent example, a pharmaceutical company reduced 25-30% of total transportation costs on the countries inspected [34]. While pharmaceutical companies can save as much in transportation as they can in warehouse operations, delivering those savings requires a different approach. If companies have historically ignored their warehouse operations, at least they began with a good idea of the size and location of their facilities. Transportation costs, by contrast, come from many hundreds of thousands of widely distributed individual operations every year [34]. Complexity is what makes transportation difficult to improve. Many pharmaceutical companies have tremendous variability in their transport operations, with different customers demanding different service levels and a multitude of transport providers delivering services in different ways [34]. Companies can cut through this complexity, however. By building a full picture of their transportation operations, they can see, often for the first time, exactly where to find the primary drivers of transportation cost. Armed with this information, they can identify and exploit opportunities and save up to 20 or even 30% of transportation costs [34]. One large pharmaceutical player began optimizing transportation by analyzing historical transport data for a full year. It collected information and analyzed each delivery (e.g., shipment types, sizes, modes of transport, provider, customer, region, type of service and cost) to understand the real drivers of transportation costs [34]. The analysis revealed that three critical service categories that had a disproportionate effect on transportation costs: 2.18.1 Temperature-controlled Distribution While 98% of product by weight passed through the firm’s ambient distribution chain, the 2% that had to be shipped in refrigerated vehicles accounted for a quarter of all shipments— and nearly half total transportation costs [34].

37
2.18.2 Special delivery services Express shipping guaranteed by 10 AM the next day can cost two to five times more than conventional 24-hour delivery. These special deliveries represented only 1% of the shipments but accounted for most of the excess cost [34]. 2.18.3 Shipment size The vast majority of shipments weighed less than five kilos, but these small shipments cost the company around six times as much per kilogram as larger shipments. Even where the company did manage to consolidate deliveries into larger shipments, it usually failed to capture all the available savings; by weight, a quarter of product was shipped in the lowest cost bracket, but nearly half fell into the next price bracket up [34]. For the pharmaceutical industry, future market plans, include expanding the number of distribution channels. The additional channels will add shipping routes, increasing shipments with new products utilizing larger, heavier shipping containers [35]. These new products are temperature-sensitive; therefore, the freight costs are higher when products are shipped [15]. This explains why rising fuel prices, labor and truck costs are important and will prove vital to the pharmaceutical industry [36].In Figure 24, an example of the layout of standard costs are shown.
Figure 24 Standard Cost Layout [37]

38
2.19 3D Printer Costs The two 3D printers that are viable options for printing oral medication are inkjet-based or inkjet powder-based 3D printers [6]. These range for about $1300. This printer is known as Plan B developed by Yvo de Haas. The printer is built from pieces of shelf inkjet printer, like ink cartridges, and has an aluminum frame. While it is slower than current 3D printers, Plan B is significantly cheaper and uses technology involving a fine powder instead of melting plastic. The new printer can, in fact, use any material that can be turned into powder, making it extremely versatile [37, 38]. The initial cost of buying a pill producing 3D printing is the cost of purchase of the machine. Materials necessary to conduct that procedure may include the chemical inks and powders used to make oral pills such as steroidal anti-inflammatory drugs, acetaminophen, theophylline, caffeine, vancomycin and inactive drugs, vary in cost. Maintenance costs for a 3D printer are relative to the issues presented by the machine, which include replacing ink or powder supplies. The long-term costs are that of maintaining constant supply of materials that are good on shelf life, as well as replacing or repairing any damage or issue to the machine. New machines last from 1 to 3 years before needing complete replacement.[37, 38].
Figure 25 Standard Path and New 3D Path
39
2.20 Profit and Advantages In terms of savings, the cost of shipment will decrease significantly due to the lack of steps necessary for the production of the medication. This means that the cost of labor will be cut, as well as the amount of substance being transported, while still improving the quality and time. Figure 25 shows the flow of each network, the routes taken from origin to destination in both the standard method and new method.
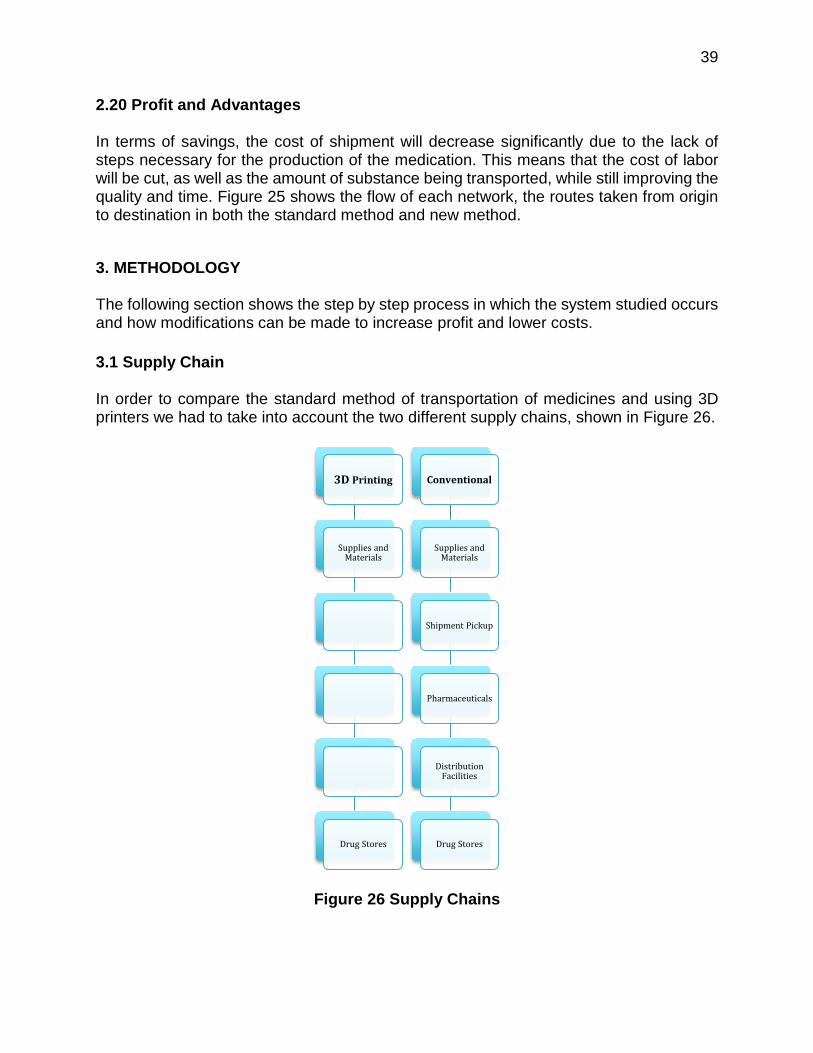
3. METHODOLOGY The following section shows the step by step process in which the system studied occurs and how modifications can be made to increase profit and lower costs. 3.1 Supply Chain In order to compare the standard method of transportation of medicines and using 3D printers we had to take into account the two different supply chains, shown in Figure 26.
Figure 26 Supply Chains
3D Printing
Supplies and Materials
Drug Stores
Conventional
Supplies and Materials
Shipment Pickup
Pharmaceuticals
Distribution Facilities
Drug Stores

40
Once the supply chain had been determined a sample area was determined to start formulating what general information was needed. Given our area shown in Figure 27 has a just the Shelby county area displayed.
Figure 27 GIS Map of Sample Area

41
3.2 Sample Drug Once the sample area was produced with the different origin and destination stops, a product had to be determined. The product decided on was one mentioned before in the literary review section, Levothyroxine shown in Figure 28 below.
Figure 28 Levothyroxine [39]
3.2.1 Thyroid The thyroid is a large ductless gland in the neck that secretes hormones regulating growth and development through the rate of metabolism, also known as a large cartilage of the larynx, a projection of which forms he Adam’s apple in humans. The thyroid hormone regulates the body’s metabolic rate as well as the heart and digestive function, muscle control, brain development and bone maintenance. A general guideline is 0.8 mcg for every pound of weight (or 1.6 mcg for every kilogram of weight) [40–42]. Thyroid disease, otherwise called abnormal thyroid, is any dysfunction of the butterfly-shaped gland at the base of the neck. Two common subcategories of this disease are hypothyroidism and hyperthyroidism. Hypothyroidism is a condition in which the thyroid gland does not produce enough thyroid hormone, also known as underactive thyroid. Hyperthyroidism is the overproduction of the thyroid hormone [40, 41]. 3.2.2 Levothyroxine Levothyroxine is a synthetic thyroid hormone that is chemically identical to thyroxine (T4), which is naturally secreted by the follicular cells of the thyroid gland. It treats hypothyroidism and thyroid cancer. The price ranges from $4 to $16 for 30 tablets [32]. Its chemical formula, C15H10I4NNaO4, shown in Table 4 [43]. It has a drug ingredient of levothyroxine sodium, and in addition, each tablet contains the following inactive ingredients: butylated hydroxyanisole, colloidal silicon dioxide, crospovidone, magnesium stearate, mannitol, microcrystalline cellulose, povidone, sodium lauryl sulfate and sucrose [39]. Levothyroxine is very slightly soluble in water; slightly soluble in ethanol (~750 g/L)

42
TS; practically insoluble in acetone R and ether R. It dissolves in solutions of alkali hydroxides [39]. Levothyroxine is a narrow therapeutic index drug such that doses only about 20-25% outside the normal therapeutic window can put patients at risk of severe side effects of hyper or hypothyroidism. Levothyroxine is a known example of classic bioequivalence problem between various available products. Dissolution of a drug is a crucial step in its oral absorption and bioavailability. The results of the inductively coupled plasma mass spectrometry (ICP-MS) showed that dissolution of such products is highly variable making it a rate-limiting step and a possible contributing factor to the bioequivalence concern. Furthermore, the oral bioavailability of T4 is known to be incomplete and quite variable ranging from 50-80%. Two most important factors that can affect the oral absorption of a drug are solubility and permeability across the gastrointestinal tract. Among the many pharmaceutical interventions available to increase drug solubility, solid dispersions and solid solutions have found enormous attention. Vitamin E-TPGS, a water soluble amphiphilic polymer was used to enhance the solubility of 14 via solid dispersion technique. The formulations were subjected to solid state characterization in order to fully understand the mechanisms of solubility enhancement. Levothyroxine is known to be a low permeability drug [28, 39, 42, 44]. Over dosage may cause confusion and disorientation. Other symptoms include and are not limited to cerebral embolism, shock, coma, and death. Children who have taken more than 18mg have been reported having seizures [44]. Table 4 Levothyroxine Chemical Breakdown [45] Molecular Weight 798.851849 g/mol Hydrogen Bond Donor Count 2 Hydrogen Bond Acceptor Count 5 Rotatable Bond Count 5 Exact Mass 798.668644 g/mol Monoisotopic Mass 798.668644 g/mol Topological Polar Surface Area 95.6 A^2 Heavy Atom Count 25 Formal Charge 0 Complexity 426 Isotope Atom Count 0 Defined Atom Stereocenter Count 1 Undefined Atom Stereocenter Count 0 Defined Bond Stereocenter Count 0 Undefined Bond Stereocenter Count 0 Covalently-Bonded Unit Count 2
3.3 Chemical Compound According to the chemical formula of Levothyroxine sodium, which is C15H10I4NNaO4H2O, the weight per chemical component is shown in the Table 5 below.

43
Table 5 Weight per chemical component of C15H10I4NNaO4H2O
Chemical Molecular Weight Units C15H10I4NNaO4 798.851 g/mol C15 180.1605 g/mol H10 10.0794 g/mol I4 507.61788 g/mol N 14.0067 g/mol Na 22.9898 g/mol O4 63.9976 g/mol 798.85188
An average full replacement dosage is 1.7 mcg/kg/day (e.g., 100 to 125 mcg/day for a 70 kg adult) orally. The U.S. population is 322,762,018, and Memphis has a population of 679,490.5. About 10 million Americans effected by hypothyroidism. Targeted patient group are women over the age of 50 [43, 46]. The United States has a population of 322,762,018 people. From that population only 10,000,000 Americans have hypothyroidism [40, 41]. Based off this information we can get the percentage of the American population that has hypothyroidism to be 3.098%. Memphis has a population of 679,490.5 people, therefore by multiplying the Memphis population by the percent of Americans with hypothyroidism the number of Memphians with hypothyroidism would be 21,052.4. Assumption number 1 is that all the people with hypothyroidism are using a prescription of 50mcg a day of Levothyroxine for treatment. Using this assumption, we know the 21,052.4 people have a Levothyroxine prescription. One prescription is 30 pills, which means the Memphis area needs 631,571.06 pills of Levothyroxine a month. One pill of Levothyroxine is 0.05 mg, making the Memphis supply of Levothyroxine needed weighs 31,578.5 mg. A 30-day prescription of Levothyroxine is $14.33, meaning 1 pill of Levothyroxine is $0.477. Therefore, the cost of the Levothyroxine needed to supply the Memphis demand is $301,680.44 a month. 3.4 Trucking Cost Based off of an interview with the Hub Group Trucking Company, an assumption was made that the trucks would travel 6.45 miles per gallon of fuel and the fuel would cost $1.94 per gallon. The interview also provided that trucker make around $40.00 an hour. It was determined that an average trucks maintains cost per year of $54.02, and the insurance cost per year to be $9000.00 [47].
4. DATA 4.1 Cost
𝒕𝒕 = 𝒂𝒂𝒂𝒂𝒂𝒂𝒂𝒂𝒂𝒂𝒂𝒂 𝒑𝒑𝒑𝒑𝒂𝒂𝒑𝒑 = 𝒗𝒗𝒑𝒑𝒂𝒂𝒗𝒗𝒗𝒗𝒗𝒗𝒕𝒕𝒗𝒗 × 𝒉𝒉𝒗𝒗𝒂𝒂𝒉𝒉 Equation 5 Where,
44
k= proportion of traffic congestion during peak time Tc= travel time (hr) under volume capacity
𝟎𝟎𝐇𝐇 = 𝐓𝐓𝐜𝐜𝐤𝐤(𝟑𝟑𝟑𝟑𝟐𝟐 𝐝𝐝𝐝𝐝𝐝𝐝𝐝𝐝𝐝𝐝𝐲𝐲𝐝𝐝𝐲𝐲
) Equation 6
𝑽𝑽𝑻𝑻𝑪𝑪 = 𝑻𝑻𝑶𝑶 �𝟏𝟏 + 𝟎𝟎.𝟏𝟏𝟐𝟐�𝑽𝑽𝑪𝑪�𝟎𝟎
� ∗ 𝟎𝟎.𝟖𝟖𝟖𝟖 Equation 7
Where,
To = free flow travel time (hr)
𝑻𝑻𝑶𝑶 =𝑳𝑳𝑺𝑺𝒇𝒇
Equation 8
Where,
L= Road Length Sf= free flow speed
Fuel Cost
FC= fuel consumption cost during peak hour Fc= fuel consumption rate (gal/ vehicle-miles) Cf = cost of fuel (dollars/gallon)
𝐅𝐅𝐅𝐅 = �𝐓𝐓𝐜𝐜𝐋𝐋𝐤𝐤 �𝟑𝟑𝟑𝟑𝟐𝟐𝐝𝐝𝐝𝐝𝐝𝐝𝐝𝐝𝐝𝐝𝐲𝐲𝐝𝐝𝐲𝐲
�� 𝐟𝐟𝐜𝐜 Equation 9
Where,
Vc=Vehicles
𝑽𝑽𝑪𝑪 =𝒘𝒘𝒕𝒕𝒗𝒗
Equation 10 Where,
tv= tons/vehicle
𝑉𝑉𝑴𝑴𝑻𝑻 = 𝒕𝒕𝒗𝒗 ∗ 𝑽𝑽𝒗𝒗 = 𝑻𝑻𝒗𝒗𝒑𝒑(𝟑𝟑𝟑𝟑𝟐𝟐𝒅𝒅𝒂𝒂𝒗𝒗𝒅𝒅𝒗𝒗𝒑𝒑𝒂𝒂𝒉𝒉
) Equation 11
Where,
C= Chemical Volume (tons) MA= Truck maintenance DR= Driver cost per year TA=Trucks per year

45
Dy=Drivers per year DI = Annual driver insurance TI=Annual truck insurance CPy= Chemical packaging per ton per year Lcost=Labor Cost Tcost= Truck Cost WOD=Number of trucks for each origin to destination
Ve=Volume of chemical for each origin to destination
𝑳𝑳𝒗𝒗𝒗𝒗𝒅𝒅𝒕𝒕 = 𝑫𝑫𝒗𝒗[𝑫𝑫𝑹𝑹 + 𝑫𝑫𝑰𝑰] Equation 12
𝑻𝑻𝒗𝒗𝒗𝒗𝒅𝒅𝒕𝒕 = 𝑴𝑴𝑨𝑨 ∗ 𝑻𝑻𝑨𝑨 ∗ 𝑻𝑻𝑰𝑰 Equation 13
𝑪𝑪 = 𝑳𝑳𝒗𝒗𝒗𝒗𝒅𝒅𝒕𝒕 + 𝑻𝑻𝒗𝒗𝒗𝒗𝒅𝒅𝒕𝒕 + �𝑪𝑪𝑻𝑻 ∗ 𝑪𝑪𝑷𝑷𝒗𝒗 � Equation 14
𝑪𝑪 = �𝑫𝑫𝒗𝒗 ∗ 𝑫𝑫𝑹𝑹 ∗ 𝑫𝑫𝑰𝑰� + �𝑴𝑴𝑨𝑨 ∗ 𝑻𝑻𝑨𝑨 ∗ 𝑻𝑻𝑰𝑰 ∗ 𝒇𝒇𝒗𝒗 ∗ �𝟑𝟑𝟑𝟑𝟐𝟐𝐝𝐝𝐝𝐝𝐝𝐝𝐝𝐝𝐝𝐝𝐲𝐲𝐝𝐝𝐲𝐲
� ∗ 𝒗𝒗𝒇𝒇� + �𝑪𝑪𝑻𝑻 ∗ 𝑪𝑪𝑷𝑷𝒗𝒗� Equation 15
𝑾𝑾𝑶𝑶𝑫𝑫 = 𝒘𝒘
𝒕𝒕𝒗𝒗� Equation 16
𝑻𝑻𝒗𝒗𝒗𝒗𝒅𝒅𝒕𝒕 = [𝑴𝑴𝑨𝑨 + 𝑻𝑻𝑰𝑰]𝑾𝑾𝑶𝑶𝑫𝑫
𝒕𝒕𝒗𝒗 Equation 17
Using the peaks, the worst situations were seen when the highest traffic congested the road flow. 4.2 Experimental Conventional Path
Figure 29 Sample Conventional Path
Time with no traffic found using Google Maps, the conventional path (Figure 29). From the Fedex Freight (461 Winchester Rd, Memphis, TN 38109),
Via I-240E <14.5miles> 19 min Via Winchester Rd <12.8 miles>25 min
Fedex(Shipment
Pickup)
Pfizer(Pharmaceutical)
Mckesson(Distribution
Facitility)
Walgreens(Drug Store)
46
Via Winchester Rd and I-240 E <14.7 miles> 24 min From Pfizer Inc. (6730 Lenox Center Ct #300, Memphis, Tn 38115),
Via I-240 E <13.8 miles> 20 min Via I-240 E and Summer Ave <13.6 miles> 24 min
From Mckesson Corp (5705 Stage Rd, Memphis, TN 38134), Via Stage Rd, Jackson Ave and N Highland St <9.0 miles> 17 min Via Sam Cooper Blvd <9.9 miles> 16 min Via Summer Ave and Walnut Grove Rd <9.3 miles> 19 min
From Walgreens (3381 Poplar Ave, Memphis, TN 38111), Via Poplar Ave and Union Ave <4.1 miles> 8 min Via Poplar Ave <4.6 miles> 10 min
o Costs without insurance (40) • 50 mcg, 30 tablets, $12.00 • 100 mcg, 30 tablets, $15.00 • 200 mcg, 30 tablets, $18.00
Via Central Ave and Union Ave <4.9 miles> 10 min
5. RESULTS After conducting the previous research, the section following includes the results found. 5.1 Data Collection With the population of the sample taken from the data above, the spread sheets were made to track the distances from each leg of the logistics route. A sample of one route starting from the FedEx hub, where it was determined all the Memphis sample would be getting their chemical supplies from the first pharmaceutical company Eli Lilly & Co to the distribution facility McKesson Corp to the drug store CVS Stage. Within the data, there are eleven pharmaceutical companies, 22 distribution facilities, and 18 drug stores. Knowing that the sample for Memphis is 631,571.06 pills and each pill weights 0.05 mg, the need for 31,578.5 mg of the chemical compound of levothyroxine is calculated [43]. With no information on how much levothyroxine each pharmaceutical company produce, it was run through the spreadsheets assuming that they all produced the same amount of pills each meaning each pharmaceutical company is used to produce 1,754.36 mg of levothyroxine. Each drug store also gets an even amount of the produced levothyroxine from each pharmaceutical company, making the amount of levothyroxine produces in each segment based on pharmaceutical company and drug store 159.48mg. 5.2 Route Paths In Table 6, the chemical amount in weight was taken from the 159.48 mg above in the Data Collection section of chapter 5. Next the distance for each branch of the route was determined using the shortest distance between location points within the rows FROM and TO show in Table 6. Speed was taken on an average of the route taken between

47
points. This was done because not all the roads along the route were the same. Travel time was determined by dividing distance in miles by speed in miles per hour. Table 6 Example Route from Pharmaceutical Company to Drugstore Supplies and
Materials Pharmaceutical
Companies Distribution
Facilities From Fedex Hub Eli Lilly & Co Mckesson
corp. To Eli Lilly & Co Mckesson corp. CVS stage Chemical Amount: Weight (mg)
159.48
Distance (Miles) 12.00 8.90 15.00
Speed (miles/hr) 45.00 45.00 40.00 Travel Time (hr) 0.27 0.20 0.38 Vehicles 1.00 1.00 1.00
Each section of the spreadsheet was computed for every section in the charts like Table 6 for each segment. The distances for each route from the 18 pharmaceutical companies to the 10 distribution centers to the 11 drug stores the distances were calculated in order to be able to determine cost of fuel. Each pharmaceutical company to drug store distance shown in Figure 30, was broken up between the 10 different routes that were taken to include all the distribution centers from the sample group. This was done so that it would be easier to use the information in the tables to determine the cost of standard bio logistics route. Table 7 Supply Chain Distances from Different Distribution Centers with the Total Route from Pharmaceutical Company to Drug Store. Sample total Route from Eli and Lily Company to CVS (Stage)
Routes Distribution Center Distance
Route 1 Mckesson corp 35.9 Route 2 ProLogistix 38 Route 3 Mckesson Rx 33.3 Route 4 Cardinal health (Union) 32.9 Route 5 West Ward Pharmaceuticals 42 Route 6 Pfizer Logistic center 25.6 Route 7 Accredo Health Group, Inc. 25.9 Route 8 UPS SUPPLY CHAIN 45 Route 9 McKesson Memphis 37.1 Route 10 Baxter Healthcare Corporation 41 Total Route 356.7

48
Figure 30 Supply chain distance from pharmaceutical company to drug stores (in
miles)
Once the distances were displayed in Figure 30 a table to display the time traveled for each pharmaceutical company to the different drug stores was developed. This information is displayed in Table 8. This data is used to help determine how many hours a driver is working and used to determine the drivers pay for each route. 5.3 Cost Standard vs. 3D Printing Using Table 7 and Figure 31, the cost was calculated for each route of the biologistics route. In each section displayed in Figure 32, the assumption made was one driver driving to one truck once in the month to deliver the product from location to location within that route path. Total saving from changing from the standard method of making Levothyroxine sodium our sample drug choice would be around $48,675,841.34 per a month. Most of this cost just comes from cutting down on all the travel to and from getting the chemicals to the pharmaceutical company and then the drug once made to a storage warehouse while its sorted out then taken to the drug stores.
0
100
200
300
400
500
600
CVS
(sta
ge)
CVS
(qui
nce)
Wal
gree
ns (P
opla
r)W
algr
eens
(Win
ches
ter)
Wal
gree
ns (K
irby)
Wal
gree
ns(M
ain)
Wal
gree
ns(P
ark)
Rite
Aid
(Qui
nce)
Oliv
er D
rug
Stor
ecv
s (un
ion)
wal
gree
ns (p
opla
r)w
algr
eens
(el
vis)
wal
gree
ns (u
nion
)le
ader
dru
g st
ore
Fred
's Ph
arm
acy
(lam
ar)
CVS
(Win
ches
ter)
Fred
's (s
umm
er)
Tayl
or B
row
n Ap
othe
cary
Dist
ance
(mile
s)
Destinations
Eli Lilly & Co
Pfizer Inc.
Amgen Inc.
McKesson Corporation
Northstar Rx Llc
TOP RX, INC.
Bayer Consumer Health
Pennington Pharmaceutical
GlaxoSmithKLine
Ariste Medical
Triad Isotopes
3 d printing

Table 8 Travel Time from Pharmaceutical Company to Drug Store (hours)
Eli Lilly & Co
Pfizer Inc.
Amgen Inc.
McKesson Corporation
Northstar Rx Llc
TOP RX, INC.
Bayer Consumer Health
Pennington Pharmaceutical
GlaxoSmithKLine
Ariste Medical
Triad Isotopes
3D printing
CVS (Stage) 8.4 5.9 10.2 5.2 5.7 11.3 7.1 9.5 11.3 9.8 6.9 0.4 CVS (Quince) 8.4 4.1 7.7 2.7 3.2 8.8 4.6 7 8.8 7.2 4.4 0.2 Walgreens (Poplar) 6.2 4.5 8 3.1 3.6 9.1 4.9 7.4 9.1 7.6 4.7 0.2 Walgreens (Winchester) 5.9 4.2 7.7 2.7 3.2 8.8 4.6 7 8.8 7.3 4.4 0.3 Walgreens (Kirby) 5.1 3.4 6.9 1.9 2.4 8 3.8 6.2 8 6.5 3.6 0.2 Walgreens(Main) 9.6 7.9 11.4 6.5 7 12.6 8.3 10.8 12.6 11 8.1 0.3 Walgreens(Park) 6.1 4.4 7.9 3 3.5 9 4.8 7.3 9 7.5 4.6 0.1 Rite Aid (Quince) 6.4 4.6 8.2 3.2 3.7 9.3 5.1 7.5 9.3 7.7 4.9 0.1 Oliver Drug Store 7.4 5.7 9.2 4.2 4.7 10.3 6.1 8.5 10.3 8.8 5.9 0.4 CVS (Union) 7.6 5.9 9.4 4.5 5 10.6 6.3 8.8 10.6 9 6.1 0.1 Walgreens (Poplar) 6.2 4.5 8 3.1 3.6 9.1 4.9 7.4 9.1 7.6 4.7 0.2 Walgreens (Elvis) 7.1 5.4 8.9 4 4.5 10.1 5.8 8.3 10.1 8.5 5.6 0.2 Walgreens (Union) 8.9 7.2 10.7 5.8 6.3 11.8 7.6 10.1 11.8 10.3 7.4 0.2 Leader Drug Store 8.4 6.7 10.2 5.2 5.7 11.3 7.1 9.5 11.3 9.8 6.9 0.3 Fred's Pharmacy (lamar) 7.6 5.9 9.4 4.5 5 10.6 6.3 8.8 10.6 9 6.1 0.4 CVS (Winchester) 5.4 3.7 7.2 2.2 2.7 8.3 4.1 6.5 8.3 6.8 3.9 0.2 Fred's (Summer) 7.6 5.9 9.4 4.5 5 10.6 6.3 8.8 10.6 9 6.1 0
Taylor Brown Apothecary 5.9 0.4 0.8 0.3 0.3 0.9 4.6 7.1 8.8 7.3 4.4 0.3

Figure 31 Cost 100% Standard by Pharmaceutical Company to Drug Store in Thousands of Dollars
Figure 32 Standard vs. 3D Printing by Pharmaceutical Company to Drug Store in Thousands of Dollars
255.5256
256.5257
257.5258
258.5259
259.5260
Standard Market Cost in Thousands
Eli Lilly & Co Pfizer Inc. Amgen Inc.
McKesson Corporation Northstar Rx Llc TOP RX, INC.
Bayer Consumer Health Pennington Pharmaceutical GlaxoSmithKLine
Ariste Medical Triad Isotopes
0.00
500.00
1000.00
1500.00
2000.00
2500.00
3000.00
3D printing VS. Standard Cost
3 d printing sum of standard difference standard-3d

51
5.4 Market Penetration Now as with most changes within the global market things do not just change overnight. Knowing the total cost different between the standard bio logistics route and using the 3D printing route, the market penetration for one of the drug stores, CVS on Stage Road, was then determined. In Table 9, it shows the first process of the market penetration of 0.1 for CVS on Stage Road. Below that in Figure 33, it shows the cost savings for CVS on Stage Road per month per 0.1 degree of market penetration. Table 9 Example of Market Penetration for Sample Drug Store (CVS on Stage Road)
Market Penetration
Vehicle Travel Time
(hours)
Vehicle Miles Travelled
CVS (Stage)
cost (in $1000)
Eli Lilly & Co 8.4 357.0 152.7 Pfizer Inc. 5.9 294.4 151.8 Amgen Inc. 10.2 450.1 154.0 McKesson Corporation 5.2 259.0 151.4 Northstar Rx Llc 5.7 271.1 151.5 TOP RX, INC. 11.3 443.1 153.9 Bayer Consumer Health 7.1 325.1 152.3 Pennington Pharmaceutical 9.5 413.8 153.5 GlaxoSmithKLine 11.3 467.1 154.2 Ariste Medical 9.8 367.8 152.9 Triad Isotopes 6.9 262.1 151.5 3D Printing 0.1 0.4 16.0 17.3 Standard Sum 1,679.63 Cost Saving 1,160.91
5.5 Alternate Viable Scenario 5.5.1 Drug Choice The most popular pain killer used in this country is Vicodin, a narcotic that aids in moderate to severe pain relief. The number has grown from a 112 million prescribed populations to a new high of 131 million users. The US consumes 80 percent of the world’s opioids through this drug [31].

52
Figure 33 Cost saving per month based off the market penetration from sample
Drug Store (CVS on Stage Road)
5.5.2 FedEx With over 400,000 team members worldwide, FedEx has over 4,323 facilities around the globe. The supplies are shifted all over using aircrafts, motorized vehicles, as well as air and ocean freight forwarding services. Over 12 million shipments are moved each business day. In Figure 34, the map indicates the FedEx locations in Memphis, where the customers can place and pick up their 3D printed prescribed oral medication in the near future. The scenario entails that all the FedEx locations all possess a 3D printer. The cost lowers due to the decrease in the pathways needed to reach the destination from the origin, since the drug chemicals can be directly sent to the location where the oral medications can be made. FedEx will even decrease the distance needed to travel to pick up medication because it can be mailed straight to the patient. This will be a very great option to slowly shift into to increase profits as well as lower costs.
0
500000
1000000
1500000
2000000
2500000
3000000
10.00% 20.00% 30.00% 40.00% 50.00% 60.00% 70.00% 80.00% 90.00% 100.00%
Cost
in D
olla
rs
Market Penetration
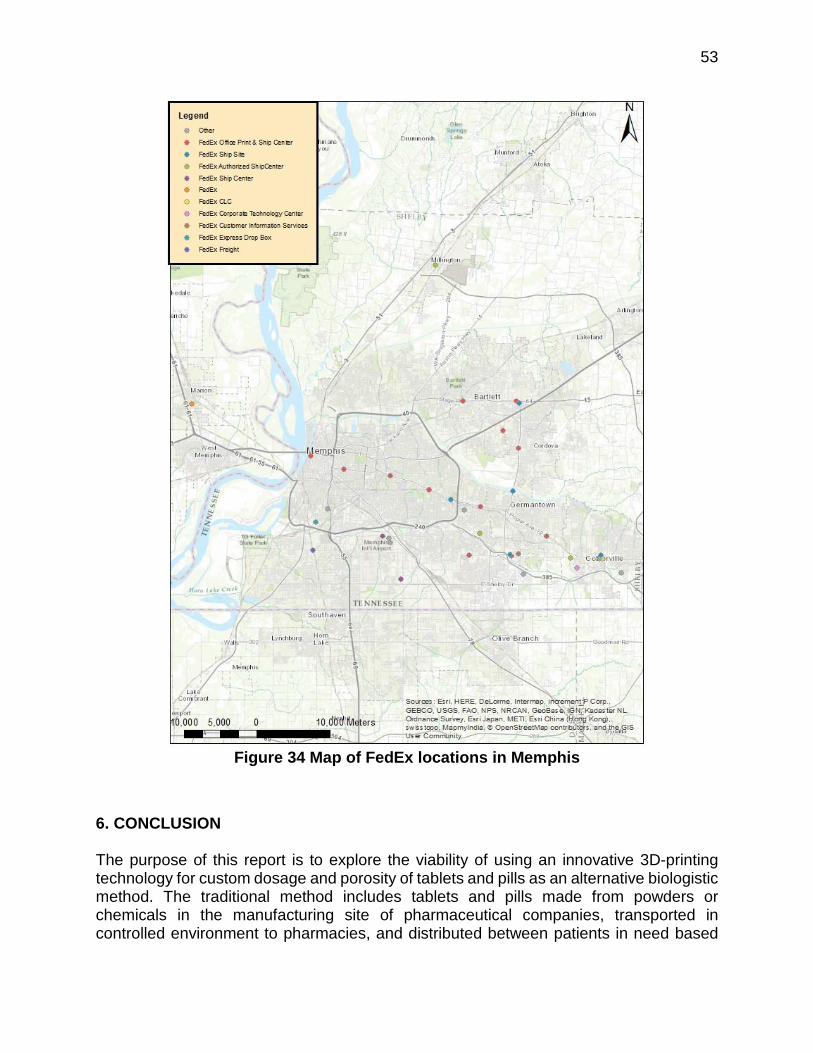
53
Figure 34 Map of FedEx locations in Memphis
6. CONCLUSION The purpose of this report is to explore the viability of using an innovative 3D-printing technology for custom dosage and porosity of tablets and pills as an alternative biologistic method. The traditional method includes tablets and pills made from powders or chemicals in the manufacturing site of pharmaceutical companies, transported in controlled environment to pharmacies, and distributed between patients in need based

54
on prescriptions. It is desired for tablets and pills to be transported as powders rather than easily crushable solid shapes because it will significantly lower the biologistics and transportation difficulties and costs, to be manufactured in a short amount of time as the custom dosage drugs according to the exact medical need of each individual patient, to have custom porosity to control the dissolving rate of the tablets and pills based on the preference of patients. The primary objective of this research were to identify the demand and service locations of LENS technology for a particular drug, analyze the competition of LENS technology with conventional ones by various market penetrations, determine the state of transportation network with and without LENS technology, and identify the feasibility and performance of the transportation network with LENS technology. Therefore, another aspect was to investigate the economic impact of using this technique on the Memphis transportation industries. The research integrates transportation and materials/manufacturing sciences and, as a result, consists of two main tasks that will be performed in continuous and direct communications. In the transportation task, the current biologistics for tablets and pills will be compared against the biologistics of the same pills and tablets if manufactured with LENS technology to explore the impact of the proposed research on this industrial sector. Firstly, drug materials are transported to a laboratory for preparation and packaging into strips. Then depending on the demand they are sent to the distribution center for box-packaging and shipment. The shipment is then transported to the drug stores. Customers either collect the drug from the drug store directly, or consume at hospitals. Some steps of the sequence are not required in LENS technology because the drugs can directly be prepared at the drug store. Another option for the future includes using FedEx locations in Memphis, where the customers can place and pick up their 3D printed prescribed oral medication in the near future. The cost lowers due to the decrease in the pathways needed to reach the destination from the origin, since the drug chemicals can be directly sent to the location where the oral medications can be made. FedEx will even decrease the distance needed to travel to pick up medication because it can be mailed straight to the patient. From the research done, it is indeed a viable option for the future to convert from the traditional method to the newer 3D printing option for oral medication. Not only is it a viable option it will save money for most companies involved. In the first year alone with just the savings from the sample drug used in this research the money needed to buy the 3D printer would be paid off within the month.

55
REFERENCES 1. Gad SC (2008) Pharmaceutical manufacturing handbook: production and processes.
John Wiley & Sons 2. Bhowmik D, Duraivel S, AN R, Kumar KS (2014) Tablet manufacturing process and
defects of tablets. Elixir Int J 70:24368–24374. 3. Nickerson B (2011) Sample Preparation of Pharmaceutical Dosage Forms:
Challenges and Strategies for Sample Preparation and Extraction. Springer Science & Business Media
4. Augsburger LL, Larry LA, Lachman L, Schwartz JB (1990) Pharmaceutical Dosage Forms: Tablets, -Volume 2. Informa Health Care
5. Ray Goff, Jr. C What’s Driving Freight Costs Higher? http://www.pharmoutsourcing.com/Featured-Articles/126129-What-s-Driving-Freight-Costs-Higher/. Accessed 7 Feb 2017
6. Ventola CL (2014) Medical applications for 3D printing: current and projected uses. PT 39:704–711.
7. Goyanes A, Buanz AB, Basit AW, Gaisford S (2014) Fused-filament 3D printing (3DP) for fabrication of tablets. Int J Pharm 476:88–92.
8. Skowyra J, Pietrzak K, Alhnan MA (2015) Fabrication of extended-release patient-tailored prednisolone tablets via fused deposition modelling (FDM) 3D printing. Eur J Pharm Sci 68:11–17.
9. Bennett B, Cole G (2003) Pharmaceutical production: an engineering guide. IChemE 10. Rogers AJ, Hashemi A, Ierapetritou MG (2013) Modeling of particulate processes
for the continuous manufacture of solid-based pharmaceutical dosage forms. Processes 1:67–127.
11. Faure A, York P, Rowe R (2001) Process control and scale-up of pharmaceutical wet granulation processes: a review. Eur J Pharm Biopharm 52:269–277.
12. Vervaet C, Remon JP (2005) Continuous granulation in the pharmaceutical industry. Chem Eng Sci 60:3949–3957.
13. Pujara C (2007) Granulation:Preparation, Evaluation & Control. 14. Yu DG, Zhu L-M, Branford-White CJ, Yang XL (2008) Three-dimensional printing
in pharmaceutics: Promises and problems. J Pharm Sci 97:3666–3690. 15. Khaled SA, Burley JC, Alexander MR, Roberts CJ (2014) Desktop 3D printing of
controlled release pharmaceutical bilayer tablets. Int J Pharm 461:105–111. 16. Katstra W, Palazzolo R, Rowe C, et al (2000) Oral dosage forms fabricated by
Three Dimensional Printing�. J Controlled Release 66:1–9. 17. Gross BC, Erkal JL, Lockwood SY, et al (2014) Evaluation of 3D printing and its
potential impact on biotechnology and the chemical sciences. ACS Publications 18. Goyanes A, Chang H, Sedough D, et al (2015) Fabrication of controlled-release
budesonide tablets via desktop (FDM) 3D printing. Int J Pharm 496:414–420. 19. fda, cder Highlights of Prescribing Information. 20. Goyanes A, Buanz AB, Hatton GB, et al (2015) 3D printing of modified-release
aminosalicylate (4-ASA and 5-ASA) tablets. Eur J Pharm Biopharm 89:157–162. 21. Pardeike J, Strohmeier DM, Schrödl N, et al (2011) Nanosuspensions as advanced
printing ink for accurate dosing of poorly soluble drugs in personalized medicines. Int J Pharm 420:93–100.

56
22. Prasad LK, Smyth H (2016) 3D Printing technologies for drug delivery: a review. Drug Dev Ind Pharm 42:1019–1031.
23. Norman J, Madurawe RD, Moore CM, et al (2016) A new chapter in pharmaceutical manufacturing: 3D-printed drug products. Adv. Drug Deliv. Rev.
24. Içten E, Giridhar A, Taylor LS, et al (2015) Dropwise Additive Manufacturing of Pharmaceutical Products for Melt-Based Dosage Forms. J Pharm Sci 104:1641–1649.
25. Alsaheb RAA, Aladdin A, Othman NZ, et al (2015) Recent applications of polylactic acid in pharmaceutical and medical industries. J Chem Pharm Res 7:51–63.
26. Ursan ID, Chiu L, Pierce A (2013) Three-dimensional drug printing: a structured review. J Am Pharm Assoc 53:136–144.
27. Gbureck U, Vorndran E, Müller FA, Barralet JE (2007) Low temperature direct 3D printed bioceramics and biocomposites as drug release matrices. J Controlled Release 122:173–180.
28. Huang W, Zheng Q, Sun W, et al (2007) Levofloxacin implants with predefined microstructure fabricated by three-dimensional printing technique. Int J Pharm 339:33–38.
29. Wang L, Chen J, Chen L, et al (2013) 1 H-NMR based metabonomic profiling of human esophageal cancer tissue. Mol Cancer 12:25.
30. Banks J (2013) Adding value in additive manufacturing: Researchers in the United Kingdom and Europe look to 3D printing for customization. IEEE Pulse 4:22–26.
31. Glover L (2015) The Most Commonly Prescribed Drugs in America. NerdWallet 32. The True Cost Of Your Prescription Drugs! In: True Cost Your Prescr. Drugs.
http://www.rense.com/general54/preco.htm. 33. (2014) Top 15 pharma companies in the US - Top Pharma List - PMLiVE.
http://www.pmlive.com/top_pharma_list/us_revenues. Accessed 7 Feb 2017 34. Alicke K, Lösch M Lean and mean: How does your supply chain shape up?
McKinsey Co Munich 1–15. 35. Ulhrich D, Labs A, Rizzo TJ (2012) Bringing room-temperature pharma shipping
under the “CRT” umbrella. In: Pharm. Commer. http://pharmaceuticalcommerce.com/supply-chain-logistics/bringing-room-temperature-pharma-shipping-under-the-crt-umbrella/. Accessed 7 Feb 2017
36. Hipolite W (2014) Plan B 3DP Powder-based Inkjet 3D Printer - Costs Less Than $1300 to Build. 3DPrint.com
37. Grunewald SJ Build your Own 3D Printer that uses Powder and Ink Jet Technology. In: 3D Print. Ind. https://3dprintingindustry.com/news/build-3d-printer-uses-powder-ink-jet-technology-31951/. Accessed 7 Feb 2017
38. Cohen D, George K, Shaw C Are you ready for 3-D printing? | McKinsey & Company. http://www.mckinsey.com/business-functions/operations/our-insights/are-you-ready-for-3-d-printing. Accessed 7 Feb 2017
39. Levothyroxine - FDA prescribing information, side effects and uses. In: Drugs.com. https://www.drugs.com/pro/levothyroxine.html. Accessed 8 Feb 2017
40. Hypothyroidism. In: Univ. Md. Med. Cent. http://umm.edu/health/medical/reports/articles/hypothyroidism. Accessed 8 Feb 2017

57
41. Norman J Hypothyroidism: Too Little Thyroid Hormone. In: EndocrineWeb. https://www.endocrineweb.com/conditions/thyroid/hypothyroidism-too-little-thyroid-hormone. Accessed 8 Feb 2017
42. Levothyroxine Dosage Guide with Precautions. In: Drugs.com. https://www.drugs.com/dosage/levothyroxine.html. Accessed 8 Feb 2017
43. Population Of Memphis In 2016. USA Popul. 2016 – States City 44. Synthroid (Levothyroxine Sodium) Drug Information: Overdosage and
Contraindications - Prescribing Information at RxList. In: RxList. http://www.rxlist.com/synthroid-drug/overdosage-contraindications.htm. Accessed 8 Feb 2017
45. Pubchem Levothyroxine sodium | C15H10I4NNaO4 - PubChem. https://pubchem.ncbi.nlm.nih.gov/compound/Levothyroxine_sodium. Accessed 8 Feb 2017
46. The Size of the U.S. and the World in 2016. In: US News World Rep. http://www.usnews.com/opinion/blogs/robert-schlesinger/articles/2016-01-05/us-population-in-2016-according-to-census-estimates-322-762-018. Accessed 8 Feb 2017
47. Overdrive Trucking insurance. http://www.overdriveonline.com/trucking-insurance/. Accessed 8 Feb 2017