an analysis incoming quality control of material in manufacturing company low kuan chuen -...
TRANSCRIPT
TECHNICAL UNIVERSITY OF MALAYSIA MALACCA
An Analysis Incoming Quality Control
Of Material in Manufacturing Company
Project submitted in accordance with the requirements of the National Technical
University of Malaysia Malacca for the Degree of Bachelor of
Engineering (Honors) Manufacturing (Management)
By
Low Kuan Chuen
Faculty of Manufacturing Engineering
May 2008

ABSTRACT
Quality control of incoming materials is one of the important consideration
for improving the quality performance and customer satisfaction of XX Company.
This thesis would mostly concern in area of receiving incoming parts.
The methodology of this thesis is conducted to ensure the successive of thesis
completion. The results of the data collection is related to the problem of incoming
material issue through the data analysis by using quality techniques and tools
approaches such as QC Tools and MIL-STD-105E for controlling incoming quality
control. From the data findings, there are recommendations on problems occurred
and suggestions for future improvement construct in this thesis.
i
ABSTRAK
Kawalan kualiti bagi bahan kemasukan merupakan satu pertimbangan yang
penting untuk meningkatkan taraf persembahan kualiti dan kepuasan pelanggan di
XX Syarikat. Tesis ini akan menitikberatkan di lokasi penerimaan bahan kemasukan.
Kaedah bagi tesis ini telah dijalankan bagi memastikan penyiapan tesis
dengan jayanya. Keputusan pengumpulan data berkenaan dengan isu masalah bahan
kemasukan melalui analisa data dengan menggunakan teknik kualiti dan peralatan
seperti Peralatan Kawalan Kualiti dan 105E-Tetapan Militari untuk mengawal
kawalan kualiti kemasukan. Daripada penelitian data, penilaian terhadap masalah
yang dihadapi dan dengan itu beberapa cadangan bagi peningkatan masa akan datang
telah dilaksanakan dalam tesis ini.
ii

CHAPTER 1
INTRODUCTION
1.1 Background of Quality Control
Generally, the quality control normally competition among the companies in order to
control and produce the products in the best condition. The goal of the best quality
control is customer satisfaction. Besides, quality is important for giving customer
expectations and needs. Quality control is a management function whereby control of
the quality of raw materials, assemblies, produced materiel, components, services
related to production, and management, production, and inspection processes is
exercised for the purpose of preventing undetected production of defective material
or the rendering of faulty services.
As a general rule, if defects are eliminated or minimized through quality control, the
cost of production due to waste will decrease. It is simply common sense that when
products which deviate from the intended standard are made, they must either be
repaired or discarded and this would obviously incur extra costs. If it is possible to
turn out goods that will fulfill the standard, naturally costs will decrease in addition
to improved customers' satisfaction. It is therefore appropriate to clearly define first
what quality control is before we identify the need for quality control. The most
common notion of quality control is the checking or inspection of the product to
ensure its conformance to specifications.
1

The concepts of quality control have undergone changes in evolutionary process of
refinement and application. Like quality, they have many definitions. One useful
definition for quality control is that helps to put the preceding discussion on
standards and measurements into an action mode as follows:
“Quality control is the regulatory process through which we measure actual quality
performance, compare it with standards, and act on the difference.” (Juran, 1988,
p.27)
The Japanese Industrial Standards defined quality control as:
Quality Control is a system comprising all the means used in the economically
manufacturing of products or services that meet the quality requirements of the
buyer.
Quality control should therefore encompass the activities of Prevention, Detection
and Correction of product defects that could cause customers' dissatisfaction. The
key point in quality control is therefore the faithful conformance of the product
specifications or standard. Product defects or deviations from specifications can
result from any or combination of some of the following:
i. Poor product design
ii. Defective raw material
iii. Inadequate, inappropriate machines and tools
iv. Inappropriate environment
v. Human errors
A quality control system should therefore be designed and instituted to cover all
these areas. The basic elements in quality control which can be translated directly
into the objectives of a Quality Control System are:
i. To maintain design standards
ii. To meet customers' specifications
iii. To determine department/personnel effectiveness
2

iv. To detect and correct defective products
In particulars of quality concept, it can affect other vital elements of a company such
as productivity, cost, and delivery schedules. It may also have an effect on the
workplace environment. Quality leaves its imprint on society and on the quality of
government. In recognition of the many aspects of quality, to describe the wide
spectrum of applicability, the authors have developed a broad and comprehensive
definition of quality. A few companies continue to emphasize only the inspection
aspect of quality control, whereas inspection is actually one useful element in an
overall quality system who stated by (Stephen, 2000).
The quality control of company is very important because of being the strategy that
can bring:
i. Better quality as well as at incoming materials, production and
assembly parts until the finish goods before outgoing and delivery.
ii. Better quality in term of saving cost or cheap with good quality due to
apply continuous improvement.
iii. Better providing the customer satisfaction, creating greater markets
and thus reducing overall cost resulting from improved quality is a
reasonable measure of the correctness of its application.
Generally, if it is costing more than it is saving, it is improperly applied. This places
great importance on quality cost analysis, a significant element in a quality system
that will be explored subsequently. Stressing quality can produce all the desired
results for examples; less work, greater productivity, lower unit cost, price flexibility,
improved competitive position, increased demand, larger profits, more jobs and more
secure jobs. Customers get high quality at a low price, vendors get predictable long
term sources of business, and investors get profits.
According to incoming quality control, adequate communication of requirements to
suppliers is important because of specifications should be understandable and
precise. Process capability requirements on suppliers, together with process controls,
can reduce or eliminate inspection of incoming suppliers.
3

1.2 Problem Statement
First, quality of the incoming quality control on raw materials in any industry has
played an important role. All industries have their responsibilities on managing their
quality on raw materials in order to make sure that this output products can be
produced. Company not only has to provide cost effective product but also quality in
incoming materials, which satisfy the further processing line and good output.
The measurements should be broadly classified as follows:
1. To measure the characteristics of an individual article for the purpose of
determine whether or not the piece conforms to the specifications.
2. To measure the characteristics of the pieces in a sample taken at random
from a lot.
3. To measure and choose the supplier giving most problem for incoming
material.
4. To measure supplier performance by supplier audit
1.3 Objective of Study
The objectives of this study are:
i. To understand the concept of incoming quality of raw material for
production line purposes to further process.
ii. To identify the current problem about the incoming materials in
industry company
iii. To apply the concepts of incoming quality control of material in
producing better quality product.
4
1.4 Scope of Study
In order to understand the incoming quality control, a history development, definition
using sampling plan, quality tools and techniques and the standardized Quality
Management System (QMS) as stated in ISO 9001:2000, Clause 5.4.2.(Quality
Management System Planning). A research on XX Company was done in Incoming
Quality Control Department. This study about measurements in checking the
incoming raw materials parts to identify the parts whether in specification or out of
specification limit. From this task of measuring, any tools and equipments we been
use important for determine that which tools are suitable for the measuring. There are
some methods for summarize the result using many quality tools such as Pareto
diagram and cause and effect diagram.
In the procedures of inspection the quality of the materials, some of the samples
taken for checking whether they have any defects or any incomplete parts not fulfill.
Importantly, inspections of quality control based on incoming are:
1. To improve the quality of the input materials with less variation
2. Greater productivity on the process of checking and transferring to
production section
3. The way of improve the better supplier relations so that suppliers always
keep quality conformance level for the parts incoming time to time.
1.5 Organization of the Thesis
Based on the thesis for Projek Sarjana Muda (PSM) I, an organization has been
constructed for the process flow of completion. This organization is use for students
purposely follow the format and understands sequences of doing the project as good
as possible to fulfill course of Degree in UTeM. The format of organization as
follow:
5

i. Chapter 1 : INTRODUCTION
This chapter presented the background of quality control,
objectives of study, problem statement, scope of study and the
organization for the thesis.
ii. Chapter 2 : LITERATURE REVIEW
This chapter summarized all the finding that related to the
quality control based on incoming materials. Then, this is
followed by data measurements and analysis. Finally, find and
observe different of tools and techniques of quality control
approaches to overcome the current problem statement
occurred in company.
iii. Chapter 3 : METHODOLOGY
This chapter gave the ideas on how to solve the problems in
ways such as data collections, secondary data and the tools and
techniques for analysis the problems and finally solves them
for better improvements.
iv. Chapter 4 : RESULT
This chapter would cover the company background after
researched. Besides, data measurements and collections taken
for the quality control on the incoming materials where visited
and researched the XX Company. This is followed by the
detailed calculation carried out for the problems. Supplier
selected for the most contributed defects on part after using
Pareto Chart.
v. Chapter 5 : DISCUSSION
This chapter discussed about the findings that related to theory
or current understanding in quality control of incoming
6

materials. The tool using is Cause and Effect diagram to show
the problem cause. Better understanding from diagram and to
show the recommendation later for future improvement.
vi. Chapter 6 : CONCLUSION
This chapter included the recommendation and summary of
for thesis. Future improvement conducted in this chapter for
the further study related to quality control on incoming
materials.
7

CHAPTER 2
LITERATURE REVIEW
2.1 Introduction
Quality control is defined in ISO 9000-2000 as “Part of quality management focused
on providing confidence that quality requirements are fulfilled” (American Society
for Quality, 2000). Quality control refers to the activities or tools that are used to
provide this assurance. The word “quality” here refers to the fitness of a product or
service for its intended use. This fitness is usually measured with great difficulty and
expenses, and by general agreement (in terms of specifications), certain quantities,
called attribute, are used as fitness surrogates. They should be defined in such a way
that when they fall within their specifications, the product or service will be fit for its
intended use.
The benefits of quality control are improving quality of products and services to meet
customers’ needs, increasing the productivity of manufacturing process and
commercial businesses, ensuring on-time deliveries and availability. In this quality
control focus on incoming raw material inspection that is an appraisal activity that
compares goods or services to a standard. “Garbage in; garbage out” suits for
describe the importance of in-coming quality control for the material purchased in
manufacturing company. Thus, every input must be acceptable for checking
conformance before going to production line.
8

Inspection before and after production often involve acceptance sampling
procedures. In order to determine whether a process is functioning as intended or to
verify a batch or lot of raw materials or final products does not contain more than a
specified percentage of defective goods, it is necessary to physically examine at least
some of the items in question. The purpose of inspection is to provide information on
the degree to which items conform to a standard. The basic issues are:
a. How much to inspect and how often.
b. At what points in the process inspection should occur.
2.2 Development of Quality Control Knowledge
2.2.1 Earlier Development
One of the earlier references to quality control in the United States was in report by
Alexander Hamilton, then Secretary of the Treasury, to the U.S. House of
Representatives in 1791 [Syrett (1966)]. This reference is contained in a report
entitled “Report on Manufacturers” and is as follows:
Chapter IX. Judicious regulations for the inspection of manufactured
commodities
This is not among the least important of the measures, by which the prosperity of
manufacturers may be promoted. It is in many cases one of the most essential.
Contributing to prevent frauds upon consumers at home and exporters to foreign
countries-to improve the quality and preserve the character of the national
manufacturers, it cannot fail to aid the expeditions and advantageous sale of them,
and to serve as a guard against successful competition from other quarters. The
reputation of the flour and lumber of some stats, and of the Potash of others has
been established by an attention to this point. And the like good name might be
procured for those articles, wheresoever produced, by a judicious and uniform
9
system of inspection; throughout the ports of the United States. A like system might
also be extended with advantage to other commodities.
Much of the earliest documented work in quality control centered on the Bell
Telephone System. Telephone networks are giant series systems. For conversations
to be possible over long distances, every piece of the network must function
correctly. This means that each telephone, drop wire, and switch and all other
transmission facilities must be designed, manufactured, installed, and maintained to
exacting standards. The early realization of this fact led on an AT&T document in
1892 emphasizing the importance of managing the quality of all products intended
for the rapidly growing network. Fagan (1974) tells us that even before that, in 1882,
the contract between the Western Electric Company and the American Bell
Telephone Company (an early name of the AT&T Company) states:
At all times during their manufacture and upon their completion the
instruments and materials employed shall be subject to the inspection and
acceptance…by [the American Bell Telephone Company].
From 1925 to 1941 the developments of quality control and quality assurance
methodology were remarkable. Golomski (1967) writes about this early period:
On 16 May 1924…Dr. Shewhart prepared a little memorandum only about a
page in length. About a third of that page was devoted to a simple diagram
which we would all recognize today as a schematic control chart. That
diagram, and the short text which preceded and followed it, set forth all of
the essential principles and considerations which are involved in what we
know today as process quality control.
Shewhart published this concept in the December 1925 issue of the Journal of the
American Statistical Association [Shewhart (1925)]. In this paper he introduced the
control chart, which became a basic manufacturing tool used around the world.
10
2.2.2 Latest Development of Quality Control
At the beginning of U.S. involvement in World War II, there was an immediate need
for large quantities of war material-everything from guns to radar equipment to
shoes. United States industry expanded rapidly at the same time that the country’s
armed forces were expanding. Therefore, many people who had never before worked
in a manufacturing organization were employed by these new and expanding
factories. The War Department engaged Bell Telephone Laboratories, Edwards and
some of his people to go out to manufacturing plants and teach people simple
methods of quality control [“Dr. W. Edwards Deming” (1980)]. Other instructors
were selected from local universities.
The founding editor of the second publication was Dr. Lloyd Nelson, then of General
Electric Company. This publication, the Journal of Quality Technology, is devoted to
the more technical aspects of quality control, much of it of a statistical nature.
Another journal that has contained significant technical papers on quality, reliability,
and productivity since its beginning is Technometrics, a joint publication of the
American Statistical Association and the American Society for Quality Control. The
Journal of the American Statistical Association, now more than ninety years old, has
presented many of the major technical papers in quality and reliability. The
publication Quality presents papers for managers and engineers in the areas of
quality assurance. The ASQ has recently added two new journals to its publication
list. These are Quality Engineering and Quality Management Journal. Quality
Engineering has technical articles that are at a somewhat lower statistical level than
those in the Journal of Quality Technology. Quality Management Journal has articles
dealing with research and applications in the field of quality management.
In the 1950s through the 1970s these standards were the only ones published by ISO
that dealt with quality control. In the meantime, the International Electrotechnical
11
Commission (IEC), a sister organization to ISO, through its Technical Committee 56,
was developing standards dealing with reliability, maintainability, and related topics.
Thus, in those times, quality practitioners gravitated to those two committees in an
effort to standardize the field of quality assurance. However, by the late 1970s it was
recognized that standards dealing with the management of quality were needed and
that these two committees were unable to meet this need.
An example of Japan’s training effort is summarized in the following quotation from
Ishikawa (1968), in which he emphasizes the use of public media for quality control
training in Japan:
QC courses through radio began in July 1956. The Nippon Shortwave
Broadcasting Co. (NSB) held a 3-month course seven times. Since 1957,
NHK (Japan Broadcasting Corporation) held an introductory course called
“Management and Quality Control” for 7 weeks (15 minutes per weekday).
More than 100,000 copies of this textbook have been distributed. From 1957
to 1962, there were seven NHK radio QC courses. In 1960 and 1961, NHK
TV broadcast two courses called Quality Control and Standardization for 4
months.
Many companies require their suppliers to be registered to one of the standards. The
ISO 9000 standards are a set of standards. Three of them-ISO 9001, 9002 and 9003
are the contractual standards that are used for auditing purposes. These were revised
in 1994 and a third edition was published in 2000. In this latter edition, ISO 9002 and
9003 were dropped so that only contractual standard is ISO 9001.
12

2.3 QC Tools and Techniques
There were numbers of techniques useful in conducting investigations to achieve
improvements. The following shows the examples of the tools and techniques may
have needed to improve the incoming quality control.
2.3.1 Sampling Plan
A key element of acceptance sampling is the sampling plan. Sampling plans specify
the lot size, the sample size, the number of samples to be taken, and the acceptance
/rejection criteria. A variety plans can be used. Some plans call for selection of a
single sample, and others call for two or more samples, depending on the nature of
the plan. The plan used is Single Sampling Plan and as shown in Table 2.1.
In the single plan, one random sample is drawn from each lot, and every item in the
sample is examined and classified as either “good” or “defective.” If any sample
contains more than a specified number of defectives, c, that lot is rejected.
Table 2.1: Sample Table of Single Sampling Plan
13
.010 .015 .025 .040 .065 .10 .15 .25 .40 .65 1.0 1.5 2.5 4.0 6.5 10.0
LOT SIZE SAMPLE SIZE
2 to 8 * * * * * * * * * * * * 5 3 2 2
9 to 15 * * * * * * * * * * 13 8 5 3 2 2
16 to 25 * * * * * * * * * 20 13 8 5 3 3 2
26 to 50 * * * * * * * * 32 20 13 8 5 5 5 3
51 to 90 * * * * * * 80 50 32 20 13 8 7 6 5 4
91 to 150 * * * * * 125 80 50 32 20 13 12 11 7 6 5
151 to 280 * * * * 200 125 80 50 32 20 20 19 13 10 7 6
281 to 500 * * * 315 200 125 80 50 48 47 29 21 16 11 9 7
501 to 1200 * 800 500 315 200 125 80 75 73 47 34 27 19 15 11 8
1201 to 3200 1250 800 500 315 200 125 120 116 73 53 42 35 23 18 13 9
3201 to 10,000 1250 800 500 315 200 192 189 116 86 68 50 38 29 22 15 9
10,001 to 35,000 1250 800 500 315 300 294 189 135 108 77 60 46 35 29 15 9
35,001 to 150,000 1250 800 500 490 476 294 218 170 123 96 74 56 40 29 15 9
150,001 to 500,000 1250 800 750 715 476 345 270 200 156 119 90 64 40 29 15 9
500001 and over 1250 1200 1112 715 556 435 303 244 189 143 102 64 40 29 15 9

2.3.2 Pareto Chart
Pareto Analysis is a technique for focusing attention on the most important problem
areas. The Pareto concept, named after the 19th-century Italian economist Vilfredo
Pareto, is that a relatively few factors generally account for a large percentage of
total cases for example, complaints, defects, problems. The idea is to classify the
cases according to degree of importance and focus on resolving the most important,
leaving the less important. Often referred to as the 80-20 rule, the Pareto concept
states that approximately 80 percent of the problems come from 20 percent of the
items, and thus it is useful to prepare a chart that shows the number of occurrences
by category, arranged in order of frequency. Example of Pareto chart shown in
Figure 2.1.
Figure 2.1: Sample of Pareto Chart
14

The dominance of the problem with traffic becomes apparent. Presumably, the
manager and employees would focus on trying to resolve this problem. Once they
accomplished that, they could address the remaining defects or problems in similar
fashion. Child care would be the next major category to be resolved, and so on.
Hence, in later Pareto diagram, categories such as “traffic” may still appear but
would be much less prominent.
2.3.3 Cause-and-Effect Diagram
A cause-and-effect diagram offers a structured approach to search for possible
cause(s) of problem. It is also known as a fishbone diagram because of its shape, or
an Ishikawa diagram, after the professor who developed the approach to aid workers
overwhelmed by the number of possible sources of problems when problem solving.
This tool helps to organize problem-solving efforts by identifying categories of
factors that might be causing problems. Often this tool is used after brainstorming
sessions to organize the ideas generated. Figure 2.2 illustrates one form of a cause-
and-effect diagram.
Figure 2.2: Format of Cause-and-Effect Diagram
15

An example of an application of such a cause-and-effect diagram is shown in Figure
2.3. Each of the factors listed in the diagram is a potential source of unwanted
variation in output. Some are more likely causes than others, depending on the nature
of the errors. If the cause is still not obvious at this point, additional investigation
into the root cause may be necessary, involving a more in-depth analysis.
Figure 2.3: Cause-and-Effect Diagram for Unwanted Variation in Output
16

CHAPTER 3
METHODOLOGY
3.1 Introduction
In this chapter, it explains the research methodologies that were used for supporting the
analysis of the study. Some of the elements in methodology include the study plan,
flowchart of the research, data collection and analysis techniques.
3.2 Study plan
This study plan is to identify and analyze for the incoming material based on quality
control in the manufacturing industry. In Figure 3.1 can shows that the research is
carried out in procedure according to the flow chart. This flow chart is a graphical or
symbolic representation of a process. Each step in the process flow is represented by a
different symbol and contains a short text description of the process step in the flow
chart symbol. It helps to identify a starting point, a sequence of actions, the decisions
that must be made, and the conclusion or end to the process. Besides, it can be used to
identify areas of the problem, document the process and even serve as a planning tool
for process improvement. Then, an analysis on the data collected and also discussion
concluded. Lastly, recommendations and conclusions were carried out to complete final
report.
17
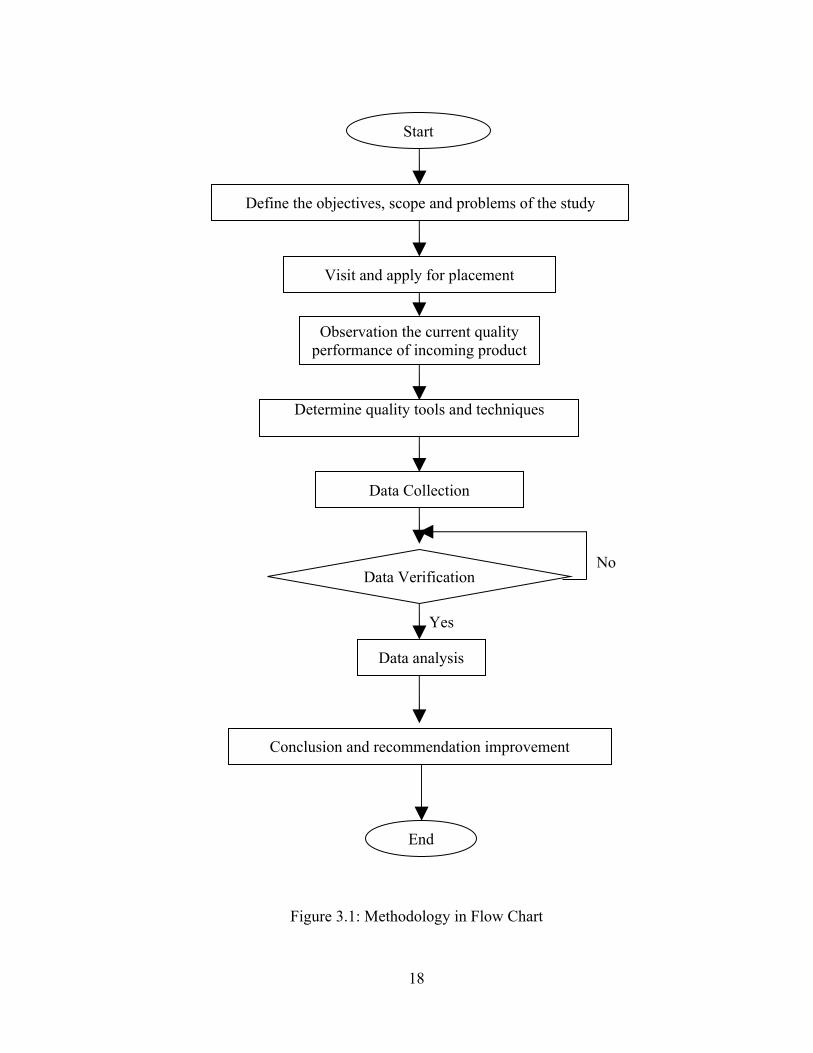
Figure 3.1: Methodology in Flow Chart
Start
Define the objectives, scope and problems of the study
Visit and apply for placement
Observation the current quality performance of incoming product
Determine quality tools and techniques
Data Collection
Data VerificationNo
Yes
Data analysis
Conclusion and recommendation improvement
End
18

3.2.1 Explanation of Study Plan
First in start point, the title is “An analysis incoming quality control of material in
manufacturing industry” for this project. So, it needs to identify objective, scope of
study and the problem statements for the project. Objective discussed the purpose and
goal which need to be achieving in this project. Scope would represent the research area
that covered in this project. In problem statement would discussed the problem that
comes out of the manufacturing industry.
Next would be the going and visit industrial to apply placement for run the research
more technical and practical. The application to industry visit being preceded to confirm
the manufacturing industry for our study.
After confirmation for accept the permission from the manufacturing industry,
something must be done before go to the industry. From here, observation for the current
quality control system based on incoming materials or parts of the manufacturing
industry. Then, sampling method must be determined to make the analysis more
technical and practical.
So, till the stage of data collection, an observation for the data whether in control limit
specification or out of the standard using different of tools. Besides, some of the
measurements need to be carried out for getting the data of the material. This
measurements could analyzed the quality of the raw materials or input parts before go
through the production line is consider good.
This step shows the quantity of the data measurements has been carried out whether is
enough for the research. Some of the data that has been measured achieved the numbers
of acceptance or not. Besides that, the quality control technique that used for the
received raw materials part in the factory also needs to be analysis. Verification of the
19
data to ensure data collected are enough for the data analysis otherwise the data must be
repeatedly filled up.
At the stage of data analysis, it will concern to analysis quality level of the raw materials
in the incoming location of factory. Sampling plan used for the acceptance or rejection;
and quality control tools and technique have been used for analysis the data
measurements. Some of the quality control tools for obtain the data of incoming parts
can be performed by using Pareto chart, Cause-and-Effect Diagram.
Before end point, the summary of the research represent the conclusion. From
conclusion, it also obtain that objectives of the project have been achieved. Meanwhile,
some recommendations and suggestions being implement to solve the problem that face
of the manufacturing industry. The solutions indirectly could provide the improvements
for the manufacturing industry. The project of PSM subject has been completed at the
end point stage.
3.3 Data Collection
For the data collection that used in this project are to determine the quality control based
on the incoming parts or materials in the manufacturing industry. The data collected
through primary resources and secondary resources.
3.3.1 Primary Resources
3.3.1.1 Archival Collections
20
Archival collection defines to analyze and evaluate the quality control based on the
incoming materials part in the manufacturing industry in Malaysia. Two ways of
accessing the project, one is the library search and the other is the internet accesses. The
others information was obtained through the online internet resources, journals finding
related, reference books, and articles from the library of UTeM.
3.3.1.2 Interview
Interview conducted with the operator from the quality control department in XX
Electronics Company carried out. From this session, the information can be collected
about the quality control situation for their incoming checking inspection.
3.3.2 Secondary Resources
3.3.2.1 Reference Books
Reference books such as journals, articles, magazines and other books related are
secondary sources purposely for report completion. The sources of reference books
normally borrow through UTeM library. Some of the important articles and journals are
scanned out for reference that related to the project. Mostly the information sources from
reference books are more recognized compare to the information resource from online
search which is internet.
3.4 Analysis Tools and Techniques
Some of the procedures include of the analysis techniques and methods that used in this
project are internet search and the sources of finding from the reference books. The
21

processes or methods that used in this project were acceptance sampling, Pareto
diagram, and Cause-and-Effect diagram.
3.4.1 Acceptance Sampling
In acceptance sampling is more focused to this project with inspection and measuring of
the incoming raw material before going through the production. Acceptance sampling is
a form of inspection that is applied to lots or batches of items either before or after a
process instead of during the process. In this case, the lots represent incoming purchased
items from suppliers of the factory. The purpose of acceptance sampling is to decide
whether a lot satisfies predetermined standards. All inspections important in this
incoming department that satisfy standards are passed or accepted while those do not are
rejected.
22

CHAPTER 4
RESULTS
4.1 Company Background
XX Electronics Company is established on 15th April 1994 as old company located in
Free Trade Zone Fhase III Batu Berendam, Melacca. It is the largest manufacturing
facility where Electronics manufactures digital entertainment products as well as
Speaker Systems for the PC and the Internet.XX Company is a reliable electronics
manufacturing service provider that emphasizes on high quality, flexibility, competitive
prices and timely delivery to offer its customers a competitive edge. It is a world class
integrated electronics manufacturing company which that through to:
1. Provides Quality Products and Services
2. Exceed Customers' Expectations
3. Committed Employees & Strategic Partners
4. Fulfill Business Objectives & Social Responsibilities
XX Company is committed to total customer satisfaction, accomplished through a
process of continuous improvement to become a world class multimedia producer.
23

4.2 Flow Chart Inspection
The raw material is coming from suppliers related.
In Incoming Quality Control Department, the raw material for Cover Top and Chassis Main received.
IQC will check on dimension, and visual for incoming parts.
The condition of product checked.
If Reject:1. Obtain the Material Rejection Report for the rejection due to visual and dimension defects.2. Identify most problem of rejection before send back to supplier
If Accept:3. Proceed to warehouse and production line used.
Figure 4.1: Flow Chart of Incoming Material
4.3 Data Collection
24