an analysis of consumers’ buying behavoiur and its
TRANSCRIPT
International Journal of Economics and Finance; Vol. 7, No. 9; 2015
ISSN 1916-971X E-ISSN 1916-9728
Published by Canadian Center of Science and Education
112
An Analysis of Consumers’ Buying Behavoiur and Its Determinants of
Fast Food in Sri Lanka
Thayaparan Aruppillai1 & Paulina Mary Godwin Phillip
1
1 Department of Economics & Management, Vavuniya Campus of the University of Jaffna, Sri Lanka
Correspondence: Thayaparan Aruppillai, Vavuniya Campus of the University of Jaffna, Sri Lanka. Tel:
94-7-7614-3582. E-mail: [email protected]
Received: May 15, 2015 Accepted: August 10, 2015 Online Published: August 25, 2015
doi:10.5539/ijef.v7n9p112 URL: http://dx.doi.org/10.5539/ijef.v7n9p112
Abstract
This study focused to identify the impact of demographic and economic attributes of the consumers that
influence on fast food consumption and consumers’ buying behaviour in Moratuwa municipal council area
which is located in Sri Lanka. Data were collected through a consumer survey with a structured questionnaire
conducted in the study area and 100 samples from 50 restaurants were selected randomly. An ordered probit
model was carried out to find out the relationships between a selected demographic and economic attributes of
consumers such as age, education, gender, civil status, number of family members, distance to the nearest fast
food outlet, conscious of health and disease concern on fast food consumption, consumers’ perception on
convenience of fast food, entertainment, income, employment status, and price opinion about fast food that affect
on buying behaviour of the consumers in the fast food restaurants in Sri Lanka. In addition to that, other
econometrics techniques such as, descriptive statistics, chi–square test and marginal effects also applied in the
data. Frequency of fast food consumption considered as dependent variable which is as an ordinal outcome
variable and all other explanatory variables namely demographic and economic attributes of consumers were
used as categorical and binary variables in the study. Results from the ordered probit model reveals that, age of
the respondent, education level, employment and civil status, distance to the nearest fast food outlet from their
home have statistically significant and they are the key determinants in the consumption of fast food. The
findings of this study will help for fast food managers to design their marketing strategies which are most
suitable to fit with the consumers’ attitudes and expectations and their buying behaviour of fast food restaurants
in Sri Lanka.
Keywords: fast food restaurants, consumers’ attitudes, marginal effects, ordered probit model
1. Introduction
Over the past decades, fast food consumption habits have changed massively in the world and at present busy
world and because of both spouses to work outside of the home, most people prefer to consume the fast food in
the restaurants or take away food outlets. In addition to the income of the households, with an increasing assent
on health concern, nutrition of the foods and atmosphere and changing life styles towards the modernization
offers various opportunities for the household to buy and consume fast food products quickly from the modern
restaurants. Due to the above reasons the habits towards ready to eat among the consumers have increased the
demand for fast food. As like other developing countries, there are significant number of restaurants are being
established especially in major cities in Sri Lanka including Moratuwa which is a large suburban city in the
South- West coast of the country. At present more than 50 fast food restaurants and takeaway joints are operating
in the study area. In this background, it is interesting to know what factors have influenced the people in and
around the area to consume more of fast food in the restaurants and there is a need to identify the factors that
determine the frequency of fast food consumption in Moratuwa, Sri Lanka.
The objective of this study is to investigate how demographic and economic attributes of the consumers
influence on fast food consumption habits and their buying behaviour in Moratuwa, which is located in Sri
Lanka.
2. Literature Review
Anita Goyal and N. P. Singh (2007), have examined the consumer perception about fast food in India and they
www.ccsenet.org/ijef International Journal of Economics and Finance Vol. 7, No. 9; 2015
113
have found that young Indian has passion for visiting fast food outlets for fun and change but home food their
first choice. Consumer characteristics influencing fast food consumption in Turkey was investigated by Cuma
Akbay, Gulgun Yildiz Tiryaki and Aykut Gul (2007) and the results shown that age, income, education,
household size, presence of children and other factors significantly influence the fast food consumption
behaviour in Turkey. Another study has made by Elizabeth Denney–Wilson, Anthony D. Okely, Louise Hardy,
David Crawford and Timothy Dobbins (2009) on influences on consumption of soft drinks and fast foods
adolescents in New South Wales and their results proved that over half of the boys and more than one third of the
girls reported drinking soft drinks daily, and consumption peaked in grade 8 students in the study area. Iqbal
Zafar. M, Saif–ur-Rehman Saif Abbasi, Aysha Chaudhry and Atif Riaz (2009) have examined the consumer
behaviour towards fast food Pakistan using 90 customers which were selected randomly and their results
suggested that majority of the respondents was young, well educated and economically well off.
Another research has done by Bala swamy, Anil Kumar and Srinivasa Rao (2012) have analyzed the buying
behaviour of consumers towards instant food products in India and their results suggest that the average per
capita purchase and per capita expenditure on instant food products had a positive relationship with income of
households. A previous study has done by Vinit Dani and Vanishree Pabalkar (2013) regarding on exploring of
consumer behaviour towards fast food industry in Pune and their findings reveals that Indian fast food market is
growing at an annual growth rate of 30%-35% and other popular food chain have huge plans of expansion in
future. Zeke Bryant (2011) has analyzed on who consumes fast food and why? in USA and his results showed
that gender, age and time spent cooking had a significant negative effect on the consumption of fast food while
race had a positive influence on it.
3. Methods
To identify how a consumer’s fast food consumption behavior is affected by socio-economic and demographic
characteristics in Moratuwa municipal council area, primary data through a structured questionnaire comprising
of both open ended and close ended questions were collected from all 21 towns in this study area. Further,
sample comprised of 120 respondents and out these, 100 samples was selected randomly from 50 restaurants,
who gave completed questionnaires.
Different econometrics techniques such as descriptive statistics, chi–square test, ordered probit model and
marginal effects were applied in the data analysis. The categorical variable for frequencies of consumption was
used as dependent variables and it coded as 0 for never, 1 for once or twice a month, 2 for once a week and 3 for
once a day and all other twelve variables were used as explanatory variables in the study. For data analysis,
ordered probit regression and marginal effects after estimate the model were applied and addition to that data
were analyzed by using other statistical methods especially descriptive statistics and chi- square test. Descriptive
statistics are used to describe the basic features of the data set and they provide simple summaries about the
sample and the measures. Chi-square test measures the goodness of fit where data are categorized and as a test
for the more common contingency table, in which categorization is across two or more dimensions at the
nominal or ordinal level. The crosstabs with chi–square are more useful to identify the relationship between
categorical and ordinal data and this test is more useful to determine whether or not a particular categorical
ordinal variable is an important in the dependent variable.
In sociological research, ordered probit model is often used to relate an ordered outcome dependent variable to a
set of dichotomous or categorical independent variables. In this study also, dependent variable that is consumers’
frequency of fast food was investigated using ordered probit model and the response regarding the consumption
frequency was converted into ordered values from 0 to 3. The model used in the study can be written as:
Y = β0 + β1P + β2AGE + β3INC + β4EDU + β5ES + β6G + β7NFM + β8CS + β9DSTNC +β10HLTH + β11CONV
+ β12ENT + Ɛ
Where:
Y = Frequency of fast food consumption and it is coded as an ordered outcome such as,
= 0 for never
= 1 for once or twice a month
= 2 for once a week
= 3 for once a day
P = price of fast food
= 0 for not affect on consumption decision of fast food
www.ccsenet.org/ijef International Journal of Economics and Finance Vol. 7, No. 9; 2015
114
= 1 for has affect on consumption decision of fast food
AGE = Age of the household in years
= 0 for less than 15 year (Kids)
= 1 for between 16 and 30 years (Youngsters)
= 2 for between 31 and 45 years (Middle aged consumers)
= 3 for 46 years and above (Elders)
INC = Monthly income of the household
= 0 for less than LKR 15000
= 1 for between LKR 15001 and LKR 30000
= 2 for between LKR 30001 and LKR 45000
= 3 for LKR 45001 and above
EDU = Educational level of the household
= 0 for primary education
= 1 for secondary education
= 2 for higher education
ES = Employment status
= 0 for unemployed
= 1 for employed
G = Gender
= 0 for female
=1 for male
NFM = Number of family members
CS = Civil Status
= 0 for single
= 1 for married
DSTNC= Distance to the nearest fast food outlet from their home (km)
HLTH = Conscious about health and disease concern
= 0 for fast food has no harmful on health and disease
= 1 for fast food has harmful on health and disease
CONV = Consumer’s perception about convenience
= 0 for fast food is no convenient
= 1 for fast food is convenient
ENT = Entertainment
= 0 for eating fast food for entertainment
= 1 for eating fast food not entertainment
Marginal effects are more useful to interpret the results of ordered probit model effectively and this effects show
how the probabilities of each outcome change with respect to the changes in explanatory variables. The positive
marginal effect of a variable indicates the probability of a consumer choosing that particular ranking increases
with the particular variable while a negative marginal effect of a variable indicates the probability of a consumer
choosing that particular ranking decreases with the particular variable.
4. Results and Discussions
In Table 1, results of the descriptive statistics of each variable were analyzed and it displaced in the table as
below.
www.ccsenet.org/ijef International Journal of Economics and Finance Vol. 7, No. 9; 2015
115
Table 1. Results of descriptive statistics
Variables Mean Standard deviation
Independent variables
Price .74 .441
Age 1.32 .815
Income 1.58 1.273
Level of Education 1.56 .538
Employment status .73 .446
Number of family members 4.30 1.521
Civil status .40 .492
Distance in Km 2.06 2.033
Health concerns .89 .314
Convenience .91 .288
Entertainment .58 .496
Gender
Dependent variable
Frequency of fast food consumption
.49
1.34
.502
0.685
Source: Survey data, 2014.
The above table shows that mean of the dependent variable that is frequency of fast food consumption is 1.34
indicates that the respondents who are living in the study area on average their preference to go to the fast food
restaurants considered as once or twice month. The average age group of respondents was in between 16 years to
30 years, while the average income was in between LKR 16,000 and LKR 30,000. The average number of
family members per respondent was roughly 4 and the average distance from the home to the fast food restaurant
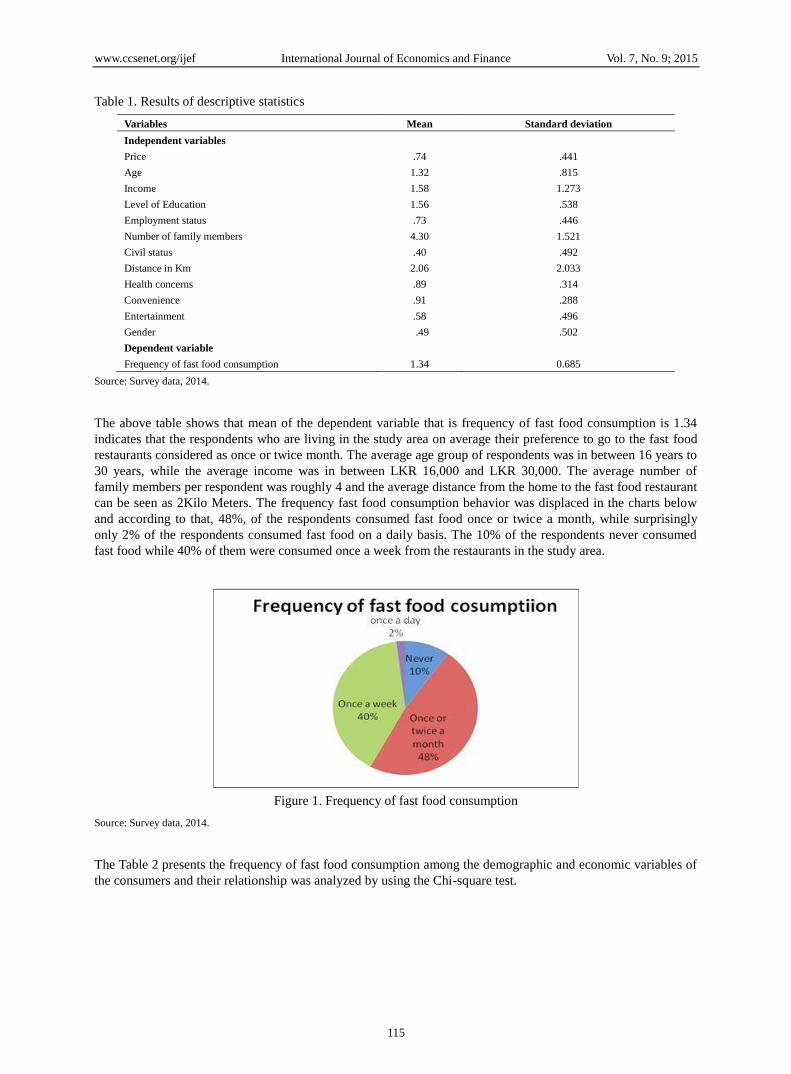
can be seen as 2Kilo Meters. The frequency fast food consumption behavior was displaced in the charts below
and according to that, 48%, of the respondents consumed fast food once or twice a month, while surprisingly
only 2% of the respondents consumed fast food on a daily basis. The 10% of the respondents never consumed
fast food while 40% of them were consumed once a week from the restaurants in the study area.
Figure 1. Frequency of fast food consumption
Source: Survey data, 2014.
The Table 2 presents the frequency of fast food consumption among the demographic and economic variables of
the consumers and their relationship was analyzed by using the Chi-square test.
www.ccsenet.org/ijef International Journal of Economics and Finance Vol. 7, No. 9; 2015
116
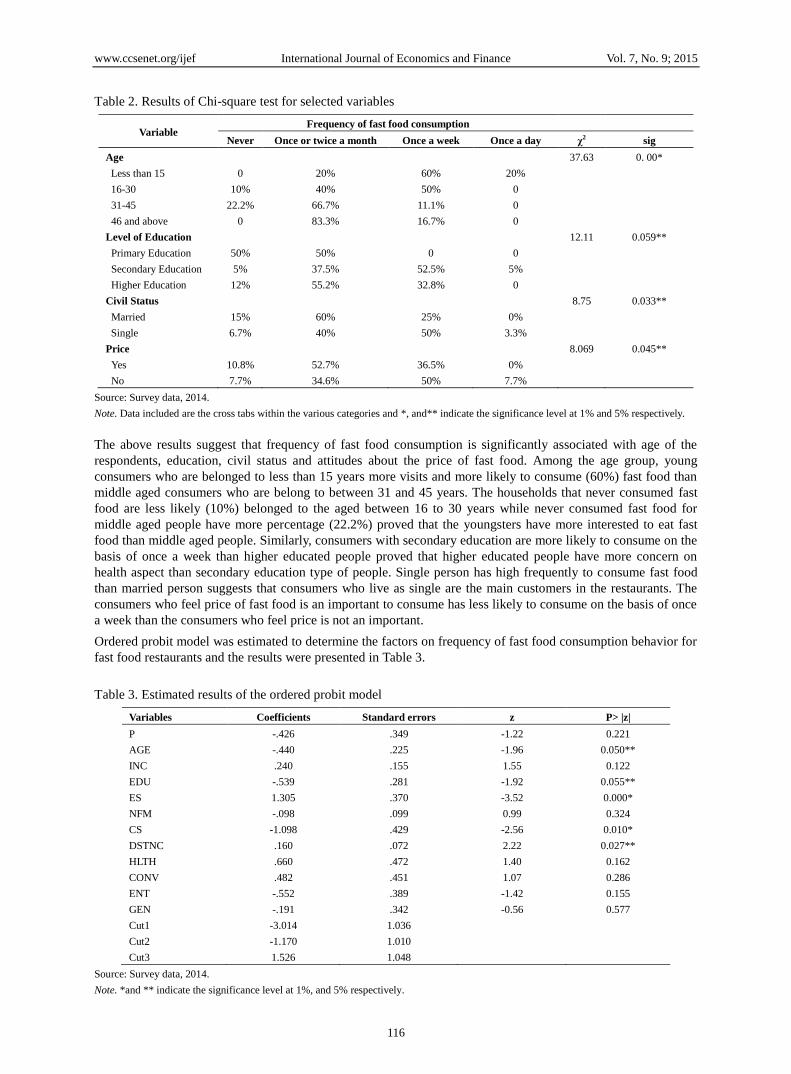
Table 2. Results of Chi-square test for selected variables
Variable Frequency of fast food consumption
Never Once or twice a month Once a week Once a day χ2 sig
Age 37.63 0. 00*
Less than 15 0 20% 60% 20%
16-30 10% 40% 50% 0
31-45 22.2% 66.7% 11.1% 0
46 and above 0 83.3% 16.7% 0
Level of Education 12.11 0.059**
Primary Education 50% 50% 0 0
Secondary Education 5% 37.5% 52.5% 5%
Higher Education 12% 55.2% 32.8% 0
Civil Status 8.75 0.033**
Married 15% 60% 25% 0%
Single 6.7% 40% 50% 3.3%
Price 8.069 0.045**
Yes 10.8% 52.7% 36.5% 0%
No 7.7% 34.6% 50% 7.7%
Source: Survey data, 2014.
Note. Data included are the cross tabs within the various categories and *, and** indicate the significance level at 1% and 5% respectively.
The above results suggest that frequency of fast food consumption is significantly associated with age of the
respondents, education, civil status and attitudes about the price of fast food. Among the age group, young
consumers who are belonged to less than 15 years more visits and more likely to consume (60%) fast food than
middle aged consumers who are belong to between 31 and 45 years. The households that never consumed fast
food are less likely (10%) belonged to the aged between 16 to 30 years while never consumed fast food for
middle aged people have more percentage (22.2%) proved that the youngsters have more interested to eat fast
food than middle aged people. Similarly, consumers with secondary education are more likely to consume on the
basis of once a week than higher educated people proved that higher educated people have more concern on
health aspect than secondary education type of people. Single person has high frequently to consume fast food
than married person suggests that consumers who live as single are the main customers in the restaurants. The
consumers who feel price of fast food is an important to consume has less likely to consume on the basis of once
a week than the consumers who feel price is not an important.
Ordered probit model was estimated to determine the factors on frequency of fast food consumption behavior for
fast food restaurants and the results were presented in Table 3.
Table 3. Estimated results of the ordered probit model
Variables Coefficients Standard errors z P> |z|
P -.426 .349 -1.22 0.221
AGE -.440 .225 -1.96 0.050**
INC .240 .155 1.55 0.122
EDU -.539 .281 -1.92 0.055**
ES 1.305 .370 -3.52 0.000*
NFM -.098 .099 0.99 0.324
CS -1.098 .429 -2.56 0.010*
DSTNC .160 .072 2.22 0.027**
HLTH .660 .472 1.40 0.162
CONV .482 .451 1.07 0.286
ENT -.552 .389 -1.42 0.155
GEN -.191 .342 -0.56 0.577
Cut1 -3.014 1.036
Cut2 -1.170 1.010
Cut3 1.526 1.048
Source: Survey data, 2014.
Note. *and ** indicate the significance level at 1%, and 5% respectively.
www.ccsenet.org/ijef International Journal of Economics and Finance Vol. 7, No. 9; 2015
117
Results of the socio–economic and demographic variables are guided to identify the consumers who are likely to
be most interested in fast food consumption behavior. According to the table 3, coefficients for price (P), income
(INC), number of family members (NFM), attitudes about health concern on food (HLTH), convenient (CONV),
entertainment (ENT), and gender (GEN) did not have significant impact on fast food consumption while
coefficients for age (AGE), education level (EDU), employment status (ES), civil status (CS) and distance
(DSTNC) have statistical significance and they are the important determinants of fast food consumption.
Age of the respondents have negative sign shows that as age increases, the consumers have less probability to go
to the restaurants and compare with elderly people, young generation prefers to go more visits to restaurants.
Similarly other variables such as, education level, number of family members and civil status also negatively
impact on frequency of past food consumption behaviour of the consumers. It means that as the above variables
were increases, they have less probability to go the food restaurants and their buying behaviour from the
restaurants also less in the study area.
On the other hand, coefficients for employment status and distance have statistically positive impact on fast food
consumption show that when these variables are increase, the probability for frequency of fast food consumption
also will increase. Cut 1, cut 2 and cut 3 refer to the intercepts of the dependent variable and it has four orders
and three dummy variables hence there will be only three intercepts. The variable civil status has negative sign
reveals that a person who is married has less likely to consume the fast food from restaurants than single person.
Further, the variable for distance has positive sign proves that the customers who are living far away from the
restaurants have less visit and thus less interested to consume the fast food than others who are living closer to
the restaurants.
The marginal effects give insights into how the explanatory variables shift the probability of frequency of fast
food purchasing behaviour between the four ordinal levels and these effects were measured after estimated
ordered probit model. The results of marginal effects for fast food purchasing behaviour were display in the
Table 4.
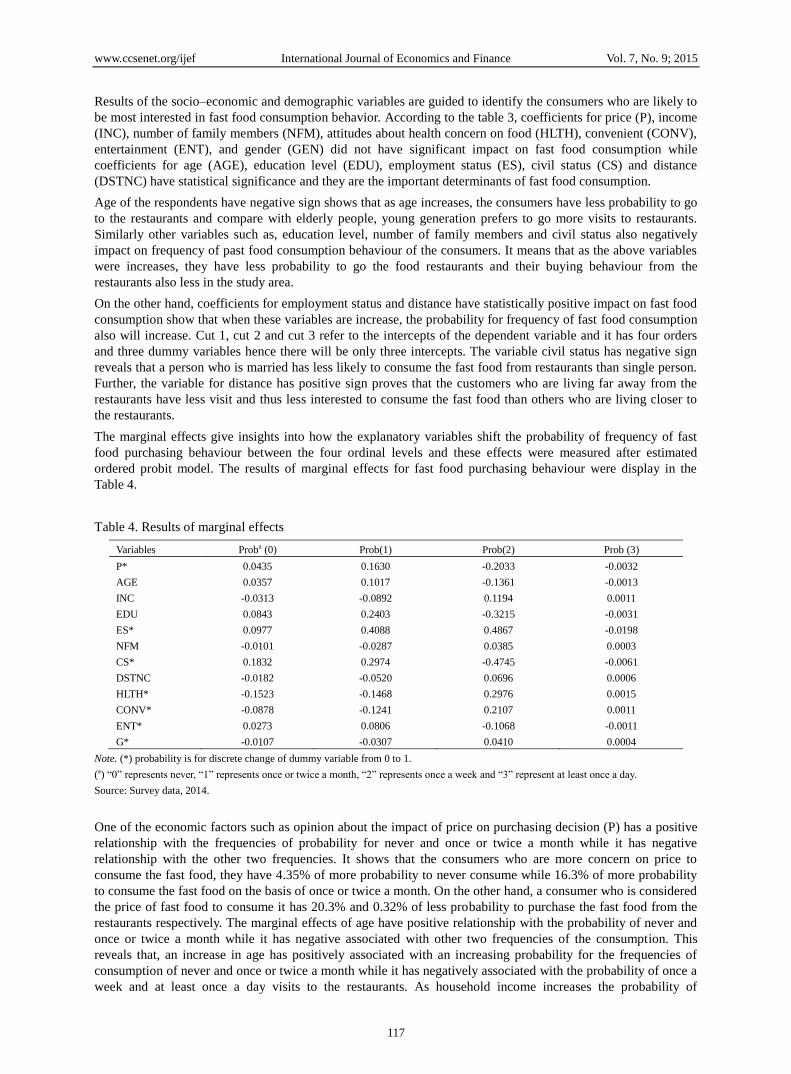
Table 4. Results of marginal effects
Variables Proba (0) Prob(1) Prob(2) Prob (3)
P* 0.0435 0.1630 -0.2033 -0.0032
AGE 0.0357 0.1017 -0.1361 -0.0013
INC -0.0313 -0.0892 0.1194 0.0011
EDU 0.0843 0.2403 -0.3215 -0.0031
ES* 0.0977 0.4088 0.4867 -0.0198
NFM -0.0101 -0.0287 0.0385 0.0003
CS* 0.1832 0.2974 -0.4745 -0.0061
DSTNC -0.0182 -0.0520 0.0696 0.0006
HLTH* -0.1523 -0.1468 0.2976 0.0015
CONV* -0.0878 -0.1241 0.2107 0.0011
ENT* 0.0273 0.0806 -0.1068 -0.0011
G* -0.0107 -0.0307 0.0410 0.0004
Note. (*) probability is for discrete change of dummy variable from 0 to 1.
(a) “0” represents never, “1” represents once or twice a month, “2” represents once a week and “3” represent at least once a day.
Source: Survey data, 2014.
One of the economic factors such as opinion about the impact of price on purchasing decision (P) has a positive
relationship with the frequencies of probability for never and once or twice a month while it has negative
relationship with the other two frequencies. It shows that the consumers who are more concern on price to
consume the fast food, they have 4.35% of more probability to never consume while 16.3% of more probability
to consume the fast food on the basis of once or twice a month. On the other hand, a consumer who is considered
the price of fast food to consume it has 20.3% and 0.32% of less probability to purchase the fast food from the
restaurants respectively. The marginal effects of age have positive relationship with the probability of never and
once or twice a month while it has negative associated with other two frequencies of the consumption. This
reveals that, an increase in age has positively associated with an increasing probability for the frequencies of
consumption of never and once or twice a month while it has negatively associated with the probability of once a
week and at least once a day visits to the restaurants. As household income increases the probability of
www.ccsenet.org/ijef International Journal of Economics and Finance Vol. 7, No. 9; 2015
118
purchasing the food in the category of never and once or twice a month will reduces by 3.13% and 8.92%
respectively while frequencies of other categories are increases. Probability of fast food consumption increase
with education on the basis of never and once a twice a month while reduces on the basis of once a week and at
least once a day.
Civil status (CS) which is a dummy variable given zero for single and 1 for married has positive relations with
the first two categories while it has negative relations with other two categories show that the consumers who are
single had 47.45% and 0.61% of lower probability for the frequencies of once a week and at least once a day
while 18.32% and 29.74% of higher probability of being not consuming the fast food from the restaurants in the
study area. Regarding to the health concern which is also dummy variable indicates that the consumers who have
more concern on their healthy life, they had less probability for higher frequency that is at least once a week and
nearly 15% probability of being not consuming the fast food. The demographic variables such as gender (G) are
also helpful in profiling consumer who is likely to be most interested in the purchasing of fast food. According to
that, relatively male consumers have little bit more interested on fast food consumption on the basis of higher
frequency than female consumers. Consumers’ attitudes towards perception about convenience and
entertainment and the distance between the restaurants and consumers’ residential places also impact on the
purchasing behaviour of fast food consumption in the study area.
5. Conclusions
Today’s world, the people are increasing the consumption for their different varieties of food due to the
convenience and socio economic factors they prefer to take them from the restaurants and the rapid advancement
in the food industry can be attributed to the growth in technology which also gave way to fast food. The study
proved that 48% of the respondents in the sample consumed fast food at once or twice a month, while
surprisingly only 2% of the respondents consumed fast food on a daily basis. But only 10% of them never
consumed their fast food while 40% of them were consumed once a week from the restaurants in the study area.
Overall, the results of the ordered probit model suggests that a person who has employed have more likely to
consume the fast food from the restaurants while the consumer who are not married has more probability to visit
the restaurants in the study area. Also age of the consumer, education level and distance between the restaurants
and home also major determinants of consumers’ buying behaviour from the restaurants in Sri Lanka. An overall
results and findings may help to design the marketing strategies and policies to improve their business who are
involved in fast food industry and they can promote their market share in Sri Lanka.
Acknowledgments
We are very much obliged to thank the University Grants Commission of Sri Lanka for their immense support by
way of funding the whole research. This support is very much appreciated for researchers like us to continue
researches in their field of expertise.
References
Anita, G., & Singh, N. P. (2007). Consumer perception about fast food in India: An exploratory study. British
Food Journal, 109(2), 182-195. http://dx.doi.org/10.1108/00070700710725536
Bala, S. M., Anil, K. T., & Srinivasa, R. K. (2012). Buying behaviour of consumers towards instant food
products. International journal of Research and computational Technology, 2(2), 2012.
Cuma, A., Gulgun, Y. T., & Aykut, G. (2007). Consumer characteristics influencing fast food consumption in
Turkey. Retrieved from http://www.sciencedirect.com/science/article/pii/S0956713506001290(2007)
Elizabeth, D. W., Anthony, D. O., Louise, H., David, C. D., & Timothy, D. (2009). Influences on consumption of
soft drinks and fast foods in adolescents. Retrieved from
http://ro.uow.edu.au/cgi/viewcontent.cgi?article=1113&context=edupapers
Iqbal, Z. M., Saif-ur-Rehman, S. A., Aysha, C., & Atif, R. (2009). Consumer behaviour towards fast food.
Retrieved from http://psfst.com/jpd_fstr/eb5d4181d750ced06632d9c378c95e63.pdf
Vinit, D., & Vanishree, P. (2013). Exploring of consumer behaviour towards fast food industry in Pune.
Retrieved from
http://www.theglobaljournals.com/ijar/file.php?val=September_2013_1378217975_3a30e_97.pdf
Zeke, B. (2011). Who consumes fast food and why. Retrieved from
http://www.aaea.org/UserFiles/sections/ss-aaea/journal/2011/Bryant.pdf
www.ccsenet.org/ijef International Journal of Economics and Finance Vol. 7, No. 9; 2015
119
Copyrights
Copyright for this article is retained by the author(s), with first publication rights granted to the journal.
This is an open-access article distributed under the terms and conditions of the Creative Commons Attribution
license (http://creativecommons.org/licenses/by/3.0/).