an analysis of drought and its relationship with an ... · tual evapotranspirasi and potential...
TRANSCRIPT

914
Bulgarian Journal of Agricultural Science, 24 (No 5) 2018, 914–924
An analysis of drought and its relationship with an agricultural area in the watershed of Krueng Aceh, IndonesiaAzmeri1*, Asri Syahrial2
1 Civil Engineering Department, Faculty of Engineering, Syiah Kuala University, Jl. Tgk. Syeh Abdul Rauf No. 7, Darussalam – Banda Aceh 23111, Indonesia
2 Offi ce of River Region of Sumatra-I, Jl. Ir. Mohd. Thaher No. 14 Lueng Bata, Banda Aceh 23247 *Corresponding author: [email protected]
Abstract
Azmeri & Syahrial, A. (2018). An analysis of drought and its relationship with an agricultural area in the watershed of Krueng Aceh, Indonesia. Bulgarian Journal of Agricultural Science, 24(5), 914–924
In Indonesia, apart from Java Island, there is a scarcity of drought research. Therefore it is important to apply the results of the drought analysis, so as to anticipate an agricultural drought. This research aims are to calculate the drought index with the Standardized Precipitation Index (SPI), to compare SPI with the Southern Oscillation Index (SOI), Indian Ocean Dipole (IOD), river discharge and extensive rice fi elds affected by crop failure; to depict a map of drought spatial distribution. The worst agricultural drought value of SPI-6, displayed by Indrapuri post in November 2008, is about -5.13. Meanwhile SPI-12 showed the worst hydrological drought happening in November 2008 by -3.51 in Indrapuri post. The worst drought duration occurred in Blang Bintang, lasted for 34 months. The analysis results show that there is no signifi cant relationship between the value of the SPI with SOI and IOD, so that it can be said that rainfall patterns in the watershed of Krueng Aceh are not infl uenced directly by the SOI or IOD. Relationship of the SPI with discharge is also not suffi ciently signifi cant, with the greatest relation-ship of 0.61 on Indrapuri post. The SPI value also does not show a direct relationship with rice fi elds affected by the drought.
Keywords: drought; SPI; SOI; IOD; agricultural drought; hydrological drought
Introduction
Drought is the genesis of a disaster that creeps up on us slowly without our realizing it, because it can only be ex-perienced as an impact. It can manifest as a lower level of water in wells, rivers, lakes, and groundwater reducing land humidity which leads to plant stress causing them to die and will affect the water balance of irrigated agriculture (Ojeda-Bustamante et al., 2017). Climate change has affected the hydrological cycle (Woods et al., 2006), particularly water available for agricultural crops (Gawith et al., 2012; Rotich and Mulungu, 2017).
The drought in the area of Indonesia is infl uenced by climate change, signifi cantly the difference in air pressure
and air temperature between the Eastern Pacifi c Ocean mea-sured in Tahiti, and the Western Pacifi c Ocean measured in Darwin, Australia. The difference in value of the average air pressure in Tahiti and Darwin is recorded in an index known as the Southern Oscillation Index (SOI) (Dahlman, 2009). This index can be used as a reference to calculate the rela-tionship with the drought that has occurred.
Drought meteorology is signifi cant related to the phe-nomenon of El-Nino. While a meteorological drought has a signifi cant relationship with an agricultural one, proof of both is still required (Mladenova and Varlev, 2007; Adi-darma et al., 2013;). Dai (2012), researcher at the National Center for Atmospheric Research (NCAR) in Colorado, USA, explained that due to the rise in global temperatures,

915An analysis of drought and its relationship with an agricultural area in the watershed of Krueng Aceh...
the impact of climate change will increase in soildrought conditions in 30 years in most parts of the world. Adidarma et al. (2009) have studied the trend of lower rainfall in the dry season, and the possibility of intense dryness that be-came worse in some watersheds on Java Island, Indonesia. This research was based on the rainfall data of the years between 1916 and 2000. The results of research state that the phenomenon of increased dryness cannot be inferred merely from the tendency of heavy summer downpours. A drought that reduces the frequency of plentiful summer rain cannot be inferred from the tendency for more rain in the wet season.
Pratama (2014) conducted research on the analysis of drought using the Theory of Run on the watershed Ngrowo, Indonesia. Research results indicated the duration of the lon-gest drought of 17 months with the greatest intensity and quantity of rain 2.303 mm, in 1998. The conclusions showed that meteorological drought is associated with hydrological drought, from a relationship between drought and the num-ber of dischargecards in the river. In addition, meteorologi-cal drought also has a relationship with the SOI which is an indicator of the onset of El-Nino.
Method of Standardized Precipitation Index (SPI) can calculate various drought index time scale. At fi rst the SPI is calculated for 3, 6, 12, 24 and 48 months. This time scale describes the impact of the drought on the availability of various water sources in accordance with the allocation. The SPI-1 or 3-monthly described the meteorological drought and observed the monitoring drought. The SPI-1 to 6 month-ly was used for agricultural drought, and the SPI-12 to 24 monthly was used for analysis of hydrological drought and for catchment reservoirs design (Mckee et al., 1993).
Determination of scale (index) of drought can be measured by calculating the deviations of a long rainfall period (month-ly) with a value of either normal/average rainfall condition or a threshold value (humidity) (Adidarma et al., 2011a, b). The threshold value can be a value set in accordance with the needs of the allocation. The value of humidity for rice is 150 mm/month and for coconut it is 70 mm/month (Oldeman et al., 1980), by assuming that the probability of the same rainfall is 75% which can fulfi ll the needs of water for rice plants of 220 mm/month and 120 mm/month for palawija (coarse grain). Consequently, a month is said to be wet when the rainfall is greater than 200 mm and dry when there is less than 100 mm.
Fig. 1. Map of research location (Source: Public Work Offi ce/Irrigation, 2017)

916 Azmeri, Asri Syahrial
The agricultural sector as the largest water user becomes the most severely affected when catastrophic drought oc-curs. Climate change impacts more susceptible agricultural products, lowering the production of rice and coconuts (Mio-duszewski, 2009).
At the moment, the calculation of the SPI outside Java Island (Indonesia) has not much done, particularly in Aceh province. Indonesian Agency for Meteorology, Climatology and Geophysics only do calculations for the SPI-3 monthly. Thus it is important to look at the relationship between the SPI and agriculture.
Data and Methods
The location of the study is in the Krueng Aceh water-shed which is located in the Aceh Besar district, Aceh Prov-ince. Krueng Aceh watershed is located at the coordinates 5°35′34″ – 5°3′40″ Latitude North and 95°13′2″ – 95°49′46″ Longitude East. Figure 1 shows the position of rain posts that spread in and around the watershed of Krueng Aceh.
Data availability of suffi cient rain especially in the prov-ince of Aceh for conducting an analysis of hydrology is ex-tremely scarce. Military confl ict has neglected monitoring posts and the tsunami disaster worsened conditions. Not all posts have complete data and time is required for data to be inputted. The missing rainfall data was recorded using the combination method (developed by a team of fl ood and drought specialists, HITA Offi ce, Water Resources Center, the Ministry of Public Works). Table 1 shows the list of rain-fall posts in Aceh Besar District.
The calculation of the SPI to a location is worked out on the basis of monthly rainfall data for the desired period. Rainfall data is adjusted to a type of Gamma distribution, then calculated within the parameters of the Probability Den-sity Function (PDF). Next it is transformed to a normal dis-tribution reading where the average SPI in a location is equal to zero. When the value of SPI is positive, it indicates that the rainfall is greater than the threshold. On the other hand,
when the value of SPI is negative, rainfall is less than the threshold (Adidarma et al., 2011).
Meteorological drought is defi ned based on the level of drought climate change based on a specifi c period of rain-fall, compared to “normal” condition or averages duration of the dry period. While the agricultural drought related to the hydrological characteristics, where conditions are less rain (in the context of agriculture) is associated with the ac-tual evapotranspirasi and potential ground water that shrink, characteristics of plants, and shrinking water fl ow of the riv-er, reservoirs or ground water. Agriculture drought must be able to calculate the condition land humidity in the top soil at the time of planting. Therefore if the humidity of land in the top soil is not suffi cient, it will decrease the harvest or even will happen puso conditions for rice (Adidarma et al., 2011).
Standardized Precipitation Index (SPI)According to the guidelines of the Construction and Civil
Building No. Pd T-02-2004-A 2004, about the calculation of the drought index using the Run theory, the drought index in each rainfall post is calculated using the Standardized Pre-cipitation Index method. The calculation provides a drought index in 1-monthly, 3-monthly, 6-monthly and 12-monthly periods. The procedure for the calculation of the drought in-dex with the SPI is based on the following:
1. The series of monthly rainfall data calculate data pa-rameters for each of the same months in the form of:
● mean● standard deviation● lambda = [stdev / (mean)^2],● beta = 1/lambda,● alpha = lambda x mean,● the amount of data (n),● the frequency of data with the value of “0” (m), and● probability (q) = m/n2. Then the data is changed into a Gamma distribution to
calculate the cumulative probability distribution of Gamma using the monthly parameters of alpha and beta in accor-dance with their monthly data.
3. Furthermore its probability is calculated with the for-mula of the “q (1-Q)*cumulative gamma probability”.
4. Finally, the value of the drought index SPI is acquired by changing the data back to “normal distribution standards” by using the function of “norsinv”.
5. For the SPI 3-monthly, 6-monthly and 12-monthly, the calculation is slightly different with the SPI 1-monthly, by sum-marize data by as much as 3 months, 6 months and 12 months that continue to be counted until the last data is recorded.
6. Parameters of the data for each month are also calcu-lated for SPI 3-monthly, 6-monthly and 12-monthly.
Table 1List of rainfall posts
No. Post Names CoordinateLatitute Longitude
1 Blang Bintang 5o 30′ 12″ LU 95o 24′ 12″ BT2 Kota Bakti 5o 16′ 0.93″ LU 95o 55′ 46.6″ BT3 Lhoong 5° 18′ 00″ LU 95° 13′ 48,0″ BT4 Seulimum 5° 22′ 12.9″ LU 95° 33′ 48,0″ BT5 Indrapuri 5o 24′ 13.55″ LU 95o 27′ 51.23″ BT6 Lam Teuba 5° 28′ 48,0″ LU 95° 36′ 36,0″ BT7 Padang Tidji 5° 24′ 0″ LU 95° 48′ 36,0″ BT
917An analysis of drought and its relationship with an agricultural area in the watershed of Krueng Aceh...
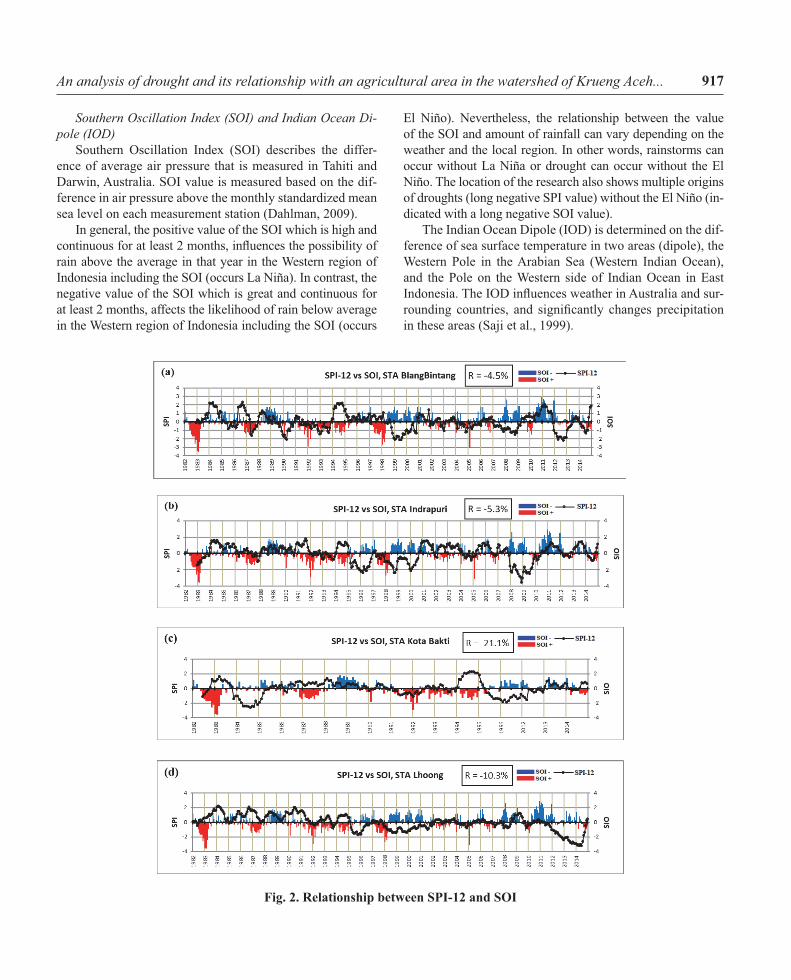
Southern Oscillation Index (SOI) and Indian Ocean Di-pole (IOD)
Southern Oscillation Index (SOI) describes the differ-ence of average air pressure that is measured in Tahiti and Darwin, Australia. SOI value is measured based on the dif-ference in air pressure above the monthly standardized mean sea level on each measurement station (Dahlman, 2009).
In general, the positive value of the SOI which is high and continuous for at least 2 months, infl uences the possibility of rain above the average in that year in the Western region of Indonesia including the SOI (occurs La Niña). In contrast, the negative value of the SOI which is great and continuous for at least 2 months, affects the likelihood of rain below average in the Western region of Indonesia including the SOI (occurs
El Niño). Nevertheless, the relationship between the value of the SOI and amount of rainfall can vary depending on the weather and the local region. In other words, rainstorms can occur without La Niña or drought can occur without the El Niño. The location of the research also shows multiple origins of droughts (long negative SPI value) without the El Niño (in-dicated with a long negative SOI value).
The Indian Ocean Dipole (IOD) is determined on the dif-ference of sea surface temperature in two areas (dipole), the Western Pole in the Arabian Sea (Western Indian Ocean), and the Pole on the Western side of Indian Ocean in East Indonesia. The IOD infl uences weather in Australia and sur-rounding countries, and signifi cantly changes precipitation in these areas (Saji et al., 1999).
Fig. 2. Relationship between SPI-12 and SOI
918 Azmeri, Asri Syahrial
Results and Discussion
Relationship between SPI and SOIDrought analysis of SPI-1, SPI-3 and SPI-6 could not
indicate the drought accurately. The drought analysis of SPI-12 (specifi cly to the condition of the hydrological drought) showed a relationship between the genesis drought (long negative SPI) and the possibility of whether El Niño that oc-cured or not based on the value of the SPI.
From 7 posts, analysis is only done in 4 posts. Four posts have the latest rain data, while other posts only have data before 2014. Figure 2 describes the relationship between the SPI-12 and SOI.
The graph presented in Fig. 2 refers to the relationship between the SPI-12 and the SOI value, which shows that the value of the long negative SPI does not indicate any relation-ship with the value of the long negative SOI. Returns the
correlation coeffi cient of the array 1 and array 2 cell ranges. Use the correlation coeffi cient to determine the relationship between two properties. The equation for the correlation co-effi cient is:
∑x(x – x–)(y – y–)Correl (X,Y) = –––––––––––––––, ––––––––––––– √(x – x–)2(y – y–)2
where: ∑x = total number of variabel X; ∑y = total number of variabel Y; = total average of variabel X; and = total average of variabel Y.
The value of R in each graph in Fig. 2 shows how signifi -cant is the relationship between the SPI-12 and the SOI. The larger the value of R the relation is signifi cant. Consequently, it can be said that the climate in the location of the study is not infl uenced directly by the SOI. It can be stated that the drought in the location of the study often occurs without El Niño.
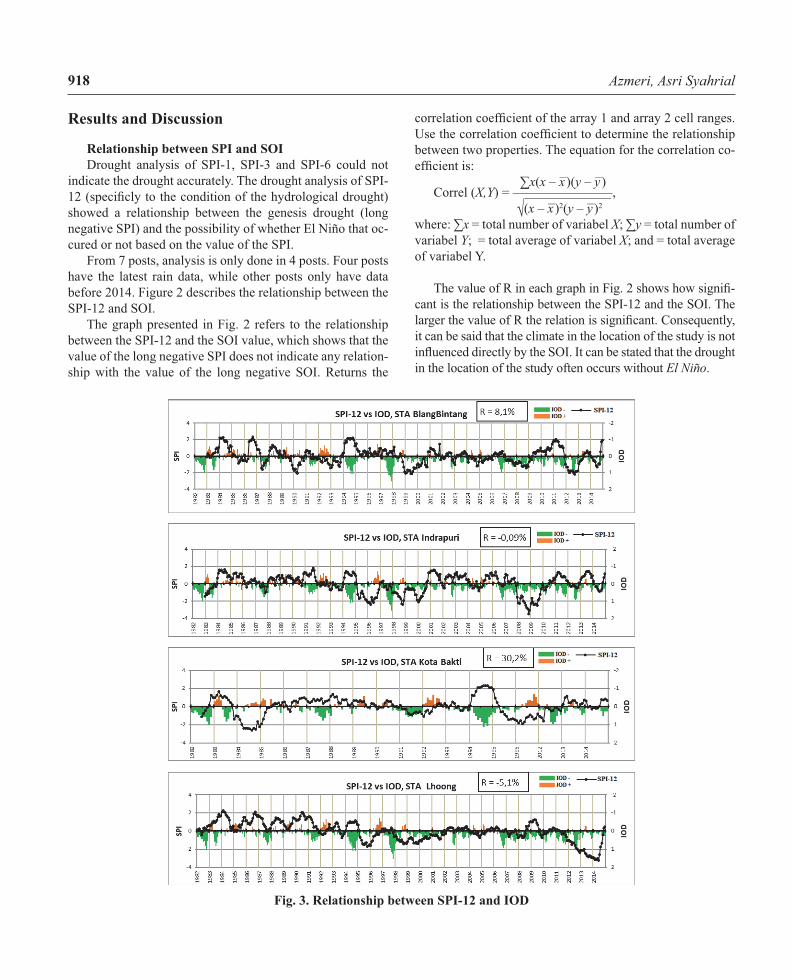
Fig. 3. Relationship between SPI-12 and IOD

919An analysis of drought and its relationship with an agricultural area in the watershed of Krueng Aceh...
Relationship between SPI and IOD
In contrast to the SOI, in the IOD, a positive value indi-cates the possibility of drought, while negative numbers de-scribe the excess of rainfall. In other words, a lengthy posi-tive value of IOD shows the lack of rainfall which impacts on a long disaster drought.
Fig. 3 shows that there is no signifi cant relationship be-tween the value of the IOD and the index value of the SPI-12. According to the graph, there is only a little data that shows the period of the months with the value of the long negative SPI, that correlate with the value of the long positive IOD.
The Blang Bintang post indicated no signifi cant relation-ship with relationship R = 8.1%. In the Indrapuri post, there was a no signifi cant relationship between the SPI-12 and the IOD with R = – 0.09%. In the Kota Bakti post, there was sig-
Table 2Classifi cation of the wetness and drought level according to the value of SPIThe value of SPI Classifi cation2.00 or >2.00 Extremly wet1.50 –1.99 Very wet1.00 – 1.49 Moderately Wet(-0.99) – 0.99 Near normal(-1.00) – (-1.49) Moderately dry(-1.50) – (-1.99) Severely dry(-2.00) or < (-2.00) Extremely Dry
Source: Mckee et al. (1993)
Table 3. Analysis of annual rainfall character in rainfall postYear BlangBintang Indrapuri Kota Bakti Lhoong Average
1982 Dry -1.42% Dry -27.99% Wet 0.3 Wet 15.14% 0.04% Wet1983 Wet 18.19% Wet 13.02% Dry -0.2 Wet 49.42% 5.33% Wet1984 Wet 20.58% Wet 16.88% Dry -0.5 Wet 14.85% -8.25% Dry1985 Dry -8.05% Wet 13.08% Wet 0.1 Wet 30.89% 9.38% Wet1986 Wet 23.89% Wet 11.69% Wet 0.2 Wet 52.53% 19.02% Wet1987 Wet 0.58% Dry -7.97% Wet 0.2 Wet 5.89% -5.48% Dry1988 Wet 3.50% Wet 9.58% Wet 0.1 Wet 30.35% 23.36% Wet1989 Dry -22.59% Wet 13.26% Wet 0.0 Wet 37.46% 6.72% Wet1990 Wet 7.73% Wet 28.82% Dry 0.0 Wet 44.03% 6.88% Wet1991 Dry -3.30% Dry -3.38% Dry -0.2 Dry -4.77% -8.58% Dry1992 Dry -21.93% Dry -14.36% Wet 0.1 Wet 5.94% -9.24% Dry1993 Wet 6.20% Dry -9.05% Dry -0.1 Dry -4.45% 8.03% Wet1994 Wet 22.07% Wet 22.37% Wet 0.6 Wet 18.15% 25.63% Wet1995 Wet 9.33% Dry -37.52% Dry -0.3 Dry -36.49% -12.72% Dry1996 Wet 16.15% Dry -1.03% Dry -0.2 Wet 4.27% 3.46% Wet1997 Wet 6.04% Dry -21.05% Dry -17.82% -5.58% Dry1998 Dry -27.82% Dry -20.03% Dry -34.43% -21.10% Dry1999 Dry -15.95% Dry -35.17% Dry -28.90% -26.67% Dry2000 Wet 8.62% Wet 28.10% Dry -11.31% 8.47% Wet2001 Dry -2.82% Dry -5.19% Dry -13.23% -7.08% Dry2002 Dry -12.23% Wet 24.12% Wet 1.81% 4.57% Wet2003 Wet 4.42% Wet 7.47% Wet 2.37% 4.75% Wet2004 Dry -10.73% Dry -9.90% Dry -13.31% -11.31% Dry2005 Dry -3.99% Wet 18.69% Wet 3.40% 12.30% Wet2006 Dry -0.02% Wet 13.44% Wet 2.94% 12.92% Wet2007 Dry -12.09% Dry -30.22% Dry -20.92% -11.36% Dry2008 Dry -19.04% Dry -51.27% Wet 28.35% 2.75% Wet2009 Wet 17.21% Dry -3.50% Dry -13.31% -3.18% Dry2010 Wet 31.88% Wet 8.98% Wet 3.40% 4.99% Wet2011 Dry -15.60% Wet 5.60% Dry -27.01% -12.46% Dry2012 Dry -26.91% Dry -0.61% Dry -13.43% Dry -52.42% -21.94% Dry2013 Wet 8.10% Wet 19.35% Wet 17.75% Dry -60.68% 1.69% Wet2014 Wet 34.71% Wet 23.76% Wet 16.67% Wet 10.85% 20.47% Wet

920 Azmeri, Asri Syahrial
F ig. 4. Map of drought spatial distribution in a wet year (1994)
921An analysis of drought and its relationship with an agricultural area in the watershed of Krueng Aceh...
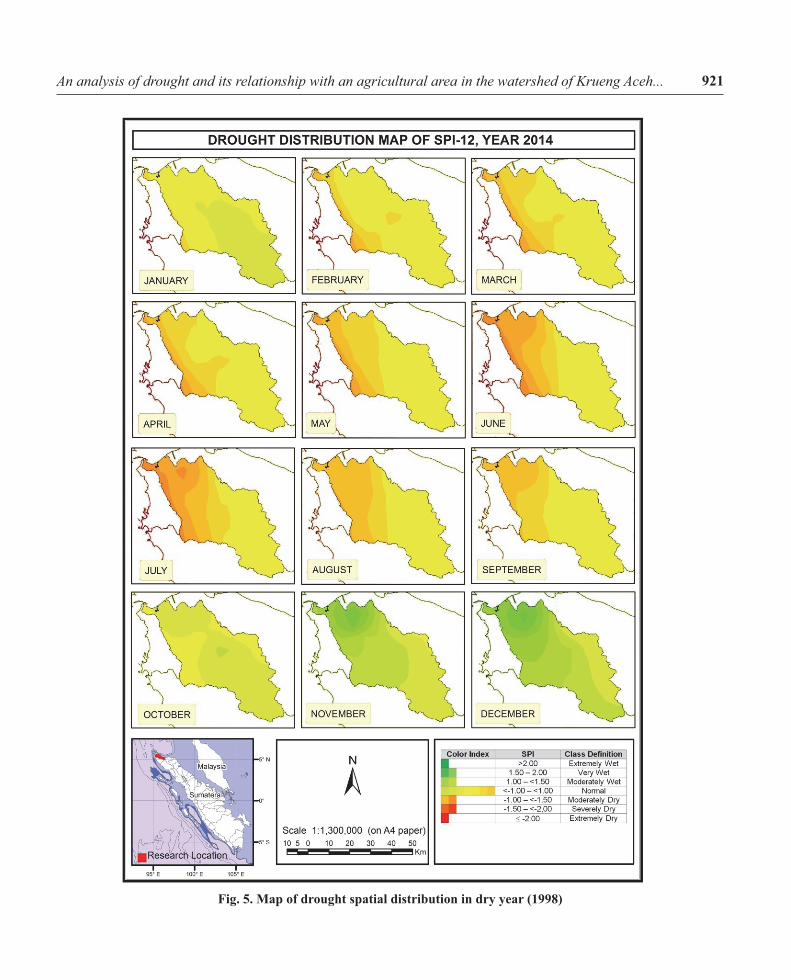
Fi g. 5. Map of drought spatial distribution in dry year (1998)

922 Azmeri, Asri Syahrial
Fig . 6. Map of drought spatial distribution in 2014

923An analysis of drought and its relationship with an agricultural area in the watershed of Krueng Aceh...
nifi cant with R = 30.2%. The Lhoong post shows no signifi -cant relationship between SPI-12 and IOD with R = – 5,1%.
Drought spatial distributionThe monthly drought map is composed of multiple years,
based on the criteria of extreme wet years (1994), a dry year (1998), and the fi nal year (2014). This map is presented based on the results of the calculation of the droughtindex with the Standardized Precipitation Index method that is drawn using the software ArcGIS.
McKee et al. (1993) classify the criteria of drought/wet-ness level based on the level of rain intensity by dividing it in some level of index scale (Standardized Surface Index) to the time scale of certain events, as outlined in Table 2.
The years are determined of extreme, dry and normal years based on the amount of rain in each post’s annual rain-fall. The same data is then compared to the amount of aver-age rainfall, so that the percentage of the rain on the post may be obtained. The results of the annual rainfall analysis of each post are presented in Table 3.
The map of the spread of drought for a drought index of SPI-12 in 1994 in Fig. 4 shows that the dominant wet phe-nomenon (extreme wet) occurs throughout the year, namely that the rainfall in 1994 was very high.
Fig. 5 shows a map of the spread of drought SPI-12 in 1998, which shows that from January to July, rainfall re-mained normal. The rainfall was less from August to De-cember, so that a drought occurred in these months.
A map of the spread of drought for 2014 in Fig. 6 shows
that there is a decline of rainfall from January to September (drought). October showed normal conditions, while rainfall in November and December had already returned to normal, wet conditions.
Crop failure drought vs SOI-6The value of the SPI that describes agricultural drought
is shown on the SPI-6. If it is correlated with the impact of drought in agriculture, it is the same as the number of hect-ares of rice fi elds affected by drought, experiencing the crop failure. The number of data fi elds affected by crop failure drought was issued by the Department of Agriculture, the Directorate for the protection of the food crops, Indonesia .
Based on the data obtained, drought in the Aceh Besar District occurred in late 1994, 2005, 2006, 2009, 2011 and 2012. While the value of the SPI-6 shows a lengthy period of drought from 2011 to 2012 in the Blang Bintang post, in Indrapuri and Lhoong Posts, the value of SPI-6 on the period did not show the drought. This data shows that there is no signifi cant relationship between the value of the SPI-6 and agricultural drought. Only in the Blang Bintang post did the index value of SPI-6 in 2011 and 2012 have a positive relationship with widespread rice affected by a crop failure (Fig. 7).
Conclusions
The conlusions of research conducted in the location of the studies are:
F ig. 7. Relationship graph between monthly SPI-6 value and rice fi eld area that suffering crop failure drought

924 Azmeri, Asri Syahrial
The worst drought value of SPI-1 occurred in Blang Bin-tang post of -4.45 in March 1998 for the data period from 1981 to 2014.
The worst drought value SPI-3 happened in Indrapuri post of -5.12 in November 2008 for data period from 1981 to 2014.
The worst value of SPI-6 appears in November 2008 of -5.13 on Indrapuri post for the data period from 1981 to 2014.
The worst drought value of SPI-12 took place in Novem-ber 2008, with -3.51 in the Indrapuri post for the data period from 1981 to 2014.
According to the data from the entire rainfall posts, it shows that there is no signifi cant relationship between the value of the SPI with the value of the SOI and the IOD. Rain-fall patterns in the location of the study are not infl uenced directly by the SOI or the IOD.
The relationship between the value of SPI-6 and the se-lected rainfall posts does not show a signifi cant relationship with genesis drought, indicated by the number of widespread rice fi elds affected by a crop failure drought.
References
Adidarma, W. K., Triweko, R. W. & Untari, A. (2009). Does the tendency of rainfall in dry season worsen the drought level. Workshop Identifying the Impacts of Climate Changes on Wa-ter Resources in Program: Reinforcing Scientech for Climate Change Adaptation and Mitigation. Ministry of National Re-search and Technology Irrigation Center, Bekasi.
Adidarma, W. K., Marwati, L., Levina & Subrata, O. (2011a). Drought monitoring model as disaster management framework in providing spatial and temporal information. Colloquium Re-search Results and Water Resources Development, Bandung.
Adidarma, W. K., Marwati, L., Subrata, O. & Levina (2011b). Drought mitigation – monitoring and mapping. Water Resourc-es Research and Development Agency, Bandung.
Adidarma, W. K., Subrata, O. & Roseline, L. H. (2013). Predict-ing meteorological drought by using ws pemali comal statistical approach. Colloquium Research Results and Water Resources Development, Bandung.
Dahlman, L. (2009). Climate variability: Southern Oscillation In-dex.
Dai, A. (2013). Increasing drought under global warming in obser-vations and models. Nature Climate Change, 3(1), 52.
Gawith, D., Kingston, D. G., & McMillan, H. (2012). The ef-fects of climate change on runoff in the Lindis and Matukituki catchments, Otago, New Zealand. Journal of Hydrology (New Zealand), 121-135 .
McKee, T. B., Doesken, N. J., & Kleist, J. (1993, January). The relationship of drought frequency and duration to time scales. In Proceedings of the 8th Conference on Applied Climatology (Vol. 17, No. 22, pp. 179-183). Boston, MA: American Meteo-rological Society.
Mioduszewski, W. (2009). Water for agriculture and natural envi-ronment. Journal of Water and Land Development, 13, 3-16.
Mladenova, B., & Varlev, I. (2007). Impact of extreme climate years on relative ‘yield-evapotranspiration’ relationships. Jour-nal of Water and Land Development, 11, 71-77 .
Ojeda-Bustamante, W., Ontiveros-Capurata, R. E., Flores-Velázquez, J., & Iñiguez-Covarrubias, M. (2017). Changes in water demands under adaptation actions to climate change in an irrigation district. Journal of Water and Climate Change, 8(2), 191-202.
Oldeman, L. R., & Las, I. (1980). The agroclimatic maps of Kali-mantan, Maluku, Irian Jaya and Bali, West and East Nusa Teng-gara. Contributions-Central Research Institute for Agriculture (Indonesia), (60).
Pratama, A. (2014). The analysis of drought in watershed of Ngro-wo by using theory of run method. Master thesis, Brawijaya University, Malang.
Rotich, S. C., & Mulungu, D. M. (2017). Adaptation to climate change impacts on crop water requirements in Kikafu catch-ment, Tanzania. Journal of Water and Climate Change, 8(2), 274-292.
Saji, N. H., Goswami, B. N., Vinayachandran, P. N., & Yamaga-ta, T. (1999). A dipole mode in the tropical Indian Ocean. Na-ture, 401(6751), 360 .
Woods, R., Hendrikx, J., Henderson, R., & Tait, A. (2006). Esti-mating mean fl ow of New Zealand rivers. Journal of Hydrology (New Zealand), 95-109.
Guidelines of the Construction and Civil Building No.Pd T-02-2004-A (2004). The Calculation of Drought Index by Using Run Theory. Minister of Regional Settlement and Infrastruc-ture, No.360/KPTS/M/2004.
Received: October 27, 2017; Accepted: January 5, 2018; Published: November 2, 2018