an analysis of energy consumption in the campus building’s
TRANSCRIPT
Journal of the Civil Engineering Forum Vol. 4 No. 1 (January 2018)
67
An Analysis of Energy Consumption in the Campus Building’s Operation
(Case Study: The Building of Faculty of Engineering and Department of Civil
and Environmental Engineering, Universitas Gadjah Mada)
Syarifudin Politeknik Negeri Nunukan, Nunukan, INDONESIA
Ashar Saputra Department of Civil and Environmental Engineering, Universitas Gadjah Mada, Yogyakarta, INDONESIA
Suprapto Siswosukarto Department of Civil and Environmental Engineering, Universitas Gadjah Mada, Yogyakarta, INDONESIA
ABSTRACT
Energy Consumption Intensity (IKE) is an indicator that is used to determine the amount of energy used per area by an air-
conditioned building within a month or a year as a reference to determine how much energy conservation can be done in the
building. To determine the energy consumption of buildings and to determine the savings opportunities, there should be an
effort to review the energy consumption through energy audits. In this research, energy consumption analysis was conducted at
the Main Office building of the Faculty of Engineering (KPFT) and Department of Civil Engineering and Environmental
(CEED) of Universitas Gadjah Mada Yogyakarta. The analysis was conducted on the main variables of energy efficiency,
namely: measurement of temperature and relative humidity, calculation of Overall Thermal Transfer Value (OTTV) and Roof
Thermal Transfer Value (RTTV), calculation of Energy Consumption Intensity (IKE) in air-conditioned and non-air-
conditioned rooms as well as an analysis of opportunities to increase the efficiency of energy consumption in the buildings.
The results showed that the temperature and the relative humidity of the KPFT building = 28.4℃ and 62%, while CEED
Building = 28.4℃ dan 65%. Calculation of average OTTV of the KPFT building = 17.61 W/m2 and CEED building = 43.05
W/m2. Average IKE of the KPFT building in 2015 was 3.25 kWh/m2/month and in 2016 was 3.45 kWh/m2/month, while the
average IKE of CEED building in 2015 was 1.5 kWh/m2/month and in 2016 was 0.79 kWh/m2/month. Based on the
calculation of IKE in both buildings, they are still considered in the category of efficient. However, based on the measurement
of temperature and relative humidity, it shows that in both buildings air conditioning is still necessary to achieve the level of
thermal comfort, therefore an increase of efficiency in the load is needed to avoid wastage.
Keywords: Energy Audit, IKE, Conventional Building, Thermal Comfort.
1 INTRODUCTION
Nowadays it cannot be denied that energy has become
a basic need that has an important role as a stimulus of
almost all economic and social activities in the
society. As a means of infrastructure supporting those
activities, buildings also have a high level of need for
energy for their operational activities.
Energy consumption in buildings should have been
planned and agreed upon from the initial planning
between planners, owners and contractors/
implementers so that material selection, determination
of design as well as electrical equipment used such as
lights, air conditioners, and electrical appliances are
more energy efficient (Ministry of Energy and
Mineral Resources, 2012). For buildings that have
been built conventionally, there should be an effort to
review energy consumption through energy audits to
determine the profile of energy usage and energy
savings opportunities so that it can increase the
efficiency of energy usage. This paper describes the
use of energy consumption as one of the dominant
aspects that determines the cost efficiency in building
operation.
Universitas Gadjah Mada (UGM) of Yogyakarta as
one of the best universities in Indonesia should have
applied the savings or efficiency in the use of energy
in the operational activities of the buildings.
Considering that there has been no calculation
analysis of energy consumption in the KPFT, used as
administrative building of engineering faculty, and in
CEED’s building, used as a lecture building, the
energy use in both buildings cannot be categorized as
Vol. 4 No. 1 (January 2018) Journal of the Civil Engineering Forum
68
efficient, yet. Therefore, energy audit activities are
necessary to be carried out.
Purposes of the researchs are to figure out the value of
energy consumption intensity and the existing energy
usage profile in the operational activities of KPFT
building and CEED building of UGM Yogyakarta in
the last 2 years, 2015 and 2016, to figure out the
application of several major variables of energy
efficiency namely; temperature setting and relative
humidity of air, value of OTTV and RTTV at KPFT
building and CEED building of UGM Yogyakarta,
and to determine alternative methods of energy
conservation to make energy savings as well as cost
savings based on real conditions.
2 LITERATURE REVIEW
Marzuki and Rusman (2012) conducted a study of
Energy Audit on Building Director of PT. Perkebunan
Nusantara XIII (Persero). Analysis of energy
consumption was carried out through a comprehensive
energy audit on a building by calculating the Energy
Consumption Intensity (IKE) Gross, as well as Net
IKE. The results show that the composition of the use
of energy is divided into three groups, namely;
lighting expenses 4.54%, air conditioner (AC) 57.36%
and other office equipment 38.10%. The potential
savings from the difference energy use of
conventional AC replacement with energy-efficient
AC inverters for all office buildings is significant. In
addition, Replacement of TL lamps with LED lamps
that have a much lower heat can reduce the workload
of AC to make it more energy efficient in lighting
systems. Yuliatna (2015) conducted a study on the
comparison of energy consumption in buildings with
the concept of green building and conventional
buildings. This research was carried out by calculating
the value of OTTV and RTTV and the value of
Energy Consumption Intensity (IKE). Result of
analysis of several research variables; namely
temperature, relative humidity, OTTV, RTTV, (IKE)
show that buildings with green building concept have
better energy audit results compared to conventional
buildings.
3 RESEARCH METHOD
Based on Inpres No.13 year 2011 on energy and water
conservation, it is necessary to do energy management
so that energy usage, especially electric energy
becomes more efficient (Syarifudin, 2017). The
purpose of the energy audit is to study the profile of
energy use and energy saving opportunities so as to
improve the efficiency of energy use.
The energy audit is a thorough study of the calculation
of Energy Consumption Intensity (IKE), either in the
form of IKE Gross, or IKE Netto. Based on the energy
conservation standards used by the Ministry of
National Education of the Republic of Indonesia and
ASEAN - USAID, the intensity of energy
consumption (IKE) in buildings is classified into two
parts: air-conditioned and non-AC rooms (ASEAN-
USAID, 1992).
Indonesian National Standard (SNI) 6389-2011
provides guidance on design criteria, energy
conservation, and recommendations for the optimal
building envelope as well as SNI 6197-2011 (Badan
Standarisasi Nasional, 2011) rules procedure of
energy audit for building so that energy use can be
efficient without compromising comfort and work
productivity (Badan Standarisasi Nasional, 2011). In
calculating the value of Overall Thermal Transfer
Value (OTTV) there are several variables that must be
studied, namely; the absorbance value of solar
radiation, wall thermal transmittance (W/m2oC),
window to wall ratio or the ratio of the width of the
window to the entire outer wall in the specified
orientation, the difference in the equivalent
temperature between the outer and inner side, solar
factor or solar radiation factor in orientation
determined (W/m2), and shading coefficient or shade
coefficient of the fenestration /aperture system. In
addition to OTTV, RTTV (roof thermal transfer
value) is also calculated to define the thermal transfer
for roof area. RTTV is calculated by considering
several factors, as follows; a transparent roofing area
(W/moC), the difference between the outer and inner
side (oC), the width of the roof light hole (m2), the
roof hole transmittance (W/moC), the temperature
difference between the outer and inner planning
conditions (oC), and shading coefficient or coefficient
of roof hole lightning (Krishan, 2001).
Considering that there has been no audit on energy
consumption in Faculty of Engineering (KPFT)
building and Civil Engineering and Environment
Department (CEED) building of Universitas Gadjah
Mada University, the efficiency use of energy
consumption in both buildings cannot yet be
determined, therefore an energy audit is necessary.
4 RESULTS AND DISCUSSIONS
Measurements of temperature and relative
humidity
Measurements of temperature and relative humidity
were conducted directly at the KPFT building and the
CEED building. Measurement of these two variables
was performed using a Thermohygrometer by taking
Journal of the Civil Engineering Forum Vol. 4 No. 1 (January 2018)
69
some of the main rooms on each floor as samples. In
each room, the measurement took approximately 5 to
10 minutes while the air was not being conditioned
(AC turned was off). Measurements were conducted
on holidays (Saturdays and Sundays) 3 times with a
three-week rest at each measurement in each of the
buildings between November 2016 and January 2017.
Measurements were carried out in the morning at
07.00-09.00 am noon at 11.00-13:00 pm and the
afternoon at 15.00-17:00 pm.
By the time of the measurement, it was figured out
that the sun inclining on the south side of the building,
thus affecting the measurement results conducted on
the rooms located on the south side of the building.
Result recapitulation of temperature and relative
humidity measurement in KPFT and CEED buildings
is presented in Table 1.
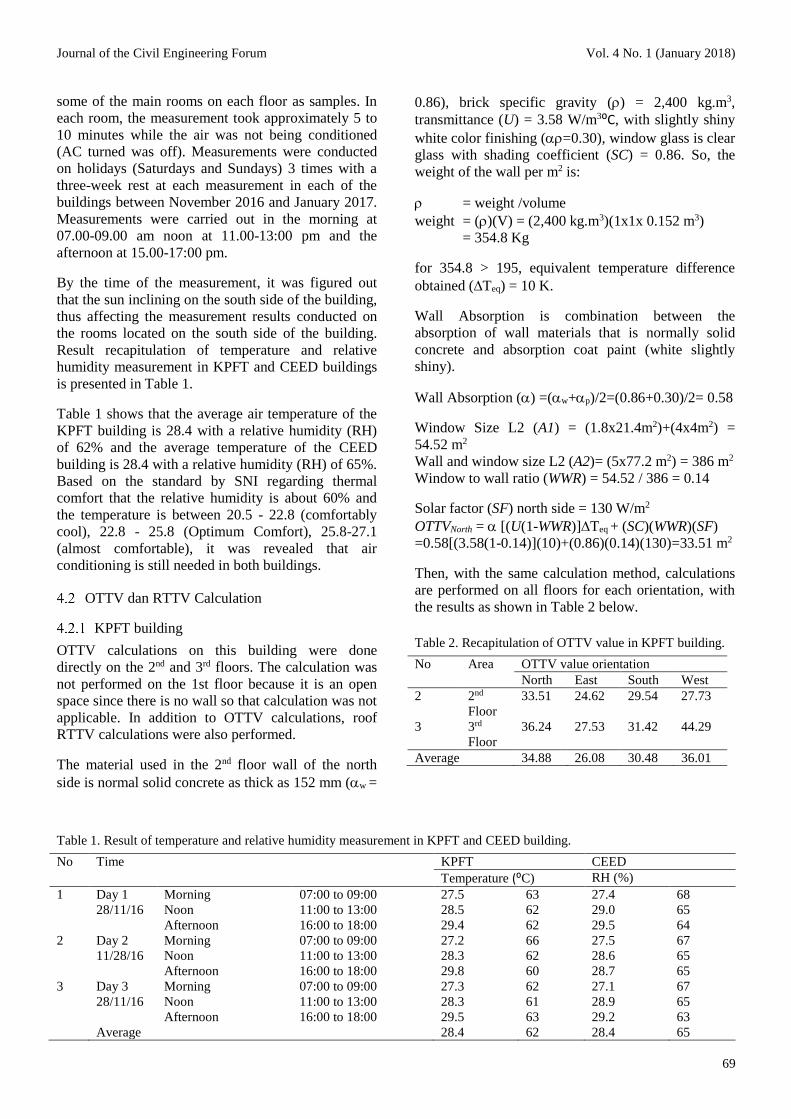
Table 1 shows that the average air temperature of the
KPFT building is 28.4 with a relative humidity (RH)
of 62% and the average temperature of the CEED
building is 28.4 with a relative humidity (RH) of 65%.
Based on the standard by SNI regarding thermal
comfort that the relative humidity is about 60% and
the temperature is between 20.5 - 22.8 (comfortably
cool), 22.8 - 25.8 (Optimum Comfort), 25.8-27.1
(almost comfortable), it was revealed that air
conditioning is still needed in both buildings.
OTTV dan RTTV Calculation
KPFT building
OTTV calculations on this building were done
directly on the 2nd and 3rd floors. The calculation was
not performed on the 1st floor because it is an open
space since there is no wall so that calculation was not
applicable. In addition to OTTV calculations, roof
RTTV calculations were also performed.
The material used in the 2nd floor wall of the north
side is normal solid concrete as thick as 152 mm (w =
0.86), brick specific gravity () = 2,400 kg.m3,
transmittance (U) = 3.58 W/m3⁰C, with slightly shiny
white color finishing (=0.30), window glass is clear
glass with shading coefficient (SC) = 0.86. So, the
weight of the wall per m2 is:
= weight /volume
weight = ()(V) = (2,400 kg.m3)(1x1x 0.152 m3)
= 354.8 Kg
for 354.8 > 195, equivalent temperature difference
obtained (Teq) = 10 K.
Wall Absorption is combination between the
absorption of wall materials that is normally solid
concrete and absorption coat paint (white slightly
shiny).
Wall Absorption () =(w+p)/2=(0.86+0.30)/2= 0.58
Window Size L2 (A1) = (1.8x21.4m2)+(4x4m2) =
54.52 m2
Wall and window size L2 (A2)= (5x77.2 m2) = 386 m2
Window to wall ratio (WWR) = 54.52 / 386 = 0.14
Solar factor (SF) north side = 130 W/m2
OTTVNorth = [(U(1-WWR)]Teq + (SC)(WWR)(SF)
=0.58[(3.58(1-0.14)](10)+(0.86)(0.14)(130)=33.51 m2
Then, with the same calculation method, calculations
are performed on all floors for each orientation, with
the results as shown in Table 2 below.
Table 2. Recapitulation of OTTV value in KPFT building.
No Area OTTV value orientation
North East South West
2 2nd
Floor
33.51 24.62 29.54 27.73
3 3rd
Floor
36.24 27.53 31.42 44.29
Average 34.88 26.08 30.48 36.01
Table 1. Result of temperature and relative humidity measurement in KPFT and CEED building.
No Time KPFT CEED
Temperature (⁰C) RH (%)
1 Day 1
28/11/16
Morning 07:00 to 09:00 27.5 63 27.4 68
Noon 11:00 to 13:00 28.5 62 29.0 65
Afternoon 16:00 to 18:00 29.4 62 29.5 64
2 Day 2
11/28/16
Morning 07:00 to 09:00 27.2 66 27.5 67
Noon 11:00 to 13:00 28.3 62 28.6 65
Afternoon 16:00 to 18:00 29.8 60 28.7 65
3 Day 3
28/11/16
Morning 07:00 to 09:00 27.3 62 27.1 67
Noon 11:00 to 13:00 28.3 61 28.9 65
Afternoon 16:00 to 18:00 29.5 63 29.2 63
Average 28.4 62 28.4 65

Vol. 4 No. 1 (January 2018) Journal of the Civil Engineering Forum
70
Based on the conducted OTTV calculation and on the
standard set by SNI with maximum OTTV value of 45
W/m2, it was revealed that the OTTV value of the
whole orientation of the wall of the KPFT building is
still below the specified threshold.
Then, RTTV calculation in the KPFT building by
using the following method; roof material is clay tile
with transmittance value (U) = 1.7 W/m2 ⁰C and =
0.8. Roof area = 1,982.4 m2. Shading coefficient (SC)
and solar factor (SF) value are not needed because the
roof of the CEED building does not have any skylight.
Weight roof per m2 is determined by calculating the
total weight of all components per m2. From the
calculation result, it is assumed that weight per m2 =
200 kg, so that Teq = 20 K or ⁰C.
RTTV = [(Ar) (Ur)(∆Teq) + (As) (Us)(∆T) + (As)
(SC)(SF)]/(Ar + Ar)
= [(1982.4)(1.7)(20)+(0)+(0)]/(1982.4+0)= 34 W/m2
OTTVtotal= [(Anorth x OTTVnorth) + (Aeast x OTTVeast) +
(Asouth x OTTVsouth) + (Awestx OTTVwest) + (Aroof x
OTTVroof)] / (Anorth+ Aeast+ Asouth+ Awest+ Aroof)
= [(782 x 34.88) + (412 x 26.08) + (782 x 30.84)
+(412 x 36.01) + (1982.4 x 34)] / (782+ 412+ 782+
412 + 1982.4) = 17.61 W/m2
Based on the conducted calculation, results of OTTV
and RTTV calculations on KPFT building on each
wall orientation are; the north wall of 34.88 W/m2, the
east wall of 26.08 W/m2, the south wall of 30.84
W/m2 and the west wall of 36.01 W/m2 and RTTV
roof at 34 W/m2.
Figure 1. Comparison OTTV value with SNI on KPFT
building.
The comparison on Figure 1 shows that OTTV value
of all orientation of the entire wall of KPFT building
is still below the threshold of the SNI, which
amounted to 45 W/m2.
CEED building
Similar to the calculation method performed on the
KPFT building, OTTV calculations on CEED
building are performed floor per floor in each
direction of wall orientation. Recapitulation of OTTV
calculation on 1st - 3rd floor for the four sides of the
building wall of CEED building are presented in
Table 3 below.
Table 3. Recapitulation of OTTV value in CEED building.
No Area OTTV value orientation
North East South West
1 1st Floor 49.94 36.31 37.89 70.33
2 2nd Floor 52.71 37.22 37.75 95.06
3 3rd Floor 50.68 37.39 37.85 69.86
Average 51.11 36.97 37.83 78.42
Based on the calculations that have been done, the
results of OTTV and RTTV calculations on CEED
buildings on each wall orientation are; the north wall
= 51.11 W/m2, the east wall = 36.97 W/m2, the south
wall = 37.83 W/m2 and the west wall = 78.42 W/m2.
Based on Figure 2, OTTV values of east and south
walls remain below the threshold while for the north
and west walls’ OTTV value are above the standard
threshold SNI, which amounted to 45 W/m2.
Figure 2. Comparison OTTV value with SNI on CEED
building.
IKE Calculation
There are two variables that can be calculated on IKE
building electricity, namely: IKE Gross which is total
area of the air-conditioned room (with AC) plus total
area of the non-air-conditioned room (non-AC), and
IKE nett which is detailed IKE with clear separation
per unit of total area between air-conditioned and non-
air-conditioned rooms.
0
10
20
30
40
50
North East South West Roof
OT
TV
(W
/m2)
Direction
KPFT's OTTV OTTV Standard
0
10
20
30
40
50
60
70
80
North East South West Roof
OT
TV
(w
/m2)
Direction
CEED's OTTV OTTV Standard
Journal of the Civil Engineering Forum Vol. 4 No. 1 (January 2018)
71
Table 4. IKE based on electricity account bill of CEED building UGM 2015 and 2016.
Month 2015 2016
Electrical
Consumption
(kWh)
Electrical
Cost (Rp)
IKE
(kWh/m2/month)
Electrical
Consumption
(kWh)
Electrical Cost
(Rp)
Building IKE
(kWh/m2/month)
January 16,600 14,641,200.00 3.01 19,000 18,098,640.00 3.44
February 16,160 14,253,120.00 2.93 19,320 18,403,459.20 3.50
March 16,080 14,182,560.00 2.91 19,200 18,289,152.00 3.48
April 19,680 17,357,760.00 3.57 20,120 19,165,507.20 3.65
May 18,720 16,511,040.00 3.39 23,280 22,175,596.80 4.22
June 15,480 13,653,360.00 2.80 18,680 17,793,820.80 3.38
July 14,960 13,194,720.00 2.71 86,80 8,268,220.80 1.57
August 16,720 14,747,040.00 3.03 21,240 20,232,374.40 3.85
September 19,560 17,251,920.00 3.54 19,840 18,889,790.40 3.59
October 18,160 16,017,120.00 3.29 18,400 17,527,104.00 3.33
November 22,320 19,686,240.00 4.04 23,240 20,479,680.00 4.21
December 20,880 18,416,160.00 3.78 17,680 15,593,760.00 3.20
Average 17,943 15,826,020.00 3.25 19,057 16,807,980.00 3.45
Table 5. IKE based on electricity account bill of CEED building UGM 2015 and 2016.
Month 2015 2016
Electrical
Consumption
(kWh)
Electrical
Cost (Rp)
IKE
(kWh/m2/month)
Electrical
Consumption
(kWh)
Electrical Cost
(Rp)
Building IKE
(kWh/m2/month)
January 3680 3,245,760.00 0.75 3880 3,422,160.00 0.67
February 3320 2,928,240.00 0.72 2360 2,081,520.00 0.57
March 3160 2,787,120.00 0.77 4680 4,127,760.00 0.98
April 4120 3,633,840.00 0.93 3840 3,386,880.00 0.76
May 2120 1,869,840.00 0.57 3960 3,492,720.00 0.98
June 4120 3,633,840.00 0.95 1960 1,728,720.00 0.40
July 2520 2,222,640.00 0.57 3280 2,892,960.00 1.64
August 2640 2,328,480.00 0.59 3680 3,245,760.00 0.01
September 2800 2,469,600.00 0.79 3680 3,245,760.00 0.99
October 3520 3,104,640.00 1.02 3160 2,787,120.00 0.86
November 3720 3,281,040.00 0.99 3440 3,034,080.00 0.93
December 3360 2,963,520.00 0.82 3280 2,892,960.00 0.68
Average 3257 2,872,380.00 1.50 3433 3,028,200.00 0.79
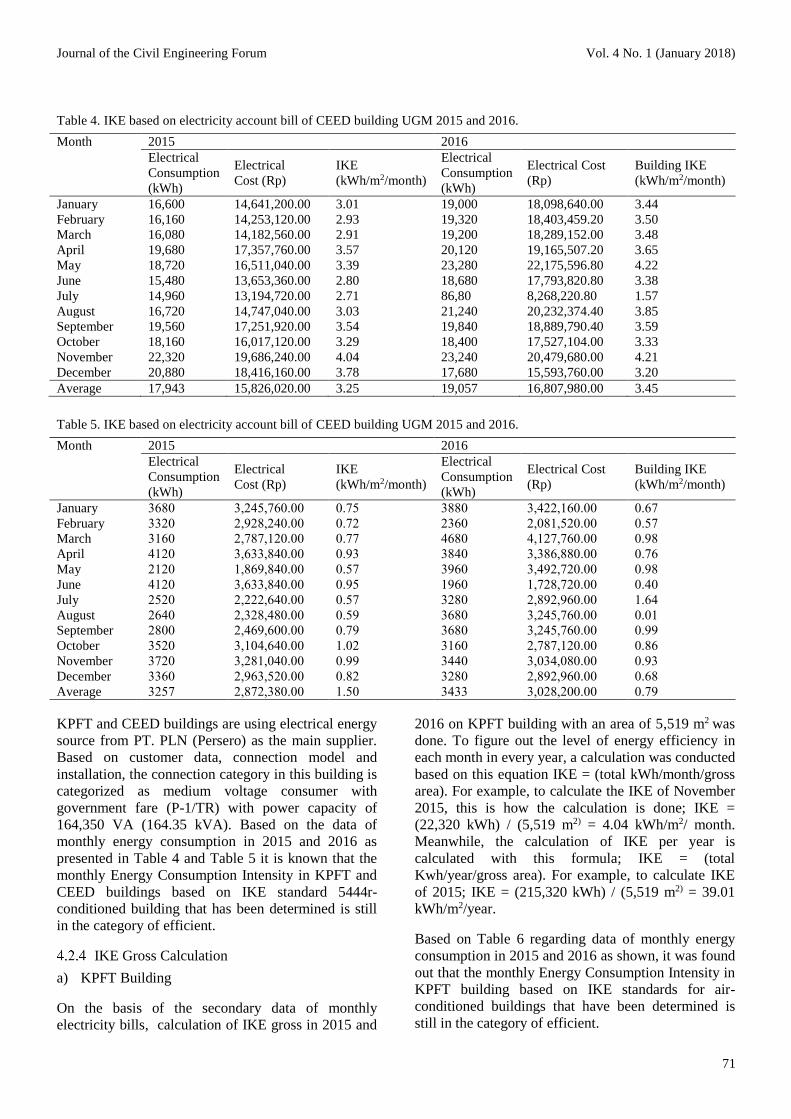
KPFT and CEED buildings are using electrical energy
source from PT. PLN (Persero) as the main supplier.
Based on customer data, connection model and
installation, the connection category in this building is
categorized as medium voltage consumer with
government fare (P-1/TR) with power capacity of
164,350 VA (164.35 kVA). Based on the data of
monthly energy consumption in 2015 and 2016 as
presented in Table 4 and Table 5 it is known that the
monthly Energy Consumption Intensity in KPFT and
CEED buildings based on IKE standard 5444r-
conditioned building that has been determined is still
in the category of efficient.
IKE Gross Calculation
a) KPFT Building
On the basis of the secondary data of monthly
electricity bills, calculation of IKE gross in 2015 and
2016 on KPFT building with an area of 5,519 m2 was
done. To figure out the level of energy efficiency in
each month in every year, a calculation was conducted
based on this equation IKE = (total kWh/month/gross
area). For example, to calculate the IKE of November
2015, this is how the calculation is done; IKE =
(22,320 kWh) / (5,519 m2) = 4.04 kWh/m2/ month.
Meanwhile, the calculation of IKE per year is
calculated with this formula; IKE = (total
Kwh/year/gross area). For example, to calculate IKE
of 2015; IKE = (215,320 kWh) / (5,519 m2) = 39.01
kWh/m2/year.
Based on Table 6 regarding data of monthly energy
consumption in 2015 and 2016 as shown, it was found
out that the monthly Energy Consumption Intensity in
KPFT building based on IKE standards for air-
conditioned buildings that have been determined is
still in the category of efficient.
Vol. 4 No. 1 (January 2018) Journal of the Civil Engineering Forum
72
Table 6. Category of energy consumption KPFT building on 2015-2016
Month 2015 2016 Information
IKE (kWh/m2/month) IKE (kWh/m2/year) IKE (kWh/m2/month) IKE (kWh/m2/year)
January 3.01 36.09 3.44 41.31 Efficient
February 2.93 35.14 3.50 42.01 Efficient
March 2.91 34.96 3.48 41.75 Efficient
April 3.57 42.79 3.65 43.75 Efficient
May 3.39 40.70 4.22 50.62 Efficient
June 2.80 33.66 3.38 40.62 Efficient
July 2.71 32.53 1.57 18.87 Efficient
August 3.03 36.35 3.85 46.18 Efficient
September 3.54 42.53 3.59 43.14 Efficient
October 3.29 39.49 3.33 40.01 Efficient
November 4.04 48.53 4.21 50.53 Efficient
December 3.78 45.40 3.20 38.44 Efficient
Table 7. Category of energy consumption CEED Building on 2015-2016
Month 2015 2016 Information
IKE (kWh/m2/month) IKE (kWh/m2/year) IKE (kWh/m2/month) IKE (kWh/m2/year)
January 0.75 9.00 0.67 8.09 Efficient
February 0.72 8.61 0.57 6.78 Efficient
March 0.77 9.26 0.98 11.74 Efficient
April 0.93 11.22 0.76 9,13 Efficient
May 0.57 6.78 0.98 11.74 Efficient
June 0.95 11.35 0.40 4.83 Efficient
July 0.57 6.78 1.64 19.70 Efficient
August 0.59 7.04 0.01 0.13 Efficient
September 0.79 9.52 0.99 11.87 Efficient
October 1.02 12.26 0.86 10.30 Efficient
November 0.99 11.87 0.93 11.22 Efficient
December 0.82 9.78 0.68 8.22 Efficient
b) CEED Building
The area of CEED builing is 4,600 m2. As an example,
calculation of IKE in april 2015 is IKE = (4,120
kWh)/ (4,600 m2) = 0.90 kWh/m2/month. The
calculation of IKE per year is calculated by formula;
IKE = (total kwh/year/gross area). For example, to
calculate IKE of 2015 is as follows, IKE = (39,080
kWh) / (4,600 m2) = 8.50 kWh/m2/year.
Based on Table 7, regarding data of monthly energy
consumption in 2015 and 2016 as shown, it was found
out that the monthly Energy Consumption Intensity in
KPFT building based on IKE standards for air-
conditioned buildings that have been determined is
still in the category of efficient.
Calculation of IKE in AC and Non AC room
a) KPFT Building
The proportion of areas of air-conditioned and non-
air-conditioned rooms in KPFT building for each floor
can be seen in Table 8.
Table 8. Air-conditioned and unconditioned room area in
KPFT building
No Floor Area
Total
(m2)
Conditioned
Area (m2)
Unconditioned
Area (m2)
1 1st Floor 2,093 0 2,093
2 2nd Floor 1,461 808 653
3 3rd Floor 1,965 1,322 643
Total 5,519 2,130 3,389
This calculation is conducted to get the net IKE value
in the KPFT building. To calculate the IKE in the
rooms, it is necessary to firstly observe and collect the
data of electronic device types, power capacity (watt),
and the amount contained in the room.
Assumed that the operational activity (total working
hours) is for 8 hours (07:30-15:30), the load
requirement for 5 days in a week (22 effective days in
one month) equal to 70%. Daily energy consumption
for KPFT 3rd floor (Light + AC + other loads) =
32.09 kW x 8 hours x 0.70 = 179.71 kWh/day (SEE
Table 9).

Journal of the Civil Engineering Forum Vol. 4 No. 1 (January 2018)
73
Consumption of electric energy per month = 179.71
kWh/day x 22 days = 3,953.49 kWh/month.
The are of air-conditioned room on the 3rd floor is
1,322 m2. IKE of AC room in 3rd floor = 3,953.49
kWh/month/ 1,322 m2 = 2.99 kWh/m2/month.
The first floor (typical) of the KPFT building is an
open hall without walls, so the calculation of the
electrical load is only done on a load of light and other
loads without HVAC load with the following details.
Lighting load = 2628 watts/day or 2,628 kW/day
HVAC load = 0
Other loads = 1000 watts/day or 1.00 kW/day
Total electrical load=(Lighting+ HVAC+other loads)
= (2,628+0+1,000)=3,628 Watts/day = 3.628 kW/day.
Calculation of energy consumption on the 1st floor is
assumed starting when the lights are turned on until
the end of the activities in the hall which is at 17.00-
22.00 pm every day. So, daily load on the 1st floor
can be calculated: 3,628 x 5 = 18,140 watts/day or
18.14 kW/day and per month 18,140 x 30 = 544,200
Watt/month or 544.20 kW/month. The are on the first
floor is 2,093 m2. Therefore, the consumption of non-
air-conditioned room on the 1st floor is 544.20
kW/month/ 2,093 m2 = 0.26 kWh/m2/month.
b) CEED Building
The proportion of air-conditioned and non-air-
conditioned rooms in Civil Engineering and
Environmental Department buildings for each floor
can be seen in Table 10 and Calculations of IKE of
air-conditioned and non-AC rooms are presented in
Table 11 and Table 12.
Based on the calculation of Energy Consumption
Intensity (IKE) in the main CEED building presented
in Table 11, average IKE per unit of area of the air-
conditioned room is 4.40 kWh/m2/month and from
Table 12 it is figured out that the average IKE per unit
of area of non-air-conditioned room is 1.40
kWh/m2/month. Based on the established standard, it
is found out that air-conditioned room is categorized
as very efficient, while non-air-conditioned room is
categorized as efficient
Table 10. Air-conditioned and unconditioned room area in
CEED building
No Floor Area
Total
(m2)
Conditioned
Area (m2)
Unconditioned
Area (m2)
1 1st Floor 1,302.48 847.80 454.68
2 2nd
Floor
1,211.76 963.36 248.40
3 3rd Floor 1,097.64 879.12 218.52
Total 3,611.88 2,690.28 921.60
Table 9. IKE in Air Conditioned Rooms KPFT building.
Floor Total
Area
Conditioned
Area
Energy Consumption (kW/hr) Load
Total
(kW)
Load
(kW/day)
Load
(kW/mth)
IKE
(kWh/m2/mth) Lamp HVAC Other
2nd 1,461 808 8.60 5.96 3.63 18.19 101.86 1,120.51 1.39
3rd 1,965 1,322 6.21 9.75 16.14 32.10 179.71 3,953.49 2.99
Total 3,426 2,130 14.81 15.71 19.77 50.29 281.57 5,074.00 2.19
Table 11. IKE in Air Conditioned Rooms CEED building.
Floor Total
Area
Conditioned
Area
Energy Consumption
(kW/hr)
Load Total
(kW)
Load/day
(kW/day)
Load
(kW/mth)
IKE
(kwh/m2/mth)
Lamp HVAC Other
1st 1,302.48 847.80 4,824 17,240 6,105 28,169 158.98 3,497.53 4.13
2nd 1,211.76 963.36 8,460 21,850 6,485 36,795 206.05 4,533.14 4.71
3rd 1,097.64 879.12 6,300 21,910 2,980 31,190 174.66 3,842.61 4.37
Total 3,611.88 2,690.28 19,584 61,000 15,570 96,154 539.69 11,873.28 4.40
Table 12. IKE in Air Conditioned Rooms KPFT building.
Floor Total
Area
Unconditioned
Area
Energy Consumption (kW/hr) Load
Total
(kW)
Load/
day
(kW/day)
Load/mth
(kWh/mth)
IKE
(kWh/m2/mth) Lamp Lamp Lamp
2nd 1,302.48 454.68 0.609 2.391 3.00 16.80 369.60 0.813 1302.48
3rd 1,211.76 248.40 0.587 0.400 0.99 5.54 121.97 0.491 1211.76
Total 1,097.64 218.52 4.929 0.200 5.13 28.72 631.89 2.892 1097.64
.
Vol. 4 No. 1 (January 2018) Journal of the Civil Engineering Forum
74
Recommendation on Opportunities for Energy
Efficiency Increase
The need for air conditioning to create comfort in the
rooms of both buildings has resulted in energy
consumption, in this case, the electrical load, for air
conditioner becomes greater than the electrical energy
consumption of other electrical equipment. High
electrical loads on air conditioner equipment results to
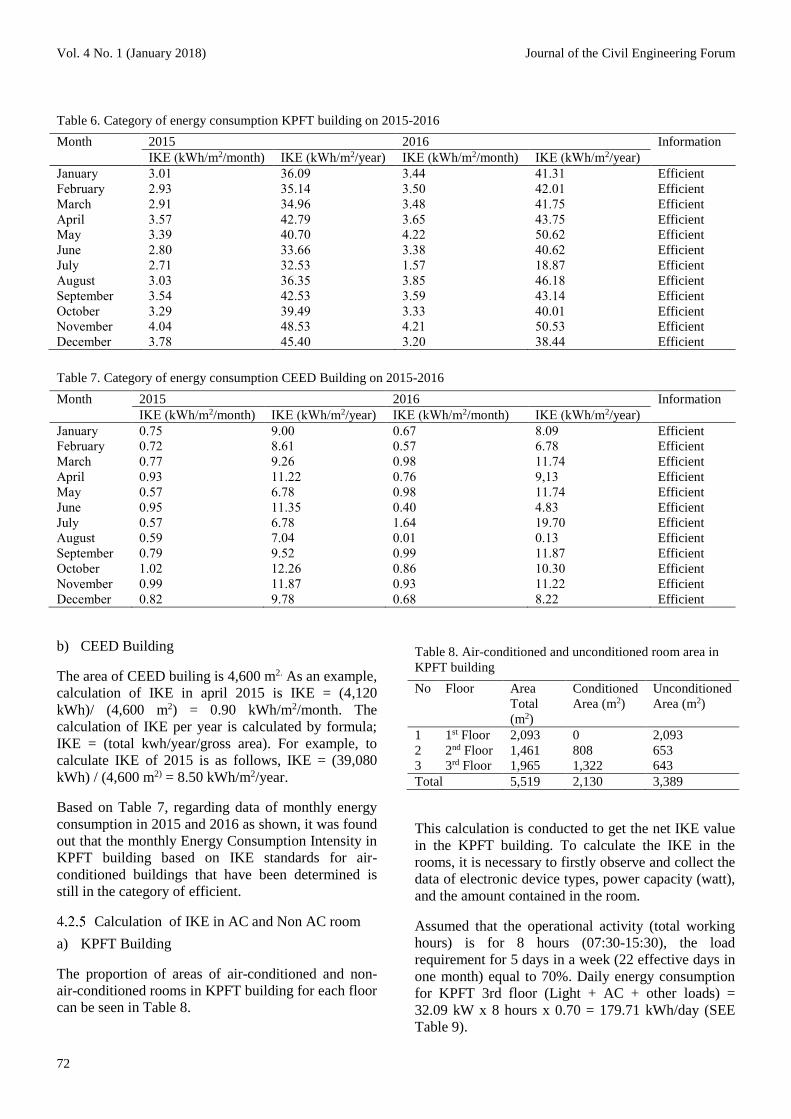
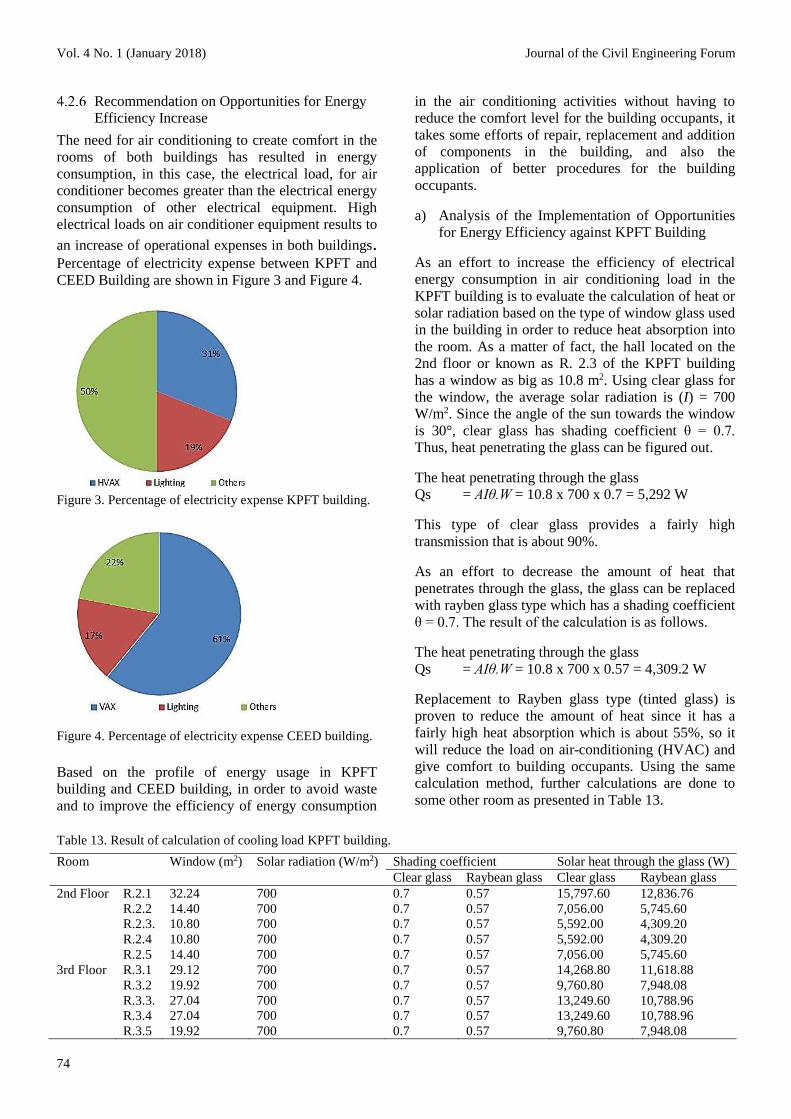
an increase of operational expenses in both buildings. Percentage of electricity expense between KPFT and
CEED Building are shown in Figure 3 and Figure 4.
Figure 3. Percentage of electricity expense KPFT building.
Figure 4. Percentage of electricity expense CEED building.
Based on the profile of energy usage in KPFT
building and CEED building, in order to avoid waste
and to improve the efficiency of energy consumption
in the air conditioning activities without having to
reduce the comfort level for the building occupants, it
takes some efforts of repair, replacement and addition
of components in the building, and also the
application of better procedures for the building
occupants.
a) Analysis of the Implementation of Opportunities
for Energy Efficiency against KPFT Building
As an effort to increase the efficiency of electrical
energy consumption in air conditioning load in the
KPFT building is to evaluate the calculation of heat or
solar radiation based on the type of window glass used
in the building in order to reduce heat absorption into
the room. As a matter of fact, the hall located on the
2nd floor or known as R. 2.3 of the KPFT building
has a window as big as 10.8 m2. Using clear glass for
the window, the average solar radiation is (I) = 700
W/m2. Since the angle of the sun towards the window
is 30°, clear glass has shading coefficient θ = 0.7.
Thus, heat penetrating the glass can be figured out.
The heat penetrating through the glass
Qs = AIθ.W = 10.8 x 700 x 0.7 = 5,292 W
This type of clear glass provides a fairly high
transmission that is about 90%.
As an effort to decrease the amount of heat that
penetrates through the glass, the glass can be replaced
with rayben glass type which has a shading coefficient
θ = 0.7. The result of the calculation is as follows.
The heat penetrating through the glass
Qs = AIθ.W = 10.8 x 700 x 0.57 = 4,309.2 W
Replacement to Rayben glass type (tinted glass) is
proven to reduce the amount of heat since it has a
fairly high heat absorption which is about 55%, so it
will reduce the load on air-conditioning (HVAC) and
give comfort to building occupants. Using the same
calculation method, further calculations are done to
some other room as presented in Table 13.
Table 13. Result of calculation of cooling load KPFT building.
Room Window (m2) Solar radiation (W/m2)
Shading coefficient Solar heat through the glass (W)
Clear glass Raybean glass Clear glass Raybean glass
2nd Floor R.2.1 32.24 700 0.7 0.57 15,797.60 12,836.76
R.2.2 14.40 700 0.7 0.57 7,056.00 5,745.60
R.2.3. 10.80 700 0.7 0.57 5,592.00 4,309.20
R.2.4 10.80 700 0.7 0.57 5,592.00 4,309.20
R.2.5 14.40 700 0.7 0.57 7,056.00 5,745.60
3rd Floor R.3.1 29.12 700 0.7 0.57 14,268.80 11,618.88
R.3.2 19.92 700 0.7 0.57 9,760.80 7,948.08
R.3.3. 27.04 700 0.7 0.57 13,249.60 10,788.96
R.3.4 27.04 700 0.7 0.57 13,249.60 10,788.96
R.3.5 19.92 700 0.7 0.57 9,760.80 7,948.08

Journal of the Civil Engineering Forum Vol. 4 No. 1 (January 2018)
75
b) Analysis of the Implementation of Opportunities
for Energy Efficiency against CEED Building
In order to increase the efficiency of electric energy
consumption in the air conditioning load, calculation
of cooling needs by thermal balance method was
carried out in some rooms in the CEED building.
In the calculation of cooling needs with thermal
balance method in undergraduate administration room
in the 2nd floor of CEED building, the dimensions of
the room; length: 14.4 m, width: 14.4 m, and height:
3.5 m. It used the split type air conditioner. The east
and west walls are directly exposed to outer space,
consisting of a solid concrete wall as thick as 152 mm,
the transmittance (U wall) = 3.58 W/m2°C, wall
absorption (α) = 0.58, sizes of window for each side
of the east and west with a width of 12.96 and a height
of 2.05 with raybean glass type which transmittance
values (Uglass) is 4.48 W/m2°C, at the time of the
calculation, the angle of incidence of the sun on the
wall and Glass (β) was 60°. Average solar radiation
(I) = 700 W/m2, the transmittance of air (fo) = 10
W/m2°C, hot air type 1,300 J/m3°C, ventilation = 0.5
ACH, indoor temperature (Ti) 24°C (comfortable
condition), outdoor temperature (To) was measured at
31°C. The room contains 16 administrative personnel
using 12 fluorescent lamps (TL lamps) @ 36 watts,
each person was assumed to generate 140 W heat.
Based on those data, the cooling load required is:
External wall surface temperature:
Ts = To + (I.α cosβ/fo)= 51.3 °C
Then
ΔTwall = Ts - Ti = 51.3 – 24 = 27.3°C
ΔTglass = To – Ti = 31 – 24 = 7°C
The formula for cooling needs is:
Qm = Qi +Qs + Qc +Qv
Qi = Σ heat (human, electrical equipment)
= (12)(36) + (16)(140) = 2,672 W
Qs = solar heat through the glass
= Aglass. I. θ = (12.96)(2.05)(2)(700)(0.75)
= 27,896.4 W
Qc = heat through wall + heat through glass
= Awall.Uwall.ΔT + Aglass.Uglass.ΔT
=((14.4)(1.45)(2)(3.58)(27.3))+((12.96)(2.05)
(2)(4.48)(7)) = 5,747.72 W
Qv = heat for ventilation = 1,300 . V. ΔT
= 1,300.((14.4)(14.4)(3.5)(0.5)/3,600))(7)= 917.28 W
Qm = Qi + Qs + Qc + Qv
= 2,972+27,896.4+5,747.72+917.28 = 37.53 kW
Based on the performed calculation, it was found out
that the heat that went through the undergraduate
administrative room on the 2nd floor of the CEED
building was very high. Therefore, any afforts to
minimilize the load are needed. Some possible efforts
to do:
a) Preventing solar radiation by installing wide
enough shades or by using a glass type which has
a high solar absorption.
b) Reducing the heat load can also be achieved by
using energy-efficient bulbs. It is recommended to
use 12 energy-save CFL bulbs (Compact
Fluorescent Lamp) @ 24 W with the assumption
that each bulb produces 24 W of heat as well.
c) It is recommended that the inside part of the
normal concrete wall is coated with a 25 mm cork
board which can make the transmittance value of
the wall become 0.85 W/m2°C.
Furthermore, a re-calculation was done to find out
how much is the efficiency of cooling load in the
undergraduate administrative room on the 2nd floor of
CEED building which in the existing condition is
known to have a cooling load as much as 37,533.4 W
or 37.53 kW and after implementing some repair and
addition of wall components, it decreased down
significantly to 6,080.66 W or 6.08 kW so that the
efficiency improvements in AC loads can also be
lowered. With the same calculation assumption,
further calculation was carried out in some other
rooms as shown in Table 14.

Vol. 4 No. 1 (January 2018) Journal of the Civil Engineering Forum
76
Table 14. Result of calculation of cooling load CEED building.
Level Room
Function
Wall Window Energy for cooling Qm
p l t (m2) Qi (W) Qs (W) Qc W) Qv (W) (W)
1st
Floor
R. 202 Adm.
room
14.4 14.4 3.5 26.57 2,528 0 2,635 917.28 6,080.66
R. 206 Meeting
room
7.2 3.6 3.5 15.33 1,826 0 1,501 114.66 3,441.75
3rd
Floor
R. 301 Meeting
room
18.0 12.6 3.5 70.45 28,109 0 7,311 1,003.28 36,423.86
R. 303 Meeting
room
14.4 7.2 3.5 25.58 7,404 0 2,843 458.64 10,705.64
R. 307 Classroom 14.4 14.4 3.5 51.16 15,692 0 3,645 917.28 20,254.34
R. 310 Classroom 14.4 14.4 3.5 51.16 15,800 0 3,645 917.28 20,362.34
5. CONCLUSIONS
a) The average temperature of the KPFT building is
28.4°C, while its average relative humidity is
62%. Meanwhile, the average temperature of the
CEED building is 28.4°C, while its average
relative humidity is 65%. Based on those results,
it can be concluded that in order to achieve
thermal comfort which temperature is around
24°C and relative humidity is around 60%, a quite
intensive air conditioning is still needed in both
buildings.
b) OTTV value of the KPFT building is 17.61 W/m2,
while CEED building OTTV value is 43.05 W/m2.
Those values are still below the standard of SNI
which is 45 W/m2. The OTTV value of CEED
building is higher than KPFT building because the
direction of its glass windows are facing on the
west and east which get direct exposure of
sunlight which makes heat radiation penetrating
through the rooms in the CEED building is also
higher.
c) The IKE gross value indicates that the KPFT
building has average IKE value per month as
much as 3.25 kWh/m2 in 2015 and as much as
3.45 kWh/m2 in 2016. Meanwhile, the CEED
building has average IKE value per month as
much as 1.50 kWh/m2 in the year of 2105 and as
much as 0.79 kWh/m2 in 2016 which are still in
the category of EFFICIENT. The significant
lowering of IKE value of CEED building is
affected by the fact that there was some
replacement of electrical appliances in the
building in 2016, specifically replacement of the
air conditioner to a more energy-efficient
airconditioner, while no such replacement was
done in the KPFT building.
d) A couple of efforts to improve the efficiency of
electrical energy consumption in air conditioning
activity (HVAC) in KPFT building that can be
taken are 1) replacing the air conditioner (AC) 2)
replacing the glass window with a better heat
absorbance glass.
e) Several efforts to improve the efficiency of
electrical energy consumption in the
airconditioning activities (HVAC) in CEED
building that can be done: 1) adding a sunshade to
avoid direct solar radiation on the glass. 2) adding
some layer in the inner part of the wall which has
lower transmittance value.
6. SUGGESTIONS
a) To increase the quantity or number as well as
various functions of the buildings to be taken as
the study case objects
b) To add more measurement variables in order to
strengthen the arguments, similarities, differences
as well as to provide alternative solutions to be
offered.
c) To involve the residents or users of the building in
direct research.
REFERENCES
ASEAN-USAID, 1992. Building Energy
Conservation Project, Final Report, June 1992,
United States: ASEAN Lawrence Berkeley
Laboratory.
Badan Standarisasi Nasional, 2011. SNI 6197:2011
tentang Prosedur Audit Energi pada Bangunan
Gedung. Jakarta: Badan Standarisasi Nasional.
Badan Standarisasi Nasional, 2011. SNI 6389:2011
tentang Konservasi Energi Selubung Bangunan pada
Bangunan Gedung. Jakarta: Badan Standarisasi
Nasional.
Krishan, A., 2001. Climate Responsive Architecture:
A Design Handbook for Energy Efficient Buildings.
New York: McGraw-Hill Book Company.

Journal of the Civil Engineering Forum Vol. 4 No. 1 (January 2018)
77
Marzuki, A. & Rusman, 2012. Audit Energi pada
Bangunan Gedung Direksi PT. Perkebunan
Nusantara XIII (Persero0, Pontianak: Department of
Electrical Engineering, Politeknik Negeri Pontianak.
Ministry of Energy and Mineral Resources, 2012.
Ministry Law No.13 Year 2012 Tentang Penghematan
Pemakaian Energi Listrik. Jakarta: Directorate
General of Energy Saving.
Satwiko, P., 2009. Fisika Bangunan [Physics of
Building]. Yogyakarta: Penerbit Andi.
Syarifudin, 2017. Analisis Konsumsi Energi pada
Operasional Bangunan Gedung Kampus [Analysis of
Energy Consumption towards Campus Building
Operational], Yogyakarta: Master Thesis, Faculty of
Engineering, Universitas Gadjah Mada.
Yuliatna, F., 2015. Analisis Perbandingan Konsumsi
Energi pada Kegiatan Operasional dan Pemeliharaan
Bangunan Gedung dengan Konsep Green Building
dan Bangunan Gedung Konvensional, Yogyakarta:
Faculty of Engineering, Universitas Gadjah Mada.

Vol. 4 No. 1 (January 2018) Journal of the Civil Engineering Forum
78
[this page is intentionally left blank]