an analysis of merging maneuvers at urban expressway merging sections
TRANSCRIPT
Procedia - Social and Behavioral Sciences 138 ( 2014 ) 105 – 115
Available online at www.sciencedirect.com
1877-0428 © 2014 Elsevier Ltd. This is an open access article under the CC BY-NC-ND license (http://creativecommons.org/licenses/by-nc-nd/3.0/).Peer-review under responsibility of Beijing Jiaotong University(BJU), Systems Engineering Society of China (SESC).doi: 10.1016/j.sbspro.2014.07.186
ScienceDirect
The 9th International Conference on Traffic & Transportation Studies (ICTTS’2014)
An Analysis of Merging Maneuvers at Urban Expressway Merging Sections
Tien Dung Chua*, Tomio Miwab, Takayuki Morikawac a Department of Civil Engineering, Nagoya University, Furo-cho, Chikusa-ku, Nagoya 464-8603, Japan
b EcoTopia Science Institute & Green Mobility Collaborative Research Center, Nagoya University, Furo-cho, Chikusa-ku, Nagoya 464-8603, Japan
c Graduate school of Environmental Studies & Green Mobility Collaborative Research Center, Nagoya University, Furo-cho, Chikusa-ku, Nagoya 464-8603, Japan
Abstract
This study analyzed merging maneuvers namely merging speed and merging position by using video data collected at two merging sections on Nagoya Urban Expressway, Japan. The analysis demonstrated that the longer acceleration lane length is associated with further merging positions. Furthermore, the traffic conditions do not significantly affect the means of merging positions but their variations. The variations of merging positions become significant when the density of mainline is higher. A similar tendency can be observed if acceleration lane length becomes longer. Regarding merging speed, it is found that mainline traffic conditions significantly affect merging speeds. They decrease as traffic conditions become denser. To generalize the results of analysis, a normal distribution was adopted to fit the models of merging position and speed. The results of model estimation and sensitivity analysis indicate that the models give consistent results with the analysis. © 2014 The Authors. Published by Elsevier Ltd. Peer-review under responsibility of Beijing Jiaotong University (BJU), Systems Engineering Society of China (SESC).
Keywords: urban expressway, merging maneuver, traffic conditions, gap choice; normal distribution
1. Introduction
Recently, as a consequence of rapid motorization, many bottlenecks on urban expressway in Japan have suffered from severe congestions. Among them, merging section is one of areas that traffic congestions are likely to occur.
* Corresponding author. Tel.: +81-(0)52-789-3565; Fax: +81-(0)52-789-5728. E-mail address: [email protected].
© 2014 Elsevier Ltd. This is an open access article under the CC BY-NC-ND license (http://creativecommons.org/licenses/by-nc-nd/3.0/).Peer-review under responsibility of Beijing Jiaotong University(BJU), Systems Engineering Society of China (SESC).

106 Tien Dung Chu et al. / Procedia - Social and Behavioral Sciences 138 ( 2014 ) 105 – 115
Due to this reason, the operational performance of merging sections has become a crucial issue. To evaluate the performance of these sections, traffic simulators e.g. AIMSUN, VISSIM, PARAMICS, etc., are recognized as effective tools. However, for a reasonable evaluation of performance of merging sections, various influencing factors on driver behavior need to be considered prior to implementing it into simulation models. Although the existing traffic simulators can reproduce merging maneuvers, they cannot precisely represent driver behavior under various influencing factors e.g. traffic conditions, geometry, and individual interactions between merging and mainline vehicles. In the direction of overcoming this limitation, a research project has been conducted to develop driver behavior models which can precisely represent the whole maneuvers of merging and mainline vehicles. That makes it possible to reasonably evaluate the performance of merging sections by incorporating proposed models into a traffic simulator.
Being a part of this research project, the objective of this paper is to analyze and model merging maneuvers namely merging speed and merging position by using video data collected at merging sections on Nagoya Urban Expressway, Japan. The video data were recorded in different times of the day and days of the week to cover both uncongested and congested regimes of mainline traffic. It is interesting to mention that at the study sites, acceleration lanes were extended in 2011 as a measure to relieve traffic congestion. In addition, during the extension of these sections, the acceleration lanes were slightly shortened due to construction work. Therefore, the video data taken during three periods with different lengths of acceleration lane and conditions of mainline traffic provide a good basis for this study.
2. Literature reviews
Polus et al. (1985) analyzed merging positions of merging vehicles based on video data collected at four acceleration lanes in Israel. The comparison was given for tapered and parallel acceleration lanes. However, the effects of traffic conditions and acceleration lane lengths on merging positions were not concerned. Ahammed (2008) modeled merging maneuvers including merging speed and merging position based on field data observed in Ottawa City, Canada. The models showed that merging speeds and merging positions increase as the acceleration lane length becomes longer. Nevertheless, the effects of the mainline traffic conditions were not considered since the field observation was conducted during the off-speak hours only.
Calvi and Blastis (2011) studied the driver behavior on acceleration lane by using a driving simulator. Six configurations were used to test the participants in the simulator including different acceleration lane lengths with low (1000), medium (1500) and high traffic conditions (3000veh/h/2-lane). The findings demonstrated that traffic volumes on the mainline significantly affect merging maneuvers. Initial speed, merging speed, and merging position increase as traffic volumes become higher. In addition, acceleration lane length was found not to affect merging position except under high traffic volume. Although both mainline traffic conditions and acceleration lane lengths were considered, it is unrealistic to assume a fixed mainline speed of 120km/h for all of six configurations in the driving simulator. In reality, the speeds of mainline vehicles are quite dependent on the mainline traffic conditions and they cannot be constant under different traffic conditions. That might be the reason why they concluded that initial and merging speeds increase as traffic volumes become higher.
Most recently, Chu et al. (2013a) claimed that effects of geometry of merging sections and traffic conditions on merging maneuvers have not been thoroughly studied yet. They overcame these limitations by considering both effects of geometry and traffic conditions on merging maneuvers. They took into consideration the effects of traffic conditions by dividing them into four levels A, B, C and F depending on thresholds of traffic flow and an assumed critical speed. However, the effects of traffic conditions cannot be precisely taken into account. In reality, the traffic flow is fluctuated, even under the same traffic level (A, B, C or F). As a result, an individual merging vehicle can face with different traffic flow of mainline within a level. Thoughtfulness of this fact, the present paper improves this limitation by using density for each merging vehicle to analyze the effects of traffic conditions. On the other hand, Chu et al. (2013b) analyzed and modeled gap choices behavior by dividing the choices into “direct-”, “chase-” and “yield-merging” depending on interactions between merging and mainline vehicles. The present paper continues this work in order to build the whole maneuvers of merging vehicles, which can be incorporated in a traffic simulator for reasonably evaluating the operational performance of merging sections.
107 Tien Dung Chu et al. / Procedia - Social and Behavioral Sciences 138 ( 2014 ) 105 – 115
30m200m
200m 30mTakatsuji
Horita South bound
Horita
Takatsuji
North bound
365m (+ 165m*)
65m (+ 35m*)280m (+ 80m*)
100m (+70m*)
Takatsuji
Horita
Horita
Takatsuji
South bound
North bound
3. Study sites, data collection and processing
3.1. Study site description.
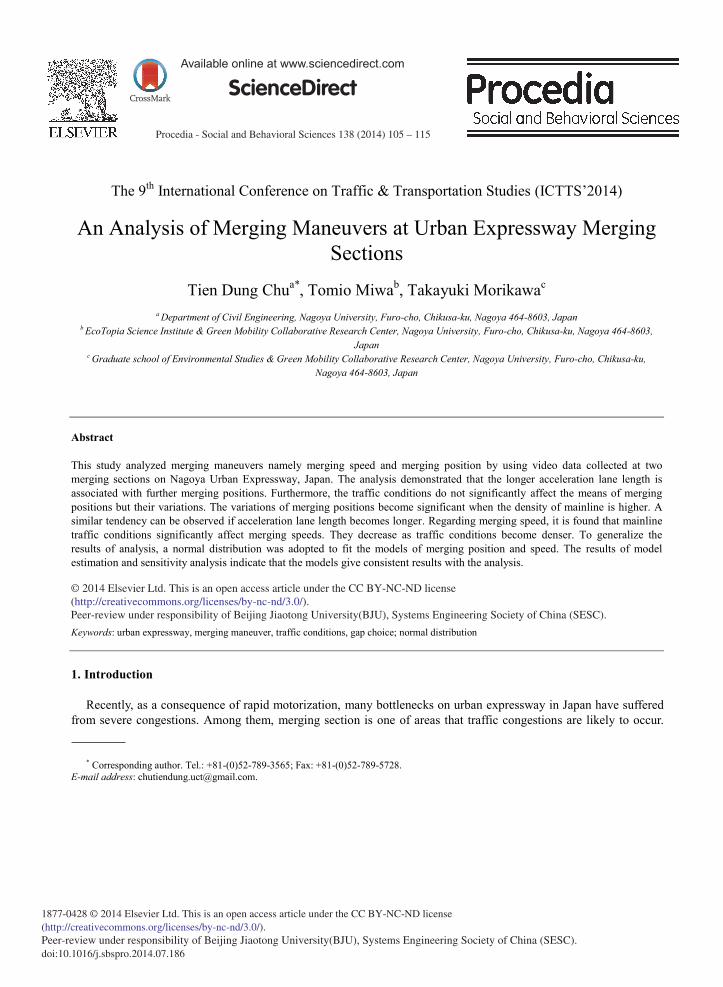
As shown in Fig. 1(a), two merging sections named Horita and Takatsuji entrances on Nagoya Urban Expressway route No. 3 were selected for this study. Both of the sections are located on the right side (left-hand traffic). At these sections, acceleration lanes were extended in October 2011 as a measure to relieve congestion (Fig. 1(c)). Moreover, during the process of extending the sections, the acceleration lanes were slightly shortened (-30m) due to construction work (Fig. 1(b)). The situations of before, during and after the extension of acceleration lanes are denoted as “before”, “during” and “after”, respectively.
(a)
170m (-30m*)
170m (-30m*)
30m
30m
Construction work
Takatsuji
Horita
Horita
TakatsujiConstruction work
South bound
North bound
(b)
(c) Fig. 1. Geometries of Horita and Takatsuji entrances: (a) “Before”; (b) “During”; (c) “After”
Note: (*) compared to before the extension of acceleration lane
3.2. Data collection
Video cameras were positioned on the top of high buildings located near the merging sections to cover large angles. This enables to minimize errors while tracking vehicle trajectories. Video data were recorded at both Horita and Takatsuji entrances, covering all situations of “before”, “after” and “during” in different periods of the day and days of the week. Thus, various mainline traffic conditions including congested and uncongested regimes can be observed. Notably, since the different lengths of acceleration lane were observed at the same merging section, it is expected that the characteristics of drivers e.g. driver’s population, percentage of aggressive drivers are not different for “before”, “during” and “after” situations. Observation dates, duration of survey and mainline traffic situation are shown in Table 1.
108 Tien Dung Chu et al. / Procedia - Social and Behavioral Sciences 138 ( 2014 ) 105 – 115
Table 1. Video survey periods and mainline traffic conditions Merging Section Situation Acceleration lane length:
L (m) Survey date Day Survey time Mainline flow rate (veh/h-2lane) (Min-Max)
Horita Entrane
Before 170 09/16/2005 Friday 14:00 - 17:00 1735 - 3158
During 200 07/26/2011 07/26/2011 07/30/2011
Tuesday Tuesday Saturday
06:00 - 10:50 15:14 - 18:00 05:45 - 09:00
588 - 3240 2484 - 3444 432 - 2232
After 280 11/10/2011 11/13/2011
Thursday Sunday
14:00 - 18:00 07:30 - 10:00
2064 - 3348 1008 - 2580
Takatsuji Entrance
Before 170 01/18/2005 Tuesday 08:00 - 10:00 2650 - 3325
During 200 08/02/2011 08/02/2011 08/06/2011
Tuesday Tuesday Saturday
09:00 - 11:00 15:00 - 18:00 12:00 - 15:00
2400 - 3072 1800 - 2652 1500 - 2316
After 365 01/10/2011 01/13/2012 01/21/2012
Thursday Friday Saturday
14:00 - 18:00 06:45 - 09:30 08:00 - 12:15
1800 - 2820 2154 - 3242 1584 - 2496
3.3. Data processing
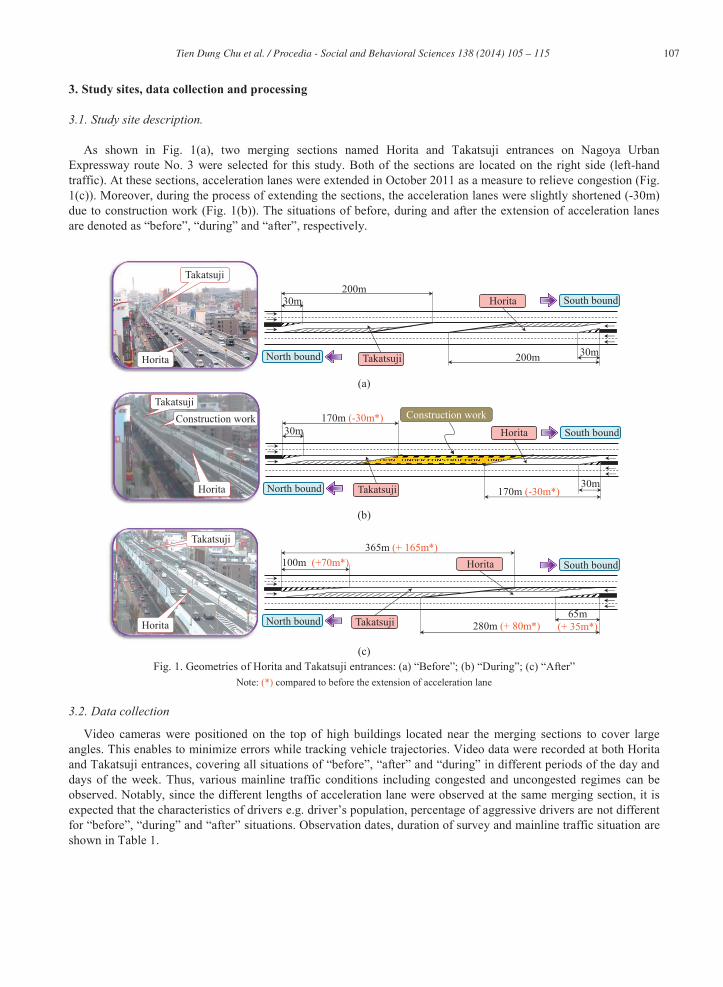
An image processing technique (TrafficAnalyzer, Suzuki and Nakamura, 2006) was used to extract trajectories of free merging vehicles from video data (see, Fig. 2). In this study, a free merging vehicle is defined as the vehicle without facing any other merging vehicles ahead on the acceleration lane when it passes the position of the physical-nose. The position and timing of each vehicle were manually extracted every 1.0 second, and then they were smoothened into every 0.1 seconds by using Kalman Smoothing function. The reference observation point for all vehicles is the point where the right-rear wheel of vehicle is touching the ground. The observed trajectories based on the right-rear wheel were transformed to the trajectories which correspond to the center of the vehicles by considering the dimension of each vehicle.
Fig. 2. TrafficAnalyzer for extracting vehicle trajectories from video data
After getting the vehicle trajectories, the merging maneuvers can be interpolated. In this study, maneuvers
include initial speed, merging speed and merging position which are illustrated in Fig. 3. Their definitions are explained in details as follows. Initial speed (v1, km/h): The speed of merging vehicle at the position of physical-nose. The physical-nose is
defined as the connection point between median separator and tapered chevron marking. Merging speed (v2, km/h): The speed at the moment of merging completion. Merging completion is defined at the
moment when the right-rear side of merging vehicle touches the dashed marking line.
Free merging vehicle
Following merging vehicleSmoothened point
Observation point
Physical-nose
Soft-nose
Kalman Smoothing Function

109 Tien Dung Chu et al. / Procedia - Social and Behavioral Sciences 138 ( 2014 ) 105 – 115
Merging position (xM, m): The distance from physical-nose to the front bumper of merging vehicle at the moment of merging completion. Also, the geometric parameters of merging section are defined in Fig. 3.
Length of chevron marking (xPN-SN, m). It is the distance from physical-nose to soft-nose. The soft-nose is defined as the end point of tapered chevron marking between on-ramp and expressway.
Length of acceleration lane (L, m). It is defined as the distance from physical-nose to the end of taper.
xPN-SNMerging position (xM )
Acceleration lane length (L)
Physical-nose Merging speed (v2)
v2
Initial speed (v1)
Soft-nose
End of taperx
yChevron marking
Median separator
Complete merging point
v1
Fig. 3. Definitions of merging maneuvers and geometric parameters
3.4. Density data collection
In order to analyze the effects of mainline traffic conditions, density data were collected. It is assumed that a merging vehicle starts to be affected by vehicles on median lane within the length of acceleration lane (denoted “influenced area”) when it passes the physical-nose as illustrated in Fig. 4(a). Note that the density within the influenced area changes as the merging vehicle moves from the physical-nose until it makes lane-changing. However, this paper simplifies this matter by assuming that the density in this area is constant during the merging process. The density is calculated as shown in Equation (1):
LNk 1000 (1)
Where k (veh/lane/km) is density of median lane; N is number of mainline vehicles on the median lane within the influenced area when the merging vehicle passes the physical-nose and L (m) is the length of acceleration lane. According to HCM (2010), level of service (LOS) at merging sections is categorized depending on k (pc/km/lane) as follows: A (k ≤ 6), B (k = 6~12), C (k = 12~17), D (k = 17~22), E (C (k > 22). And LOS F exists when demand exceeds capacity. It is good if traffic conditions could be categorized as detailed as HCM (2010) when analyzing effects of traffic conditions. However, considering the available sample size in each regime, in this paper, mainline traffic density is categorized into low density (k 20), medium density (k = 20~40) and high density (k > 40, veh/km/lane).
3.5. Classifications of gap choice
As aforementioned, Chu et al. (2013b) modeled gap choices behavior by dividing them into “direct-”, “chase-” and “yield-merging” depending on interaction between merging and mainline vehicles at an assumed decision point as shown in Fig 4(b). The assumed decision point is defined as 30m downstream from physical-nose. The details of gap choice model and assumed decision point can be seen in Chu et al. (2013 b). And these concepts are adopted in this paper.
4. Analysis of merging maneuvers
4.1. Merging position (xM)
As mentioned earlier, Horita and Takatsuji entrances with different situations of “before”, “during” and “after” were observed. Although merging maneuvers may be influenced by characteristic of each entrance, this fact is
110 Tien Dung Chu et al. / Procedia - Social and Behavioral Sciences 138 ( 2014 ) 105 – 115
i-2 i-1 i i+1a) Direct mergingAdjacent gap
Lead gap
Following gap
i-2 i-1 i i+1
b) Chase merging
i-2 i-1 i i+1
c) Yield merging
i-2 i-1 i i+1Merging vehicle at assumed decision point
Number of mainline vehicles on median lane within acceleration lane (N )
Chevron marking Soft-nosePhysical-nose
Median separator
Influenced area
End of taper
Shoulder laneMedian lane
Merging vehicle at physical-nose
050
100150200250300350
k <
20
k =
20~4
0
k >
40
k <
20
k =
20~4
0
k >
40
k <
20
k =
20~4
0
k >
40
k <
20
k =
20~4
0
k >
40
Mer
ging
pos
ition
(m)
Traffic conditions (Density - k, veh/km/lane)
UpperLowerBox 1
L = 170m L = 365mL = 280mL = 200m
Ave85%
15%Min
Max
(120) (129) (185) (9) (46) (208) (42) (90) (46) (80) (119) (13)
(18.64)(18.47)(23.97)(29.75)(29.72)(41.52) (29.11)(28.24)(44.33)
(45.72)(41.74)(61.73) (STDEV)
(Sample)size
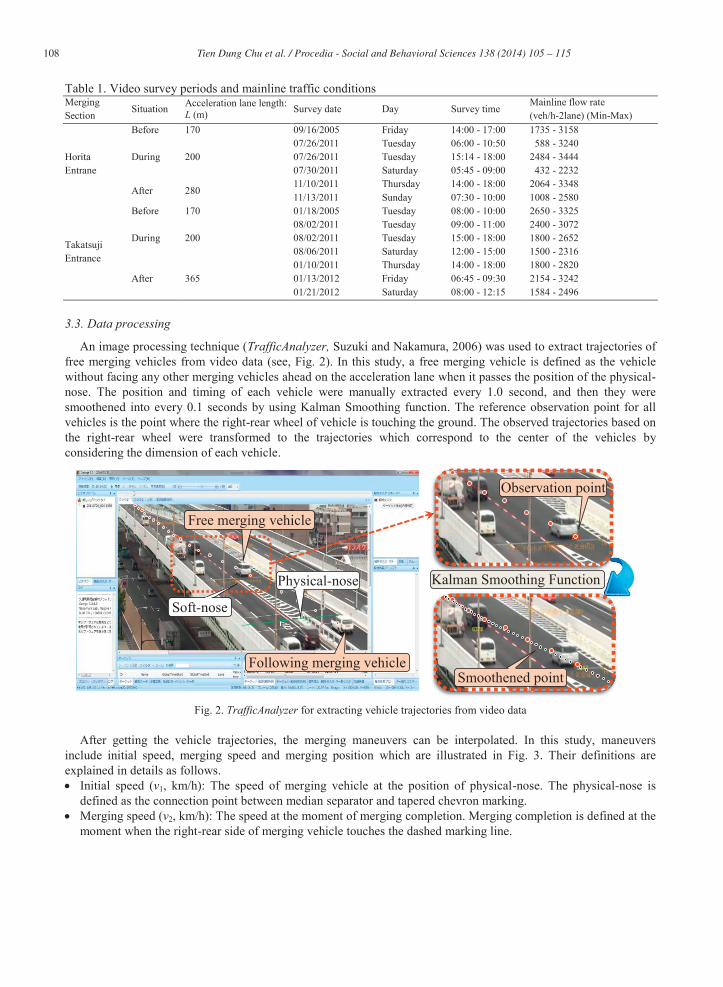
assumed to be neglected. Thus, the data at Horita and Takasuji with the same acceleration lane length can be combined. As indicated in. Fig. 5, in the cases of L = 170m (“during”) and 200m (“before”), the data from both of the sections are used. While the cases of L = 280m and L = 365m represent the data of “after” situations at Horita and Takatsuji, respectively. This category is later applied for other figures as well.
(a) (b) Fig. 4. (a) Density data collection; (b) classification of gap choice.
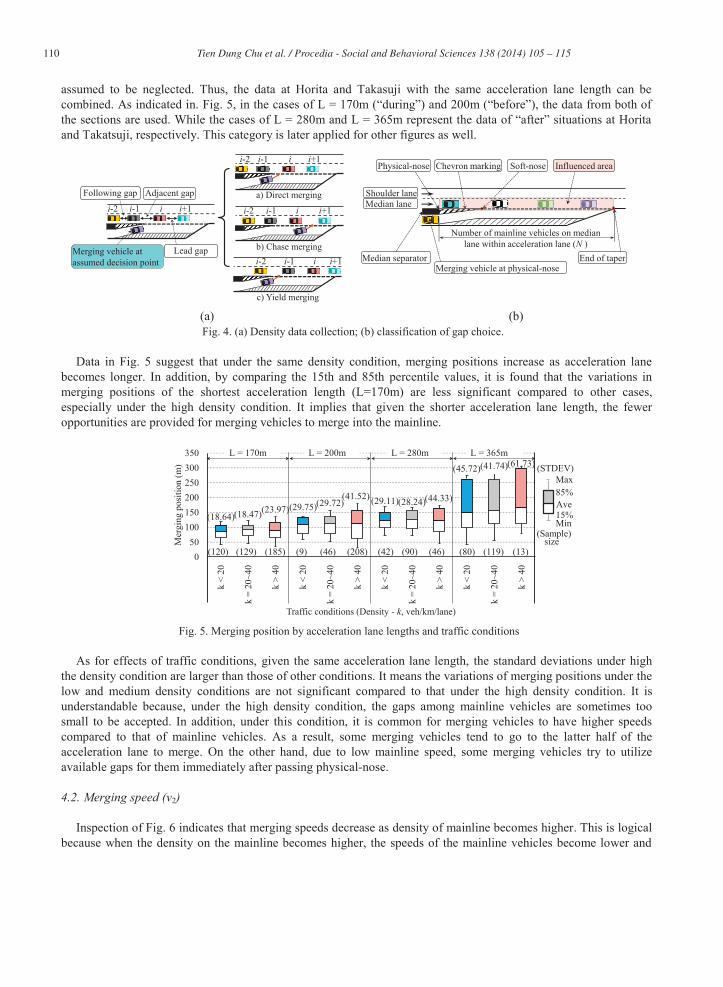
Data in Fig. 5 suggest that under the same density condition, merging positions increase as acceleration lane
becomes longer. In addition, by comparing the 15th and 85th percentile values, it is found that the variations in merging positions of the shortest acceleration length (L=170m) are less significant compared to other cases, especially under the high density condition. It implies that given the shorter acceleration lane length, the fewer opportunities are provided for merging vehicles to merge into the mainline.
Fig. 5. Merging position by acceleration lane lengths and traffic conditions
As for effects of traffic conditions, given the same acceleration lane length, the standard deviations under high the density condition are larger than those of other conditions. It means the variations of merging positions under the low and medium density conditions are not significant compared to that under the high density condition. It is understandable because, under the high density condition, the gaps among mainline vehicles are sometimes too small to be accepted. In addition, under this condition, it is common for merging vehicles to have higher speeds compared to that of mainline vehicles. As a result, some merging vehicles tend to go to the latter half of the acceleration lane to merge. On the other hand, due to low mainline speed, some merging vehicles try to utilize available gaps for them immediately after passing physical-nose.
4.2. Merging speed (v2)
Inspection of Fig. 6 indicates that merging speeds decrease as density of mainline becomes higher. This is logical because when the density on the mainline becomes higher, the speeds of the mainline vehicles become lower and
111 Tien Dung Chu et al. / Procedia - Social and Behavioral Sciences 138 ( 2014 ) 105 – 115
020406080
100120140
k <
20
k =
20~4
0
k >
40
k <
20
k =
20~4
0
k >
40
k <
20
k =
20~4
0
k >
40
k <
20
k =
20~4
0
k >
40
Mer
ging
spee
d (k
m/h
)
Traffic conditions (Density - k, veh/km/lane)
UpperLowerBox 1
L = 170m L = 200m L = 280m L = 365m
Ave85%
15%Min
Max
(120) (129) (185) (9) (46) (208) (42) (90) (46) (80) (119) (13)
(10.94)(11.20)(11.97)
(12.42)(13.71)(11.64)
(8.48)(8.22)
(12.75)
(8.99) (8.20)
(5.31)
(STDEV)
(Sample)size
0
20
40
60
80
100
0 20 40 60 80 100
Mer
ging
spee
d v 2
(km
/h)
Initial speed v1 (km/h)
k < 20k = 20~40k > 40
Note: k (veh/km/lane)
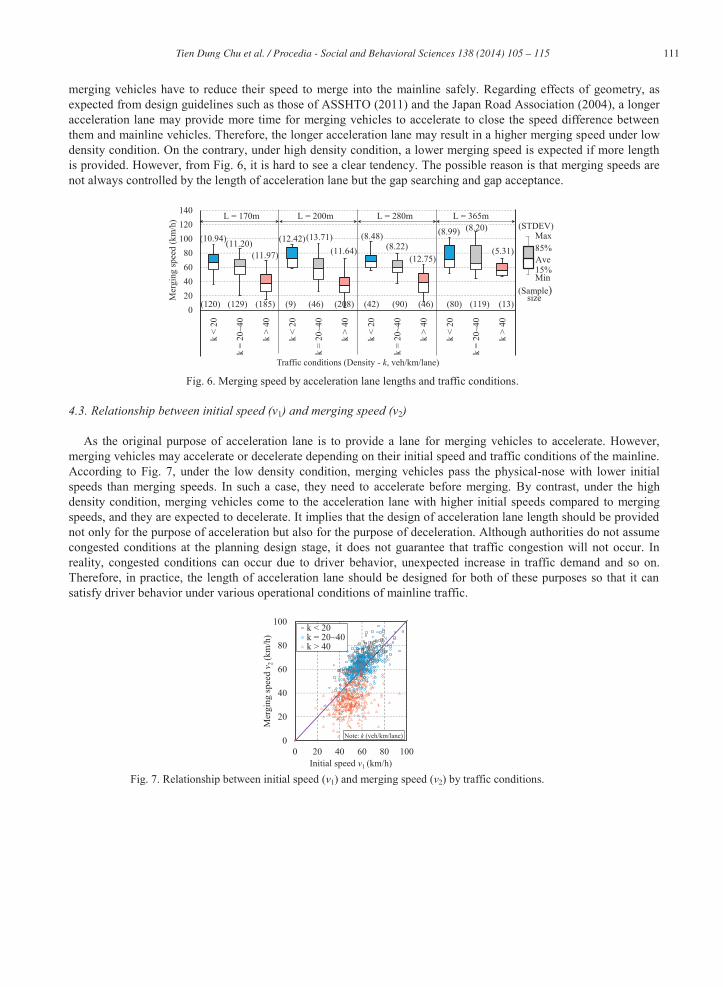
merging vehicles have to reduce their speed to merge into the mainline safely. Regarding effects of geometry, as expected from design guidelines such as those of ASSHTO (2011) and the Japan Road Association (2004), a longer acceleration lane may provide more time for merging vehicles to accelerate to close the speed difference between them and mainline vehicles. Therefore, the longer acceleration lane may result in a higher merging speed under low density condition. On the contrary, under high density condition, a lower merging speed is expected if more length is provided. However, from Fig. 6, it is hard to see a clear tendency. The possible reason is that merging speeds are not always controlled by the length of acceleration lane but the gap searching and gap acceptance.
Fig. 6. Merging speed by acceleration lane lengths and traffic conditions.
4.3. Relationship between initial speed (v1) and merging speed (v2)
As the original purpose of acceleration lane is to provide a lane for merging vehicles to accelerate. However, merging vehicles may accelerate or decelerate depending on their initial speed and traffic conditions of the mainline. According to Fig. 7, under the low density condition, merging vehicles pass the physical-nose with lower initial speeds than merging speeds. In such a case, they need to accelerate before merging. By contrast, under the high density condition, merging vehicles come to the acceleration lane with higher initial speeds compared to merging speeds, and they are expected to decelerate. It implies that the design of acceleration lane length should be provided not only for the purpose of acceleration but also for the purpose of deceleration. Although authorities do not assume congested conditions at the planning design stage, it does not guarantee that traffic congestion will not occur. In reality, congested conditions can occur due to driver behavior, unexpected increase in traffic demand and so on. Therefore, in practice, the length of acceleration lane should be designed for both of these purposes so that it can satisfy driver behavior under various operational conditions of mainline traffic.
Fig. 7. Relationship between initial speed (v1) and merging speed (v2) by traffic conditions.
112 Tien Dung Chu et al. / Procedia - Social and Behavioral Sciences 138 ( 2014 ) 105 – 115
0
50
100
150
200
250
300
350
Dire
ct
Cha
se
Yie
ld
Dire
ct
Cha
se
Yie
ld
Dire
ct
Cha
se
Yie
ld
Dire
ct
Cha
se
Yie
ld
Mer
ging
pos
ition
(m)
Merging choice
UpperLowerBox 1
L = 170m L = 200m L = 280m L = 365m
Ave85%
15%Min
Max
(18.42)(21.12)(26.28)(34.74)
(35.30)(28.31)(21.41)
(33.97)(24.44)(36.85)
(17.97)(24.01)
(287) (39) (29) (179) (73)(10)
(166)
(6)(6)
(193)
(9)
(10)
(STDEV)
(Sample)size
0
20
40
60
80
100
120
140
Dire
ct
Cha
se
Yie
ld
Dire
ct
Cha
se
Yie
ld
Dire
ct
Cha
se
Yie
ld
Dire
ct
Cha
se
Yie
ld
Mer
ging
spee
d (k
m/h
)
Merging choice
UpperLowerBox 1
L = 170m L = 200m L = 280m L = 365m
Ave85%
15%Min
Max
(287) (39)(29)
(179) (73)(10)
(166)(6)
(6) (193)(9) (10)
(16.22)
(11.77)(12.48)
(17.02)
(10.77)(14.39)
(13.65)(18.07)
(12.24)(8.90)
(12.57)(8.67)
(STDEV)
(Sample)size
4.4. Effects of merging choices on merging position (xM) and merging speed (v2)
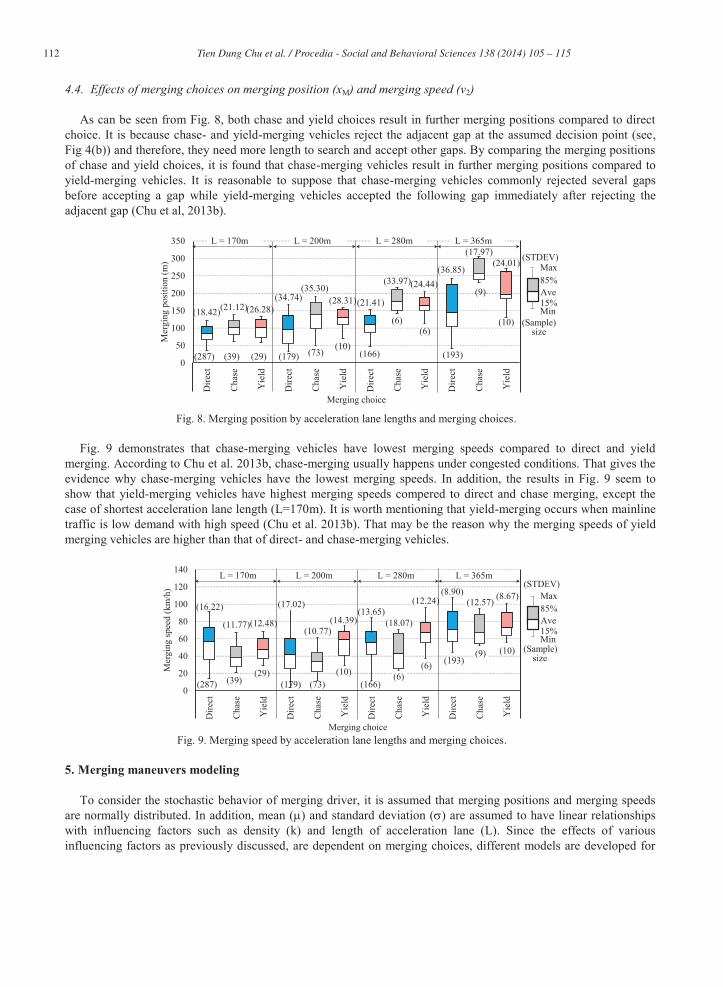
As can be seen from Fig. 8, both chase and yield choices result in further merging positions compared to direct choice. It is because chase- and yield-merging vehicles reject the adjacent gap at the assumed decision point (see, Fig 4(b)) and therefore, they need more length to search and accept other gaps. By comparing the merging positions of chase and yield choices, it is found that chase-merging vehicles result in further merging positions compared to yield-merging vehicles. It is reasonable to suppose that chase-merging vehicles commonly rejected several gaps before accepting a gap while yield-merging vehicles accepted the following gap immediately after rejecting the adjacent gap (Chu et al, 2013b).
Fig. 8. Merging position by acceleration lane lengths and merging choices. Fig. 9 demonstrates that chase-merging vehicles have lowest merging speeds compared to direct and yield
merging. According to Chu et al. 2013b, chase-merging usually happens under congested conditions. That gives the evidence why chase-merging vehicles have the lowest merging speeds. In addition, the results in Fig. 9 seem to show that yield-merging vehicles have highest merging speeds compered to direct and chase merging, except the case of shortest acceleration lane length (L=170m). It is worth mentioning that yield-merging occurs when mainline traffic is low demand with high speed (Chu et al. 2013b). That may be the reason why the merging speeds of yield merging vehicles are higher than that of direct- and chase-merging vehicles.
Fig. 9. Merging speed by acceleration lane lengths and merging choices.
5. Merging maneuvers modeling
To consider the stochastic behavior of merging driver, it is assumed that merging positions and merging speeds are normally distributed. In addition, mean ( ) and standard deviation ( ) are assumed to have linear relationships with influencing factors such as density (k) and length of acceleration lane (L). Since the effects of various influencing factors as previously discussed, are dependent on merging choices, different models are developed for

113 Tien Dung Chu et al. / Procedia - Social and Behavioral Sciences 138 ( 2014 ) 105 – 115
020406080
100
0 20 40 60 80 100 120
Perc
enta
ge (%
)
Merging speed (km/h)
Direct modelFixed parametersk =5veh/km/laneL = 300mxm = 100m v1 = 40km/h
v1 = 60km/hv1 = 80km/h
020406080
100
0 20 40 60 80 100 120
Perc
enta
ge (%
)
Merging speed (km/h)
k = 5k = 35k = 65
Direct modelFixed parametersv1 = 40km/hL = 300mxm = 100m
Note: k (veh/km/lane)
020406080
100
0 20 40 60 80 100 120
Perc
enta
ge (%
)
Merging speed (km/h)
DirectChaseYield
Fixed parametersv1 = 40km/hk =10veh/km/laneL = 200mxm = 100m
020406080
100
0 20 40 60 80 100 120
Perc
enta
ge (%
)
Merging speed (km/h)
L=200mL=250mL=300m
Direct modelFixed parametersv1 = 40km/hk =5veh/km/lanexm = 100m
020406080
100
0 50 100 150 200 250 300
Perc
enta
ge (%
)
Merging position (m)
L=200mL=250mL=300m
Direct modelFixed parametersk = 5veh/km/lanexPN-SN = 50m
020406080
100
0 50 100 150 200 250 300
Perc
enta
ge (%
)
Merging position (m)
DirectChaseYield
Fixed parametersk = 10veh/km/laneL = 200mxPN-SN = 30m
020406080
100
0 50 100 150 200 250 300
Perc
enta
ge (%
)
Merging position (m)
k = 5veh/km/lanek = 35veh/km/lanek = 65veh/km/lane
Direct modelFixed parametersL = 300mxPN-SN = 60m
020406080
100
0 50 100 150 200 250 300
Perc
enta
ge (%
)
Merging position (m)
30
60
90
Direct modelFixed parametersk = 5veh/km/laneL = 300m
xPN-SN = 30mxPN-SN = 60mxPN-SN = 90m
direct, chase and yield merging, respectively. Note that, the chevron marking length can affect the merging position. Basically, merging vehicles should not merge into the mainline before the end of chevron marking. Thus, this variable is taken into account of merging position modeling. On the other hand, initial speed and merging position variables are additionally considered for merging speed modeling.
Table 2 gives the estimation results of merging position and merging speed models for direct-, chase- and yield-merging, respectively. It is shown that mainline density and chevron marking length do not significantly affect the mean of merging position but its variation. The higher density and the shorter chevron marking exhibit more variation of merging position. This evidence can also be seen in Fig. 10(a) and(b). On the other hand, the results of Table 2 and Fig. 10(c) indicate that the length of acceleration lane is a factor in significantly changing of both mean of merging position and its variation. The longer acceleration lane associates with a further merging position and more variation. Looking at the effect of merging choices, it can be identified from Fig. 10(d) that chase- and yield-merging vehicles have further merging position than direct-merging vehicles.
(a) (b)
(c) (d)
Fig. 10. Sensitivity analysis of merging position: (a) Effect of traffic conditions; (b) effect of chevron marking; (c) effect of acceleration lane length; (d) effect of merging choice
(a) (b)
(c) (d) Fig. 11. Sensitivity analysis of merging speed: (a) Effect of traffic conditions; (b) effect of initial speed; (c) effect of acceleration
lane length; (d) effect of merging choice

114 Tien Dung Chu et al. / Procedia - Social and Behavioral Sciences 138 ( 2014 ) 105 – 115
Regarding merging speed models, mainline density and initial speed are the most significant variables. As displayed in Fig. 11, merging speed increase greatly if mainline density decreases or initial speed increases. Other variables such as merging position and length of acceleration lane do not attribute to a significant change of merging positions as can be observed in Fig. 11(c). It is worth mentioning that merging position variable was shown a similar tendency with length of acceleration lane. Thus, the figure was omitted. As for effects of merging choice, data from Fig. 11(d) report that yield-merging vehicles have higher merging speeds compared to direct- and chase-merging.
Table 2. The estimation results of merging position and merging speed models Variables
Merging positions Merging speeds Direct Chase Yield Direct Chase Yield Estimated parameters (T-statistic) Estimated parameters (T-statistic)
Constant 33.3 (4.1) -56.8 (-2.8) -32.9(-0.94) 19.1 (8.2) 44.5 (4.9) 71.3 (7.8) Initial speed (v1, km/h) - - - 0.67 (22) 0.10 (2.1) 0.12 (2.4) Merging position (xM, m) - - - 0.051 (5.2) 0.054 (2.1) 0.098 (2.8) Mainline density (k, veh/km/lane) 0.069 (1.4) * * -0.41 (-20) -0.45 (-7.1) -0.64 (-5.7) Length of acceleration lane (L, m) 0.30 (3.3) 1.2 (5.6) 1.1 (3.4) 0.027 (6.4) * * Chevron marking length (xPN-SN, m) * -1.2 (-1.9) -1.5 (-1.8) - - -
Constant -22.9 (-3.9) -32.8 (-2.2) 10.1 (0.41) 6.62 (4.9) -5.9 (-0.8) 11.9 (2.0) Initial speed (v1, km/h) - - - 0.028 (1.6) 0.17 (2.4) 0.016 (1.5) Merging position (xM, m) - - - 0.011 (2.1) -0.026(-1.4) * Mainline density (k, veh/km/lane) 0.12 (3.4) 0.34 (2.5) 0.27 (2.3) 0.051 (4.0) * * Length of acceleration lane (L, m) 0.36 (5.6) 0.38 (2.6) 0.030 (2.1) -0.013(-4.9) 0.038 (1.6) -0.01 (-1.8) Chevron marking length (xPN-SN, m) -0.79 (-4.4) -0.97 (-2.3) -0.02 (-2.2) - - -
Initial log likelihood -44627.63 -13672.31 -8541.93 -200686.05 -15800.03 -23203.77 Log likelihood -3760.78 -614.36 -334.99 -2802.66 -467.05 -261.66 Sample size 825 127 55 825 127 55 Note: “*“ Not significant “-“ Not applicable
6. Conclusions
This paper analyzed the merging maneuvers at urban expressway merging sections by using video data. It is concluded that the longer acceleration lane length results in further merging positions. Furthermore, the traffic conditions do not significantly affect the means of merging positions but their variations. The variations of merging positions become significant when density of mainline is higher. A similar tendency can be observed if acceleration lane length becomes longer. From these results, it can be implied that a longer acceleration lane may not always provide a benefit in terms of efficiency. Under near-congested or congested conditions, the variation of merging positions when the longer acceleration lane is provided can cause more negative impacts on mainline traffic. Regarding merging speed, it is found that mainline traffic conditions significantly affect merging speeds. Merging speed decreases as traffic conditions become denser. The relationship between initial and merging speeds showed that, merging vehicles use the acceleration lane not only for acceleration purpose but also for deceleration purpose.
The normal distribution was adopted to fit the models of merging positions and speeds. The results of model estimation and sensitivity analysis indicate that the models are consistent with the analysis. However, these models are limited to the right hand-side entrances (left-hand traffic). In future, collecting data of left-hand-side entrances with more available ranges of acceleration lane length to generalize the models is necessary. In addition, in this study, only free merging vehicles were considered. Thus, future work should also need to take into account of following merging vehicles.
References
Ahammed, M. A., Hassan, Y., and Tarek A. S. (2008): Modeling driver behavior and safety on freeway merging areas. Journal of Transportation Engineering, 134, 370 – 377.
115 Tien Dung Chu et al. / Procedia - Social and Behavioral Sciences 138 ( 2014 ) 105 – 115
American Association of State Highway and Transportation Officials, AASHTO (2011). A policy on geometric design of highways and streets, Washington, D. C. Calvi, A., & Blasiis, M. A. D. (2011). Driver’s behavior on acceleration lanes: a driving simulator study. Transportation Research Board 90th Annual Meeting, DVD. Chu, T. D., Nakamura, H., Peng, C., & Asano, M. (2013). Quantifying Effects of Acceleration Lane Lengths and Traffic Conditions on Merging Maneuvers at Urban Expressway Entrances. In Proceedings of the Eastern Asia Society for Transportation Studies (Vol. 9). Chu, T. D., Nakamura, H., & Asano, M. (2013b). Modeling gap choice at urban expressway merging sections, Journal of Japan Society of Civil Engineers Part D3, JSCE, 69, (in press). Highway Capacity Manual, HCM (2010). Transportation Research Broad. Japan Road Association (2004). Interpretation and application of road structure ordinance (in Japanese). Polus, A., Livneh, M., & Factor, J. (1985). Vehicle flow characteristics on acceleration lanes. Journal of Transportation Engineering, 111, 595-606. Suzuki, K., & Nakamura, H. (2006). TrafficAnalyzer - the integrated video image processing system for traffic flow analysis. 13th World Congress on Intelligent Transportation Systems, London, CD-ROM.