an analysis of methanol and hydrogen production via high
TRANSCRIPT

INL/EXT-14-31642
An Analysis of Methanol and Hydrogen Production via
High-Temperature Electrolysis Using the
Sodium Cooled Advanced Fast Reactor
Shannon M. Bragg-Sitton Richard D. Boardman Robert S. Cherry Wesley R. Deason Michael G. McKellar Idaho National Laboratory
March 2014


DISCLAIMER
This information was prepared as an account of work sponsored by an agency of the U.S. Government. Neither the U.S. Government nor any agency thereof, nor any of their employees, makes any warranty, expressed or implied, or assumes any legal liability or responsibility for the accuracy, completeness, or usefulness, of any information, apparatus, product, or process disclosed, or represents that its use would not infringe privately owned rights. References herein to any specific commercial product, process, or service by trade name, trade mark, manufacturer, or otherwise, does not necessarily constitute or imply its endorsement, recommendation, or favoring by the U.S. Government or any agency thereof. The views and opinions of authors expressed herein do not necessarily state or reflect those of the U.S. Government or any agency thereof.


INL/EXT-14-31642
An Analysis of Methanol and Hydrogen Production via High-Temperature Electrolysis Using the Sodium
Cooled Advanced Fast Reactor
Shannon M. Bragg-Sitton Richard D. Boardman
Robert S. Cherry Wesley R. Deason
Michael G. McKellar Idaho National Laboratory
March 2014
Idaho National Laboratory Idaho Falls, Idaho 83415
http://www.inl.gov
Prepared for the U.S. Department of Energy Office of Nuclear Energy
Under DOE Idaho Operations Office Contract DE-AC07-05ID14517


An Analysis of Methanol and Hydrogen Production via High-Temperature
Electrolysis Using the Sodium Cooled Advanced Fast Reactor
INL/EXT-14-31642
March 2014
Approved by:
3/28/14 Shannon Bragg-Sitton Project Manager
Date
3/28/14 Richard D. Boardman Approving Manager
Date


v
ABSTRACT
Integration of an advanced, sodium-cooled fast spectrum reactor into nuclear hybrid energy system (NHES) architectures is the focus of the present study. A techno-economic evaluation of several conceptual system designs was performed for the integration of a sodium-cooled Advanced Fast Reactor (AFR) with the electric grid in conjunction with wind-generated electricity. Cases in which excess thermal and electrical energy would be reapportioned within an integrated energy system to a chemical plant are presented. The process applications evaluated include hydrogen production via high temperature steam electrolysis and methanol production via steam methane reforming to produce carbon monoxide and hydrogen which feed a methanol synthesis reactor. Three power cycles were considered for integration with the AFR, including subcritical and supercritical Rankine cycles and a modified supercritical carbon dioxide modified Brayton cycle. The thermal efficiencies of all of the modeled power conversions units were greater than 40%. A thermal efficiency of 42% was adopted in economic studies because two of the cycles either performed at that level or could potentially do so (subcritical Rankine and S-CO2 Brayton). Each of the evaluated hybrid architectures would be technically feasible but would demonstrate a different internal rate of return (IRR) as a function of multiple parameters; all evaluated configurations showed a positive IRR. As expected, integration of an AFR with a chemical plant increases the IRR when “must-take” wind-generated electricity is added to the energy system. Additional dynamic system analyses are recommended to draw detailed conclusions on the feasibility and economic benefits associated with AFR-hybrid energy system operation.

vi

vii
CONTENTS
1. INTRODUCTION .............................................................................................................................. 1
2. SODIUM FAST REACTOR HYBRID HEAT APPLICATIONS ..................................................... 3
2.1 Power Generation ..................................................................................................................... 3 2.1.1 General Considerations of Power Cycles .................................................................... 3 2.1.2 Rankine Steam Cycle .................................................................................................. 5 2.1.3 Supercritical Carbon Dioxide Modified Brayton Gas Cycle (S-CO2) ........................ 7 2.1.4 Cooling Tower Model ................................................................................................. 9 2.1.5 Results ....................................................................................................................... 10
2.2 Hydrogen Production via HTSE ............................................................................................ 12 2.2.1 Introduction and model development........................................................................ 12 2.2.2 Results of the Process Model .................................................................................... 15
2.3 Methanol Production Plant ..................................................................................................... 16 2.3.1 Adaptation of the conventional methanol process .................................................... 16 2.3.2 Operation to Counterbalance Wind Generation Variability ...................................... 19
3. FINANCIAL PERFORMANCE ...................................................................................................... 20
3.1 Study Methodology and Scope .............................................................................................. 20 3.1.1 Financial Figures of Merit ......................................................................................... 20 3.1.2 Financial Analysis Theory ........................................................................................ 21 3.1.3 Capital Cash Flows during Construction .................................................................. 22 3.1.4 Financial Analysis Parameters and Key Assumptions .............................................. 23 3.1.5 Capital Cost Estimation for the AFR-100 and Wind Farm ....................................... 23 3.1.6 Capital Cost Estimation for Methanol and HTSE Chemical Plants .......................... 24
3.2 Study Results.......................................................................................................................... 31
4. CONCLUSIONS AND RECOMMENDATIONS ........................................................................... 39
5. REFERENCES ................................................................................................................................. 42
6. APPENDIX: MODEL PROCESS FLOW DIAGRAMS AND OUTPUT ..................................... A1
6.1 Supercritical Rankine Power Cycle Model ........................................................................... A2
6.2 Subcritical Rankine Power Cycle Model ............................................................................ A27
6.3 Supercritical CO2 Modified Brayton Power Cycle Model .................................................. A44
6.4 Supercritical Rankine HTSE Model .................................................................................... A56
6.5 Subcritical Rankine HTSE Model ....................................................................................... A95
6.6 Supercritical CO2 Brayton HTSE ...................................................................................... A133

viii
FIGURES Figure 1. Heat engine between hot source and cold sink. ............................................................................ 4
Figure 2. Basic Rankine steam cycle. .......................................................................................................... 5
Figure 3. Rankine steam cycle with feed water heaters. .............................................................................. 6
Figure 4. Typical temperature profile for an optimized feed water heater. ................................................. 7
Figure 5. Simple Brayton cycle.................................................................................................................... 8
Figure 6. Supercritical CO2 cycle. ............................................................................................................... 9
Figure 7. Water cooling tower process flow diagram. ............................................................................... 10
Figure 8. Thermal efficiency of S-CO2 cycle as a function of IHX temperature difference of inlet and outlet CO2 ............................................................................................................................ 11
Figure 9. Process flow diagram of AFR-100/HTSE Integration ................................................................ 13
Figure 10. HTSE heat integration process flow diagram. .......................................................................... 14
Figure 11. General energy and product flows for AFR-100 integration with HTSE using the analyzed power conversion cycles: (a) Supercritical Rankine, (b) Subcritical Rankine and (c) Supercritical CO2 Brayton. ............................................................................................. 15
Figure 12. Steps for converting natural gas to methanol. The center section of the diagram (outlined in blue) is further described in Figure 13. ................................................................... 17
Figure 13. Comparison of heat management for two steam-methane reforming cases. The output syngas is a precursor to methanol, as shown in Figure 12. Note that BFW = boiler feed water. .......................................................................................................................................... 18
Figure 14. MIMO nuclear hybrid energy system depicting wind energy and methanol production integration. .................................................................................................................................. 28
Figure 15. MIMO nuclear hybrid energy system depicting wind energy and hydrogen production integration. .................................................................................................................................. 28
Figure 16. Results from Case 2 evaluations, indicating the variation in the IRR as a function of electricity price for Single-Input/Single-Output cases (nuclear to electricity only). .................. 33
Figure 17. Results from Case 3 evaluations, demonstrating the increased IRR for larger single-unit nuclear plants (note that these results do not translate directly to the build of multiple lower power units to achieve the same total electric power). ....................................... 34

ix
TABLES
Table 1. AFR-100 Design Parameters (Kim, Grandy, & Hill, 2012) .......................................................... 2
Table 2. Results of power conversion unit analysis for AFR-100 ............................................................. 11
Table 3. HTSE electrolysis cell parameters ............................................................................................... 13
Table 4. Hydrogen production summary. ................................................................................................. 16
Table 5. Standard 15-year MACRS depreciation schedule. ...................................................................... 22
Table 6. Assumed Economic Input Parameters used in Financial Analysis .............................................. 23
Table 7. Scaled capital cost comparisons for SFRs found in literature. ..................................................... 24
Table 8. Capital cost estimates for chemical plant components. ............................................................... 24
Table 9. Manufacturing costs used in the models. ..................................................................................... 25
Table 10. Applied commodity prices. ........................................................................................................ 26
Table 11. Methanol Plant Variable Production Scaling. “Reference 1” and “Reference 2” correspond to the earlier PWR integration study; “Derived Plant” corresponds to the AFR case..................................................................................................................................... 30
Table 12. Methanol Plant Equipment Scaling. “Reference” corresponds to the earlier PWR integration study; “Derived” corresponds to the AFR case. ....................................................... 30
Table 13. HTSE Production Scaling. “Reference” corresponds to the AFR/HTSE plant design presented in Section 2.2 of the current report. “Derived” corresponds to the AFR/HTSE plant size used for economic analysis. ........................................................................................ 31
Table 14. List of Evaluated Cases: Single-Input and Multi-Input for Electricity Production ................... 32
Table 15. List of Evaluated Cases: Single-Input and Multi-Input for Electricity Production .................... 33
Table 16. List of Evaluated Cases: Multi-Input for Electricity Production (MISO) .................................. 34
Table 17. List of Multi-Input/Multi-Output (MIMO) Evaluated Cases Featuring Integration with a Methanol Production Plant. ..................................................................................................... 35
Table 18. AFR-100 methanol hybrid energy system economic modeling results for configurations producing both electricity and methanol. In all cases the total electricity production is constant at 100 MWe. ........................................................................................... 36
Table 19. List of Multi-Input/Multi-Output (MIMO) Evaluated Cases Featuring Integration with a HTSE Plant .............................................................................................................................. 37
Table 20. AFR-100 HTSE hybrid energy system economic modeling results for configurations producing both electricity and hydrogen via HTSE. In all cases the total electricity production is constant at 100 MWe. ........................................................................................... 38
1
An Analysis of Methanol and Hydrogen Production via High-Temperature Electrolysis Using the Sodium
Cooled Advanced Fast Reactor
1. INTRODUCTION Integration of an advanced, sodium-cooled fast spectrum reactor into nuclear hybrid energy system (NHES) architectures is the focus of the current study. As previously discussed in Bragg-Sitton, et al., (2013), NHES could be a key part of the solution to achieving energy security, could provide reliable power availability even with increasing renewable energy penetration into the power grid, and could allow repurposing excess heat and electricity in times of low demand.
Multiple analyses have been performed to demonstrate the load-managing potential of small modular reactors (SMRs). The purpose of this report is to present the results of a techno-economic evaluation of several conceptual designs for the integration of a sodium-cooled Advanced Fast Reactor (AFR) with the electric grid. Selected system designs allow the reactor thermal energy to be converted to electricity and be subsequently dispatched to the grid or to be used in the production of alternative commodities as electricity demand fluctuates. The recent drive in the U.S. and Europe has been to increase the amount of renewable energy on the electrical grid in attempt to reduce overall greenhouse gas (GHG) emissions, but the variability of electricity production via renewable sources increases the need for dependable load-balancing power generation. Nuclear energy provides one option for producing low-emissions electricity. The challenge for nuclear energy is to provide cost-competitive energy in a market in which pricing is established by instantaneous demand with a “must take” priority for variable renewable power generation provided by wind and solar energy.
Nuclear reactors must be operated near their nominal design capacity to be economically viable, justifying large capital costs to build the plant and minimizing operations and maintenance costs. Integration of renewable energy with nuclear power in a hybrid energy system could supply demand-following electricity to the grid while simultaneously increasing utilization of the capital equipment through integration of additional processes that can make efficient use of excess thermal energy. Many industrial manufacturing processes can beneficially use excess reactor thermal energy and/or electrical energy that would be available in times of low grid electricity demand or high renewable-generated electricity.
This report includes analysis results for several electricity generation scenarios to begin to quantify the benefits of hybrid applications of the AFR:
A. Single-input, single-output (SISO) generation of electricity from a nuclear plant (provides a traditional baseline for subsequent hybrid analyses).
B. Multi-input, single-output (MISO) generation of electricity. This simplified hybrid implementation allows evaluation of integrated wind and nuclear power generation using custom Rankine and supercritical power cycles to produce electricity only.
C. Multi-input, multi-output (MIMO) generation of electricity and an additional output commodity (e.g. hydrogen, methanol). For the current study, these cases include:
i. Integration of wind and nuclear power generation with hydrogen and oxygen production via high temperature steam electrolysis (HTSE) in addition to electricity generation.
ii. Integration of wind and nuclear power generation with methanol production via steam methane reforming of natural gas (produces carbon monoxide and hydrogen, which are catalytically combined to produce methanol) in addition to electricity generation.

2
The selected hybrid cases are useful illustrations of the art-of-the-possible. High temperature steam electrolysis (HTSE) is a process that ideally splits steam at 800C (O'Brien, 2008). HTSE is approximately 30% more efficient than standard water electrolysis. HTSE represents a process that can be rapidly turned up or down to utilize electricity and thermal energy when it is available. Additionally, heat recuperation from the hot product streams can be used to amplify the heat provided by a nuclear reactor having intermediate-level output temperature.
Methanol production is representative of many petro-chemical manufacturing industries that must operate continuously near their design capacity for both technical and economic reasons. Methanol production requires heat, steam, and electricity that could be provided by a nuclear plant. Methanol is a primary feedstock for several chemical products, and it can also be converted into gasoline or olefins.
The current study was limited to analysis of a small modular version of the AFR technology to produce electricity and heat for the described hybrid energy systems. The examples are based on the AFR-100 design, which would produce approximately 100 megawatts electricity depending on its associated power cycle. The AFR-100 is a sodium cooled fast reactor design developed at the Argonne National Laboratory; a summary of the design parameters is provided in (Kim, Grandy, & Hill, 2012). The AFR is one of the leading advanced SMR concepts being developed by the DOE Advanced SMR (aSMR) Program. The AFR concept would use sodium for both the core cooling in the primary loop and as the working fluid in the secondary heat transfer loop. The secondary loop provides isolation of the reactor core from the power conversion unit and process heat applications.
Table 1. AFR-100 Design Parameters (Kim, Grandy, & Hill, 2012)
AFR-100 Product Product Description Reactor Conditions Thermal Energy Rating 250 MWt Reactor Outlet Temperature 550°C (sodium) Reactor Inlet Temperature 395°C (sodium) Reactor Heat and Power Steam 510°C and 17 MPa for Subcritical Rankine cycle Steam 510°C and 24 MPa for Supercritical Rankine cycle Carbon Dioxide 510°C and 20 MPa for Supercritical CO2 Brayton cycle Electricity Production >100 MWe Net AC or DC
Generated by Rankine or Supercritical carbon dioxide Brayton power cycle with thermal efficiency > 40%
HYSYS (Aspen Technology Inc., 1995) was used to model integration of the AFR-100 reactor with the power conversion units and a high temperature steam electrolysis (HTSE) plant located in close proximity to the reactor site. The modeled power conversion units include supercritical carbon dioxide (S-CO2) modified Brayton, supercritical steam Rankine, and subcritical steam Rankine power cycles. HYSYS allows for accurate mass and energy balances and contains all of the fundamental process components in the plant; for example, compressors, turbines, pumps, valves, and heat exchangers. HYSYS is used to support the analysis of power conversion units and HTSE because of its ease to develop and optimize detailed power conversion systems and the legacy of HYSYS models developed for HTSE at INL. This work sets the stage for future evaluation of the technical attributes of these cycles, such as their ramp rates and ability to be hybridized with manufacturing industries. Section 2.2 presents additional details on the HTSE integration and the associated results.
The integration of a methanol plant to an AFR-100 was modeled using Aspen-Plus. A detailed methanol plant based on natural gas reforming to produce the appropriate ratio of carbon monoxide and hydrogen (mixtures of CO and H2 are often referred to as syngas) for catalytic synthesis of methanol was previously

3
developed for other SMR designs, as described in (Bragg-Sitton, et al., 2013). The model includes both major and minor unit operations with a full heat and electrical integration between the nuclear and chemical production plants. This study leverages the results of the earlier model to evaluate potential heat and electrical integration with the AFR-100. Section 2.3 presents additional details and the associated results for methanol plant integration.
A custom Microsoft Excel spreadsheet economic model (Gandrik A. , 2011) was used to calculate the internal rate of return (IRR) of a capital investment based on a standard computation of the net present value (NPV) from discounted cash flows. The economic spreadsheet invokes typical plant economic cost estimations using scaled and factored analyses that include contingencies for engineering, piping, instruments and controls, etc. The analysis employs the HTSE technology design basis developed by the Idaho National Laboratory (INL) and preliminary plant engineering and economics completed by Dominion Engineering under subcontract to DOE-NE (Krull, Roll, & Varrin, March 2013). A limited parametric evaluation of the selling price of electricity and SMR plant size was completed to illustrate the impact of these variables on the financial indicators that can be used to measure project economic value. Hydrogen, oxygen, and methanol commodity prices may also vary according to market projections, but only historical prices were used to project revenue for purposes of this study.
A detailed evaluation of the dynamic hybrid operation of this plant with variable production of electricity and chemicals was beyond the scope of the present work. Such an analysis requires the development of a dynamic process model that accounts for transitory operations that follow market demand functions such as the time-dependent trading costs of electricity.
2. SODIUM FAST REACTOR HYBRID HEAT APPLICATIONS
2.1 Power Generation
2.1.1 General Considerations of Power Cycles
The major difference between nuclear and non-nuclear power cycles is the heat source. For conventional plants, fossil fuels are the heat source, whereas nuclear fission is the heat source for a nuclear plant. A power cycle generally consists of four stages: (1) heat addition, (2) power generation through expansion, (3) heat rejection, and (4) compression.
Thermodynamic performance of a cycle is measured by its thermal efficiency, th. The thermal
efficiency is defined as the electrical power output, elecW , divided by the heat input, inQ , or:
in
electh Q
W
(1)
A power cycle is based on the thermodynamic concept of a heat engine. Power may be produced from a heat engine that is placed between a high temperature source and a low temperature sink,
as shown in Figure 1. The work of the heat engine, W , is defined in Eq. (2), where HQ and
LQ represent the heat flow from the high temperature source and the low temperature sink, respectively:
LH QQW (2)

4
Figure 1. Heat engine between hot source and cold sink.
Heat is transferred from the high-temperature source to the heat engine and heat is rejected from the heat engine to the low temperature sink. The thermal efficiency of a heat engine can be shown as:
H
LHth Q
(3)
In real situations, a temperature difference is needed to transfer the heat from the source to the heat engine and from the heat engine to the heat sink. However, if those differences were to go to zero, an ideal or maximum efficiency could be determined. The maximum efficiency is called the Carnot efficiency, ηCarnot, and is a function of source and sink temperatures only, TH and TL:
H
LHCarnot T
TT
(4)
In this report, three power cycles were analyzed: supercritical Rankine steam cycle, subcritical Rankine steam cycle, and a supercritical carbon dioxide modified Brayton gas cycle. The following assumptions were made for all of the cycles analyzed:
- Cycle turbines and compressors have 90% isentropic efficiencies unless otherwise stated.
- Pumps have 75% isentropic efficiencies.
- Intermediate heat exchangers (IHX) and steam generators have minimum approach temperatures of 20C.
- All other heat exchangers in the power cycles have minimum approach temperatures of 5.56C.
- Pressure drops across the components are 2% of the inlet pressure to the component.
- For the Rankine power cycles, the high pressure and low pressure turbines have isentropic efficiencies of 80% and the intermediate turbine has an efficiency of 90%.
TH
TL
W
HQ
LQ
5
The purpose of these models is to provide a reasonable thermal efficiency for electricity production. The models are theoretical and are not developed for actual power cycle design.
2.1.2 Rankine Steam Cycle
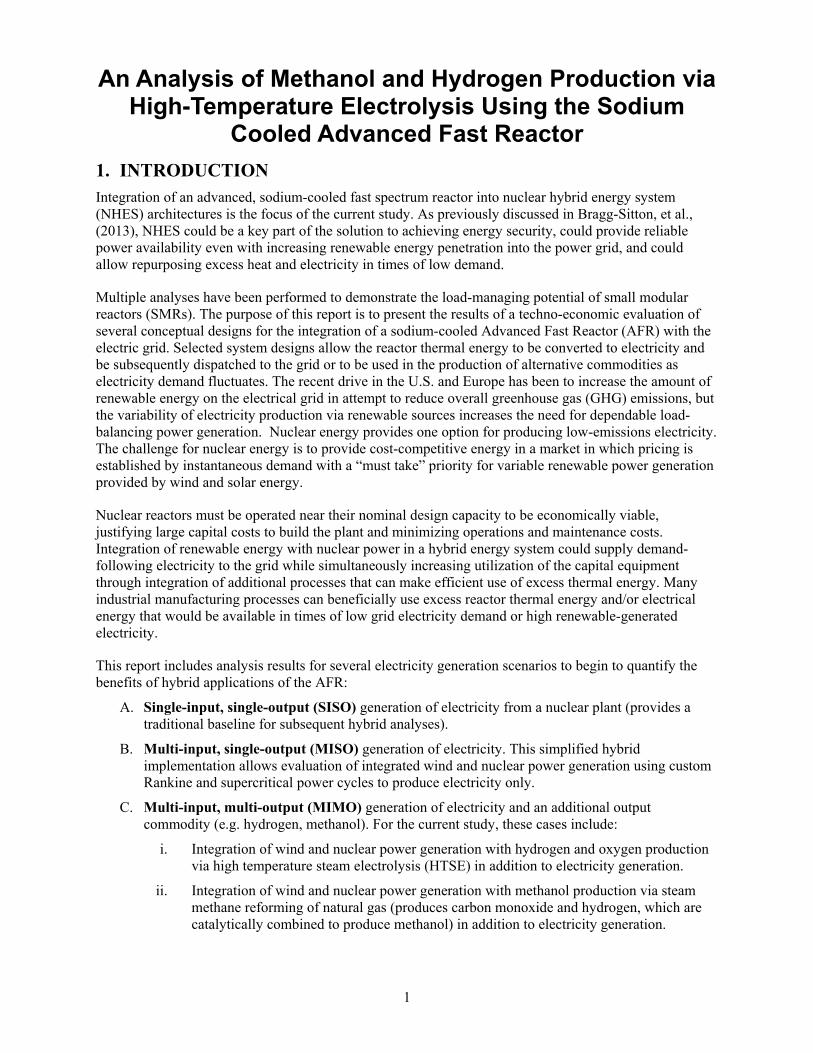
The Rankine steam cycle is the most basic thermodynamic power cycle. The simplest cycle consists of a steam generator, turbine, condenser, and pump, as shown in Figure 2. The working fluid is water; low-pressure water is pumped to a high pressure. Heat is transferred to the water through a steam generator to produce high-pressure steam. The steam expands through the turbine to produce flow work or power which is converted to electricity in a generator. The low-pressure saturated steam/water is condensed to liquid water in the condenser.
Figure 2. Basic Rankine steam cycle.
The Rankine cycle efficiency is defined as the power difference between the turbine and the pump divided by the heat input to the steam generator:
GeneratorSteam
PumpTurbineth Q
WW
(5)
The cycle efficiency can be improved through heat recuperation in which a portion of the partially expanded streams from the turbines exchange heat with the water returning from the condenser to the steam generator, also known as feed water. These heat exchangers are called feed water heaters. The expanded streams are mixed with the exit stream of the condenser. The efficiency can also be improved by reheating the steam from the first turbine within the steam
GeneratorSteamQ
CondenserQ
TurbineW
PumpW

6
generator before expanding the steam in the second turbine. Figure 3 shows a Rankine steam cycle with feed water heaters and a set of turbines. The power cycle is separated from the heat of the reactor through two circulation loops: the primary sodium loop and a secondary (intermediate) sodium heat transfer loop. The purpose of the intermediate loop is to prevent tritium migration to the power cycle components. The thermal efficiency of a recuperated Rankine cycle is defined as:
actorRe
PumpsTurbinesth Q
WW
(6)
Figure 3 is a simple representation of the actual process model. Both supercritical and subcritical Rankine cycle models for this work have 6 feed water heaters, 1 deaerating heater, and 3 feed water pumps. The supercritical Rankine cycle has a pressure exiting the steam generator that is above the critical point of steam (22.1 MPa) and the subcritical has a pressure below the critical point. The models are based on a supercritical steam cycle developed by Babcock and Wilcox (The Babcock & Wilcox Company, 2005). The process flow diagrams and stream conditions of both models are found in Appendix A.
Figure 3. Rankine steam cycle with feed water heaters.
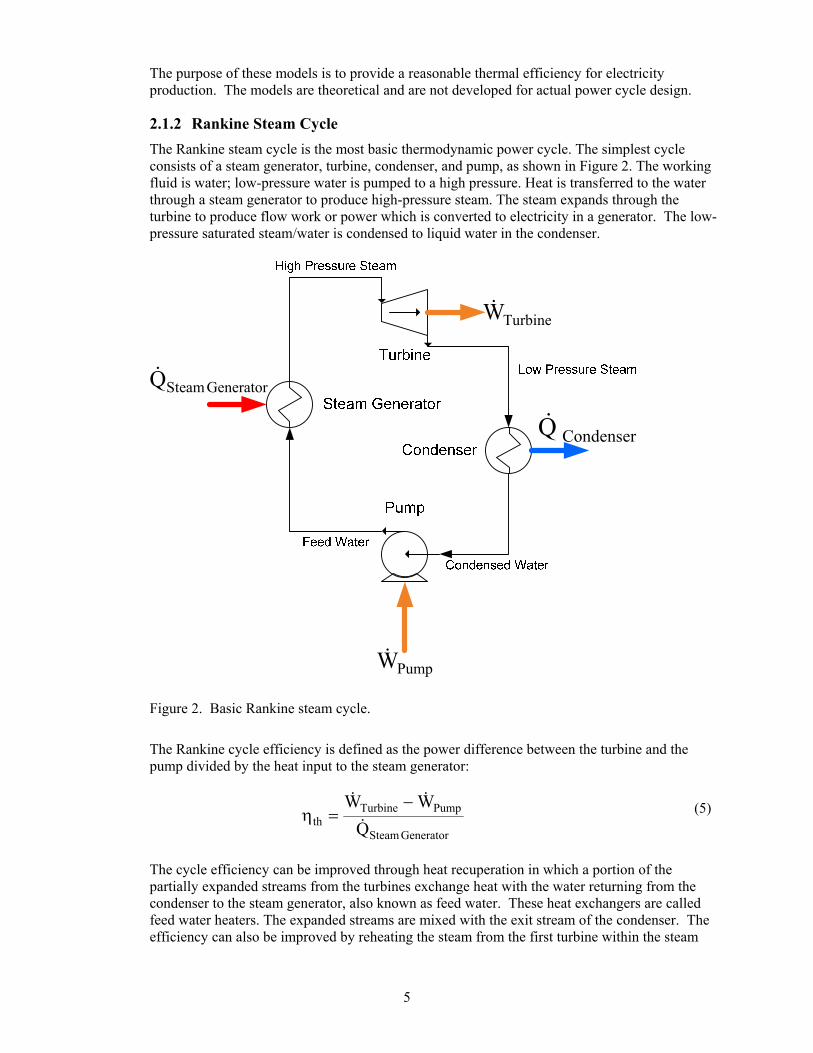
The Rankine cycle is optimized by increasing the temperature into the steam generator to as high a temperature as possible. This temperature is constrained by the minimum temperature difference between the hot side and the cold side of the steam generator. The steam generator inlet temperature establishes the maximum flow rate of water/steam through the steam generator. Next, the feed water heaters must be optimized by adjusting the fraction of steam bled from the turbines to the feed water heaters and the pressures at which those streams are bled. Those variables are adjusted so that the inlets of the pumps are saturated liquid and each feed water heater has a minimum temperature difference of 5.56 °C between the hot side and cold side fluids at the inlets and outlets. Figure 4 shows a typical temperature versus heat flow profile for an optimized feed water heater.
7
Figure 4. Typical temperature profile for an optimized feed water heater.
2.1.3 Supercritical Carbon Dioxide Modified Brayton Gas Cycle (S-CO2)
The basic Brayton gas cycle is shown in Figure 5. The high-pressure working gas is expanded in a turbine to produce power. The low-pressure warm gas is cooled in an ambient cooler, which reduces the power of compression. The low-pressure cold gas is compressed to the high-pressure of the system. Often the turbine and the compressor are mechanically connected through a single shaft. The thermal efficiency of the cycle is presented in Eq. (7).
HeaterGas
CompressorTurbineth Q
WW
(7)
205
210
215
220
225
230
235
240
245
250
0 5 10 15
Temperature (°C)
Heat Flow (MWt)
Bled Steam from Turbine
Feed Water

8
HeaterGasQ
CoolerGasQ
TurbineW
CompressorW
Figure 5. Simple Brayton cycle.
As with the Rankine steam cycle, the thermal efficiency is improved through recuperation. The recuperating heat exchanger heats the gas exiting the compressor and cools the gas leaving the turbine. This has a two-fold advantage of reducing the amount of cooling needed from the gas cooler and heat needed before expansion.
A modified Brayton cycle (Figure 6) was developed to take advantage of the high density of carbon dioxide at the thermodynamic critical point (Dostal, Driscoll, & Hejzlar, 2004). Compression power is reduced due to the higher density of the CO2. High pressure (~20 MPa) CO2 is heated from the secondary sodium heat transfer loop to the maximum temperature of the cycle through the intermediate heat exchanger (IHX). The gas is expanded in the turbine to near the critical pressure of carbon dioxide (~7.4 MPa). The high temperature recuperator (HTR) exchanges heat with the return line from the compressors. This exchange increases the temperature into the IHX which increases the flow through the turbine, resulting in higher power production. The low pressure stream is further cooled by the low temperature recuperator (LTR) by exchanging heat from the gas exiting the LTR. The flow is then split to parallel compressors. The lower mass flow fraction (~30%) enters the high temperature compressor which is expanded to the high pressure and combined with the gas from the cold temperature compressor as this flow exits the LTR. The larger fraction of flow (~70%) rejects its heat through a gas cooler before entering the low temperature compressor. The thermal efficiency for the S-CO2 cycle as shown in Figure 6 is described by Eq.8.
actorRe
sCompressorPumpsTurbinesth Q
WWW
(8)

9
Figure 6. Supercritical CO2 cycle.
The S-CO2 cycle is optimized by adjusting the split between the low temperature and high temperature compressors, the outlet pressure of the turbine (a slight adjustment), and the temperature of the CO2 into the IHX. The last adjustment has an optimal value below or above which the thermal efficiency decreases. The temperature rise across the nuclear reactor core has a strong effect on this adjustment. If the core has a large temperature rise (~150 - 400°C), the optimal value cannot be reached due to constraints imposed by the reactor inlet temperature, which in turn will result in a lower than optimal thermal efficiency. The cycle can be adjusted to its optimal efficiency if the temperature rise across the core is less than the difference between the optimal IHX inlet and outlet CO2 temperatures. The process model developed for this study is based on the Argonne National Laboratory modelling work of the S-CO2 cycle integrated with sodium cooled fast reactors (Chang, Finck, Grandy, & Sienicki, 2006; Sienicki, 2011).
2.1.4 Cooling Tower Model
A cooling tower model was developed to cool the condensers in the Rankine cycles and the cooler in the S-CO2 cycle. The air in the cooling tower model has an inlet temperature of 20°C and a relative humidity of 50%. The water cooling constraints and conditions such as blowdown and entrained water are based on published information (Peters & Timmerhaus, 1991; Zhai & Rubin, 2010). The process flow diagram for the cooling tower is shown in Figure 7.

10
Figure 7. Water cooling tower process flow diagram.
2.1.5 Results
Detailed process flow diagrams and corresponding steam and component data are found in Appendix A. Table 2 summarizes the analysis results for the AFR-100 integration with each power cycle.
The most efficient cycle is the supercritical Rankine cycle with a thermal efficiency of 43.8%; however, this cycle also has the highest pressure of the studied power conversion cycles, 24 MPa. Both Rankine cycles have low pressures (7.43 kPa) in the condenser, which will result in large heat exchangers. The subcritical Rankine cycle has the lowest pressure difference, 17 MPa, across a heat exchanger between the secondary sodium loop and the power conversion cycle. The Rankine cycles are established cycles with many years of experience within the nuclear industry, including previous use in sodium-cooled reactors.
The S-CO2 cycle has a low pressure of 7.40 MPa, near the critical point of carbon dioxide. The highest pressure in the cycle is 20 MPa at the outlet of the cold temperature compressor. The overall higher pressure within this cycle results in smaller components. The Rankine cycles are constrained only by the reactor outlet temperature. However, the S-CO2 cycle is constrained by both the reactor outlet and inlet temperatures. Another analysis was performed in which the inlet temperature into the CO2 side of the IHX was allowed to increase, while keeping the IHX outlet CO2 temperature constant. The results of this analysis are shown in Figure 8. Figure 8 plots the cycle thermal efficiency and the temperature difference across the IHX on the CO2 side as a function of the CO2 temperature into the IHX. As the temperature difference across the IHX decreases from 155°C to 139°C, the thermal efficiency increases from 40% to 42%. If the temperature into the IHX is further increased, the thermal efficiency decreases. The temperature

11
difference across the CO2 of the IHX has a direct relationship to the temperature difference across the reactor core. In other words the temperature difference across the reactor core constrains the temperature difference of the CO2 across the IHX. Another means to approach the optimal CO2 temperature difference across the IHX is to lower the allowable temperature differences between the hot side and cold side of each heat exchanger between the reactor core and the IHX. This temperature difference is referred to as the minimum approach temperature difference of the heat exchanger. For example, if the IHX inlet approach temperature difference between the sodium side and the CO2 side is reduced from 20°C to 5°C, the S-CO2 cycle thermal efficiency could increase to 42%. The lower efficiency of the S-CO2 cycle in this study results from two factors: the temperature difference across the reactor core and the temperature difference constraint across the hot side and cold side of each heat exchanger between the reactor core and the IHX.
Table 2. Results of power conversion unit analysis for AFR-100
Supercritical Rankine
Subcritical Rankine
S-CO2
Electric Power Generated (MWe) 109.5 106.8 100.5
Thermal Efficiency 43.8% 42.7% 40.2%
High Pressure (MPa) 25.0 17.7 20.8
Low Pressure (MPa) 0.0074 0.0074 7.40
Water Usage (kg/s) 66.9 68.2 82.1
Figure 8. Thermal efficiency of S-CO2 cycle as a function of IHX temperature difference of inlet and outlet CO2
42%Optimal Point
139 °COptimal Point
120
130
140
150
160
170
180
37.5%
38.0%
38.5%
39.0%
39.5%
40.0%
40.5%
41.0%
41.5%
42.0%
42.5%
43.0%
330 340 350 360 370 380 390
IHX In
let an
d Outlet Temperature Difference of CO2
Therm
al Efficiency
CO2 Temperature into IHX (°C)
Thermal Efficiency
Temperature Difference Across IHX

12
2.2 Hydrogen Production via HTSE
2.2.1 Introduction and model development
In 2009, an independent review team considered the integration of three hydrogen production technologies with a high temperature gas-cooled reactor (HTGR) under the Next Generation Nuclear Plant (NGNP) Project funded by the U.S. Department Energy Office of Nuclear Energy (DOE-NE) (NGNP, July 2009). The three hydrogen production processes considered were: 1) thermal-chemical water splitting based on the sulfur iodine looping reactions process, 2) the hybrid sulfur process, and 3) high-temperature steam electrolysis (HTSE). These technologies were selected over other candidate processes based on higher thermodynamic efficiencies that can be achieved at process temperatures that matched the HTGR reactor outlet temperature of approximately 850 C. The review team recommended the HTSE process as the best choice for the NGNP Project. Most commercial and industrial hydrogen production is by steam methane forming where natural gas and steam are reacted to form syngas (hydrogen and carbon monoxide) and the carbon monoxide in the syngas is reacted with more water to create carbon dioxide and hydrogen.
The energy duty of HTSE is approximately 85-90 % electricity input. Thermal energy is used to produce and supply superheated steam combined with a gas recycle stream. With custom design of the hydrogen and oxygen separation processes, heat recuperation can be used to superheat steam that is supplied to the HTSE process from intermediate temperature steam generators.
Hydrogen can be efficiently produced using HTSE with steam temperatures up to approximately 800C in solid oxide electrolysis cells (SOEC). The steam and associated electricity that would be produced by the AFR-100 can provide the required input to the HTSE unit operations. Heat recuperation from the product streams is used to amplify the temperature of the intermediate quality steam provided by the AFR-100. Electricity is simultaneously directed to the HTSE plant.
Figure 9 shows the detail of a custom HYSYS process model developed to simulate integration of an AFR-100 with HTSE. Steam produced by the reactor is apportioned between power generation and the HTSE plant. For this analysis, the electrolysis process is at the thermal neutral point, defined as isothermal at 800°C and adiabatic.
Table 3 shows the electrolysis cell conditions applied in the analysis. Figure 10 shows the nuclear heat integration and recuperation for the HTSE process with highlights showing low and high temperature heat recuperation, nuclear process heat integration, and topping heat. The HYSYS models for the power cycles combined with the electrolysis units are provided in Appendix A.

13
Figure 9. Process flow diagram of AFR-100/HTSE Integration
Table 3. HTSE electrolysis cell parameters
Supercritical Rankine
Subcritical Rankine
S-CO2
Number of cells 526,000 514,000 487,000 Cell Area (cm2) 225 225 225 Current Density (amperes/cm2) 0.636 0.636 0.635 Area Specific Resistance (ohms * cm2) 0.4 0.4 0.4 Operating Voltage 1.29 1.29 1.29 Current (amperes) 143 143 143

14
Figure 10. HTSE heat integration process flow diagram.
15
2.2.2 Results of the Process Model
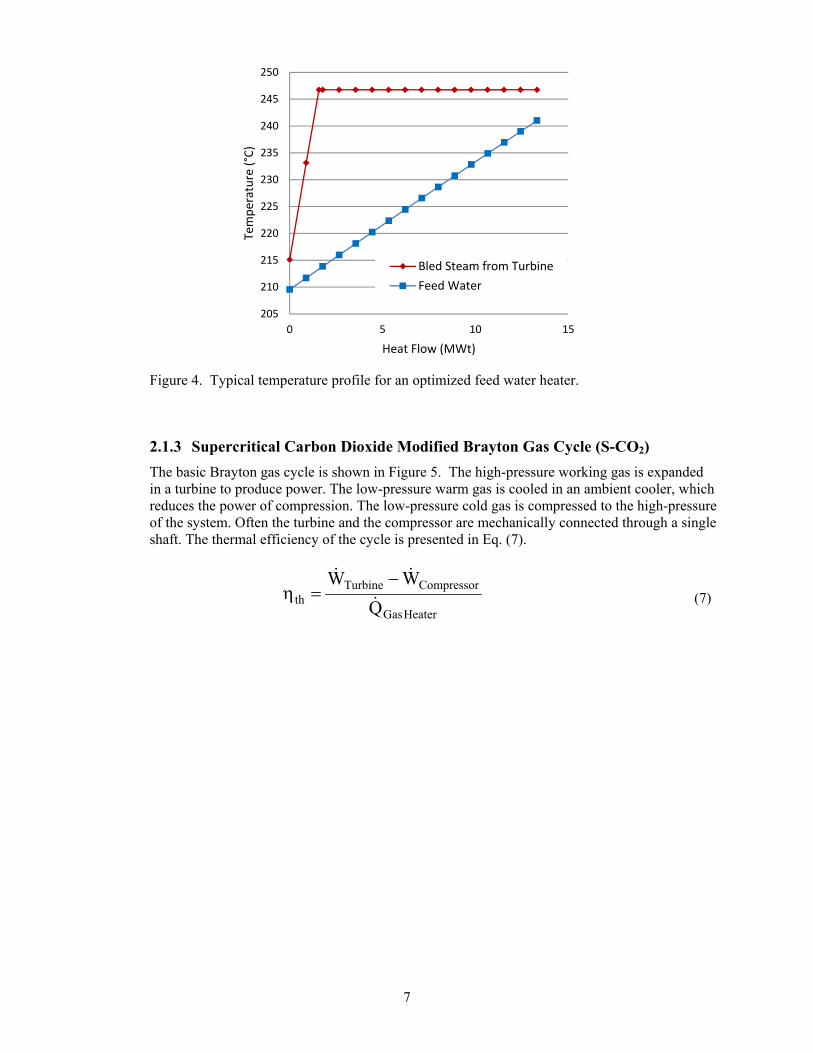
Figure 11 summarizes the input and product streams for the integrated AFR-100/HTSE process for a single 250 MWt nuclear reactor. The HTSE process uses approximately 90 to 100 MWe electrical load input from the nuclear reactor and produces no carbon dioxide, as summarized in Table 4. A secondary steam loop transfers ~530 °C steam from the AFR-100 to the HTSE facility where feed water is converted to steam. High temperature and low temperature recuperating heat exchangers are subsequently used to superheat the steam used in the electrolyzers. A total of 21 to 24 MW of thermal energy is needed for this purpose.
High Temperature Steam Electrolysis
AFR 100 @ 250 MWt
Sub-Critical Rankine
Nuclear ProcessHeat
22.9 MWt
Water73.8 kg/s
Hydrogen0.768 kg/s
CO2 Emitted0 ton/day
Electricity97.0 MWe
Oxygen6.10 kg/s
High Temperature Steam Electrolysis
AFR 100 @ 250 MWt
Super-Critical Rankine
Nuclear ProcessHeat
23.5 MWt
Water72.8 kg/s
Hydrogen0.786 kg/s
CO2 Emitted0 ton/day
Electricity99.2 MWe
Oxygen6.24 kg/s
High Temperature Steam Electrolysis
AFR 100 @ 250 MWt
Super-Critical CO2 Brayton
Nuclear ProcessHeat
21.7 MWt
Water82.1 kg/s
Hydrogen0.727 kg/s
CO2 Emitted0 ton/day
Electricity91.7 MWe
Oxygen5.77 kg/s
(a)
(b)
(c)
Figure 11. General energy and product flows for AFR-100 integration with HTSE using the analyzed power conversion cycles: (a) Supercritical Rankine, (b) Subcritical Rankine and (c) Supercritical CO2 Brayton.

16
Table 4. Hydrogen production summary.
Supercritical
Rankine Subcritical Rankine
S-CO2
Inputs 250 MWt AFR-100 1 1 1 Outputs Hydrogen (kg/s) 0.786 0.768 0.727 Hydrogen Production Efficiency 44.1% 43.1% 40.8% Power Cycle Thermal Efficiency 43.8% 42.7% 40.2% Oxygen (kg/s) 6.24 6.10 5.77 Utility Summary Total Power (MWe) 99.2 97.0 91.7 Electrolyzer 97.1 95.0 89.8 Pumps 0.0826 0.0808 0.0764 Circulator 0.194 0.189 0.179 Topping Heaters 1.71 1.67 1.58 Power Needed for HTSE Cooling 0.0480 0.0468 0.0457 Process Heat Total Process Heat (MWt) 23.5 22.9 21.7 Water Consumption Total Water (kg/s) 72.8 73.8 82.1 Make-Up Cooling Water for Power Conversion Unit 60.6 61.9 70.4 Make-Up Cooling Water for Electrolysis Process 5.05 4.93 5.06 Water Consumed by Electrolysis 7.12 6.96 6.58 CO2 Emissions Emitted (ton/day CO2) 0 0 0
The HTSE process requires the feed mixture of steam and recycled hydrogen to be heated to approximately 800C, which necessitates additional topping heat from an auxiliary heat source. This heat source could derive from a combustor, electric heating, or waste heat from a neighboring process. This assessment assumes that topping heat is provided by 1.6 to 1.7 MW electrical heating. The hydrogen product is approximately 99.1% pure with residual water vapor. The corresponding oxygen byproduct is also 99.1% pure with residual water vapor.
In convention with prior HTSE assessments, the hydrogen production efficiency for this process is defined as the higher-heat value (HHV) of the product hydrogen divided by the HHV of feed gas and other thermal energy input into the processes. In this case, the input energy is the sum of thermal value of the feed streams, the process heat input from the AFR-100, and the thermal equivalent of the electric power used for topping heat and the SOEC since steam is already in its base oxidation stream. The HTSE case has an overall efficiency of 41 to 44%, which, as expected, is very close to the efficiency for electrical power production. Standard electrolysis of water typically is less than 25% efficient.
2.3 Methanol Production Plant
2.3.1 Adaptation of the conventional methanol process
Methanol production in the U.S. is largely based on the chemistry of reacting CO and CO2 with H2 in a catalyst reactor. A simple block diagram illustrates the steps of converting natural gas to methanol, which subsequently can be converted into fuels or higher value chemicals through additional chemical processing plants.

17
Figure 12. Steps for converting natural gas to methanol. The center section of the diagram (outlined in blue) is further described in Figure 13.
A synthesis gas mixture (or syngas) is adjusted to achieve a molar ratio (M) of 2.10, as calculated by the following expression:
M = (H2-CO2)/(CO + CO2).
The conventional methanol process starts with reforming natural gas using steam to make syngas (see Figure 12(a), Figure 13). A feed mixture of steam and natural gas is heated to approximately 540 °C prior to entering a primary reformer that operates at 740 C for partial conversion of the methane to syngas. A natural gas-fired process heater is used to first heat the primary reformer and then to preheat the steam-methane feed mixture through a series of counter-current heat exchangers. The partially reformed effluent of the primary reformer enters a secondary reformer where it reacts with pure oxygen to generate internal chemical reactor temperatures up to 1040 °C. Excess steam is used to control free carbon formation and deposition in the process and downstream gas feed line. These conditions also convert nearly all of the methane to syngas. The pure oxygen is obtained from a dedicated air separation plant.
The hot secondary reformer effluent gas is used to generate steam at three successively lower pressure levels. The steam is distributed and used throughout the plant at several pressure levels; for instance, in heaters and distillation column reboilers, and for process needs, including production of steam that is blended with the natural gas feed to the reformers. Excess steam from the methanol process is generally collected and heated in a custom heat recovery and steam generation unit (HRSG) to supply steam turbines that produce electricity to power the plant auxiliary loads. The conventional steam-methane reforming process can readily substitute heat provided by a high-temperature nuclear reactor for some, if not most, of the indirect heat that is currently provided by natural gas combustion. The case for this integration was previously modeled for the fluoride salt-cooled high temperature reactor (FHR) and the high temperature gas-cooled reactor (HTGR) SMR concepts (Bragg-Sitton, et al., 2013). However, the outlet temperature of the AFR is not sufficient to provide significant benefit in raising the reformer feed stream to 740 C. Therefore, an alternative beneficial integration scheme is needed.
By redesigning the conventional steam reforming process, as shown in Figure 13(b), an opportunity to use lower temperature process heat provided by the AFR is possible. In this case,
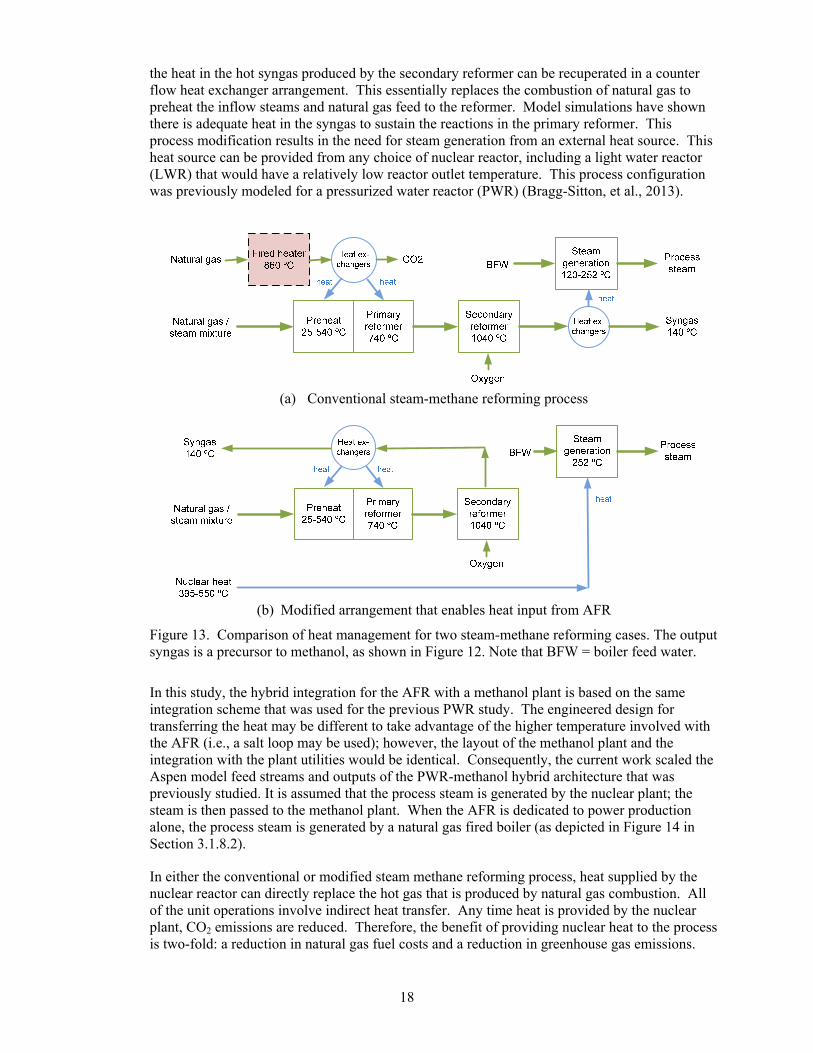
18
the heat in the hot syngas produced by the secondary reformer can be recuperated in a counter flow heat exchanger arrangement. This essentially replaces the combustion of natural gas to preheat the inflow steams and natural gas feed to the reformer. Model simulations have shown there is adequate heat in the syngas to sustain the reactions in the primary reformer. This process modification results in the need for steam generation from an external heat source. This heat source can be provided from any choice of nuclear reactor, including a light water reactor (LWR) that would have a relatively low reactor outlet temperature. This process configuration was previously modeled for a pressurized water reactor (PWR) (Bragg-Sitton, et al., 2013).
(a) Conventional steam-methane reforming process
(b) Modified arrangement that enables heat input from AFR
Figure 13. Comparison of heat management for two steam-methane reforming cases. The output syngas is a precursor to methanol, as shown in Figure 12. Note that BFW = boiler feed water.
In this study, the hybrid integration for the AFR with a methanol plant is based on the same integration scheme that was used for the previous PWR study. The engineered design for transferring the heat may be different to take advantage of the higher temperature involved with the AFR (i.e., a salt loop may be used); however, the layout of the methanol plant and the integration with the plant utilities would be identical. Consequently, the current work scaled the Aspen model feed streams and outputs of the PWR-methanol hybrid architecture that was previously studied. It is assumed that the process steam is generated by the nuclear plant; the steam is then passed to the methanol plant. When the AFR is dedicated to power production alone, the process steam is generated by a natural gas fired boiler (as depicted in Figure 14 in Section 3.1.8.2).
In either the conventional or modified steam methane reforming process, heat supplied by the nuclear reactor can directly replace the hot gas that is produced by natural gas combustion. All of the unit operations involve indirect heat transfer. Any time heat is provided by the nuclear plant, CO2 emissions are reduced. Therefore, the benefit of providing nuclear heat to the process is two-fold: a reduction in natural gas fuel costs and a reduction in greenhouse gas emissions.

19
In the conventional methanol plant (Figure 13a), various grades of surplus steam are superheated in a heat recovery/steam generation (HRSG) unit. This high temperature steam is then used to produce power for the plant auxiliary equipment loads- such as compressors and pumps. The proposed plant configuration shown in Figure 13b does not result in excess steam. Consequently, electrical power must be imported from the grid to supply the electrical power required to operate the methanol plant for this case. Alternatively, the necessary electrical power can be provided by the nuclear reactor. In this study, it is assumed that AFR constantly supplies the essential electricity to the methanol plant. This results in the need to install a larger AFR that is capable of supplying up to 100 MWe to the grid while also servicing the methanol plant loads. Hence, the case for the methanol plant integration requires a larger SMR than the case for the HTSE integration.
By supplying nuclear-generated electrical power to the methanol plant, carbon dioxide emissions are lower than the integration scenarios previously modeled for the FHR and HTGR. Additionally, while the AFR is similar to the PWR integration case, the main advantage of the AFR is a higher power generation efficiency that is achieved by the higher outlet temperature of the AFR. Thus, a smaller AFR is needed compared to the previously studied PWR integration.
In summary, the present AFR integration scheme results in decreased GHG emissions by avoiding the natural gas fired heat recovery and steam generation unit. It also reduces the capital cost of the methanol plant through elimination of this unit and the power generation battery in a standard methanol production plant (Figure 13a). The complete ramifications of these cost-benefit trade-offs is beyond the scope of the present study, and will be addressed in a related exergy study of the system. An exergy study could also help assess the relative merits of the various classes of SMR integration with the alternative methanol plant configurations.
2.3.2 Operation to Counterbalance Wind Generation Variability
The proposed AFR integration with the methanol plant is accomplished by fixing the size of the methanol plant on a scale that can utilize the nuclear thermal energy that is available when the wind-generation electricity is produced at any instant. When the wind farm is operating at its maximum capacity of 30 MWe, 69 MWt of additional heat is made available from the AFR-100 to be used by the methanol plant. In order to avoid turning down methanol production when this thermal energy is required for electricity production (e.g. at times of low wind input), a natural gas-fired boiler may be employed to provide the necessary steam and process heat. Natural gas boilers, along with a steam accumulator, will facilitate a smooth transition between the heat/steam provided by the AFR. The capital cost of a natural gas boiler is not substantial.
The proposed method of AFR integration results in a simple control scheme in which the natural gas boiler is dynamically adjusted in concert with wind power generation. As wind power is generated, thermal energy from the nuclear plant is proportionally diverted to the methanol plant. The natural gas boiler is thus modulated to balance the steam duty. An analysis of the dynamic load-balancing and thermal energy transfer is beyond the scope of this effort, but can be addressed through dynamic systems modeling.

20
3. FINANCIAL PERFORMANCE
3.1 Study Methodology and Scope
In order to assess the financial performance of AFR hybrids, it is necessary to define the methodology and scope under which they will be compared to alternatives. Similar to previous work, the goal of this analysis is to assess the value of hybridized energy systems featuring the AFR-100 sodium-cooled fast spectrum reactor with respect to other hybridized and non-hybridized energy systems. Comparative cases were selected for the present work, allowing a complete understanding of the value of the AFR hybridized system, as well as hybridized systems in general, to be reached. The applied economic evaluation closely matches that of previous work (Lee, Gribik, Maio, McKellar, Patterson, & Wood, 2010). Prior to discussing the analysis techniques, it is necessary to remind the reader of the energy system configurations that were introduced in section 1:
A. SISO
Single-Input/Single-Output (SISO) systems are the most common form of energy system present today. They represent systems that produce a single product using a single energy source, such as typical coal and nuclear plants. The current energy grid represents a network of SISO systems that operate independently to meet the grid demand. Independent systems can be impacted by one another based on how the generation from each system is accepted on the grid. For instance, if renewable-generated electricity is considered "must-take" on the grid, then other baseload SISO systems, such as a nuclear plant, may be required to reduce output to accommodate the renewable input. This scenario is represented by case 1b in the discussion below.
B. MISO
Multi-Input/Single-Output (MISO) systems include a secondary energy source within an integrated system. An example of this is a nuclear plant operating in parallel with a wind farm to produce electricity. This configuration differs from the previous scenario because the integration of the wind and nuclear subsystems occurs behind the electrical grid. When the wind farm produces electricity, the nuclear plant is still forced to turn down its energy production or sell its energy at a reduced rate to allow acceptance to the electric grid. In this configuration the available thermal energy would not be optimally used.
C. MIMO
Multi-Input/Multi-Output (MIMO) systems would integrate two or more input energy sources to produce two or more output commodities, one of which is electricity. An example of this system is a nuclear reactor that is integrated with a renewable energy system, such as a wind farm, to produce both a chemical product and electricity. When the wind farm produces electricity, the thermal output and/or electricity generation from the nuclear reactor can be reapportioned to a chemical production plant to achieve a higher overall system efficiency and a greater financial benefit through the production of multiple commodities.
The present work attempts to evaluate the relative value of MIMO versus SISO and MISO systems. Several cases have been analyzed using the methods and assumptions discussed below. The results and parameters for these cases—which focus on communicating relative financial significance rather than absolute financial significance—are provided in section 3.2 and are in accordance with previous work (Bragg-Sitton, et al., 2013).
3.1.1 Financial Figures of Merit
To allow sufficient comparison to prior work, the analysis tools were not changed. Specifically, the indices selected as financial figures-of-merit are the Net Present Value (NPV) ranking and the Internal Rate of Return (IRR) ranking. The reasons for these selections are as follows:
21
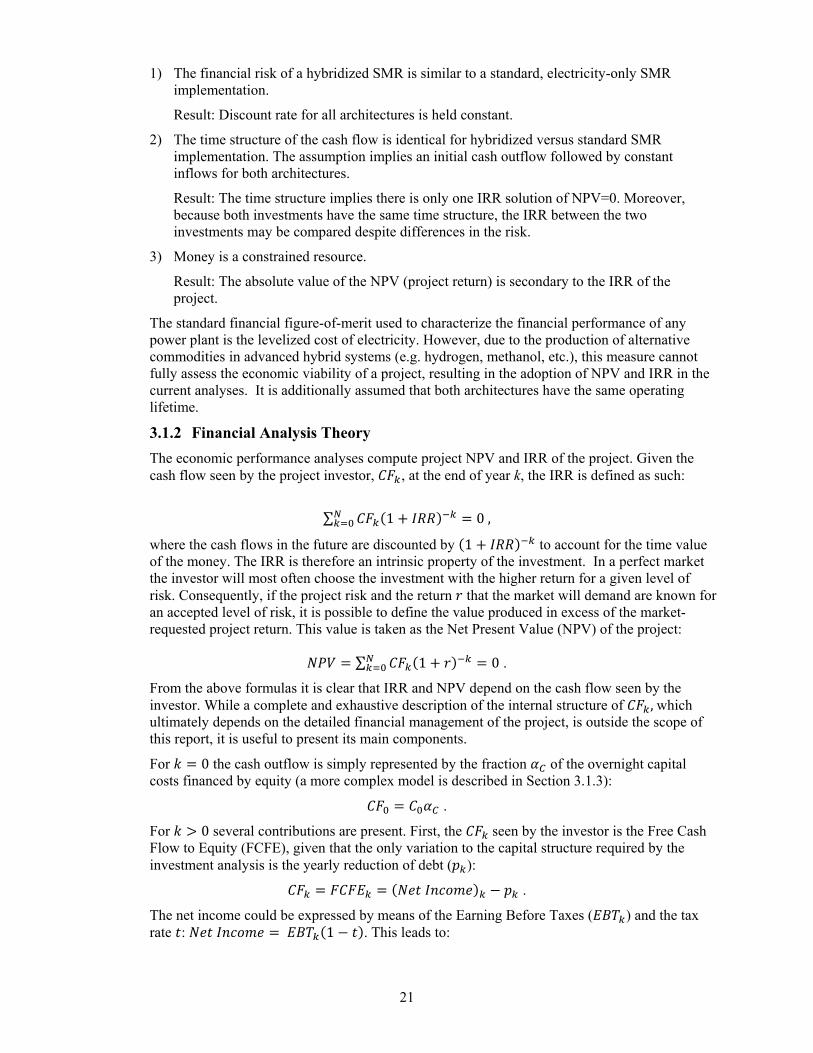
1) The financial risk of a hybridized SMR is similar to a standard, electricity-only SMR implementation.
Result: Discount rate for all architectures is held constant.
2) The time structure of the cash flow is identical for hybridized versus standard SMR implementation. The assumption implies an initial cash outflow followed by constant inflows for both architectures.
Result: The time structure implies there is only one IRR solution of NPV=0. Moreover, because both investments have the same time structure, the IRR between the two investments may be compared despite differences in the risk.
3) Money is a constrained resource.
Result: The absolute value of the NPV (project return) is secondary to the IRR of the project.
The standard financial figure-of-merit used to characterize the financial performance of any power plant is the levelized cost of electricity. However, due to the production of alternative commodities in advanced hybrid systems (e.g. hydrogen, methanol, etc.), this measure cannot fully assess the economic viability of a project, resulting in the adoption of NPV and IRR in the current analyses. It is additionally assumed that both architectures have the same operating lifetime.
3.1.2 Financial Analysis Theory
The economic performance analyses compute project NPV and IRR of the project. Given the cash flow seen by the project investor, , at the end of year k, the IRR is defined as such:
∑ 1 0,
where the cash flows in the future are discounted by 1 to account for the time value of the money. The IRR is therefore an intrinsic property of the investment. In a perfect market the investor will most often choose the investment with the higher return for a given level of risk. Consequently, if the project risk and the return that the market will demand are known for an accepted level of risk, it is possible to define the value produced in excess of the market-requested project return. This value is taken as the Net Present Value (NPV) of the project:
∑ 1 0 .
From the above formulas it is clear that IRR and NPV depend on the cash flow seen by the investor. While a complete and exhaustive description of the internal structure of ,which ultimately depends on the detailed financial management of the project, is outside the scope of this report, it is useful to present its main components.
For 0 the cash outflow is simply represented by the fraction of the overnight capital costs financed by equity (a more complex model is described in Section 3.1.3):
.
For 0 several contributions are present. First, the seen by the investor is the Free Cash Flow to Equity (FCFE), given that the only variation to the capital structure required by the investment analysis is the yearly reduction of debt ( ):
.
The net income could be expressed by means of the Earning Before Taxes ( ) and the tax rate : 1 . This leads to:
22
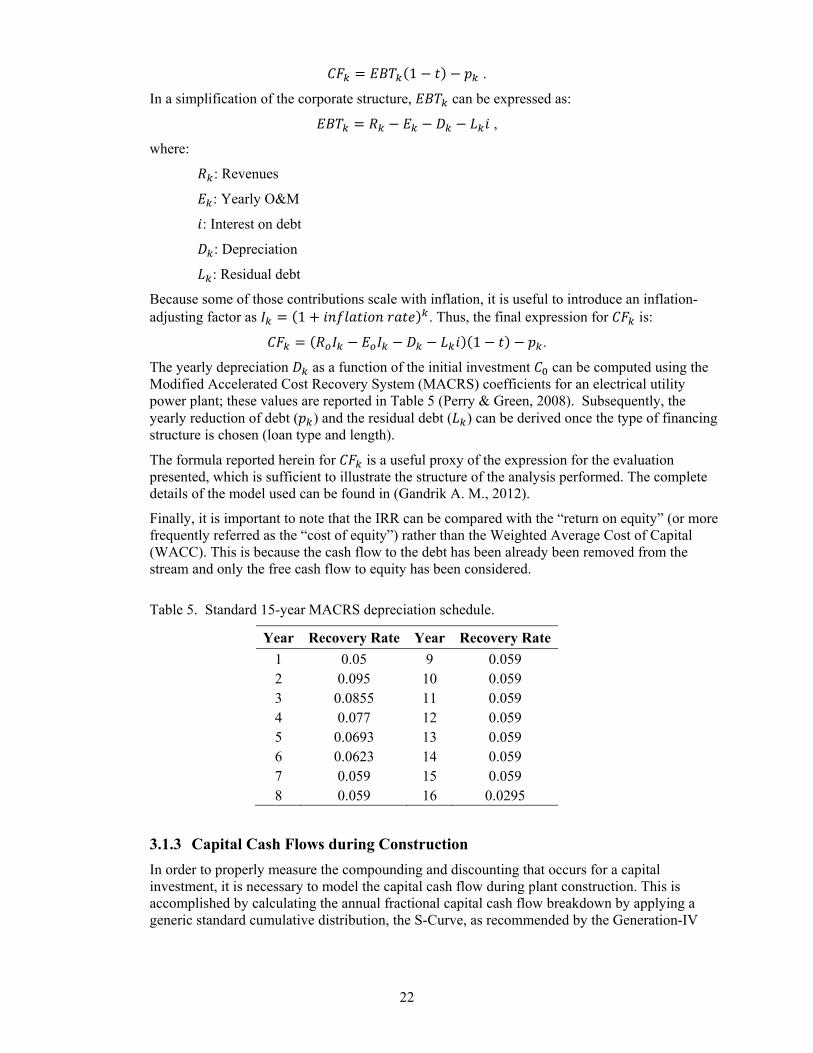
1 .
In a simplification of the corporate structure, can be expressed as:
,
where:
: Revenues
: Yearly O&M
: Interest on debt
: Depreciation
: Residual debt
Because some of those contributions scale with inflation, it is useful to introduce an inflation-adjusting factor as 1 . Thus, the final expression for is:
1 .
The yearly depreciation as a function of the initial investment can be computed using the Modified Accelerated Cost Recovery System (MACRS) coefficients for an electrical utility power plant; these values are reported in Table 5 (Perry & Green, 2008). Subsequently, the yearly reduction of debt ( ) and the residual debt ( ) can be derived once the type of financing structure is chosen (loan type and length).
The formula reported herein for is a useful proxy of the expression for the evaluation presented, which is sufficient to illustrate the structure of the analysis performed. The complete details of the model used can be found in (Gandrik A. M., 2012).
Finally, it is important to note that the IRR can be compared with the “return on equity” (or more frequently referred as the “cost of equity”) rather than the Weighted Average Cost of Capital (WACC). This is because the cash flow to the debt has been already been removed from the stream and only the free cash flow to equity has been considered.
Table 5. Standard 15-year MACRS depreciation schedule.
Year Recovery Rate Year Recovery Rate
1 0.05 9 0.059 2 0.095 10 0.059 3 0.0855 11 0.059 4 0.077 12 0.059 5 0.0693 13 0.059 6 0.0623 14 0.059 7 0.059 15 0.059 8 0.059 16 0.0295
3.1.3 Capital Cash Flows during Construction
In order to properly measure the compounding and discounting that occurs for a capital investment, it is necessary to model the capital cash flow during plant construction. This is accomplished by calculating the annual fractional capital cash flow breakdown by applying a generic standard cumulative distribution, the S-Curve, as recommended by the Generation-IV

23
International Forum (GIF) (GIF, 2007). The capital breakdown per month, , is calculated as follows:
0.5 ∗ sin∗
_1 1 ,
where is the current month in the plant construction period and _ is the total number of months in the plant’s construction period. The capital fraction for each year is calculated by summing the capital fraction for the corresponding months.
3.1.4 Financial Analysis Parameters and Key Assumptions
The relevant parameters applied in the current financial analysis are summarized in Table 6. These values were selected based on previous work, as reported in (Bragg-Sitton, et al., 2013).
Table 6. Assumed Economic Input Parameters used in Financial Analysis
Parameter Value
Federal Tax Rate 35% State Tax Rate 6% Overall Tax Rate 38.9% Annual Inflation Rate 3% Economic Life 30 yearsDebt/Equity Ratio 50% Interest Rate on Debt 8% Repayment Term 15 yearsReactor Construction Period 3 years Startup Time 1 year Plant Availability (nuclear and chemical)
90%
3.1.5 Capital Cost Estimation for the AFR-100 and Wind Farm
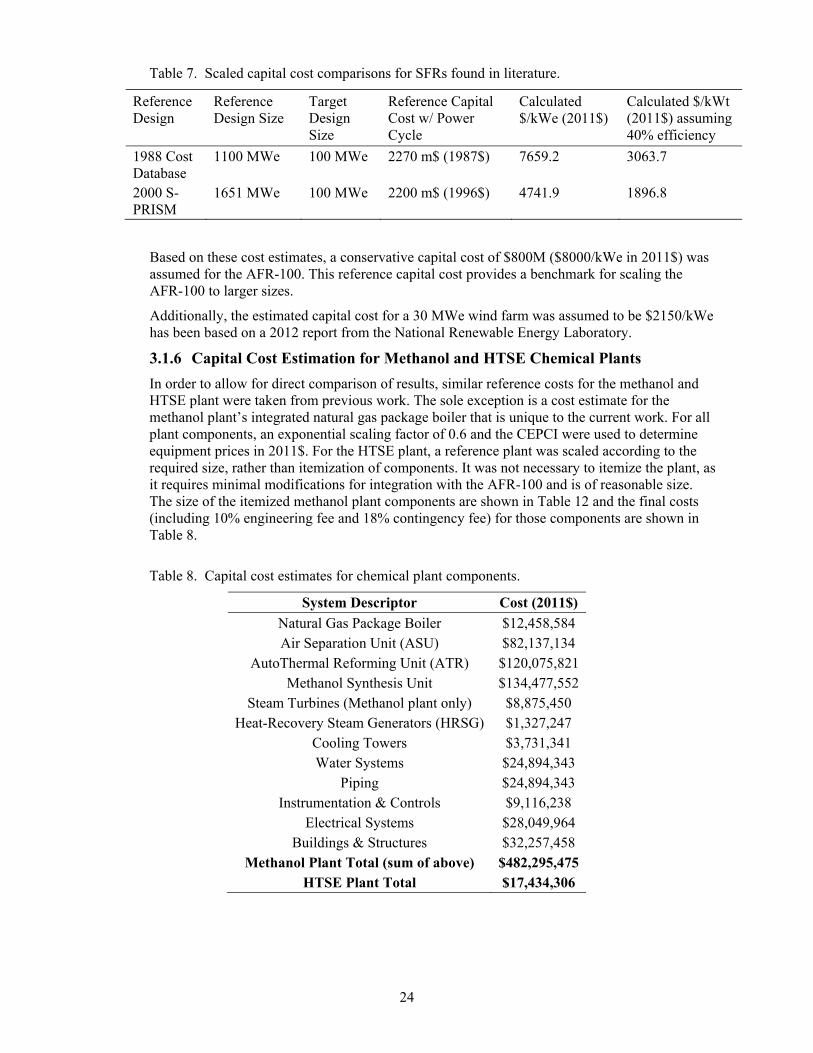
A literature review of the capital costs for Sodium Fast Reactors (SFRs) was conducted to estimate a reasonable capital cost for the AFR-100. Applicable cost numbers were difficult to obtain due to the small number of studies that have been completed, particularly recent studies. The most complete estimate for SFRs was found in the 1988 Department of Energy (DOE) Nuclear Energy Cost Database (Delene, Williams, & Shapiro, 1988). The 1988 Cost Database numbers for SFRs (called the liquid metal reactor [LMR] in the cited report) were in 1987$ and based on a single reactor module with an 1100 MWe power rating. The next applicable cost estimate was found in a 2000 International Conference on Nuclear Energy presentation on the S-PRISM (Super-Power Reactor Innovative Small Module) SFR developed by General Electric (GE) (Boardman 2000). The numbers presented for the S-PRISM SFR were in 1996$ and based on a twin reactor module with a 1651 MWe power rating. Both documents break their costs down to capital and O&M components; however, the 1988 Cost Database also lists scaling exponents for specific capital cost components.
To allow determination of reasonable capital cost estimates, the two referenced estimates were scaled to the desired reactor size and applicable 2011$ values using the Chemical Engineering Plant Cost Index (CEPCI) and an exponential scaling factor of 0.7. The result of this adjustment is shown in Table 7.
24
Table 7. Scaled capital cost comparisons for SFRs found in literature.
Reference Design
Reference Design Size
Target Design Size
Reference Capital Cost w/ Power Cycle
Calculated $/kWe (2011$)
Calculated $/kWt (2011$) assuming 40% efficiency
1988 Cost Database
1100 MWe 100 MWe 2270 m$ (1987$) 7659.2 3063.7
2000 S-PRISM
1651 MWe 100 MWe 2200 m$ (1996$) 4741.9 1896.8
Based on these cost estimates, a conservative capital cost of $800M ($8000/kWe in 2011$) was assumed for the AFR-100. This reference capital cost provides a benchmark for scaling the AFR-100 to larger sizes.
Additionally, the estimated capital cost for a 30 MWe wind farm was assumed to be $2150/kWe has been based on a 2012 report from the National Renewable Energy Laboratory.
3.1.6 Capital Cost Estimation for Methanol and HTSE Chemical Plants
In order to allow for direct comparison of results, similar reference costs for the methanol and HTSE plant were taken from previous work. The sole exception is a cost estimate for the methanol plant’s integrated natural gas package boiler that is unique to the current work. For all plant components, an exponential scaling factor of 0.6 and the CEPCI were used to determine equipment prices in 2011$. For the HTSE plant, a reference plant was scaled according to the required size, rather than itemization of components. It was not necessary to itemize the plant, as it requires minimal modifications for integration with the AFR-100 and is of reasonable size. The size of the itemized methanol plant components are shown in Table 12 and the final costs (including 10% engineering fee and 18% contingency fee) for those components are shown in Table 8.
Table 8. Capital cost estimates for chemical plant components.
System Descriptor Cost (2011$)
Natural Gas Package Boiler $12,458,584 Air Separation Unit (ASU) $82,137,134
AutoThermal Reforming Unit (ATR) $120,075,821 Methanol Synthesis Unit $134,477,552
Steam Turbines (Methanol plant only) $8,875,450 Heat-Recovery Steam Generators (HRSG) $1,327,247
Cooling Towers $3,731,341 Water Systems $24,894,343
Piping $24,894,343 Instrumentation & Controls $9,116,238
Electrical Systems $28,049,964 Buildings & Structures $32,257,458
Methanol Plant Total (sum of above) $482,295,475 HTSE Plant Total $17,434,306

25
3.1.7 Manufacturing Cost Estimation for the AFR-100
Manufacturing costs for the AFR-100 Hybrid Energy System were separated into two main categories: one for nuclear-related energy generation costs and one for chemical manufacturing cost, as summarized in Table 9. For nuclear related energy generation costs, the three main contributors are the Operations and Maintenance Costs (O&M), nuclear fuel costs, and decommissioning sinking fund payment costs.
Table 9. Manufacturing costs used in the models.
Specific Cost Value
Nuclear-Related Energy Generation Costs Reactor Operations and Maintenance $12.05/MWt-hr
Nuclear Fuel $8.53/MWt-hr Decommissioning ($/MWt-hr) $0.14/MWt-hr
Chemical Plant-Related Costs
Natural Gas (used in methanol plant) $6.50/MMBTUWastewater Treatment $0.38/m3
Makeup Water Treatment $0.0079/m3 Zinc Oxide $10918.73/m3
HDS Catalyst $16378.09/m3 Primary Reforming Catalyst $27296.82/m3
Secondary Reforming Catalyst $23657.24/m3 Methanol Catalyst $27296.82/m3
Water Usage $.013/m3 HTSE Cell Replacement $0.077/kg of H2
CO2 Emission Tax $55.12/MT
The assumed cost of natural gas is higher than present (fiscal year 2014) wholesale market prices. EIA projections suggest that natural gas will rise to between between $6-8 per Million British Thermal Units (MMBTU) by 2035. Therefore, the average cost of $6.50 per MMBTU seems reasonable for a project that begins operation by 2025.
Determination of manufacturing costs was different for each non-electric application studied depending on the feed source and the method of production. For methanol production, the majority of costs derive from the natural gas feed source and wastewater treatment. For HTSE, the majority of costs derive from cell replacement and maintenance costs.
3.1.8 Commodity Pricing
The pricing of commodities used in the calculations has a high impact on the estimated plant performance. These values are tabulated in Table 10. The assumed selling price of electricity is higher than the average retail market price of $0.10/kWe-hr. This value was selected to reflect both the possible selling price of electricity in the future and to be consistent with the “bid-in” price of wind and solar energy.

26
Table 10. Applied commodity prices.
Commodity Price
Electricity $0.12/kWe-hrMethanol $459.05/MT Hydrogen $2.50/kg Oxygen $75.52/MT Nitrogen $64.95/MT
3.1.9 Nuclear and Chemical Plant Scaling
The purpose of this report is to establish the value of integrating the AFR-100 with wind power generation to produce electricity and either hydrogen via HTSE or methanol via steam methane reforming and methanol synthesis. The integration in this study differs from earlier cases involving FHR and HTGR integration as follows:
1. The general design for the SMR integration studies nominally targets a nuclear reactor that can provide up to 100 MWe to the grid. In this study, three power cycles were evaluated, resulting in theoretical AFR-100 designs of slightly different thermal energy generation. Of these power cycles, the subcritical Rankine cycle was selected for integration with HTSE and methanol production. Thus, heat conveyance is performed with subcritical steam. This is in contrast with earlier integrations performed for the FHR and HTGR case studies, which conveyed heat using a helium working fluid (Bragg-Sitton, et al., 2013).
2. The performance of the SMR with wind integration depends on the power cycle efficiencies, which differ for each of the SMRs. The current work considers the static case in which the maximum electricity production by the wind farm is 30 MWe. The capital and operating cost of the wind turbines and the associated wind power revenues were included in the NVP and IRR calculations for this study. The capacity factor for the wind farm (~30%) is not addressed in the current study but should be included in future dynamic analyses.
3. HTSE integration depends on the heat integration scheme that optimizes the combination of heat recuperation, topping heat, and electrical input. The ratio of heat and electrical input varies according to power cycle efficiencies and associated excess thermal heat available when the SMR power generation is turned down from 100 MWe to 70 MWe. This heat integration also depends on the temperature of heat available from the SMR. In the present study, the size of the SMR and HTSE were scaled as necessary to establish constant reactor thermal output while maintaining 100 MWe to the grid at all times via combination of all available input sources (e.g. wind and nuclear).
4. Integration with the methanol plant depends on the temperature level of heat associated with the SMR, which impacts the heat integration scheme. Additionally, this study assumes constant output by the methanol plant, using natural gas heaters to make up the steam or hot gas that is not available when the SMR is dedicated to power production.
As a result of these assumptions, the detailed view of the AFR-100 system integration does not allow for direct comparison with previous work (Bragg-Sitton, et al., 2013). However, various scaling factors were applied to the AFR-100 to take advantage of the previous detailed Aspen modeling that was completed for a PWR integration with a methanol plant. The scaling constraints are described below.

27
3.1.9.1 Scaling Constraint: Constant Grid Electricity Production
The first scaling constraint requires the system to produce 100 MWe for the grid at all times. This implies that the nuclear reactor must be able to turn down its electricity output to the grid according to the size of the integrated wind farm, in this case, 30 MWe. When reduction in wind energy generation occurs, energy that was previously directed to the chemical process must be redistributed to the electric grid.
3.1.9.2 Scaling Constraint: Chemical Process Turn-Down and Plant Size
The second scaling constraint depends on the coupled process that allows for reapportioning of nuclear-generated energy when it is not required to meet grid demand. In the case of methanol plant integration, the unit operations are difficult to cycle. Material constraints and complex plant material and energy integration flows can take many hours, or even days, to start up and stabilize. Additionally, the cash flow for the methanol plant essentially requires that the plant operate near its nameplate capacity at all times. These constraints are met by assuming that natural gas heaters will be used to provide the heat and steam when necessary to maintain plant operation at full capacity. When heat is available from the AFR, the natural gas burners are modulated accordingly. This type of a system represents a process where multiple energy inputs flexibly produce multiple outputs commodities (MIMO). Figure 14 differentiates the variable and constant energy and product flows for this hybrid process.
In the case of hydrogen (HTSE) plant integration, turn down of plant production is technically and economically feasible. The electrolysis cells can be held in hot standby and will respond nearly instantaneously to coordinated steam and electricity input. The capital cost of the electrolysis cells is relatively low, which obviates the need to run HTSE full time. Thus, a third input energy source is not required for this system. The driver for the size of the HTSE plant is only dependent on the total amount of energy that can be diverted when wind energy is available to meet grid demand. This system is depicted in Figure 15.

28
Figure 14. MIMO nuclear hybrid energy system depicting wind energy and methanol production integration.
Figure 15. MIMO nuclear hybrid energy system depicting wind energy and hydrogen production integration.
WindVariable Output
Nuclear ReactorConstant Output
Natural GasVariable Output
Thermal EnergyVariable
Electrical EnergyVariable
Methanol Plant – Electrical RequirementConstant
Methanol Plant – Thermal RequirementConstant
Methanol Market
Constant Production
Electric GridConstant Production
WindVariable Output
Thermal EnergyVariable
Electrical EnergyVariable
HTSE – Electrical RequirementVariable
HTSE – Thermal RequirementVariable
Electric GridConstant Production
Hydrogen Market
Variable Production
Nuclear ReactorConstant Output

29
3.1.9.3 Scaling Constraint: Nuclear Process Turn-Down and Plant Size
The hybrid system analyses all assume that nuclear reactor thermal energy production remains constant at all times. Thus, the nuclear reactor plant size is driven by the required electricity production when no wind-generated electricity is available. In the case of integration with HTSE, the HTSE production is scaled according to the energy available when wind offsets the demand for nuclear power generation. The energy from the nuclear plant is then apportioned between electrical power to the grid and combined electrical power and heat to the HTSE.
The methanol plant integration case requires a constant amount of electricity to support needs within the methanol plant. Therefore, the nuclear reactor must be scaled to provide 100 MWe to the grid (when wind-generation is zero) plus the electricity required by the methanol plant. This condition is necessary to maintain steady operation of the methanol plant at all times, resulting in a higher thermal power AFR than is required for the HTSE integration.
3.1.9.4 Scaling Constraint: Nuclear Hybrid Energy System Architecture
The final scaling constraint on the system is the architecture itself. In the case of a fully augmentable architecture, each plant may allocate energy differently in the system – especially for more complicated chemical plant integrations such as methanol. However, in the present work, two plant architectures are defined for analysis: one to represent HTSE integration with the AFR-100 and one to represent methanol integration with the AFR-100, scaled up to provide the constant electrical input to the methanol plant.
For the methanol case, the selected plant architecture selected was initially designed for application in a PWR hybrid energy system. Two primary changes were made: (1) a natural gas package boiler was included to provide thermal energy makeup when the nuclear reactor thermal energy is unavailable and (2) scaling was introduced to prevent reactor thermal energy from being delivered to the chemical plant when grid demand is met fully by the nuclear reactor (100 MWe; wind generation of zero) (Bragg-Sitton, et al., 2013). The equipment and utility loads for the AFR integration are derived from the detailed PWR-methanol Aspen model simulations, as shown in Tables 11 and 12.
Since the methanol plant architecture was operated in a variable manner in the PWR case (without the use of natural gas boiler makeup, the methanol plant could not be maintained at 100%), the utility loads for two plant scales provided a linear scaling formula for the present AFR-methanol integration. The Reference #1 case in Table 11 corresponds to 100 MWe provided by the PWR to the grid (no contribution from wind generation), resulting in a turn-down of the methanol plant by just over 50% without input from wind. The Reference #2 case corresponds to conditions in which 30 MWe is provided by wind generation and 70 MWe is provided by PWR nuclear generation to meet the 100 MWe grid demand, allowing for increased methanol production. The Derived AHR-integrated methanol case is then represented by the right-hand column; these values correspond to the AFR-integrated methanol plant as modeled in Aspen. The modeled methanol plant equipment from the PWR case is referred to as simply Reference in Table 12, as the two cases correspond to different operating modes for the same plant. The PWR-methanol plant equipment was already scaled for maximum production (as for the Reference #2 case of Table 11); a standard scaling method was used for equipment sizing.

30
Table 11. Methanol Plant Variable Production Scaling. “Reference 1” and “Reference 2” correspond to the earlier PWR integration study; “Derived Plant” corresponds to the AFR case.
System Descriptor Reference #1 Reference #2 Derived Plant
Nuclear Plant Electric Output to Grid (MWe) 100 70 100
Nuclear Plant Thermal Output (MWt) 400 400 334
Methanol (MT/day) 1403 2915 3052
Nitrogen (MT/day) 2320 4817 5043
Air Separation Power (MWe) 11.5 24 25.13
Nat. Gas Reform. Power (MWe) 1.5 3.1 3.24
Fossil Power and Steam (MWe) (produced) 2.1 7.3 7.77
Methanol Power (MWe) 7.4 15.3 16.01
Water Treatment Power (MWe) 2.1 3.2 3.29
Required Process Heat Power (MWt) 32.3 67.1 70.26
Natural Gas (MMSCFD) 34.8 72.4 3052.19
Wastewater Treatment (1000-gal/day) 1080 1702 82.83
Makeup Water Treatment (1000-gal/day) 3074 4073 1758.44
Zinc Oxide (ft3/day) 0.18 0.37 4163.65
HDS Catalyst (ft3/day) 0.09 0.18 0.39
Primary Reforming Catalyst (ft3/day) 0.06 0.12 0.19
Secondary Reforming Catalyst (ft3/day) 0.04 0.08 0.13
Methanol Catalyst (ft3/day) 0.03 0.07 0.084
Table 12. Methanol Plant Equipment Scaling. “Reference” corresponds to the earlier PWR integration study; “Derived” corresponds to the AFR case.
System Descriptor Reference Derived
Air Separation Unit (ASU) (kg/hr) 56694 59362.5 AutoThermal Reforming Unit (ATR)
(m3) 2.04 x 10⁶ 2.12 x 10⁶
Methanol Synthesis Unit (MT/day Methanol)
2915 3052
Heat-Recovery Steam Generators (HRSG) (kg/hr Steam)
8029 8406
Cooling Towers (L/min Water) 336985 352846
For the HTSE hybrid case, the plant size was determined from the information presented in Section 2.2 of this report. The scaling values are shown in Table 13. Since the HTSE architecture has only been evaluated for the maximum power output case, all values for the HTSE case were scaled proportionally according to hydrogen output. Although a specific model for HTSE integration was developed for the AFR-100, it was necessary to scale it to accommodate wind integration. To do so, the necessary reactor size was first determined by the

31
total electrical output provided by the reactor when no electrical energy is displaced by wind (100 MWe). This reactor size was then used to determine the HTSE plant size that could be coupled to the plant when 30 MWe of nuclear-generated electricity is displaced by wind. The ratio of the thermal power available for HTSE between the Reference Case (plant design described in Section2.2) and the Derived Case (plant size used for economic analysis) was then used to determine the remaining attributes of the integrated HTSE plant.
Table 13. HTSE Production Scaling. “Reference” corresponds to the AFR/HTSE plant design presented in Section 2.2 of the current report. “Derived” corresponds to the AFR/HTSE plant size used for economic analysis.
System Descriptor Reference Derived
Nuclear Plant Thermal Power (MWt) 250 235.61 Nuclear Plant Thermal Power Available to HTSE (MWt) 250 70.68
Nuclear Plant Electric Power to HTSE (MWe) 96.98 27.42 Process Heat Required for HTSE (MWt) 9.82 2.64
Hydrogen Product (kg/s) 0.7684 0.22 Oxygen Product (kg/s) 6.098 1.72
Water Required for HTSE (kg/s) 11.89 3.36 Nuclear Plant Tertiary Cooling Water (kg/s) 68.19 64.26
Nuclear Plant Tertiary Cooling Water Required for HTSE (kg/s) 61.94 58.37
3.2 Study Results
A series of cases was progressively analyzed to assess the value of hybridized energy systems featuring the AFR-100 Sodium Fast Reactor with respect to other hybridized and non-hybridized energy systems. Thus, the present work includes a number of comparative cases to clearly identify the value of system hybridization.
The selected cases are summarized in Table 14. The case numbers listed on the left-hand side serve to organize each case into families according to their purpose. The purpose of each case family and its impact to the understanding of energy systems are described below. The calculated IRR is included in this summary table to provide a snapshot of the final results. Additional details are included in the results provided in Tables 15-20.
To group the selected cases even further, Case sets 1-3 are presented in detail in Table 15. All cases presented in Table 15 are Single-Input/Single-Output (SISO), in which the AFR is only required to produce electricity.
Case 1a presents a scenario where the nuclear power plant is operating at full electric power output. Case 1b is a variant of the SISO construct in which some other input source is connected to the grid directly (not integrated into the hybrid system) and is providing 30 MWe. This case reflects the current scenario in which baseload nuclear generation is required to turn down it capacity when wind generation is available to the grid. Its purpose is to provide a baseline for comparison to the other cases evaluated in this study.
Cases 2a – 2e evaluate the impact of the selling price of electricity over the range of $0.08 to $0.16 per kWe-h. The results are plotted in Figure 16 to illustrate the break-even IRR. Caution should be exercised when interpreting the outcome of this trend given the set of financial and project scales that have been selected for this study.

32
Cases 3a – 3c examine the trend of increasing reactor size from 100 MWe to 600 MWe using a single reactor module. The results are conveyed in Figure 17. The effect of economies of scale yields an increased IRR as the reactor electric power output is increased. Note that the scaling results will differ for one large reactor (assumed here) versus building multiple reactor units to achieve the same electric power production. The latter case requires additional study.
Table 14. List of Evaluated Cases: Single-Input and Multi-Input for Electricity Production
Case #
Integrated Subsystems Note: All configurations include the AFR-100 and Electricity Production
Subsystems Included in
Capital Cost
Subsystems Included in
Revenue
Price of Electricity (¢/kW-h)
Calculated IRR (%)
Wind HTSE Methanol 1a* -- -- -- N N 12 4.9 1b* -- -- -- N N 12 0.37
2a -- -- -- N N 8 -1.68 2b -- -- -- N N 10 2.04 2c -- -- -- N N 12 4.9 2d -- -- -- N N 14 7.31 2e -- -- -- N N 16 9.47
3a‡ -- -- -- N N 12 4.9 3b‡ -- -- -- N N 12 8.10 3c‡ -- -- -- N N 12 10.4
4a yes -- N, W N, W 12 4.92
5a -- -- yes N, M N, M 12 16.44 5b¢ yes -- yes N, W, M N, W, M 12 15.79 5c¢ yes -- yes N, W, M N, W, M 12 16.65 5d§ -- -- yes M M 12 36.97
6a¢ yes yes -- N, W, H N, W, H 12 4.06 6b¢ yes yes -- N, W, H N, W, H 12 7.62 N = Nuclear, W = Wind, M = Methanol, H = Hydrogen *Case 1a is just a nuclear plant supplying electricity to the grid; Case 1b assumes a “hybrid grid” in which an additional input source connected to the grid forces the nuclear plant to turn down power. ‡Cases 3a-3c vary the nuclear plant capacity. ¢Cases 5b, 5c, 6a, and 6b represent cases where wind does and does not contribute to electricity production with all other factors held constant. §Case 5d does not include electricity generation. This is a baseline case in which methanol production is driven purely by natural gas. Capital cost for the natural gas plant is included in the IRR calculation.

33
Table 15. List of Evaluated Cases: Single-Input and Multi-Input for Electricity Production
Case #
Price of Electricity (¢/kW-h)
Subsystems Included in Revenue
(MWe)
Subsystems Included in Capital Cost
(Yes or No)
Calculated CO2
Production (MT/day)
Calculated IRR (%)
Nuclear Wind Nuclear Wind 1a 12 100 0 Yes No 0 4.9 1b 12 70 0 Yes No 0 0.37
2a 8 100 0 Yes No 0 -1.68 2b 10 100 0 Yes No 0 2.04 2c 12 100 0 Yes No 0 4.9 2d 14 100 0 Yes No 0 7.31 2e 16 100 0 Yes No 0 9.47
3a 12 100 0 Yes No 0 4.9 3b 12 300 0 Yes No 0 8.10 3c 12 600 0 Yes No 0 10.4
Figure 16. Results from Case 2 evaluations, indicating the variation in the IRR as a function of electricity price for Single-Input/Single-Output cases (nuclear to electricity only).
-4
-2
0
2
4
6
8
10
12
6 8 10 12 14 16 18
IRR
(%
)
Selling Price of Electricity (¢/kW-h)

34
Figure 17. Results from Case 3 evaluations, demonstrating the increased IRR for larger single-unit nuclear plants (note that these results do not translate directly to the build of multiple lower power units to achieve the same total electric power).
Case 4, depicted in Table 16. a represents the closely coupled integration of the AFR and wind generation to produce a combined 100 MWe to meet grid demand. The purpose for calling out Case 4a specifically is to show that, relative to Cases 1a and 1b, the integration of wind within the system (creating a MISO system), recovers revenue that ordinarily would be lost when the plant is forced to turn down due to competition with wind-generated electricity on the grid.
Table 16. List of Evaluated Cases: Multi-Input for Electricity Production (MISO)
Case #
Price of Electricity (¢/kW-h)
Subsystems Included in Revenue
Subsystems Included in
Capital Cost
Calculated CO2
Production (MT/day)
Calculated IRR (%)
N (MWe)
W (MWe)
M (MT/day)
N W M
4a 12 70 30 0 Yes Yes No 433 4.92 N = Nuclear, W = Wind, M = Methanol
Cases 5a – 5d, presented in Table 17, are MIMO cases that consider various integration and operating options for integration of the AFR-100 and wind with methanol production. As was shown in case 1a, 5a results in a higher IRR when the wind plant is not integrated with the nuclear-methanol plant combination (single input scenario). However, Case 5c shows that integration with the methanol plant has prevented a large drop in IRR when wind displaces the electric power previously provided by the nuclear plant. The generally higher IRR value shown by Cases 5a -5c is explained by Case 5d, where the additional revenue from methanol results in higher overall plant revenue relative to the capital investment for the methanol plant.
Recall that the methanol cases differ from the hydrogen production cases in that the methanol plant is maintained at 100% capacity through the introduction of additional natural gas heating. This results in additional revenue from methanol production even when all of the nuclear generation is directed to
0
2
4
6
8
10
12
0 100 200 300 400 500 600 700
IRR
(%
)
Reactor Electric Power Output (MWe)

35
the grid electrical demand. Case 5d provides a baseline case in which only natural gas is used to drive the methanol plant (no wind or nuclear input) and no electricity is generated. This results in a high IRR but significantly higher CO2 production than when some of the reactor thermal energy is made available to the methanol plant. For the HTSE-integrated cases that will be discussed next, hydrogen is produced only when there is excess energy available from the nuclear plant when wind-generated electricity is available.
The value of nuclear/wind integration with methanol production is a substantial decrease in CO2 emissions. The current evaluation assumes a penalty of $50/ton of CO2 emitted. This illustrates the overall benefit of hybridization depending on total systems costs and benefits. Additionally, the case for hybridization is dependent on the selling price of electricity. When the market demand for electricity is low, the value of directing heat and electricity to the methanol plant will increase. Consideration of time value of products is left for future SMR hybrid assessment using dynamic analysis tools.
Table 17. List of Multi-Input/Multi-Output (MIMO) Evaluated Cases Featuring Integration with a Methanol Production Plant.
Case #
Price of Electricity (¢/kW-h)
Subsystems Included in Revenue
Subsystems Included in
Capital Cost (Yes or No)
Calculated CO2
Production (MT/day)
Calculated IRR (%)
N (MWe)
W (MWe)
M (MT/day)
N W M
5a* 12 100 0 3052.2 Yes No Yes 392.81 16.44 5b* 12 100 0 3052.2 Yes Yes Yes 392.81 15.79 5c 12 70 30 3052.2 Yes Yes Yes 22.92 16.65 5d* 12 0 0 3052.2 No No Yes 392.81 36.97
N = Nuclear, W = Wind, M = Methanol *Cases 5a, 5b and 5d are all supplemented by a natural gas plant for constant methanol production capacity.
The results relevant to previous FHR and HTGR integration evaluations are shown in Table 18, where Cases 1a and 1b provide base cases for comparison of methanol integration performance evaluated in Cases 5b and 5c. It can be seen that integration of the methanol plant greatly increases the calculated IRR; more importantly, it can be seen that integration of the methanol plant mitigates a drop in the calculated IRR when displacement from wind-generated electricity occurs. The negative Net Present Value displayed in Table 18 for Cases 1a and 1b is not of crucial concern, as the merit in the analyzed cases is in their relative financial figures of merit (as compared to one another) rather than the actual value calculated due to the large number of assumptions made in determining these results. However, the NPV for these cases is much lower than that of other cases, indicating that the investment is not worthwhile relative to an expected 8% return.

36
Table 18. AFR-100 methanol hybrid energy system economic modeling results for configurations producing both electricity and methanol. In all cases the total electricity production is constant at 100 MWe.
Analysis Case Case 1a Case 1b Case 5b Case 5c
Reactor Electric Output (MWe) 100 70 142.5 (100 sent to
grid)
112.5 (70 sent to
grid)
Wind Electric Output (MWe) 0 0 0 30
Reactor Thermal Output (MWt) 235.61 164.93 333.7 333.7
Natural Gas Boiler (MWt) 0 0 70.25 0
Methanol (MT/d) 0 0 3052.2 3052.2
Financial Indicators
NPV @ 8% Discount Factor (million $) -178.9 -383.5 1123.9 1259.7
Calculated IRR (%) 4.90 0.37 15.79 16.65
Capital Costs (million $) 767.5 767.5 1526.1 1526.1
Nuclear Reactor 767.5 767.5 979.3 979.3
Power Cycle (included in reactor capital cost)
Wind Turbines 0 0 64.5 64.5
Methanol Process 0 0 482.3 482.3
Manufacturing Costs (million $/yr) 38.5 33.9 281.1 259.2
Nuclear Reactor & Power Cycle 38.6 33.9 54.6 54.6
O&M 22.4 22.4 31.7 31.7
Fuel 15.9 11.2 22.5 22.5
Decommissioning Fund 0.3 0.3 0.4 0.4
Methanol Process 0 0 227.2 212.0
Direct Costs 0 0 206.9 191.8
Indirect Costs 0 0 20.2 20.2
Revenues (million $/year) 94.7 66.3 562.3 562.3
Electricity 94.7 66.3 94.7 94.7
Methanol 0 0 379 379
Nitrogen 0 0 88.62 88.62
Table 19 summarizes the outcome of nuclear-wind-HTSE-electricity hybrid plants taking the entire system capital investment into consideration (similar to Cases 5b and 5c for methanol integration). The production of hydrogen naturally increases the internal rate of return. When compared to Case 4a (nuclear-wind-electricity), it is evident that HTSE integration accomplishes its primary task in preventing a large drop in revenue when it has been displaced by wind electricity generation. Again, the current analysis does not consider the time-value of the price of electricity into consideration; the impact of variable pricing will be included in a future study using dynamic analysis tools. As discussed with respect to Table 18, the negative Net Present Value displayed in Table 20 for all cases is not of crucial concern, as the analyses are performed only to determine relative financial

37
significance. However, the NPV for these cases does signify that the investment is not of high worth relative to an expected 8% return. This result also serves to show the relatively low worth of hydrogen in comparison with methanol as a product given that the HTSE plant is operated only when excess thermal and electrical energy are available from the nuclear plant (when the wind-generated electricity is available) whereas revenue is available from the methanol plant at all times due to the additional feed from natural gas fired heaters to maintain the methanol plant at 100%.
Table 19. List of Multi-Input/Multi-Output (MIMO) Evaluated Cases Featuring Integration with a HTSE Plant
Case #
Price of Electricity (¢/kW-h)
Revenue Contribution through Production
Capital Cost Contribution (Yes or No)
Calculated CO2
Production (MT/day
Calculated IRR (%)
N (MWe)
W (MWe)
H (MT/day)
N W H
6a 12 100 0 0 Yes Yes Yes 0 4.06 6b 12 70 30 26.58 Yes Yes Yes 0 7.62
N = Nuclear, W = Wind, H = Hydrogen

38
Table 20. AFR-100 HTSE hybrid energy system economic modeling results for configurations producing both electricity and hydrogen via HTSE. In all cases the total electricity production is constant at 100 MWe.
Case 1a
Case 1b
Case 6a
Case 6b
Reactor Electric Output (MWe) 100 70 100 97.34 (70 sent to grid)
Wind Electric Output (MWe) 0 0 0 30
Reactor Thermal Output (MWt) 235.61 164.93 235.61 235.61
Hydrogen (MT/day) 0 0 0 26.58
Financial Indicators
NPV @ 8% Discount Factor (million $)
-178.9 -383.5 -240.9 -25.2
Calculated IRR (%) 4.90 0.37 4.06 7.62
Capital Costs (million $) 767.5 767.5 835.9 835.9
Nuclear Reactor 767.5 767.5 753.9 753.9
Power Cycle (included in reactor capital costs)
Wind Turbines 0 0 64.5 64.5
HTSE 0 0 17.4 17.4
Manufacturing Costs (million $/yr) 38.5 33.9 40 40.7
Nuclear Reactor & Power Cycle 38.6 33.9 38.5 38.5
O&M 22.4 22.4 22.4 22.4
Fuel 15.9 11.2 15.9 15.9
Decommissioning Fund 0.3 0.3 0.3 0.3
HTSE 0 0 1.5 2.2
Direct Costs 0 0 .75 1.4
Indirect Costs 0 0 .73 .7
Revenues (million/year) 94.7 66.3 94.7 91.9
Electricity 94.7 66.3 94.7 66.3
Hydrogen 0 0 0 21.8
Oxygen 0 0 0 3.8
39
4. CONCLUSIONS AND RECOMMENDATIONS Integration of an advanced, sodium-cooled fast spectrum reactor in nuclear hybrid energy system (NHES) architectures was the focus of the present study. Several power cycles were considered for integration with the Advanced Fast Reactor, including subcritical and supercritical Rankine cycles and a modified supercritical carbon dioxide modified Brayton cycle. All three power cycles were considered for electricity production and hydrogen production via high temperature steam electrolysis; only the subcritical Rankine cycle was considered for the cases that integrated methanol production. Based on the design parameters of the AFR-100 and the assumptions made for the analysis the following conclusions can be made:
The thermal efficiencies of all of the modeled power conversion units were above 40%. The supercritical Rankine cycle achieved the highest calculated efficiency at 43.8%, followed by the subcritical Rankine at 42.7% and the S-CO2 at 40.2%
The Rankine cycles have the lowest pressure at the condenser (7.4 kPa), which will necessitate large equipment. The S-CO2 system will, in general, have higher pressures throughout the cycle, reducing the physical equipment size.
The S-CO2 cycle could achieve a thermal efficiency of approximately 42% if the reactor inlet temperature is allowed to increase by 15°C, or if the minimum approach temperature at the low temperature end of the cycle intermediate heat exchanger is reduced by 15°C. Such a modification can be addressed via optimization of the reactor design in conjunction with the balance of plant.
A thermal efficiency of 42% was used for the chemical plant integration studies because two of the cycles either performed at that level or could potentially do so.
With a fixed AHR thermal output, the hydrogen production rate by HTSE is strongly dependent on the thermal efficiency of the power cycle. This is attributed to the electrical versus thermal duty of approximately 90% to 10%, respectively. Hydrogen production varies from 0.727 kg/s to 0.786 kg/s based on the power conversion unit integrated with the AFR-100 reactor.
The cost of electricity directly correlates with IRR, as expected given the relationship with revenue generation. This result suggests the opportunity to flexibly produce multiple energy services according to the highest market value of either electricity or chemicals. During periods of high electricity demand, the AFR-generated electricity would likely be bid onto the grid. During periods of low electricity demand, the electricity and heat generated by the AFR would be dispatched to the integrated chemical plant.
Based on a capital cost of $8,000/kWe installed, a positive IRR is realized when the selling price of electricity is greater than approximately $0.09/kW-h. This compares favorably to the current production cost of variable renewable power generations options (viz., http://www.nrel.gov/analysis/tech_lcoe.html).
The scale of AFR production correlates with higher IRR, as expected given the reduced capital investment per kW installed as plant sizes are increased. This may be realized by a) reducing the capital cost of the AHR based on manufacturing and permitting experience, b) building larger power units to reduce the capital cost per thermal unit production, or c) timely capital investments through phased construction of multi-module plants.
Integration of an AFR with a chemical plant increases the internal rate of return (IRR) when “must-take” wind-generated electricity is added to the energy system.
HTSE and methanol plant integration with a small modular AFR illustrate two models of hybridization with a chemical manufacturer in which the nuclear heat is dynamically modulated

40
between electricity generation and steam supply or process heating for the chemical plant. Through custom design of heat recuperation and heat exchangers, thermal energy can be dispatched from an AFR to augment chemical production. Both cases can accommodate variable heat and electricity supply.
Integration of an AFR with methanol production in the manner modeled in this report results in a significant reduction of CO2 emissions relative to standard methanol production methods. HTSE offsets CO2 emissions associated with conventional production of hydrogen using steam methane reforming. The U.S. market for hydrogen used for petroleum refining and fertilizer production currently uses about 13 million tons of hydrogen each year. Hydrogen production via HTSE and substitution of nuclear energy in the methanol industry could reduce the current total U.S. greenhouse gas emissions by 3-5%. Additionally, HTSE could produce hydrogen for peaking-power fuel cells or light-duty vehicles in the transportation sector.
HTSE represents a type of chemical manufacturing that involves a relatively small capital investment and, therefore, can economically be cycled up and down as energy is diverted from electricity production to the HTSE plant. HTSE is also capable of rapid cycling in response to the dynamic energy supply from the AFR. The IRR projections in this work could be increased if the AFR is dedicated to hydrogen production. This could be accomplished by building a larger AFR to service grid demand while maintaining a steady threshold of hydrogen generation. In this case, the surplus energy delivered to the HTSE plant during periods of wind power generation augments hydrogen production.
Methanol production represents a chemical plant that involves a large capital investment that should be utilized to the maximum extent possible. The unit operations in a methanol plant require long time periods to start up; therefore, it is not technically feasible to modulate the plant output. Consequently, an alternative heat supply source is needed to maintain steady operation when heat from the nuclear plant is not available. This can be conveniently and economically accomplished with natural gas heaters and steam boilers.
The NPV and IRR calculations presented in this study are based on case-specific assumptions and are not intended to discriminate hybrid options. The selection of preferred options will depend on several factors, including local and regional demand for energy services (i.e., electricity verses hydrogen or methanol), plant scale, duration of operations, and total wind penetration.
The current analysis of these hybrid system configurations leads to the following recommendations:
1. Accurate SMR capital and operating cost estimates are needed to increase the confidence level in the economic analysis. The present work relies on disparate and dated data in the open literature. A conservative cost of capital ($8,000/kWe-h) was used for the financial analyses. Detailed cost estimates based on manufacturing and construction costs for a selected SMR will also help identify areas for cost improvement.
2. Dynamic analysis of heat diversion from SMRs for HTSE or methanol production should be completed. These analyses must consider:
a) Variation in wind-generated power levels (for example, ranging from 0-100 percent of rated power output of the wind farm),
b) Transient thermal energy delivery (including factors such as the distance to the chemical plant),

41
c) Integrated controls that modulate alternative heat and steam supply using natural gas-fired burners to supplement nuclear-generated heat, and
d) Turn-down capability of the SMR in circumstances where the chemical plant is off-line during maintenance activities.
3. Given the relative importance of hydrogen in the current chemical manufacturing industry, and likely increased importance in future markets, a comparison of SMR-based hybrid system production of hydrogen by various processes should be performed: a) HTSE, b) steam methane reforming, and c) select thermal chemical water splitting. This study should consider the time value of producing electricity versus hydrogen and the value of avoiding CO2 emissions. The benefits of producing hydrogen using nuclear-integrated HTSE for use in peaking-power fuel cells or in the transportation section would provide valuable insight into the art-of-the-possible for significant reduction in U.S. greenhouse gas emissions.
4. An analysis of overall system exergy (i.e., the conversion efficiency of energy to useful work) will help clarify the value proposition for integrating SMRs with methanol plants. Two configurations have been developed: one that conveniently integrates FHR and HTGR concepts with a conventional methanol plant, and a re-engineered design that beneficially integrates the lower temperature heat that can be provided by an AFR or PWR. Factorial analysis of the exergy and other figures of merit will elucidate the cost-benefit tradeoffs for these two system configurations for the different SMR designs, plant scales, and performance under variable demand for electrical power generation.
5. A methodical technical, economic, and environmental assessment of U.S. hybrid energy systems is needed on a region-by-region basis. The assessment must consider resource availability, industrial and energy delivery infrastructure, population, energy demand, market factors, and regulatory controls/constraints. In order to characterize the dynamic attributes of the unique hybrid systems, a new approach for modeling the integrated energy system is necessary. It should include dynamic models of power generation, thermal energy production and delivery, and industrial applications to evaluate the technical feasibility of dynamic energy transfer within the coupled system. Rigorous analysis of markets, including state-of-the-art models of the electricity system that incorporate system management costs and value and reflect realistic market influences informed by consumer projections and macroeconomics, are also necessary.
6. Given the co-dependence of SMR hybrid systems on energy and material coupling, as well as market signals, advanced instrumentation and control approaches are needed to provide real-time state estimation of energy demands. Detailed consideration of the instrument types, location, and data links should be included in this study. The design of practical instrumentation and controls may impact the design of the integrated hybrid systems. Additionally, human factors must be taken into consideration for the SMR(s), wind power generation, and chemical plant operations. This effort should eventually utilize a virtual test mockup to demonstrate the feasibility of monitoring and managing integrated energy systems with electricity dispatch authorities.
7. New hybrid systems will fundamentally change the manner in which nuclear reactors are integrated with chemical industries, requiring safety and licensing issues to be addressed. This activity is needed early in the analysis process to provide guidance to the reactor design teams, the chemical manufacturing industry, the associated regulatory bodies (e.g. the Nuclear Regulatory Commission), and developers/providers of the SMR technology. Plant separation distance, co-dependence on utilities, and interruption in services are among key considerations that need to be addressed.

42
5. REFERENCES Aspen Technology Inc. (1995). Aspen HYSYS V7.3 . Aspen Technology Inc.
Boardman, C. (n.d.). Economic Assessment of S-PRISM Including Development and Generating Costs. Proceedings of 9th International Conference on Nuclear Engineering (ICONE-9). Nice, France: ICONE.
Bragg-Sitton, S., Boardman, R., McKellar, M., Garcia, H., Wood, R., Sabharwall, P., et al. (2013). Value Proposition for Load-Following Small Modular Reactor Hybrid Energy Systems, INL/EXT-13-29298. Idaho Falls: Idaho National Laboratory.
Chang, Y., Finck, P., Grandy, C., & Sienicki, J. (2006). Advanced Burner Test Reactor Preconceptual Design Report, ANL-ABR-1 (ANL-AFCI-173). Argonne: Argonne National Laboratory, Nuclear Engineering Division.
Delene, J., Williams, K., & Shapiro, B. (1988). A Reference Data Base for Nuclear and Coal-fired Powerplant Power Generation Cost Analysis, Rep. no. DOE/NE-0095. Washington D.C.: Department of Energy.
Dostal, V., Driscoll, M. J., & Hejzlar, P. (2004). A Supercritical Carbon Dioxide Cycel for Next Generation Nuclear Reactors, MIT-ANP-TR-100200. Cambridge: Massachusetts Institute of Technology.
Gandrik, A. (2011). HTGR Cost Model Estimating Tool, Report number INL/MIS-11-23534. Idaho Falls: Idaho National Laboratory.
Gandrik, A. M. (2012). HTGR Application Economic Model User's Manual, INL/EXT-11-24143. Idaho Falls: Idaho National Laboratory.
GIF. (2007). Cost Estimating Guidelines for Generation IV Nuclear Energy Systems, GIF/EMWG/2007/004, Rev. 4.2. Generation-IV International Forum.
IPCC. (2012). IPCC, Special Report of the Intergovernmental Panel on Climate Control, Renewable Energy Strategies and Climate Change Mitigation. ISBN 978 1 107 02340 6.
Kim, T., Grandy, C., & Hill, R. N. (2012). A 100 MWe Advanced Sodium-Cooled Fast Reactor Core Concept. PHYSOR 2012-Advances in Reactor Physics-Linking Research, Industry, and Education. Knoxville: American Nuclear Society.
Krull, P., Roll, J., & Varrin, R. D. (March 2013). HTSE Plant Cost Model for the INL HTSE Optimization Study, Dominion Engineering Report R-6828-00-01.
Lee, N., Gribik, A., Maio, V., McKellar, M., Patterson, M., & Wood, R. (2010). Integration of High Temperature Gas-Cooled Reactors into Industrial Process Applications, Revision 2, INL/EXT09-16942. Idaho Falls: Idaho National Laboratory.
NETL. (Nov. 2008). DOE/NETL-2009/1346, Development of Baseline Data and Analysis of Life Cycle Greenhouse Gas Emissions of Petroleum-Based Fuels. NETL.
NGNP. (July 2009). NGNP Hydrogen Technology Down-Selection: Results of the Independent Review Team (IRT) Evaluation, R-6917-00-01. Idaho Falls: NGNP.
O'Brien, J. (2008). Thermodynamic Considerations for Thermal Splitting Processes and High Temperature Electrolysis, IMECE2008-68880. Proceedings of the 2008 International Mechanical Engineering Congress and Exposition. Boston: American Society of Mechanical Engineers.
Perry, R., & Green, D. (2008). Perry's Chemical Engieer's Handbook (8th Edition). New York: McGraw Hill.
Peters, M. S., & Timmerhaus, K. D. (1991). , Plant Design and Economics for Chemical Engineers, 4th Edition. McGraw-Hill.

43
Sienicki, J. (2011). Alternative Cycles for Power Converters. 48th Annual Technical Meeting of Society of Engineering Sciences. Northwestern University: Argonne National Laboratory.
TEV-666. (May 2010). TEV-666, Nuclear-Integrated Ammonia Production Analysis, Technical Evaluation Study, Rev 1. Idaho Falls: Idaho National Laboratory.
TEV-693. (May 2010). TEV-693, Nuclear-Integrated Hydrogen Production Analysis, Technical Evaluation Study, Rev 1. Idaho Falls: Idaho National Laboratory.
TEV-953. (Sept. 2010). HTGR-Integrated Hydrogen Production vis Steam Methane Reforming (SMR) Process Analysis. Idaho Falls: Idaho National Laboratory.
TEV-954. (Sept. 2010). HTGR-Integrated Hydrogen Production via Steam Methane Reforming (SMR) Economic Analysis. Idaho Falls: Idaho National Laboratory.
The Babcock & Wilcox Company. (2005). Steam: its generation and use, Edition: 41. Barberton, Ohio: The Babcock & Wilcox Company.
U.S. Energy Information Administration. (n.d.). www.eia.gov. From U.S. Energy Information Administration Annual Energy Outlook 2013, Release Dates; April 15-May2, 2013: http://www.eia.gov/forcasts/aeo/images/figure_88
Yang, C., & Ogden, J. (2008). Determining the Lowest-Cost Hydrogen Delivery Mode. Institute of Transportation Studies, Department of Environmental Science and Policy, Univerisity of California, Davis.
Zhai, H., & Rubin, E. S. (2010). Performance and cost of wet and dry cooling systems for pulverized coal power plants with and without carbon capture and storage. Energy Policy 38, 5653-5660.

A1
6. APPENDIX: MODEL PROCESS FLOW DIAGRAMS AND OUTPUT Models developed using Aspen HYSYS V7.3 on an Apple Mac Pro Mid 2010 with a 2 x 2.4 GHz Quad-Core Intel Xeon processor using VMware Fusion Version 4.1.3 emulating Windows XP.

A2
6.1 Supercritical Rankine Power Cycle Model
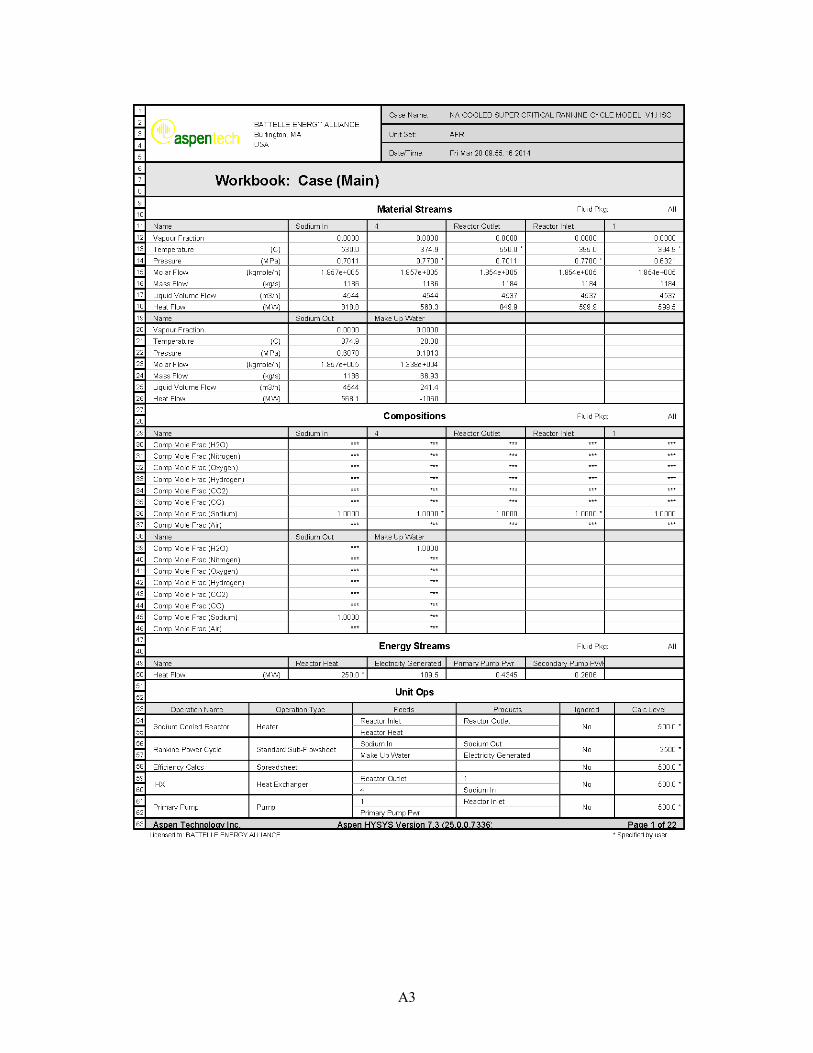
A3

A4

A5
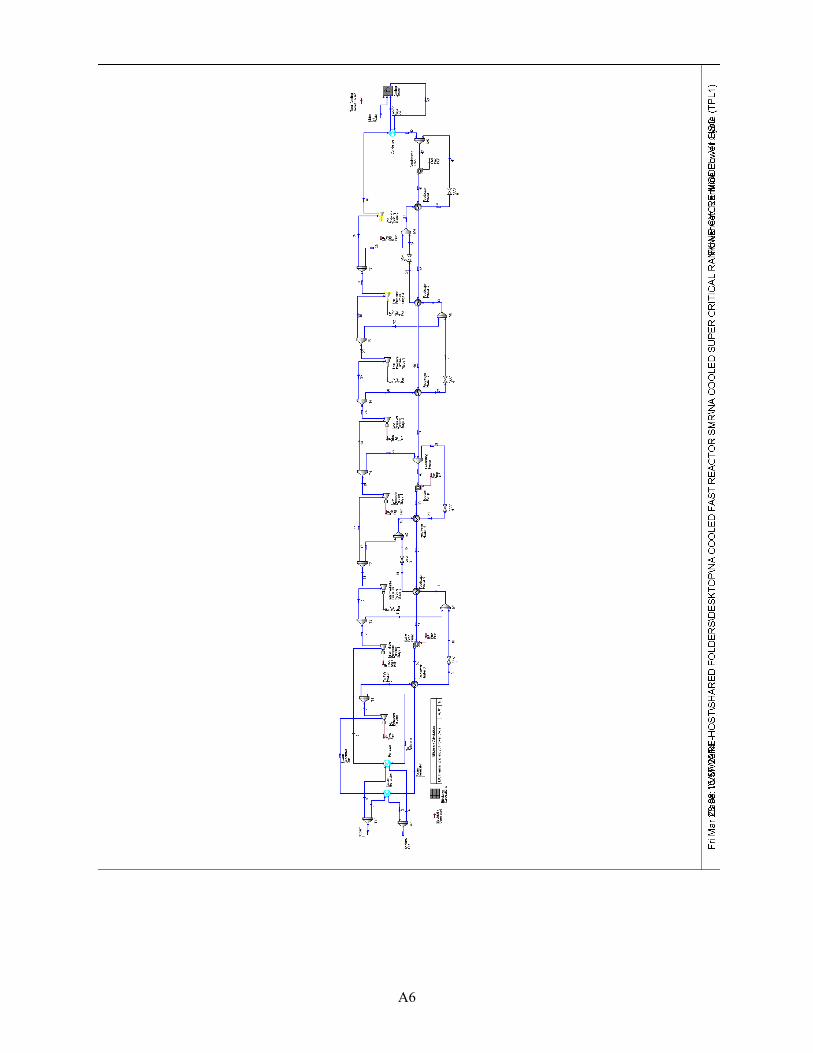
A6

A7

A8

A9

A10

A11
A12
A13

A14
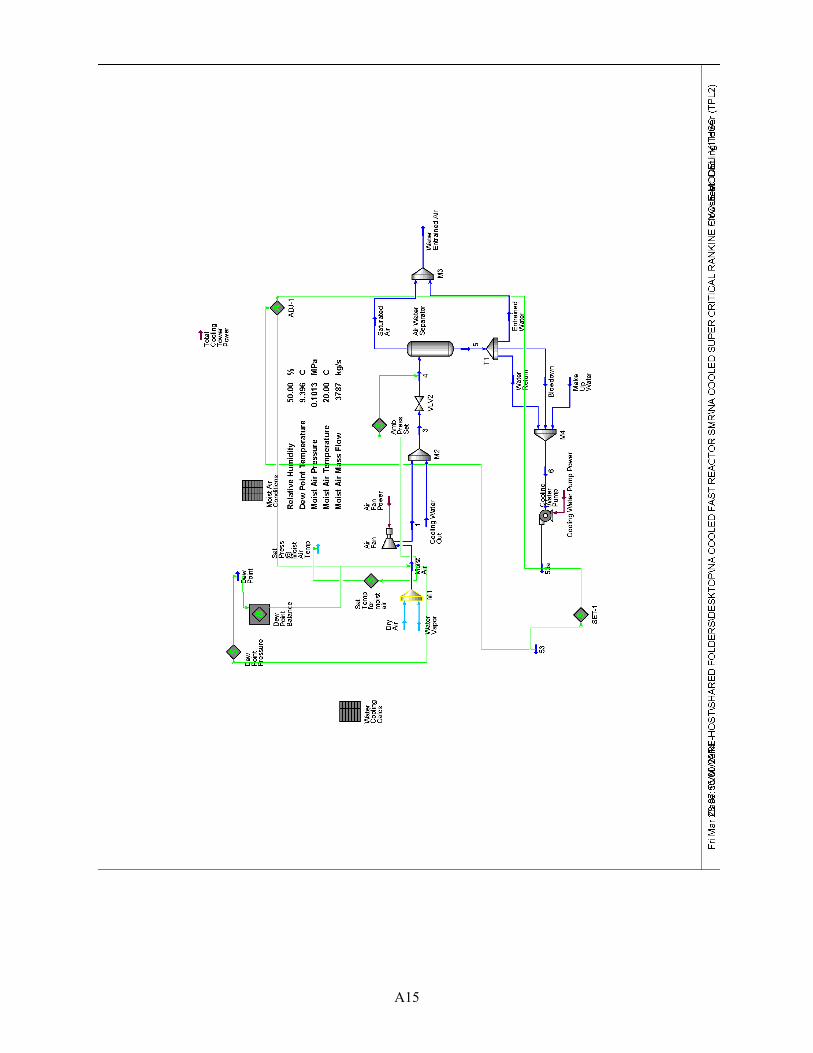
A15

A16

A17

A18

A19

A20

A21

A22

A23

A24

A25

A26

A27
6.2 Subcritical Rankine Power Cycle Model

A28

A29

A30
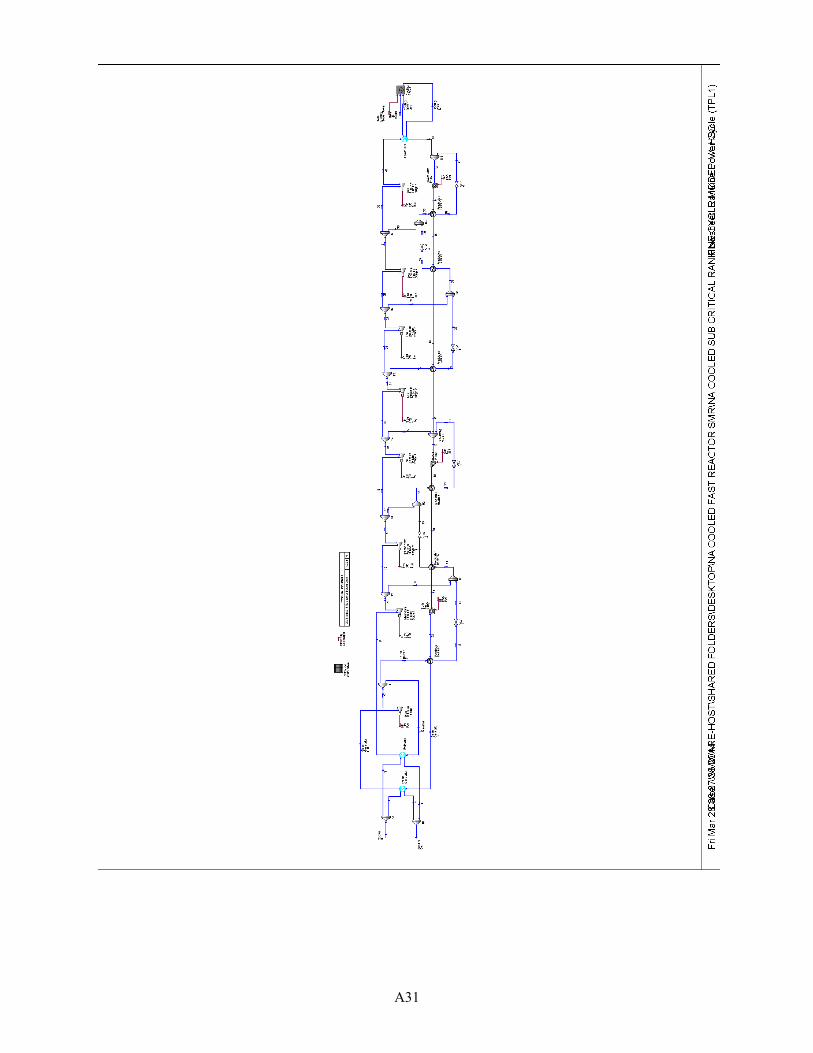
A31

A32

A33

A34
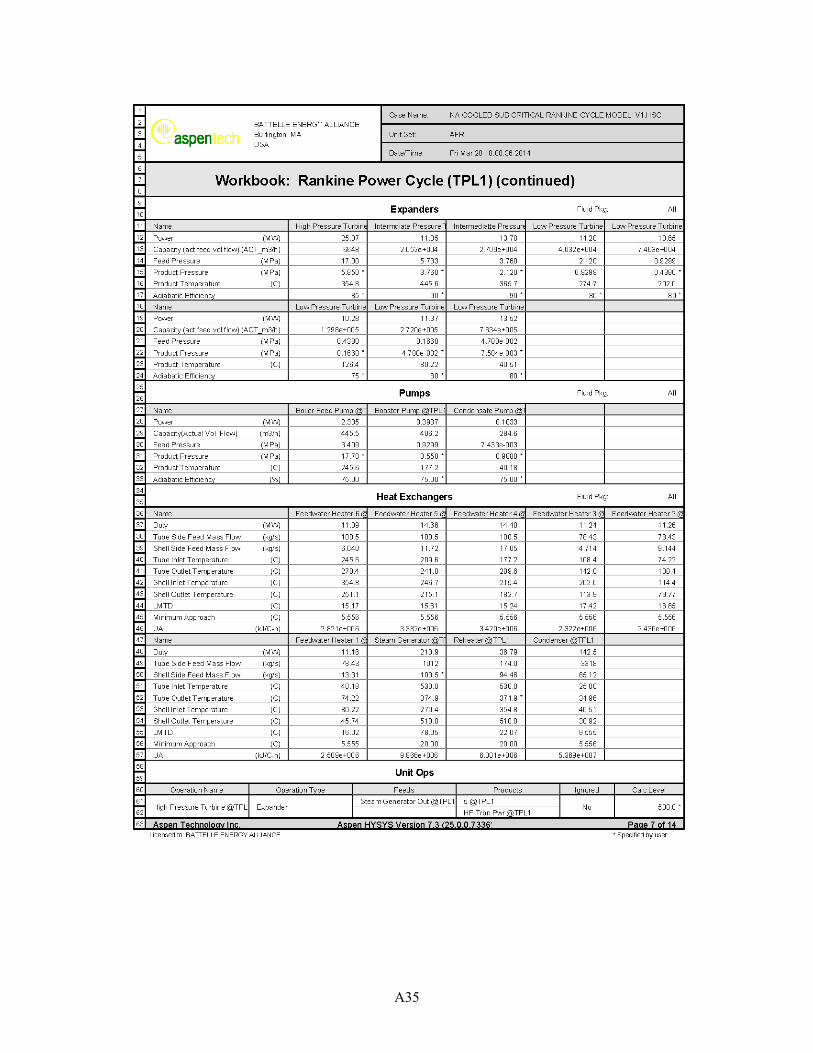
A35

A36

A37

A38

A39

A40

A41

A42

A43

A44
6.3 Supercritical CO2 Modified Brayton Power Cycle Model

A45

A46

A47

A48

A49
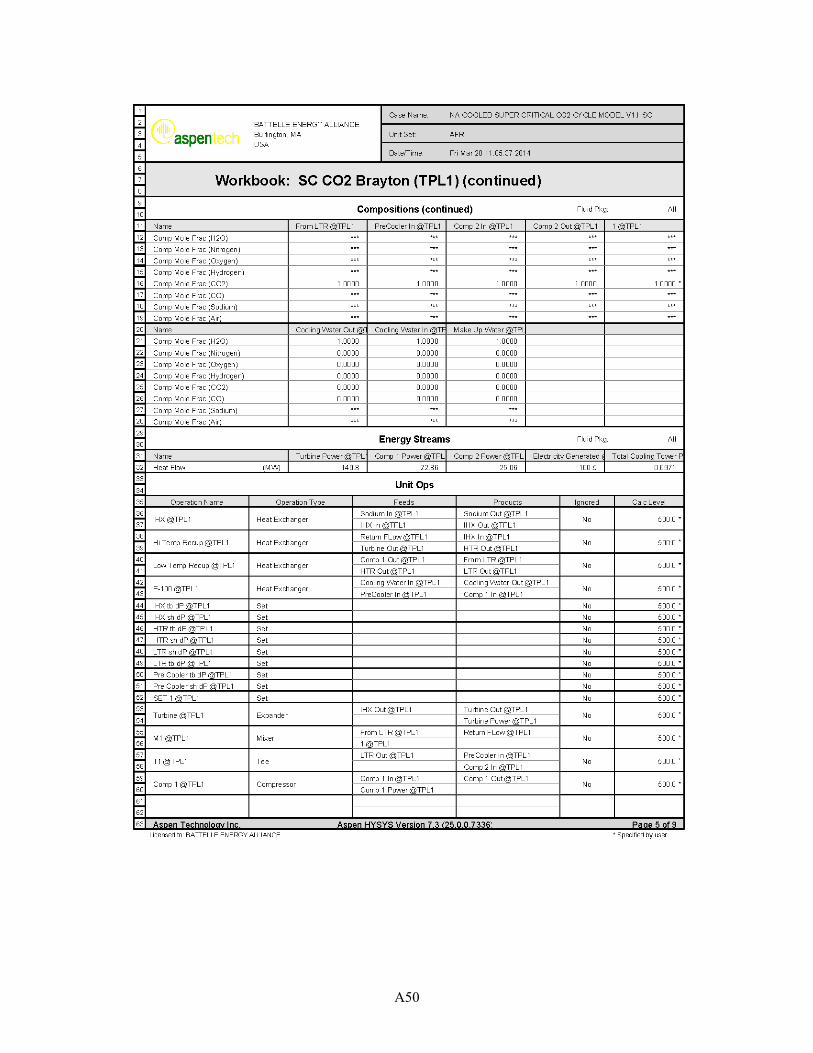
A50

A51

A52

A53

A54

A55

A56
6.4 Supercritical Rankine HTSE Model
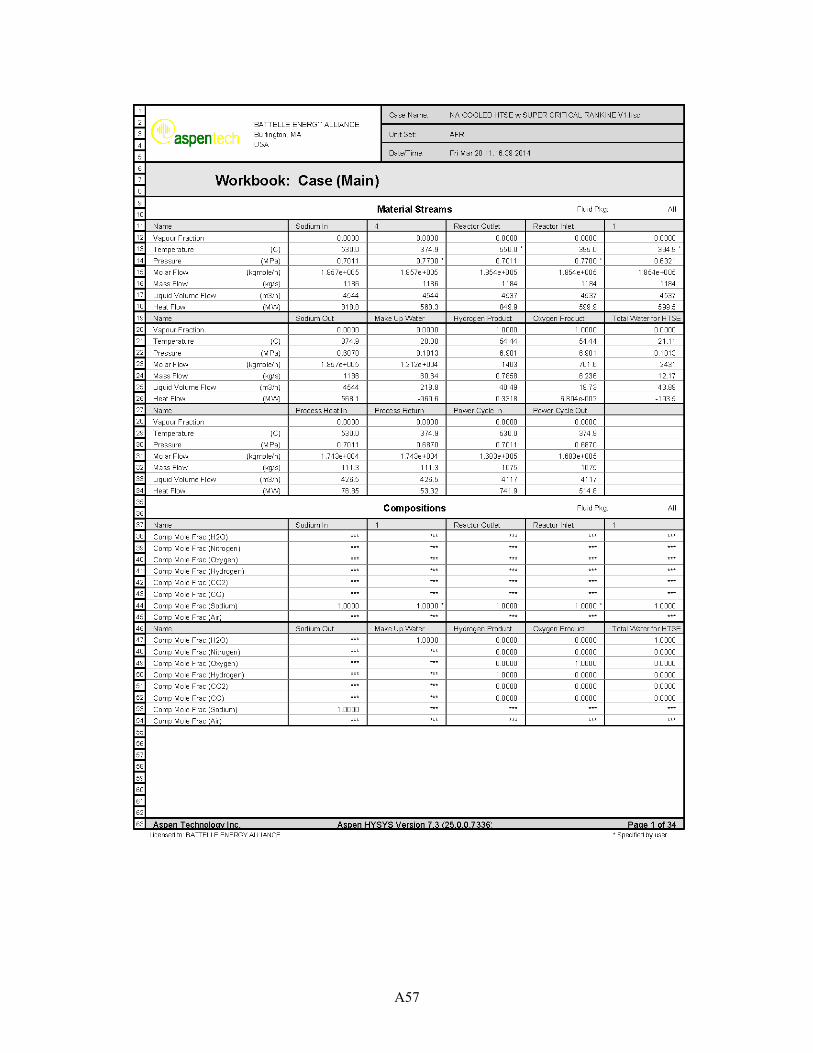
A57

A58

A59

A60

A61

A62

A63

A64

A65

A66

A67

A68

A69
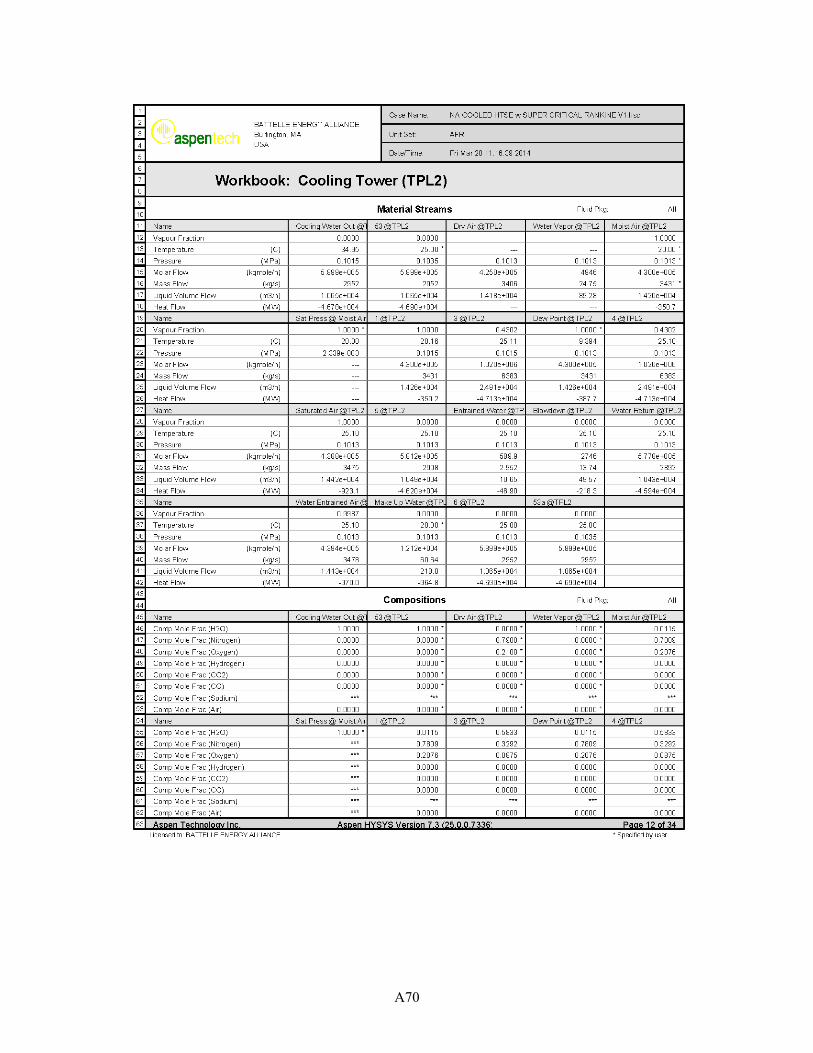
A70

A71

A72

A73

A74

A75

A76

A77

A78
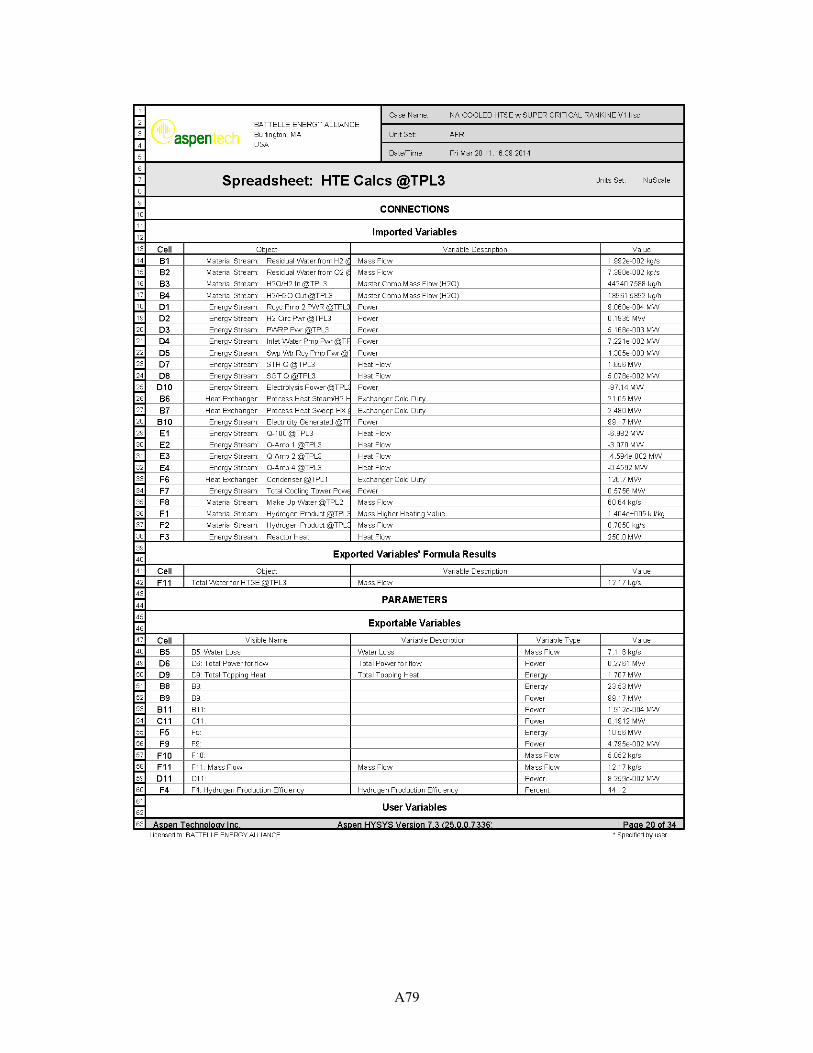
A79
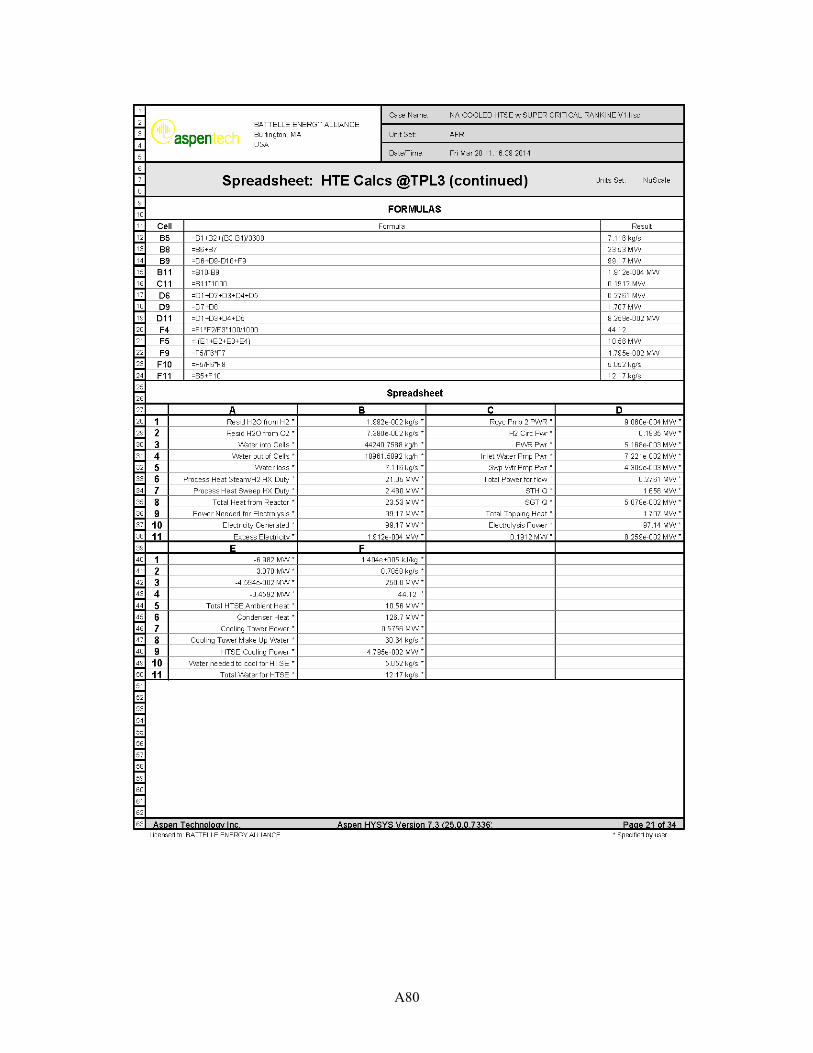
A80

A81
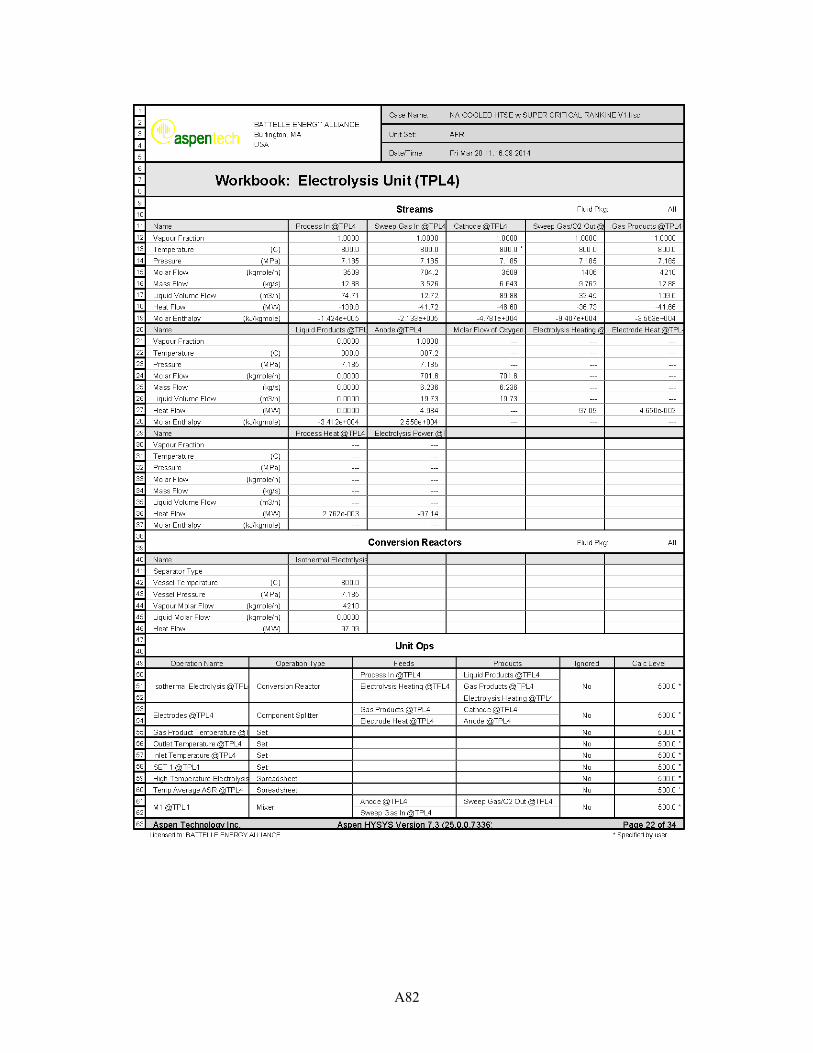
A82

A83

A84
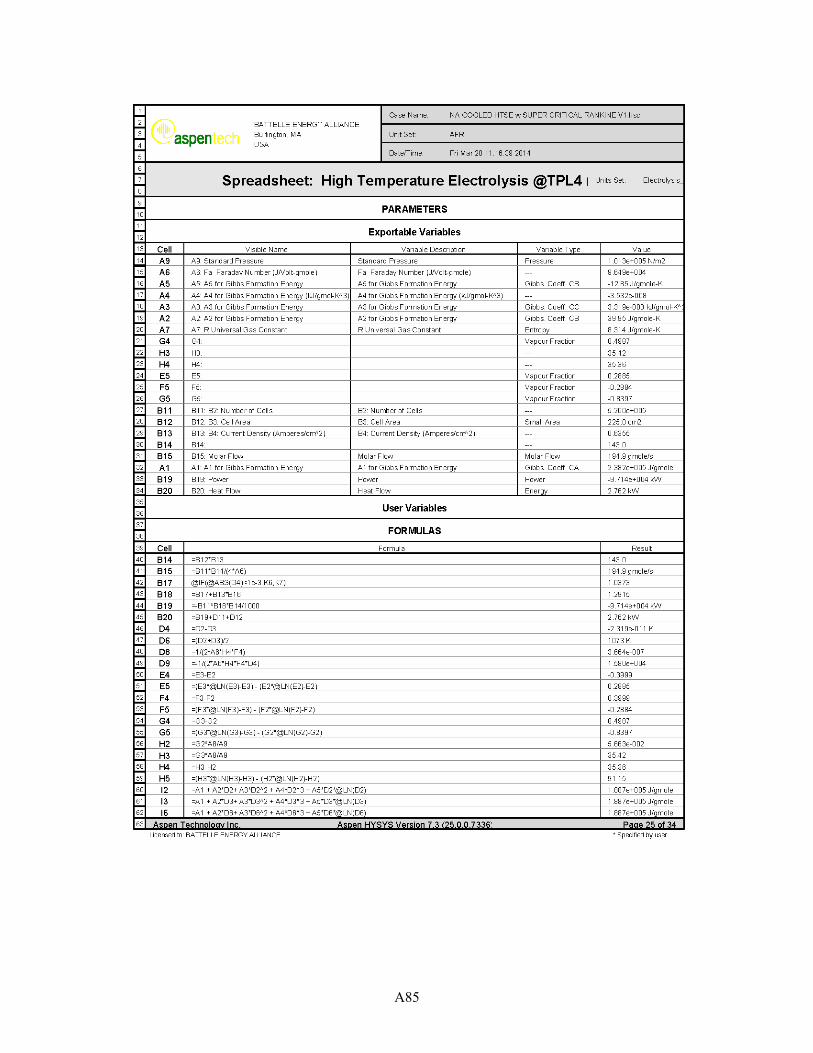
A85

A86

A87

A88

A89
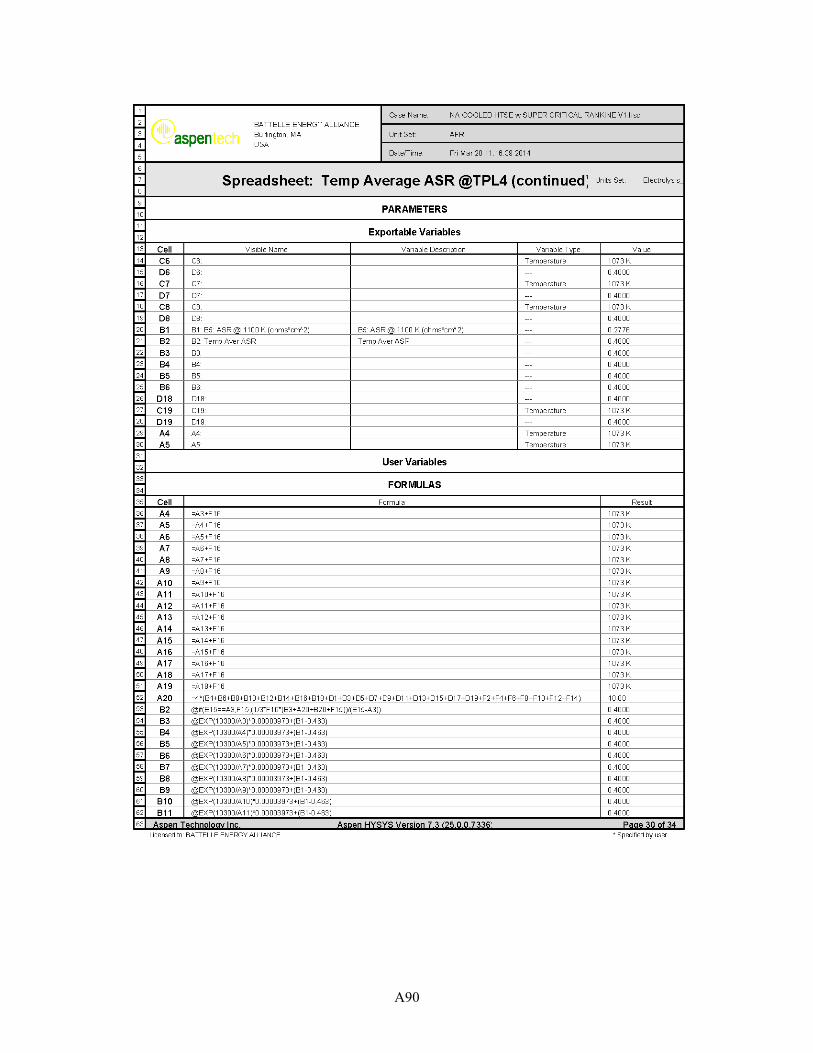
A90

A91

A92

A93

A94

A95
6.5 Subcritical Rankine HTSE Model

A96
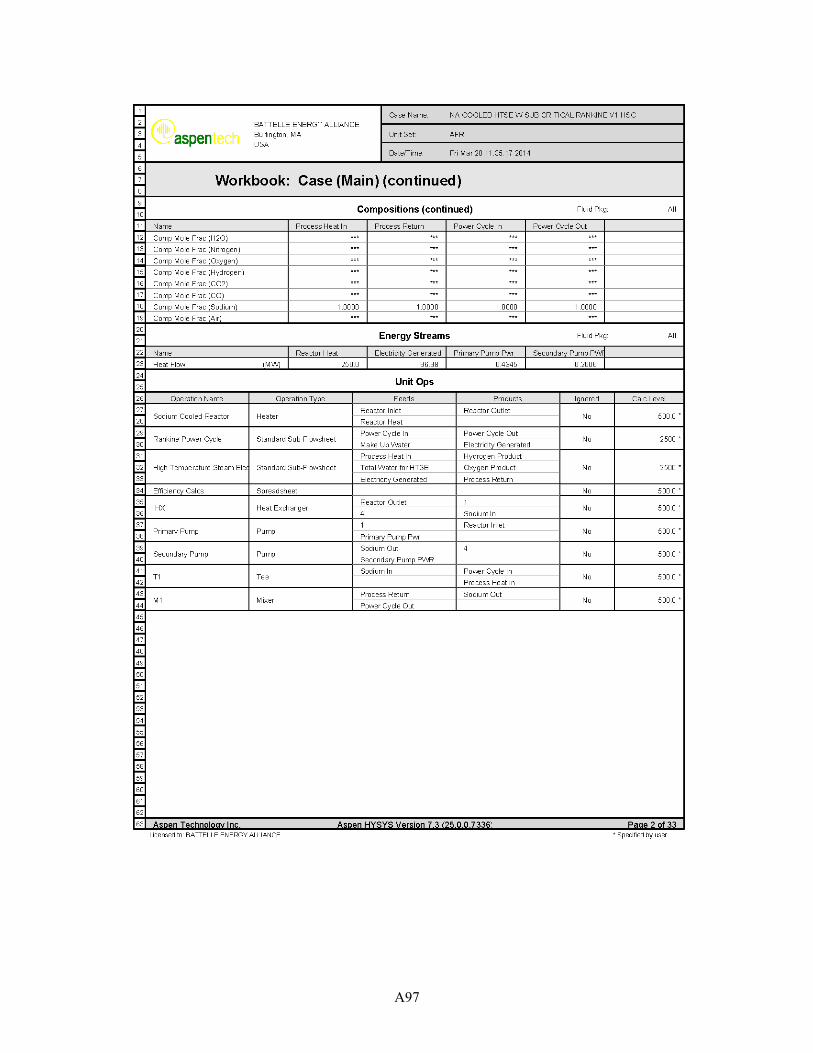
A97

A98

A99

A100
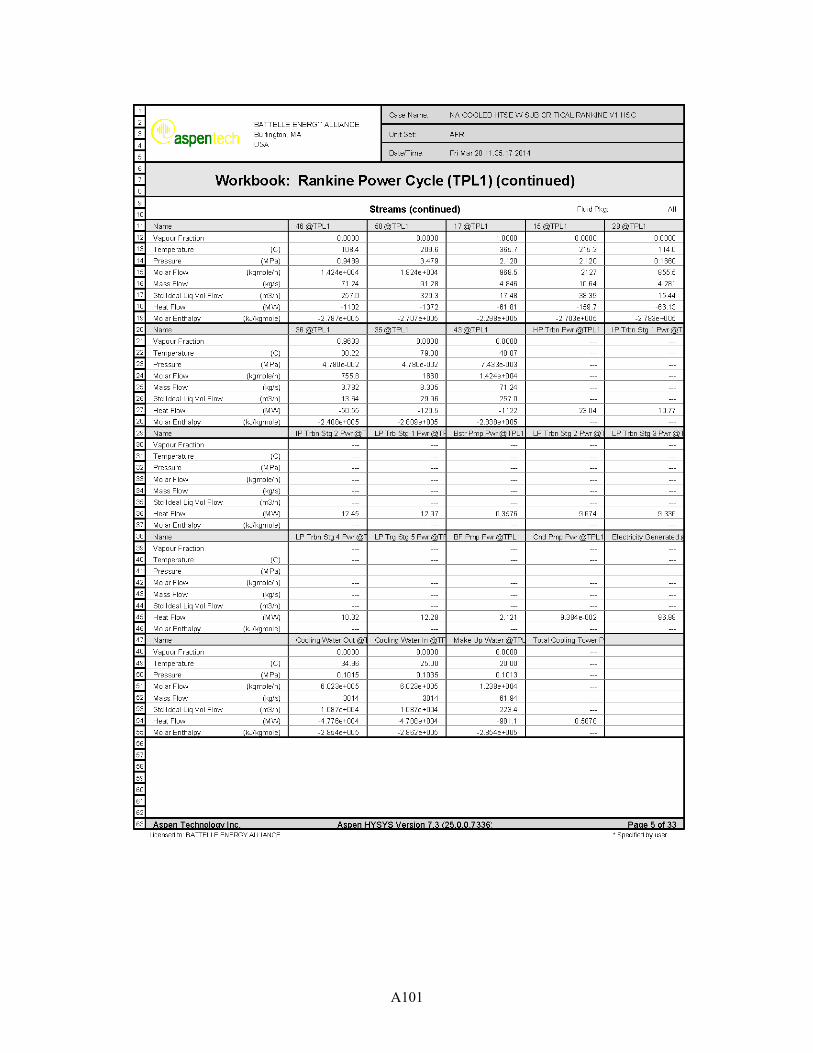
A101

A102

A103

A104

A105

A106

A107

A108

A109
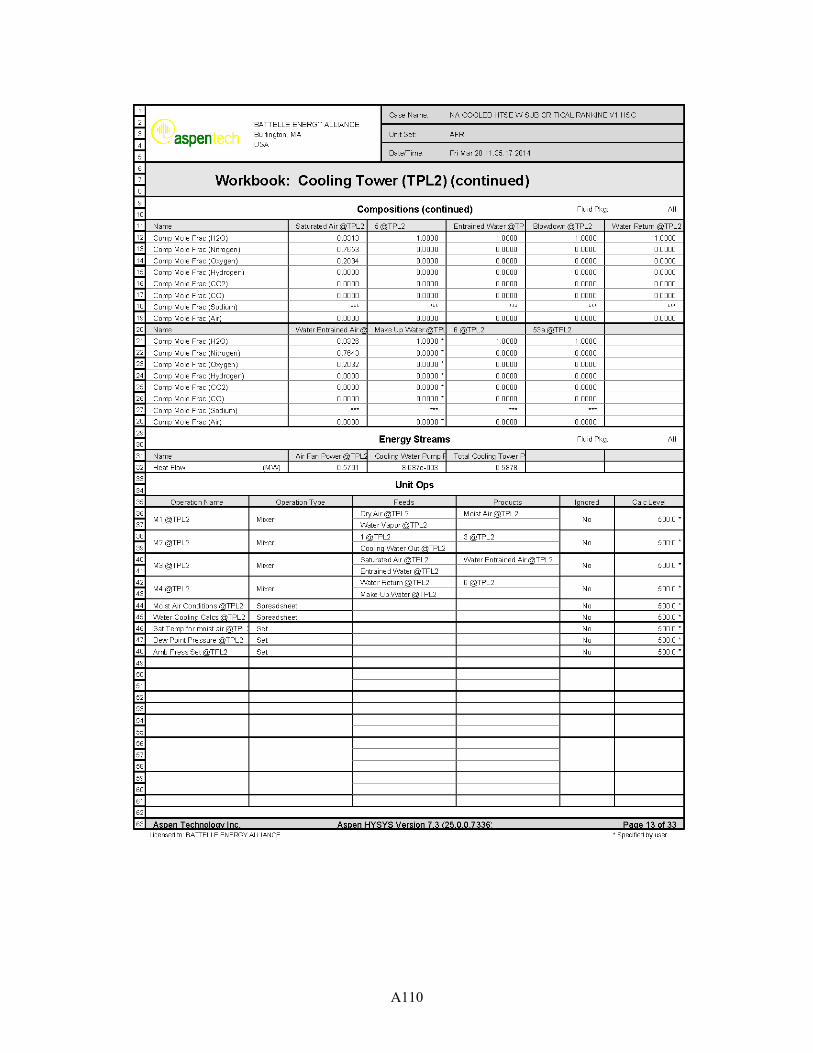
A110

A111

A112

A113

A114

A115

A116

A117

A118

A119

A120

A121

A122

A123
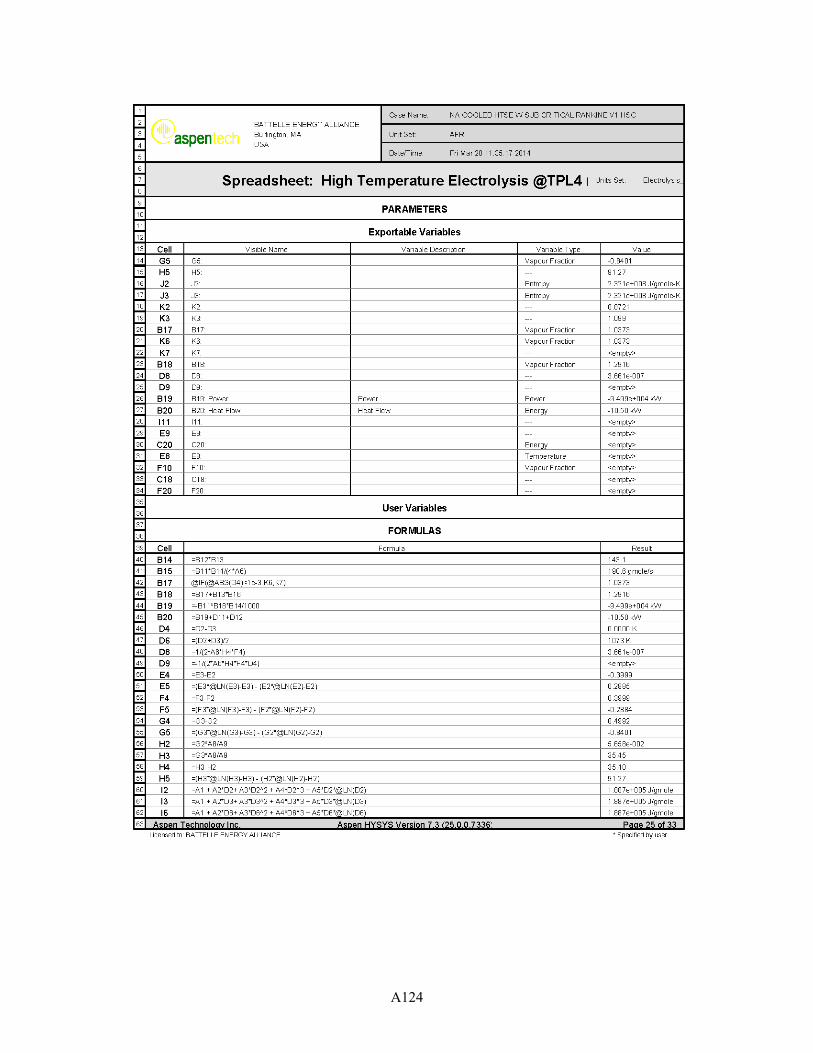
A124

A125

A126

A127
A128

A129

A130

A131

A132

A133
6.6 Supercritical CO2 Brayton HTSE

A134

A135
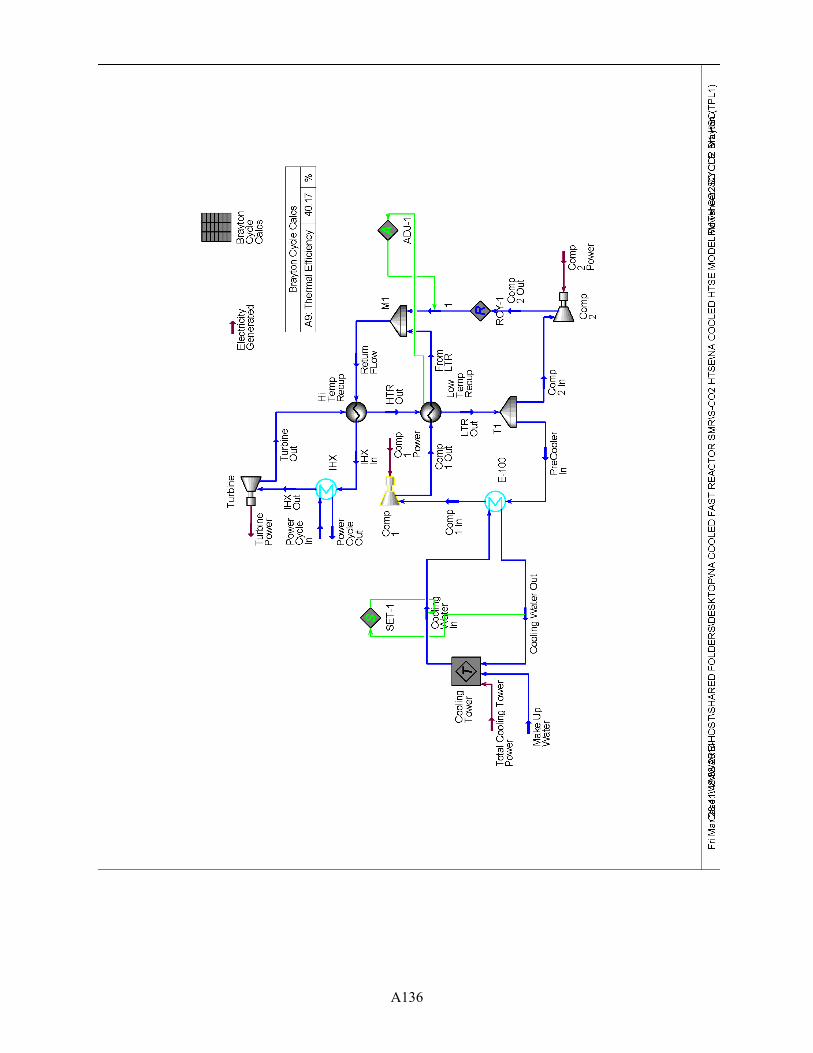
A136

A137

A138

A139

A140

A141

A142

A143

A144

A145

A146

A147

A148

A149

A150

A151

A152

A153

A154

A155

A156

A157

A158

A159

A160

A161

A162

A163

A164

A165