an analysis of middle school mathematics classroom
TRANSCRIPT

Montgomery County Public Schools Rockville, Maryland
An Analysis of Middle School Mathematics Classroom Observation and Teacher Interview Data
September 2000
Dr. Jerry D. Weast Dr. James A.Williams Superintendent of Schools Deputy Superintendent of Schools

Office of Shared Accountability Montgomery County Public Schools
Rockville, Maryland
An Analysis of Middle School Mathematics Classroom Observation and Teacher Interview Data
Dr. Susan Gross Evaluation Specialist
September 2000
Dr. Pamela Hoffler-Riddick Dr. Marlene Hartzman Associate Superintendent for Shared Director, Office of Shared Accountability Accountability

An Analysis of Middle School Mathematics Classroom Observation and Teacher Interview Data
Summary
Overview As a result of questions arising from differences in performance on Algebra 1 fi-nal examinations by school during the 1999-2000 school year, students’ middle school mathematics experiences have received renewed focus. Specific ques-tions have arisen regarding whether all students are sufficiently prepared to han-dle algebraic content by grade 8 or 9, and whether teachers have different ex-pectations for students based on demographic variables or the students’ prior mathematics performance. In spring 1999 evaluation staff from the Office of Shared Accountability (formerly Department of Educational Accountability) ob-served middle school mathematics classes to provide needs assessment data for a grant proposal that was submitted to the National Science Foundation (NSF). This report brings together data obtained from the classroom observations and from teachers’ comments to help shed light on the questions surrounding Algebra 1 performance. Findings
Teachers at all grade levels were judged by the observers to be of very similar and high levels of competency in mathematics. They appeared to be quite knowledgeable about mathematics content. Overall, mathematics lessons were well planned and organized, the
powatakthetheprotiothe
pa
Teachers are highly competent in mathematics content. However, there is great variability in how they approach classroom instruction.
resources provided by teachers contributed sitively to accomplishing the lessons’ purposes, and the mathematics content s significant and worthwhile. However, while overall, teachers appeared to e into account students’ prior knowledge in planning and delivering instruction, re was great variety in the instructional strategies used by teachers to meet diverse learning needs of the students. The areas in greatest need of im-vement are teachers’ use of wait time and questioning strategies. The instruc-
nal methodology of many of the teachers could be described as a “quest for right answer.”
Examination of the classroom culture found in the mathematics classes showed that overall,
Mathematics is frequently taught as isolated content without connections to relevant real-world applications.
students were encouraged to rticipate actively in the lesson, and there was respect for students’ ideas,

2
questions, and contributions. Teachers and students worked well together. However, many classes lacked the degree of intellectual rigor that one would hope would be present in mathematics classes in the county. In many mathematics classes the mathematics content was taught in isolation, with little attempt to make mathematics investigative or dynamic, or to connect mathematics to other disciplines or real-world contexts. While in many classes students appeared to be intellectually engaged with the important ideas that were presented, the lack of connection of mathematics with real-world applications appeared to result in student confusion and off-task behavior in some cases.
When data were disaggregated by grade level, it was found that the highest rated instruction (as measured on our classroom
observation instrument) tended to be provided in 6th grade, and the lowest rated instruction was provided in 8th grade. However, in all three grade levels lessons were found to be rushed, with teachers attempting to cover large amounts of content and not planning sufficient time for students to have the opportunity to step back and reflect on what they had learned. Lessons tended to end with the bell that signified change of classes, rather than with any planned teacher discussion or questioning of what were the important features of the lesson.
Observation data suggest that there are additional problems inherent in Algebra 1 classes, with ratings of instruction in “regular” Algebra 1 classes falling short of ratings in “gifted and talented” Algebra 1 classes in several key indicators of classroom practice. In talking
with teachers, evaluators found that many teachers felt frustrated that they could not “reach” all students. They felt that the recent emphases on 40% of all students taking Algebra 1 in 8th grade and the remaining students taking it by 9th grade was pushing students forward too fast, and that many students did not have the prerequisite skills to handle the algebra content. They also spoke of students who come to school unprepared, who do not do homework, and who wish to socialize in class. These problems are perceived by teachers as detract-ing from classroom instructional time.
In the August 3, 2000 issue of the Washington Post, the state of Maryland
was featured as having made great strides in the performance of 4th grade students on the National Assessment of Educational Progress (NAEP).1 However, Donna Watts, mathematics specialist at the Maryland Department of Education, pointed to the flat trajectory of mathematics test scores among middle schoolers, as well as the fact that up to half of Maryland’s middle school teachers
1 Washington Post, Thursday, August 3, 2000, Montgomery Weekly, page 1: Md. Kids Outscore Most in Math.
Mathematics lessons often proceed at too quick a pace.
Students have diverselearning needs that manyteachers feel unpreparedto meet.
Professional development is needed.

3
do not hold secondary mathematics teaching certificates, as indicators that we need to provide professional development to these teachers. Our study findings support the assertion that teachers of middle school mathe-matics could benefit from professional development, and the study findings sug-gest that they are in particular need of professional development aimed at in-creasing their repertoire of instructional strategies to deal with diverse student populations. Students might also benefit from an expansion of some of the new instructional materials that are being piloted – e.g., MATHThematics and Math-Scape. Preliminary data suggest that these two curriculum packages provide hands-on mathematics experiences that students react to positively.

4
Detailed Findings Study Procedures In all, 75 middle school classes were observed in Spring 1999: 32 were 6th grade; 20 were 7th grade, and 23 were 8th grade. Among the 8th grade classes, 16 were Algebra 1 classes and seven were Math 8. Evaluation staff used a structured ob-servation protocol designed for a national evaluation of the NSF Local Systemic Change programs in mathematics and science (see Appendix A). The instrument captures ratings of about 40 indicators of classroom practice which are sum-marized into five summary scores: lesson design; lesson implementation; mathematics content; classroom culture; and an overall synthesis score. All rat-ings are recorded on a 5 point scale, with 5 indicating exemplary classroom practice; 3 indicating average classroom practice; and 1 indicating ineffective classroom practice. Findings are presented, first, for the five summary scores, and then by specific indicators that might point toward areas in which MCPS could attack the questions surrounding Algebra 1 participation and performance. Interview questions were framed in the context of the lesson that was observed. A short pre-observation interview (Appendix B) asked the teacher to describe what would take place in class and to indicate if there was anything special the observer needed to know about the students in the class. The post-observation interview (Appendix C) asked the teacher to reflect on whether the lesson went as planned, describe next steps for classroom instruction and evaluation of stu-dent progress, and to comment on any challenges faced in motivating the stu-dents. Comments from observers’ written descriptions of mathematics lessons and teachers’ responses to interview questions are presented in this report where they serve to enhance the quantitative data. This report presents, first, findings for all classes observed in Grades 6, 7, and 8; second, a discussion of differences found in classroom observations of “gifted/talented” and “regular” Algebra 1 classes; and third, a discussion of teacher comments and classroom observations as they relate to students’ prepa-ration, needs, and attitudes towards mathematics. Comparison of Classes in Grades 6, 7, and 8 Overall Ratings Summary data suggest that the middle school mathematics instruction that was observed in spring 1999 was somewhat less than what NSF would have consid-ered average instructional quality, in that each rating received an average score of less than 3 for the total number of teachers (see Table 1). In particular, the category of lesson design was found to be deficient. When these data were dis-aggregated by grade level, however, it was found that the highest rated instruc-

5
tion tended to be provided in 6th grade, and the lowest rated instruction provided in 8th grade. Differences in the ratings of 6th, 7th, and 8th grade instruction were statistically significant in all areas except the area that addressed the appropri-ateness and relevance of the mathematics content. In an effort to try to under-stand the source of these differences, individual indicators were grouped into several dimensions of mathematics instruction. These are discussed in the fol-lowing sections.
Table 1
Summary Score Ratings for 6th, 7th, and 8th Grade Mathematics Classes (scale values: 1=lowest; 3=average; 5=highest)
Summary Score Category Grade 6 Grade 7 Grade 8 Total Lesson design 2.6 ** 2.0 1.9 2.2 Lesson implementation 2.9 * 2.4 2.3 2.6 Mathematics content 2.8 2.6 2.4 2.6 Classroom culture 3.2 ** 2.5 2.5 2.8 Overall synthesis score 2.9 * 2.3 2.3 2.6 * statistically significant at .05 level ** statistically significant at .01 level Teacher Competency in Mathematics Evaluators rated the teachers in three areas of observed competency in mathe-matics (see Table 2). The data illustrate that teachers at all grade levels were judged to be of very similar and high levels of competency in mathematics. They appeared to be quite knowledgeable about mathematics content.2
Table 2
Ratings of Indicators of Competency for 6th, 7th, and 8th Grade Mathematics Classes
Indicators of Math Competency Grade 6 Grade 7 Grade 8 Total The teacher appeared confident in his/her ability to teach mathematics.
3.7 3.6 3.6 3.6
Teacher-presented information was accurate. 3.9 3.8 3.9 3.9 The teacher displayed an understanding of mathematics concepts.
3.9 3.9 3.9 3.9
2 Since a rating of 3 is considered average instruction and 5 is considered exemplary instruction, average ratings that are approximately 4 should be viewed as very good instruction.

6
Planning and Organization of the Lesson Overall, mathematics lessons were judged to be well planned and organized, the resources provided by teachers contributed positively to accomplishing the les-sons’ purposes, and the mathematics content was significant and worthwhile (see Table 3). However, lessons observed in 6th grade were rated more positively than were those in 7th and 8th grades. In all three grade levels lessons were found to be rushed, with teachers attempting to cover large amounts of content and not planning sufficient time for students to have the opportunity to step back and reflect on what they had learned. Lessons tended to end with the bell that signified change of classes, rather than with any planned teacher discussion or questioning of what were the important features of the lesson.
Table 3
Ratings of Planning and Organization of the Lesson for 6th, 7th, and 8th Grade
Mathematics Classes Indicators of Planning/Organization Grade 6 Grade 7 Grade 8 Total The design of the lesson reflected careful planning and organization.
3.2 * 2.8 2.7 2.9
The resources available in the lesson con-tributed to accomplishing the purposes of the instruction.
3.0 * 2.6 2.4 2.7
The mathematics content was significant and worthwhile.
3.7 * 3.2 3.3 3.4
Adequate time and structure were provided for “sense-making.”
1.3 1.3 1.2 1.2
Adequate time and structure were provided for wrap-up and closure.
1.2 1.2 1.1 1.2
* Statistically significant at .05 level. The first two of the following evaluator comments describe lessons that provided for student ”sense-making.” The latter two illustrate lessons that did not provide students with “sense-making” opportunities.
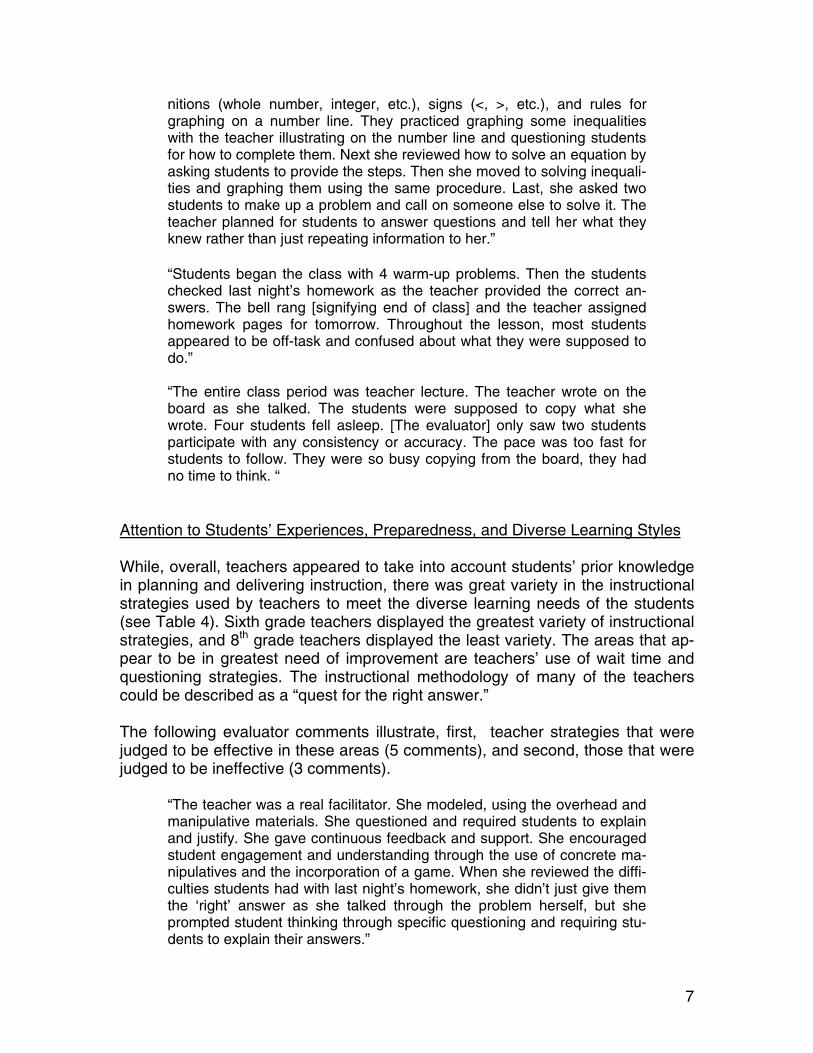
“Class began with a warm-up problem that was a review activity for up-coming MSPAP and CRT assessments. After discussing the solution to this problem, the teacher reviewed concepts that would be covered on an in-class test the next day and gave illustrations for each concept. There was considerable class discussion as the teacher and students reviewed each of the concepts.” “Students were confused about inequalities, so the teacher used this les-son to go back over some concepts. She began by reviewing some defi-
7
nitions (whole number, integer, etc.), signs (<, >, etc.), and rules for graphing on a number line. They practiced graphing some inequalities with the teacher illustrating on the number line and questioning students for how to complete them. Next she reviewed how to solve an equation by asking students to provide the steps. Then she moved to solving inequali-ties and graphing them using the same procedure. Last, she asked two students to make up a problem and call on someone else to solve it. The teacher planned for students to answer questions and tell her what they knew rather than just repeating information to her.”
“Students began the class with 4 warm-up problems. Then the students checked last night’s homework as the teacher provided the correct an-swers. The bell rang [signifying end of class] and the teacher assigned homework pages for tomorrow. Throughout the lesson, most students appeared to be off-task and confused about what they were supposed to do.” “The entire class period was teacher lecture. The teacher wrote on the board as she talked. The students were supposed to copy what she wrote. Four students fell asleep. [The evaluator] only saw two students participate with any consistency or accuracy. The pace was too fast for students to follow. They were so busy copying from the board, they had no time to think. “
Attention to Students’ Experiences, Preparedness, and Diverse Learning Styles While, overall, teachers appeared to take into account students’ prior knowledge in planning and delivering instruction, there was great variety in the instructional strategies used by teachers to meet the diverse learning needs of the students (see Table 4). Sixth grade teachers displayed the greatest variety of instructional strategies, and 8th grade teachers displayed the least variety. The areas that ap-pear to be in greatest need of improvement are teachers’ use of wait time and questioning strategies. The instructional methodology of many of the teachers could be described as a “quest for the right answer.” The following evaluator comments illustrate, first, teacher strategies that were judged to be effective in these areas (5 comments), and second, those that were judged to be ineffective (3 comments).
“The teacher was a real facilitator. She modeled, using the overhead and manipulative materials. She questioned and required students to explain and justify. She gave continuous feedback and support. She encouraged student engagement and understanding through the use of concrete ma-nipulatives and the incorporation of a game. When she reviewed the diffi-culties students had with last night’s homework, she didn’t just give them the ‘right’ answer as she talked through the problem herself, but she prompted student thinking through specific questioning and requiring stu-dents to explain their answers.”

8
Table 4
Ratings of Attention to Students’ Experiences, Preparedness, and Diverse
Learning Styles for 6th, 7th, and 8th Grade Mathematics Classes Indicators of Attention to Students’ Needs
Grade 6 Grade 7 Grade 8 Total
The instructional strategies and activities used in the lesson reflected attention to students’ experience, preparedness, and/or learning styles.
3.0 * 2.5 2.4 2.7
The instructional strategies and activities re-flected attention to issues of access, equity, and diversity for students (e.g., use of ‘wait time,’ cooperative learning, language-appro-priate strategies/materials).
2.9 * 2.1 2.0 2.4
The pace of the lesson was appropriate for the developmental levels/needs of the stu-dents.
3.0 * 2.6 2.3 2.6
The teacher took into account prior knowledge of students.
3.2 2.9 2.9 3.0
The teacher’s questioning strategies were likely to enhance the development of student conceptual understanding and problem solv-ing.
2.8 ** 1.9 1.9 2.3
* Statistically significant at .05 level. ** Statistically significant at .01 level.
“The teacher was unsure of how well students would remember finding the area of a trapezoid. Therefore, she planned a few problems at the be-ginning of class to assess this, and had the activity ready should it be needed to allow students to develop and re-learn this concept.”
“Before going over the warm-up/review, the teacher said that he had seen a couple of consistent confusions when looking over student homework, so he decided those would be discussed after the warm-up. He sent stu-dents to the overhead to show and explain how they solved the warm-up/review problems. After warm-up, a few homework problems were re-viewed in the same manner. If a child at the overhead ran into trouble, the teacher slid unobtrusively into the act and worked with the child. No big deal was made about the error. The teacher used proximity control to get off-task students on task. It worked very effectively. The resource teacher entered and paid close attention to the success of the IEP students. The teacher used pictures on the overhead as a means of showing how each strategy could be used in problem solving.”

9
“The teacher used questioning fairly extensively with some higher-order questions. When she gave problems on the overhead for students to solve, she always allowed time for students to work on the problems indi-vidually first before discussing them as a class. The pace was appropri-ate.” “Materials (scissors, cm squared paper) were distributed and through guided questions and teacher modeling, students discovered the formula for computing the area of a triangle and a trapezoid.” “The class began by going over the problems on a review sheet: quad-ratic equations. As students checked their work the teacher asked ques-tions and then answered most of them herself.” “The teacher knew that students were confused, but made no effort to change the plan. The purposes were not clear. Learning time was lost due to student confusion. Activities were rushed, with an emphasis on getting through the plan (a timer was used to indicate when it was time to stop one thing and move on to another).” “The teacher began class by giving answers to yesterday’s homework. Those who had been absent were told to get the notes, etc. from class-mates. When one student who had been absent asked a question, the teacher said, ‘What did I JUST say?’ She did not answer his question. She wrote the homework answers on an overhead as she talked, but most of the time she stood between the overhead and the screen, so she totally blocked the students’ view of the transparency.”
Use of Reform-based Instructional Strategies
The data indicate that in many mathematics classes the mathematics content was taught in isolation, with little attempt to make mathematics investigative or dynamic, or to connect mathematics to other disciplines or real-world contexts (see Table 5). While in many classes students appeared to be intellectually en-gaged with the important mathematics ideas that were presented, the lack of connection of mathematics with real-world applications appeared to result in stu-dent confusion and off-task behavior in some cases. The following comments are all illustrative of classes in which real-world connec-tions were made to mathematics content or mathematics was presented as in-vestigational in nature.
“The content was appropriate and tied to real-world applications (pizza in a box, swimming pool with a deck). Line drawings helped students visu-alize the different areas. Students were on task and participated well throughout the lesson.”

10
Table 5
Ratings of Use of Reform-based Instructional Strategies for 6th, 7th, and 8th Grade Mathematics Classes
Indicators of Reform-based Strategies Grade 6 Grade 7 Grade 8 Total The design of the lesson incorporated tasks, roles, and interactions consistent with investi-gative mathematics.
2.7 ** 1.9 1.8 2.2
The design of the lesson encouraged a col-laborative approach to learning.
2.6 ** 1.8 2.0 2.2
The instructional strategies were consistent with investigative mathematics.
2.8 ** 1.8 1.7 2.2
Students were intellectually engaged with important ideas relevant to the focus of the lesson.
2.7 2.3 2.3 2.4
Mathematics was portrayed as a dynamic body of knowledge continually enriched by conjecture, investigation, analysis, and/or proof/justification.
2.1 ** 1.6 1.4 1.7
Appropriate connections were made to other areas of mathematics, to other disciplines, and/or to real-world contexts.
2.3 * 1.9 1.6 1.9
* Statistically significant at .05 level. ** Statistically significant at .01 level.
“The class began with a few problems in finding the area of triangles and trapezoids. As students did not remember how to find the area of a trape-zoid (this had been started in the previous class period before testing and half days), they did an activity to help them develop this concept. They drew and cut out a trapezoid, then folded it, cut it, and formed a parallelo-gram. As they answered questions from the activity sheet they were able to determine the formula for the area of a trapezoid.” “The teacher designed the lesson to provide students some opportunity to investigate by designing polygons. She also had students sharing in pairs and at one point with nearby groups also. She had allowed time for stu-dents to show their answers and for questioning, alternative solutions, and critiquing. There were additional activities for those who finished first. The teacher implemented her plan well. The pace of the lesson was good, with time allowed for many questions/discussion and for exploration of alternative solutions.” “Students had been working on a long-term project in conjunction with their study of geometry. The project also incorporated ratio/proportion, which they had studied prior to geometry. It involved designing the ‘Ulti-mate Bedroom,’ using as many geometric shapes as possible and choosing a scale which was used to calculate the exact sizes of the ob-jects in the bedroom.”

11
“Students were looking at the effect of keeping a constant volume while varying the surface area. Students used blocks to measure the surface area of 3-dimensional shapes with a constant volume. Students fit the blocks into the various shapes and then counted to obtain the surface area. They also figured out the volume. This was done as a class using a worksheet with the teacher demonstrating at first and then leading the discussion for the next few. She then asked students to come up with a new rectangular shape that would have the same volume. This was dis-cussed. Last, working in groups of four, students were to design as many shapes as they could that would have a volume of 24 cubes. They were to fill in a chart recording the length of the sides and the height, and de-termine volume and surface area.”
Classroom Culture Examination of the classroom culture found in the mathematics classes showed that overall, students were encouraged to participate actively in the lesson, and there was respect for students’ ideas, questions, and contributions (see Table 6). Teachers and students appeared to work well together. However, many classes lacked the degree of intellectual rigor that one would hope would be present in mathematics classes in the county.
Table 6
Ratings of Classroom Culture for 6th, 7th, and 8th Grade Mathematics Classes
Indicators of Classroom Culture Grade 6 Grade 7 Grade 8 Total The teacher’s classroom management style/ strategies enhanced the quality of the lesson.
3.2 * 2.7 2.5 2.9
Active participation of all was encouraged and valued.
3.8 * 3.1 2.9 3.3
There was a climate of respect for students’ ideas, questions, and contributions.
3.5 3.0 3.0 3.2
Interactions reflected collaborative working relationships among students.
3.0 * 2.2 2.5 2.6
Interactions reflected collaborative working relationships between teacher and students.
3.7 * 3.1 3.2 3.4
The climate of the lesson encouraged stu-dents to generate ideas, questions, conjec-tures, and/or propositions.
2.6 2.2 2.0 2.3
Intellectual rigor, constructive criticism, and the challenging of ideas were evident.
2.1 * 1.6 1.5 1.8
* Statistically significant at .05 level.

12
The following comments illustrate positive classroom cultures (2 examples) and a negative classroom culture (1 example).
“The class was considered a ‘regular’ 7th grade math class. Their lack of math confidence and proficiency was obvious. Judging by the lesson content and students’ abilities with the content, it was obvious that math is a challenging activity for most of these students. However, this high-en-ergy teacher used wait time, questioning, visual reinforcement, and re-lated in a very pleasant, humorous, and accepting manner with students. The teacher literally pulled students into the discussion and problem solving.” “Students worked well together, sharing ideas and knowledge. There was a good relationship between teacher and students. The teacher called on many students and encouraged student questions and ideas. She al-lowed students to do the answers on the board or overhead instead of doing them herself. Students were engaged in some investigative activi-ties. The teacher asked many higher-order questions and students were involved in critical thinking. Students seemed to understand the concepts well and shared their knowledge with each other.” “Most students were overlooked entirely (the teacher only called on a few of them). Students were frequently admonished for behaviors the teacher didn’t like. Seats were changed and a child was thrown out of the room for asking another student for help. Student active participation or elabor-ation was not encouraged. Students were not permitted to ask critical questions or work together and help one another. The teacher obviously wanted students to be busy and quiet. She expected students to do what she said.”
Comparison of “Gifted/Talented” and “Regular” Algebra 1 Classes Of the 16 Algebra 1 classes that were observed in Spring 1999, 12 were labeled “gifted and talented” algebra, and 4 were labeled “regular” algebra. This labeling is apparently done by the schools to identify those algebra classes in which stu-dents have been enrolled despite their not meeting CRT or other cutoff scores deemed desirable by the school staff (the section on teacher comments provides ample evidence of this feeling). Comparisons of observation ratings for these two groups of algebra classes show that, in general, the “gifted and talented” algebra classes were rated higher by the observers than were the “regular” algebra classes. The opinion of the evaluators is that some of these differences may be attributed to differences in student populations in the two settings, with the “gifted and talented” students coming to class more prepared to handle the mathematics content. However, much of the difference must also be attributed to the lack of ability or unwillingness on the part of teachers to try new strategies that might work with the “regular” algebra students. Differences between the two types of

13
Algebra 1 classes were found in two major areas of classroom practice: attention to the diverse needs of students in the class, and classroom culture. Attention to Students’ Experiences, Preparedness, and Diverse Learning Styles Examination of indicators of attention to students needs suggests that teachers need assistance in tailoring instructional strategies and activities to meet the needs of their Algebra 1 students (see Table 7). This is especially true for strate-gies that could address issues of access and equity, as well as use of question-ing techniques that would enhance students’ conceptual understanding and problem solving. Additionally, teachers of “gifted and talented” algebra students received signifi-cantly higher ratings than teachers of “regular” algebra students in two of the in-dicators: strategies that address access and equity, and conducting the lesson at an appropriate pace for students in the class. In a third indicator, questioning strategies, teachers of the “gifted and talented” students received ratings that were higher than those of “regular” students, but the size of the difference just missed the cutoff for statistical significance. The totality of these data suggest that the students in “regular” algebra classes have learning needs that differ from those found in “gifted and talented” algebra classes, and the teachers of the “regular” students do not appear to have a sufficient repertoire of instructional strategies to deal with these students’ needs.
Table 7
Ratings of Attention to Students’ Experiences, Preparedness, and Diverse Learning Styles for “Gifted and Talented” and “Regular” Algebra 1 Classes
Indicators of Attention to Students’ Needs Gifted/Talented Regular The instructional strategies and activities used in the lesson reflected attention to students’ experience, preparedness, and/or learning styles.
2.5 2.5
The instructional strategies and activities reflected attention to issues of access, equity, and diversity for students (e.g., use of ‘wait time,’ cooperative learning, language-appropriate strategies/materials).
2.1 * 1.3
The pace of the lesson was appropriate for the developmental levels/needs of the students.
2.7 * 1.5
The teacher took into account prior knowledge of stu-dents.
2.9 3.0
The teacher’s questioning strategies were likely to enhance the development of student conceptual un-derstanding and problem solving.
2.1 1.5
* Statistically significant at .05 level.

14
Classroom Culture Indicators of classroom culture show that Algebra 1 teachers encouraged the ac-tive participation of their students in the day’s lesson (see Table 8). Also, in most cases, there was a positive, collaborative working relationship between the teacher and students. However, there was a significant difference in how re-spectful of student questions the Algebra 1 teachers were in their “regular” alge-bra classes as compared to their “gifted and talented” algebra classes. The “regular” algebra classes also contained fewer incidents of students working col-laboratively with each other than was observed in the “gifted and talented” classes. Finally, in both settings, the classes were found to be deficient in en-couraging students to generate ideas, questions, or conjectures, and overall, there was a singular lack of intellectual rigor in evidence. These findings suggest additional areas in which middle school mathematics teachers would benefit from professional development experiences.
Table 8
Ratings of Classroom Culture for “Gifted and Talented” and “Regular” Algebra 1 Classes
Indicators of Classroom Culture Gifted/
Talented Regular
The teacher’s classroom management style/ strategies enhanced the quality of the lesson.
2.8 * 1.5
Active participation of all was encouraged and valued.
3.1 3.0
There was a climate of respect for students’ ideas, questions, and contributions.
3.3 * 2.0
Interactions reflected collaborative working relationships among students.
3.0 * 1.8
Interactions reflected collaborative working relationships between teacher and students.
3.5 2.8
The climate of the lesson encouraged stu-dents to generate ideas, questions, conjec-tures, and/or propositions.
2.3 1.8
Intellectual rigor, constructive criticism, and the challenging of ideas were evident.
1.8 1.0
* Statistically significant at .05 level.

15
Teacher Comments and Classroom Observations in Relation to Students’ Preparation, Needs, and Attitudes Toward Math Among all the classes that were observed, 49 percent were labeled “gifted and talented;” 28 percent were labeled “regular;” and 23 percent were labeled “skills.” As the following discussion regarding teachers’ comments and classroom obser-vations unfolds, the reader should keep these percentages in mind. If students at all working levels were viewed similarly by their teachers, we would expect that positive and negative comments about the students and observation findings would be distributed in the same percentages – that is, 23 percent should apply to “skills” classes, 28 percent should apply to “regular” classes, and 49 percent should apply to “gifted and talented” classes. The data suggest that this is not the case. In general, “gifted and talented” students are viewed much more positively by their teachers than are “regular” and “skills” students. The following example illustrates how the data are interpreted. Twenty percent of the teachers commented that students do not complete their homework assignments or come to class otherwise unprepared (see Table 9). The distribution of these comments across working levels of the classes shows that teachers perceive this to be a problem more so in “regular” classes than they do in their “skills” or “gifted and talented” classes. This finding is based on the fact that 43 percent of the teachers who commented about students’ lack of preparation for class were teachers of “regular classes,” despite the fact that “regular classes” only made up 28 percent of the classes that were observed.
Table 9
Comments Made by Teachers and Their Distribution Across Working Levels of the Classes
Comment % of All
Teachers Skills Class Percentage
Regular Class Percentage
Gifted/Talented Class Percentage
Expected percentage 23 28 49 Students unprepared for class
20 24 43 33
Students lack requisite skills 40 61 27 11 Students have requisite skills
7 0 0 100
MCPS is moving students too fast
16 39 39 23
Students well motivated 12 0 8 92
Teachers offered comments regarding the preparation of their students in requi-site skills to succeed in mathematics. Forty percent of the teachers felt students

16
in their classes did not have requisite skills. This was clearly a concern for them in the “skills” level classes and to some extent in “regular classes,” but surpris-ingly, a small number of teachers indicated this was also the case for their “gifted and talented” classes. Seven percent of the teachers felt the students in their classes had requisite skills. These comments were made exclusively for “gifted and talented” classes. Additionally, it was primarily for “gifted and talented” classes that teachers described their students as well motivated. Sixteen percent of the teachers felt MCPS was moving students too quickly through the mathematics curriculum. They were more concerned about this for “skills” and “regular” students than they were for “gifted and talented” students. When classroom observation data were disaggregated by working level of the class, additional troubling findings emerged. We saw a disproportionately large incidence of student off-task behavior in “skills” classes, compared to classes at the other levels (see Table 10). We also saw a disproportionately large incidence of apparent student confusion in the “skills” classes. In the opinion of the evalu-ators, these two indicators go hand-in-hand, and are further evidence of the need to provide professional development to teachers in how to deal with diverse stu-dent needs. To their credit, in over half the classes where we saw student confu-sion, teachers attempted to modify the lesson to meet their students’ needs. However, in several instances we saw no evidence of an attempt by the teacher to try a different approach.
Table 10
Classroom Attributes Observed Across Working Levels of the Classes
Attribute % of All
Classes Skills Class Percentage
Regular Class Percentage
Gifted/Talented Class Percentage
Expected percentage 23 28 49 Students off task 29 47 25 28 Students seem confused 30 57 15 27 Teacher makes no modifi-cations to lesson
10 72 0 28
Teacher modifies lesson 18 65 15 20 Teacher marches through the content
27 41 24 35
Teacher quest for right answer
25 26 22 52
Teacher has students elaborate/justify their re-sponses; seeks alternate solutions
30 24 36 39
Drill and practice 33 31 19 50 Investigative math 31 12 38 50
17
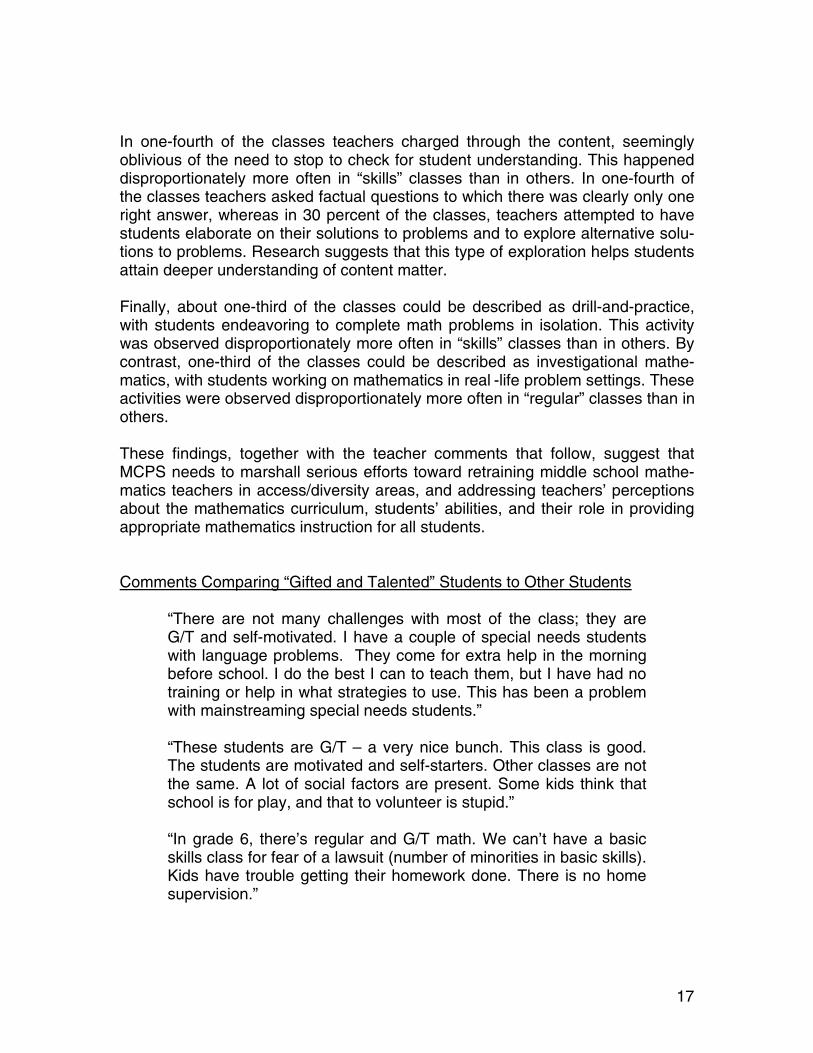
In one-fourth of the classes teachers charged through the content, seemingly oblivious of the need to stop to check for student understanding. This happened disproportionately more often in “skills” classes than in others. In one-fourth of the classes teachers asked factual questions to which there was clearly only one right answer, whereas in 30 percent of the classes, teachers attempted to have students elaborate on their solutions to problems and to explore alternative solu-tions to problems. Research suggests that this type of exploration helps students attain deeper understanding of content matter. Finally, about one-third of the classes could be described as drill-and-practice, with students endeavoring to complete math problems in isolation. This activity was observed disproportionately more often in “skills” classes than in others. By contrast, one-third of the classes could be described as investigational mathe-matics, with students working on mathematics in real -life problem settings. These activities were observed disproportionately more often in “regular” classes than in others. These findings, together with the teacher comments that follow, suggest that MCPS needs to marshall serious efforts toward retraining middle school mathe-matics teachers in access/diversity areas, and addressing teachers’ perceptions about the mathematics curriculum, students’ abilities, and their role in providing appropriate mathematics instruction for all students. Comments Comparing “Gifted and Talented” Students to Other Students
“There are not many challenges with most of the class; they are G/T and self-motivated. I have a couple of special needs students with language problems. They come for extra help in the morning before school. I do the best I can to teach them, but I have had no training or help in what strategies to use. This has been a problem with mainstreaming special needs students.”
“These students are G/T – a very nice bunch. This class is good. The students are motivated and self-starters. Other classes are not the same. A lot of social factors are present. Some kids think that school is for play, and that to volunteer is stupid.”
“In grade 6, there’s regular and G/T math. We can’t have a basic skills class for fear of a lawsuit (number of minorities in basic skills). Kids have trouble getting their homework done. There is no home supervision.”

18
Comments Pertaining to “Skills” Classes
“I face many challenges in helping my students to be actively en-gaged in math. Many of my students have some serious home problems, peer problems and self-esteem problems that often get in the way of their learning. They have very little available help out-side of the classroom and many do not practice math by doing homework, make-up work, projects, etc. Some of them want to be entertained all period long and they want to learn without doing anything. They still get excited by some new things, but the more games they play on the computer and the more video games they play and videos they watch, holding their interest (especially if they are lazy) is difficult at best.” “They want to know when they will ever use this [mathematics]. It’s a challenge keeping them on task. Little activities are okay for a moment, but it doesn’t pull them in.”
“This is a pre-algebra class. Some kids are in here because the low-level classes are so full. There is no time. Lots of children have learning needs – 6 students haven’t passed MFMT. They’re not motivated. They’re playful. Management is difficult. They can throw candy all day. The system is social promotion. Kids don’t know ba-sic multiplication. They can’t handle freedom. They can’t manage games – they throw the pieces away and across the room. Kids need many social supports and I can’t give it to them. There is no one at home. There is no time for MFMT. We have to do it after school. The activity bus takes these students home. These kids (at this level) won’t do homework and don’t follow directions in class. Sometimes they say they won’t do it. They’re lazy. They aren’t ready for high school. We meet about student concerns.”
Comments Pertaining to Pushing Students Ahead
“This class is called 7+ however most of them scored between 600-650 on the CRT’s in 6th grade. We really struggled with the first part of the lesson today (as opposed to the other group who jumped right in and were proud of their successes). They learn so slowly and they don’t remember and most don’t care. Kids don’t do homework. Parents think it doesn’t matter when the kids turn it in. There’s slow motion learning. Some who do it have trouble.”
“This is a class of students who just missed the traditional cutoff for Algebra I in 8th grade. Formerly, this would have been a pre-Alge-bra class. These are students who are being ‘pushed’ to achieve

19
their maximum potential. Large classes are a problem. We have kids who are having survival problems. They are more interested in their social life and less interested in math. They are impulsive and try to be non-conformists.”
“Some kids don’t know how to manage themselves; they have a lack of social skills. Including lower level math students has dumbed down the instruction. There is a problem with below grade level kids whose parents insist that they be in algebra. There is no time to prepare. There are too many expectations on schools.”
“They are very social and want to be engaged in everything else. Students who should not be in this class are still here – they are not ready for work (low scores on the CRT’s and low grades the previ-ous year). We have 3 7th grade Algebra classes now. I don’t agree with this. Many students aren’t ready. We are being pushed into it by parents.”
Implications and Recommendations The current analysis suggests that some teachers are more effective than others in mathematics instruction. The highest rated instruction (as measured by our classroom observation instrument) tended to be provided in 6th grade, and the lowest rated instruction provided in 8th grade. Differences in ratings of classroom instruction were also found when “gifted and talented” Algebra 1 classes were compared to classes that were called “regular” Algebra 1 – the “gifted and tal-ented” classes were more highly rated. When the ratings of mathematics lessons were examined in detail, it was found that teachers differed considerably in the variety of instructional strategies they used to try to meet the learning needs of all the students in their classes. The areas that appeared to be in greatest need of improvement were teachers’ use of wait time and their questioning strategies. Comments made by teachers, as well as data obtained in the classroom obser-vations suggest that students come to mathematics classes today with more di-verse learning needs than was true in the past. The observation data suggest that teachers frequently do not appear to have a broad enough repertoire of strategies at their disposal for addressing the diverse needs of the students. The totality of the data suggest that teachers would profit from professional de-velopment specifically targeted to students’ diverse learning needs. This pro-fessional development might include:

20
• modeling and practicing effective use of wait time; • learning about and practicing a variety of questioning strategies; • learning effective techniques for foreshadowing instruction, providing periodic
summaries of key concepts, and helping students to reflect on the most im-portant aspects of what they learned; and
• learning how to best couch mathematics instruction in real-world, problem-based settings.
Several new curriculum packages are currently being piloted in selected MCPS middle schools. One or more of the new curriculum packages might serve as an appropriate vehicle upon which the professional development activities could be based.