an analysis of next generation access networks deployment...
TRANSCRIPT

An Analysis of Next Generation Access Networks Deployment in Rural Areas
Claudio Feij60
CeDlnt - Technical University of Madrid, Spain [email protected]
Jose-Luis G6mez-Barroso
National University for Distance Learning
Abstract-Next generation access networks (NGAN) will support
a renewed electronic communication market where main
opportunities lie in the provision of ubiquitous broadband
connectivity, applications and content. From their deployment it
is expected a wealth of innovations. Within this framework, the
project reviews the variety of NGAN deployment options
available for rural environments, derives a simple method for
approximate cost calculations, and then discusses and compares
the results obtained. Data for Spain are used for practical calculations, but the model is applicable with minor modifications
to most of the rural areas of European countries. The final part of
the paper is devoted to review the techno-economic implications
of a network deployment in a rural environment as well as the
adequacy and possible developments of the regulatory framework
involved.
Keywords: next generation networks, fibre, mobile
communications, 4g, electronic communications regulation
I. BACKGROUND
The so-called Next Generation Networks (NGN) will be the supporting infrastructure of ubiquitous ultra-broadband. For the purposes of this paper, a NGN will be a single network which delivers multiple data applications -whether originally based on voice, data, and video- to multiple devices -whether fixed or mobile. In addition, it will be considered that the provision of services is decoupled from networks. The choice of access technology is simply a matter of costs (which in tum depend basically on demographic and geographic variables), possible re-use of existing infrastructures and the user's requirements (and expectations). The access part of a NGN is usually called Next Generation Access Networks (NGAN).
Precisely, the conditions for the deployment of NGAN are currently on the forefront of the debate about the role of telecommunication market developments, the best regulation for them and the level and modes of potential public involvement. In broad terms it can be said that we are currently in a very early stage of NGAN deployment - particularly out of main urban areas. This situation is influenced by relatively unknown technology roadmaps, possibly some doubts about the implementation of the regulatory scenario, as well as,
Madrid, Spain j [email protected]
Sergio Ramos
CeDInt - Technical University of Madrid, Spain [email protected]
especially, the economic uncertainties about the return on investments.
From the perspective of techno-economics, there is not a one-size-fits-all NGAN: the most suitable type of NGAN depends heavily on the re-use of existing infrastructures and on the type of geo-demographic area (the "geotype"). Indeed, operators invest in areas that are profitable. As dense areas are more profitable than rural ones, dense areas will be served first. If we consider geographic density as a continuum, there is a point where operators stop investing because it is no longer profitable. In fact, in most rural areas low population density and high deployment costs discourage private investments, creating a negative feedback of limited capacity, high prices, and low service demand.
As the profitability of any area depends basically on infrastructure costs, which tend to decrease slowly over time, there are some possibilities of less dense areas to become profitable as time passes by [ 1], all other parameters equal. However, this effect could be too slow and meanwhile it would impact significantly on equity in territorial terms for a potential long period of time. In fact, currently there is little or no commitment to connect areas that include smaller towns and rural villages [2]. Data collected by OECD have shown that, among the developed countries, those with a large urban population such as South Korea, Japan, France and the Netherlands are more likely to achieve a higher rate of broadband penetration than those with significant rural communities such as the United States and Canada [3].
Therefore, it is necessary to analyse the more suitable choices for NGAN deployments in these areas, depicting and accurate scenario of related deployment costs. This is the main objective of this paper. For this, a simple method for cost calculations will be derived using the data for Spain for reasons of availability. However, it would be applicable to most of the rural areas of European countries. Based on the results obtained, the techno-economic implications of NGAN deployments in rural areas will be reviewed as well as the adequacy and possible developments of the existing EU regulatory framework.
978-1-4577-1210-4/11/$26.00 ©2011 IEEE
II. GEOTYPES IN THE RURAL SCENARIO
The assumptions on geotypes for network deployment consider a classification in zones based on population density as the basic parameter affecting the cost of rolling out a NGAN. This is the most used approach to network deployment cost calculations, see for instance Analysis Mason [4].
For the particular case of Spain, a division into 10 different zones (numbered I to X) has been chosen. See Annex for a detailed description of the main parameters for the geotypes used in the calculations. Apart from the direct relevance of the case of Spain as a main European instance for NGAN deployment, it is interesting to note that data for Spain are relatively similar to the Euroland scenario [5]. The population in this area adds up to 46.4 million inhabitants, which is the mean of seven European states: France, Germany, italy, Holland, Spain, Sweden and the United Kingdom. Demographically, Euroland is made up by a few urban areas with a high population density, a greater number of suburban areas, many rural areas and very few remote areas. Last, there are 15.4 million households in Euroland and, of the total inhabitants, 17.3 million are employed in 3.2 million companies.
It is also worth to note that previous studies usually considered 3 to 7 zones. For instance, in the Euroland scenario [5] it was assumed that 50% of the population lived in urban areas (6,000 inhablkm2 population density), 35% in suburban areas (500 inhablkm2 density) and around 15% in rural areas (30 inhablkm2 density). G6mez-Barroso and Robles-Rovalo [6] chose a division into 7 zones for WiMAX calculations in Mexico, including rural areas. This is also the number used in Jeanjean [1] for NGAN calculations. Analysis Mason [7], apart from London, also selected 7 zones for its study on fibre deployment in the UK, however leaving aside the rural and remote areas. The motivation for using 10 different zones lies in enjoying more precise estimations in the "grey" areas that the competitive market providers could reach in the medium term as a function of technology, demand and public policies. In fact in the case of Spain about one quarter of the population lives in the 500 - 100 inhabitants/Km2 area, where the population density typical of suburban zones finishes and the rural type-ofdensity begins. Also in Spain, about 46% of the population lives in urban areas (above 1000 inhabitants/Km2), with an additional 10% in lower-density suburban areas. Remote rural areas (below 50 inhabitants/Km2) made up 12% of the population, but 77% of the territory.
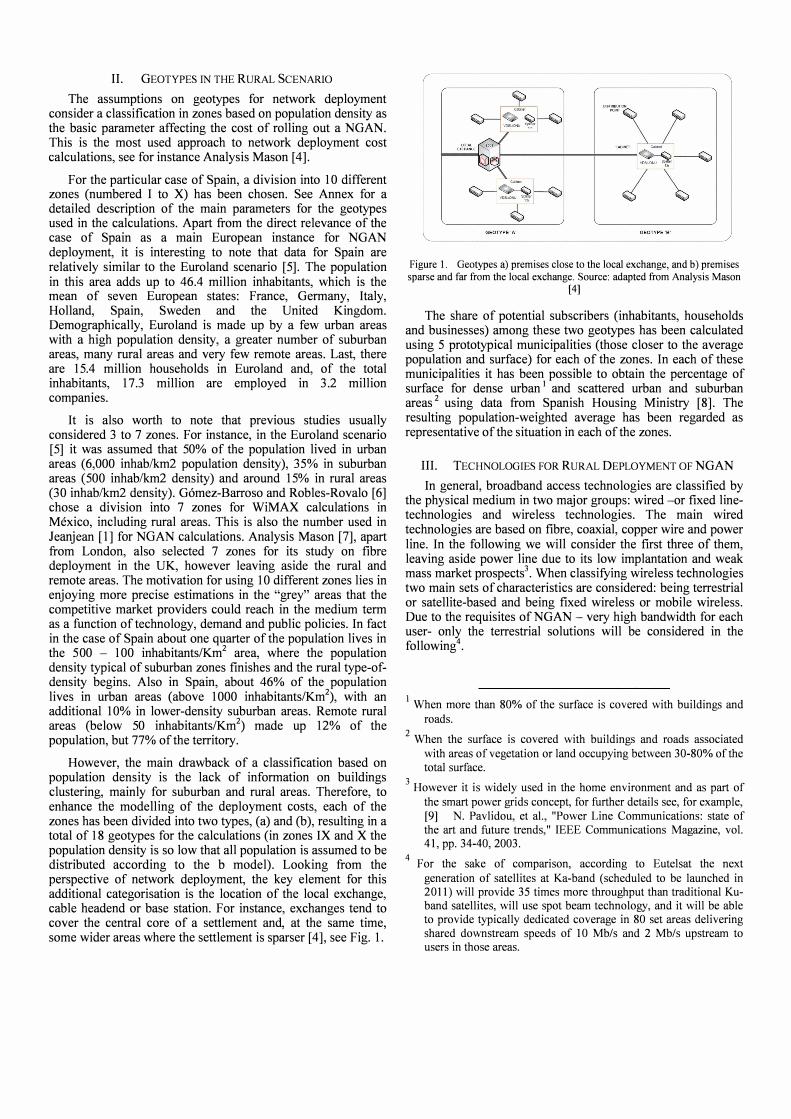
However, the main drawback of a classification based on population density is the lack of information on buildings clustering, mainly for suburban and rural areas. Therefore, to enhance the modelling of the deployment costs, each of the zones has been divided into two types, (a) and (b), resulting in a total of 18 geotypes for the calculations (in zones IX and X the population density is so low that all population is assumed to be distributed according to the b model). Looking from the perspective of network deployment, the key element for this additional categorisation is the location of the local exchange, cable headend or base station. For instance, exchanges tend to cover the central core of a settlement and at the same time some wider areas where the settlement is sp�rser [4], see Fig. 1.
'
Figure I. Geotypes a) premises close to the local exchange, and b) premises sparse and far from the local exchange. Source: adapted from Analysis Mason
(4)
The share of potential subscribers (inhabitants, households and businesses) among these two geotypes has been calculated using 5 prototypical municipalities (those closer to the average population and surface) for each of the zones. In each of these municipalities it has been possible to obtain the percentage of surface for dense urban 1 and scattered urban and suburban areas 2 using data from Spanish Housing Ministry [8]. The resulting population-weighted average has been regarded as representative of the situation in each of the zones.
III. TECHNOLOGIES FOR RURAL DEPLOYMENT OF NGAN In general, broadband access technologies are classified by
the physical medium in two major groups: wired -or fixed linetechnologies and wireless technologies. The main wired technologies are based on fibre, coaxial, copper wire and power line. In the following we will consider the first three of them, leaving aside power line due to its low implantation and weak mass market prospects3. When classitying wireless technologies two main sets of characteristics are considered: being terrestrial or satellite-based and being fixed wireless or mobile wireless. Due to the requisites of NGAN - very high bandwidth for each user- only the terrestrial solutions will be considered in the following4.
1
2
When more than 80% of the surface is covered with buildings and
roads.
When the surface is covered with buildings and roads associated
with areas of vegetation or land occupying between 30-80% of the
total surface.
3 However it is widely used in the home environment and as part of
the smart power grids concept, for further details see, for example,
[9] N. Pavlidou, et aI. , "Power Line Communications: state of
the art and future trends," IEEE Communications Magazine, vol.
41, pp. 34-40, 2003. 4
For the sake of comparison, according to Eutelsat the next
generation of satellites at Ka-band (scheduled to be launched in
2011) will provide 35 times more throughput than traditional Ku
band satellites, will use spot beam technology, and it will be able
to provide typically dedicated coverage in 80 set areas delivering
shared downstream speeds of 10 Mb/s and 2 Mb/s upstream to
users in those areas.

Each of technologies considered for the study has its advantages and disadvantages in terms of maximum bandwidth/transmission speed, reliability, cost of deployment and ease of coverage. Therefore there is not an obvious choice for all situations, and in practice a telecommunications operator will likely use a "mix" of technologies, as later discussed. Table I overviews some of the main milestones and features of the technologies involved in the deployment of NGAN compiled by the authors from publicly available industry data and forecasts.
TABLE I.
Features
Theoretical max. data rates
Typical data rates per user
Begin of massive deployment inEU
Enhanced version max. data rate Critical technologies
Main advantage
Main barrier (as of July 2011)
MAIN FEATURES OF POTENTIAL NGAN TECNOLOGIES FOR RURAL DEPLOYMENT
NGAN Technology
FTTH FTTC
HFC GPON
FTTB DOCSIS 3.0
LTE(4G) VDSL
2,SO Gb/s' 100 Mb/s 400 Mb/s 300 Mb/s
(downstr.) (downstr.) (downstr.) ( downstream)
1,2S Gb/s SO Mb/s 100 Mb/s 7S Mb/s
(upstream) (upstream) (upstream) (upstream)
100-2S0 30-S0 Mb/s
SO Mb/sb
1-10 Mb/sc
Mb/s (d) (downstr.)
(downstr.) (downstr.) S-IS Mb/s SO-100
(upstream) 10 Mb/s I Mb/s Mb/s (u) (upstream) (upstream)
2009 - 2012 2007 - 2010 2009 - 2011 2011 - 2013
Advanced DOCSIS LTE
l OG GPON DSL 4.0 Evolution
10 Gb/s 100-300 10 Gb/s I Gb/s
Mb/s
WDMA ONU CPE OFDMA
Guaranteed Re-use of Re-use of
Evolutionary legacy HFC
data rates network network
from 3.SG
Opto- Availability Deploy.
electronic Shared
of devices cost
equipment media
Shared media
a. Single fibre with current technology b. Depends on number of concurrent users
c. Depends on number of concurrent users and size of cell
The inclusion of 4G mobile technologies among NGAN might be controversial. In fact, as a general consideration, wireless technologies are around 3 to 5 years behind fixed ones in terms of data rates per user. However, they are about to reach the 10 Mb/s level per user with some consistency with peak speeds around 100 Mb/s. As a consequence a number of experts from the industry forecast that mobile broadband connections will overcome fixed ones sometime around 20 1 1-20 13 [ 10-12] and its impact will be considerable from NGAN perspective [ 13]. To this regard, and in the long run, the massive deployment of femtocells, mobile devices with cognitive radio capabilities and mesh network topologies could make wireless networks almost indistinguishable from most of today's ultrabroadband fixed solutions.
IV. METHODOLOGY
The methodology for the calculation of the deployment costs for NGAN technologies in rural scenarios departs from a
number of assumptions. First, the backbone network will not be included in the calculations5. Secondly, legacy networks will be consider where possible to re-use part of the infrastructure previously built by the same or other operators. The model has chosen the parameters for a situation reasonably as close to reality as possible. Data on lengths, types of terrain and re-use of existing infrastructures will be based on own estimations, see Annex for details.
Also the potential sharing of infrastructures between competitive providers has not been considered. On the one side, the presence of several operators leads to a potential lower utilization of assets per customer, as the customer base is shared among players, and therefore, increases the costs with regard to a monopolistic situation. On the other side, several operators depending on their commercial agreements, or the imposed regulations, can share different combinations of the infrastructures, decreasing the incurred costs per customer. Some implications of sharing infrastructures among operators are briefly considered in the results section.
Next, the model presented in this paper intends to be as agnostic as possible with regard to demand, as it had been pointed out before6. However it is required to include some assumptions about it since some of the costs calculations are dependent on the actual number of customers in the network. To simplify the calculations take-up is assumed to represent net additions to the network (therefore including the effect of chum) and it is also assumed that it will happen at 10% constant rate with regard to the total of potential subscribers. This means that if, for instance, the network is deployed in 4 years, the level of 80% of the total potential subscribers would be reached in 9.5 years. Once the maximum level of subscribers is attained it will remain indefinitely at that number. Obviously, this is an optimistic scenario for each technology in terms of adoption, but from the perspective of costs is a worstcase scenario. The chum rate will be 20% of existing customer base or, equivalently, on average each customer changes operator every five years, a figure similar to the existing chum in mobile networks.
To calculate the present value of investments, a weighted average cost of capital (WACC) of 12% is considered, in
5 For the interested reader the paper from De Antonio et al (2006)
offers some estimation on the capex and opex for building such a backbone network from the scratch, using both a top-down
analysis and a bottom-up approximation. For example,
considering a case similar to Spain, the backbone network
included 8 core routers, 77 service edge routers and 23,000
aggregation devices for the access traffic and the appropriate
length of fibre. It was calculated that the investment needed
(including the backbone, aggregation and edge sections)
amounted to 8.300 ME. [14] 1. De-Antonio, et aI. , "A
European perspective on the deployment of next generation
networks," The Journal of the Communications Network, vol. Vol
5, part 2, pp. 47-55, 2006.
6 Other potential choice would be to decide that the network is
absolutely universal and minimum demand assumptions are made,
an approach used for instance in De Antonio et al [14] ibid . .
However, this i s thought a s too unrealistic, leading t o increased
cost estimations.

accordance to previous studies 7 and financial conditions for European broadband operators [7]. The rate of average yearly inflation is estimated at 2%, the objective of the European Central Banle Operating expenses are calculated just for the 10 first years of operation.
V. DEPLOYMENT MODEL DESCRIPTION
As regards the deployment model, it is considered that the network will reach 100% both of individual and business users8
in 10 years. From here it should be noted that potential users are not the same for fixed and mobile technologies. The total number of potential users of fixed networks is 17.9 million. However, only up to 80% of them will subscribe to a given network, i.e., they will be customers of a particular broadband service offering. The total number of potential users of mobile networks is 53.3 million, representing a 114% mobile penetration, similar to the latest data available for Spain [ 15]. Again, only up to 80% of them will belong to a given network at a certain time and in a certain area.
Three different network models are used in order to calculate the CAPEX and OPEX of wired (FTTH and DOCSIS technology) and wireless technologies that can be deployed, as depicted in Figs 2 to 5, and detailed in the Annex.
The detailed information about ratios and distributions of the distances, as well as the cost of every item involved in the deployment, operation maintenance and management of the networks considered are presented also in the Annex.
The limiting factor for quality in a FTTH-OPON and in a FTTCIVDSL2 deployment is the shared OL T card managing one fibre at the local exchange. For the calculations it has been supposed that each OL T card can manage 2,5 Obis per 64 users maximum. It has been also assumed that in FTTCIVDSL 20% of the users (those very close to it) can be served directly from the local exchange using existing copper wire and without installing any fibre. In the DOCSIS case, the limiting factor for quality is the number of channels shared among customers at the headend. Two implementations have been chosen: the first just the update of the existing network for DOCSIS 3.0 and a new implementation able to offer 50 Mb/s per user 80% guaranteed. The figures for this last implementation could be equivalent to a new plant deployment (no re-use of ducts and a ring topology). Finally, the limiting factor for quality in a LTE deployment is the amount of spectrum bandwidth allocated to a single operator. It has been set at 1800 Mb/s as the maximum total speed available for all users covered by the cell.
7 This value has been calculated adding the interest rates (around 2 to
3%) to a 7-9% representing investment-related financial and
market risks.
8 For comparison, in the Analysis Mason report for Of com the fibre
network only reaches 66% of potential users [7] Analysis
Mason, "Competitive models in GPON," Of com, London 1st December 2009.
TO 8ACKHAUL
""'" , ... ....a:m ·0
B�CKHAUL
Figure 2. Sections for cost calculations in FTTx
Figure 3. Sections for cost calculations in cable DOCSIS 3.0
de ......
' .........
Figure 4. Sections for cost calculations in 4G mobile communications
All the data for network element costs are supplied by the industry at 20 II prices, either publically or through direct interviews.
VI. RESULTS AND DISCUSSION
In this section the results of the cost modeling of the different options for a NOAN are presented. All the costs are discounted to give their present value.
A. Capex, opex, total costs and level of investment
To begin with, the present value of the total capex by areas of maximum 16,384 users and by geotype is shown in Table II. Note that the figures presented are a good approximation to the capital investment required to deploy a neutral operator in a typical municipality of each of the geotypes, re-using existing civil infrastructures where possible.
TABLE [I.
Geotype
VI (500-100 inh/km2) VII (100-50 inh/km2) VIII (50-10 inh/km2) IX (10-5 inh/km2) X «5 inh/km2)
PRESENT VALUE OF TOTAL CAPEX (M€) FOR ACCESS AREA (MAX. 16,384 USERS) AND BY GEOTYPE
NGAN Technology HFC
FTTH FTTC DOCSIS LTE (4G) b GPON VDSL
3.0a
9.44 3.89 15.67 6.40
1.60 0.75 3.92 1.51
1.53 0.37 1.96 0.73
0.58 0.29 0.49 0.22
0.40 0.07 0.24 0.12
a. Max. 50Mb/s b. At2.6 GHz
The present value of the total capex by zone is presented in Table III, while the annualized (i.e., divided by the number of years for the roll-out) present value per user is shown in Table IV. This table is provided to supply an easy comparison as a minimum floor with annual ARPU levels. From the figures it can be seen that, rather obviously, the costs increase with lower densities of population. They also show that wireless technologies are more cost-efficient in these lower density areas. On the contrary, it is in the higher density areas where FTTC-VDSL and DOCSIS are the less expensive as they re-use the existing infrastructures. Note that FTTH is the costlier option whatever zone is considered.
TABLE III.
Geotype
VI (500-100 inh/km2) VII (100-50 inh/km2) VIII (50-10 inh/km2) IX (10-5 inh/km2) X «5 inh/km2)
TABLE [V.
Geotype
VI (500-100 inh/km2) VII (100-50 inh/km2) VIII (50-10 inh/km2) IX (10-5 inh/km2) X «5 inh/km2)
PRESENT VALUE OF TOTAL CAPEX (M€) BY GEOTYPE
NGAN Technology
FTTH FTTC HFC
DOCSIS LTE(4G)b GPON VDSL
3.0"
2,298 948 3,813 1,558
518 241 1,269 489
1,356 329 1,738 646
364 184 309 140
261 49 161 84
a. Max. 50Mb/s b. At 2.6 GHz
ANNUALISED PRESENT VALUE OF CAPEX PER USER (€) BY GEOTYPE
NGAN Technology HFC
FTTH FTTC DOCSIS LTE(4G)b GPON VDSL
3.0a
576 238 957 391
390 182 956 369
746 181 956 357
1,127 570 957 437
1,554 289 957 482
a. Max. 50Mb/s b. At 2.6 GHz
Another very relevant aspect of comparison among NGAN technologies refers to the cost of guaranteed data rate per user. Usually, when comparing these technologies, this very fundamental perspective is not clearly considered if at all. Table V shows the cost of 10 Mb/s of guaranteed data rate per user for different NGAN technologies and by geotype. Note that for these calculations, the size of the access area in the case of wireless technologies has had to be reduced, therefore increasing the costs of deployment with regard to above results. Also cable has assumed to be already deployed and only the upgrade to DOCSIS 3.0 is needed.
TABLE V.
Geotype
VI (500-100 inh/km2) VII (100-50 inh/km2) VIII (50-10 inh/km2) IX (10-5 inh/km2) X «5 inh/km2)
COST OF 10 MBPS GUARANTEED DATA RATE PER USER (€) BY GEOTYPE (50% PENETRATION)
NGAN Technology
FTTH FTTC HFC
GPONa VDSLb DOCSIS LTE(4G)d
3.ff
1,149 632 251 6,075
259 161 84 1,901
678 220 114 2,508
182 123 20 550
131 32 11 328
a. 40 Mbps b. 30 Mbps c. 30 Mbps d. 10 Mbps
apex per user for the year 20 15, a year representative of established operations, is shown in Table VI. apex is dominated by typical operating costs: maintenance, support, billing, etc, in any technology.
TABLE VI. OPEX PER USER (€) FOR THE YEAR 2015
NGAN Technology
Geotype FTTH FTTC HFC
DOCSIS LTE(4G)h
GPON VDSL 3.0a
Opex per user 204 208 218 197
Support, management
58 75 85 30 and provision per user
a. Max. 50Mb/s b. At 2.6 GHz
Finally, the present value of the total cost per subscriber by geotype is presented in Table VII.
TABLE VII. ANNUALISED PRESENT VALUE OF CAPEX PER USER (€) BY GEOTYPE
NGAN Technology
Geotype HFC FTTH FTTC DOCSIS LTE (4G) b GPON VDSL
3.0a VI (500-100
826 277 1,020 594 inh/km2) VII (100-50
717 222 1,022 571 inh/km2) VIII (50-10
1,167 220 1,022 558 inh/km2) IX (10-5
1,569 610 1,023 635 inh/km2)

NGAN Technology
Geotype HFC FTTH FTTC DOCSIS LTE(4G)b GPON VDSL
3.0a X «5
1,997 328 1,026 704 inh/km2)
a. Max. 50Mb/s b. At 2.6 GHz
B. Sensitivity analysis
Departing from the base calculations presented in the previous sub-section, Table VIII presents the effects on the costs of several other situations.
TABLE VIII. SENSITIVITY ANALYSIS (%) OF PRESENT VALUE OF TOTAL COSTS
Geotype NGAN Technology
FTTHGPON FTTCVDSL
Deployment in 5 years instead oflO 22% 16% years Coverage of 80% of premises -40% -27% instead of 100% Coverage of 60% of premises -59% -46% instead of 100% Increase of 10 Mb/s of guranteed 1% 12% speed per user Increase of WACC from 12% -7% -5% to 15% Decrease of 30%
-22% -11% of civil works cost Sharing passive infrastructures
-20% -10% between 2 operators Increase of 40 MHz of allocated - -spectrum
VII. A DECALOGUE OF CONCLUSIONS
LTE(4G)a
34%
-19%
-40%
69%
-8%
-14%
-5%
-10%
a. At 2.6 GHz
Undoubtedly, the deployment of NGAN is the technical and business element around which the future evolution of the information and technology sector revolves. However, numerous uncertainties remain regarding their development. Some operators have started to invest but maintain their doubts over whether the applications and services offered over a NGAN shall be sufficient to provide a return to investment specially in rural areas and, at present, they are not sure which killer application, if any, will develop to provide sufficiently a new revenue stream for ultra-broadband networks.
In this scenario of uncertainty, more research works are required focusing on the economic, fmancial and regulatory aspects of NGAN in rural areas. The analysis that has been presented here, although quite simple and rough, allows extracting a few important consequences.
A. Investment, investment, investment
First, and the datum is not less important despite being expected, it is clear that -any- NGAN requires major
investments. Also, and as a consequence, the recovery of these investments implies that the prices charged for access and usage of the services will not differ much of current prices. Every study agrees on this point [ 1, 4, 7, 14]. Thus, it seems probable that the companies interested in deploying NGAN will aim first towards competition in new and attractive offers of services for the users than in prices, since any war of prices entails a reduction of the present and future ARPU
B. A technology "mix"
Should the demand for large bandwidths appear, the case could be that no access technology by itself, at least with the technical and economic conditions expected as of today, could present the optimal characteristics for satisfying all the requirements demanded by the users in every circumstance. This has been shown in the model presented where the cheapest technologies per user are those offering the lowest speeds and the contrary being also true. However, the prices per 10 Mb/s show a different picture. Here, those technologies, such as FTTH, able to supply higher speeds appear as more competitive. They are also the technologies more easily scalable if the target is to increase significantly the speed over the existing infrastructure in some future. Wireless technologies lie in some middle ground: low speeds and intermediate costs.
Therefore, the case of different advantages and drawbacks for each technology, backed by the need to achieve a return on the investments, is leading operators to create platforms capable of integrating different access technologies over the same backbone network. The future market of the information and communications sector, characterised by "comprehensive" operators, would be, in this case, quite different from the current one, where there is a clear separation between technologies. Thus, any -policy, regulatory- measure to facilitate the "mix" of technologies without compromising competition would help to produce the case for the deployment of NGAN.
C. Distinct departure points and transition paths
However, the departure point for the different types of operators (historic, cable, wireless, alternative and even new agents) is not the same. These initial differences are conditioning, and shall do so in the future, the path followed for the transformation of their networks into NGAN. The cost calculations carried out support this first impression. As a consequence, each operator will have a different set of drivers for migrating to NGAN [16]. These drivers will dictate their base time frames for investing in this advanced infrastructure, and subsequently migrating services from existing networks.
D. Each NGAN is different
Comparing different types of NGAN from the supply side is a difficult exercise with significant risks. In fact, a careful look into NGAN reveals that there are no easy conclusions.
Data rates are arguably the most tempting parameter for such a comparison. If we take an absolute value such as 50 Mb/s, not even a currently typical implementation of FTTH will ensure this speed for 100% of the users all of the time. Therefore, the expected market share and the expected number

of concurrent users matter to set the real data rate. In particular, cable DOCSIS, due to its "shared-channel" architecture, is a system where the number of concurrent users changes dramatically the maximum speeds available, restricting at times even the meaningfulness of comparisons among implementations of the same technology. But also matters time. Maybe today's implementation of VDSL only reaches 30 Mb/s at several hundred metres from user premises, but new developments promise to exceed 50 Mb/s at distances above 1 Km. And not each NGAN addresses the same type -and amount- of users. Wired networks are typically for premises and wireless networks for persons. Therefore wireless systems can serve about three times the subscribers of a fixed network (and enjoy up to triple revenues). At the same time boundaries blur: picocells and femtocells create a convergence where both fibre and radio are needed and no longer is the distinction between technologies valid.
E. Sharing irifrastructures
Sharing infrastructures has already been considered in the regulation, see Ruhle & Lundborg [ 17] and it is an area where operators are showing renewed interest. According to the model developed, sharing infrastructures can decrease costs significantly. This is not only important for wired solutions, but for wireless players, where they can achieve higher savings if they go beyond the mere civil works to share some types of active equipment -up to 30% according to Norman [ 18]- or even spectrum. Apart from reducing costs, infrastructure sharing can accelerate roll-out, stimulate competition, decrease the troubles of deployment for the public and have environmental benefits (sharing power supplies for instance). There are also some evident risks of collusion.
F. Long life to copper wires
Copper lines continue to be a strategic asset well into the middle term. Not only are they able to provide right now speeds that would fall into the NGAN category but, in addition, they allow for a smoother and more scalable path in the transition from ADSL to FTTH. Indeed, about 20% of potential subscribers to a NGAN live close enough to the local exchange so as to be directly provided with a VDSL2 solution from this local exchange and, therefore, requiring just a modest investment in the equipment there. Existing copper -in the part closer to subscriber premises- also allows rolling out FTTC and FFTB solutions to be completed with VDSL2 that could serve as a first step towards a definitive FTTH solution while re-using all fibre deployed so far. Last but not least new developments complemented by fibre could extend the copper capacity well into the 100 Mb/s range.
G. Cable networks, the key to a competitive landscape
The upgrade of existing cable networks with DOCSIS 3.0 is, together with VDSL from local exchange, the cheapest alternative for the deployment of NGAN in a country such as Spain. Therefore, cable networks, where they already exist, play a key role in the competitive scenario. Therefore, from the perspective of competition among different providers of NGAN, an interesting solution would be to ensure that, maybe even with some type of public support, the conditions for the
cable operators to obtain the required funding are met and they effectively deploy these solutions into the market as soon as possible.
Moreover, cable operators in Spain have a highly relevant asset when taking the perspective of NGAN: according to CMT [ 19] figures almost 40% of premises have, in addition to coaxial cabling, a copper wire deployed in parallel with the former. Due to the architecture of cable networks this copper line runs typically for the last 500m to user premises. Therefore, there wou�d be possibilities to re-use this copper wire (with VDSL2, for Instance) to provide an additional means of deploying NGAN for interested parties.
H. NGAN, wireless solutions and spectrum
It has not been properly understood yet the role of wireless access technologies as a fundamental part of NGAN. In fact, their use for access from mobile operators it is just a different way to address the same broadband target, but, adding along the road, the mobile advantages: a maybe much more reasonable approach in terms of financing and technology evolution, avoiding the disruptive leaps required in fixed infrastructures. In addition, wireless NGAN are the only scalable solution in terms of infrastructures for areas of low density of population. They are also a complement to NGAN competition in almost any area.
At the same time, it is true that radio-based systems are able to provide today about one tenth of sustained speed compared to wire line solutions and that this difference has been kept constant for the last years. But it is also true that the developments required to improve the capabilities of radiobased systems are at --close- sight: opening of additional spectrum, more efficient spectrum management practices, much smarter radios to access appropriate frequencies at each moment and process signals more efficiently. Therefore, although there is "a limit to the ability of wireless technology to be full players in high-speed Telecom 3.0" [20] and the investments are considerable, there is still room enough for wireless to play a role in medium-speed uses or even higher at low density of population rural areas. As the model shows, 5 Mb/s of mobile sustained speed, with much higher peaks depending on the number of concurrent users, and at a cost below that of FTTH could have a significant impact of the NGAN market. This result is coincident with some recent st�dies. For instance, according to Analysis Mason, terrestrial WIreless technology could be used to provide broadband connections to the final 15% of UK homes not covered by fiber connections. They also acknowledge that the wireless element would be sufficient for households of average usage, after modeling low, medium and high-use scenarios, but only if the number of base stations and spectrum available was increased [21]. Therefore, the usage of spectrum for wireless solutions appears as a main element in configuring the NGAN landscape.
Two are the main relevant parameters for allocation of spectrum to wireless operators: the amount of spectrum (bandwidth) and the band of operation.
The amount of spectrum required per mobile operator depends fundamentally on the level of quality of service including the number of users concurrently accessing mobil�

data -density of users-, type of usage -more than 90% of traffic non-voice in 2013 [ 12], evolution of user perceptions about service quality, and the size of the cell relative to the population density. But also depends on the ability of the mobile transmission technology to manage and re-use frequencies and on the topology and type of the network. In the calculations for the model it was allocated at least 40 MHz of spectrum (already a considerable quantity) to achieve a relatively modest 5Mb/s data rate. It is obvious that, maintaining the level of investment, more bandwidth would be required to offer higher speeds to users. Therefore, a significant new quantity of spectrum should be freed up and allocated to operators so as to turn wireless solutions in an actual opportunity. This road is precisely being taken by a number of countries. For instance, the FCC has the ambitious goal to make 500 MHz of spectrum available for mobile broadband over the next 10 years, 300 MHz of them in the next five years. In the case of the EU, the need for spectrum has prompted to adopt a decision aimed at harmonising the allocation of the 790-862 MHz band spectrum, the well known digital dividend. In addition, the amount of frequency spectrum allocated to an operator has also a direct impact on costs, as it allows delivering more speed per user without decreasing the size of the cell.
The choice of the frequency band for the allocation has a significant impact on costs. For instance, the EU claims that infrastructure equipment for the 800MHz band was expected to be 70 % cheaper than that required for the radio frequencies in use on 3G networks. It has also advantages in terms of propagation, since it should provide operators with improved coverage and in-building penetration in comparison with most current 3G bands. Due to this propagation effects in theory it would look like the lower frequencies of operation saving a significant amount of base stations. But this is only partially true. The limiting factor in a wireless NGAN of the type described in this report is the quality of the service per user, and not the maximum coverage of the cell as a function of the frequency of operation. However, using lower frequencies allows an initial deployment with much less base stations that later could be completed at the same or other frequencies, and it still valid as the best solution for low density areas.
I. A baseline/or the market and/or policy action
The above considerations translate in a baseline for market behaviour. In 2015 it would be relatively possible for Spain to enjoy a "2+" infrastructures-based competition (incumbent, cable operator and mobile operators) for NGAN at about 50% of premises (i.e., 9 million of households and businesses). Beyond this point the required investments would be much higher. The cheapest choice would be for a "1 +" infrastructures-based competition (incumbent using VDSL-type technology and mobile operators) in an additional 10% of the population, with an added cost for the VDSL of about 400 M€. For the rest of the population, the most probable option would be no access to NGAN except maybe some scattered local initiatives and some mobile 4G deployments in some particular areas, very dependent on the conditions on new spectrum licences. These figures appear lower than the objectives set out in the "Avanza" plan [22]: 70% of the population with availability of broadband at a 50 Mb/s speed or higher and 60%
of the population with availability of broadband at a 100 Mb/s speed or higher. No regulatory "carrot" seems able to easily increase the investment in the required zones, and neither a huge public effort to compensate lack of pure market action seems possible under the current economic conditions.
J. The limits 0/ market action in the rural areas
In the case of Spain the transition between semi-urban and rural areas happens between zone V (zones I-V include 57% of the population and just 1,4% of the surface) and VI (zones VIX include the remnant 43% of the population and 98,6% of the surface). In other words, the discontinuity in potential profitability appears at the 500 inhabitantslkm2 population density where the figures for capex per user jump well over the 1.000 € threshold for any technology, and where the "growth of costs overcomes the growth of the consumption of households in broadband communications" [23].
Thus, as the profitability of this areas depends basically on infrastructure costs, which tend to decrease slowly over time, there are some possibilities of less dense areas to become profitable as time passes by [1]. However, this effect could be too slow and meanwhile it would impact significantly on equity in territorial terms for a potential long period of time.
The picture on the investments required to cover the less dense zones looks rather different when just a small area is considered. Here, because, just one area is considered, it would be possible to deploy a NGAN in a small town or village at an affordable cost, especially if taken into consideration the slow development of the market towards these areas. We could, therefore, be confronted relatively soon with a "patchwork" of local initiatives which try to solve the market failures by their own means.
REFERENCES
[I] F. Jeanjean, "Financing the next generation infrastructures.
Consumer subsidies or infrastructure subsidies?, " presented at the EuroCPR
2010, Brussels, 2010.
[2] 1. P. R. Pereira, "A cost model for broadband access networks:
FTTx versus WiMAX " presented at the Access Networks & Workshops,
2007. AccessNets '07. Second International Conference on 2007.
[3] M. H. Sherif and Y. Maeda, "Standards for broadband access and
beyond, " IEEE Communications Magazine, vol. 48, pp. 136 - 138, 2010.
[4] Analysis Mason, "The costs of deploying fibre-based next
generation broadband infrastructure, " Final report for the Broadband
Stakeholder Group, London2008.
[5] S. Forge, et at., "The demand for future mobile communications
markets and services in Europe, " Institute for Prospective Technological
Studies - JRC - EC EUR 21673 EN, 2005.
[6] 1. Gomez-Barroso, Robles-Rovalo, A. , "Wireless hopes for
universal service in developing countries: an assessment of the Mexican
context, " info, vol. 10, pp. 83-91, 2008.
[7] Analysis Mason, "Competitive models in GPON, " Of com, London
1st December 2009.
[8] Ministerio de Vivienda. Atlas estadistico de las areas urbanas 2006
[Online]. Available:

http://siu.vivienda.es/portallindex. php?view=article&catid= 19%3 Aatlas
digital-de-las-reas-urbanas&id=57%3Aatlas-estadistico-de-Ias-areas-urbanas-
2006&option=com content<emid=73&lang=es
[9) N. Pavlidou, et a/., "Power Line Communications: state of the art
and future trends, " IEEE Communications Magazine, vol. 41, pp. 34-40, 2003.
[10) D. Nerandzic, "Emerging technologies and their implications on
regulatory policy, " presented at the 17th Biennial Conference of the
International Telecommunications Society "The changing role of the
telecommunications industry and the new role for regulation ", Montreal,
Canada, 2008.
[II) S. Ouvrier, "Driving key technologies for next generation mobile
networks, " presented at the ICT Mobile Summit 2008, Stockholm, Sweden,
2008.
[12) A. Aguado, "Innovacion tecnologica y espectro, " Regulatory and
economic policy in telecommunications, vol. 2, pp. 41-48, 2009.
[13) S. Ramos, et al., "Next Generation Mobile Network Deployment
Strategies, " Journal of the Institute of Telecommunications Professionals, vol.
3, pp. 13-19, March 2009 2009.
[14) 1. De-Antonio, et at., "A European perspective on the deployment
of next generation networks, " The Journal of the Communications Network,
vol. Vol 5, part 2, pp. 47-55, 2006.
[15) EC, "Progress report on the single European electronic
communications market 2008 (14th report), " E. Commission, Ed., 24/03/2009
ed. Brussels, 2009.
[16) M. N. O. Sadiku and T. H. Nguyen, "Next generation networks, "
IEEE Potentials, vol. 21, pp. 6-8, Apr.-May 2002 2002.
[17) E.-O. Ruhle and M. Lundborg, "EU policy for next generation
access - an innovative or incremental step forward?, " Telecommunications
Policy, vol. 34, pp. 36-44, 2010.
[18) T. Norman. (2010, 17 June 2010). Wireless infrastructure sharing
saves operators 30% in capex and 15% in opex. Available:
http://www.analysysmason.com/About-Us/News/lnsightiWireless
infrastructure-sharing-saves-operators-capex-and-opexl?journey= I 17,55
[19) CMT, "Informe anual 2008, " Comision del Mercado de las
Telecomunicaciones, Barcelona2009.
[20) E. Noam, "Regulation 3.0 for telecom 3.0, " Telecommunications
Policy, vol. 34, pp. 4-10, 2010.
[21) Analysis Mason, "The costs and capabilities of wireless and
satellite technologies - A 2016 snapshot, " Broadband Stakeholder Group,
London26 Oct 2010 2010.
[22) MITYC, "Plan Avanza 2. Estrategia 2010-2015, " Ministerio de
Industria, Turismo y Comercio. Secretaria de Estado de Telecomunicaciones y
para la Sociedad de la Informacion, Madrid, Espafia201O.
[23) K. Rupp and S. Selberherr, "The economic limit to Moore's Law, "
Proceedings of the IEEE, vol. 98, pp. 351-353, 2010.
[24) INE. Censo nacional de poblacion y viviendas 2001 [Online).
Available:
http://www.ine.es/jaxi/menu.do?type=pcaxis&path=%2Ft20%2Fe242&file=in
ebase&L=
[25) fNE. Directorio central de empresas 2009 [Online). Available:
http://www.ine.es/jaxi/menu.do?type=pcaxis&path=%2Ft3 7%2 Fp20 I &fi le=in
ebase&L=O

TABLE IX.
Zone I
Population density >10 000 hab/km2
Number of 17
municipalities
Total population 2 707 360
Population per 159 256
municipality
% of national population 5,79 %
% of national population 5,79 %
(accumulated)
Total surface (km2) 179,14
Surface per municipality 10,54
% of national surface 0,04 %
% of national surface 0,04 %
(accumulated)
Population density 15 113
(inhlkm2)
Number of buildings 150.991 Inhabitants per bulding 17,93
Buildings density 842,87
(b/km2)
Number of households 956.677
Persons per househo1da 2,63
Number of businessesb 247.676
Number of households 1.204.353
and businesses (nusc,)
Households and 7,82
businesses per building
Multi-dwelling units 110.542
% of total buildings 73%
Single-unit buildings 40.449
% of total buildings 27%
ANNEX - DEMOGRAPHIC OAT A
SUMMARY OF DEMOGRAPHIC DATA FOR SPAIN (2001 FOR POPULATION AND HOUSEHOLDS, 2009 FOR BUSINESSES). SOURCE: INE [24,25]
II III IV V VI VII VIII IX X Total
10-5 000 5 -3 000 3 -1 000 1 000-500 500 -100 100-50 50-10 10-5 <5 hab/km2
hab/km2 hab/km2 hab/km2 hab/km2 hab/km2 hab/km2 hab/km2 hab/km2
28 46 175 209 946 745 2705 1444 1797 8112
6 300 119 3 832 203 8 596 709 5 016 333 I I 326 891 3 574 008 4 406 394 668 735 317 055 46 745 807
225 004 83 309 49 124 24 002 11 973 4 797 1 628 463 176 5 763
13,48 % 8,20 % 18,39 % 10,73 % 24,23 % 7,65 % 9,43 % 1,43 % 0,67 % 100 %
19,27 % 27,47% 45,86 % 56,59 % 80,82 % 88,47 % 97,90 % 99,33 % 100 % 100 %
I 086,33 969,99 5 278,55 7 103,38 50 561,39 52 638,58 185 348,40 92 937,96 108 573,47 504 677,19
38,80 21,09 30,16 33,99 53,45 70,66 68,52 64,36 60,42 62,21 0,22 % 0,19 % 1,05 % 1,41 % 10,02 % 10,43 % 36,73 % 18,42 % 21,49% 100 %
0,26 % 0,45 % 1,50 % 2,91 % 12,93 % 23,36 % 60,09 % 78,51 % 100 % 100 %
5 799 3 951 1 629 706 224 67,9 23,8 7,20 2,92 92,63
349.457 292.268 1.001.308 768.534 2.546.655 1.195.033 2.088.085 517.713 374.469 9 284 513 18,03 13,11 8,59 6,53 4,45 2,99 2,11 1,29 0,85 5,03
321,69 301,31 189,69 108,19 50,37 22,70 11,27 5,57 3,45 18,40
2.076.924 1.170.050 2.509.817 1.406.991 3.106.774 1.056.207 1.486.870 273.065 143.794 14.187.169
2,74 2,95 2,88 2,91 2,96 2,93 2,78 2,55 2,37 2,85
536.081 311.978 709.653 400.875 880.898 270.780 330.552 50.376 24.361 3.763.229
2.613.005 1.482.028 3.219.470 1.807.866 3.987.672 1.326.987 1.817.422 323.441 168.155 17.950.398
7,34 4,96 3,14 2,29 1,53 1,08 0,85 0,61 0,44 1,89
236.055 146.786 395.617 254.702 678.233 274.232 383.016 72.718 49.757 2.601.658
68% 50% 39% 32% 27% 23% 18% 14% 13% 28%
113.402 145.482 614.181 542.133 1.833.646 921.000 1.706.285 442.955 323.816 6.683.349
32% 50% 61% 68% 73% 77% 82% 86% 87% 72%
a. INE data only gives number of households with 1,2, 3, 4, 5,6 and 7 or more persons. The figures in the table have been obtained supposing a maximum number of7 persons per household
b. Businesses per municipality are obtained from businesses per province distributed proportionally to the population of the municipality. This approach includes the number of different locations for the same business.

TABLE X. NUMBER OF POTENTIAL SUBSCRIBERS TO NGAN AS A FUNCTION OF GEOTYPE. SOURCE: OWN ESTIMATIONS FROM INE [24, 25] AND MINISTERIO DE VIVIENDA [8]
Total potential % of potential
Geotype subscribers Total population subscribers and (households + population per
businesses) zone alb VIa (500 - 1 00 inhlkm2)
1 .232.2 1 0 3 . 500.065 3 1 %
Vlb (500 - 1 00 inhlkm2) 2 .755 .46 1 7 .826.826 69%
VIla ( 1 00 - 50 inhlkm2) 741 .787 1 .997 .873 56%
VIIb ( 1 00 - 50 inh!km2) 585 .200 1 .576 . 1 3 5 44%
VllIa (50 - 10 inhlkm2) 790 .356 1 .9 1 6.242 43%
VIIIb (50 - 1 0 inhlkm2) 1 .027.066 2.490. 1 52 57%
IX ( 1 0 - 5 inhlkm2) 323 .44 1 668.735 1 00 %
X « 5 inhlkm2) 1 68 . 1 5 5 3 1 7 .055 1 00 %

ANNEX � COST CALCULATIONS ASSUMPTIONS
TABLE XI. NUMBER OF POTENTIAL USERS (PREMISES) PER ACCESS AREA, SPLITTER RATIO AND NUMBER OF FIBRES, DIVISION POINT, CABINETS AND DISTRIBUTION BOXES PER GEOTYPE
Minimum Number of Number of Number of Number of Number of number of Total splitter fibres at each Number of fibres at each Number of fibres at each Number of fibres at each Zone users per fibres at the ratio (r,pH' division points division points access area A segment B segment cabinets (ncab) C segment D segment (n .... a)
exchange =r splitl X r split2 ) (nfibreA) at A-B (nd;vAB)
(nfib"B) (nfib"c) at C-D (nd;vCO) (nfib"O) (nfib,,) VI (500-100
16384 256 8x8 96 (min 64) 4 16 (min 8) 32 96 (min 64) 32 inh/km2) VII (100-50
4096 64 8x8 24 (min 16) 4 8 (min 4) 16 48 (min 32) 16 inh/km2) VIII (50-10
2048 32 8x8 16 (min 8) 4 8 (min 2) 16 24 (min 16) 16 inh/km2) IX (10-5
512 8 Ix8 16 (min 2) 4 3 (min 2) 4 24 (min 16) 4 inh/km2) X «5
256 8 Ix4 16 (min 2) 4 3 (min 2) 4 16 (min 6) 4 inh/km2)
TABLE XII. NUMBER OF POTENTIAL SUBSCRIBERS PER ZONE AND CELL AREA AND NUMBER OF BASE STATIONS FOR WIRELESS ACCESS PER GEOTYPE
Total number Number of Average Number of Number of Number of Number of Number of ofpotential users per cell radius of cell base stations users per base stations fibres at each division points
Zone subscribers area (neelJ area (m) (dJ per zone access area per equivalent B segment at A-B per per zone (n.",J access area (nfUmBJ access area
(nzon.J (nhJ (nd;vABJ VI (500-100
3.987.672 360 1205 11.077 16384 46 8 (min 2) 8 inh/km2) VII (100-50
1.326.987 360 2132 3.686 4096 12 8 (min 2) 8 inh/km2) VIII (50-10
1.817.422 360 3419 5.048 2048 6 8 (min 2) 4 inh/km2) IX (10-5
323.441 223 4516 1.450 512 1 8 (min 2) inh/km2)
-
X «5 168.155 106 4668 1.586 256 1 8 (min 2)
inh/km2) -
16 (min 6)
16(min 6)
16(min 6)
16 (min 6)
16 (min 6)
Number of fibres at each
A segment (nf"m�
16
16
16
16
16
Number of distribution boxes (nbox)
342
86
43
II
II

TABLE XIII. TYPES OF TERRAIN IN WIRED ACCESS AS A FUNCTION OF THE GEOTYPE
Geotype Fraction da dd Fraction da dd Fraction da dd Fraction de - df Fraction de - df Fraction de - df road (%) jootpath(%) soft (%) jootpath (%) sojt (%) aerial (%)
VIa (500 - 100 5 75 20 55 25 20
inhlkm2)
Vlb (500 - 100 5 75 20 55 25 20
inhlkm2)
VIla (100 - 50 5 45 50 40 30 30
inhlkm2)
VIIb (100 - 50 5 45 50 40 30 30
inhlkm2)
VIlla (50 - 10 5 35 60 35 25 40
inhlkm2)
VIllb (50 - 10 5 35 60 35 25 40
inhlkm2)
IX (10 - 5 5 25 70 30 20 50
inhlkm2)
X « 5 inhlkm2) 5 25 70 25 15 60
TABLE XlV. AVERAGE DISTANCES IN WIRED ACCESS AS A FUNCTION OF THE GEOTYPE
Cost category
Civil works
Duct deployment (road) (CduCH)
Duct deployment (footpath) (Cduct.f)
Duct deployment (soft ground) (Cduct.,g)
Aerial deployment (Cduct.a,,)
Sub-duct deployment (C,duct)
Cable installation (Ccin,,)
Exchange cabinet (Ccab-c)
Geotype da(m) db(m) dc(m) dJm) de(m) dim)
VIa (500 - 100 inhlkm2) 100 250 300 50 10 10
Vlb (500 - 100 inhlkm2) 500 1500 500 100 20 30
VIla (100 - 50 inhlkm2) 50 200 200 40 10 10
VIlb (100 - 50 inhlkm2) 250 1000 1000 200 30 70
Villa (50 - 10 inhlkm2) 50 150 350 60 10 15
VIIIb (50 - 10 inhlkm2) 200 500 1000 200 30 100
IX (10 - 5 inhlkm2) 100 300 800 120 20 60
X « 5 inhlkm2) 100 300 800 120 20 60
TABLE Xv. WORKS, PASSIVE AND ACTIVE EQUIPMENT COSTS FOR WIRED NGAN
Price (£) Yearly Comments
evolution
70 (per Inflation Average of conventional trenching and microtrenching. For any technology m) increase
50 (per Inflation idem m) mcrease
30 (per Inflation idem m) increase
8 (per Inflation No ducts are required. For any technology m) increase
1,5 (per Inflation Relevant for any operator, alternative in particular, when inserting sub-duct in existing m) increase ducts. For any technology
10 (per Inflation For any type of cable and any type of duct and aerial installations. For any technology m) increase
3600 5% fall Able to accommodate ODF, splitter, ONU and xDSL equipment

Cost category Price (€) Yearly Comments
evolution
Division point (Cdiv) 600 5% fall For separation of fibres/cables at a-b and c-d segments. Includes fibre fusion and boxes as required
Field (street) cabinet (Ccab) 23000 2% fall Able to accommodate ODF, MDF, power unit, AC/DC converter, batteries and xDSL equipment.
Distribution point boxes (COOx) 2500 2% fall Outdoor cabinet for last mile FTTH GPON splitters. Up to 48 subscribers per boxAverage price.
Distribution point boxes (Cbox) 250 2% fall Average price. Only 10% require upgrading for FTTC/BIVDSL
In-building wiring (Cmdw) 200 5% fall Per premise. Only for FTTH technology and multi-dwelling units.
Passive equipment
Fibre cable (Cfibee) 96 FO 6,5 (per 3% fall m)
Fibre cable (Cfib,,) 16 FO 2 (per 3% fall m)
Fibre cable (Cfibee) 8 FO 1,3 (per 3% fall m)
Copper cable 0 - Existing copper does not need to be upgraded
Migration of existing copper lines (Cmig) 20 Inflation Per line. For FTTC/B/xDSL technologies increase
GPON splitter (Csplit) 120 5% fall The maximum split ratio is 64 (max number of users per fibre). The split ratio of an individual splitter is 8 (therefore, two stages are required)
Optical Distribution Frame (ODF) at 2800 5% fall Holding up to 256 fibres (and therefore up to 64x256 max number of customers) local exchange (CODF)
Optical Network Unit (ONU) at cabinet \ 000 5% fall Holding 64 fibres (and therefore 64x64 max number of customers). Only used if
(CONU) competition takes place from the cabinet
Active equipment
Optical Line Termination (OL T) card at 30000 10% fall Each card holds 640 users (10 ports at 64 users per port) local exchange (COLT)
Aggregation switch at local exchange 3000 10% fall 10 Gb/s of switching capacity per OLT card (640 users) ( Cswitch)
Mini-VDSLAM at cabinet or 2000 10% fall Each supports 64 users. For FTTC/B/xDSL technologies distribution point box (cVDsLl
Battery for VDSL at cabinet (Cbalt) \ 000 5% fall For FTTC/B/xDSL technologies
TABLE XVI. FRACTION OF PREMISES IN MULTI-DWELLING UNITS AND AVERAGE NUMBER OF PREMISES PER BUILDING AS A FUNCTION OF THE GEOTYPE. SOURCE: OWN ESTIMATIONS
Geotypes Fraction of premises in muIti- Average premises dwelling units (frmdw) per building
VIa (500 - 100 inhlkm2) 40 2,32
Vlb (500 - \ 00 inhlkm2) 30 2,75
VIla ( l 00 - 50 inhlkm2) 30 1,28
VIIb ( l 00 - 50 inh!km2) 20 1,42
VllJa (50 - 10 inhlkm2) 20 1,08
VIIIb (50 - 10 inhlkm2) 10 1,00
IX ( l 0 - 5 inhlkm2) 10 1,00
Geotypes Fraction of premises in muIti- Average premises dwelling units (frmdw) per building
X « 5 inhlkm2) 5 1,00
TABLE XVII. PERCENTAGE OF DUCT RE-USE (FR) AS A FUNCTION OF THE GEOTYPE
Geotype d. - db (%) dc - dd (%) de - dr(%)
VIa (500 - 100 inhlkm2) 60 40 30
VIb (500 - 100 inhlkm2) 40 20 10
VIla (100 - 50 inhlkm2) 60 40 30
VIIb (100 - 50 inhlkm2) 40 20 10
VIlla (50 - 10 inhlkm2) 40 20 10
VIIlb (50 - 10 inhlkm2) 40 20 10
IX (10 - 5 inhlkm2) 40 20 10
X « 5 inhlkm2) 40 20 10
TABLE XVIII. NUMBER OF POTENTIAL SUBSCRIBERS FOR NEW CABLE NETWORK AS A FUNCTION OF THE GEOTYPE
Geotype Total potential subscribers (households + %of potential subscribers covered with Potential subscribers for new cable businesses) cable network network built
VIa (500 - 100 1.232.210 52% 591.461
inhlkm2)
VIb (500 - 100 2.755.461 53% 1.295.067
inhlkm2)
VIla (100 - 50 741.787 25% 556.340
inhlkm2)
VIIb (100 - 50 585.200 25% 438.900
inhlkm2)
VIlla (50 - 10 790.356 25% 592.767
inhlkm2)
VIIIb (50 - 10 1.027.066 18% 842.194
inhlkm2)
IX (10 - 5 inhlkm2) 323.441 17% 268.456
X « 5 inhlkm2) 168.155 0% 168.155
TABLE XIX. PASSIVE AND ACTIVE DOCSIS EQUIPMENT COSTS
Cost category Price Yearly Comments (€) evolution
EdgeQUAM modulator VOD (CEQUAMVOD & 29000 7 % fall
144 Channels for Video on demand and Broadcast TV services, capacity is BTV) excepted to be increased significantly in coming years
Docsis 3.0, CMTS (C_CMTS) 519000 12 % fall Docsis 3.0, Full node CMTS in primary node
Optical Distribution Frame (ODF) at Primary 2800 5% fall Holding up to 256 fibres
Node in HFC networks (cODF)
RF combiner (C _ RF combi) 250 5 % fall RF combiner/splitter .- HFC Combination
BONT cabinet in PN (C CABN_NP ) BONT cabinet in primary node
Power node (C_NPOT) 75000 5 % fall Power distribution node supply & installation as main power source in
outdoor cabinets
Secondary node(C Cab _ NS ) 9250 5 % fall cabinet with HFC OlE BONT, ODF, and primary coax distribution point in
secondary node

Cost category Price Yearly Comments (£) evolution
Terminal node (C_cab_NT) 9250 5 % fall cabinet with HFC OlE BONT , ODF, and primary coax distribution point in
terminal node
Coax Amplification (C_AMPU) 70 2% fall HFC Coax Amplification in last mile
Connection to power utility urban (C ---'power ! ) 2500 Inflaction Connection to power utility company in Urban areas, for outdoor Secondary & Increase Terminal Nodes
Connection to power utility low dense 12500
Inflaction Connection to power utility company in non urban areas
(C---'powerl ) Increase
CATV trunk 2-way tap (C_TAP2) 3,7 2% fall Outdoor CATV sub-trunk 2-way taps , are used in last mille Drop, so highly
needed in cable networks
CATV trunk 4-way tap (C _ T AP4) 4,1 2% fall Outdoor CATV sub-trunk 4-way taps
CATV trunk 4-way tap (C_TAP8) 5,8 2% fall Outdoor CATV sub-trunk 8-way taps
Coax Cable QR540 (C_coax QR540) 5,1 3% fall Coax Cable QR540 in mts, final drop cable
Coax Cable RG6 (C_coax QR540) 5,1 2% fall Coax Cable RG6 in mts, distribution cable in final drop
TABLE XX. DEPLOYMENT COSTS FOR WIRELESS NGAN
Cost category Price (£) Yearly evolution Comments
Civil works
Base station deployment (Cbs-d) 30.000 5% fall Per site. For any technology
Spectrum
Spectrum fees at 800 MHz (cspect) 20.000.000 Inflation increase Per MHz. 20 years license.
Spectrum fees at 2,6 GHz (csp",) 2.000.000 Inflation increase Per MHz. 20 years license.
Administrative licensing 3.500 € Per site
Active equipment
Base station at 2,6 GHz (Cbs) 23.000 10% fall For L TE. 3 sectors, 20 MHz each
Base station at 800 MHz (Cbs) 18.000 10% fall For L TE. 3 sectors, 20 MHz each
Tr-Rx equipment (eo-) 4.000 10% fall For L TE. 2 Tr-Rx per sector
Power supply equipment for base station (cpow) 10.000 5% fall For any technology
Pi co-cell (Cpico)
F emtocell (crem!o)
Cost category Price (£)
Civil works
Duct rental 2 (per m)
Passive equipment
Installation of final drop 120 ( Cdmp) Migration due to chum 100 ( Cohurn)
Accomodation of 10 equipment in the exchange
Yearly
350 10% fall Up to 8 users. For any technology
250 10% fall
TABLE XXI. OPERATING COSTS FOR WIRED NGAN
For any technology
evolution Comments
Inflation Only relevant for alternative operators increase
Inflation Per user. Incurred only when a customer takes a service. Includes the faceplate at subscriber premises. increase For any technology
Inflation Average value per churned user. It could vary as a function of the access point I unbundling increase possibilities (at exchange, at cabinet or at distribution box). Includes internal and external migration
costs. For any technology
Inflation Per user. Only relevant for alternative operators increase
Cost category Price Yearly Comments (€) evolution
Active equipment
Customer Premises 100 10% fall Per user. Including modem, routing and wireless hub. For any technology. Cost per 5 years. Equipment (CPE) (CePE) Battery backup (Cbalt) 100 10% fall Per user. For FTTH as this technology does not include power supply on the wire. Includes
maintenance. Cost per 5 years.
Power consumption at 2 Inflation Per line. Considers the average of a fixed and a variable per KWh charge (30 W consumption per OLT exchange (cpow) increase port).
Support and management
Network support (FTTH) 6 Inflation Per line
(CnClS) increase
Network support 12 Inflation Per line
(FTTCIVDSL) (cncts) increase
General support (FTTH) 9 Inflation Per line ( cgcns) increase
General support 12 Inflation Per line (FTTCIVDSL) (cgcns) increase
General management (Cgcnm) 13 Inflation Per line. For any tecnology increase
Finance and billing (Cbill) I Inflation Per line. For any technology increase
Bad debts and other costs 3 Inflation Per line. For any technology ( Cbad) increase
Provision / maintenance 4 Inflation Per line (FTTH) (cpmv) increase
Provision / maintenance 12 Inflation Per line (FTTCIVDSL) (cpmv) increase
TABLE XXII. SUMMARY OF OPERATING COSTS FOR WIRELESS NGAN
Comments Price (€ Yearly
Cost category evolution
Civil works
Duct rental Only relevant for alternative operators 2 (per m) Inflation
increase
Site rental Per site 6.000€ Inflation
increase
Passive equipment
Installation of final drop (cruop) Per user. Incurred only when a customer takes a service. Includes the faceplate at subscriber
120 Inflation
premises. For any technology increase
Average value per churned user. It could vary as a function of the access point / unbundling Inflation
Migration due to chum (Cchurn) possibilities (at exchange, at cabinet or at distribution box). Includes internal and external 100 increase
migration costs. For any technology
Accommodation of equipment Per user. Only relevant for alternative operators 10
Inflation
in the exchange increase
Active equipment
F emto and Pi co-cells power Considerations about the power consumption on the cells reception equipment 120
consumption

Comments Price (£ Yearly
Cost category evolution
F emto and Pi co-cells
equipment technical For example: Replacement of equipment due to malfunction 60
maintenance
Tx-Rx power consumption 80 Inflation
Increase
Tx-Rx equipment technical 30
Inflation
maintenance increase
Base Station power supply Per site 1.200 Inflation
increase
Base Station equipment Per site 600
Inflation
technical maintenance increase
Sanctions Per year for the whole network 3.000.000 20%
increase
Closures and withdrawals Per year for the whole network 15.000.000 10%
increase
Adaptations 1 of 30 base stations need this type of work a year l .000 Inflation
Increase
Support and management
General management and For any technology 25
Inflation
support (Cgcmn) increase
Finance and billing (Cbill) For any technology 1 Inflation
increase
Bad debts and other costs (Chad) For any technology. Include the debts, chum, 3 Inflation
Increase