an analysis of synthetic ruby overgrowth on corundum · in sample 385 the synthetic ruby overgrowth...
TRANSCRIPT

The report indicates the status of a research project that is still ongoing within GIA Laboratory Bangkok. Comments on this and other reports and their direction are warmly welcomed as are offers of collaboration. Please contact: [email protected] stating the name of the project and name(s) of the author(s).
NEWS FROM RESEARCH
An analysis of synthetic ruby overgrowth on corundum
Sudarat Saeseaw, Vincent Pardieu, Vararut Weeramonkhonlert, Supharart Sangsawong and Jonathan Muyal

Table of Contents
Table of Contents ................................................................................................................................................................ 2
Introduction .......................................................................................................................................................................... 3
Materials and Methods........................................................................................................................................................ 4
Examination Results ............................................................................................................................................................ 5
Microscopic examination ............................................................................................................................................... 5
Type I: Stones 385, 386 and 390 with no obvious interface between natural seed and the synthetic layer ........................................................................................................................................................................................ 5
Type II: Stones 387, 384, 392, 391, 389, 393, 388, with clear dusty interface between the natural and synthetic layer .............................................................................................................................................................. 9
Chemistry .......................................................................................................................................................................... 9
Type I: the chemistry of sample 385 (Figure 7 and Table 2). .......................................................................... 10
Type II: sample 391 was selected in this study (Figure 8 and Table 3). ......................................................... 11
Duros and hydrothermal synthetic ruby samples ............................................................................................... 12
Infrared Spectroscopy ................................................................................................................................................... 13
Observations ........................................................................................................................................................................ 15
Biography ............................................................................................................................................................................. 15
©GIA http://www.giathai.net June 10th 2015

Introduction
Synthetic ruby is one of the most commonly synthesized gems with various methods being used since the turn of the last century (Scarratt 1977, Bank and Schmetzer 1979, Schmetzer and Bank 1988, Peretti and Smith 1993, Scarratt 1994, Muhlmeister, Fritsch et al. 1998, Shida. 2000). The synthetic overgrowth of ruby on corundum seeds is one of the rarer versions of these processes, however, it is not particularly new and indeed such materials were reported relatively recently by GIT (Promwongnan. 2015)
This additional report characterizes the material further and adds detailed chemical analyses to the data already published.
In 2014 author VP acquired ten specimens in which it was stated that synthetic ruby have been overgrown onto natural corundum, these were obtained via Laurent Massi which in turn had purchased them from Karim Guercouche of Premacut Ltd, a Bangkok based supplier. It was indicated to VP that the stones in questions were related to attempts during the early 1990’s to diffuse Cr into natural pink sapphires and thereby change their color appearance to that of ruby. Indeed after disappointments in the Cr diffusion experiments (Smith 2002)some colorless sapphires of Sri Lankan origin were given to the Duros Company, famous for their synthetic rubies (Hänni 1993, Koivula and Fritsch 1993, Hänni and Schmetzer 1994, Hänni, Schmetzer et al. 1994, Hänni, Schmetzer et al. 1994), for further experiments and the specimens reported upon here are reportedly (quality) rejects from these experiments with Duros.
©GIA http://www.giathai.net June 10th 2015

©GIA http://www.giathai.net June 10th 2015
Materials and Methods
Table 1: The reference number and weight of the “synthetic overgrowth” ruby Samples used in this study (see also Figure 1 and Figure 2)
Reference #Type I Weight (carats)
Image
100310677385 1.406
100310677386 1.773
100310677390 1.765
Reference # Type II Weight (carats)
Image
100310677384 1.996
100310677387 1.421
100310677388 1.904
100310677389 2.091
100310677391 2.173
100310677392 2.073
100310677393 1.873
Ten faceted samples of synthetic overgrowth ruby were used for this report (Table 1) which were obtained from Premacut Ltd., a Bangkok based gemstone supplier. The stones ranged in size from 1.40ct to 2.17ct and were either near round or oval in shape. The color of the samples ranged from purplish red to red.
Standard gemological testing was carried out using the OPL hand held spectroscope to establish that the material was indeed ruby.
Internal features were observed using a variety of Gemolite microscopes with magnifications ranging up to 70x, and a Nikon SMZ 1500 system with darkfield, brightfield, and diffused illuminations, together with a fiber-optic light source when necessary with magnifications and photo imaging of up to 180x.
FTIR microscopy was performed using a Nicolet iN10 (Thermo Fisher Scientific) operating in a reflection mode with a liquid nitrogen cooled MCT-A (mercury cadmium telluride) detector and a KBr beam-splitter. The iN10 conditions used were at 4 cm-1 spectral resolution, 128 scans, and aperture size of 150 X 150 um.

Three samples (385, 386 and 391) were cut into wafers for inclusion and chemical analysis.
Chemistry was performed using Thermo Fisher Scientific iCAP Q Induced Coupled Plasma - Mass Spectrometer (ICP-MS) coupled with a Q-switched Nd:YAG Laser Ablation (LA) device operating at a wavelength of 213 nm. Laser conditions used 55 μm diameter laser spots, a fluency of around 10 J/cm2, and a 15 Hz repetition rate. For the ICP-MS operations, the forward power was set at ~1350 W and the typical nebulizer gas flow was ~0.80 L/min. The carrier gas used in the laser ablation unit was He, set at ~0.50 L/min. The criteria for the alignment and tuning sequence were to maximize beryllium counts and keep the ThO/Th ratio below 2%. A special set of synthetic corundum reference standards (Be, Mg, Ti, Cr, V, and Ga-doped) and a natural sample for Fe were used for quantitative analysis. All elemental concentrations were calculated by applying 27Al as an internal standard, with Al concentration calculated from the theoretical value of corundum (52.92 wt%)
Examination Results
For convenience and based only upon microscopic observations the samples in this study (Table 1) were separated into two ‘types’: Type I and Type II. The separation was simply related to whether or not the interface between the synthetic overgrowth and the ‘natural sapphire seed” was easily visible using a standard gemological (Gemolite) microscope. Type I consisted of three samples where there was no obvious interface visible while type II consisted of seven samples where there was a clear ‘dusty’ interface
Observed with the unaided eye, the color of all samples appeared the purplish red to red that is expected for natural rubies. However, the type II samples (Figure 2 bottom) appeared more homogenous in color than type I (Figure 2 top) samples. The type I samples had a very thin layer of synthetic ruby overgrowth forming the table with most of the other areas of the samples having no overgrowth on the seed material. In contrast, a thicker layer of synthetic overgrowth was observed in type II samples.
Standard gemological properties of these stones were normal for corundum. Under long-wave ultraviolet the samples appeared to fluoresce from a strong red to being inert and were inert to chalky in some areas under short-wave.
Microscopic examination
Type I: Stones 385, 386 and 390 with no obvious interface between natural seed and the synthetic layer
Three stones (#385, 386 and 390) were examined using a Gemolite microscope. The features noted at the interface between the natural seed and the synthetic outer layers were triangular growth marks (Figure 2a), sub-parallel striations (Figure 2b) and ‘mountain peak’ or ‘heat wave-like’ formations (Figure 2c). In the
©GIA http://www.giathai.net June 10th 2015

{Face up
{Face Down
Type II
outer layer of synthetic overgrowth flux healed fissures (fingerprints) (Figure 2d) and a frosted crystal-like inclusion (Figure 2e) were observed.
{Face up
{Face Down
Type I
Figure 1: GIA reference sample: Type I (385, 390, 386 from left to right) and type II (387, 384, 392, 391 (top) and 389, 393, 388 (bottom)). Photo by N. Kitdee © GIA.
©GIA http://www.giathai.net June 10th 2015
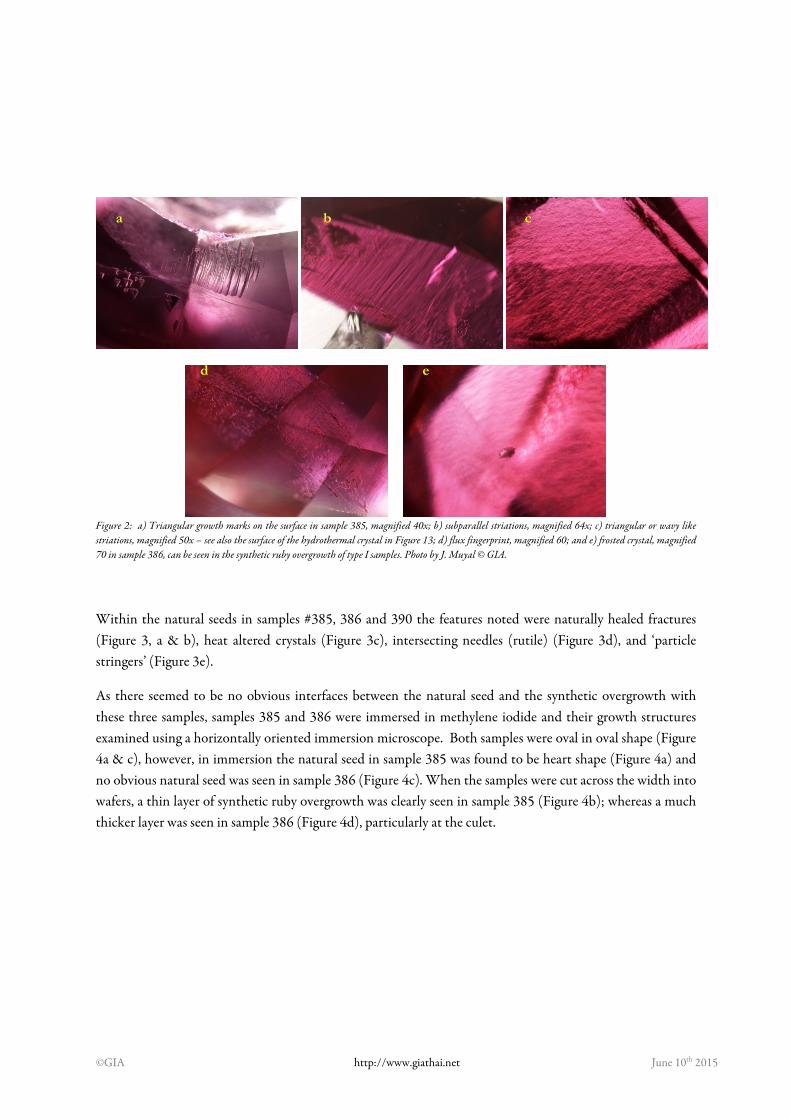
Figure 2: a) Triangular growth marks on the surface in sample 385, magnified 40x; b) subparallel striations, magnified 64x; c) triangular or wavy like striations, magnified 50x – see also the surface of the hydrothermal crystal in Figure 13; d) flux fingerprint, magnified 60; and e) frosted crystal, magnified 70 in sample 386, can be seen in the synthetic ruby overgrowth of type I samples. Photo by J. Muyal © GIA.
Within the natural seeds in samples #385, 386 and 390 the features noted were naturally healed fractures (Figure 3, a & b), heat altered crystals (Figure 3c), intersecting needles (rutile) (Figure 3d), and ‘particle stringers’ (Figure 3e).
As there seemed to be no obvious interfaces between the natural seed and the synthetic overgrowth with these three samples, samples 385 and 386 were immersed in methylene iodide and their growth structures examined using a horizontally oriented immersion microscope. Both samples were oval in oval shape (Figure 4a & c), however, in immersion the natural seed in sample 385 was found to be heart shape (Figure 4a) and no obvious natural seed was seen in sample 386 (Figure 4c). When the samples were cut across the width into wafers, a thin layer of synthetic ruby overgrowth was clearly seen in sample 385 (Figure 4b); whereas a much thicker layer was seen in sample 386 (Figure 4d), particularly at the culet.
a b c
d e
©GIA http://www.giathai.net June 10th 2015

Figure 3: a), b) naturally healed fractures in sample 385, magnified 50x and in sample 390, magnified 30, respectively; c) altered crystal with healed fracture in sample 389, magnified 70x; d) needles in sample 385, magnified 50x; and e) stringers in sample 386, magnified 40x can see in natural seed of type I samples. Photo by J. Muyal © GIA
Samples 385 & 386 below photographed immersed in methelyne iodide as faceted stones
Samples 385 & 386 below photographed in color corrected conditions after being waferred
Sam
ple 3
85
Sam
ple 3
86
Figure 4: Sample 385 (top) and sample 386 (bottom). Photo by S. Saeseaw and S. Engniwat © GIA.
Table
Culet
a b c
d e
a
d c
b
©GIA http://www.giathai.net June 10th 2015

Type II: Stones 387, 384, 392, 391, 389, 393, 388, with clear dusty interface between the natural and synthetic layer
Seven stones, # 387, 384, 392, 391, 389, 393 and 388 showed very clear demarcation between the natural seed and the synthetic overgrowth, the interface appearing what might best be described as “dusty”. The synthetic layer had the appearance of being ‘cracked’ and contained many coarse flux inclusions (Figure 5). This type of sample while appearing homogenous to the unaided eye, appeared very ‘cracked’ under magnification and in dark field illumination (Figure 5a, b and c). The inclusions observed in the natural seeds included blue color zoning (Figure 5b), altered crystals (Figure 6a) and altered fingerprints (Figure 6b). Sample 389 was cut through and showed many particles in the form of ‘stringers’ (Figure 6c). In general the synthetic overgrowth in the type II samples was relatively thick, making the samples appear more homogeneous in color and giving them a more natural appearance.
Figure 5: Sample 389 taken under a) dark filed illumination and b) diffuse light illumination, magnified 7.5x; c) flux inclusions reaching to the surface, magnified 35x can be seen in all seven samples on the synthetic ruby overgrowth of type II samples. Photo by J. Muyal © GIA
Figure 6 a) altered crystals with healed fractures in sample 391; b) altered fingerprints in sample 388; and c) wafer sample 389 showed particles and stringers, magnified 15x can see in natural seed of type II samples. Photo by J. Muyal © GIA
Chemistry
Samples 385, 386 and 389 were fabricated into wafers in order to facilitate the determination of the chemistry for both the seed material and the synthetic overgrowth, the analysis being carried out by LA-ICPMS. It is interesting that these two types showed different chemistry following
a c b
a b c
©GIA http://www.giathai.net June 10th 2015
©GIA http://www.giathai.net June 10th 2015
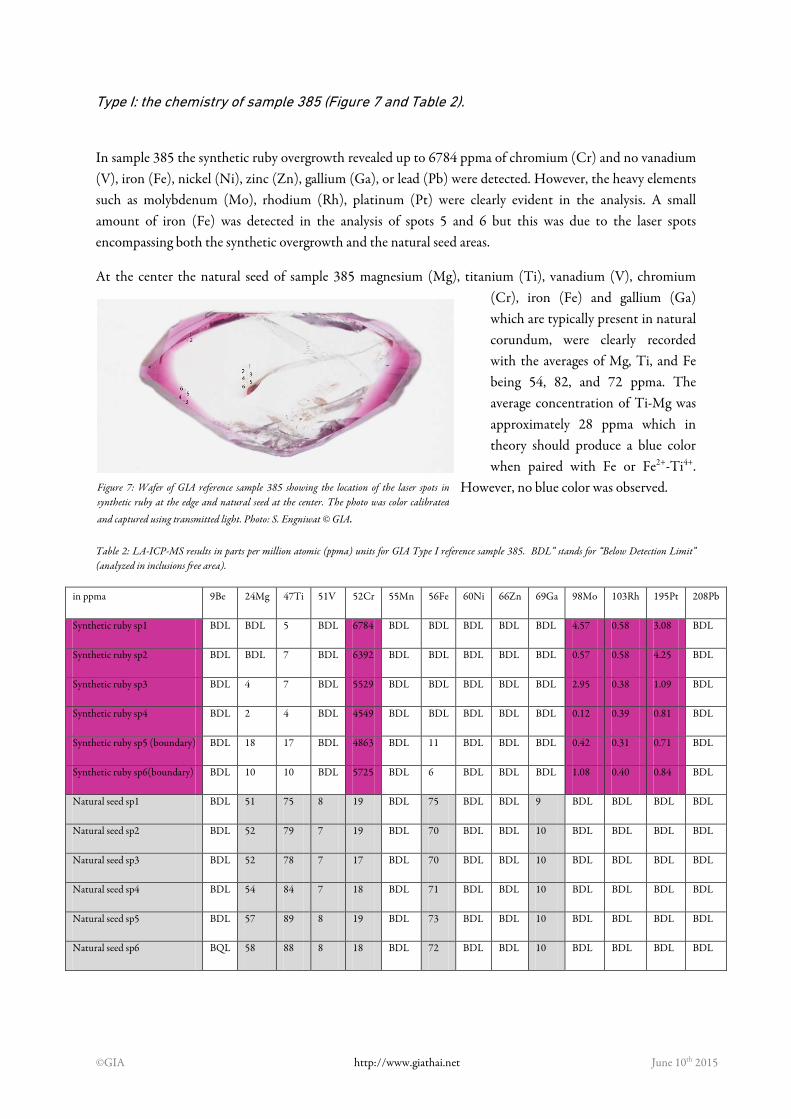
Type I: the chemistry of sample 385 (Figure 7 and Table 2).
In sample 385 the synthetic ruby overgrowth revealed up to 6784 ppma of chromium (Cr) and no vanadium (V), iron (Fe), nickel (Ni), zinc (Zn), gallium (Ga), or lead (Pb) were detected. However, the heavy elements such as molybdenum (Mo), rhodium (Rh), platinum (Pt) were clearly evident in the analysis. A small amount of iron (Fe) was detected in the analysis of spots 5 and 6 but this was due to the laser spots encompassing both the synthetic overgrowth and the natural seed areas.
At the center the natural seed of sample 385 magnesium (Mg), titanium (Ti), vanadium (V), chromium (Cr), iron (Fe) and gallium (Ga) which are typically present in natural corundum, were clearly recorded with the averages of Mg, Ti, and Fe being 54, 82, and 72 ppma. The average concentration of Ti-Mg was approximately 28 ppma which in theory should produce a blue color when paired with Fe or Fe2+-Ti4+.
However, no blue color was observed.
Table 2: LA-ICP-MS results in parts per million atomic (ppma) units for GIA Type I reference sample 385. BDL” stands for “Below Detection Limit” (analyzed in inclusions free area).
in ppma 9Be 24Mg 47Ti 51V 52Cr 55Mn 56Fe 60Ni 66Zn 69Ga 98Mo 103Rh 195Pt 208Pb
Synthetic ruby sp1 BDL BDL 5 BDL 6784 BDL BDL BDL BDL BDL 4.57 0.58 3.08 BDL
Synthetic ruby sp2 BDL BDL 7 BDL 6392 BDL BDL BDL BDL BDL 0.57 0.58 4.25 BDL
Synthetic ruby sp3 BDL 4 7 BDL 5529 BDL BDL BDL BDL BDL 2.95 0.38 1.09 BDL
Synthetic ruby sp4 BDL 2 4 BDL 4549 BDL BDL BDL BDL BDL 0.12 0.39 0.81 BDL
Synthetic ruby sp5 (boundary) BDL 18 17 BDL 4863 BDL 11 BDL BDL BDL 0.42 0.31 0.71 BDL
Synthetic ruby sp6(boundary) BDL 10 10 BDL 5725 BDL 6 BDL BDL BDL 1.08 0.40 0.84 BDL
Natural seed sp1 BDL 51 75 8 19 BDL 75 BDL BDL 9 BDL BDL BDL BDL
Natural seed sp2 BDL 52 79 7 19 BDL 70 BDL BDL 10 BDL BDL BDL BDL
Natural seed sp3 BDL 52 78 7 17 BDL 70 BDL BDL 10 BDL BDL BDL BDL
Natural seed sp4 BDL 54 84 7 18 BDL 71 BDL BDL 10 BDL BDL BDL BDL
Natural seed sp5 BDL 57 89 8 19 BDL 73 BDL BDL 10 BDL BDL BDL BDL
Natural seed sp6 BQL 58 88 8 18 BDL 72 BDL BDL 10 BDL BDL BDL BDL
Figure 7: Wafer of GIA reference sample 385 showing the location of the laser spots in synthetic ruby at the edge and natural seed at the center. The photo was color calibrated and captured using transmitted light. Photo: S. Engniwat © GIA.
©GIA http://www.giathai.net June 10th 2015
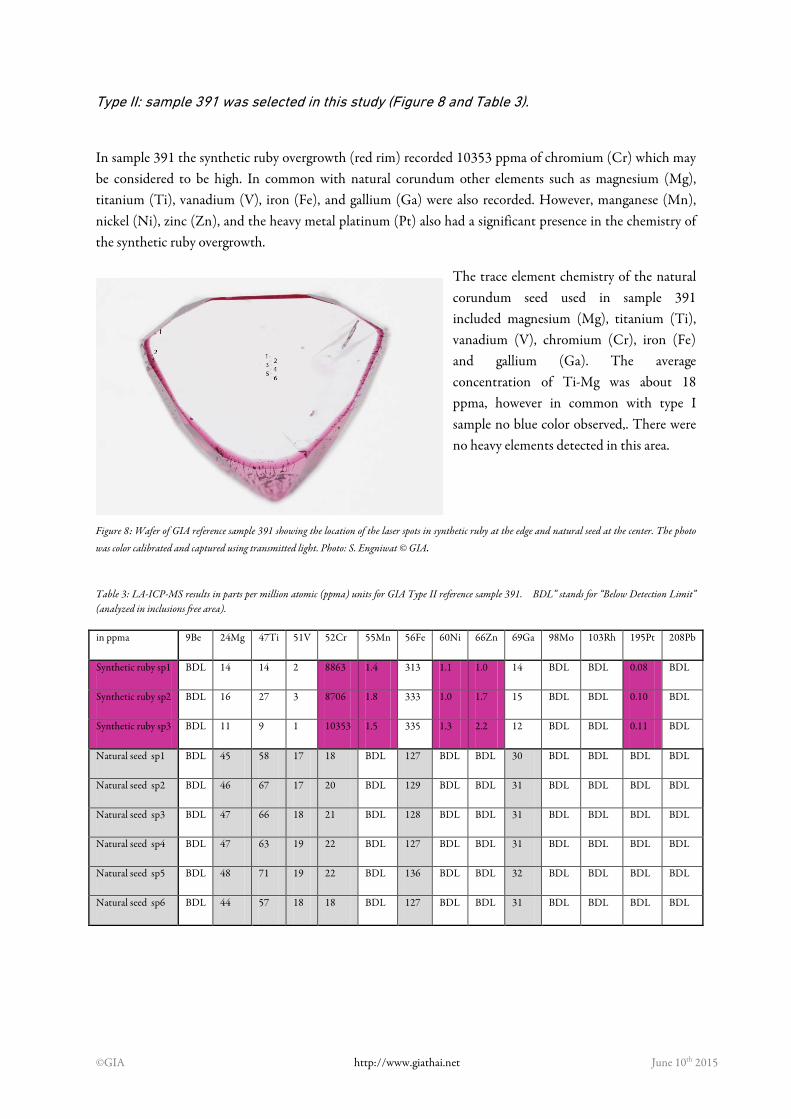
Type II: sample 391 was selected in this study (Figure 8 and Table 3).
In sample 391 the synthetic ruby overgrowth (red rim) recorded 10353 ppma of chromium (Cr) which may be considered to be high. In common with natural corundum other elements such as magnesium (Mg), titanium (Ti), vanadium (V), iron (Fe), and gallium (Ga) were also recorded. However, manganese (Mn), nickel (Ni), zinc (Zn), and the heavy metal platinum (Pt) also had a significant presence in the chemistry of the synthetic ruby overgrowth.
The trace element chemistry of the natural corundum seed used in sample 391 included magnesium (Mg), titanium (Ti), vanadium (V), chromium (Cr), iron (Fe) and gallium (Ga). The average concentration of Ti-Mg was about 18 ppma, however in common with type I sample no blue color observed,. There were no heavy elements detected in this area.
Figure 8: Wafer of GIA reference sample 391 showing the location of the laser spots in synthetic ruby at the edge and natural seed at the center. The photo
was color calibrated and captured using transmitted light. Photo: S. Engniwat © GIA.
Table 3: LA-ICP-MS results in parts per million atomic (ppma) units for GIA Type II reference sample 391. BDL” stands for “Below Detection Limit” (analyzed in inclusions free area).
in ppma 9Be 24Mg 47Ti 51V 52Cr 55Mn 56Fe 60Ni 66Zn 69Ga 98Mo 103Rh 195Pt 208Pb
Synthetic ruby sp1 BDL 14 14 2 8863 1.4 313 1.1 1.0 14 BDL BDL 0.08 BDL
Synthetic ruby sp2 BDL 16 27 3 8706 1.8 333 1.0 1.7 15 BDL BDL 0.10 BDL
Synthetic ruby sp3 BDL 11 9 1 10353 1.5 335 1.3 2.2 12 BDL BDL 0.11 BDL
Natural seed sp1 BDL 45 58 17 18 BDL 127 BDL BDL 30 BDL BDL BDL BDL
Natural seed sp2 BDL 46 67 17 20 BDL 129 BDL BDL 31 BDL BDL BDL BDL
Natural seed sp3 BDL 47 66 18 21 BDL 128 BDL BDL 31 BDL BDL BDL BDL
Natural seed sp4 BDL 47 63 19 22 BDL 127 BDL BDL 31 BDL BDL BDL BDL
Natural seed sp5 BDL 48 71 19 22 BDL 136 BDL BDL 32 BDL BDL BDL BDL
Natural seed sp6 BDL 44 57 18 18 BDL 127 BDL BDL 31 BDL BDL BDL BDL

Duros and hydrothermal synthetic ruby samples
Given the indications (statements made at the time of acquisition, see introduction) that the company that produced the Douros synthetic ruby were involved in the production of these synthetic overgrowth rubies and that the infrared spectra recorded at the interface of the overgrowth and the natural seed of a Type I specimen revealed features close to those seen in hydrothermal synthetic rubies (Figure 10), for comparative purposes the authors also collected chemical from one known Douros (Figure 12) and one known hydrothermally grown (Figure 13) synthetic ruby crystal.
For the hydrothermal synthetic (Table 4) the material appeared to be relatively free of ‘unusual’ trace elements the exception being Ni with a presence of between 4 and 23 ppma. Mo, Rh, Pt and Pb were all below the detection limits. Cr was present at the expected high levels but Fe was below detection limits as were Ga and V. These data do not correlate well with either the Type I or the Type II synthetic ruby overgrowth samples examined here.
For the Douros synthetic ruby crystal (Table 5) Ga was determined to be present at relatively high levels (196-202ppma) but this is to be expected for this particular synthetic material (Hänni, Schmetzer et al. 1994). As expected Rh and Pb and in particular Pt were present in detectable amounts. Cr was detected and relatively low levels in comparison to Fe. As with the hydrothermal synthetic the chemistry data of the Douros synthetic ruby crystal do not correlate well with either the Type I or the Type II synthetic ruby overgrowth samples examined here.
Table 4: LA-ICP-MS results in parts per million atomic (ppma) units for the Russian hydrothermally grown synthetic ruby depicted in Figure 13. BDL” stands for “Below Detection Limit”.
Hydrothermal synthetic ruby
Spot # 9Be 24Mg 47Ti 51V 52Cr 55Mn 56Fe 60Ni 66Zn 69Ga 98Mo 103Rh 195Pt 208Pb
sp1 BDL 5.7 68 BDL 6157 BDL BDL 23 BDL BDL BDL BDL BDL BDL
sp2 BDL 0.9 33 BDL 4980 BDL BDL 4 BDL BDL BDL BDL BDL BDL
sp3 BDL 0.9 38 BDL 4902 BDL BDL 4 BDL BDL BDL BDL BDL BDL
sp4 BDL 0.6 39 BDL 5333 BDL BDL 4 BDL BDL BDL BDL BDL BDL
Table 5: LA-ICP-MS results in parts per million atomic (ppma) units for the Douros synthetic ruby depicted in Figure 12. BDL” stands for “Below Detection Limit”.
Douros synthetic ruby
Spot # 9Be 24Mg 47Ti 51V 52Cr 55Mn 56Fe 60Ni 66Zn 69Ga 98Mo 103Rh 195Pt 208Pb
sp1 BDL 1.1 33 BDL 98 2.1 1194 10 BDL 196 BDL 0.03 26 0.03
sp2 BDL 1.3 33 BDL 92 2.0 1172 9 BDL 197 BDL 0.03 25 0.04
sp3 BDL 1.1 32 BDL 97 1.8 1209 8 BDL 202 BDL 0.02 27 0.03
sp4 BDL 0.8 35 BDL 93 1.6 1117 8 BDL 192 BDL 0.03 24 0.04
©GIA http://www.giathai.net June 10th 2015

Infrared Spectroscopy
Type I samples presented interested FTIR spectra at the interface between natural seed and synthetic ruby overgrowth with peaks at 3475 and 3355 cm-1 (Figure 10) neither of which were recorded in the bodies of the natural seed or the synthetic overgrowth, indeed these other areas examined produced featureless IR
spectra. These features produced at the interface were similar to but not the same as those reported for some hydrothermally grown synthetic rubies (Figure 11). At present these features noted at the interface are not understood and further work is necessary before an attribution can be made
Figure 10: The infrared spectra recorded for the natural seed (green) the synthetic ruby overgrowth (red) and at the interface between the seed and the overgrowth (black) using a FTIR microscope (iN10).
3475 3355
0
0.1
0.2
0.3
0.4
0.5
0.6
300031003200330034003500360037003800
Abs
orba
nce
Wavenumber, cm-1
natural seed
interface
synthetic ruby
Figure 9: The areas from which infrared spectra were recorded (circled) and detailed in sample 386, from a Type I sample of synthetic overgrowth ruby. Photo: C.
Khowpong © GIA.
©GIA http://www.giathai.net June 10th 2015

©GIA http://www.giathai.net June 10th 2015
Figure 13: A crystal of Russian grown hydrothermal synthetic ruby and a wafer from the same crystal the IR spectrum of which can be seen in Figure 11. Photo by L. Nillapat (top) and S. Engniwat (bottom) © GIA
Figure 11: The IR spectra of a Douros synthetis ruby (Figure 12) and a wafer of Russian grown hyrothermally growth synthetic ruby (Figure 13) using a Nicolet 6700 FTIR spectrometer.
3561 3483 3304
4
4.5
5
5.5
6
0
0.5
1
1.5
2
2.5
3
300031003200330034003500360037003800
Abs
orpt
ion
coef
ficie
nt, c
m-1
(for
Dor
os)
Wavenumber, cm-1
Doros
hydrothermal
Figure 12: A crystal of the Douros synthetic ruby the IR spectrum of which can be seen in Figure 11. Photo by L. Nillapat © GIA
Absorption coefficient, cm
-1 (for hydrothermal)

Observations
The natural inclusions depicted as being present in the natural ‘seeds’ of this synthetic ruby overgrowth material in Figure 3 might possibly mislead an observer into assuming that he we examining a natural ruby, however, a careful examination should in all cases reveal the synthetic ruby overgrowth. The presence of these natural inclusions though also give some insight into the growth conditions used in so much as the temperatures used could not have exceed 1200°C. The inclusions recorded in the synthetic overgrowth ruby were typical of what might be expected within a flux growth synthetic ruby -‘flux healed’ fissures and other flux related inclusions, however, the triangular or wavy (heat-wave) like striations (Figure 2c) had a similar appearance to the surface of the hydrothermal crystal depicted in Figure 13.
The infrared spectra proved to be interesting but only in terms of the spectra obtained at the interface between the natural seed and the synthetic overgrowth. The synthetic overgrowth and the natural seed themselves producing no discernible features whereas a series peaking at 3475 and 3355 were recorded from the material at the interface that were reminiscent of (but not identical to) the series observed in hydrothermally grown synthetic ruby.
The chemistry recorded for the samples indicated that differing growth conditions may have been applied for the two types (Type I and Type II). Mo (often recorded in flux grown synthetic rubies) was clearly present in the synthetic overgrowth of type I but not in Type II samples whereas Ni was recorded in Type II specimens but not in Type I. Ga and V were not evident in the synthetic overgrowth ruby in Type I but clearly present in the overgrowth of Type II specimens – previous reports on Douros synthetics have reported the clear presence of Ga.
Both types contained a significant Pt content, but Rh was detected in type I samples only.
In the cases where inclusions or other growth indicators are not evident the detection of the elements Pt, Rh, Ni, or Mo would prove useful in identifying specimens as being of synthetic origin. However, analyses using LA-ICP-MS would be necessary.
Biography
Bank, H. and K. Schmetzer (1979). "Spiralförmige einschlüsse in edelsteinen: spannungsriss in synthetischem korund." Zeitschrift der Deutschen Gemmologischen Gesellschaft 28(3): 148-149. Hänni, H. A. (1993). "A new synthetic ruby from Greece poses challenges for gemologists." Rapaport Diamond Report 16(30): 27-28.
©GIA http://www.giathai.net June 10th 2015
Hänni, H. A. and K. Schmetzer (1994). "How to identify Douros synthetic rubies." Jewellery News Asia: 156-168. Hänni, H. A., et al. (1994). "Synthetic rubies by Douros: A new challenge for gemologists." Gems and Gemology 30(2): 72-86. Hänni, H. A., et al. (1994). "Synthetische rubine von Douros." Goldschmiede Zeitung(11): 101-108. Koivula, J. I. and E. Fritsch (1993). "Douros flux-grown synthetic ruby." Gems and Gemology 29(4): 295. Muhlmeister, S., et al. (1998). "Separating natural and synthetic rubies on the basis of trace-element chemistry." Gems and Gemology 34(2): 80-101. Peretti, H. A. and C. P. Smith (1993). "A new type of synthetic ruby on the market: Offered as hydrothermal rubies from Novosibirsk." Australian Gemmologist 18(5): 149-156. Promwongnan., S., Saengbuangamlam., S, Leelawatanasuk (2015) Lab Update - Synthetic Ruby Overgrowth on Natural Corundum. GIT Scarratt, K. (1977). "A study of recent Chatham synthetic ruby and synthetic blue sapphire crystals with a view to the identification of possible faceted material." Journal of Gemmology 15(7): 347-353. Scarratt, K. (1994). "Lab Report: Kashan synthetic rubies; synthetic ruby from Russia; hydrothermal synthetic ruby—infrared spectrum." JewelSiam 5(1): 62–69. Schmetzer, K. and H. Bank (1988). "Lechleitner synthetic rubies with natural seed and synthetic overgrowth." Journal of Gemmology 21(2): 95–101. Shida., J. (2000). "Overgrown Ruby." The Journal of the Gemmological Association of Hong Kopng XXI: 5. Smith, C. P. (2002). ""Diffusion ruby" proves to be synthetic overgrowth on natural corundum." Gems and Gemology 38(3): 240-248.
©GIA http://www.giathai.net June 10th 2015