an analysis of tax abatements in philadelphia · shua-kym mclean. contents 1 executivesummary iv...
TRANSCRIPT

An Analysis of Tax Abatements in Philadelphia
Office of the Controller, City of PhiladelphiaApril 20, 2018
City Controller Rebecca Rhynhart
First Deputy Kellan WhiteChief of Staff Nicole McCormac
General Counsel Salena M. Jones, Esq.Strategy and Policy Team Rosamond Howard
Nick HandMatthew VegariShua-Kym McLean

Contents
1 Executive Summary iv
2 Introduction 12.1 Why look at the Ten-Year Tax Abatement now? . . . . . . . . . . . . . . . . . 12.2 Methodology . . . . . . . . . . . . . . . . . . . . . . . . . . . . . . . . . . . 2
3 The Ten-Year Tax Abatement 53.1 Historical information . . . . . . . . . . . . . . . . . . . . . . . . . . . . . . 53.2 Segmentational analysis of actively abated properties . . . . . . . . . . . . . 10
4 Developer Profitability 214.1 Defining real estate development profitability . . . . . . . . . . . . . . . . . 214.2 Philadelphia profitability by ZIP code . . . . . . . . . . . . . . . . . . . . . . 224.3 Challenges to real estate development in Philadelphia: market values, rents
& construction costs . . . . . . . . . . . . . . . . . . . . . . . . . . . . . . . 25
5 Changes to the Abatement: Scenarios Considered 335.1 Scenario 1: remove the abatement . . . . . . . . . . . . . . . . . . . . . . . 345.2 Scenario 2: remove school portion of the abatement . . . . . . . . . . . . . 355.3 Scenario 3: remove abatement in 8 most profitable ZIP codes . . . . . . . . 355.4 Scenario 4: cap abatement at $700K . . . . . . . . . . . . . . . . . . . . . . 365.5 Scenario 5: cap abatement at $150 per square foot . . . . . . . . . . . . . . 365.6 Scenario 6: amortize abatement over ten years . . . . . . . . . . . . . . . . 375.7 A note on compounding . . . . . . . . . . . . . . . . . . . . . . . . . . . . . 38
A Boundaries by Neighborhood, ZIP Code, and Council District 39
Glossary 42
Bibliography 44
Note: The cover page shows a heat map of all properties in Philadelphia. Properties without an
abatement are shown in blue (565,788 in total) and properties with an abatement are shown in
yellow (14,345 in total).
iii

1Executive Summary
Philadelphia’s Ten-Year Tax Abatement is one of the most all-encompassing property taxincentives in the nation, providing a 100% tax benefit for new construction and the valueof improvements or conversions to existing properties. Growing out of a similar 30-monthabatement for developers in the 1970s, the abatement was intended to spur developmentcity-wide after decades of disinvestment, population loss and stagnant home-ownershiprates.
Today, Philadelphia is a different city from when the current abatement policy was firstenacted. Re-evaluating and revisiting tax stimulus programs like the abatement should be aregular practice to determine if the benefits of the incentive outweigh the opportunity costrepresented in its associated potential tax revenue. Nearly 20 years after the inception ofthe Ten-Year Tax Abatement and in light of the city’s positive change, the question remains:does Philadelphia need the tax abatement as it once did?
This analysis of the abatement looks at its geographical concentration, the distributionof benefit and developer profitability. Additionally, this analysis presents and evaluatespotential changes, referred to as scenarios, to the current abatement policy.
Ultimately, the decision to end, continue or alter the tax abatement lies with City Counciland the Mayor. The goal of this analysis is to inform the discussion with historical data,accurate analysis and a clear presentation of information.
Philadelphia Real Estate Growth
• The total number of properties in Philadelphia has increased significantly. At the timeof this study, there are 580,133 properties on the Office of Property Assessment (OPA)rolls, with 15,000 properties added in the past 15 years.
• Philadelphia’s share of regional real estate development has grown relative to itssuburbs.
• The median home value per square foot (sqft) in Philadelphia has tripled since 1996.However, the appreciation has not been uniform throughout the city, and has beenlargely concentrated in the greater Center City area.
iv

Tax Impact
• Since 2000, abated properties have received a $1.05B cumulative tax benefit.
• In 2017, there were 14,345 properties with active abatements; these propertiesreceived a tax benefit of $93M.
• 12,477 properties have expired abatements. The latest annual property tax revenueassociated with these properties was $83M per assessed values as of 3/31/2017(assuming a 100% collection rate). This is revenue that may not have been generatedhad these properties not been built or improved.
Abatements by Value
Abatement value is concentrated in high-value properties. Abated properties are, on thewhole, more valuable than non-abated properties. Properties with higher abated valuesreceive the majority share of tax benefits.
• Just 2.5% of all properties in Philadelphia have an abatement as of 2017. The totalsum of the abatements for these properties makes up 6.6% of all assessed value inPhiladelphia.
• The tax benefit associated with the abatement is concentrated in new construction.
• The tax benefit associated with the abatement is concentrated in residential properties.However, the tax benefit associated with commercial properties is disproportionate:commercial properties account for 2% of total abated properties, but receive 11% ofthe total tax benefit.
• The tax benefit associated with the abatements policy is concentrated in high-valueproperties. The top 15 properties by abated value, most of which are apartmentbuildings, make up 0.1% of all active abated properties and a full 16% of abated value,representing an associated tax benefit of $15M.
• 7% of actively abated properties receive abatements greater than $700K, but this smallpercentage of properties receives an outsized share of the tax benefit (51%).
v
Abatements by Geography
Properties with tax abatements are concentrated in a small portion of Philadelphia, whetherconsidering abated properties by neighborhood or by Council District.
• The tax benefits associated with abated properties are concentrated in neighborhoodsin the greater Center City area. Just 6% of all Philadelphia neighborhoods account for59% of the tax benefit from the abatement policy.
• Council Districts 1, 2 and 5 account for 79% of actively abated properties and $5.3Bin abated value. The remaining 21% of actively abated properties are spread out overthe other seven Council Districts and represent $1.3B in abated value.
• The abated value in Districts 1, 2 and 5 are concentrated in high-value properties(abatements greater than $1M); however, the majority of abated properties receivemuch lower abatement values, typically around $250K.
Development Profitability
Few neighborhoods in Philadelphia have profitable development economics, regardlessof the abatement. A ZIP code by ZIP code analysis of Philadelphia shows that only ahandful of ZIP codes are sufficiently profitable to spur development on a build-to-sell andbuild-to-rent basis. Real estate development profitability is correlated with the number ofabated properties in a ZIP code. Among most of the ZIP codes with profitable developmenteconomics, development is profitable regardless of abatement.
Changes to the Abatement: Scenarios Considered
This analysis evaluates six different hypothetical scenarios in which the abatement iseliminated, diminished, amortized, or discontinued at certain property value thresholdsand assesses the potential revenue gained if the respective, hypothetical policy change wereto have taken effect in 2016, without adjusting for potential secondary economic effects.The potential revenue gained in each scenario is a projection calculated using proformaOPA data reflecting construction from January 2016 to December 2016, as if the applicablepolicy change had taken effect in 2016. Note that these hypothetical scenarios are onlyapplied to properties added to OPA rolls in proforma year 2016.
The Office of the City Controller recognizes that any particular change in abatement policymay have secondary economic effects that are not reflected in this preliminary analysis,including but not limited to decreased development.
vi

Currently, the property tax rate of 1.4% is applied to the assessed value of a property’sbuilding and land. The revenue generated from the tax is then split two ways, with 55%going to the Philadelphia School District and 45% to the City. For our analysis, we assumethat revenue split as a portion of the property tax rate itself, applying a tax rate of 0.63%, or45% of the total tax rate, for the City and a rate of 0.77%, or 55% of the total tax rate, forthe School District.
Scenario 1: This scenario eliminates the tax abatement entirely. Assuming unchanged realestate development, this scenario would have resulted in additional tax revenue estimatedat $10.4M on 1,411 properties in 2016.
Scenario 2: This scenario removes the School District portion of the tax abatement (the0.77% tax rate referenced above) but maintains the abatement for the portion of the propertytax directed to the City. In 2016, this scenario would have resulted in additional tax revenueestimated at $5.7M, assuming unchanged real estate development. Scenario 2 would impactas many properties as Scenario 1, but is associated with a smaller revenue impact because itfeatures a partial abatement.
Scenario 3: This scenario examines the elimination of abatements in the eight mostprofitable ZIP codes. These eight ZIP codes – 19102, 19103, 19107, 19118, 19123, 19130,19146, and 19147 – were identified as the most profitable for real estate development inthe city, regardless of the status of the abatement. If this scenario were to have occurred,assuming unchanged real estate investment in 2016, all abated parcels outside of these eightZIP codes would have been abated, while 712 parcels within these ZIP codes would nothave received an abatement. In 2016, this would have resulted in additional tax revenueestimated at $5.0M.
Scenario 4: This scenario taxes the assessed value of an individual property in excess of$700K, effectively creating a $700K cap on an individual abatement. In 2016, 72 propertieswith abatements valued in excess of $700K would have been impacted by this scenario. Ifimplemented, assuming unchanged real estate investment in 2016, this scenario would haveresulted in additional tax revenue estimated at $5.8M.
Scenario 5: This scenario removes abatements on a cost per square foot (sqft) basis forassessed values exceeding the threshold of $150. That is, for properties with assessed valueover $150 per sqft, Scenario 5 applies taxation only to the portion of assessed value over$150 per sqft. Assuming unchanged real estate investment in 2016, this scenario wouldhave resulted in additional tax revenue estimated at $1.5M from 491 properties.
Scenario 6: The final scenario modeled represents a linear amortization of the tax abate-ment over its ten years, assuming a 100% abatement in year 1, 90% abatement in year2, 80% abatement in year 3, and so on, with the property receiving no abatement in year
vii

11. Scenario 6 would have affected all 1,411 properties added in 2016. In year two, allelse equal, this would have resulted in additional tax revenue estimated at $1M. Additionalrevenue would continue to grow in each subsequent year, back-end loading the tax revenuesto the later years of a property’s ten-year abated life.
Ultimately, the decision to end, continue or alter the abatement lies with the City Counciland the Mayor. The goal of this analysis is to inform the discussion with historical data,accurate analysis and a clear presentation of information.
viii

2Introduction
2.1 Why look at the Ten-Year Tax Abatement now?
Philadelphia’s Ten-Year Tax Abatement is one of the most all-encompassing property taxincentives in the nation.
The tax abatement, enacted in its current form in 2000, originates in the 1970s. Afterdecades of disinvestment, population loss, stagnant home ownership rates and increasedpoverty, Philadelphia wanted to become more attractive to prospective developers andresidents. In pursuit of this goal, the City created a 30-month abatement for developers ofresidential properties that expired upon the sale or transfer of new properties. This policyevolved in 1997 when it became a ten-year abatement for commercial properties that wereconverted to residential use. Since 2000, the current form of the abatement policy hasprovided a tax-exempt period of ten years for all improvements and all new constructionregardless of property type.
As a whole, Philadelphia’s outlook and landscape has greatly improved over the last 18years, including in the growth of its population and tax base (sales, wage and propertytaxes). While many cite the abatement as the cause for this progress, the exact increasein development attributable to abatements alone cannot be known; other factors, likethe national trend toward urbanization, immigrant population increases, and lower crimerates in cities, also contributed to broader development in and attraction to urban areaslike Philadelphia. It is worth noting, however, that in 2017, previously abated propertiescontributed approximately $83 million, assuming 100% property tax collection, in revenueto the City - much of which would have not been collected had these properties not beenbuilt or improved. 1
While the abatement policy has helped to spur development in the city, new and rehabilitativeconstruction have not rippled out into most of the city’s neighborhoods. Though the policy isavailable to all homeowners in all Philadelphia ZIP codes, the majority of abated propertiesappear within the greater Center City area. This uneven growth has led to significantfrustration among long-time residents, many of whom believe the abatement policy unduly
1This $83 million is calculated from the total assessed value of these properties. Historically, taxation mayhave been abated for only a portion of the assessed value for each property. For example, while abatementsmay have applied to the assessed values attributable to improvements on these properties, these propertiesmay have been subject to taxation of their unimproved assessed values.
1

and unfairly provides a sizeable tax benefit to developers and wealthy individuals andinvestors, deprives the City and Philadelphia School District of much needed revenue, andraises the values of their residential properties and, therefore, their property taxes.
At the same time, the City has increased the property tax rate several times over the lastfew years and added or extended other taxes, such as the Philadelphia beverage tax, thecigarette tax and the sales tax, to fund schools and other education-related policies. TheCity is currently proposing another property tax rate increase for Fiscal Year 2019, one thatwould coincide with new property reassessments that have increased on average by 11% inthe past year. These property tax increases amplify the feelings of many residents that theypay taxes while others do not.
Tax stimulus programs, like the tax abatement, should be re-evaluated and revisited regu-larly to determine if the benefits of the incentive outweigh the opportunity cost representedin its associated tax revenue. Nearly 20 years after its inception, the City has not under-taken a comprehensive, independent assessment of the tax abatement policy despite theimprovement to the City’s economic climate.
This analysis of the Ten-Year Tax Abatement policy seeks to assess several of the underlyingissues at the heart of this contentious discussion, including geographical concentration,distribution of benefit by property valuation and developer profitability. Additionally, thisanalysis presents and evaluates potential changes, referred to as scenarios, to the currentabatement policy. These scenarios highlight revenue possibilities and the impact on abatedproperties.
Ultimately, the decision to end, continue or alter the tax abatement lies with City Counciland the Mayor. The goal of this analysis is to inform the discussion with historical data,accurate analysis and a clear presentation of information.
2.2 Methodology
For this policy analysis, the Office of the City Controller used data from the Office ofProperty Assessment (OPA) and Zillow, as well as construction cost figures for residentialand commercial properties generated by RSMeans, a software program for real estateprofessionals to estimate construction costs. The data were used to identify abated properties,looking at type, value and location, to understand development profitability and to runscenarios for possible changes to the abatement policy for benefit and impact.
2.2 Methodology 2
Office of Property Assessment
OPA data contain 37 different categories of properties that are exempt from real estate taxes,such as government buildings and non-profit-owned properties. This analysis focuses onlyon the three categories that represent ten-year abatements for new and improved residentialand commercial construction, as defined by Ordinances 1456-A, 961, 1130, respectivelycoded as N, 1, and 8:2
• Ordinance 1456-A provides a ten-year tax abatement from real estate taxes for newconstruction of residential properties. This abatement is available for single-familyhomes, duplexes, apartments, and condos, but not hotels;
• Ordinance 961 provides a ten-year tax abatement from real estate taxes for rehabilita-tion or improvement construction of existing residential properties containing one ormore units. Improvements categorized as ordinary upkeep or maintenance are noteligible under this abated category; and
• Ordinance 1130 provides a ten-year tax abatement from real estate taxes for newconstruction or improvements to deteriorated industrial, commercial, or other businessproperties. Improvements categorized as ordinary upkeep or maintenance are noteligible under this abated category.
Actively abated properties, as defined in this analysis, are identified using exempt codes 1,N and 8 as of March 31, 2017 (the most current full-year data available as of January 2018when this analysis began).
Developer Profitability
Because the tax abatement was created to support developers and spur development morebroadly in Philadelphia, this analysis also examines the historical economic profitability ofdevelopment, including construction costs, sale prices, and rents.
Data from Zillow provided sale prices and rent costs. Home sale prices were estimatedusing median home values on a per square foot basis from the Zillow Home Value Index[2]. Typically, home sale prices are higher than home values. Unfortunately, Zillow does notprovide home sale prices on a per square foot basis or for specific ZIP codes or neighborhoods.For these reasons, market value data were used as an estimate of sales price. This choicedoes not affect any of the conclusions in this analysis regarding the development economicsin Philadelphia. RSMeans was used to model construction costs for different residential and
2More information regarding how abatement categories are defined is available on the OPA website:https://goo.gl/cLRsR. New and improved residential and commercial construction defined by Ordinances1456-A, 961, 1130 have exempt code values of N, 1 and 8 in the historical OPA data [1].
2.2 Methodology 3
commercial construction projects in Philadelphia and other cities. OPA data for arm’s-lengthland sales over the last four years were used to determine the cost of land acquisition.These data were used to show the profitability of build-to-rent and build-to-sell residentialdevelopment and the profitability of developing commercial properties as compared to othercities.
Scenarios
Policy change scenarios were modeled using the 1,411 abated properties added to the OPArolls from January 1, 2016 to December 31, 2016. These data were the most recent completedata set for new exemptions (as of January 2018 when this analysis began).
2.2 Methodology 4
3The Ten-Year Tax Abatement
3.1 Historical information
Summary
Philadelphia Real Estate Growth
• The total number of properties in Philadelphia has increased significantly. At the timeof this study, there are 580,133 properties on the OPA rolls, with 15,000 propertiesadded in the past 15 years.
• Philadelphia’s share of regional real estate development has grown relative to itssuburbs.
• City median market values per sqft have tripled but the appreciation has not beenuniform throughout the city.
• The median home value per sqft in Philadelphia has tripled since 1996. However,the appreciation has not been uniform throughout the city, and has been largelyconcentrated in the greater Center City area.
Tax Impact
• Since 2000, abated properties have received a $1.05B cumulative tax benefit.
• In 2017, there were 14,345 properties with active abatements; these propertiesreceived a tax benefit of $93M.
• 12,477 properties have expired abatements. The latest property tax revenue associatedwith these properties is $83M (assuming a 100% collection rate). This is revenue thatmay not have been generated had these properties not been built or improved.
5
3.1.1 Objective & relative historic property investment
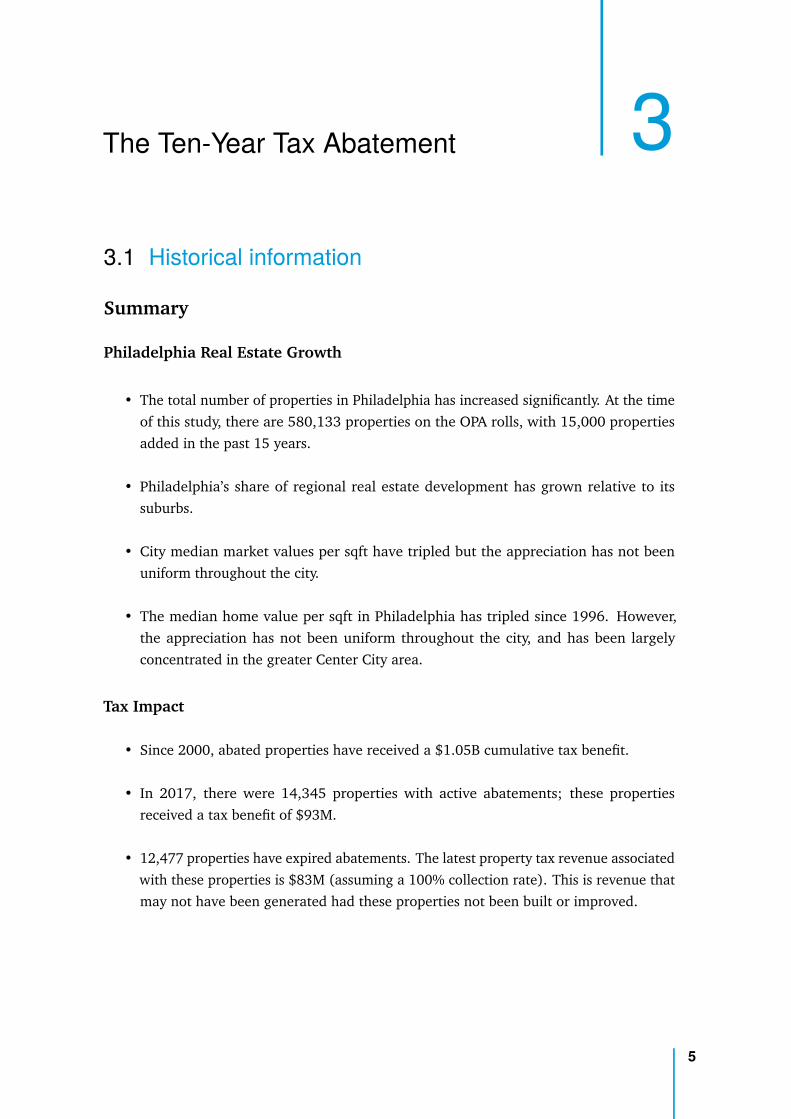
Both the necessity of the abatement policy at its inception and its success in driving de-velopment in Philadelphia are visible in figure 3.1, which charts the historical number ofproperties in Philadelphia since the early 1990s. While city-wide development remainedrelatively stagnant until 2002, the past fifteen years have seen an increase of roughly 15,000in the number of properties. Currently there are 580,133 properties on the OPA rolls,1
versus 565,487 in 1990, reflecting a 2.6% increase. For comparison, we show the projectedgrowth of properties based only on data from 1990 to 2002 as the dashed, gray line in fig-ure 3.1, which indicates very modest gains over the past fifteen years had growth continuedat a pre-abatement rate. Since 2008, on average 1,433 abated parcels worth $667M inabated property value have been granted annually. Using the latest data from the Officeof Property Assessment, there were 1,411 new abatements granted in the calendar year of2016, which represents the latest year for which a full year’s worth of data exists. Thoughmuch of the increase may be attributable to the abatement, confounding factors such asincreasing urbanization and millennial population growth could also have contributed tothe increase.
Figure 3.1. The historical growth of properties in Philadelphia. The gray dashed line shows theprojected growth for 2002 onwards based on the average property growth from 1990 -2002.
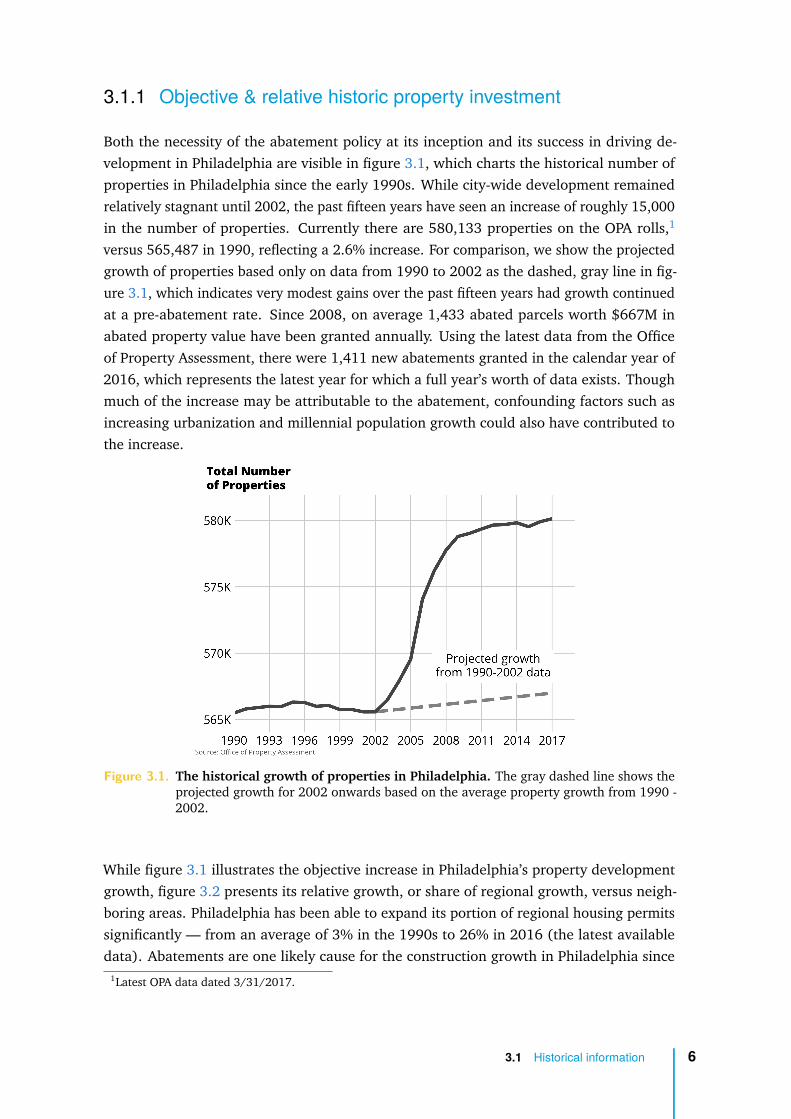
While figure 3.1 illustrates the objective increase in Philadelphia’s property developmentgrowth, figure 3.2 presents its relative growth, or share of regional growth, versus neigh-boring areas. Philadelphia has been able to expand its portion of regional housing permitssignificantly — from an average of 3% in the 1990s to 26% in 2016 (the latest availabledata). Abatements are one likely cause for the construction growth in Philadelphia since
1Latest OPA data dated 3/31/2017.
3.1 Historical information 6
2000 and the relative share of investment the city garners versus regional competition in thesuburbs.2 Demographic trends, especially the increasing preference to live in dense, urbanareas, likely have also played a part in the increase in investment [4].
Figure 3.2. The number of permitted housing units granted annually by region.
3.1.2 Abated properties as a share of total properties inPhiladelphia
Actively abated properties comprise a small percentage of the total number of properties inPhiladelphia (2.5%) but the total sum of their abated value makes up an outsized share ofthe total assessed value (6.6%), as figure 3.3 illustrates. There are 14,345 actively abatedproperties totaling $6.67B in abated property value, corresponding to an annual tax benefitof $93.4M.
2For this calculation, we define the Philadelphia suburbs using the Philadelphia Metropolitan Statistical Area(MSA). The PA suburbs include Bucks, Chester, Delaware, and Montgomery Counties. The NJ suburbsinclude Burlington, Camden, Gloucester, and Salem Counties. The DE/MD suburbs include New Castle andCecil Counties [3].
3.1 Historical information 7

Figure 3.3. The current properties in Philadelphia that are and are not receiving abatements,in terms of the total number and total assessed building value.
3.1.3 Tax implications for actively abated properties and propertieswith expired abatements
Since the start of the current policy in 2000, approximately 26,800 properties have receivedan abatement in Philadelphia. Historically, 60% of the properties receiving abatements arenew construction, with the remaining properties being improvements or conversions ofexisting buildings. During the tenure of the abatement policy, a cumulative total of $38.5B inassessed value has been abated, which amounts to a cumulative total tax benefit of $1.05B.3
• Expired abatements: 12,477 properties subject to the abatement policy have abate-ments which have expired (properties with new construction or improvements overten years old). Previously abated properties make up 47% of the total number ofproperties subject to the abatement policy and have received a cumulative total taxbenefit of $609M (or 58% of the total tax benefit of $1.05B associated with the abate-ment policy). For assessed values in 2017, previously abated properties contributedapproximately $83M in property taxes in tax year 2018, revenue that would not havebeen generated had these properties not been built.4
• Active abatements: 14,345 properties subject to the abatement policy have activeabatements (properties with new construction or improvements under ten years old).5
3The tax benefit is computed by multiplying the abated value amount for a given year by the real estate tax ratefor that year, as determined by the City of Philadelphia. We assume a 100% tax collection rate historicallyfor this calculation. The current tax rate is 1.3998% of the assessed property value [5]. See [6] for thehistorical schedule of tax rates in Philadelphia.
4When discussing the tax revenue from previously abated properties, it is important to remember that forthe ∼40% of properties that were improvements, only a portion of the total assessed property value waspreviously abated.
5The latest OPA data used in this analysis contains properties certified on March 31, 2017.
3.1 Historical information 8
Actively abated properties make up 53% of the total number of properties subjectto the abatement policy and have received a cumulative tax benefit of $442 overtheir abatement life (or 42% of the total tax benefit of $1.05B associated with theabatement policy). In 2017, actively abated properties received an annual tax benefitof $93M.
3.1.4 Property growth categorized as new construction andimproved construction
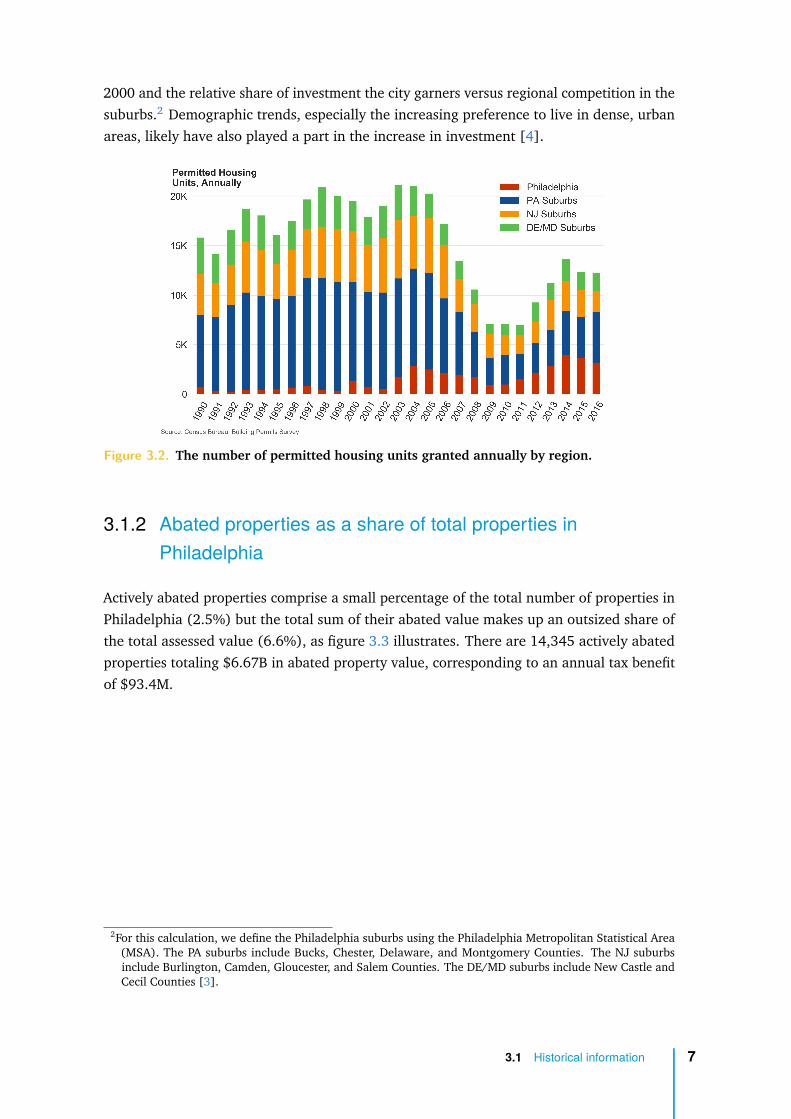
Figure 3.4 shows the total number of abated properties in Philadelphia historically, as wellas the breakdown of abatements granted for either new construction or improvements.The number of properties receiving abatements annually has risen to roughly 14,000 andremained relatively steady since 2012. In any given year, typically 60% of the abatementsare granted for new construction and 40% granted for improvements or conversions.
Figure 3.4. The total number of abated properties in Philadelphia historically. We also showthe breakdown of abatements granted for new construction (dark blue) or improvements(light blue).
3.1.5 Philadelphia market values over the life of the abatementpolicy
The heat map and associated graph in figure 3.5 present the nonuniform distribution ofproperty appreciation over the life of the abatement policy. Even though city median market
3.1 Historical information 9

values have experienced appreciation since the institution of the abatement policy (triplingfrom $50 per sqft in the mid 1990s to $150 per sqft in 2017), this appreciation has not beenuniformly distributed throughout the city. Since 2000, many neighborhoods, those withlittle to no red-saturation in the graphics below, saw little appreciation in market values evenas the city realized significant growth in market values overall. As this paper will explain insubsequent sections, the neighborhoods with the greatest market value appreciation in thisgraphic are positively correlated with high levels of abated property investment.
Figure 3.5. The historical median home value per square foot across Philadelphia. We showthe historical trend in the city-wide home value (top) and home values by neighborhood(bottom) for several years. While remaining stagnant in the 1990s, the median homevalue has tripled from $50 per sqft in the mid 1990s to $150 per sqft in 2017.
3.2 Segmentational analysis of actively abatedproperties
Summary
Abatement value is concentrated in high-value properties. Abated properties are, on thewhole, more valuable than non-abated properties. Properties with higher abated valuesreceive the majority share of tax benefits.
3.2 Segmentational analysis of actively abated properties 10
• Just 2.5% of all properties in Philadelphia have an abatement as of 2017. The totalsum of the abatements for these properties makes up 6.6% of all assessed value inPhiladelphia.
• The tax benefit associated with the abatement is concentrated in new construction.
• The tax benefit associated with the abatement is concentrated in residential properties.However, the tax benefit associated with commercial properties is disproportionate:commercial properties account for 2% of total abated properties, but receive 11% ofthe total tax benefit.
• The tax benefit associated with the abatements policy is concentrated in high-valueproperties. The top 15 properties by abated value, most of which are apartmentbuildings, make up 0.1% of all active abated properties and a full 16% of abated value,representing an associated tax benefit of $15M.
• 7% of actively abated properties receive abatements greater than $700K, but this smallpercentage of properties receives an outsized share of the tax benefit (51%).
Properties with tax abatements are concentrated in a small portion of Philadelphia, whetherconsidering abated properties by neighborhood or by Council District.
• The tax benefits associated with abated properties are concentrated in neighborhoodsin the greater Center City area. Just 6% of all Philadelphia neighborhoods account for59% of the tax benefit from the abatement policy.
• Council Districts 1, 2 and 5 account for 79% of actively abated properties and $5.3Bin abated value. The remaining 21% of actively abated properties are spread out overthe other seven Council districts and represent $1.3B in abated value.
• The abated value in Districts 1, 2 and 5 are concentrated in high-value properties(abatements greater than $1M); however, the majority of abated properties receivemuch lower abatement values, typically around $250K.
3.2.1 Active abatements by new construction and improvements:abatement benefits are concentrated in new construction
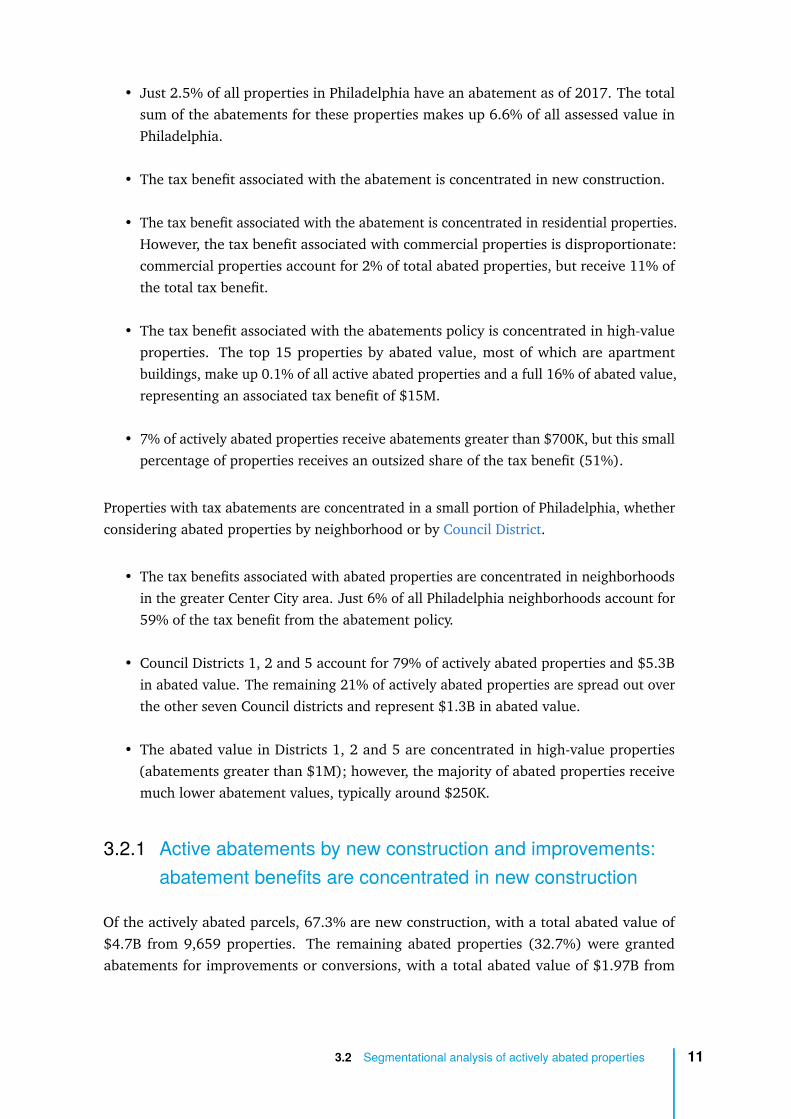
Of the actively abated parcels, 67.3% are new construction, with a total abated value of$4.7B from 9,659 properties. The remaining abated properties (32.7%) were grantedabatements for improvements or conversions, with a total abated value of $1.97B from
3.2 Segmentational analysis of actively abated properties 11
4,686 properties. This breakout of new and improved construction by number of propertiesand tax benefit is illustrated in figure 3.6 below. Note that the tax benefit is concentrated inhigher value properties.
Figure 3.6. The distribution of currently abated properties by the abated value. We show thetotal number of properties (top) and aggregate tax benefit (bottom) for properties thatare newly constructed (dark blue) and improvements of existing buildings (light blue).
3.2.2 Active abatements by property use type: abatement benefitsare concentrated in properties designated for residential userather than commercial use
The vast majority of abated properties are for residential use. Of the actively abatedproperties, 13,757 are for residential use, representing 96% of the total number of abatedproperties. Of the remaining abated properties, 324, or 2.2%, are for commercial use.The remaining 264 properties, or 1.8% of abated properties, are for other uses such asunderdeveloped land, stores with dwellings, and some industrial uses.
Residential abated properties have a total abated value of $5.8B, corresponding to 87% ofthe total abated value. Residential properties are comprised as follows:
• 6,956 are single-family homes (49% of the total number of abated properties).
• 5,448 are condos (38% of the total number of abated properties).
3.2 Segmentational analysis of actively abated properties 12
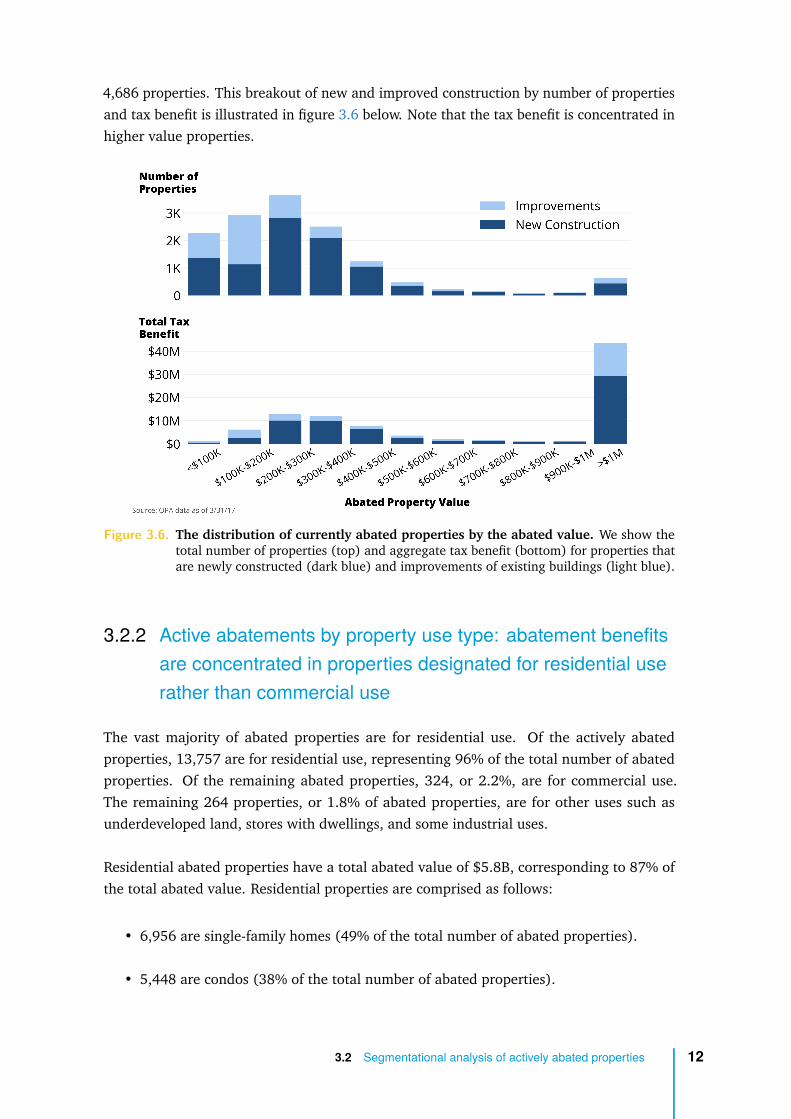
• 1,448 are hotels and apartment buildings (10% of the total number of abated proper-ties).
Hotels and apartment buildings,6 which this analysis categorizes as residential, receive thelargest total abatement value ($2.1B), followed by condominiums ($1.99B), and single-family homes ($1.72B). However, on a per sqft basis, condos receive nearly $290 persqft in abatements on average, while single-family homes average $143 per sqft, andhotels/apartments average $128 per sqft (based on new construction only).
There are only 324 actively abated commercial7 properties, representing 2.2% of totalabatements. These few properties constitute $0.74B (11%) of the total abated value. Newlyconstructed commercial properties (149 in total) have a median abated value of $88 per sqft.By comparison, commercial properties across Philadelphia that do not receive an abatement(13,408 in total) have a median taxable building value of only $37 per sqft.
Figure 3.7. Actively abated properties by their usage type, in terms of the total number ofproperties and total abated value.
3.2.3 Active abatements by value: abatement benefits areconcentrated in high-value properties
Median market values for abated properties are higher than median market values forunabated properties. The median market value8 per square foot (sqft) of residential, activelyabated properties is $202 per sqft. This value is 93% higher than the median home value in
6Hotels and apartment buildings are categorized as residential for our analysis. In the OPA data, this setcorresponds to Category 2 [7]. It is important to note that our analysis counts apartment buildings at thebuilding level, not the per-unit level.
7Commercial properties are defined as having Category Code 4 in the OPA data [7].8Market value is computed from the most recent sale price of the abated property (as given in the latest OPA
data from 3/31/2017).
3.2 Segmentational analysis of actively abated properties 13

Philadelphia of $105 per sqft, as given by the median city-wide home value in 2017 usingthe Zillow Home Value Index [8].
12,639 properties (88% of the total number of abated properties) have actively abated valuesless than $500K. Despite being an outsized portion of total number of abated properties, thisgroup comprises just $2.9B, or 43% of the total abated value. Of the properties receivingabatements less than $500K, 12,235 are residential (associated with an abated value of$2.8B) and 192 are commercial (associated with an abated value of $35M).
As illustrated in figure 3.8 below, 1,004 (7% of total abated properties) properties thatreceive active abatements have abated values greater than $700K. Despite being an under-sized portion of the total number of abated properties, this group comprises $3.4B, or 51%of the total abated value. Of the properties receiving abatements more than $700K, 858 areresidential (associated with an abated value of $2.6B) and 116 are commercial (associatedwith an abated value of $692M). Note: 83% of total abated property value for propertieswith abatements over $700K is categorized as “apartment buildings” or “hotel buildings.”Assessed value information is not available at a per-unit level.
Figure 3.8. Distribution of tax benefits by ownership.
647 properties receive abatements above $1M (less than 5% of total abated properties).However, the abated value associated with this group comprises $3.1B (47%) of the totalabated value. 47% of properties receiving abatements greater than $1M are condos (303properties). Of the properties receiving abatements greater than $1M, 88 are commercial(associated with a total abated value of $668M). The 88 commercial properties with abated
3.2 Segmentational analysis of actively abated properties 14

values in excess of $1M comprise less than 1% of all abated properties but represent 10% ofall abated value.
Table 3.1 below summarizes abated properties by type and value, illustrating that high-valueproperties comprise a relatively small percentage of abated parcels but receive an outsizedportion of the tax benefits.
Table 3.1. The distribution of abated properties by their type, including residential and com-mercial usage. Note that a small percentage of abated properties do not fall into eitherthe residential or commercial categories and are not represented in this table.
Number of Properties Abated ValueTax Benefit
(Percentage of Total) (Percentage of Total)
All AbatedTotal 14,345 (100%) $6,674M (100%) $93M
PropertiesResidential 13,757 (96%) $5,784M (87%) $81MCommercial 324 (2%) $736M (11%) $10M
Properties withTotal 1,705 (12%) $3,809M (57%) $53M
Abatements >$500KResidential 1,522 (11%) $3,002M (45%) $42MCommercial 131 (1%) $701M (11%) $10M
Properties withTotal 1,004 (7%) $3,408M (51%) $48M
Abatements >$700KResidential 858 (6%) $2,623M (39%) $37MCommercial 116 (1%) $692M (10%) $10M
Properties withTotal 647 (5%) $3,112M (47%) $44M
Abatements >$1MResidential 538 (4%) $2,359M (35%) $33MCommercial 88 (1%) $668M (10%) $9M
Source: OPA data as of 3/31/17
The concentration of tax benefits is perhaps most apparent when evaluating the top 15abatements by abated value (0.1% of all abated properties). These 15 properties, most ofwhich are apartment buildings, correspond to $1.05B in abated value - 16% of the entiretax abated value of Philadelphia - and represent an associated tax benefit of $15M.
3.2.4 Abatements by geography: abatement tax benefits areconcentrated in a small portion of Philadelphia’sneighborhoods
Tax benefits for abatements are concentrated in a small portion of Philadelphia’s neighbor-hoods. In table 3.2 we show the top neighborhoods by number of abated properties and taxbenefit. Zillow groups Philadelphia into 158 neighborhoods that we used for the purposesof our study [9]. To more easily understand the distribution of abated properties across thecity, we provide the relationship between ZIP codes and these neighborhoods in table A.1 inthe appendix.
3.2 Segmentational analysis of actively abated properties 15

54% of the total 14,345 abated properties fall into the top ten neighborhoods by numberof properties, and these top ten neighborhoods make up 59% of the total abated value.Rittenhouse alone accounts for 9% of the total properties but benefits from 19% of total taxbenefits.
Table 3.2. The top ten neighborhoods by number of abated properties in 2017.
NeighborhoodNumber of Percentage of All
Tax BenefitPercentage of All
Properties Abated Properties Abated Properties
1. Graduate Hospital 1,424 9.9% $6.0M 6.4%2. Rittenhouse 1,346 9.4% $17.9M 19.1%3. Northern Liberties 1,009 7.0% $9.9M 10.6%4. Point Breeze 805 5.6% $2.1M 2.2%5. Fishtown 799 5.6% $2.5M 2.6%6. North Central 650 4.5% $3.7M 4.0%7. Francisville 526 3.7% $1.6M 1.7%8. Old City 509 3.5% $3.4M 3.6%9. Logan Square 385 2.7% $6.3M 6.7%
10. Hawthorne 323 2.3% $1.6M 1.7%
Total 7,776 54.2% $54.9M 58.7%Source: OPA data as of 3/31/17
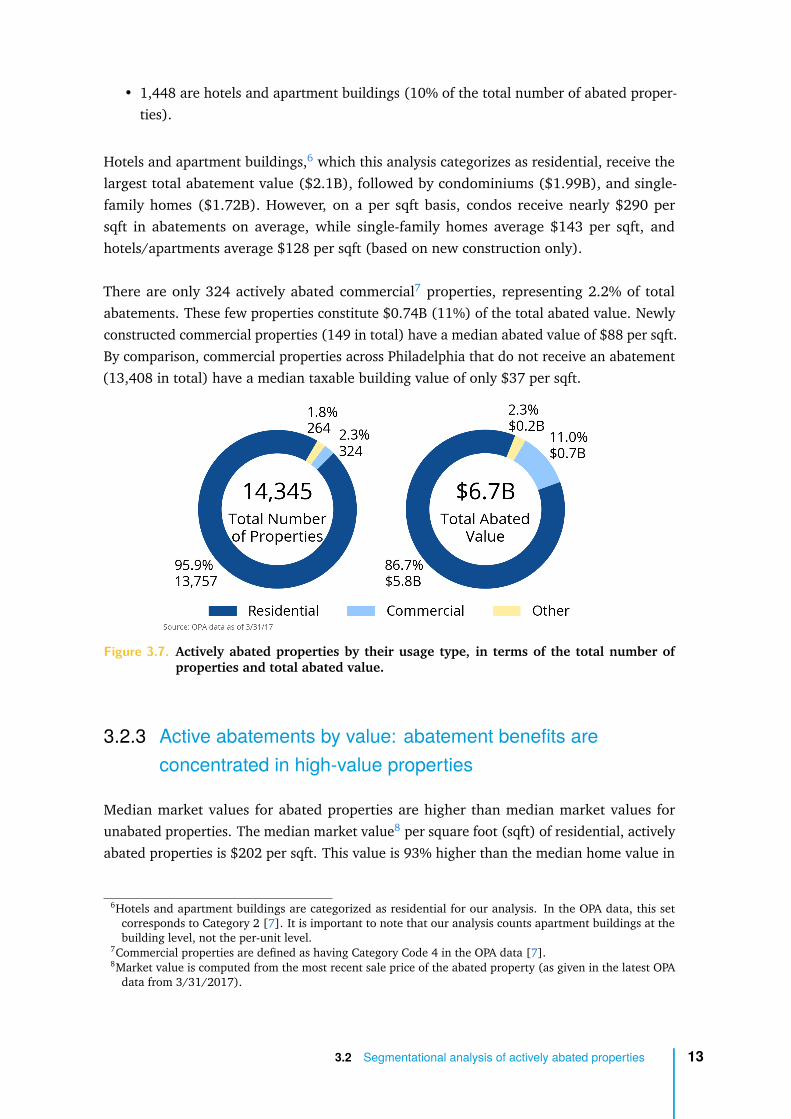
The distributions of all actively abated properties and only those with abatements over$700K are presented by neighborhood in figure 3.9. The heat maps in this figure showthat the majority of high-value abated properties are concentrated in Center City and itsimmediate surroundings.
3.2 Segmentational analysis of actively abated properties 16
Figure 3.9. The distribution of actively abated properties (top) and only those with abate-ments >$700K (bottom) by neighborhood in Philadelphia.
Another way to analyze the geographic distribution of abatement benefits is by City CouncilDistrict. The bar chart in figure 3.10 highlights the concentration of abatement benefits(both in terms of the number of parcels and the aggregate tax benefit) in a small number ofdistricts. This trend is primarily neighborhood-driven - the three districts with the highestconcentration of abatement benefits are those that are in and around greater Center City.
3.2 Segmentational analysis of actively abated properties 17
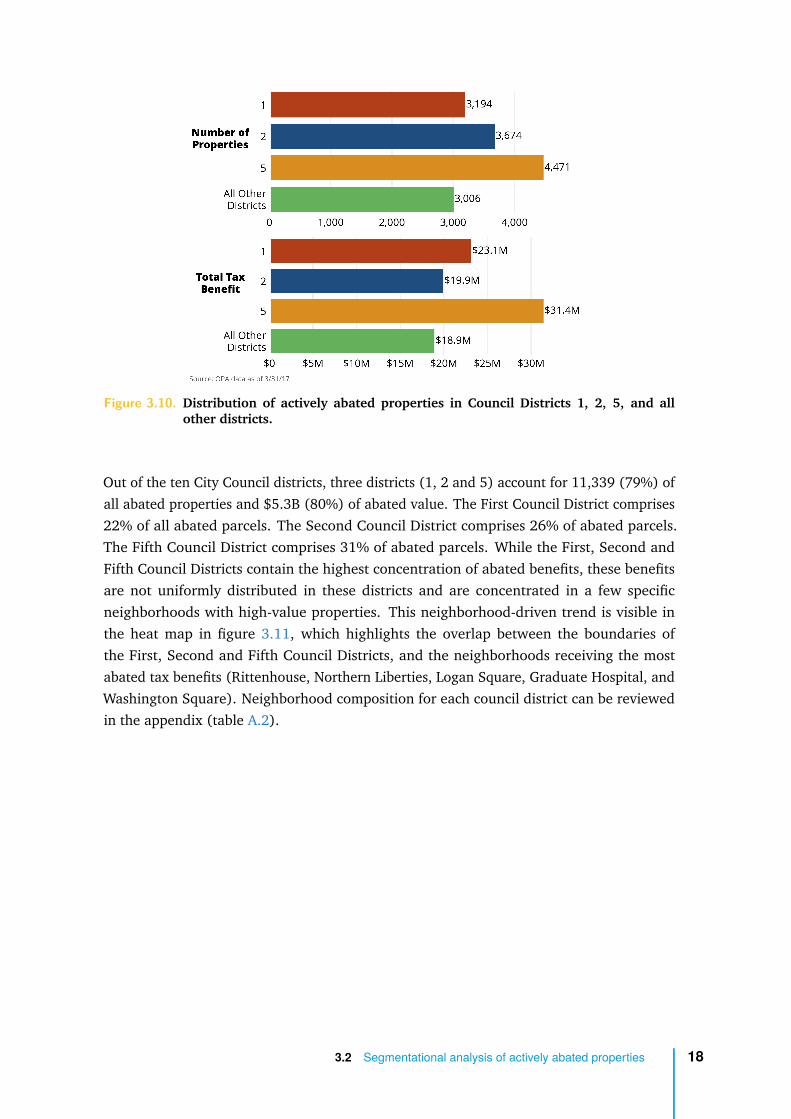
Figure 3.10. Distribution of actively abated properties in Council Districts 1, 2, 5, and allother districts.
Out of the ten City Council districts, three districts (1, 2 and 5) account for 11,339 (79%) ofall abated properties and $5.3B (80%) of abated value. The First Council District comprises22% of all abated parcels. The Second Council District comprises 26% of abated parcels.The Fifth Council District comprises 31% of abated parcels. While the First, Second andFifth Council Districts contain the highest concentration of abated benefits, these benefitsare not uniformly distributed in these districts and are concentrated in a few specificneighborhoods with high-value properties. This neighborhood-driven trend is visible inthe heat map in figure 3.11, which highlights the overlap between the boundaries ofthe First, Second and Fifth Council Districts, and the neighborhoods receiving the mostabated tax benefits (Rittenhouse, Northern Liberties, Logan Square, Graduate Hospital, andWashington Square). Neighborhood composition for each council district can be reviewedin the appendix (table A.2).
3.2 Segmentational analysis of actively abated properties 18

Figure 3.11. The distribution of the tax benefit from the abatement policy by neighborhoodin Philadelphia, with overlapping council district boundaries. District boundariesare shown as the thick black lines, with the black numbering identifying specificdistricts.
The distribution of abated properties in the First, Second and Fifth Council Districts arelargely representative of the distribution of abated properties city-wide. The median abatedproperty values in these districts ($252K, $268K, $289K, respectively) compare similarlyto the median abated value of $255K of all actively abated properties. This can be seenin figure 3.12, which shows the distribution of the number and value of actively abatedproperties. While it is true that the abated value in these districts is concentrated in high-value properties (abatements >$1M), it is also true that the majority of abated propertiesreceive much lower abatement values, typically around $250K.
3.2 Segmentational analysis of actively abated properties 19
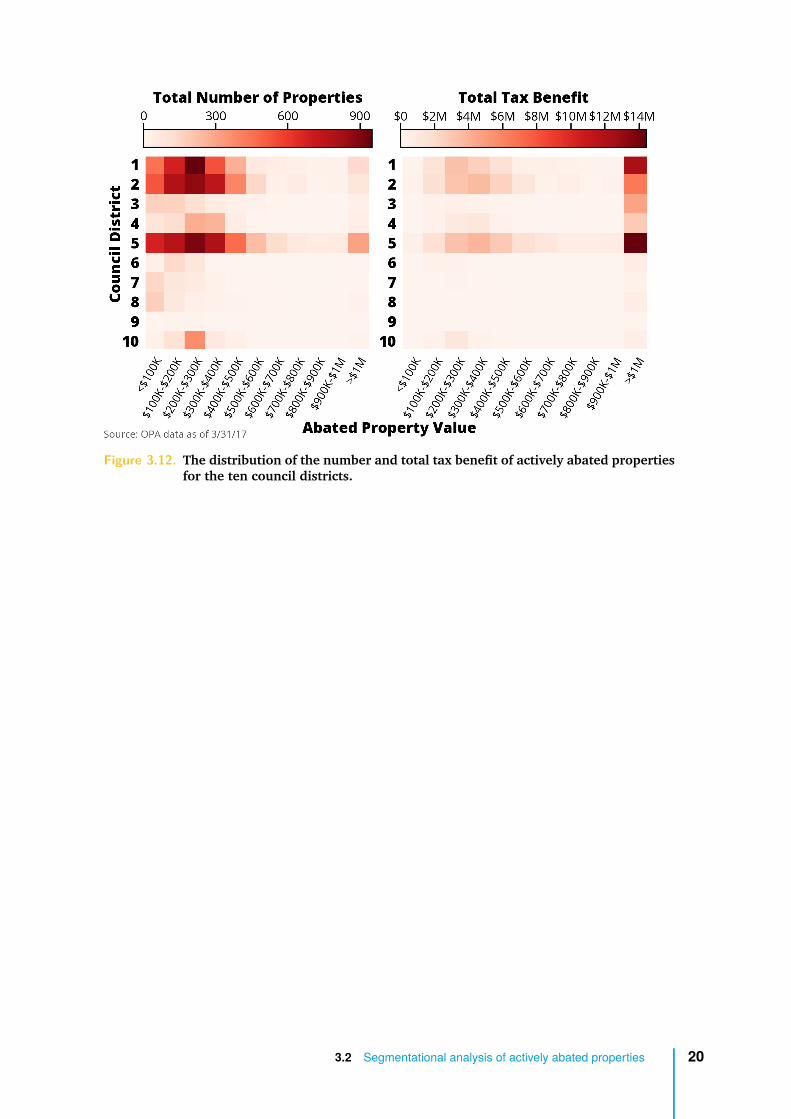
Figure 3.12. The distribution of the number and total tax benefit of actively abated propertiesfor the ten council districts.
3.2 Segmentational analysis of actively abated properties 20

4Developer Profitability
Summary
• A ZIP code by ZIP code analysis of Philadelphia reveals that only a handful of ZIP codesare sufficiently profitable to spur development on a build-to-sell and build-to-rentbasis.
• Among most of the ZIP codes with profitable development economics, development isprofitable regardless of the abatement.
• There are more abated properties in areas associated with higher developer profitabil-ity.
• Development in most of Philadelphia’s neighborhoods is not profitable, regardlessof the abatements, due to unprofitable building prospects for developers based onlower-than-average market values and rents and higher-than-average constructioncosts.
4.1 Defining real estate development profitability
Profitability in real estate development rests on what is sometimes described as a three-legged stool of market values, rent revenue and construction costs. Developers consider notonly whether a project is profitable, but also how profitable it is expected to be compared toother potential projects (which may include development in other cities). Two categories ofdevelopment activity analyzed in this paper are “build-to-sell” and “build-to-rent.”
• In a build-to-sell scenario, development is profitable when a developer can sell aproperty for an amount greater than the cost of development (comprised principallyof the costs of construction and land acquisition, in addition to transaction costs andinterest).
• In a build-to-rent scenario, development is profitable when a land owner can earnrental payments over time that exceed the cost of development (again comprised prin-
21

cipally of the costs of construction and of land acquisition, in addition to transactioncosts and interest) necessary to finance the development project.
4.2 Philadelphia profitability by ZIP code
The two areas of Philadelphia that have the highest participation in the tax abatement policyare also the areas of the city that are the most profitable to build, both from a build-to-selland a build-to-rent standpoint. The analysis below provides evidence to suggest that realestate investment would happen without tax abatements in certain areas.
4.2.1 Build-to-sell profitability
Figure 4.1 shows the build-to-sell profitability for Philadelphia ZIP codes in the form of a heatmap and a bar chart. In this case, we look at build-to-sell profitability for the construction ofa typical row home in Philadelphia.1 ZIP codes that have profitable development economicsfrom a build-to-sell standpoint are areas where home sale prices outweigh construction andland costs. We calculate for-sale profitability using median home value data from Zillow,median construction cost data from RSMeans, and the cost of land acquisition using landsale prices from the past four years of OPA data. These graphics also explore the impactof the value of the tax abatement on for-sale profitability. Over its ten-year lifetime, anabatement typically adds a ∼12% market value premium,2 helping to make developmenteconomics more profitable.
1This analysis uses assumptions for a 1,300 sqft, 2-story, economy row home.2This market value premium is equal to the net present value (NPV) of ten years of abated taxes assuming a
2.5% property appreciation rate, 1.4% tax rate, and a 5.5% discount rate.
4.2 Philadelphia profitability by ZIP code 22
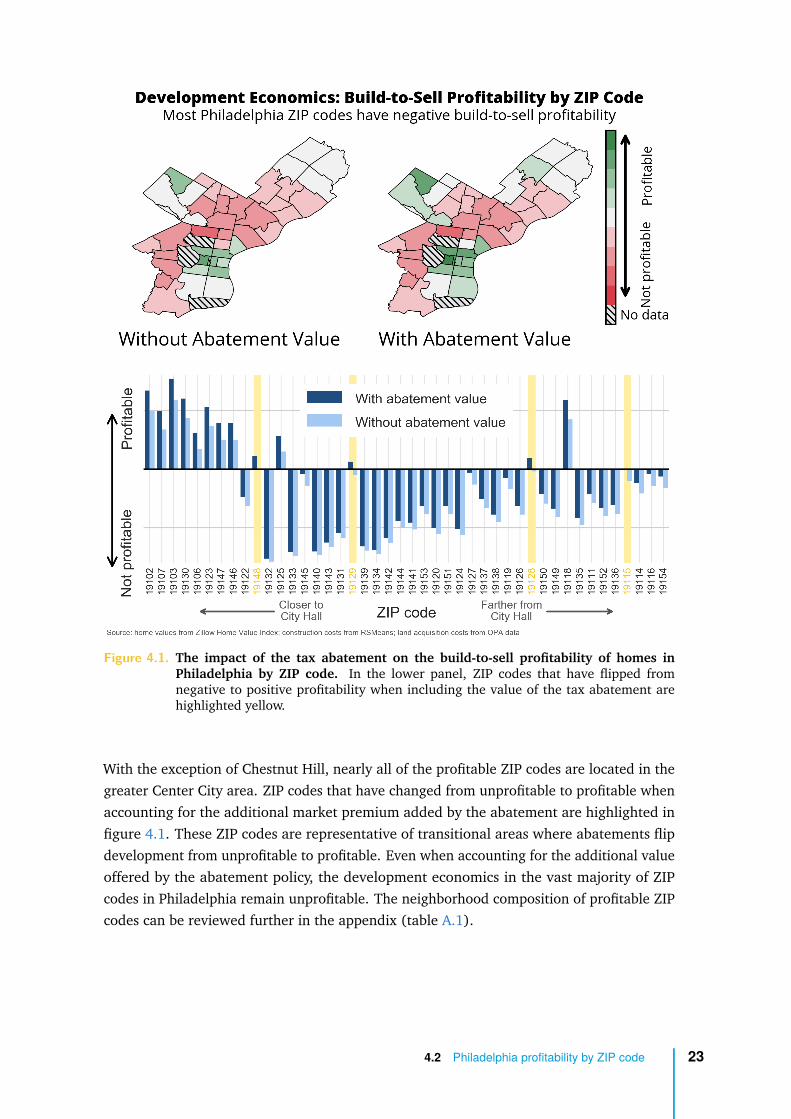
Figure 4.1. The impact of the tax abatement on the build-to-sell profitability of homes inPhiladelphia by ZIP code. In the lower panel, ZIP codes that have flipped fromnegative to positive profitability when including the value of the tax abatement arehighlighted yellow.
With the exception of Chestnut Hill, nearly all of the profitable ZIP codes are located in thegreater Center City area. ZIP codes that have changed from unprofitable to profitable whenaccounting for the additional market premium added by the abatement are highlighted infigure 4.1. These ZIP codes are representative of transitional areas where abatements flipdevelopment from unprofitable to profitable. Even when accounting for the additional valueoffered by the abatement policy, the development economics in the vast majority of ZIPcodes in Philadelphia remain unprofitable. The neighborhood composition of profitable ZIPcodes can be reviewed further in the appendix (table A.1).
4.2 Philadelphia profitability by ZIP code 23

4.2.2 Build-to-rent profitability
Build-to-rent profitability is also an important metric to consider when comparing investmentpotential for different ZIP codes. Return on costs is a measure of build-to-rent profitabilitythat can be helpful when evaluating investment potential between ZIP codes - a ZIP codewith a higher return on costs will likely solicit more developer investment than a ZIP codewith a lower return on costs. In the figure 4.2, we illustrate the correlation between thereturn on costs (calculated as annual rent over the sum of land costs and construction costs)for rental properties for ZIP codes in the city and the total abated value in those ZIP codes.For this calculation, annualized rental returns were estimated using Zillow data, constructioncost data were estimated using RSMeans, and sale prices were collected from OPA data. Wehave also indicated the total number of abatements in a ZIP code via the size of the circles.Similar to the build-to-sell economics, high-value properties with abatements tend to belocated in ZIP codes where rental returns are more profitable. Not surprisingly, the numberof abated properties is higher in ZIP codes with higher return on costs - the figure showsa strong correlation between the total sum of abated value and rental profitability by ZIPcode.
Figure 4.2. The correlation between the total abated value in a ZIP code and the build-to-rentprofitability. Circles are sized by the total number of abatements in a ZIP code. Greenlabels identify the ZIP codes that also have the most profitable build-to-sell economics.
4.2 Philadelphia profitability by ZIP code 24

It is important to note that ZIP codes can be heterogeneous – analysis indicating profitabilityfor real estate development in a certain ZIP code may not apply to all neighborhoodsand all property types within its boundaries. Conceding this reality, the analysis aboveprovides preliminary evidence that certain neighborhoods are likely receiving a tax benefitfor development that would likely happen without abatements.
4.3 Challenges to real estate development inPhiladelphia: market values, rents & constructioncosts
Developers commonly cite several factors that disincentivize investment in Philadelphiareal estate and place Philadelphia at a disadvantage compared to other major cities inwhich developers can choose to invest instead. Blight, crime, underperforming schools,cumbersome zoning and permitting and the higher tax burden of living in the city are chronicdisadvantages that put downward pressure on demand for new housing in Philadelphia.Decreased demand, in turn, depresses market values for both the purchase and rental ofproperties within the city, including new development.
Several factors combine to render both build-to-sell and build-to-rent development un-profitable in most neighborhoods of Philadelphia and therefore unattractive to potentialdevelopers. Property sale prices, as well as rents, are lower on average in Philadelphiacompared to many other cities. In addition, as described below, construction costs tendto be higher in Philadelphia than most other cities, and the combination of lower marketvalues and rents together with higher construction costs causes many potential developmentprojects to be unprofitable. Put simply, in most of Philadelphia, potential build-to-sell orbuild-to-rent development is unprofitable or not very profitable because sales values andrents are low relative to other cities while construction costs are high relative to other cities.As a result, the majority of ZIP codes do not currently offer profitable real estate developmentopportunities for build-to-sell or build-to-rent projects, regardless of abatements.
Philadelphia’s comparatively lower property and rental values can be a double-edged swordfor the city and its residents. On the one hand, much of Philadelphia’s existing housing stockis available to residents at comparatively lower prices than other major cities. On the otherhand, the lower profitability of development in many Philadelphia neighborhoods leads tounderdevelopment of new affordable housing and underinvestment in maintaining existinghousing. The reality of lower-than-average rents and market values is shown in figure 4.3.In this figure, Philadelphia ranks 15th in terms of median home value per sqft and 14th interms of median rent per sqft. Many of the cities with higher market values and rents arealso associated with higher construction costs.
4.3 Challenges to real estate development in Philadelphia: market values, rents & construction costs 25

Figure 4.3. The median home value per square foot and the median rent per square foot forvarious U.S. cities.
Figure 4.4 illustrates how the combination of low rents and high construction costs can leadto less profitable development in Philadelphia compared to other major cities in the UnitedStates. Dividing annual expected rent by the cost of construction per sqft provides a roughestimate of a developer’s return on investment for a project. Philadelphia falls significantlybelow many major cities by this metric at 4.9% for a three-story apartment complex andalso falls below the national average. Other major East Coast cities offer significantly higherreturns on investment, notably Washington D.C. (14.4%), Boston (12.6%), and New York(7.9%).3 Developers deciding whether to invest in a particular real estate project canweigh alternative investment opportunities, which may offer greater expected returns, andthe relative attractiveness of an opportunity can depend on available alternatives. Facedwith more profitable development opportunities outside of Philadelphia, developers maychoose to invest in other cities. This can contribute to underdevelopment of new housing inPhiladelphia.
3It should be noted that these data do not account for land acquisition costs.
4.3 Challenges to real estate development in Philadelphia: market values, rents & construction costs 26

Figure 4.4. The ratio between the annualized rent and union labor construction cost per sqftin various U.S. cities.
Residential single-family home development is, on average, loss-making for developers inPhiladelphia, based on city averages for sales price, construction costs, and land acquisitioncost. That is, a developer would actually lose money by building a typical single-family rowhome in Philadelphia, which helps explain why new homes are not being built in most of thecity’s neighborhoods. Figure 4.5 illustrates this reality using city averages for acquisition cost,construction costs, and market value to calculate the monetary loss associated with buildinga 1,300 sqft, two-story single-family row home in Philadelphia. According to RSMeans, mostresidential construction of this kind of row home is open-shop. In this example, it costs$167 per sqft to build a row home that would sell for $105 per sqft.4 If a developer paid$5 per sqft5 in land acquisition costs, building such a home would lead to a loss of $67 persqft. This estimate does not include soft costs and overhead, thereby understating the fullmagnitude of the loss. In light of the unprofitable nature of building a typical row home, itis understandable that relatively few homes are built in many Philadelphia neighborhoods.The Office of the City Controller has been quoted lower costs of construction for this type ofhome, as low as $115 per sqft, in certain areas of the city. However, assuming $115 per sqftconstruction costs while holding all other values equal still results in a loss of $15 per sqft.
4The average home sale price is estimated using the median city-wide home value in 2017, using the ZillowHome Value Index [8]. See the discussion in section 2.2 for further details regarding the differences betweenhome sales prices and market value.
5As determined by the median of city-wide, at-arms-length vacant land sales in 2017 using OPA data as of3/31/2017.
4.3 Challenges to real estate development in Philadelphia: market values, rents & construction costs 27

Figure 4.5. The development economics of a typical single family home in Philadelphia.
Moreover, residential construction costs for a typical 1,300 sqft single-family row homeillustrated in figure 4.5 are significantly higher in Philadelphia than for the same home inother large U.S. cities. Philadelphia has the fifth-highest cost of construction of any city inthe nation for building this row home, with construction costs of $167 per sqft, 24% abovethe national average of $135 per sqft for the same home.
Figure 4.6. Average home construction cost per sqft in various U.S. cities.
Philadelphia’s higher-than-average construction costs affect commercial, as well as residen-tial, construction projects, including projects that are built to be operated as commercialenterprises. Below we modeled construction costs for four types of buildings found in urban
4.3 Challenges to real estate development in Philadelphia: market values, rents & construction costs 28
areas: a three-story apartment building, a single-story laundromat, a six-story hospital, anda single-story day-care center. In figure 4.7, union construction costs per sqft are presentedfor 22 major U.S. cities and the national average for these four project types. For these fourprojects, union construction in Philadelphia consistently costs about 18% more than thenational average for union construction. At union labor rates:
• Philadelphia ranks fifth-highest among U.S cities for the cost of construction of athree-story apartment building;
• Philadelphia ranks third-highest among U.S. cities for the cost of construction of asingle-story laundromat;
• Philadelphia ranks fourth-highest among U.S. cities for the cost of construction of asix-story hospital; and
• Philadelphia ranks fourth-highest among U.S. cities for the cost of construction of asingle-story day care facility.
4.3 Challenges to real estate development in Philadelphia: market values, rents & construction costs 29

Figure 4.7. Union construction costs for four common commercial projects.
The primary reason for high construction costs in Philadelphia relative to other cities is thecost of labor (see table 4.1). Material costs in Philadelphia are actually slightly below thenational average by 0.4%. In contrast, installation costs in Philadelphia are 34.5% higherthan the national average. Labor costs, in turn, comprise the bulk of installation costs.Although several cities have construction costs as high as, or higher than, Philadelphia,those cities generally have higher housing prices and rents than Philadelphia, which helpcover the cost of construction. In those cities, a developer can expect a larger profit, whichprovides an incentive for more development.
4.3 Challenges to real estate development in Philadelphia: market values, rents & construction costs 30
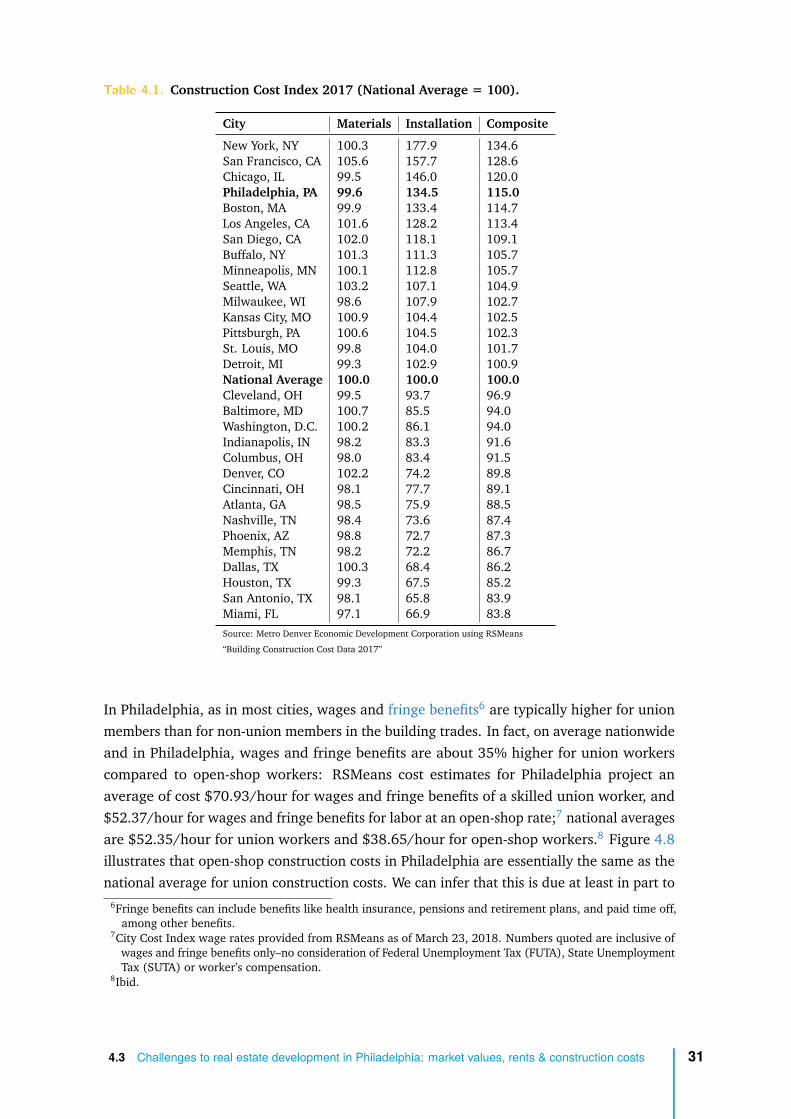
Table 4.1. Construction Cost Index 2017 (National Average = 100).
City Materials Installation Composite
New York, NY 100.3 177.9 134.6San Francisco, CA 105.6 157.7 128.6Chicago, IL 99.5 146.0 120.0Philadelphia, PA 99.6 134.5 115.0Boston, MA 99.9 133.4 114.7Los Angeles, CA 101.6 128.2 113.4San Diego, CA 102.0 118.1 109.1Buffalo, NY 101.3 111.3 105.7Minneapolis, MN 100.1 112.8 105.7Seattle, WA 103.2 107.1 104.9Milwaukee, WI 98.6 107.9 102.7Kansas City, MO 100.9 104.4 102.5Pittsburgh, PA 100.6 104.5 102.3St. Louis, MO 99.8 104.0 101.7Detroit, MI 99.3 102.9 100.9National Average 100.0 100.0 100.0Cleveland, OH 99.5 93.7 96.9Baltimore, MD 100.7 85.5 94.0Washington, D.C. 100.2 86.1 94.0Indianapolis, IN 98.2 83.3 91.6Columbus, OH 98.0 83.4 91.5Denver, CO 102.2 74.2 89.8Cincinnati, OH 98.1 77.7 89.1Atlanta, GA 98.5 75.9 88.5Nashville, TN 98.4 73.6 87.4Phoenix, AZ 98.8 72.7 87.3Memphis, TN 98.2 72.2 86.7Dallas, TX 100.3 68.4 86.2Houston, TX 99.3 67.5 85.2San Antonio, TX 98.1 65.8 83.9Miami, FL 97.1 66.9 83.8Source: Metro Denver Economic Development Corporation using RSMeans
“Building Construction Cost Data 2017”
In Philadelphia, as in most cities, wages and fringe benefits6 are typically higher for unionmembers than for non-union members in the building trades. In fact, on average nationwideand in Philadelphia, wages and fringe benefits are about 35% higher for union workerscompared to open-shop workers: RSMeans cost estimates for Philadelphia project anaverage of cost $70.93/hour for wages and fringe benefits of a skilled union worker, and$52.37/hour for wages and fringe benefits for labor at an open-shop rate;7 national averagesare $52.35/hour for union workers and $38.65/hour for open-shop workers.8 Figure 4.8illustrates that open-shop construction costs in Philadelphia are essentially the same as thenational average for union construction costs. We can infer that this is due at least in part to
6Fringe benefits can include benefits like health insurance, pensions and retirement plans, and paid time off,among other benefits.
7City Cost Index wage rates provided from RSMeans as of March 23, 2018. Numbers quoted are inclusive ofwages and fringe benefits only–no consideration of Federal Unemployment Tax (FUTA), State UnemploymentTax (SUTA) or worker’s compensation.
8Ibid.
4.3 Challenges to real estate development in Philadelphia: market values, rents & construction costs 31

high levels of union membership increasing the construction labor rate for both union andopen shop labor. As union workers negotiate higher wage rates, open-shop builders raisethe wage rates of their workers in order to close the wage gap [10].
Figure 4.8. Union and open-shop hourly wages + fringe benefits in Philadelphia versus thenational average.
4.3 Challenges to real estate development in Philadelphia: market values, rents & construction costs 32

5Changes to the Abatement:Scenarios Considered
In this section, the Office of the City Controller presents and evaluates several policy changeproposals to the Ten-Year Tax Abatement, highlighting potential revenue gained, propertiesimpacted and overall impact on the City. The potential revenue gained is a projectioncalculated using proforma OPA data reflecting construction from January 2016 to December2016, assuming the applicable policy change had taken effect in 2016. Note that thesehypothetical scenarios are only applied to properties added to OPA rolls in proforma year2016.
As discussed previously, the Ten-Year Tax Abatement exempts new construction and improve-ments to, or conversions of, existing properties from paying property tax on the changesfor ten years. The City of Philadelphia, as a local taxing authority, can create a special taxprovision, like the abatement, to encourage real estate development and improvement ofproperties in deteriorating areas in accordance with standards set by the Commonwealthof Pennsylvania. The Commonwealth has put certain restrictions on how these tax provi-sions must be drafted locally, including stating the boundaries of deteriorating areas, themaximum cost assessment to be abated, and the taxation schedule.
The legal authority, restrictions and requirements are important context to consider in thefollowing analysis, which presents and evaluates scenarios to alter the abatement policy forrevenue possibilities and abated property impact. With that in mind, a legal note for eachscenario will be included.
The analysis below evaluates six different potential policy changes. The Office of the CityController recognizes that any particular change in abatement policy may have secondaryeconomic effects that are not reflected in this analysis, including but not limited to decreaseddevelopment.
Since the enactment of the real estate tax abatement, there have been numerous policyrecommendations for its update and amendment. The most extreme approach calls foreliminating abatements entirely. Some recommendations focus on limiting abatements bygeography, others focus on limiting abatements by total property value or property valueper sqft. Still other policy recommendations call for amortization of the benefit over time.
33
Currently, the property tax rate of 1.4% is applied to the assessed value of a property’sbuilding and land. The revenue generated from the tax is then split two ways, with 55%going to the Philadelphia School District and 45% to the City. For our analysis, we assumethat revenue split as a portion of the property tax rate itself, applying a tax rate of 0.63%, or45% of the total tax rate, for the City and a rate of 0.77%, or 55% of the total tax rate, forthe School District. Due to this allocation of funds, other recommendations have called for areinstatement of the School District portion of the property tax rate (the 0.77% rate), suchthat only the portion directed to the City would be abated.
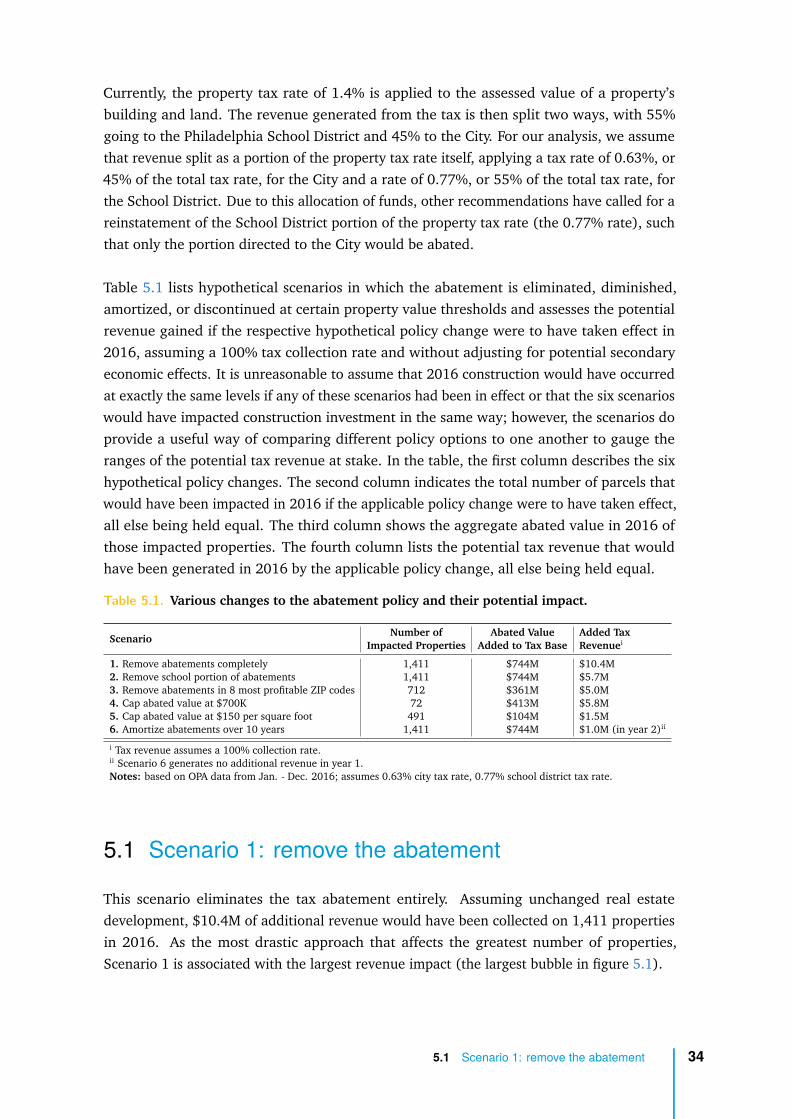
Table 5.1 lists hypothetical scenarios in which the abatement is eliminated, diminished,amortized, or discontinued at certain property value thresholds and assesses the potentialrevenue gained if the respective hypothetical policy change were to have taken effect in2016, assuming a 100% tax collection rate and without adjusting for potential secondaryeconomic effects. It is unreasonable to assume that 2016 construction would have occurredat exactly the same levels if any of these scenarios had been in effect or that the six scenarioswould have impacted construction investment in the same way; however, the scenarios doprovide a useful way of comparing different policy options to one another to gauge theranges of the potential tax revenue at stake. In the table, the first column describes the sixhypothetical policy changes. The second column indicates the total number of parcels thatwould have been impacted in 2016 if the applicable policy change were to have taken effect,all else being held equal. The third column shows the aggregate abated value in 2016 ofthose impacted properties. The fourth column lists the potential tax revenue that wouldhave been generated in 2016 by the applicable policy change, all else being held equal.
Table 5.1. Various changes to the abatement policy and their potential impact.
ScenarioNumber of Abated Value Added Tax
Impacted Properties Added to Tax Base Revenuei
1. Remove abatements completely 1,411 $744M $10.4M2. Remove school portion of abatements 1,411 $744M $5.7M3. Remove abatements in 8 most profitable ZIP codes 712 $361M $5.0M4. Cap abated value at $700K 72 $413M $5.8M5. Cap abated value at $150 per square foot 491 $104M $1.5M6. Amortize abatements over 10 years 1,411 $744M $1.0M (in year 2)ii
i Tax revenue assumes a 100% collection rate.ii Scenario 6 generates no additional revenue in year 1.Notes: based on OPA data from Jan. - Dec. 2016; assumes 0.63% city tax rate, 0.77% school district tax rate.
5.1 Scenario 1: remove the abatement
This scenario eliminates the tax abatement entirely. Assuming unchanged real estatedevelopment, $10.4M of additional revenue would have been collected on 1,411 propertiesin 2016. As the most drastic approach that affects the greatest number of properties,Scenario 1 is associated with the largest revenue impact (the largest bubble in figure 5.1).
5.1 Scenario 1: remove the abatement 34
Legal note: Tax abatements are not legally mandated, and the City can elect to eliminatethem all together.1
5.2 Scenario 2: remove school portion of theabatement
This scenario removes the School District portion of the tax abatement (the 0.77% tax ratereferenced above) but maintains the abatement for the portion of the property tax directedto the City. In 2016, this scenario would have resulted in additional tax revenue estimatedat $5.7M, assuming unchanged real estate development. Scenario 2 would impact as manyproperties as Scenario 1, but is associated with a smaller revenue impact (a smaller bubblerelative to Scenario 1 in figure 5.1) because it features a partial abatement.
Legal note: The City is not required by State law to extend abatements to the taxes of theSchool District, a separate taxing entity.2
5.3 Scenario 3: remove abatement in 8 most profitableZIP codes
This scenario examines the elimination of abatements in the eight most profitable ZIP codesfor development. These eight ZIP codes -19102, 19103, 19107, 19118, 19123, 19130,19146, and 19147 - were identified previously in the paper to be the most profitable regard-less of the status of the abatement. These eight ZIP codes encompass the neighborhoods ofRittenhouse Square, Graduate Hospital, Point Breeze, Logan Square, Fitler Square, Wash-ington Square, Society Hill, Northern Liberties, Passyunk Square, Fairmount, and ChestnutHill. If this scenario were to have occurred with 2016 data, assuming unchanged real estateinvestment, all abated parcels outside of these eight ZIP codes would have been abated,while 712 parcels within those ZIP codes would have received no abatement, representingpotential additional tax revenue estimated at $5.0M. It should be noted, however, thatmany of these eight ZIP codes include neighborhoods where development profitability variessignificantly. That is, while construction may, on average, have a robust return on investmentin these eight ZIP codes, they also include pockets where this is not necessarily the case.
1Local taxing authorities may, but are not obligated to, create ordinances authorizing abatements on theassessed valuation of improvements to deteriorated properties, as well as other improvements and newconstruction in deteriorated areas. 72 P.S. §4711-202(a), §4711-302(a) and §4725(a).
272 P.S. §4711-202(a), §4711-302(a) and §4725(a). The Philadelphia School District is authorized to levytaxes on real estate in Philadelphia. Phila. Code §19-1801 (1), as authorized by 72 P.S. §5020-201. Forpurposes of abatements, local taxing authorities are defined as “a county, city...or school district havingauthority to levy real property taxes.” 72 P.S. §4711-103 and §4724.
5.2 Scenario 2: remove school portion of the abatement 35
Legal note: The City can reassess all areas of the city by ZIP code, and decide if each isdeteriorated and therefore continues to legally qualify for abatements.3
5.4 Scenario 4: cap abatement at $700K
Scenario 4 taxes the assessed value in excess of $700K of an individual property, in effectcapping the abatement per property at $700K. In 2016, 72 properties with abatementsvalued in excess of $700K would have been impacted by this scenario. If implemented,assuming unchanged real estate investment in 2016, this scenario would have provided$5.8M in additional tax revenue.
It should be noted that Scenario 4 applies policy changes at a parcel-by-parcel level ratherthan a unit-by-unit level. The OPA data are organized by parcel, with hotels and non-condominium, multi-unit apartment buildings each categorized as a single parcel, regardlessof how many units may be found within a parcel. In the OPA data, 83% of the buildingvalue in excess of $700K is categorized as “apartment buildings or hotel buildings,” but dataregarding assessed value at a unit-by-unit level are not available from the OPA. For thisreason, potential policy changes such as assessment-based caps on abatements are modeledat the parcel level, not the unit level, for hotels and non-condominium, multi-unit apartmentbuildings. If future datasets were to include unit-by-unit assessments and assessment-basedcaps were applied per unit, the additional tax revenue generated would likely be less thanthe amounts projected in Scenario 4.
Legal note: Under the law, the City can specify a maximum cost to be taxed that is less thanthe actual maximum cost.4
5.5 Scenario 5: cap abatement at $150 per squarefoot
This scenario removes abatements on a cost per sqft basis for assessed values exceeding thethreshold of $150. That is, for properties with assessed value over $150 per sqft, Scenario 5applies taxation only to the portion of assessed value over $150 per sqft. For example, if a10,000 sqft property had an assessed value of $175 per sqft, then the tax would be appliedonly on the $25 per sqft above $150 per sqft, with a property tax of $25 x 10,000 x 1.4% =
3The Commonwealth instructs the City to designate the deteriorated areas, “wholly or partially located withinits jurisdiction,” prior to adopting a local ordinance. 72 P.S. §4711-202(a), §4711-302(a) and §4725 (a).
4Whether the actual cost or a lesser amount is the maximum, the amount must be specified in the localordinance. 72 P.S. §4711-203(a), 4711-303(b) and §4726 (a).
5.4 Scenario 4: cap abatement at $700K 36

$3,500. If Scenario 5 were to have occurred, all else equal, the associated additional taxrevenue on the 491 abated properties added in 2016 would have been $1.5M.
Most newly abated buildings have assessed values per sqft lower than this $150 per sqftthreshold. And for those properties with assessed values exceeding this threshold, themargin of difference, i.e. the taxable portion of the assessed value over $150 per sqft, tendsto be small when compared to the property as a whole. Consequently, this scenario projectsthe lowest revenue potential.
Legal note: While abatements are allowable up to the maximum cost of improvements ornew construction per property, it is not at all clear that either the abatement statutes orconstitutional uniformity would allow the City to impose a cap on the per-square footagevalue of abatements.5
5.6 Scenario 6: amortize abatement over ten years
The final scenario modeled represents a linear amortization of the tax abatement over itsten years, assuming a 100% abatement in year 1, 90% abatement in year 2, 80% abatementin year 3, and so on, with the property receiving no abatement in year 11.
Assuming unchanged real estate investment, Scenario 6 would have impacted all 1,411properties added in 2016. In year two, all else equal, this would have resulted in additionaltax revenue estimated at $1M. Additional revenue would continue to grow in each subse-quent year, back-end loading the tax revenues to the later years of a property’s ten-yearabated life.
Legal note: This scenario is expressly authorized by the Commonwealth. Local abatement or-dinances must specify an abatement schedule, declaring the portion of the new or improvedproperty to be abated each year.6
Figure 5.1 illustrates the effect of the potential policy changes of scenarios 1 through 5,based on 2016 proforma data, to demonstrate the potential tax revenue that would havebeen generated in 2016, had the respective policy changes been enacted, all else being heldequal.
5The statutory language of 72 P.S. §4711-203(a), §4711-303(b), and §4726 suggests that the Commonwealthintended for there to be a specified cost maximum per property, not per square foot of property. 72 P.S.§4711-203(a) specifically requires that if the allowable cost is set at an amount less than the maximum, thatamount must be a multiple of $1000, which would be difficult to consistently achieve assessing by squarefeet.
6For residential property abatements, the abatement schedule in scenario 6 is suggested as an option handeddown by the Commonwealth, thereby expressly authorized. 72 P.S. §4711-203(a)(1) and §4711-303(a)(2).For commercial property abatements, the Commonwealth does not give specific schedule recommendations.72 P.S. §4726(b)(2).
5.6 Scenario 6: amortize abatement over ten years 37
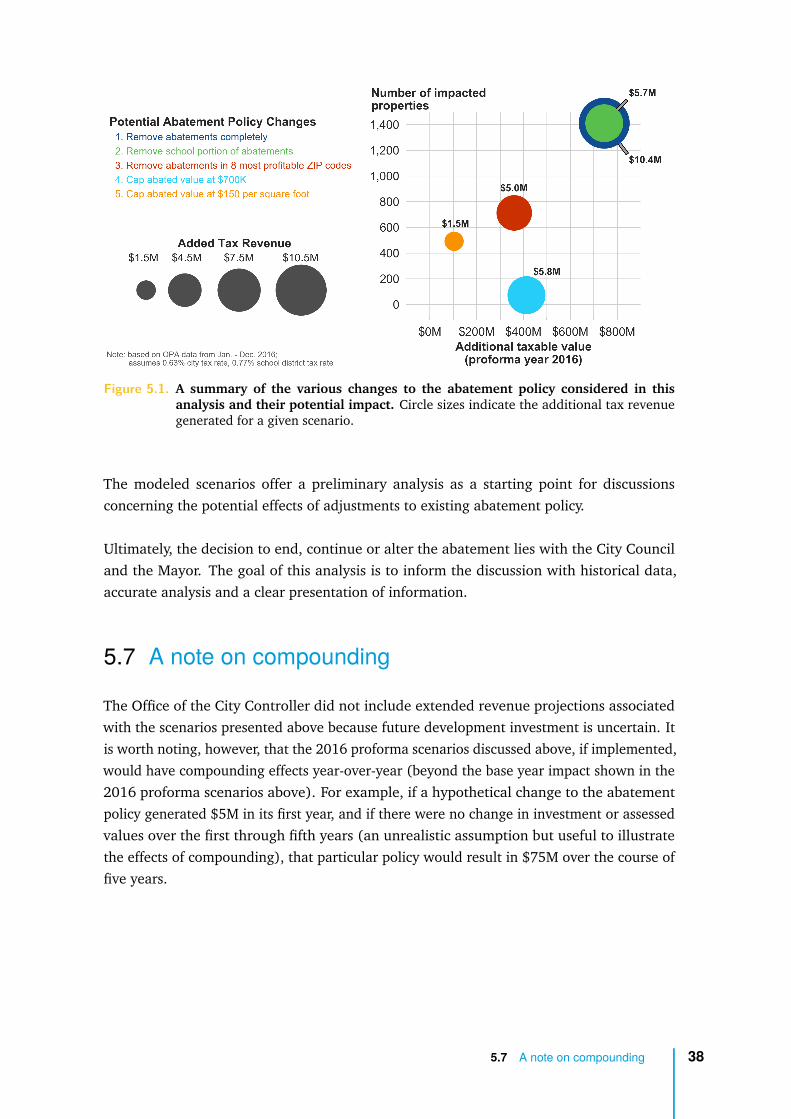
Figure 5.1. A summary of the various changes to the abatement policy considered in thisanalysis and their potential impact. Circle sizes indicate the additional tax revenuegenerated for a given scenario.
The modeled scenarios offer a preliminary analysis as a starting point for discussionsconcerning the potential effects of adjustments to existing abatement policy.
Ultimately, the decision to end, continue or alter the abatement lies with the City Counciland the Mayor. The goal of this analysis is to inform the discussion with historical data,accurate analysis and a clear presentation of information.
5.7 A note on compounding
The Office of the City Controller did not include extended revenue projections associatedwith the scenarios presented above because future development investment is uncertain. Itis worth noting, however, that the 2016 proforma scenarios discussed above, if implemented,would have compounding effects year-over-year (beyond the base year impact shown in the2016 proforma scenarios above). For example, if a hypothetical change to the abatementpolicy generated $5M in its first year, and if there were no change in investment or assessedvalues over the first through fifth years (an unrealistic assumption but useful to illustratethe effects of compounding), that particular policy would result in $75M over the course offive years.
5.7 A note on compounding 38

ABoundaries by Neighborhood, ZIPCode, and Council District
39

Table A.1. The relationship between ZIP codes and the neighborhoods used in this analysis.We also give the number of abated properties in each neighborhood. ZIP codes labeledin green identify the top 8 most profitable ZIP codes, which are considered in Scenario 3(see section 5.3).
ZIP Code Neighborhood (Number of Currently Abated Properties)
19102 Rittenhouse (525), Logan Square (2)19103 Rittenhouse (722), Logan Square (346), Fitler Square (7), Spring Garden (1)19104 Mantua (171), West Powelton (97), Spruce Hill (60), Haverford North (15), University City (14), East
Parkside (12), Powelton (11), Belmont (4), Southwest Schuylkill (3), Woodland Terrace (3)19106 Old City (476), Society Hill (35), Washington Square (27), Riverfront (1)19107 Washington Square (177), Center City (44), Old City (33), Callow Hill (21), Chinatown (12)19108 Callow Hill (1)19111 Fox Chase (93), Rhawnhurst (7), Lawndale (4), Oxford Circle (3), Burnholme (1)19112 Navy Yard (2)19113 Fox Chase (2)19114 Torresdale (46), Pennypack (38), Morrell Park (11), Aston Woodbridge (7), Academy Gardens (5), Northeast
Airport (3), West Torresdale (1)19115 Bustleton (116)19116 Byberry (252), Somerton (87)19118 Chestnut Hill (90), Mount Airy West (1)19119 Mount Airy West (43), Mount Airy East (36), Chestnut Hill (1)19120 Feltonville (1), Olney (1)19121 North Central (647), Brewerytown (94), Strawberry Mansion (57), Stanton (41), Northern Liberties (1)19122 Old Kensington (245), Ludlow (85), West Kensington (36), Hartranft (31), Fishtown (11), East Kensington
(1), Yorktown (1)19123 Northern Liberties (998), West Poplar (156), East Poplar (57), Callow Hill (37), Fishtown (14), Old Kensington
(1), Yorktown (1)19124 Juniata Park (57), Frankford (2), Northwood (2), Crescentville (1), Hunting Park (1)19125 Fishtown (774), East Kensington (224), Northern Liberties (8), Richmond (4), Old Kensington (2)19126 East Oak Lane (2)19127 Manayunk (78), Roxborough (38), Wissahickon (16), Germany Hill (1), Roxborough Park (1)19128 Roxborough (214), Upper Roxborough (88), Germany Hill (38), Dearnley Park (37), Andorra (26), Roxbor-
ough Park (25), Wissahickon (12), Manayunk (8), Chestnut Hill (1), East Falls (1)19129 East Falls (163), Allegheny West (9), Tioga (1)19130 Francisville (516), Spring Garden (212), Fairmount (142), Logan Square (37), Brewerytown (13), North
Central (3)19131 Overbrook (33), Wynnefield (14), Francisville (10), Carroll Park (5), Wynnefield Heights (3), Haddington
(1), Mill Creek (1), West Parkside (1)19132 Hartranft (27), Glenwood (20), Stanton (18), Allegheny West (6), Tioga (1)19133 West Kensington (51), Hartranft (38), Fairhill (1)19134 Richmond (149), Harrowgate (7), Hunting Park (2), Upper Kensington (1)19135 Wissinoming (6), Tacony (3)19136 Holmesburg (15), Pennypack Woods (8), Winchester Park (3), Mayfair (2), Graduate Hospital (1)19137 Bridesburg (37), Harrowgate (5), Frankford (1), Richmond (1)19138 Germantown East (5), Mount Airy East (3)19139 Mill Creek (62), Walnut Hill (22), Cobbs Creek (12), Haddington (4), Spruce Hill (3), Dunlap (2), Garden
Court (2), Overbrook (2)19140 Tioga (80), Fairhill (47), Feltonville (3), Franklinville (2), Hunting Park (1), Logan (1), Nicetown (1)19141 Logan (5), Ogontz (3), Fern Rock (2)19142 Industrial (2), Elmwood (1)19143 Cedar Park (31), Garden Court (23), Southwest Schuylkill (19), Cobbs Creek (11), Kingesessing (5), Spruce
Hill (4), Paschall (2)19144 Germantown West Central (10), Germantown Westside (9), Mount Airy West (8), Germantown East (5),
Germantown Morton (4), Logan (4), Germantown Penn Knox (3), Wister (3), Mount Airy East (1), PassyunkSquare (1)
19145 Packer Park (163), Point Breeze (43), Newbold (39), West Passyunk (26), Girard Estates (25), Grays Ferry(8), Graduate Hospital (1), Industrial (1)
19146 Graduate Hospital (1422), Point Breeze (762), Fitler Square (143), Rittenhouse (99), Grays Ferry (41)19147 Hawthorne (323), Queen Village (260), Bella Vista (210), Passyunk Square (167), Pennsport (133), Society
Hill (88), Dickinson Narrows (82), Riverfront (73), Washington Square (31), Northern Liberties (1)19148 East Passyunk (82), Pennsport (60), Greenwich (31), Dickinson Narrows (28), Lower Moyamensing (22),
Whitman (20), Stadium District (14), Riverfront (3), Passyunk Square (1)19149 Oxford Circle (5), Mayfair (3), Summerdale (1)19150 Cedarbrook (10), West Oak Lane (9)19151 Overbrook (10), Haddington (2), Carroll Park (1), Wynnefield (1)19152 Pennypack (15), Rhawnhurst (14), Lexington Park (2), Cedarbrook (1)19153 Clearview (7), Eastwick (5), Industrial (4), Airport (2), Penrose (2)19154 Parkwood Manor (7), Mechanicsville (5), Millbrook (5), Crestmont Farms (3), Normandy Village (2),
Northeast Airport (2), Modena (1)Note: Top 8 most profitable neighborhoods are highlighted in green.Source: Neighborhood definitions from Zillow; abatements from OPA data as of 3/31/17.
40

Table A.2. The relationship between council districts and the neighborhoods used in thisanalysis.
Council District Neighborhoods
1 Bella Vista, Callow Hill, Center City, Chinatown, Dickinson NarrowsEast Kensington, East Passyunk, Fishtown, Greenwich, HarrowgateJuniata Park, Lower Moyamensing, Northern Liberties, Old City, Passyunk SquarePennsport, Queen Village, Richmond, Riverfront, Society HillStadium District, Washington Square, Whitman
2 Airport, Bella Vista, Clearview, Eastwick, Fitler SquareGirard Estates, Graduate Hospital, Grays Ferry, Hawthorne, IndustrialNavy Yard, Newbold, Packer Park, Paschall, PenrosePoint Breeze, Rittenhouse, Southwest Schuylkill, Stadium District, West Passyunk
3 Belmont, Carroll Park, Cedar Park, Cobbs Creek, DunlapEast Parkside, Elmwood, Garden Court, Haddington, Haverford NorthIndustrial, Kingesessing, Mantua, Mill Creek, PoweltonSouthwest Schuylkill, Spruce Hill, University City, Walnut Hill, West PoweltonWoodland Terrace
4 Allegheny West, Andorra, Carroll Park, Dearnley Park, East FallsGermany Hill, Haddington, Manayunk, Mount Airy West, OverbrookRoxborough, Roxborough Park, Upper Roxborough, West Parkside, WissahickonWynnefield, Wynnefield Heights
5 Brewerytown, East Poplar, Fairmount, Fishtown, FrancisvilleFranklinville, Hartranft, Logan Square, Ludlow, North CentralNorthern Liberties, Old Kensington, Rittenhouse, Spring Garden, StantonStrawberry Mansion, West Poplar, Yorktown
6 Academy Gardens, Aston Woodbridge, Bridesburg, Frankford, HolmesburgLexington Park, Mayfair, Oxford Circle, Pennypack, Pennypack WoodsRichmond, Tacony, Torresdale, Winchester Park, Wissinoming
7 East Kensington, Fairhill, Feltonville, Fishtown, FrankfordHarrowgate, Hunting Park, Juniata Park, Northwood, Old KensingtonOxford Circle, Upper Kensington, West Kensington
8 Allegheny West, Chestnut Hill, Germantown East, Germantown Morton, Germantown Penn KnoxGermantown West Central, Germantown Westside, Glenwood, Logan, Mount Airy EastMount Airy West, Nicetown, Ogontz, Tioga, Wister
9 Burnholme, Cedarbrook, Crescentville, East Oak Lane, Fern RockLawndale, Logan, Olney, Oxford Circle, SummerdaleWest Oak Lane
10 Bustleton, Byberry, Crestmont Farms, Fox Chase, MechanicsvilleMillbrook, Modena, Morrell Park, Normandy Village, Northeast AirportParkwood Manor, Rhawnhurst, Somerton, West Torresdale
Note: Neighborhood definitions from Zillow.
41
Glossary
abatement A generalized term referring to the tax-exempt portion of assessed propertyvalue for a property owner’s real estate tax, as granted by the city. There are 37different types of property tax exemptions, including exemptions for government-owned buildings and non-profit-owned buildings. This paper focuses on 10-yearproperty tax exemptions associated with new and improved property value defined byordinances 1456-A, 961, 1130.
amortization Paying off an amount over time by making planned, incremental paymentsof principal and interest. In the case of abatements, linear amortization implies aconstant, annual drop in the value of an abatement, until the property tax is ultimatelypaid in full. For example, in a linear amortization of a ten-year tax abatement, aproperty owner would have 100% of the abatement for the first year (paying no taxon the abated value), 90% of the abatement for the second year (paying tax on 10%of the abated value), 80% for the third year (paying tax on 20% of the abated value)and so on, until the tax is annually paid in full, i.e. the abatement is fully amortized.
arm’s-length A sale in which both the buyer and seller are acting independently and intheir own self-interest. In this analysis, we use arm’s-length vacant land sales fromOPA data in order to properly estimate the cost of land acquisition in Philadelphia.
assessed value The monetary value assigned to a property by the Office of PropertyAssessment from which annual real estate taxes are calculated at the rate of 1.4%.Total assessed value is typically broken down into two categories: assessed buildingvalue and assessed land value. For this paper’s analysis, tax abatements represent thetax-exempt portion of a property’s assessed building value.
Council District The geographic section of the city corresponding to a seat on the Philadel-phia City Council, the city’s legislative body. There are 10 different city council districtswith boundaries intersecting neighborhoods and ZIP codes.
42

fringe benefits The additional benefits received by an employee outside of his or her des-ignated salary or wage. These often include health insurance, worker’s compensation,pension contributions, etc.
improvement or conversion A designation for previously-built real estate structures thatundergo rehabilitation, refurbishment, and/or conversion from commercial to residen-tial use. In relation to the property tax abatement, the tax-exempt (i.e. abated) portionof an improved property is equal to the updated, assessed value of the property minusthe value-added by the improvements. Regulations on eligibility of improvements forproperty tax-exemptions are defined by ordinances 961 and 1130.
market value The estimation of a property’s sale price should it be sold in an arms-lengthtransaction. In Philadelphia, market value can differ materially from assessed value.This paper uses market value data provided by Zillow. Market values in this paper arecomputed using home values from the Zillow home value index through [2].
new construction New residential or commercial buildings. In relation to the property taxabatement, most new construction is tax-exempt (i.e., abated) for 10 years defined byordinances 1456-A and 1130.
open-shop A firm or project type that does not require employees to join a labor union.
tax base This is the value upon which a tax liability is based. For example, assessedproperty value is the tax base upon which property taxes are based and taxable incomeis the tax base upon which income tax is based. The aggregate tax base of Philadelphiais the sum of all taxable value - including wages, business income, property value, etc.- subject to different taxes.
tax benefit The reduction in taxes owed received by a taxpayer. In relation to the propertytax abatement, this amount is equal to the tax-exempt assessed value multiplied bythe tax rate. For example, if a new home with tax abatements is assessed at $200,000,then the annual tax benefit at the current tax rate of 1.4% would be $2,800 ($200,000x 1.4% = $2,800). Assuming no appreciation to the assessed value and no changes tothe tax rate, the tax benefit over the life of the homes 10 year tax abatement would be$28,000 ($200,000 x 1.4% x 10 = $28,000).
Glossary 43
Bibliography
[1]Office of Property Assessment. “Which Abatement is Right for Your Property?”URL: https://goo.gl/ejyLfu.
[2]Zillow. “Zillow Home Value Index: Methodology”. URL: https://goo.gl/T6Wqq9.
[3]Federal Reserve Bank of Philadelphia.“Metropolitan Statistical Areas in the Three-State Region”. URL: https://goo.gl/aKDnqr.
[4]Central Philadelphia Development Corporation. “Housing Development in Perspective: 2018”.https://goo.gl/pe88KT. March 1, 2018.
[5]City of Philadelphia. “Real Estate Tax”. URL: https://goo.gl/JsGrLv.
[6]City of Philadelphia. “Summary Schedule of Tax Rates Since 1952”.URL: https://goo.gl/aUwpv2.
[7]Office of Property Assessment. “Data Dictionary”. URL: https://goo.gl/gkWU8w.
[8]Zillow. “Zillow Home Value Index (ZHVI): Median Home Value Per Sq Ft ($)”.URL: https://goo.gl/mYBPFB.
[9]Zillow. “Zillow Neighborhood Boundaries”. URL: https://goo.gl/bnAcwg.
[10]David Neumark and Michael L. Wachter.“Union Effects on Nonunion Wages: Evidence from Panel Data on Industries and Cities”.In: Industrial and Labor Relations Review 49.1 (1995), p. 20.
44

Acknowledgements
The Office of the City Controller would like to acknowledge the invaluable support providedby the City of Philadelphia Office of Property Assessment, individuals, institutions andorganizations, including development industry professionals and the Philadelphia BuildingTrades, for this paper. Without their guidance, advice and data, this analysis would not havebeen possible.
45