an analysis of teacher self-efficacy, teacher trust, …
TRANSCRIPT
AN ANALYSIS OF TEACHER SELF-EFFICACY, TEACHER TRUST,
AND COLLECTIVE EFFICACY IN A SOUTHWEST
TEXAS SCHOOL DISTRICT
A Dissertation
by
JEANETTE BALL
Submitted to the Office of Graduate Studies ofTexas A&M University
in partial fulfillment of the requirements for the degree of
DOCTOR OF PHILOSOPHY
December 2010
Major Subject: Educational Administration
AN ANALYSIS OF TEACHER SELF-EFFICACY, TEACHER TRUST,
AND COLLECTIVE EFFICACY IN A SOUTHWEST
TEXAS SCHOOL DISTRICT
A Dissertation
by
JEANETTE BALL
Submitted to the Office of Graduate Studies ofTexas A&M University
in partial fulfillment of the requirements for the degree of
DOCTOR OF PHILOSOPHY
Approved by:
Chair of Committee, John HoyleCommittee Members, Virginia Collier
Mario TorresGwendolyn Webb-Hasan
Head of Department, Fred Nafukho
December 2010
Major Subject: Educational Administration
iii
ABSTRACT
An Analysis of Teacher Self-Efficacy, Teacher Trust, and Collective Efficacy in a
Southwest Texas School District. (December 2010)
Jeanette Ball, B.A, Schreiner University;
M.A., The University of Texas at San Antonio
Chair of Advisory Committee: Dr. John Hoyle
The purpose of the study was to investigate relationships among teacher self-
efficacy, trust, and collective efficacy among teachers in a southwest Texas school
district. The research included three established surveys combined to create a single
survey. A multivariate analysis of variance was conducted to analyze the data from the
survey.
The study analyzed the results of surveys completed by 746 teachers. The
surveys completed were the Teachers’ Sense of Self-Efficacy Scale, Collective Efficacy
Scale, and Omnibus T-Scale. Factors considered in the analysis of data included gender,
number of years of experience, ethnicity, and the level of mentorship provided. A
multivariate analysis of variance was conducted to assess if differences exist in the
Teachers’ Sense of Self-Efficacy Scale subscales of student engagement, instructional
strategies, classroom management, Omnibus T-Scale subscale of trust in principal, trust
in colleagues, trust in clients, and collective efficacy between schools. The results
suggest that simultaneous differences exist in dependent variables between schools.
iv
However, further analysis also showed all schools with the exception of one scored
higher than 84% of the standardized school sample in trust in students’ ability to
perform. In comparing survey responses across teacher demographics, results showed
gender differences in trust in principal, trust in clients, and collective efficacy. When
comparing the responses to national averages, the results were as follows: self-efficacy
showed patterns that were below average, trust showed patterns that were above average,
and collective efficacy was average.
This research study contributes to the theoretical rationale explaining the
relationship between self-efficacy, collective efficacy, and trust. Further research could
be done in the area for school administrators to improve student achievement through
working to raise collective efficacy beliefs and trust of their faculty.

v
DEDICATION
This dissertation is dedicated to my loving, understanding, and supportive family.
This dream could not have become a reality with their love and encouragement. This
project is for them as much as it is for me.
To my husband, Jose Reyes, for the unending support and encouragement. I
could not have done this without you. You make me want to be a better
person. For all you have done to allow me to pursue my dream, I say, “You
are my everything!”
To my parents, Frank and Mary Ball, for providing the love and support
through my life. I thank both of you for the encouragement and support.
To my sisters, Eliza Diaz, Francine Pina, Julie Ricks, for always being there
as cheerleaders for me! Your support meant so much to me. Love you!
vi
ACKNOWLEDGEMENTS
The completion of this dissertation would not have been possible without the
guidance of many people. I am grateful for the varying levels of support and guidance
from each of them. Thank you for the advice, expertise, and support.
Dr. John Hoyle, my chair, for your expert guidance and encouragement along
the way. I could not have done it without you.
Dr. Virginia Collier, Dr. Mario Torres, and Dr. Gwen Webb-Hasan, for
sharing your time and expertise as members of my committee. Each of you
provided me with guidance and assistance along the way.
Dr. Celani Dominguez, who gave unselfishly of your time and talents to
assist me with my data collection and statistical analysis, you are
undoubtedly one of the brightest ladies I have ever known. Thanks Dr. D!
I truly appreciate the support of many family members and friends for the
encouragement and undoubting faith that this would get done. For many of my friends
who continually asked about my progress along the way, thanks to each of you!
vii
TABLE OF CONTENTS
Page
ABSTRACT ....................................................................................................... iii
DEDICATION ................................................................................................... v
ACKNOWLEDGEMENTS ............................................................................... vi
TABLE OF CONTENTS ................................................................................... vii
LIST OF FIGURES............................................................................................ ix
LIST OF TABLES ............................................................................................. x
CHAPTER
I INTRODUCTION .......................................................................... 1
Background of the Study............................................................ 1Statement of the Problem ........................................................... 8Purpose of the Study .................................................................. 10Research Questions .................................................................... 10Operational Definitions .............................................................. 11Assumptions ............................................................................... 12Limitations ................................................................................. 13Significance of the Study ........................................................... 13Organization of the Dissertation................................................. 15
II REVIEW OF THE LITERATURE ................................................ 16
Teacher Self-Efficacy................................................................. 16Teacher Trust.............................................................................. 26Collective Efficacy..................................................................... 36Conclusion.................................................................................. 44
III METHODOLOGY ......................................................................... 47
Population................................................................................... 49Instrumentation........................................................................... 50Validity and Reliability of Instruments ...................................... 54Procedures .................................................................................. 57Data Analysis ............................................................................. 58
viii
CHAPTER Page
IV RESULTS ....................................................................................... 60
Organization of Data Analysis ................................................... 60Demographic Data...................................................................... 63Internal Consistency of Survey Instrument ................................ 69Research Question 1................................................................... 71Research Question 2................................................................... 76Research Question 3................................................................... 84Summary of Findings ................................................................. 89
V SUMMARY, CONCLUSIONS, ANDRECOMMENDATIONS................................................................ 93
Introduction ................................................................................ 93Summary .................................................................................... 94Conclusions ................................................................................ 108Recommendations ...................................................................... 112
REFERENCES................................................................................................... 115
APPENDIX A .................................................................................................... 139
APPENDIX B .................................................................................................... 142
APPENDIX C .................................................................................................... 144
APPENDIX D .................................................................................................... 146
APPENDIX E..................................................................................................... 148
VITA .................................................................................................................. 151
ix
LIST OF FIGURES
FIGURE Page
2.1 Model of Teacher Self-Efficacy.......................................................... 25
2.2 Conceptualization of Interpersonal Trust in a Professional Context . 35
2.3 Goddard’s Simplified Model of Collective Teacher Efficacy............. 43
x
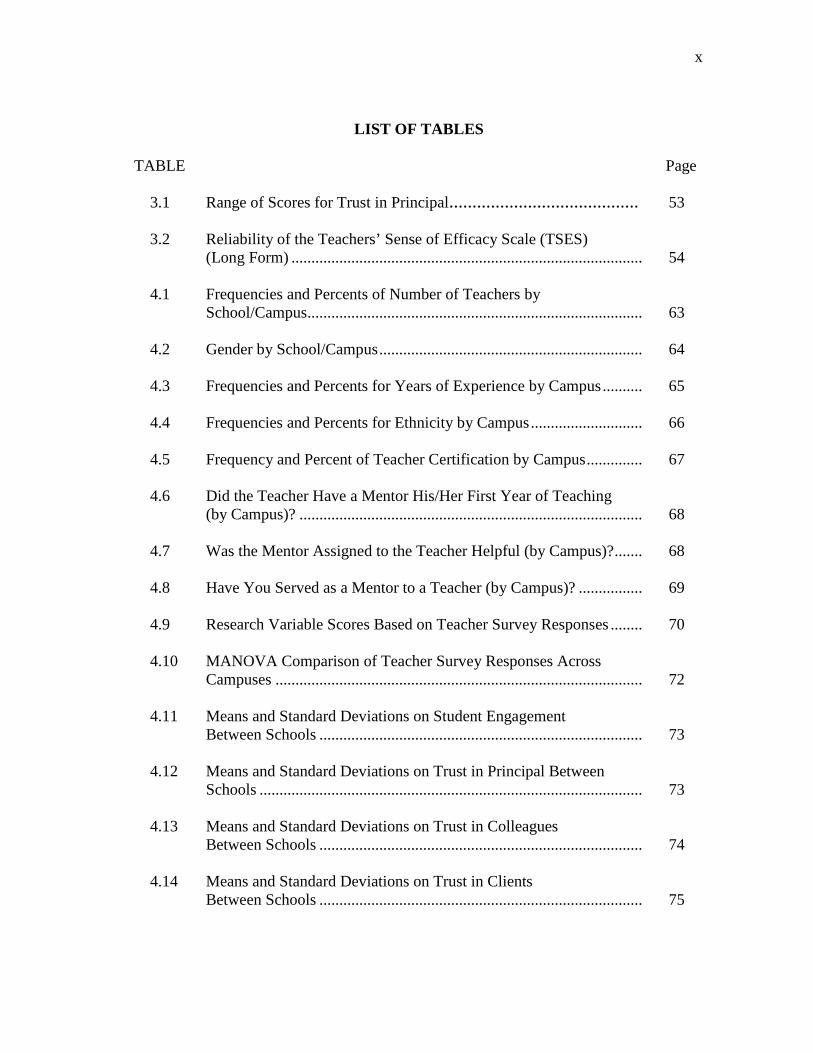
LIST OF TABLES
TABLE Page
3.1 Range of Scores for Trust in Principal......................................... 53
3.2 Reliability of the Teachers’ Sense of Efficacy Scale (TSES)(Long Form) ........................................................................................ 54
4.1 Frequencies and Percents of Number of Teachers bySchool/Campus.................................................................................... 63
4.2 Gender by School/Campus.................................................................. 64
4.3 Frequencies and Percents for Years of Experience by Campus.......... 65
4.4 Frequencies and Percents for Ethnicity by Campus............................ 66
4.5 Frequency and Percent of Teacher Certification by Campus.............. 67
4.6 Did the Teacher Have a Mentor His/Her First Year of Teaching(by Campus)? ...................................................................................... 68
4.7 Was the Mentor Assigned to the Teacher Helpful (by Campus)?....... 68
4.8 Have You Served as a Mentor to a Teacher (by Campus)? ................ 69
4.9 Research Variable Scores Based on Teacher Survey Responses ........ 70
4.10 MANOVA Comparison of Teacher Survey Responses AcrossCampuses ............................................................................................ 72
4.11 Means and Standard Deviations on Student EngagementBetween Schools ................................................................................. 73
4.12 Means and Standard Deviations on Trust in Principal BetweenSchools ................................................................................................ 73
4.13 Means and Standard Deviations on Trust in ColleaguesBetween Schools ................................................................................. 74
4.14 Means and Standard Deviations on Trust in ClientsBetween Schools ................................................................................. 75
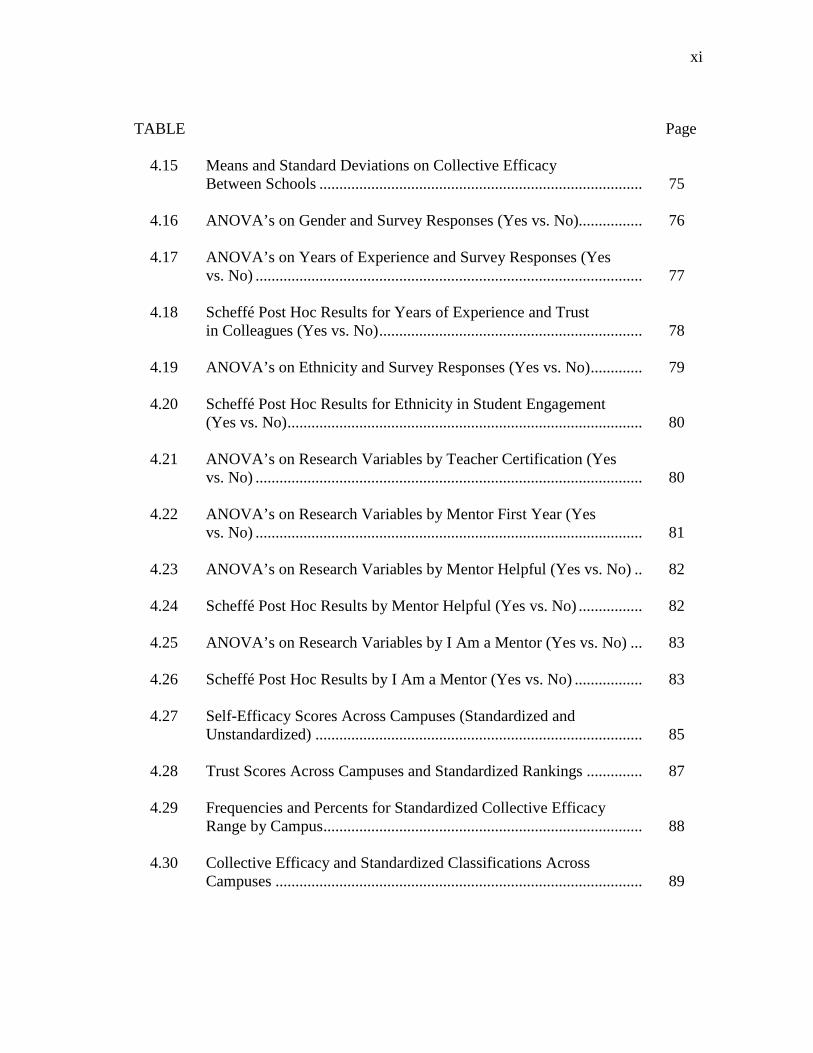
xi
TABLE Page
4.15 Means and Standard Deviations on Collective EfficacyBetween Schools ................................................................................. 75
4.16 ANOVA’s on Gender and Survey Responses (Yes vs. No)................ 76
4.17 ANOVA’s on Years of Experience and Survey Responses (Yesvs. No) ................................................................................................. 77
4.18 Scheffé Post Hoc Results for Years of Experience and Trustin Colleagues (Yes vs. No).................................................................. 78
4.19 ANOVA’s on Ethnicity and Survey Responses (Yes vs. No)............. 79
4.20 Scheffé Post Hoc Results for Ethnicity in Student Engagement(Yes vs. No)......................................................................................... 80
4.21 ANOVA’s on Research Variables by Teacher Certification (Yesvs. No) ................................................................................................. 80
4.22 ANOVA’s on Research Variables by Mentor First Year (Yesvs. No) ................................................................................................. 81
4.23 ANOVA’s on Research Variables by Mentor Helpful (Yes vs. No) .. 82
4.24 Scheffé Post Hoc Results by Mentor Helpful (Yes vs. No) ................ 82
4.25 ANOVA’s on Research Variables by I Am a Mentor (Yes vs. No) ... 83
4.26 Scheffé Post Hoc Results by I Am a Mentor (Yes vs. No) ................. 83
4.27 Self-Efficacy Scores Across Campuses (Standardized andUnstandardized) .................................................................................. 85
4.28 Trust Scores Across Campuses and Standardized Rankings .............. 87
4.29 Frequencies and Percents for Standardized Collective EfficacyRange by Campus................................................................................ 88
4.30 Collective Efficacy and Standardized Classifications AcrossCampuses ............................................................................................ 89
1
CHAPTER I
INTRODUCTION
Background of the Study
There are many challenges facing education today. Fideler and Haselkorn (1999)
indicate the biggest challenge will be the number of teacher vacancies needing to be
filled. It is estimated that over the next ten years, approximately 200,000 new teachers
will need to enter the field to meet the demands of the educational system in the United
States (Fideler & Haselkorn, 1999). Some of the factors that are creating this great need
include: (a) increasing school enrollments, (b) attempts to reduce teacher-to-student
ratios, and (c) an alarmingly high increase in teacher attrition and retirement rates
(Cortez, 2001). Between 1997 and 2009, the enrollment in public schools is projected to
increase by 4% to 48.1 million (Olson, 2000). The average age of a teacher in America
today is 44 years (Olson, 2000). According to Olson, districts are anticipating high rates
of retirement in the near future as a result of this increasingly high average age.
The teacher demand in Texas is particularly alarming. The Texas State Board for
Educator Certification (TSBEC) indicated in 1998 that Texas had a 44,000 teacher
shortage at the start of the school year (Huling, 1998). It is difficult to discuss teacher
recruitment without considering issues of the supply and demand. How many teachers
are needed for the nation’s classrooms and where they will come from are questions that
are closely related. Additionally, the issue of teacher quality is inextricably linked to
recruitment, for in recruiting teachers, we wish to attract individuals who are well-
_______________This dissertation follows the style of The Journal of Educational Research.
2
prepared, effective, and who will remain in the teaching profession long enough to make
a difference.
In the 1980s and 1990s, there was little or no shortage of teachers available to fill
open positions at the national level; in fact, the supply of teachers exceeded demand
(Boe & Gilford, 1991; Rollefson, 1992). Several prominent researchers predicted that in
the 1980s and 1990s, a shortfall in the teaching force would take place. It did not
materialize due to lower than anticipated attrition rates, slower retirement rates, and
other factors. Early in the 1980s, attrition rates for public school teachers were estimated
to be at 8% but were in actuality much lower. For example, the annual teacher attrition
from 1987-1988 to 1988-1989 was 5.6% for the nation (Whitener et al., 1997). In the
1990s, the average age of the teaching force had been gradually increasing, as more
teachers were retiring at a later age. This slower retirement rate had, in addition to other
factors, slowed the demand for new teachers. As a consequence, the National Research
Council predicted that large numbers of teachers would retire during the decade of 2000-
2010 rather than during the 1990s (Boe & Gilford, 1991). This was a deceiving
prediction. Not only should retirement have been a concern, but also teachers leaving the
profession and transferring from their present teaching positions to other educational
institutions. Both are very costly to the institution they leave.
A conservative national estimate of the cost of replacing public school teachers
who have dropped out of the profession is $2.2 billion a year (U.S. Department of
Education, 2002). If, in addition, the cost of replacing public school teachers who
transfer schools is added, this total reaches $4.9 billion every year. For different
3
individual states, various cost estimates range from $8.5 million in North Dakota to an
overwhelming half a billion dollars for a large state like Texas. “Using the most
conservative turnover cost estimation method, Texas is losing approximately $329
million year due to teacher turnover with alternate estimations for the costs reaching as
high as $2.1 billion per year” (Texas State Board for Educator Certification [TSBEC],
2000, p. 22). Specifically, teachers leaving the profession in Texas cost $19,034 per
institution they leave, for a total of $214,509,448 for the cost to the state of Texas. In
addition, teachers transferring to other schools cost institutions $1,426, and
$504,917,385 in total turnover cost in Texas statewide (National Center for Education
Statistics [NCES], 2003). Looking strictly at retirement numbers, masks a deeper seeded
problem.
The total figures on teacher supply and demand masked problems of distribution
and composition in the teaching force and, thus, were highlighted by the disaggregated
data. A good example was the identified shortages of teachers in certain areas, such as
poor, urban, and high minority enrollment schools (Eubanks, 1996; Ingersoll & Bobbitt,
1995) and in subjects such as mathematics and science (Carnegie Forum on Education
and the Economy, 1986; Gilford & Tennenbaum, 1990) and in teaching fields such as
bilingual and special education (Schmidt, 1992).
A more recent example is found in Texas school districts that have been
confronted with critical shortages of math and science teachers as college students
specializing in math and science areas lean toward careers in the higher paying
businesses and private technology sector. Almost a quarter of the math and science
4
classes in Texas middle and high schools are taught by teachers without proper
credentials. In 2006, 14.3% of math teachers, 28% of science teachers, and 52.2% of
computer science teachers have been teaching out-of-field in Texas classrooms (Terry,
2007). Mathematics and science have been designated as subject matter teacher shortage
areas by the Texas Education Agency for the 2006-2007 school years. Accordingly, a
revised target in teacher education success in Closing the Gaps by 2015, the Texas
Higher Education Coordinating Board’s (THECB, 2000) Texas higher education plan, is
to significantly increase the number of math and science teachers certified through all
teacher certification routes by 2015. There were and are today several reasons for these
shortages. The reasons range from higher turnover rates and reluctance of teachers to
take jobs in poor, inner city schools to low numbers of teachers being produced in
specific specialty areas (Adams & Dial, 1993; Ingersoll, 1999; Jones & Sandidge, 1997;
Terry, 2007).
Added to the complex issue of teacher supply and demand is the issue of the
demographic composition of the teaching pool. Previously, it was reported that the great
majority of teachers came from the lower middle class, were female and white, while
their students had become increasingly diverse (Zimpher, 1989). In fact, the U.S.
Department of Commerce (1996) predicted that by the year 2035, students of color in K-
12 classrooms would constitute a numerical majority of all students. Research into how
teachers’ demographic characteristics influence student achievement was inconclusive
(Ehrenberg & Brewer, 1994; Ehrenberg, Goldhaber, & Brewer, 1995). Many supporters
of diversifying the teaching force had presented compelling arguments in favor of
5
increasing the number of male teachers and teachers of color (Clewell & Villegas, 1998).
According to Boe and Gilford (1991), the problem of teacher shortages, viewed from a
different perspective, could be seen in terms of inadequacies in the qualifications and
characteristics of the teaching force rather than in its absolute size in relation to gross
demand. The complexity of the issue becomes greater when considering the issue of
attrition and retention of teachers.
Nieto (2003) has addressed the teacher attrition issue from a very different angle.
Instead of looking at teacher attrition and why teachers leave, she looked at why teachers
stay in their positions. Nieto conducted research with veteran teachers from high schools
in the Boston, Massachusetts, area and identified characteristics that “keep teachers
going” (p. 6). She was able to identify the characteristics such as love, hope and
possibility, anger and desperation, intellectual work, and the belief in the ability to shape
the future and how they influenced the teachers’ decision to stay put. There are other
studies that support the same findings when looking at the intrinsic factors that shape a
teacher’s decision to not only remain in the teaching profession but stay in their present
school setting (Johnson, Berg, & Donaldson, 2005; Waddell, 2007). Teachers’ job
satisfaction is thus derived from their sense of competence and self efficacy.
Ultimately, teachers’ self-efficacy is closely related to teacher job satisfaction
and is directly related to teacher intrinsic needs of competence and knowledge in their
area of expertise (Ryan & Deci, 2000). Indirectly, teachers’ sense of self-efficacy is
conducive to performance as teachers may derive pride and rewards from their job
performance. Previous research has also found that teachers’ sense of efficacy is related
6
to their job satisfaction, with their choice of profession and their competence, as rated by
school superintendents (Trentham, Silvern, & Brogdon, 1985). Moreover, recent
findings have shown that teachers’ self-efficacy beliefs have a vital role in affecting and
sustaining teacher commitment to their school and their job satisfaction (Caprara,
Barbaranelli, Borgogni, Petitta, & Rubinacci, 2003; Caprara, Barbaranelli, Borgogni, &
Steca, 2003). Self-efficacy does not only affect teachers but the entire school
organizational system.
Through a review of the literature, researchers have identified that self-efficacy,
trust, and collective efficacy impact the school organizational system. Bandura (1997)
took the leading role in this research. Bandura’s findings provided evidence that a
teacher’s belief about his or her potential and capability to reach students was
significantly related to the success of the students. Further studies indicated that
organizations that were composed of teachers with high levels of efficacy then created
an organization with collective efficacy, belief in the group’s capability to organize and
execute a course of action required to increase effective productivity (Bandura, 1997).
Deming (1986) theorized that organizations were empowered with effectiveness
when self-efficacy, trust, and collective efficacy were orchestrated within the
organization. Wong and Wong (1991) describe an efficient teacher (effective,
productive, high self-efficacy) as one who exhibits: (a) high expectations for student
achievement, (b) excellent classroom management, and (c) the ability to incorporate
great depth in their lessons to attain student mastery. The three items described above are
7
more easily achieved when the three components (self-efficacy, trust, and collective
efficacy) are in place in the organization.
Rotter (1966) considered teachers’ ability to be in command of their actions and
beliefs was strongly related to students’ achievement and motivation. As a result of
administering a 30-item Likert Scale of Efficacy, Gibson and Dembo (1984) concluded:
(a) a teacher’s perception of efficacy is related to the belief that the teacher encompassed
the skills necessary to achieve student learning, and (b) teachers’ sense of efficacy
influences “certain patterns of classroom behavior known to yield achievement gains”
(pp. 573-574).
Goddard’s (2003) research continues to clarify the progress in analyzing an
explanation for the positive link between efficacy and student achievement. Recent
studies indicate efficacy (teachers sharing a strong collective belief, in the workplace)
becomes a powerful contributor to influencing teacher performance and ultimately
student achievement (Bandura, 1993; Goddard, Hoy, & Woolfolk Hoy, 2000; Goddard
& Goddard, 2001a; Hoy, Sweetland, & Smith, 2002).
Researchers have found teachers have greater job satisfaction when they believe
they can teach and make positive impacts on their students (Hoy & Miskel, 2001). In a
targeted study on school reform, Bryk and Schneider (2002) stated, when trust
permeated through an institution, then the day-to-day function becomes a critical
resource and the system can facilitate significant improvement plans. Thus, the
educational researchers relate a common theme: namely, the importance of trust at all
levels of an organization and have concluded that trust is complex and sometimes a
8
dynamic contribution influencing human relationships and behavior that can shape
collective performance (Adams, 2008).
As indicated in the research, trust is a pivotal construct and needs to be
researched with a greater focus and thoughtful consideration of interactions with other
variables we know are affected by it. We also need to consider the interactions of trust
with various dimensions of educational reform and evaluation. Hoy, Hoy, and Davis
(2009) go on to say that there is a triadic relationship between collective efficacy and
trust and teacher self-efficacy.
Statement of the Problem
Classroom teachers face an overwhelming workload and responsibilities. Teacher
workloads and job responsibilities have been recognized and studied for decades. In
Texas, as well as other states in the U.S., the teacher’s workload includes: (a)
instructional planning, (b) managing student behavior, (c) interacting with other teachers
and administrators professionally, and (d) ensuring that programs produce students who
can pass Texas state-required proficiency tests to graduate. The teacher’s workload has
continued to an increase in both complexity and accountability. There are several
additional stressors teachers encounter on a regular basis such as: (a) meeting with
parents, (b) writing new curriculum, (c) grading and evaluating students, and (d) meeting
administrative paperwork requirements. All of the aforementioned teacher expectations
can produce a great amount of stressful situations for the classroom teacher.
Thus, the workload of teachers can lead to burnout, if they are unable to develop
their sense of self-efficacy through consistent professional growth and development.

9
Burnout is described as a three-fold syndrome that includes (a) feelings of emotional
exhaustion, (b) depersonalization, and (c) lack of personal accomplishment in response
to chronic stress in job situations where individuals work with people (Kokkinos, as
cited in Maslach, Jackson, & Leiter, 1996). According to Yong and Yue (2007),
teachers’ stress and burnout affect the schools’ overall climate, promote lower morale,
inhibit the achievement of educational objectives, and promote flight from the teachers’
workplace. Both the individual and the school organization are affected by stress and
burnout. The ultimate conflict between the teachers’ expectations and the actual teacher
workplace reality is the main contributor to teacher stress and burnout (Yong & Yue,
2007). The effect of long-term stress and anxiety lead to depletion of teachers’
enthusiasm, lowers their physical fitness, affects their mental health, and results in work
burnout (Schaufeli, Maslach, & Markek, as cited in Yong & Yue, 2007).
As a result, measurement of teacher self-efficacy, trust, and collective efficacy
(academic optimism) is necessary in order for administrators to identify and gauge job
satisfaction and teachers’ perceptions of their ability to reach and teach students and
increase their academic achievement. A bi-product may be the reflection of the campus
leadership and the resulting collective efficacy at campuses in the district where this
study takes place. As Hoyle (2007) said, in his study of district leadership, describing
two district administrators who were subjects of his study: “However, the key was in
their individual leadership styles and how to observe, reflect, and act on the interpersonal
politics with staff, school board, and community” (p. 160). Thus, the leader’s self-
efficacy may also play a role in teacher’s self-efficacy by association.
10
Purpose of the Study
The purpose of this study was to examine the variables attributed to teacher self-
efficacy, trust, and teacher collective efficacy. This study was a one-case study, with
implications for one urban fringe school district in San Antonio, Texas. Case studies
make sense in development where the intention is about understanding a specific
situation in order to make or adjust policy or practice. In this particular case, the purpose
was to research teacher efficacy, trust, and collective efficacy as it applied to the district
and individual campuses in order to inform practice for adopting/implementing
mentoring programming and development/retention of novice or experienced teachers in
this particular urban fringe school district in the San Antonio, Texas area.
Research Questions
The following questions were addressed in the study:
1. What are the scores for each campus on the following surveys: Teachers’
Sense of Efficacy Scale (TSES), Collective Efficacy Scale (CE-Scale), and
Omnibus T-Scale (OTS), and are there any differences among campus
scores?
2. What are the demographic differences of teachers’ sense of self-efficacy,
collective efficacy, and trust beliefs?
3. Do teachers’ self-efficacy, collective efficacy, and trust beliefs remain
constant for every campus?
11
Operational Definitions
Collective Efficacy: The general belief about the power of teaching to reach difficult
children (Hoy, 2000).
Teacher Retention: A teacher who is a teacher of record in the fall of year one and is still
employed as a teacher of record in the fall three years later (this term is used in
the teacher demographics as to how many years the teacher has been teaching in
the district – if there are a high percentage of teachers who do not stay in the
district for at least one to three years, the retention rate could be high).
Teacher Self-Efficacy: Teachers’ confidence in their ability to promote students’ learning
(Hoy, 2000).
Teacher Trust: A school-wide commitment to a shared vision, an effective process for
making collaborative decisions (Geist & Hoy, 2004; Goddard, Tschannen-
Moran, & Hoy, 2001a; Hoy, 2002; Hoy & Miskel, 2008; Hoy & Tschannen-
Moran, 1999; Tschannen-Moran & Hoy, 2000).
Teachers’ Sense of Efficacy Scale (TSES): Scale to measure teachers’ sense of self-
efficacy (their confidence in their ability to promote student learning)
(Tschannen-Moran & Woolfolk Hoy, 2001).
Omnibus T-Scale: Short operational measure of the three dimensions of trust (Hoy &
Tschannen-Moran, 2003).
Collective Efficacy Scale (CE-Scale): Shared perceptions of teachers in a school that the
efforts of the faculty as a whole will have positive effects on students (Goddard,
Hoy, & Woolfolk Hoy, 2000; Goddard, Tschannen-Moran, & Hoy, 2001a).

12
Assumptions
1. All three survey instruments were administered to the 714 identified teachers
(both novice and veteran) at each of the 13 campuses (9 elementary schools,
3 middle schools, and 1 high school) in an urban fringe district of San
Antonio, Texas. It was assumed most teachers would participate in the
survey.
2. It was assumed the response to the survey by teachers was a reflection of: (a)
Teachers’ Sense of Efficacy Scale (TSES), which measures efficacy in
student engagement, instructional practices, and classroom management; (b)
Omnibus T-Scale (OTS), which measures teacher trust; and (c) Collective
Efficacy Scale (CE-Scale), which measures collective efficacy.
3. It was assumed the methodology proposed and detailed in the instrumentation
and design followed a logical probe into: TSES (teacher self-efficacy);
Omnibus T-Scale (teacher trust); CE-Scale (teacher collective efficacy).
4. It was assumed the results of the survey would inform administration at the
campus and district level as to the levels of teacher self-efficacy, teacher
trust, and teacher collective efficacy at each campus.
5. It was assumed the results from the survey analysis would inform
administration at the campus and district level as to the needs for professional
development of experienced and novice teachers’ instructional skills and
possible professional development for a more positive campus environment,
13
thus leading to better instruction by teachers, greater collective campus
confidence, and improved student academic outcomes.
6. It was assumed the data from the study will be used for future longitudinal
studies of the same Fall 2009 teacher cohorts to measure improvement over
time.
Limitations
1. The study was limited to the information acquired and attained from the
literature review, teacher demographics, and teacher surveys.
2. The findings were generalized and specific to one school district and one
cohort group of teachers (Spring 2010) in an urban fringe school district in
San Antonio, Texas (13 campuses; 9 elementary schools; 3 middle schools,
and 1 high school).
Significance of the Study
This study contributes to the research foundation of: (a) teacher self-efficacy
(Hoy & Woolfolk, 1993); (b) teacher/faculty trust (Hoy & Woolfolk); and (c) collective
self-efficacy (Bandura, 1997). This study contributes to the research foundation through
incorporating the following: to determine the relationships among teacher self-efficacy,
collective efficacy, and faculty trust scale items (dependent variables), with the
independent variables (teacher demographics and other teacher characteristics). Thus,
the significance of demographics compared to academic setting (campus) and the
dependent variables included the three surveys was determined.
14
The significance of the study is embodied in the new measurement of the
significant difference (if they were found) on demographics (independent variables) and
survey variables (dependent variables). Thus, the structure of the analysis is a new
analytical view of the relationship of demographics and survey variables and leads to a
different structure of analysis. Descriptive and general linear models were utilized to
analyze quantitative data from surveys of: (a) teacher self-efficacy, (b) collective
efficacy, and (c) faculty trust. Teachers from 13 campuses in an urban fringe district in
San Antonio, Texas participated in the survey. This study provided an opportunity to
describe how the constructs of teacher self-efficacy, collective efficacy, and faculty trust
can be correlated to teacher demographics and how they are also possibly linked to
student achievement, in particular school settings in an urban fringe school district, in
San Antonio, Texas. This study revealed possible correlates but was not causal in nature.
As a result, a possible new model for evaluating professional development needs
of teachers at campuses in this particular urban fringe school district in San Antonio,
Texas, was generated. In so doing, the study will help to inform district and campus
administrators on how to better serve campuses with particular needs identified in the
areas of teacher self-efficacy, collective efficacy, and teacher/faculty trust. Although
these surveys have been administered individually before, this study was unique in
incorporating all three surveys. This study, therefore, investigated the possible
correlations there are with teacher self-efficacy, trust, and collective efficacy variables
and teacher demographics by campus in an urban fringe school district in San Antonio,
Texas.
15
Organization of the Dissertation
This dissertation is divided into five major chapters. Chapter I contains an
introduction, statement of the problem, purpose of the study, operational definitions,
assumptions and limitations, and the significance of the study. A review of the literature
is found in Chapter II. In Chapter III, the research methodology employed is described,
including: the population, instrumentation, procedures, and data analysis. Chapter IV
contains the analysis and comparisons of the data collected in the study. Finally, in
Chapter V, the researcher provides a summary of the findings of the study and
conclusions and implications from those findings. Recommendations are made for future
practices to address identified deficient practices and to strengthen positive practices
already in place. Recommendations for future research are addressed in this chapter as
well.
16
CHAPTER II
REVIEW OF THE LITERATURE
Chapter II is a critical analysis and review of literature that supports the study of
the impact of teachers’ self-efficacy, teacher trust, and collective efficacy. Researchers
have found teachers have greater job satisfaction when they believe they can teach and
make positive impacts on their students (Hoy & Miskel, 2001). Thus, teachers’ sense of
self-efficacy, trust, and collective efficacy have a profound effect on their job
satisfaction and success of their students. The research literature, in this chapter, is
organized in the following categories: (a) teacher self-efficacy, (b) teacher trust, and (c)
collective efficacy. The literature reviewed provides a conceptual framework that will
provide an explanation of how the categories contribute to the success of teachers in
their complex working classrooms.
Teacher Self-Efficacy
Teacher self-efficacy is: “teachers’ confidence in the ability to promote students’
learning” (Hoy, 2000). Teacher self-efficacy is an integral part of the success that a
teacher will have in the areas of instructional, classroom management and efficacy for
student engagement. There is a developed belief in the association between teacher self-
efficacy and high student achievement and the implementation of positive instructional
techniques. Bandura (1997) proposed that because self-efficacy beliefs were clearly
guided by a teacher’s own inner nature and directed toward perceived abilities given
specific tasks, they were powerful predictors of behavior. There are a number of factors
that many would say contribute to the effectiveness of a teacher such as: (a) planning,
17
(b) organization, (c) content knowledge, and (d) previous experience. But none of these
factors impact student success as much as teacher self-efficacy. The evidence supports
the ideas that teachers who leave teaching have lower teacher self-efficacy scores than
those who remain in teaching (Burley, Hall, Villeme, & Brockmeier, 1991; Glickman &
Tamashiro, 1982). Gregoire (2003) suggests that even when teachers understand that a
given method may be more effective, their efficacy beliefs for enacting the new method
will drive their implementation decisions.
An individual’s belief in oneself to make a difference increases the chances of
actually turning the belief into action. What we come to believe about our product is
what we will produce. In the eyes of teachers, how much they believe that they will
make a positive difference will be evident in the success of their students. If teachers are
to have high-achieving students, then it is necessary for teachers to have high achieving
goals for themselves. The journey to teach students must begin first with the teacher’s
journey in believing that he or she can fulfill the obligation (teacher self-efficacy).
Students of efficacious teachers generally have outperformed students in other classes.
Teacher efficacy was predictive of achievement on the Iowa Test of Basic Skills (Moore
& Esselman, 1992), The Canadian Achievement Tests (Anderson, Green, & Loewen,
1988), and the Ontario Assessment Instrument Pool (Ross, 1992). Regarding teacher
behavior, efficacious teachers persist with struggling students and criticize less after
incorrect student answers (Gibson & Dembo, 1984). When you have teachers with a
high sense of teacher self-efficacy, it will be evident in their motivation and desire to
work with students; they may struggle through the difficulties that are inevitable, but
18
they continue to facilitate learning and move forward even with the most difficult and
unmotivated learner. Bandura (1986) noted, “self development of efficacy requires
mastering knowledge and skills attainable only though long hours of arduous work. This
often necessitates the sacrifice of many immediate gratifications” (p. 448). Therefore, it
would stand to reason novice and experienced teachers’ self-efficacy beliefs would be
correlated with their motivation and goals and belief in their ability to reach and teach
students.
In his review of research, Jerald (2007) highlights some teachers’ behaviors
found to be related to a teacher’s sense of efficacy. Teachers with a stronger sense of
efficacy:
Teach to exhibit greater levels of planning and organization; are more open tonew ideas and are more willing to experiment with new methods to better meetthe needs of their students; are more persistent and resilient when things do notgo smoothly; are less critical of students when they make errors and are lessinclined to refer a difficult student to special education. (p. 33)
A teacher who exhibits these behaviors according to Jerald (2007), is going to positively
impact student learning. When a teacher has high-achieving goals for him or herself,
those goals are transmitted to the student.
However, it is not the expectation of a teacher with higher self-efficacy to have
his or her students reach these milestones on their own, but rather through the impact of
the teacher’s behavior to include effective lesson planning, classroom management, and
instructional methodologies. Teachers who set high goals, who persist, who try another
strategy when one approach is found wanting – in other words, teachers who have a high
sense of efficacy and act on it – are more likely to have students who learn
19
(Shaughnessy, 2004). Through teacher self-efficacy, teachers have a sense that they have
control of the situation. They are responsible for making a difference in the lives of the
children they teach.
The study of teacher efficacy is also evidenced through the Rand researchers’
evaluation of whether teachers believe they could control the reinforcement of their
actions (Armor et al., 1976). In this 1976 Rand Corporation study, it was acknowledged
that teachers who agreed with the statement, “If I try really hard, I can get through to
even the most difficult or unmotivated students” (Armor et al., 1976, p. 23) indicated
confidence in their abilities as teachers to overcome factors that could make learning
difficult for a student. Many researchers have connected this facet of efficacy to
teachers’ past personal experiences either with their own personal success or previous
success with students. So, it is critical that as we analyze the effect of teacher self-
efficacy, that we take into account the development of self-efficacy in a teacher, because
research will show that just as self-efficacy can contribute to a high level of student
achievement, lack of or lower self-efficacy will have the adverse effect.
An important finding from earlier studies indicated that teachers at risk for
burnout viewed their work as unimportant and was the polar opposite of what they had
hoped and planned for in their early careers (Bullough & Baughman, 1997). Matheny,
Gfroerer, and Harris (2000) noted that earlier research into the phenomenon described
burnout as a loss of idealism and enthusiasm for work. Freudenberger (1974), a
psychiatrist, is largely credited with first using the term. Maslach and Jackson refined the
meaning and measurement of the burnout construct in the 1980s (Maslach & Jackson,
20
1981; Maslach & Schaufeli, 1993) to include three sub-domains: (a) depersonalization,
in which one distances oneself from others and views others impersonally; (b) reduced
personal accomplishment, in which one devalues one’s work with others; and (c)
emotional exhaustion, in which one feels emptied of personal emotional resources and
becomes highly vulnerable to stressors. In particular, depersonalization may be
expressed through poor attitudes toward students and the work environment. Thus, low
teacher self-efficacy can have devastating results over time for both students and the
teachers themselves.
In a review written by Burley et al. (1991), the researchers noted that few studies
had been conducted on the development of self-efficacy with novice teachers. However,
new teachers who were confident and were developing that sense of self-efficacy had a
greater satisfaction in teaching attributed to their confidence from the support they
received during their first year. Efficacious beginning teachers indicated greater
optimism that they would remain in the field of teaching (Burley et al., 1991; Hall,
Burley, Villeme, & Brockmeier, 1992). It is imperative that when addressing the needs
of novice teachers, time be spent on ensuring the teacher’s experience is positive. A
teacher’s sense of self-efficacy is not easy to turn around. Once a teacher’s self-efficacy
has been established, and a teacher’s belief system has been set, they become resistant to
change. Changes in efficacy beliefs are more difficult to produce and sustain. In a study
conducted by Ross in 1994, it was concluded that even when teachers are exposed to
workshops and new teaching methods, the experienced teachers’ efficacy beliefs are
stable.
21
Therefore, it is not surprising, the greater teacher effort, student motivation,
higher levels of student success and teacher confidence and retention, the greater the
teacher’s self-efficacy. Student success is affected in a positive manner when strong and
stable teacher self-efficacy is evident. Researchers have found teachers have greater job
satisfaction when they believe they can teach and make positive impacts on their
students (Hoy & Miskel, 2001). It would then make sense, the greater the sense of self-
efficacy, the more teachers can maintain motivation and commitment to self-regulation
and the stronger their academic performance will be. Although simple in concept,
teacher self-efficacy is formed by many different constructs.
The educational workplace that a teacher faces on a daily basis can be one filled
with challenges and difficulties. Teachers must deal with a multitude of complex issues.
They must come face-to-face with the task of meeting the needs of their students. This
task can be overwhelming; however, self-efficacy can make this daunting task
manageable and attainable. Pajares (2002) in his research, “Overview of Social
Cognitive Theory and of Self-efficacy” states:
Teachers have the challenge of improving the academic learning and confidenceof the students in their charge. Using the social cognitive theory as a framework,teachers can work to improve their students’ emotional states and to correct theirfaulty self-beliefs and habits of thinking, improve their academic skills and selfregulatory practices behaviors, and alter the school and classroom structures thatmay work to undermine student success. (p. 2)
Again, teacher self-efficacy, the belief a teacher can make a difference, is vital
for student success in the classroom. Teachers must have a strong judgment of their
capabilities and their ability to plan, implement, motivate, and execute student
achievement. Self-efficacy beliefs provide the foundation for human motivation, well-
22
being, and personal accomplishments (Pajares, 1996). Teachers must feel motivated to
rise to the challenge of teaching. Prince (1988) suggested that stress results when the
demands of a situation are perceived to be greater than one’s capabilities to meet those
demands. Confidence is the key. But how can we go about building this confidence so
that teachers are not ill equipped to ensure positive academic outcomes and so they will
be prepared to teach effectively?
Research proves that building self-efficacy can be done through personal and
professional development for teaching staffs as well as effective mentoring programs for
novice teachers. In this regard, Tschannen-Moran and Woolfolk Hoy (2001) observed,
“teachers sense of efficacy is an idea that neither researchers not practitioners can afford
to ignore “ (p. 803). Beginning teachers appreciate an induction program that provides
support and guidance in their critical first year and sometime through first three years of
their teaching career. It is during these four years that the positive self-efficacy teachers
begin with will be engrained or that a teacher with lack of self-efficacy can develop it. In
article entitled, “Speaking Up and Speaking Freely: Beginning Teachers’ Critical
Perceptions of Their Professional Induction,” Cherubini (2007) wrote:
Beginning teachers reported that their confidence emanated from what oneindividual called “reflections on teaching and dealing with the big picture ofschooling outside the classroom wall.” Although statements describing thechallenges associated with teaching were not rare, they were consistentlycouched in rhetoric that suggested teachers’ proficiencies to mediate theexperiences described as “confidence in both our professional and personal life.”Participation in this program has affirmed that I am confident in what I do andnow I feel like this profession is actually manageable and enjoyable. (p. 6)
A program such as the one described above is an example of developing and heightening
teacher self-efficacy in order to be able to make a profound difference in the lives of
23
children on a daily basis. The idea that teachers’ self-beliefs are determinants of teaching
behavior is a simple, yet powerful idea (Henson, 2001b).
With confidence it can be stated that teacher self-efficacy plays a role not only in
student success but teacher success as well; and if there is a correlation with teacher self-
efficacy and student success, then it also impacts teacher retention. Teachers who feel
confident and sure of themselves as described in Cherubini’s study are more likely to
want to continue in the profession if they feel it is “manageable and enjoyable.” Districts
and campus leaders who establish and promote the teacher induction programs will
ensure that teachers feel confident and comfortable, and therefore, teachers will instill
this feeling in their students thus creating a positive, successful learning environment
with a teacher who will lead her current and future students into the best possible
tomorrow.
Hoy (2000) presented other factors that influence a teacher’s sense of efficacy.
First, vicarious experiences play a role. For example, a teacher might observe another
teacher using a particularly effective practice and thus feel more confident that, through
its use, they could be more successful in reaching their students. Secondly, social
persuasion plays a role. In a school setting, this could take the form of either pep talks or
feedback that highlights effective teaching behaviors, while providing constructive and
specific suggestions for ways to improve. However, such “persuasion” is likely to lose
its positive impact if subsequent teachers’ experiences are not positive.
Thus, the power of self-efficacy is evident. According to Hoy, Hoy, and Davis
(2009), “greater efficacy leads to greater effort and persistence, which leads to better
24
performance, which, in turn leads to greater efficacy” (p. 629). According to Bandura
(1997), people’s level of motivation is based on what they believe than on what is
objectively true. Consequently, it is imperative schools and school districts understand
the importance of developing teacher self-efficacy.
When districts and leaders act on the research of self-efficacy, they are making a
commitment to assist in the development of confidence and inspiring teachers to remain
in the profession. Given the current and potential educational value of the teacher
efficacy construct, efforts to impact changes in teacher efficacy would be valuable in
moving teacher efficacy research beyond the realm of correlational designs (Henson,
2001b). The opportunity for teachers to critically examine themselves, reflect on their
beliefs and receive feedback concerning their effectiveness will assist in solidifying self-
efficacy that will promote learning and retention. But, research shows that these
opportunities must be conducted early on in their careers because as a teacher moves
through his or her career, the teachers’ efficacy beliefs set in and are more challenging to
redesign. Henson (2001b) states, “positively impacting teachers’ efficacy beliefs is
unlikely outside of longer term professional development that compels teachers to think
critically about their classrooms and behave actively in instructional improvement” (p.
8). The development of teacher self-efficacy is significant; there are a number of factors
that contribute to teacher self-efficacy and there are a number of components that self-
efficacy influences. The multidimensional model of teacher efficacy from “Teacher
Efficacy: Its Meaning and Measures” by Tschannen-Moran, Woolfolk Hoy, and Hoy
25
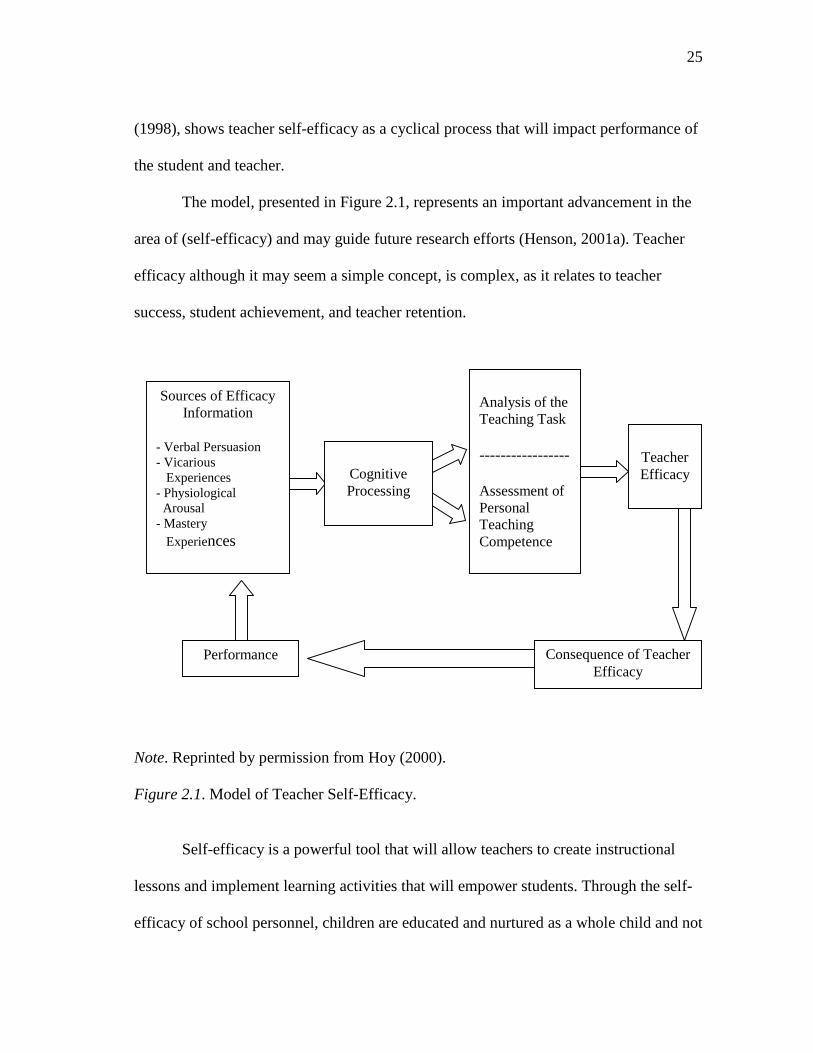
(1998), shows teacher self-efficacy as a cyclical process that will impact performance of
the student and teacher.
The model, presented in Figure 2.1, represents an important advancement in the
area of (self-efficacy) and may guide future research efforts (Henson, 2001a). Teacher
efficacy although it may seem a simple concept, is complex, as it relates to teacher
success, student achievement, and teacher retention.
Note. Reprinted by permission from Hoy (2000).
Figure 2.1. Model of Teacher Self-Efficacy.
Self-efficacy is a powerful tool that will allow teachers to create instructional
lessons and implement learning activities that will empower students. Through the self-
efficacy of school personnel, children are educated and nurtured as a whole child and not
Consequence of TeacherEfficacy
TeacherEfficacyCognitive
Processing
Sources of EfficacyInformation
- Verbal Persuasion- Vicarious
Experiences- Physiological
Arousal- Mastery
Experiences
Analysis of theTeaching Task
-----------------
Assessment ofPersonalTeachingCompetence
Performance
26
just intellect. Schools can assist students in knowledge and skills, but also with the
developing their inner strength. Losee (2000) summarized:
The value of Self-efficacy Theory is realized from the guidelines that people caninfluence their own lives and enhance human efficacy. She states that self-efficacy can be learned and it should be facilitated by the school leaders. Theingredients for self-efficacy that school leaders must develop fall into threecategories of skills: Focus, Flow and Follow-through. These three skills enableaikido masters to blend with the energies within and around them. School leadersmust be ready for transformation and change. In the quickly changing worldaround us, it is imperative we not only develop and teach skills but that our focusis on self-efficacy for all people within the school organization, leaders, staff andstudents. Self-efficacy can be the catalyst to an explosion of empowerment andbe the tool to create more than mere students, teachers or leaders but greatness.(p. 6)
As conceptualized by Bandura (1997), self-efficacy is a bridge between cognition
and behavior that correlates to the amount of energy and effort that will be expended
toward the completion of a task with a particular outcome. Research in psychology
suggests that high self-efficacy beliefs enhance motivation (Bandura & Cervone, 1983),
encourage superior goal-setting behaviors, increase dedication and persistence, and
refine the commitment to goal accomplishment (Locke & Latham, 1990). With self-
efficacy evident in leaders, teachers, and students, the overall effectiveness of the school
will rise to the top.
Teacher Trust
In the book, The Trust Factor, Deming (as cited in Whitney, 1993) stated, “trust
is mandatory for optimization of a system. Without trust, there cannot be cooperation
between people, teams, departments, or divisions” (p. viii). A review of the literature
suggests that the word trust can have a multitude of implications; however, in the
schema of teacher trust, it is being identified as a teacher who trusts in herself, in the
27
students, and in those that surround her complex world. It is a feeling that must be
evident if high-achieving student goals are to be attained. Philosopher Trudy Govier
(1998) says that “trust is an attitude based on beliefs and values and typically involving
feelings and implying behavior” (p. 18). The school system is a multifaceted
organization; and as it is with any organization, there must be a sense of working
together toward a common goal. As Covey (1992) states, if there is little or no trust,
there is no opportunity to build permanent success. Covey (1989) also argues that “trust
is the highest form of human motivation. It brings out the best in people but takes time
and patience to develop” (p. 178). Trust within the organization is the pillar of the
success of the organization. Trust is embedded in relationships throughout the school
organization.
Lewicki and Bunker (1996) express that the central component to a relationship
is trust. They refer to trust as “the glue that holds most cooperative relationships” (p.
129). Theorists have not always looked at trust as an element that would have an effect
on an organization; but in the 1990s, that all began to change. Trust became an essential
concept in the realm and language of school communities. Levin (1999) explained that
“the confidence felt by employees represents the affective element of trust and belief in
what management says represents the cognitive element of trust” (p. 42).
As evident in the study done by Bryk and Schneider (2002), trust does have a
direct correlation with student achievement. In Chicago, more than 400 elementary
schools were studied. It was found that a school with a low score in the area of trust had
only a 1 in 7 chance of demonstrating improved academic productivity, in contrast to a

28
school with high levels of trust where student achievements levels were significantly
higher and showed steady improvement. The improving schools were the schools where
a strong sense of trust was demonstrated. In these schools, increases in reading and math
scores varied from 8% to 20% in a five-year period. However, when trust was lacking,
there was little evidence that math or reading scores improved. Thus, all members of the
organization must play a vital role in the upkeep of the system; it is crucial that they feel
important. Research shows trust in the workplace will lead to efforts from the teachers
and all others involved in the organization to act in accordance to the commitment of the
vision.
The obligation to foster that feeling of importance and trust falls on the
workplace, in this case the learning environment of schools. A collaborative effort to
profess trust as a basic tenet of their organization must be embedded. In their extensive
study of school reform, Bryk and Schneider (2002) conclude that school leaders need a
strong base of trust in order to accomplish many of the day-to-day functions but
especially to successfully complete improvement plans. Trust and its associated terms
(believe in; have confidence in; have faith in; set store by, etc.), have often been used by
researchers in the field of educational leadership as something necessary and vital. There
are a number of contributing factors that can be attributed to the success of a teacher,
school, or district, but one that cannot be overlooked is teacher trust.
Teacher trust is a school-wide commitment to a shared vision, an effective
process for making collaborative decisions and solving problems and school leadership
that consistently supports teachers (Geist & Hoy, 2004; Goddard, Tschannen-Moran, &

29
Hoy, 2001b; Hoy, 2002; Hoy & Miskel, 2008; Hoy & Tschannen-Moran, 1999;
Tschannen-Moran & Hoy, 2000). When there is teacher trust, there is a confidence and
willingness toward the organization and a belief in the organization that “the latter party
is benevolent, reliable, competent, honest and open” (Hoy & Miskel, 2008, p. 18).
Studies have shown that trust can transform a mediocre school organization into
a high achieving successful institute. But how can trust be established? The Center for
Teaching Quality published an article entitled, “Creating an Atmosphere of Trust –
Lessons from an Exemplary School,” and listed factors and practices that can be evident
in a school system. From the working condition’s data, we know that factors most
strongly associated with trust include:
1. a school-wide commitment to a shared vision
2. an effective process for making collaborative decisions and solving problems;
and
3. school leadership that consistently supports teachers (Reeves, Emerick, &
Hirsch, 2007).
High-achieving schools realize the contributions that are made when teachers and
administrators collaborate to develop trust in a school environment.
Difficulty lies in the establishment of trust and mutual respect because it is not an
overnight process but rather a lifelong commitment. Administrators must adhere to
fostering trust by having open lines of communication, being visible and encouraging
teachers to play active roles in the decision-making process. The members of a school in
essence should be the members of a team who are working toward implementing
30
activities to foster their communicated vision. It must go beyond words and into action.
There is no right or wrong way to lead; many different types of leadership styles have
been successful, but there are common characteristics. According to Reeves et al.
(2007), these commonalities include: (a) consistently support teachers, (b) school level
decision-making based on a shared vision, and (c) an effective group decision-making
and problem-solving process. It is everyday actions and continuous communication that
are the key ingredients to encouraging trust and dedication to a common vision. The
vision should be assessed, communicated, and reflected on so that it is not just menial
words but the actions that a school is taking to promote trust between administrator,
teacher, parent, and student. It is integral that a correlation exist between that shared
vision and the day-to-day tasks of the school. While most schools articulate a vision
related to doing what is best for students to succeed in life, schools with high levels of
trust and mutual respect can also point to examples of how that mission influences the
way policies are developed, decisions are made, and teachers are engaged (Reeves et al.,
2007).
According to Noonan, Walker, and Kutsyuruba (2008) in “Trust in the
Contemporary Principalship,” trust is a complex, dynamic, and multidimensional
phenomenon that is related to a number of crucial variables concerning effectiveness of
school organizations, human relationships, and behavior. The complexity that surrounds
trust is its correlations to human behavior. Having trust within an organization is the
ideal situation; however, if that trust is broken, then added negative stressors will
become a part of the system. School leaders must take deliberate actions to make certain

31
that relationships are being built and that communication is open and effective. When it
comes to decision making, there must be a transparency so that all is seen as equitable
and in the best interest of the students. Teachers who feel trusted will go above and
beyond to meet the needs of the students in their organization oftentimes for fear of
breaking that trust but more so because of the interpersonal relationship that has
developed within the school system. Teachers have an urgency to promote the vision: to
do their part in making the vision a reality. In one of the more recent studies, Gimbel
(2003) found that for principals, an underlying dimension of the meaning of trust was in
one-to-one relationships they were sustaining with their teaching staffs. Gimbel (2003)
indicated that “interpersonal trust involved the principals demonstrating reliability,
consistency and follow-through” (p. 45). The two elements that are the foundation for
trust would be classified as information sharing and open communication. The
foundation fosters integrity promoting hard work and dedication to the common vision
of the school organization. With the number of challenging issues that school systems
face, state and federal accountability systems, teacher recruitment and retention, and so
many others, the most pressing issue is that trust has been developed. Trust is then
maintained through many complex situations that arise on a daily basis. Noonan et al.
(2008) concludes:
Trust is an important element in the leadership in a contemporary school.Successful principals seem to be able to understand that trust in theory andpractice is a necessary component of successful school leadership. Principalsseeking to be leaders of successful schools would benefit from understanding therole of trust in successful leadership. (p. 13)

32
Bryk and Schneider (2002) conducted a research study that included periodic
survey reports that would establish a relationship between trust level in a school and
student learning. The researchers found trust fosters a set of conditions that make it more
conducive for individuals to learn. Some of these conditions impacted by trust in the
school system are the organizational conditions, structural conditions, and social
psychological conditions.
According to the research findings by Bryk and Schneider (2002), trust affects
productivity improvements in four broad ways: (a) trust among educators lowers their
sense of vulnerability as they engage in new tasks associated with reform; (b) trust
facilitates public problem solving within an organization; (c) trust undergirds the highly
efficient system of social control found in school-based professional community; and (d)
trust sustains an ethical imperative to advance the best interests of children and, thus,
constitutes a moral resource for school improvement (Brewster & Railsback, 2003).
Teachers who trust and feel trusted understand their roles in the school community and
feel obligation to meet the demands of the job.
Trust between teachers or teacher-to-administrator does not happen by accident.
Developing trust is not a simple matter. There are challenges to overcome, and there are
always differences of opinion regarding the critical elements in a school system, whether
it be curriculum, teaching practices or school policies. A high-achieving school will have
teachers and administrators who will work together in developing and maintaining
trusting relationships. Brewster and Railsback (2003) suggest that the greatest obstacle
to overcome, however, is their past. If an issue in the past caused mistrust, it can be
33
overcome, especially if there is a sincere commitment to work past previous issues and
take a step forward to address them. Building trust is a daunting task.
How can a school organization build trust? The campus administration must take
the leading role. Bennis (1997) called for a “new kind of leader…with the ability to
generate and sustain trust if organizations are to thrive in the 21st century” (p. 35).
Research by Brewster has identified some general suggestions: (a) demonstrate personal
integrity, (b) show that you care, (c) be accessible, (d) facilitate and model effective
communication, (e) involve staff in decision-making, (f) celebrate experimentation and
support risk, (g) express value for dissenting views, (h) reduce teachers’ sense of
vulnerability, (i) ensure that teachers have basic resources, and (j) be prepared to replace
ineffective teachers. Although campus leaders must lead the voyage of trust
development, it is critical that teachers are receptive and support their leader. Trust will
be established when everyone is working toward the common goal. To target the
challenge of establishing trust between colleagues, the literature (Darling-Hammond,
1986; Russell & Spafford, 1986) called for the involvement of peers in the collaboration
process rather than solely administrator based decision-making. According to Bryk and
Schneider (2002),
Trust within a faculty is grounded in common understanding about what studentsshould learn, how instruction should be conducted, and how teachers andstudents should behave with one another. For teachers to sense integrity amongcolleagues, a faculty must not only share these views but also perceive thatactions taken by other teachers are consistent with them. (p. 130)
A trusting workplace will exhibit high levels of cooperation and efficiency and
substantial student achievement.
34
Da Costa and Riordan (1996) examined the implication of teacher trust and
efficacy. A qualitative study of 10 teachers who worked as five dyads in multiple cycles
of collaborative consultation during one school year was performed. The goal of the
study was to show a significant correlation between trust, efficacy, and collaboration.
When trust was evident in the relationship between the members, the collaboration
proved to be more effective. The Da Costa and Riordan’s review of the extant literature
indicated that teacher trust was considered fundamental due to the risk-taking involved
in effective collaboration. It is important to also note that although trust was critical and
facilitated, collaboration was received with an open mind and was effective; it was not
always deemed necessary if the teachers involved in the collaboration efforts all were
highly efficacious teachers. According to Da Costa and Riordan (1996), highly
efficacious teachers even in the absence of trust are less likely to avoid collaboration
because they believe in their personal capabilities. Thus, there are several dimensions to
teacher trust and success of the school as a whole.
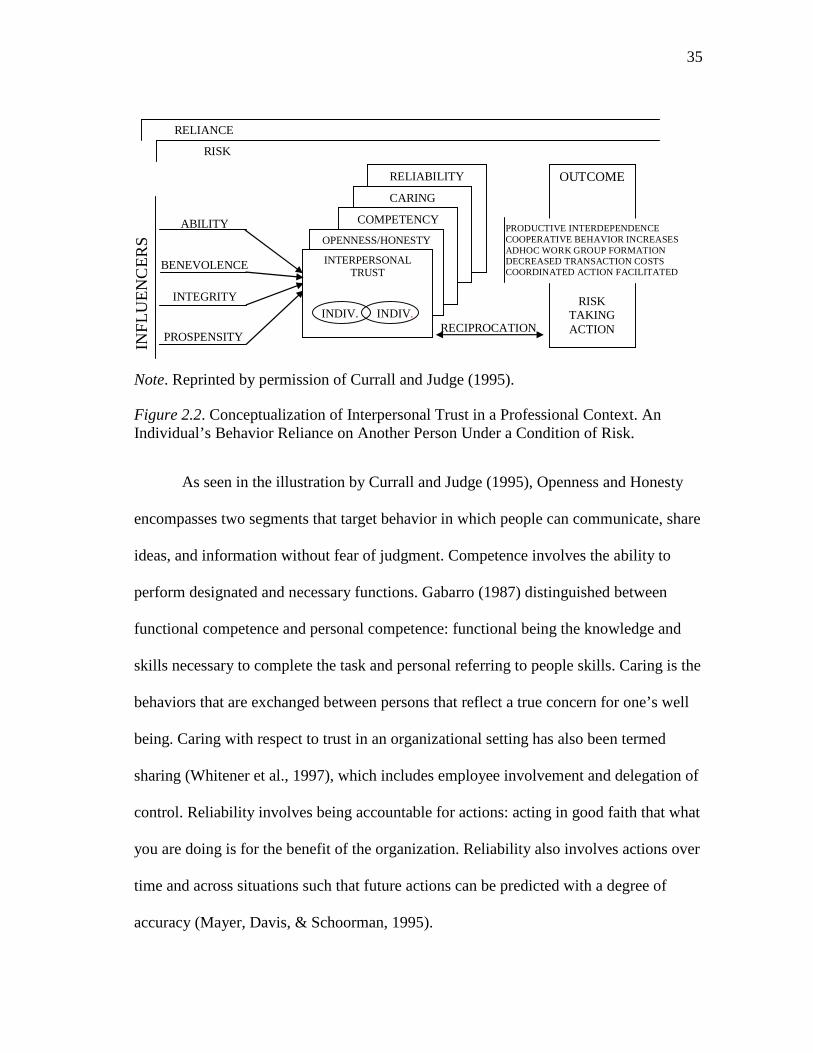
Trust is a multidimensional characteristic that has been proven to be a quality in
effective school settings, school administrators, and school teachers. Butler (1991)
described the dimensions as: (a) Openness/honesty, (b) competence, (c) caring, and (d)
reliability. Figure 2.2 is a comprehensive conceptualization of interpersonal trust. It
provides an explanation of the characteristics that influence the dimensions and the
outcomes. When the dimensions of trust are evident, there is better productivity,
cooperation, and coordination.
35
ABILITY
INTEGRITY
PROSPENSITY
BENEVOLENCE
INF
LU
EN
CE
RS
RELIABILITY
CARING
COMPETENCY
OPENNESS/HONESTY
INTERPERSONALTRUST
INDIV. INDIV.
OUTCOME
RISKTAKINGACTION
PRODUCTIVE INTERDEPENDENCECOOPERATIVE BEHAVIOR INCREASESADHOC WORK GROUP FORMATIONDECREASED TRANSACTION COSTSCOORDINATED ACTION FACILITATED
RECIPROCATION
RELIANCE
RISK
Note. Reprinted by permission of Currall and Judge (1995).
Figure 2.2. Conceptualization of Interpersonal Trust in a Professional Context. AnIndividual’s Behavior Reliance on Another Person Under a Condition of Risk.
As seen in the illustration by Currall and Judge (1995), Openness and Honesty
encompasses two segments that target behavior in which people can communicate, share
ideas, and information without fear of judgment. Competence involves the ability to
perform designated and necessary functions. Gabarro (1987) distinguished between
functional competence and personal competence: functional being the knowledge and
skills necessary to complete the task and personal referring to people skills. Caring is the
behaviors that are exchanged between persons that reflect a true concern for one’s well
being. Caring with respect to trust in an organizational setting has also been termed
sharing (Whitener et al., 1997), which includes employee involvement and delegation of
control. Reliability involves being accountable for actions: acting in good faith that what
you are doing is for the benefit of the organization. Reliability also involves actions over
time and across situations such that future actions can be predicted with a degree of
accuracy (Mayer, Davis, & Schoorman, 1995).
36
According to Williams (2001) in her research entitled, A Conceptualization of
Interpersonal Trust in the Workplace, the conceptual framework presented represents the
components of overall interpersonal trust construct. Each dimension is considered a
necessity. Trust is an authentic cornerstone for success in organizations. There is
obligation to foster trust in the workplace and learning environment. Trust must be
strongly advocated for student success, and teacher success.
Collective Efficacy
Teacher efficacy and trust only partially explain successful school organizations.
From an organizational perspective, collective efficacy may help to explain the
differential effect that schools have on student achievement. The link between teacher
self-efficacy and collective efficacy was made by Albert Bandura’s work. Bandura’s
research indicates that teachers’ perceptions of self and group capability influence their
actions, and it also suggests that these actions will be judged by the group relative to the
groups norms such as those set by collective efficacy beliefs (Goddard & Goddard,
2001a). Bandura (1993, 1997) suggests that, when aggregated, teachers’ efficacy
perceptions represent an emergent organizational construct called collective efficacy. As
previously discussed in the research concerning self-efficacy, Woolfolk and Hoy (1990)
report that teacher’s sense of self-efficacy affect direct instructional practice and overall
attitude toward the educational process. Bandura (1997) reports that taking this
individual teacher efficacy concept to the organizational level is “collective efficacy,
which is concerned with the performance capability of a social system as a whole” (p.
469). Therefore, collective efficacy is an extension of self-efficacy.
37
Goddard (2003) further defines collective efficacy as “the perceptions of teachers
in a school that the faculty as a whole can organize and execute the courses of action
required to have a positive effect on students” (p. 184). In addition, Goddard’s research
indicates, collective efficacy is defined as a group’s shared belief, coming from a
combination of individual group members’ perception of the group’s capabilities to
succeed at a given task. Performance of a particular group can be based on the amount of
the collective efficacy they possess. It is a campus team effort. If the team believes in
superior achievement, then they are going to work as one entity to achieve that goal. It is
through the team member’s perception of the shared belief, trust is built.
Collective efficacy goes hand-in-hand with trust because they must work
together to accomplish the goal. Teaching is typically performed in a group context
(Tschannen-Moran, Woolfolk Hoy, & Hoy, 1998). Teachers work communally: by
grades and subject areas, within physical domains, and according to perceived self and
collective efficacy with the school’s social system.
Teachers, like members of most organizations, share their beliefs and actionslargely in conformance with the structures, policies and traditions of the workdayworld around them and where teachers collectively perceive students as capablelearners, and themselves as capable teachers seem more likely to persevere andfoster students’ academic gains. (Rosenholtz, 1989, p. 2)
Bandura (1997) indicates an organization’s beliefs about the ability of teachers’ efficacy
to produce results is undoubtedly the result of an important feature of its operative
culture (p. 476).
In essence, collective efficacy ties together both self-efficacy and trust. When the
group is confident about their abilities, there is bound to be more effective collaboration
38
and communication. Hoover-Dempsey, Bassler, and Brissie (1987) conducted a study on
collective efficacy, though these researchers did not use the coined phrase of “collective
teacher efficacy”; their methodology involved the aggregation of teachers and individual
efficacy perceptions to the school level. The researchers reasoned, teacher’s efficacy
influenced the ‘setting’ of a school through its influence on multiple teacher behaviors.
The researchers surveyed 66 urban, suburban, and rural elementary school teachers to
prove their hypotheses that the level of teacher efficacy in a school was positively
related to various types of parental involvement. They found that the average level of
teacher efficacy in a school was positively related to parent participation in parent-
teacher conferences, parent volunteer work at school, parent home tutoring, and parent
support of the teacher’s work. These results provided initial support for Bandura’s
(1993, 1997) assertion that collective teacher efficacy is more strongly associated with
important school outcomes. Researchers who followed Hoover-Dempsey, Bassler, and
Brissie, developed the construct and named it appropriately and provided the formal
definition.
Teacher self-efficacy has been taken up a notch by current researchers, Goddard,
Hoy, and Woolfolk Hoy (2000). They have developed a corresponding construct and
have named it collective teacher efficacy. Goddard, Hoy, and Woolfolk Hoy (2000)
define this as “perceptions of teachers in a school that the efforts of the faculty as a
whole will have a positive effect on students” (p. 483) with the faculty in general
agreeing that “teachers in this school can get through the most difficult students” (p.
485). In a faculty where collective efficacy is evident, there is no student who cannot be

39
taught. In these trying times when students come to school with so many outside factors
that could contribute to their success or downfall, a school with collective efficacy may
be their saving grace. The teacher team is able to work together to reach the common
goal of helping all students succeed.
Research points out that it is the concept of team where no one is left behind, and
the belief there is not anyone who cannot be reached, that makes collective efficacy so
important. Schools, or other organizational systems with collective efficacy, make the
choice to seek out means to implement the vision. In other words, you live it, you
believe, you make it happen. According to Protheroe (2008):
Teachers in a school characterized by a can-do, together we can make adifference attitude are typically more likely to accept challenging goals and beless likely to give up easily. In contrast, teachers in a school characterized by alow level of collective efficacy are less likely to accept responsibility forstudents’ low performance and more likely to point to student risk factors, suchas poverty and limited knowledge of English, as causes. (p. 44)
A relationship between high achieving schools and collective efficacy is
highlighted through a number of studies. Attitude is something that can be worked on.
By building trust and bringing in teachers with teacher self-efficacy, collective efficacy
can be strengthened to have a positive impact regardless of the socioeconomic status or
language barriers of the students in the school system.
According to Bandura (1993, 1997) the collective efficacy perceptions of
teachers in a given school are important school organizational features. Collective
teacher efficacy has the potential to contribute to high student achievement. There is a
myriad of difficulties facing today’s students, but the stressors have a less of an impact
when collective efficacy is apparent. As efficacy continues to impact student

40
achievement in a positive matter, then efficacy will thrive. There is strong research
supporting school systems that lead teachers in a systematical way to develop efficacy.
Goddard in his 1998 study developed and implemented a 21-item scale to measure
collective teacher efficacy in 47 urban elementary schools and as predicted, collective
teacher efficacy has a positive effect on the differences in student achievement that occur
between schools (Goddard, 1998). Goddard and Goddard (2001a) analyzed the
relationship between teacher efficacy and collective efficacy and confirmed the
constructs are different but have a positive relationship. Teacher efficacy is a predicator
of between-school variance of collective efficacy, and this relationship is found in its
converse (Goddard & Goddard, 2001b). Nonetheless, collective efficacy is an essential
goal for the school organizations to be successful.
The key to unlocking the potential of a school organization is collective efficacy
because it through efficacy the talents of teachers are developed and shared. The
collective group of teachers with a common goal will have a strong sense of
commitment to the school’s success. A transformation can occur when the focus of a
campus becomes to develop, encourage, and promote efficacy in order to make
significant improvements to student learning. The level of collective efficacy more than
all factors beyond a school’s control will be a strong predicator of a school’s
performance. Campus leaders who work to construct collective teacher efficacy will
make greater strides in closing the achievement gap (Brinson & Steiner, 2007).
In the article, “Building Collective Efficacy” by Brinson and Steiner (2007), they
state that collective efficacy has an impressive list of positive consequences. Strong
41
collective efficacy insures several of these positive outcomes: (a) improves students’
performance, (b) ameliorates the negative effects of low socioeconomic status (SES), (c)
enhances parent/teacher relationships, and (d) creates a work environment that builds
teacher commitment to the school (Brinson & Steiner, 2007).
Researchers have only begun to focus on specific actions that schools can take to
improve collective efficacy; this is still a fairly new idea. It is in the emerging stages of
research; however, the following actions on the part of principals have been noted to
improve collective efficacy: (a) build instructional knowledge and skills, (b) create
opportunities for teachers to collaboratively share skills and experience, (c) interpret
results and provide actionable feedback on teachers’ performance, and (d) involve
teachers in decision-making (Brinson & Steiner, 2007). Further research will facilitate
the transformation.
The transformation will begin when fundamental concepts are addressed so that
teachers can accept the challenges that they will face on a daily basis rather than make
excuses about their lack of student achievement. They will make a commitment to
student achievement regardless of factors beyond their control.
In 2003, Ross, Hogaboam-Gray, and Gray completed a study in order to support
the notion that collective efficacy is linked to high student achievement. This study of
2,170 teachers in 141 elementary schools used a structural equation model to examine
the collective efficacy in the school systems. The study found that when members of the
school were involved in the day-to-day operations and establishment of school policies
and procedures, such as school goals and decision-making processes, then an even
42
stronger influence of collective teacher efficacy was evident. Individuals who feel that
they will be successful are more likely to not only step up to the challenge but meet the
challenge at hand because they try harder to achieve despite the roadblocks along the
way. Collective teacher efficacy influences student achievement by creating school
norms and sanctions that motivate persistence (Ross et al., 2003). Persistence is a vital
and powerful characteristic that guarantees collective efficacy. It ensures that teachers
are not going to give up (throw in the towel) when things get tough. The group will
collaborate, communicate, and persist until the goal is attained.
The assumption has been made by many researchers that people are more likely
to work toward and achieve goals that have value and meaning to them, and the goal that
they are trying to attain is relevant and has significant value. To measure collective
efficacy, researchers have used the group-level aggregate of individual perceptions of
collective efficacy, finding that collective efficacy positively predicts the dependent
variables identified in the study (Goddard, 2002). With the number of high-stakes
accountability measures faced by school organizations, collective efficacy becomes a
cornerstone in the building of a positive organizational climate and culture of the school.
Collective efficacy beliefs empower teachers and influence the number of duties that
they perform, such as curriculum planning, design, and implementation, as well as
communication with colleagues, parents, and student. The ultimate impact will be
evident in the students’ achievement.
Bandura (1997) has found “the stronger the beliefs people hold about their
collective capabilities, the more they achieve” (p. 480). Other researchers, confirmed this
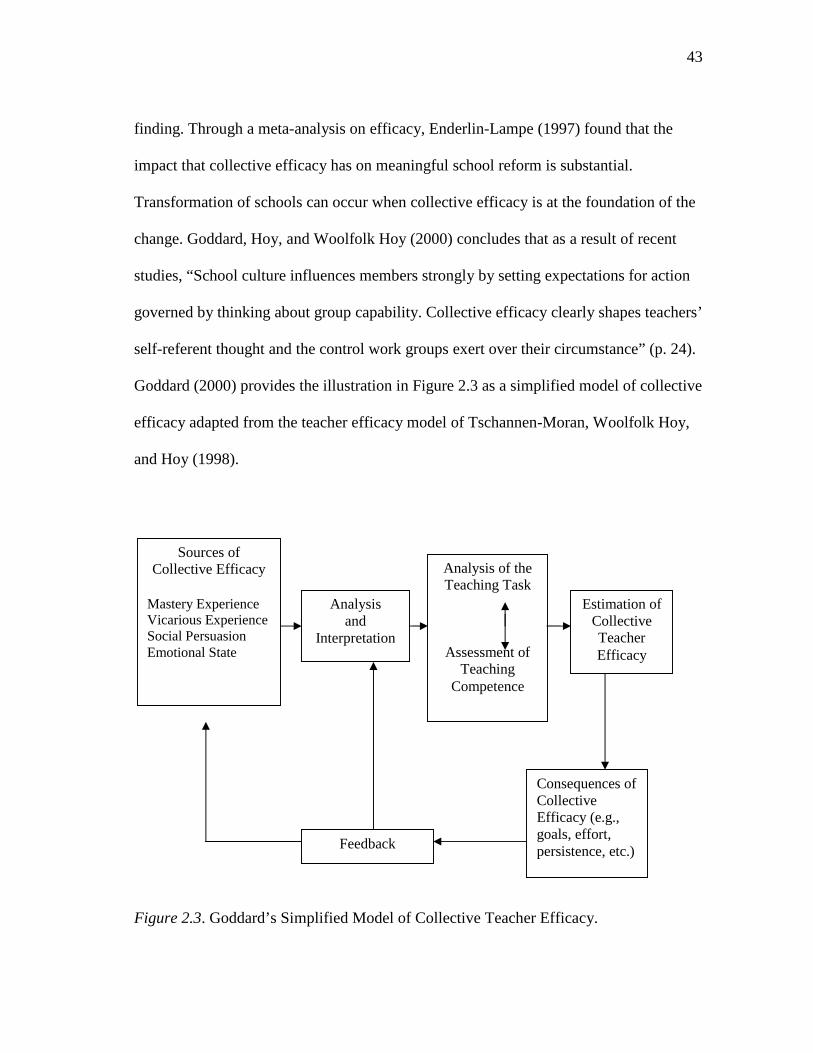
43
finding. Through a meta-analysis on efficacy, Enderlin-Lampe (1997) found that the
impact that collective efficacy has on meaningful school reform is substantial.
Transformation of schools can occur when collective efficacy is at the foundation of the
change. Goddard, Hoy, and Woolfolk Hoy (2000) concludes that as a result of recent
studies, “School culture influences members strongly by setting expectations for action
governed by thinking about group capability. Collective efficacy clearly shapes teachers’
self-referent thought and the control work groups exert over their circumstance” (p. 24).
Goddard (2000) provides the illustration in Figure 2.3 as a simplified model of collective
efficacy adapted from the teacher efficacy model of Tschannen-Moran, Woolfolk Hoy,
and Hoy (1998).
Figure 2.3. Goddard’s Simplified Model of Collective Teacher Efficacy.
Sources ofCollective Efficacy
Mastery ExperienceVicarious ExperienceSocial PersuasionEmotional State
Analysisand
Interpretation
Analysis of theTeaching Task
Assessment ofTeaching
Competence
Estimation ofCollectiveTeacherEfficacy
Consequences ofCollectiveEfficacy (e.g.,goals, effort,persistence, etc.)
Feedback
44
Conclusion
The vision for our school systems is unmistakable. The federal government
wants No Child Left Behind by requiring schools and school districts to meet annual
yearly improvement targets. At the same time, the Texas state accountability system has
schools working toward recognized and exemplary status and gold performance awards.
Thus, it is more important than ever for Texas schools and school districts to generate a
positive school culture based on high teacher self-efficacy, trust, and collective efficacy.
When you attain these three concepts, teacher self-efficacy, trust, and collective efficacy,
then a positive school culture has been established. A positive school culture has been
found to be associated with higher student motivation and achievement, improved
teacher collaboration, and improved attitudes of teachers toward their job (Stolp &
Smith, 1995).
In his book, The Lifeworld of Leadership, Sergiovanni (2000) says, “This
leadership is moral because it emphasizes bringing diverse people into a common cause
by making the school a covenantal community” (p. 167). A school culture that is built
around widely accepted core goals and values, always places students and learning first.
In order to solidify this approach, an educational leader must be willing to view
differences as strengths and encourage individuality through meaningful communication
and human interaction. However, leadership itself is not based solely on human
interaction and the ability of a leader to communicate. Rather, a good educational leader
combines meaningful communication while promoting a sense of autonomy within a

45
school and openly utilizes trust and respect to define the existing relationship with the
staff. The focus of schools, therefore, is effective instruction.
Schools must be dedicated to offering excellent instruction by teachers who are
confident in their fields and are more than certain but convinced that their students can
and must learn. They set high expectations for themselves, their colleagues, and their
students. Ahuja (2007) stated:
The school’s mission is communicated to students by word and by deed, hour byhour, day by day, year by year. A clear focus on mission becomes paramount.This mission-focus vents the institution of negative energy. What one does is oneis supposed to be doing, and this reinforces the mission because one sees othersdoing the same. Synergy produces more from less. Excellence, which is rarelymentioned at the school, becomes less a goal and more a given. (p. 16)
Developing teacher self-efficacy, trust, and collective efficacy takes work and
commitment from the entire school; it is a team effort. They become a working
community collaborating and communicating together in the best interest of the children.
When examining the literature, it is important to foster and maintain the urgency in
establishing these elements in our schools. Research proves that they create positive
learning environments, open communication in which everyone is valued, and decisions
are made collaboratively. A climate of distrust, chaos, or disrespect impedes student and
staff motivation and may limit the extent to which students achieve (Center for
Comprehensive School Reform and Improvement, 2009). On the other hand, high
academic achievement for all students is possible when teacher self-efficacy, trust, and
collective efficacy are the foundation for the school structure. The school structure will
be filled with safety, pride, respect, trust, and motivation for all.
46
In summary, information provided in this chapter included the literature pertinent
to the study of teacher self-efficacy, trust, and collective efficacy. In the review of the
literature, information relevant to teacher self-efficacy, trust, and collective efficacy was
determined to impact student achievement and teacher retention. It is clear that there is
and will continue to be a need to improve teachers’ belief in themselves and in their
school and develop a sense of trust in order to meet the needs of all students, regardless
of factors that are beyond the school’s control. This study was undertaken to
complement the existing body of knowledge related to this fundamental need to reform
our school systems and provide potential solutions.
47
CHAPTER III
METHODOLOGY
One of the purposes of the study was to investigate teachers’ self-efficacy and to
explore its relationship with teacher trust, collective efficacy, and teacher demographics.
Three surveys were used for this study: (a) the Teachers’ Sense of Efficacy Scale
(TSES), (b) the Omnibus T-Scale (OTS), and (c) the Collective Efficacy Scale (CE-
Scale). For the purpose of this study, the Teachers’ Sense of Efficacy Scale, the
Omnibus T-Scale, and the CE-Scale analyses include only the teachers at the district
being studied. The teacher survey data were derived from teachers in the 2009-2010
teacher fall cohort in an urban school district in San Antonio, Texas.
A proposal for the research study was submitted to and approved by the students’
graduate committee and the Institutional Review Board (IRB) at Texas A&M
University. Permission to conduct this study was granted by the Superintendent of
Schools from the district being studied in September of 2009.
The study focused on three specific research questions:
1. What are the scores for each campus on the following surveys: Teachers’
Sense of Efficacy Scale (TSES), Collective Efficacy Scale (CE-Scale), and
Omnibus T-Scale (OTS), and are there any differences among campus
scores?
2. What are the demographic differences of teachers’ sense of self-efficacy,
collective efficacy, and trust beliefs?
48
3. Do teachers’ self-efficacy, collective efficacy, and trust beliefs remain
constant for every campus?
This researcher used data collected from the identified survey instruments and
district Public Education Information Management System (PEIMS) teacher
information. Each teacher’s name and identification number will remain sanitized and
confidential. The researcher secured permission to use three surveys: (a) Teachers’
Sense of Efficacy Scale (TSES), (b) Collective Efficacy Scale (CE-Scale), and (c)
Omnibus T-Scale (OTS). The researcher added demographic variables into the survey
instrument and had a survey company that generated the survey online (Survey
Monkey). The demographic variables were: school, gender, years of experience,
ethnicity, teacher certification, had mentor first year of teaching, found mentor teacher
helpful, and am or have been a mentor teacher.
In this chapter, the researcher elaborated on procedures that were followed in
order to accomplish the purpose of the study. Sections contained in this chapter include:
(a) population, (b) instrumentation, (c) procedures, (d) data analysis, and (e) survey.
Permission was requested and granted from the district leadership to conduct the
research study. Additionally, an information sheet was provided to the participants who
were being asked to participate in the survey (Appendix A). Teacher anonymity was
protected through the use of unidentifiable coding used in the study survey instrument
and data collection. The first survey, the Teachers’ Sense of Efficacy Scale (TSES), was
developed in 2001 by Tschannen-Moran and Woolfolk Hoy. The TSES measures the
teachers’ sense of self efficacy. The researchers examined the construct validity of the
49
long form of the TSES by assessing the correlation of the measure and other exiting
measures of teacher efficacy. As expected, total scores on the TSES were positively
related to the Rand Items (r=0.18 and 0.53, p<0.01), as well as to both the personal
teaching efficacy (PTE) factor of the Gibson and Dembo (1984) measure (r=0.645,
p<.001) and the general teacher efficacy (GTE factor (r=0.16, p<0.01). Positive
correlations with other measures of personal teaching efficacy provide evidence for
construct validity.
Population
The population for this study included 714 teachers who completed the teacher
self-efficacy, teacher collective efficacy, and teacher trust surveys from an urban school
district in southwest San Antonio. The researcher gathered data from the participating
teachers employed during the 2009-2010 school year. The data were gathered during a
two-week period during the month of March 2010. The teachers participating in the
survey were given a two-week window in which to complete the survey. There was
extensive research and planning done before implementing the survey: (a) the research
population was considered, (b) the scope of the survey instrument and the added
demographics were considered, (c) the online survey system was used for ease for
participating teachers, (d) timeframe was considered (not too early in the school year and
in month), (e) teachers would have ample time to participate, and (f) how the data would
be analyzed after the fact was considered. Through voluntary participation, teachers
participated by completing the Teachers’ Sense of Efficacy Scale, CE-Scale, and
Omnibus T-Scale. Participating teachers took the survey during their conference time
50
and or before or after school. The survey was administered through the use of an online
system and all the participants received the same instructions through an email prior to
their participation.
The survey is an 81-item question instrument that requires participating teachers
to answer questions using a Likert Scale analysis of questions subcategorized as (a)
Teachers’ Sense of Efficacy Scale, CE-Scale, and Omnibus T-Scale. The survey reflects
questions addressing the teacher’s sense of self-efficacy, collective efficacy, and trust.
Instrumentation
The researcher chose to combine three survey instruments: (a) Teachers’ Sense
of Efficacy Scale (TSES), (b) Omnibus T-Scale, and (c) Collective Efficacy Scale (CE-
Scale). This instrument is comprised of 81 questions and is divided into three sections.
Section one is labeled Teachers’ Sense of Efficacy Scale and is comprised of 24
questions (see Appendix B for questions).
To determine the Efficacy in Student Engagement, Efficacy in Instructional
Practices, and Efficacy in Classroom Management subscale scores, this researcher
computed un-weighted means of the items that load on each factor. These groupings are:
(a) Efficacy in Student Engagement: Items 1, 2, 4, 6, 9, 12, 14, 22; (b) Efficacy in
Instructional Strategies: Items 7, 10, 11, 17, 18, 20, 23, 24; and (c) Efficacy in
Classroom Management: Items 3, 5, 8, 13, 15, 16, 19, 21.
Section two consisted of 21 questions and is categorized as the CE-Scale (see
Appendix C for questions). This sections used a 1-6 Likert scale response, with 1
reflecting strongly disagree going all the way to number 6 with strongly agree. Ten of
51
the items in this scale are reversed scored, that is, “1” is scored “6,” “2” is scored “5,”
etc. For example, the item, “If a child doesn’t want to learn teachers here give up,” is
scored in reverse. Thus, a strongly agree “6” would be scored “1,” suggesting low
efficacy. To score the scale for this section of the survey, first scores were reversed on
the following items: 3, 4, 8, 10, 11, 12, 16, 18, 19, 20. Then the scores were added for all
21 items: the greater the sum, the higher the collective efficacy. Finally, all the
individual teacher scores were averaged to find a collective efficacy score of the school.
Section three is categorized as Omnibus T-Scale (see in Appendix D for
questions) and consists of 26 questions. In this section, a Likert scale was used to record
the teachers’ responses. The scale also ranged from 1 reflecting strongly disagree going
to number 6 with strongly agree. The latest version of the Omnibus T-Scale (26 Likert
items) measures three subscales: (a) Faculty Trust in the Principal, (b) Faculty Trust in
Colleagues, and (c) Faculty Trust in Clients. Then the 26 questions were scored: (a)
Faculty Trust in the Principal - Items 1, 4*, 7, 9, 11*, 15, 18, 23*; (b) Faculty Trust in
Colleagues - Items 2, 5, 8*, 12, 13, 16, 19, 21; and (c) Faculty Trust in the Clients -
Items 3, 6, 10, 14, 17, 20, 22, 24, 25, 26* (*Items are reversed scored, that is, [1=6, 2=5,
3=4, 4=3, 5=2, 6=1]). First, for each school, the average score for every item was
computed. Then, the average item scores were used in the next set of computations to
determine the faculty trust subtest scores for each school. For each of the three subtests,
school scores were computed by adding the values for the items composing that scale
and then dividing by the number of items. Standardized scores were computed for the T-
scales for purposes of comparison: school subtest scores were converted to standardized
52
scores with a mean of 500 and a standard deviation of 100, using the following formulas:
(a) Standard Score for Trust in Clients (TCl) = 100(TCl-3.53)/.621+500; (b) the
difference between the school score on (TCl) and the mean for the normative sample
(TCl-3.53) was computed. Then, the difference was multiplied by one hundred
[100(TCl-3.53)]. Finally, the product was divided by the standard deviation of the
normative sample (.621). At the end of the computations, 500 was added to the result. As
a result, a standardized score for Faculty Trust in Clients was computed.
For the Trust in the Principal and Trust in Colleagues, the following formulas
were used: (a) Standard Score for Trust in the Principal (TP) = 100(TP-4.42)/.725+500
and (b) Standard Score for Trust in Colleagues (TCo) = 100(TCo-4.46)/.443+500.
As a result, the standardized school scores against the normative data provided in
the Ohio sample were used. For example, if one school’s score is 700 on faculty trust in
colleagues, it is two standard deviations above the average score on faculty trust in
colleagues of all schools in the sample; that is, the school has more faculty trust in
colleagues than 97% of the schools in the sample. This system is the same as the one
used in reporting individual scores on the SAT, CEEB, and GRE. The range of these
scores is presented in Table 3.1.
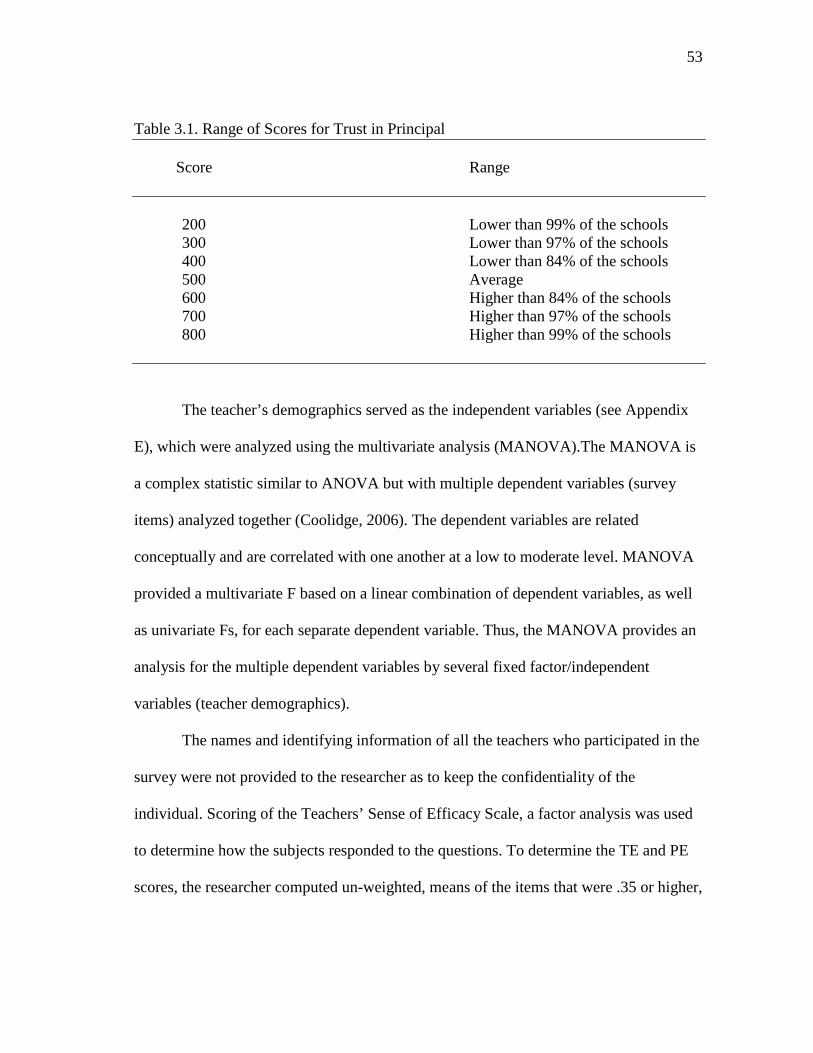
53
Table 3.1. Range of Scores for Trust in Principal
Score Range
200 Lower than 99% of the schools300 Lower than 97% of the schools400 Lower than 84% of the schools500 Average600 Higher than 84% of the schools700 Higher than 97% of the schools800 Higher than 99% of the schools
The teacher’s demographics served as the independent variables (see Appendix
E), which were analyzed using the multivariate analysis (MANOVA).The MANOVA is
a complex statistic similar to ANOVA but with multiple dependent variables (survey
items) analyzed together (Coolidge, 2006). The dependent variables are related
conceptually and are correlated with one another at a low to moderate level. MANOVA
provided a multivariate F based on a linear combination of dependent variables, as well
as univariate Fs, for each separate dependent variable. Thus, the MANOVA provides an
analysis for the multiple dependent variables by several fixed factor/independent
variables (teacher demographics).
The names and identifying information of all the teachers who participated in the
survey were not provided to the researcher as to keep the confidentiality of the
individual. Scoring of the Teachers’ Sense of Efficacy Scale, a factor analysis was used
to determine how the subjects responded to the questions. To determine the TE and PE
scores, the researcher computed un-weighted, means of the items that were .35 or higher,
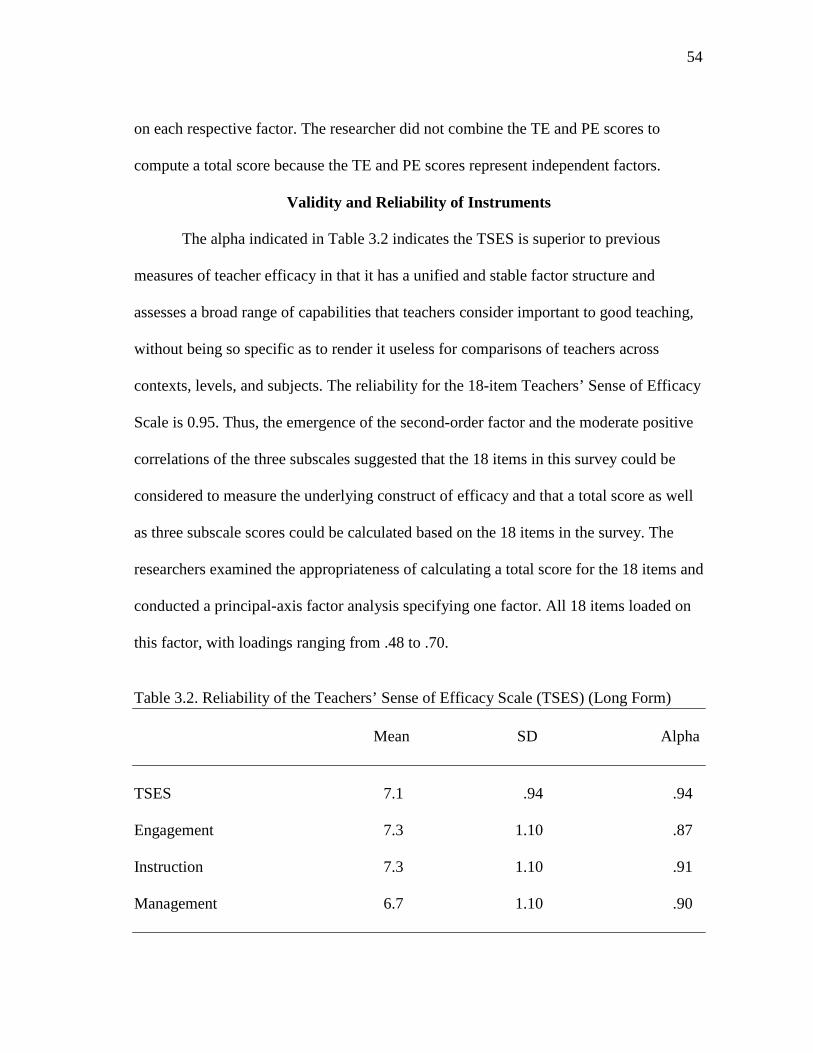
54
on each respective factor. The researcher did not combine the TE and PE scores to
compute a total score because the TE and PE scores represent independent factors.
Validity and Reliability of Instruments
The alpha indicated in Table 3.2 indicates the TSES is superior to previous
measures of teacher efficacy in that it has a unified and stable factor structure and
assesses a broad range of capabilities that teachers consider important to good teaching,
without being so specific as to render it useless for comparisons of teachers across
contexts, levels, and subjects. The reliability for the 18-item Teachers’ Sense of Efficacy
Scale is 0.95. Thus, the emergence of the second-order factor and the moderate positive
correlations of the three subscales suggested that the 18 items in this survey could be
considered to measure the underlying construct of efficacy and that a total score as well
as three subscale scores could be calculated based on the 18 items in the survey. The
researchers examined the appropriateness of calculating a total score for the 18 items and
conducted a principal-axis factor analysis specifying one factor. All 18 items loaded on
this factor, with loadings ranging from .48 to .70.
Table 3.2. Reliability of the Teachers’ Sense of Efficacy Scale (TSES) (Long Form)
Mean SD Alpha
TSES 7.1 .94 .94
Engagement 7.3 1.10 .87
Instruction 7.3 1.10 .91
Management 6.7 1.10 .90
55
The second survey incorporated into this study was the Omnibus T-Scale. The
Omnibus T-Scale is a short operational measure of these three dimensions of trust,
which can be used for either elementary or secondary schools. The reliabilities of the
three subscales typically range from .90 to .98. Factor analytic studies of the Omnibus T-
Scale support the construct and discriminant validity of the concept. The Omnibus T-
Scale has three subscales: (a) Faculty Trust in the Principal, (b) Faculty Trust in
Colleagues, and (c) Faculty Trust in Clients. Hoy’s research led him and his colleagues
to conclude there are at least three dimensions of faculty trust: (a) trust in the principal,
(b) trust in colleagues, and (c) trust in clients (students and parents). Vulnerability,
benevolence, reliability, competence, honesty, and openness characterize each of these
dimensions of trust (Hoy & Tschannen-Moran, 2003).
The third survey incorporated into this study was the Collective Efficacy Scales
(CE-Scale). The development of the 21 collective efficacy scale included several phases.
Scale development began initially by modifying items from the original Gibson and
Dembo (1984) teacher efficacy scale to reflect collective efficacy (i.e., changing the
object of the efficacy items from “I” to “We”). Next, additional items were written in
response to a review by a panel of experts with experience in teacher efficacy research.
Following this review, the items were subjected to a field test and then a pilot test with
46 teachers in 46 schools (1 teacher from each school). Results from the pilot study
suggested that the 21 items did indeed offer a valid and reliable measure of collective
efficacy (Goddard, Hoy, & Woolfolk Hoy, 2000).
56
Based on the promise of the results from the initial phases of their study, the
researchers decided to test the criterion-related validity, predictive validity, and
reliability of scores on the collective efficacy scale in a more comprehensive sample. A
sample of 452 teachers in 47 randomly selected elementary schools in a large urban
district in the Midwest completed the collective efficacy survey. At the school level, the
21 collective efficacy items were submitted to a principal axis factor analysis. All items
loaded strongly on a single factor and explained 57.89% of the item variation. The alpha
coefficient of reliability was strong (.96) (Goddard, 2002).
Criterion-related validity of the school collective efficacy scores was tested in
several ways. The criterion variables examined were (a) personal teaching efficacy (Hoy
& Woolfolk, 1993), (b) faculty trust in colleagues (Hoy & Kupersmith, 1985), and (c)
environmental press (Hoy & Sabo, 1998). Personal teaching efficacy is a measure of a
teacher’s self-perceptions of capability to educate students. It was predicted that when
aggregated to the school level, teachers’ perceptions of personal efficacy would be
moderately and positively related to collective teacher efficacy; a high correlation was
not expected because personal and collective teacher efficacy have different referents
(self versus group). Moreover, the collective teacher efficacy measure directly assesses
perceptions of both perceived competence and task, whereas the personal teacher
efficacy measure includes only items about competence. As predicted, there was a
moderate and positive (r=. 54, p<.01) correlation between personal teacher efficacy
aggregated at the school level and collective teacher efficacy. A positive relationship
between faculty trust in colleagues and collective teacher efficacy was predicted, and
57
similar to the pilot results, trust in colleagues was positively and significantly related to
collective teacher efficacy (r=.62, p<.01).
Finally, the researchers predicted no relationship between collective teacher
efficacy and environmental press or the extent to which teachers experience
“unreasonable community demands” (Hoy & Sabo, 1998). There is no a priori reason to
expect that teachers’ assessments of group capabilities would be associated with their
perceptions of external demands. In other words, a demanding task and external
pressures do not necessarily make people feel more or less capable. It is how they handle
the pressure that determines capability. As predicted, the observed relationship between
collective teacher efficacy and environmental press was not statistically significant
(r=.05, n.s.).
As a test of predictive validity, the researchers employed hierarchical linear
modeling to show that scores on the collective efficacy scale were significant predictors
of the mathematics and reading achievement (measured by the 7th edition of
Metropolitan Achievement Test) of 7016 2nd, 3rd, and 5th grade students who attended
the 47 sampled schools. Taken together, these results provide content, criterion-related,
and predictive validity evidence for scores on the collective efficacy scale as well as
strong reliability evidence.
Procedures
The procedure used consisted of first contacting the superintendent of the school
district being studied to secure her permission to perform the study in the district. A
letter was drafted, submitted, and approved by the Internal Review Board at Texas A&M
58
and submitted and signed by the Superintendent of the school being studied. The letter
assured subject confidentiality, as well as a detailed explanation of the researcher’s
intent. Permission to proceed with the study was granted by the Superintendent on
September 2009.
Next, the researcher, through email, sent a letter to participants assuring subject
confidentiality, as well as a detailed explanation of the intent of the research. The
researcher then sent a survey link inviting all participants to participate in the study by
answering the questions on the link provided. Consent to participate in the study was
assumed by the willingness to answer the survey questions on line.
Data Analysis
All three surveys were analyzed using the scoring suggested by the original
survey developers, as described at the beginning of this chapter. Then, descriptive
statistics were used to describe results; the MANOVA was conducted to find differences
between teacher demographics and survey question items. If MANOVA revealed
significant differences, the Scheffé post hoc test was applied to determine actual between
group differences.
Data were entered into SPSS version 18.0 for Windows for analysis. As
previously stated, the analyses compared the teacher’s demographics from a local district
using the Teachers’ Sense of Efficacy Scale, CE-Scale, and Omnibus T-Scale.
Responses from the teachers were used to conduct this study.
59
Teacher demographics was reported in descriptive statistic format using
frequencies and percentages. The frequency is the number of participants who fit within
a certain category. Percentages provide a representation for additional comparisons.
The Teachers’ Sense of Efficacy Scale, Omnibus T-Scale; CE-Scale survey
instruments chosen by the researcher were analyzed using a multivariate general linear
model referred to as multiple analysis of variance (MANOVA). A MANOVA was used
to see the main and interaction effects of categorical variables (scales on each survey for
each separate MANOVA analysis) and on multiple dependent interval variables
(demographic variables, for each survey for each separate MANOVA analysis). The
MANOVA tests were used to test the differences in the centroid (vector) of means of the
multiple interval dependent and for various categories of the independent(s) (for each
separate survey). Post hoc comparisons were also used to conduct to see which values of
a factor contribute most to the explanation of the dependents.
60
CHAPTER IV
RESULTS
Organization of Data Analysis
Within this chapter, results of the study are presented using the following
organization: (a) demographic data, (b) Cronbach alphas for research variables, and (c)
data analysis results for each research question.
Research questions used to guide the study were:
1. What are the scores for each campus on the following surveys: Teachers’
Sense of Efficacy Scale (TSES), Collective Efficacy Scale (CE-Scale), and
Omnibus T-Scale (OTS), and are there any differences among campus
scores?
2. What are the demographic differences of teachers’ sense of self-efficacy,
collective efficacy, and trust beliefs?
3. Do teachers’ self-efficacy, collective efficacy, and trust beliefs remain
constant for every campus?
Questions used in the survey related to each dependent category and were
grouped together for analysis. The questions themselves were derived from three surveys
that had already been developed, researched, and had been tested for their validity and
reliability. The surveys were: Teachers’ Sense of Efficacy Scale (TSES), Collective
Efficacy Scale (CE-Scale), and Omnibus T-Scale (OTS). The first survey, the Teachers’
Sense of Efficacy Scale (TSES), was developed by Tschannen-Moran and Woolfolk
Hoy (2001). The Teachers’ Sense of Efficacy Scale is a measure of the three dimensions
61
of teaching efficacy: (a) efficacy for instructional strategies, (b) efficacy for classroom
management, and (c) efficacy for student engagement (Kurz, Woolfolk Hoy, & Hoy,
2007). The second survey incorporated into this study was the Omnibus T-Scale (Hoy,
2002). The Omnibus T-Scale (OTS) is a short, operational measure of these three
dimensions of trust, which can be used for either elementary or secondary schools. The
third survey incorporated into this study was the Collective Efficacy Scale (CE-Scale)
(Goddard, Hoy, & Woolfolk Hoy, 2000; Goddard, Tschannen-Moran, & Hoy, 2001a).
The Collective Efficacy Scale measures the perceptions of teachers that the efforts of the
faculty as a whole will have a positive effect on students (Goddard, Hoy, & Woolfolk
Hoy, 2004).
As indicated in Chapter III, the three surveys were combined. Afterwards, the
questions were categorized under the following areas/categories: (a) student
engagement, (b) instructional strategies, (c) classroom management, (d) trust in
principal, (e) trust in colleagues, (f) trust in clients, and (g) collective efficacy. For
example, all questions dealing with student engagement were grouped together, all
questions dealing with classroom management were grouped together, etc. The
independent variables of school/campus, gender, years of experience, ethnicity, teacher
certification, mentor first year, mentor teacher helpful, and are or have been a mentor
teacher, were used as the explanatory categories. Presentation of this data analysis is
used to answer each research question from the respective explanatory category.
Research questions were analyzed using multivariate analysis of variance
(MANOVA), and if the MANOVA was identified as significant, separate analyses of
62
variance (ANOVA’s) were done for the individual dependent variables (surveys) and
independent variables (teacher demographics: school, gender, years of experience,
ethnicity, teacher certification, mentor in first year, mentor helpful, have been mentor
teacher) for each research question. The significance level for all statistical analyses was
set at the .001 level unless otherwise indicated. Mean differences and standard
deviations were listed for each variable with a significance score of less than .05 (p <
.05).
As an added measure of statistical significance for differences in group means,
Scheffé post hoc tests were run to determine the significant differences between group
means in an analysis of variance setting. Scheffé post hoc test results reveal where the
mean differences and standard deviations lie for the following categories: student
engagement, instructional strategies, classroom management, trust in principal, trust in
colleagues, trust in clients, and collective efficacy. Each category of questions was
developed from the survey. Scheffé’s test is considered to be one of the most
conservative post hoc tests and appropriate when using a comparison of a complex set of
group means. The Scheffé test is a method for adjusting significance levels in a linear
regression analysis to account for multiple comparisons. It is particularly useful in
analysis of variance and in constructing simultaneous confidence bands for regressions
involving basis functions. Scheffé’s method is a single-step multiple comparison
procedure that applies to the set of estimates of all possible contrasts among the factor
level means, not just the pair-wise differences considered by the Tukey-Kramer method
(Winer, Brown, & Michels, 1991).
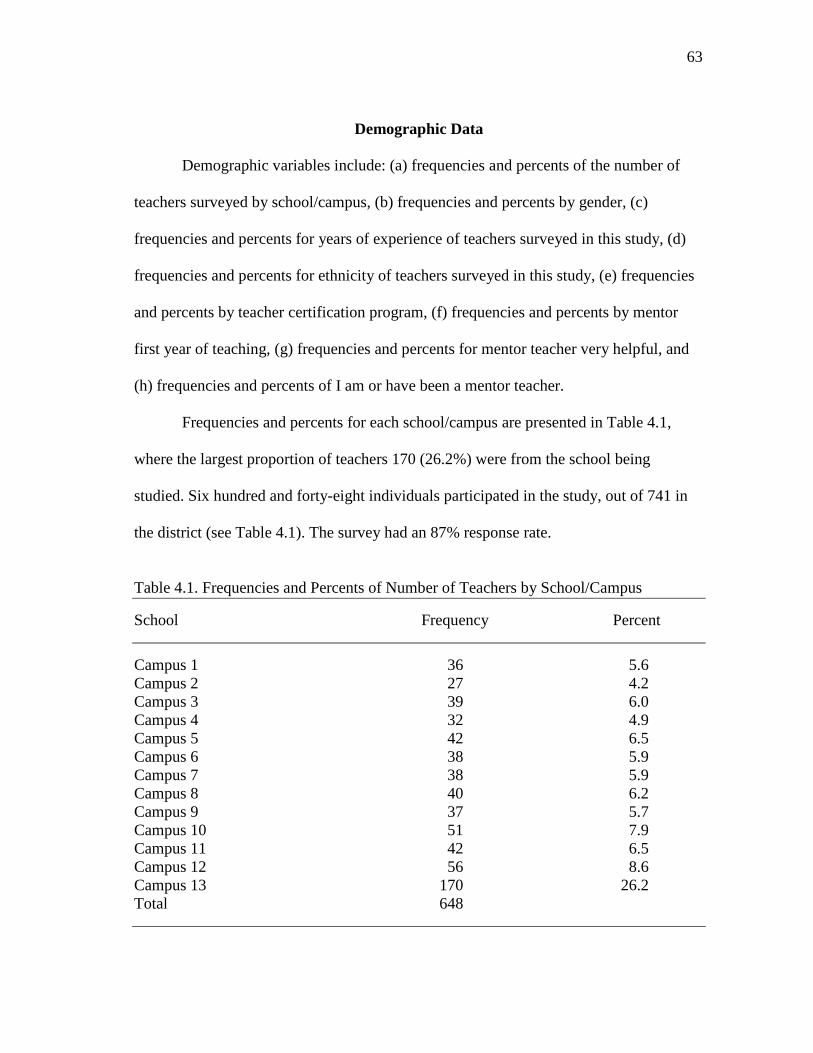
63
Demographic Data
Demographic variables include: (a) frequencies and percents of the number of
teachers surveyed by school/campus, (b) frequencies and percents by gender, (c)
frequencies and percents for years of experience of teachers surveyed in this study, (d)
frequencies and percents for ethnicity of teachers surveyed in this study, (e) frequencies
and percents by teacher certification program, (f) frequencies and percents by mentor
first year of teaching, (g) frequencies and percents for mentor teacher very helpful, and
(h) frequencies and percents of I am or have been a mentor teacher.
Frequencies and percents for each school/campus are presented in Table 4.1,
where the largest proportion of teachers 170 (26.2%) were from the school being
studied. Six hundred and forty-eight individuals participated in the study, out of 741 in
the district (see Table 4.1). The survey had an 87% response rate.
Table 4.1. Frequencies and Percents of Number of Teachers by School/Campus
School Frequency Percent
Campus 1 36 5.6Campus 2 27 4.2Campus 3 39 6.0Campus 4 32 4.9Campus 5 42 6.5Campus 6 38 5.9Campus 7 38 5.9Campus 8 40 6.2Campus 9 37 5.7Campus 10 51 7.9Campus 11 42 6.5Campus 12 56 8.6Campus 13 170 26.2Total 648
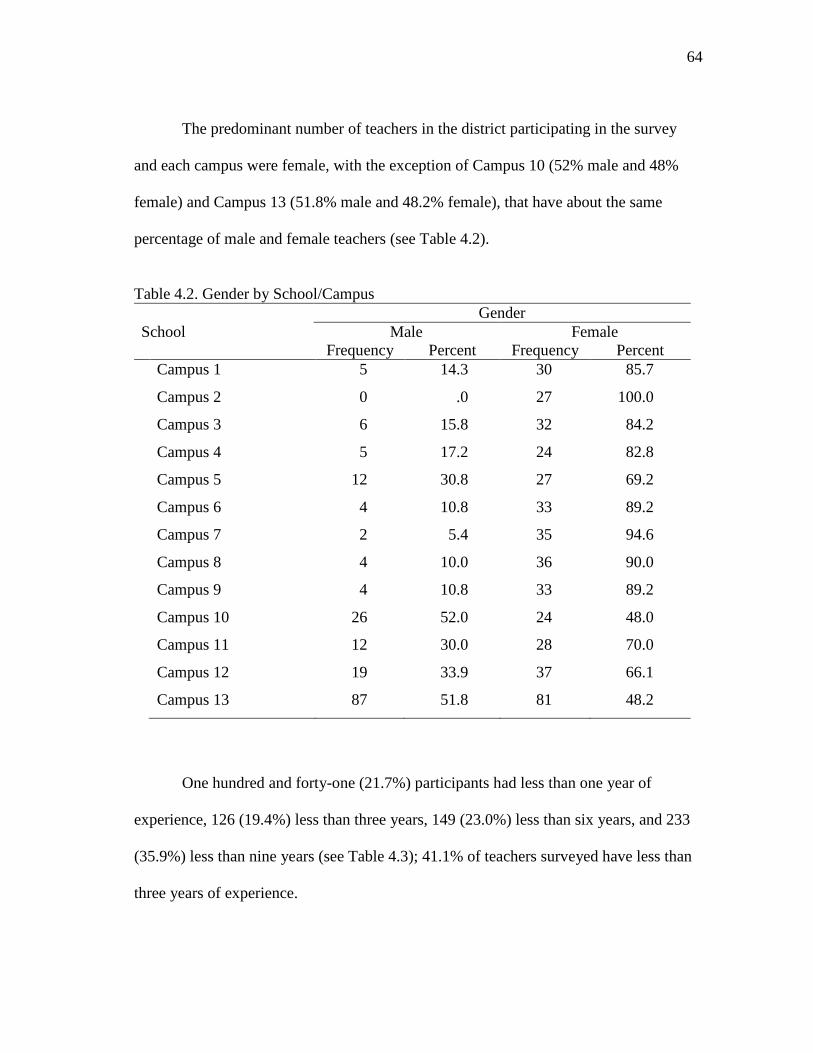
64
The predominant number of teachers in the district participating in the survey
and each campus were female, with the exception of Campus 10 (52% male and 48%
female) and Campus 13 (51.8% male and 48.2% female), that have about the same
percentage of male and female teachers (see Table 4.2).
Table 4.2. Gender by School/CampusGender
School Male FemaleFrequency Percent Frequency Percent
Campus 1 5 14.3 30 85.7
Campus 2 0 .0 27 100.0
Campus 3 6 15.8 32 84.2
Campus 4 5 17.2 24 82.8
Campus 5 12 30.8 27 69.2
Campus 6 4 10.8 33 89.2
Campus 7 2 5.4 35 94.6
Campus 8 4 10.0 36 90.0
Campus 9 4 10.8 33 89.2
Campus 10 26 52.0 24 48.0
Campus 11 12 30.0 28 70.0
Campus 12 19 33.9 37 66.1
Campus 13 87 51.8 81 48.2
One hundred and forty-one (21.7%) participants had less than one year of
experience, 126 (19.4%) less than three years, 149 (23.0%) less than six years, and 233
(35.9%) less than nine years (see Table 4.3); 41.1% of teachers surveyed have less than
three years of experience.
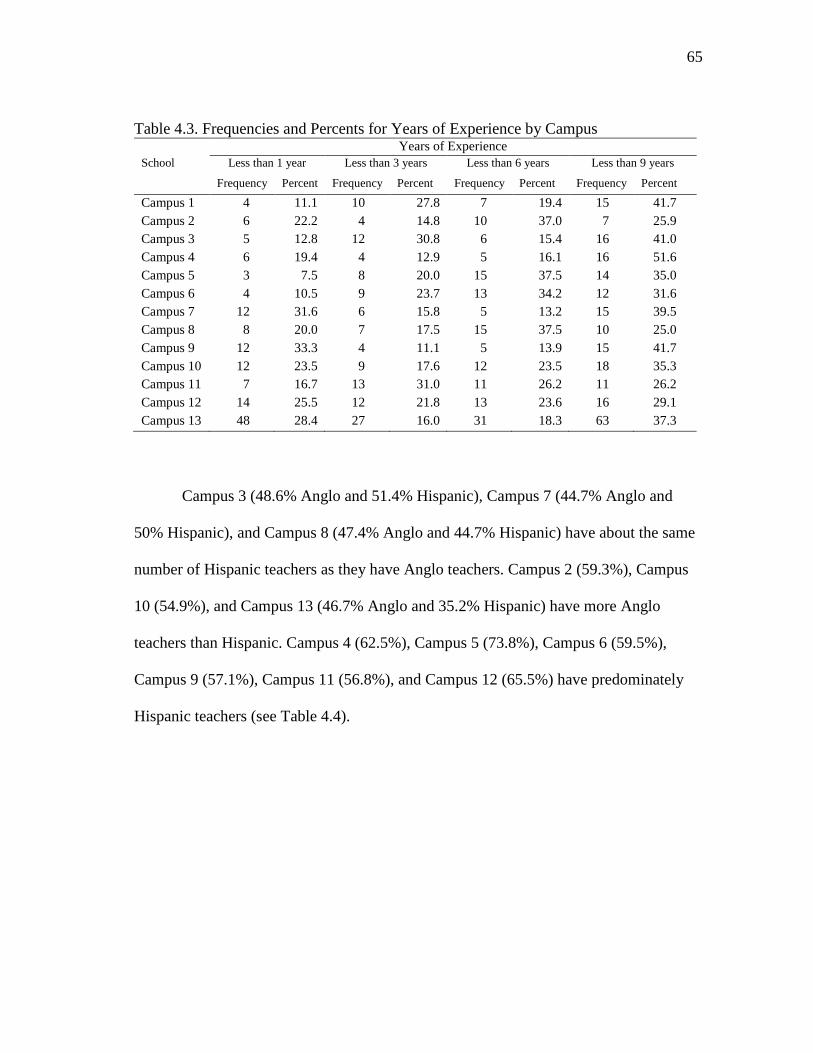
65
Table 4.3. Frequencies and Percents for Years of Experience by CampusYears of Experience
School Less than 1 year Less than 3 years Less than 6 years Less than 9 years
Frequency Percent Frequency Percent Frequency Percent Frequency Percent
Campus 1 4 11.1 10 27.8 7 19.4 15 41.7
Campus 2 6 22.2 4 14.8 10 37.0 7 25.9
Campus 3 5 12.8 12 30.8 6 15.4 16 41.0
Campus 4 6 19.4 4 12.9 5 16.1 16 51.6
Campus 5 3 7.5 8 20.0 15 37.5 14 35.0
Campus 6 4 10.5 9 23.7 13 34.2 12 31.6
Campus 7 12 31.6 6 15.8 5 13.2 15 39.5
Campus 8 8 20.0 7 17.5 15 37.5 10 25.0
Campus 9 12 33.3 4 11.1 5 13.9 15 41.7
Campus 10 12 23.5 9 17.6 12 23.5 18 35.3
Campus 11 7 16.7 13 31.0 11 26.2 11 26.2
Campus 12 14 25.5 12 21.8 13 23.6 16 29.1
Campus 13 48 28.4 27 16.0 31 18.3 63 37.3
Campus 3 (48.6% Anglo and 51.4% Hispanic), Campus 7 (44.7% Anglo and
50% Hispanic), and Campus 8 (47.4% Anglo and 44.7% Hispanic) have about the same
number of Hispanic teachers as they have Anglo teachers. Campus 2 (59.3%), Campus
10 (54.9%), and Campus 13 (46.7% Anglo and 35.2% Hispanic) have more Anglo
teachers than Hispanic. Campus 4 (62.5%), Campus 5 (73.8%), Campus 6 (59.5%),
Campus 9 (57.1%), Campus 11 (56.8%), and Campus 12 (65.5%) have predominately
Hispanic teachers (see Table 4.4).
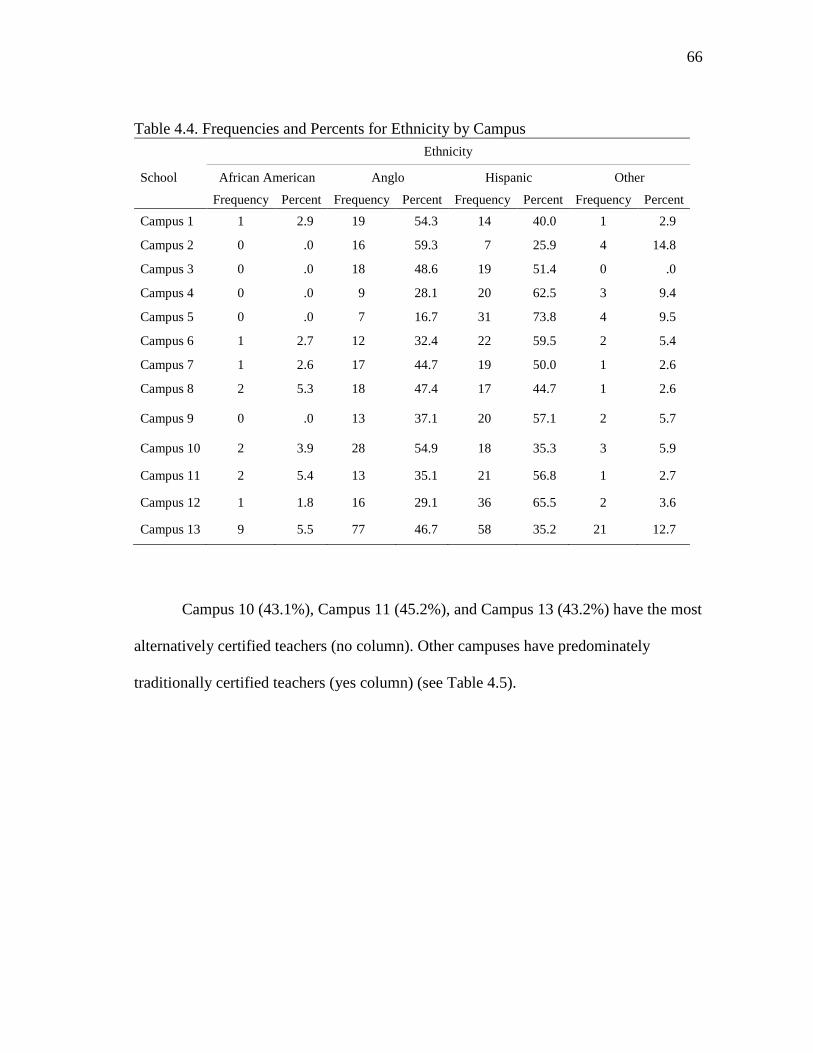
66
Table 4.4. Frequencies and Percents for Ethnicity by Campus
Ethnicity
School African American Anglo Hispanic Other
Frequency Percent Frequency Percent Frequency Percent Frequency Percent
Campus 1 1 2.9 19 54.3 14 40.0 1 2.9
Campus 2 0 .0 16 59.3 7 25.9 4 14.8
Campus 3 0 .0 18 48.6 19 51.4 0 .0
Campus 4 0 .0 9 28.1 20 62.5 3 9.4
Campus 5 0 .0 7 16.7 31 73.8 4 9.5
Campus 6 1 2.7 12 32.4 22 59.5 2 5.4
Campus 7 1 2.6 17 44.7 19 50.0 1 2.6
Campus 8 2 5.3 18 47.4 17 44.7 1 2.6
Campus 9 0 .0 13 37.1 20 57.1 2 5.7
Campus 10 2 3.9 28 54.9 18 35.3 3 5.9
Campus 11 2 5.4 13 35.1 21 56.8 1 2.7
Campus 12 1 1.8 16 29.1 36 65.5 2 3.6
Campus 13 9 5.5 77 46.7 58 35.2 21 12.7
Campus 10 (43.1%), Campus 11 (45.2%), and Campus 13 (43.2%) have the most
alternatively certified teachers (no column). Other campuses have predominately
traditionally certified teachers (yes column) (see Table 4.5).
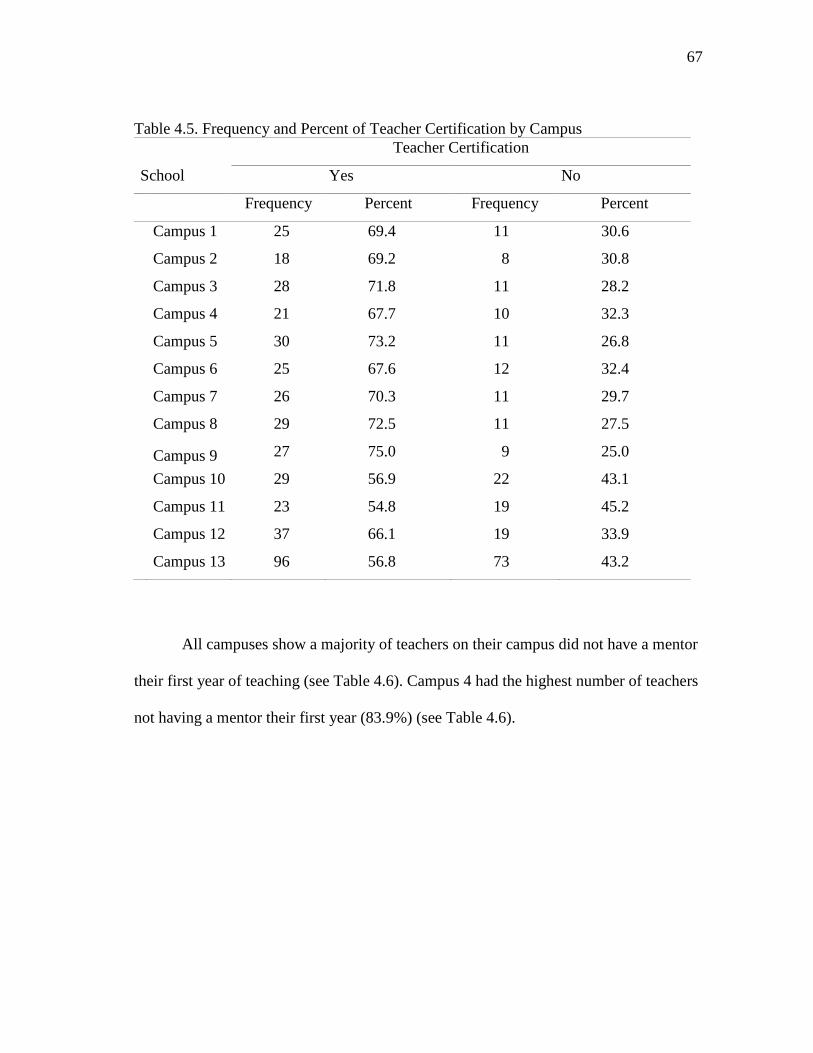
67
Table 4.5. Frequency and Percent of Teacher Certification by CampusTeacher Certification
School Yes No
Frequency Percent Frequency Percent
Campus 1 25 69.4 11 30.6
Campus 2 18 69.2 8 30.8
Campus 3 28 71.8 11 28.2
Campus 4 21 67.7 10 32.3
Campus 5 30 73.2 11 26.8
Campus 6 25 67.6 12 32.4
Campus 7 26 70.3 11 29.7
Campus 8 29 72.5 11 27.5
Campus 9 27 75.0 9 25.0
Campus 10 29 56.9 22 43.1
Campus 11 23 54.8 19 45.2
Campus 12 37 66.1 19 33.9
Campus 13 96 56.8 73 43.2
All campuses show a majority of teachers on their campus did not have a mentor
their first year of teaching (see Table 4.6). Campus 4 had the highest number of teachers
not having a mentor their first year (83.9%) (see Table 4.6).
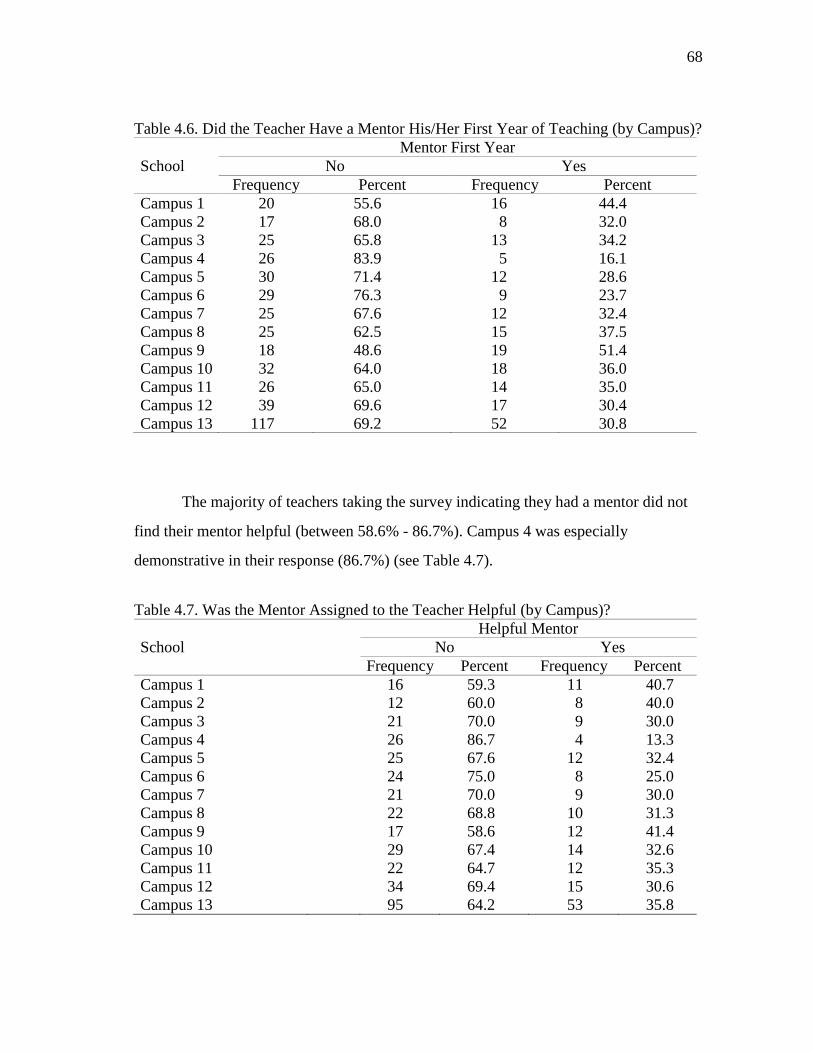
68
Table 4.6. Did the Teacher Have a Mentor His/Her First Year of Teaching (by Campus)?Mentor First Year
School No YesFrequency Percent Frequency Percent
Campus 1 20 55.6 16 44.4Campus 2 17 68.0 8 32.0Campus 3 25 65.8 13 34.2Campus 4 26 83.9 5 16.1Campus 5 30 71.4 12 28.6Campus 6 29 76.3 9 23.7Campus 7 25 67.6 12 32.4Campus 8 25 62.5 15 37.5Campus 9 18 48.6 19 51.4Campus 10 32 64.0 18 36.0Campus 11 26 65.0 14 35.0Campus 12 39 69.6 17 30.4Campus 13 117 69.2 52 30.8
The majority of teachers taking the survey indicating they had a mentor did not
find their mentor helpful (between 58.6% - 86.7%). Campus 4 was especially
demonstrative in their response (86.7%) (see Table 4.7).
Table 4.7. Was the Mentor Assigned to the Teacher Helpful (by Campus)?Helpful Mentor
School No YesFrequency Percent Frequency Percent
Campus 1 16 59.3 11 40.7Campus 2 12 60.0 8 40.0Campus 3 21 70.0 9 30.0Campus 4 26 86.7 4 13.3Campus 5 25 67.6 12 32.4Campus 6 24 75.0 8 25.0Campus 7 21 70.0 9 30.0Campus 8 22 68.8 10 31.3Campus 9 17 58.6 12 41.4Campus 10 29 67.4 14 32.6Campus 11 22 64.7 12 35.3Campus 12 34 69.4 15 30.6Campus 13 95 64.2 53 35.8
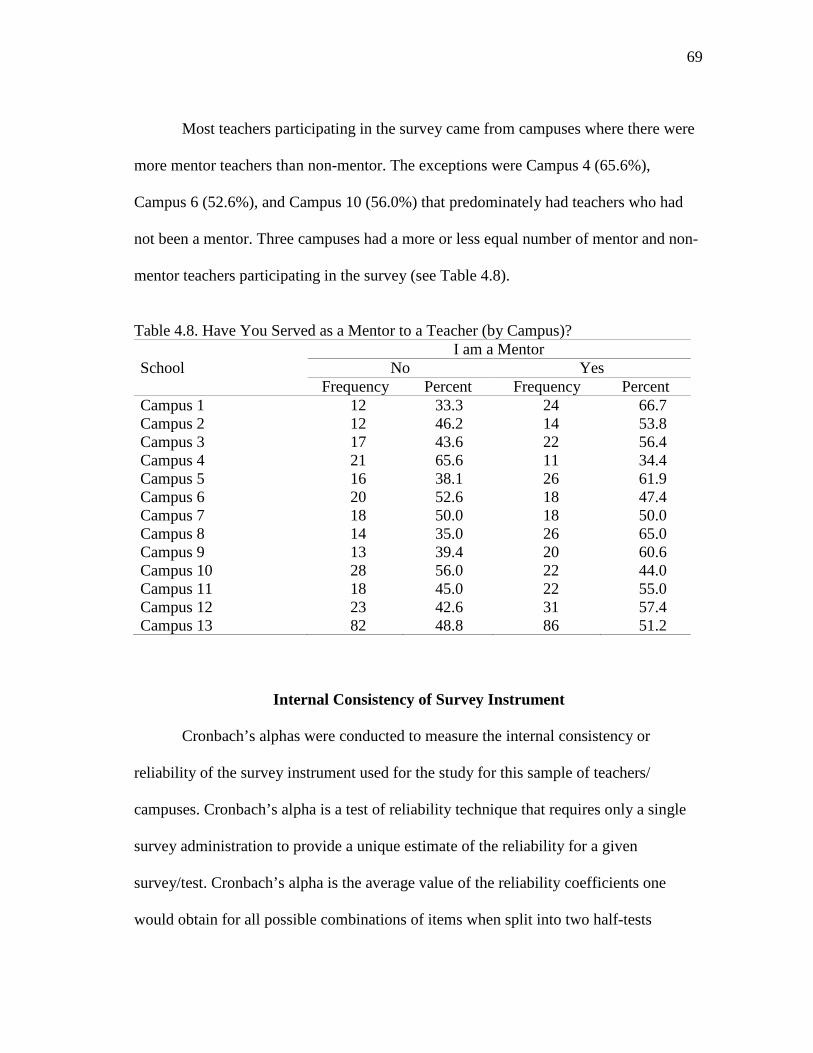
69
Most teachers participating in the survey came from campuses where there were
more mentor teachers than non-mentor. The exceptions were Campus 4 (65.6%),
Campus 6 (52.6%), and Campus 10 (56.0%) that predominately had teachers who had
not been a mentor. Three campuses had a more or less equal number of mentor and non-
mentor teachers participating in the survey (see Table 4.8).
Table 4.8. Have You Served as a Mentor to a Teacher (by Campus)?I am a Mentor
School No YesFrequency Percent Frequency Percent
Campus 1 12 33.3 24 66.7Campus 2 12 46.2 14 53.8Campus 3 17 43.6 22 56.4Campus 4 21 65.6 11 34.4Campus 5 16 38.1 26 61.9Campus 6 20 52.6 18 47.4Campus 7 18 50.0 18 50.0Campus 8 14 35.0 26 65.0Campus 9 13 39.4 20 60.6Campus 10 28 56.0 22 44.0Campus 11 18 45.0 22 55.0Campus 12 23 42.6 31 57.4Campus 13 82 48.8 86 51.2
Internal Consistency of Survey Instrument
Cronbach’s alphas were conducted to measure the internal consistency or
reliability of the survey instrument used for the study for this sample of teachers/
campuses. Cronbach’s alpha is a test of reliability technique that requires only a single
survey administration to provide a unique estimate of the reliability for a given
survey/test. Cronbach’s alpha is the average value of the reliability coefficients one
would obtain for all possible combinations of items when split into two half-tests
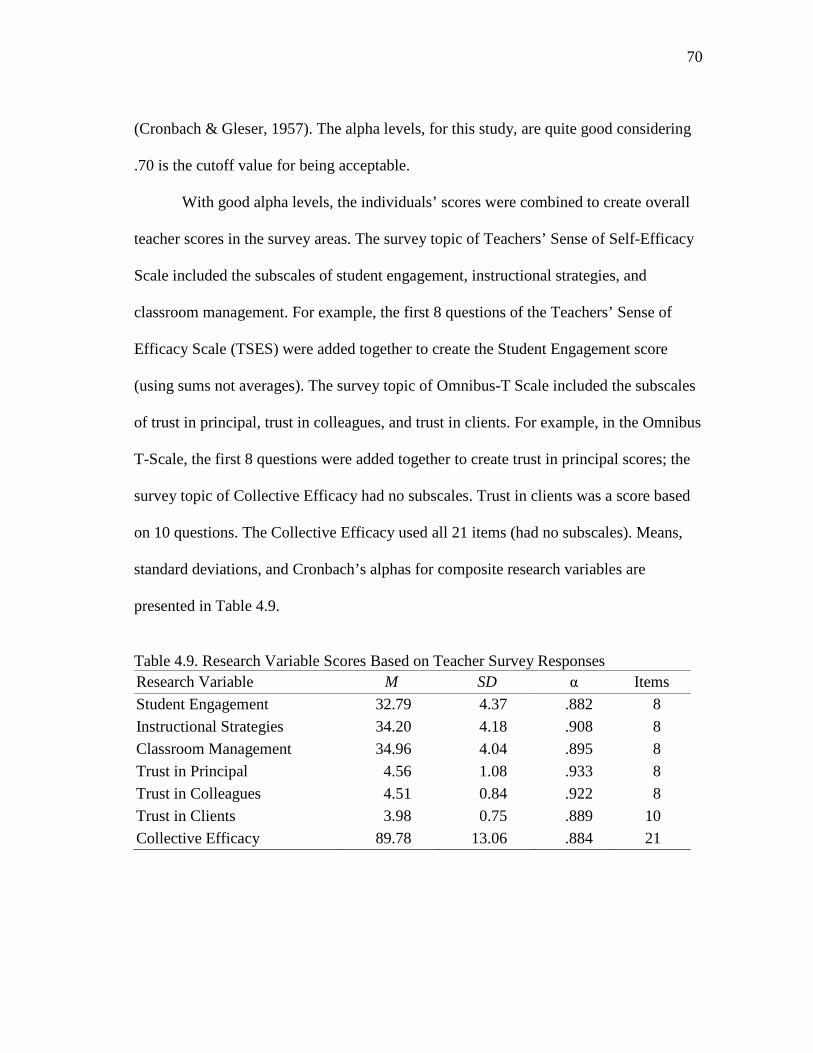
70
(Cronbach & Gleser, 1957). The alpha levels, for this study, are quite good considering
.70 is the cutoff value for being acceptable.
With good alpha levels, the individuals’ scores were combined to create overall
teacher scores in the survey areas. The survey topic of Teachers’ Sense of Self-Efficacy
Scale included the subscales of student engagement, instructional strategies, and
classroom management. For example, the first 8 questions of the Teachers’ Sense of
Efficacy Scale (TSES) were added together to create the Student Engagement score
(using sums not averages). The survey topic of Omnibus-T Scale included the subscales
of trust in principal, trust in colleagues, and trust in clients. For example, in the Omnibus
T-Scale, the first 8 questions were added together to create trust in principal scores; the
survey topic of Collective Efficacy had no subscales. Trust in clients was a score based
on 10 questions. The Collective Efficacy used all 21 items (had no subscales). Means,
standard deviations, and Cronbach’s alphas for composite research variables are
presented in Table 4.9.
Table 4.9. Research Variable Scores Based on Teacher Survey Responses
Research Variable M SD α Items
Student Engagement 32.79 4.37 .882 8
Instructional Strategies 34.20 4.18 .908 8
Classroom Management 34.96 4.04 .895 8
Trust in Principal 4.56 1.08 .933 8
Trust in Colleagues 4.51 0.84 .922 8
Trust in Clients 3.98 0.75 .889 10
Collective Efficacy 89.78 13.06 .884 21
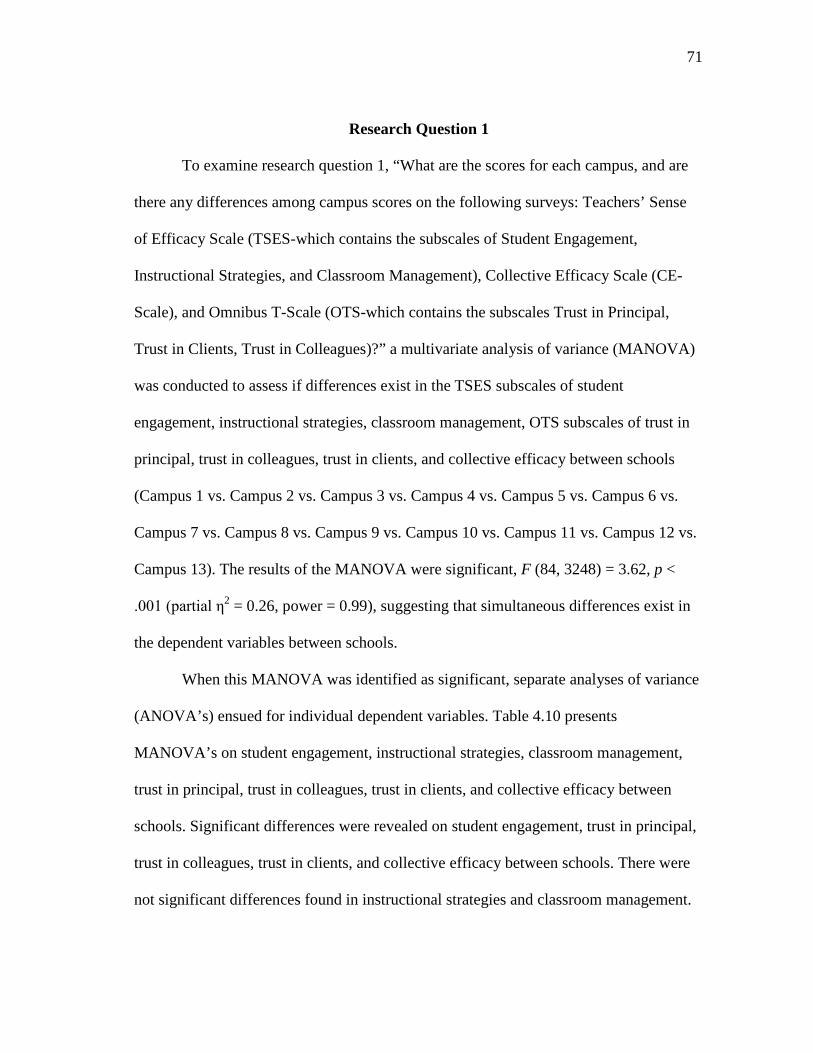
71
Research Question 1
To examine research question 1, “What are the scores for each campus, and are
there any differences among campus scores on the following surveys: Teachers’ Sense
of Efficacy Scale (TSES-which contains the subscales of Student Engagement,
Instructional Strategies, and Classroom Management), Collective Efficacy Scale (CE-
Scale), and Omnibus T-Scale (OTS-which contains the subscales Trust in Principal,
Trust in Clients, Trust in Colleagues)?” a multivariate analysis of variance (MANOVA)
was conducted to assess if differences exist in the TSES subscales of student
engagement, instructional strategies, classroom management, OTS subscales of trust in
principal, trust in colleagues, trust in clients, and collective efficacy between schools
(Campus 1 vs. Campus 2 vs. Campus 3 vs. Campus 4 vs. Campus 5 vs. Campus 6 vs.
Campus 7 vs. Campus 8 vs. Campus 9 vs. Campus 10 vs. Campus 11 vs. Campus 12 vs.
Campus 13). The results of the MANOVA were significant, F (84, 3248) = 3.62, p <
.001 (partial η2 = 0.26, power = 0.99), suggesting that simultaneous differences exist in
the dependent variables between schools.
When this MANOVA was identified as significant, separate analyses of variance
(ANOVA’s) ensued for individual dependent variables. Table 4.10 presents
MANOVA’s on student engagement, instructional strategies, classroom management,
trust in principal, trust in colleagues, trust in clients, and collective efficacy between
schools. Significant differences were revealed on student engagement, trust in principal,
trust in colleagues, trust in clients, and collective efficacy between schools. There were
not significant differences found in instructional strategies and classroom management.
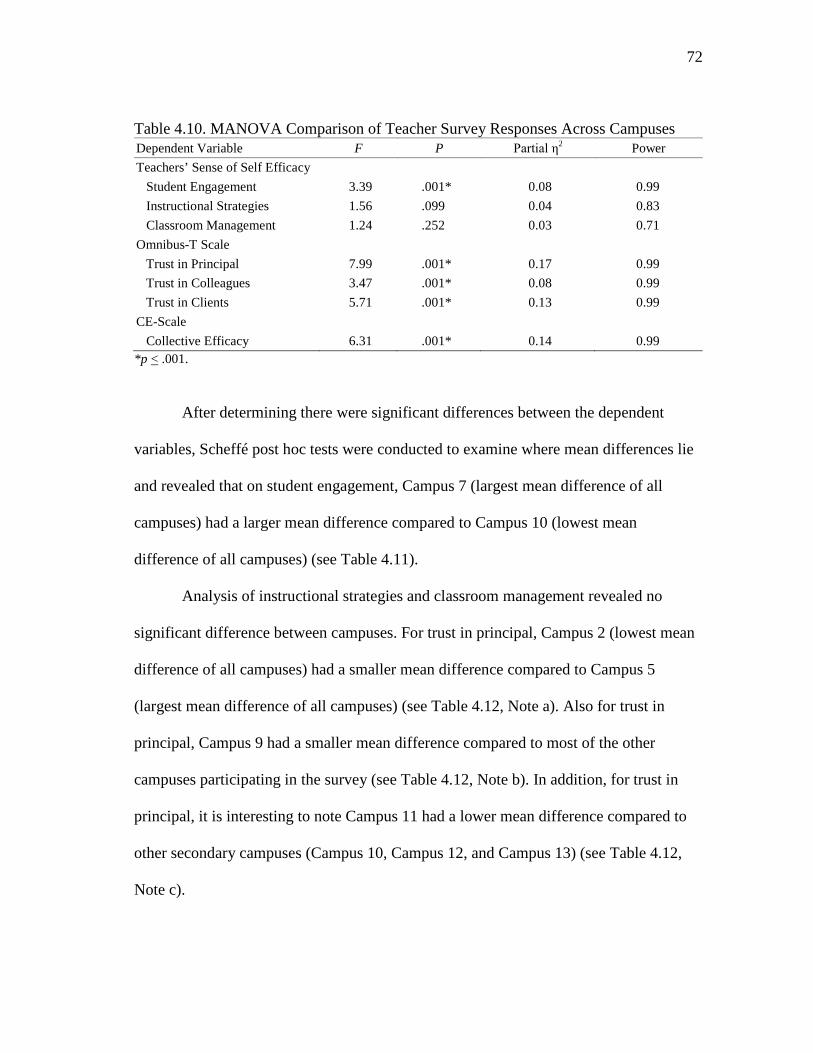
72
Table 4.10. MANOVA Comparison of Teacher Survey Responses Across CampusesDependent Variable F P Partial η2 Power
Teachers’ Sense of Self Efficacy
Student Engagement 3.39 .001* 0.08 0.99
Instructional Strategies 1.56 .099 0.04 0.83
Classroom Management 1.24 .252 0.03 0.71
Omnibus-T Scale
Trust in Principal 7.99 .001* 0.17 0.99
Trust in Colleagues 3.47 .001* 0.08 0.99
Trust in Clients 5.71 .001* 0.13 0.99
CE-Scale
Collective Efficacy 6.31 .001* 0.14 0.99
*p < .001.
After determining there were significant differences between the dependent
variables, Scheffé post hoc tests were conducted to examine where mean differences lie
and revealed that on student engagement, Campus 7 (largest mean difference of all
campuses) had a larger mean difference compared to Campus 10 (lowest mean
difference of all campuses) (see Table 4.11).
Analysis of instructional strategies and classroom management revealed no
significant difference between campuses. For trust in principal, Campus 2 (lowest mean
difference of all campuses) had a smaller mean difference compared to Campus 5
(largest mean difference of all campuses) (see Table 4.12, Note a). Also for trust in
principal, Campus 9 had a smaller mean difference compared to most of the other
campuses participating in the survey (see Table 4.12, Note b). In addition, for trust in
principal, it is interesting to note Campus 11 had a lower mean difference compared to
other secondary campuses (Campus 10, Campus 12, and Campus 13) (see Table 4.12,
Note c).
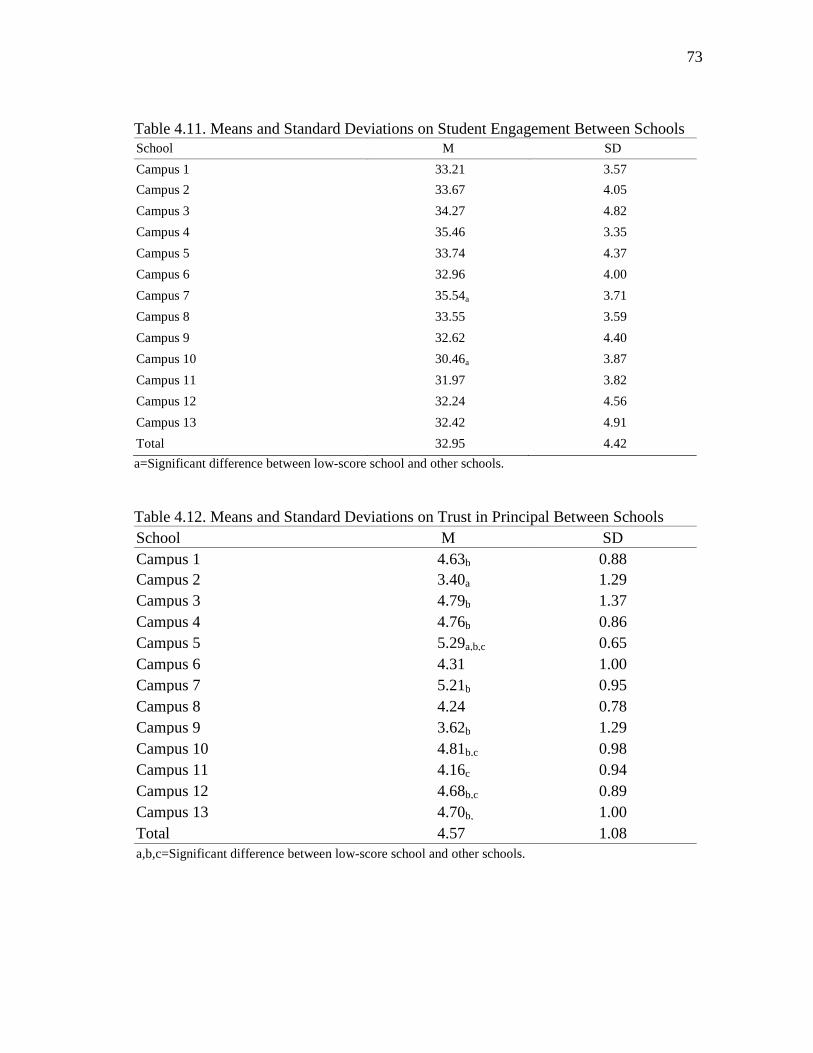
73
Table 4.11. Means and Standard Deviations on Student Engagement Between SchoolsSchool M SD
Campus 1 33.21 3.57
Campus 2 33.67 4.05
Campus 3 34.27 4.82
Campus 4 35.46 3.35
Campus 5 33.74 4.37
Campus 6 32.96 4.00
Campus 7 35.54a 3.71
Campus 8 33.55 3.59
Campus 9 32.62 4.40
Campus 10 30.46a 3.87
Campus 11 31.97 3.82
Campus 12 32.24 4.56
Campus 13 32.42 4.91
Total 32.95 4.42
a=Significant difference between low-score school and other schools.
Table 4.12. Means and Standard Deviations on Trust in Principal Between Schools
School M SD
Campus 1 4.63b 0.88
Campus 2 3.40a 1.29
Campus 3 4.79b 1.37
Campus 4 4.76b 0.86
Campus 5 5.29a,b,c 0.65
Campus 6 4.31 1.00
Campus 7 5.21b 0.95
Campus 8 4.24 0.78
Campus 9 3.62b 1.29
Campus 10 4.81b,c 0.98
Campus 11 4.16c 0.94
Campus 12 4.68b,c 0.89
Campus 13 4.70b, 1.00
Total 4.57 1.08a,b,c=Significant difference between low-score school and other schools.
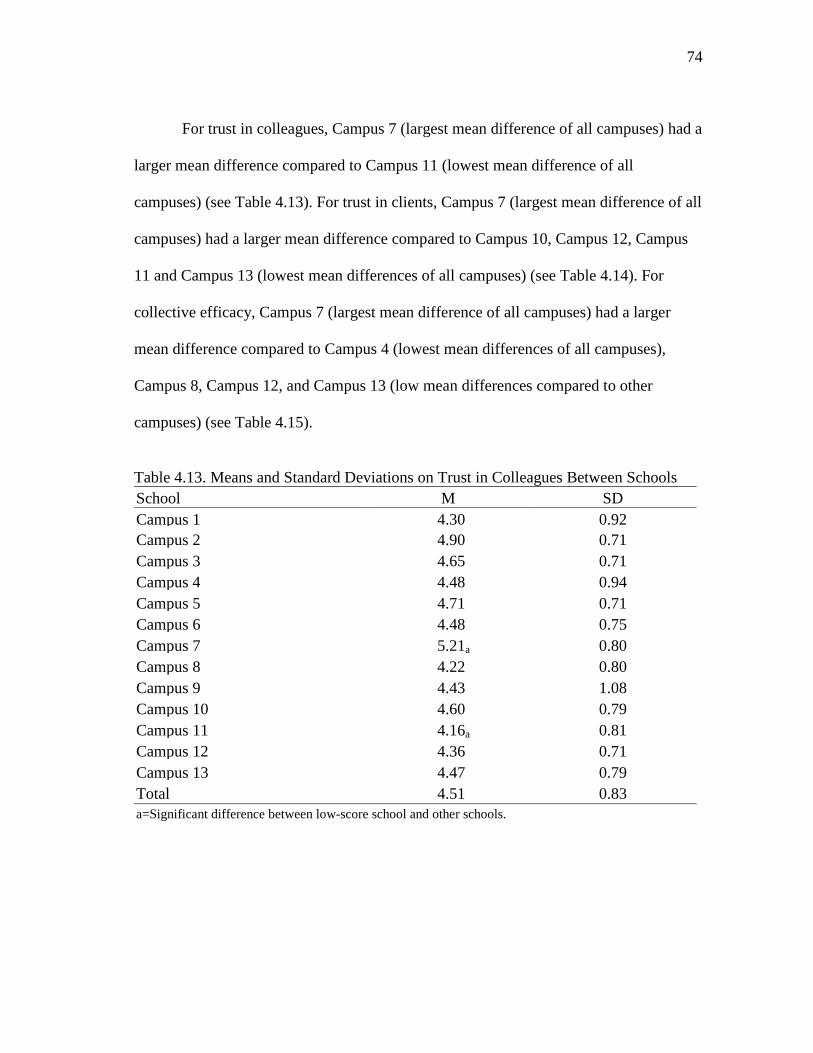
74
For trust in colleagues, Campus 7 (largest mean difference of all campuses) had a
larger mean difference compared to Campus 11 (lowest mean difference of all
campuses) (see Table 4.13). For trust in clients, Campus 7 (largest mean difference of all
campuses) had a larger mean difference compared to Campus 10, Campus 12, Campus
11 and Campus 13 (lowest mean differences of all campuses) (see Table 4.14). For
collective efficacy, Campus 7 (largest mean difference of all campuses) had a larger
mean difference compared to Campus 4 (lowest mean differences of all campuses),
Campus 8, Campus 12, and Campus 13 (low mean differences compared to other
campuses) (see Table 4.15).
Table 4.13. Means and Standard Deviations on Trust in Colleagues Between Schools
School M SD
Campus 1 4.30 0.92
Campus 2 4.90 0.71
Campus 3 4.65 0.71
Campus 4 4.48 0.94
Campus 5 4.71 0.71
Campus 6 4.48 0.75
Campus 7 5.21a 0.80
Campus 8 4.22 0.80
Campus 9 4.43 1.08
Campus 10 4.60 0.79
Campus 11 4.16a 0.81
Campus 12 4.36 0.71
Campus 13 4.47 0.79
Total 4.51 0.83a=Significant difference between low-score school and other schools.
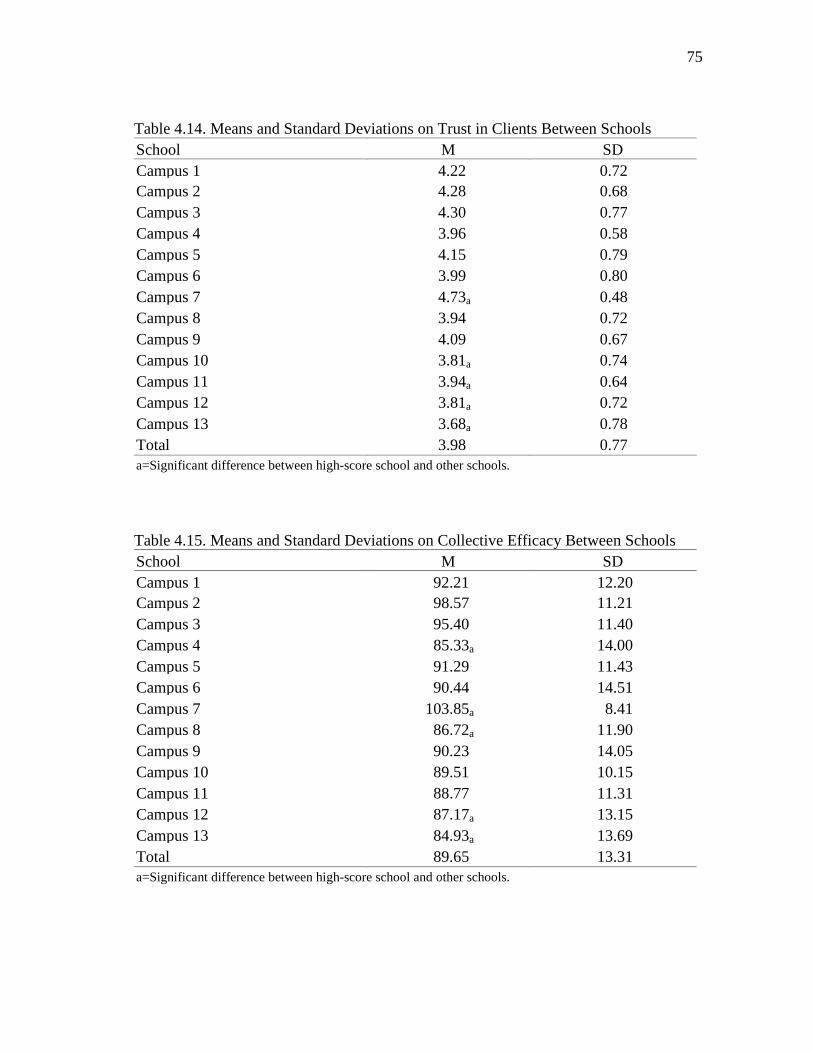
75
Table 4.14. Means and Standard Deviations on Trust in Clients Between Schools
School M SD
Campus 1 4.22 0.72
Campus 2 4.28 0.68
Campus 3 4.30 0.77
Campus 4 3.96 0.58
Campus 5 4.15 0.79
Campus 6 3.99 0.80
Campus 7 4.73a 0.48
Campus 8 3.94 0.72
Campus 9 4.09 0.67
Campus 10 3.81a 0.74
Campus 11 3.94a 0.64
Campus 12 3.81a 0.72
Campus 13 3.68a 0.78
Total 3.98 0.77a=Significant difference between high-score school and other schools.
Table 4.15. Means and Standard Deviations on Collective Efficacy Between Schools
School M SD
Campus 1 92.21 12.20
Campus 2 98.57 11.21
Campus 3 95.40 11.40
Campus 4 85.33a 14.00
Campus 5 91.29 11.43
Campus 6 90.44 14.51
Campus 7 103.85a 8.41
Campus 8 86.72a 11.90
Campus 9 90.23 14.05
Campus 10 89.51 10.15
Campus 11 88.77 11.31
Campus 12 87.17a 13.15
Campus 13 84.93a 13.69
Total 89.65 13.31a=Significant difference between high-score school and other schools.
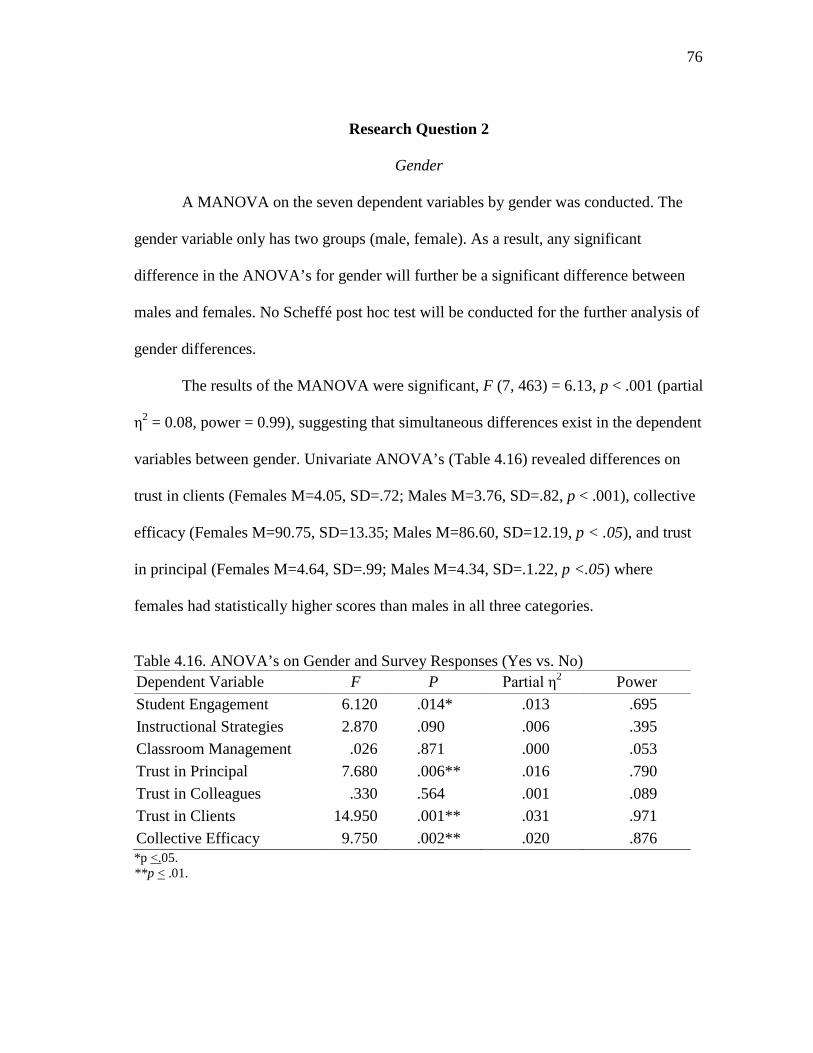
76
Research Question 2
Gender
A MANOVA on the seven dependent variables by gender was conducted. The
gender variable only has two groups (male, female). As a result, any significant
difference in the ANOVA’s for gender will further be a significant difference between
males and females. No Scheffé post hoc test will be conducted for the further analysis of
gender differences.
The results of the MANOVA were significant, F (7, 463) = 6.13, p < .001 (partial
η2 = 0.08, power = 0.99), suggesting that simultaneous differences exist in the dependent
variables between gender. Univariate ANOVA’s (Table 4.16) revealed differences on
trust in clients (Females M=4.05, SD=.72; Males M=3.76, SD=.82, p < .001), collective
efficacy (Females M=90.75, SD=13.35; Males M=86.60, SD=12.19, p < .05), and trust
in principal (Females M=4.64, SD=.99; Males M=4.34, SD=.1.22, p <.05) where
females had statistically higher scores than males in all three categories.
Table 4.16. ANOVA’s on Gender and Survey Responses (Yes vs. No)
Dependent Variable F P Partial η2 Power
Student Engagement 6.120 .014* .013 .695
Instructional Strategies 2.870 .090 .006 .395
Classroom Management .026 .871 .000 .053
Trust in Principal 7.680 .006** .016 .790
Trust in Colleagues .330 .564 .001 .089
Trust in Clients 14.950 .001** .031 .971
Collective Efficacy 9.750 .002** .020 .876*p <.05.**p < .01.
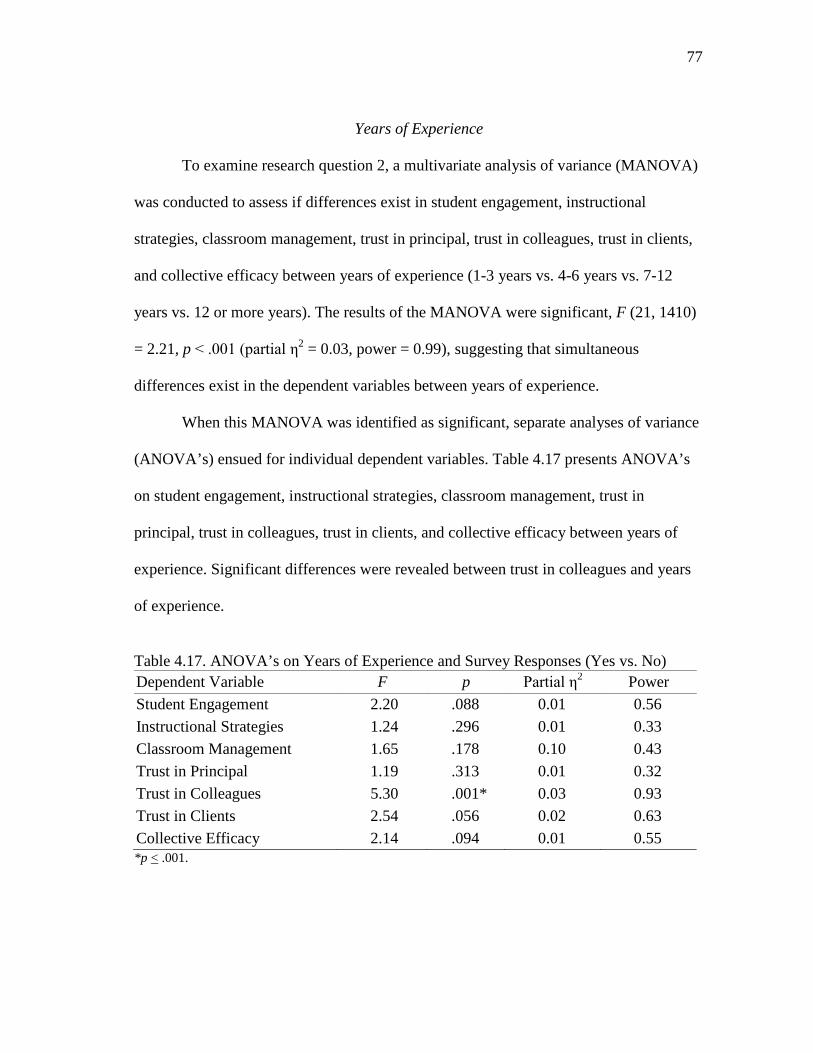
77
Years of Experience
To examine research question 2, a multivariate analysis of variance (MANOVA)
was conducted to assess if differences exist in student engagement, instructional
strategies, classroom management, trust in principal, trust in colleagues, trust in clients,
and collective efficacy between years of experience (1-3 years vs. 4-6 years vs. 7-12
years vs. 12 or more years). The results of the MANOVA were significant, F (21, 1410)
= 2.21, p < .001 (partial η2 = 0.03, power = 0.99), suggesting that simultaneous
differences exist in the dependent variables between years of experience.
When this MANOVA was identified as significant, separate analyses of variance
(ANOVA’s) ensued for individual dependent variables. Table 4.17 presents ANOVA’s
on student engagement, instructional strategies, classroom management, trust in
principal, trust in colleagues, trust in clients, and collective efficacy between years of
experience. Significant differences were revealed between trust in colleagues and years
of experience.
Table 4.17. ANOVA’s on Years of Experience and Survey Responses (Yes vs. No)
Dependent Variable F p Partial η2 Power
Student Engagement 2.20 .088 0.01 0.56
Instructional Strategies 1.24 .296 0.01 0.33
Classroom Management 1.65 .178 0.10 0.43
Trust in Principal 1.19 .313 0.01 0.32
Trust in Colleagues 5.30 .001* 0.03 0.93
Trust in Clients 2.54 .056 0.02 0.63
Collective Efficacy 2.14 .094 0.01 0.55*p < .001.
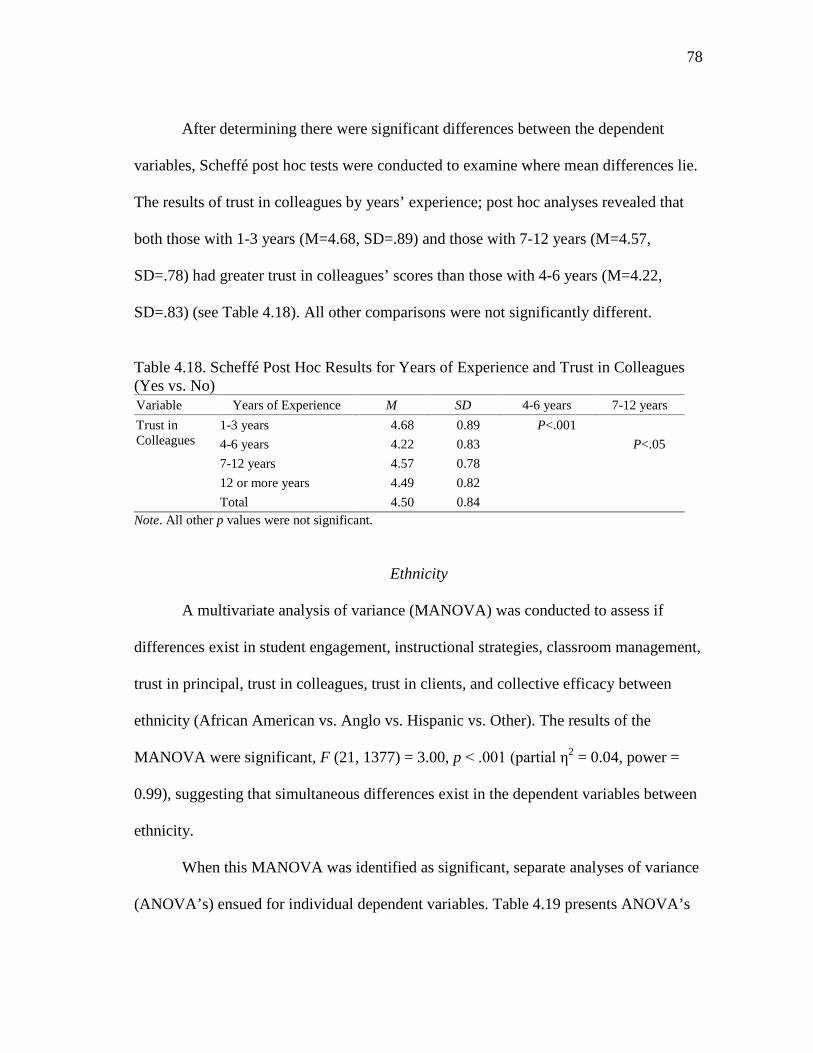
78
After determining there were significant differences between the dependent
variables, Scheffé post hoc tests were conducted to examine where mean differences lie.
The results of trust in colleagues by years’ experience; post hoc analyses revealed that
both those with 1-3 years (M=4.68, SD=.89) and those with 7-12 years (M=4.57,
SD=.78) had greater trust in colleagues’ scores than those with 4-6 years (M=4.22,
SD=.83) (see Table 4.18). All other comparisons were not significantly different.
Table 4.18. Scheffé Post Hoc Results for Years of Experience and Trust in Colleagues(Yes vs. No)Variable Years of Experience M SD 4-6 years 7-12 years
Trust inColleagues
1-3 years 4.68 0.89 P<.001
4-6 years 4.22 0.83 P<.05
7-12 years 4.57 0.78
12 or more years 4.49 0.82
Total 4.50 0.84
Note. All other p values were not significant.
Ethnicity
A multivariate analysis of variance (MANOVA) was conducted to assess if
differences exist in student engagement, instructional strategies, classroom management,
trust in principal, trust in colleagues, trust in clients, and collective efficacy between
ethnicity (African American vs. Anglo vs. Hispanic vs. Other). The results of the
MANOVA were significant, F (21, 1377) = 3.00, p < .001 (partial η2 = 0.04, power =
0.99), suggesting that simultaneous differences exist in the dependent variables between
ethnicity.
When this MANOVA was identified as significant, separate analyses of variance
(ANOVA’s) ensued for individual dependent variables. Table 4.19 presents ANOVA’s
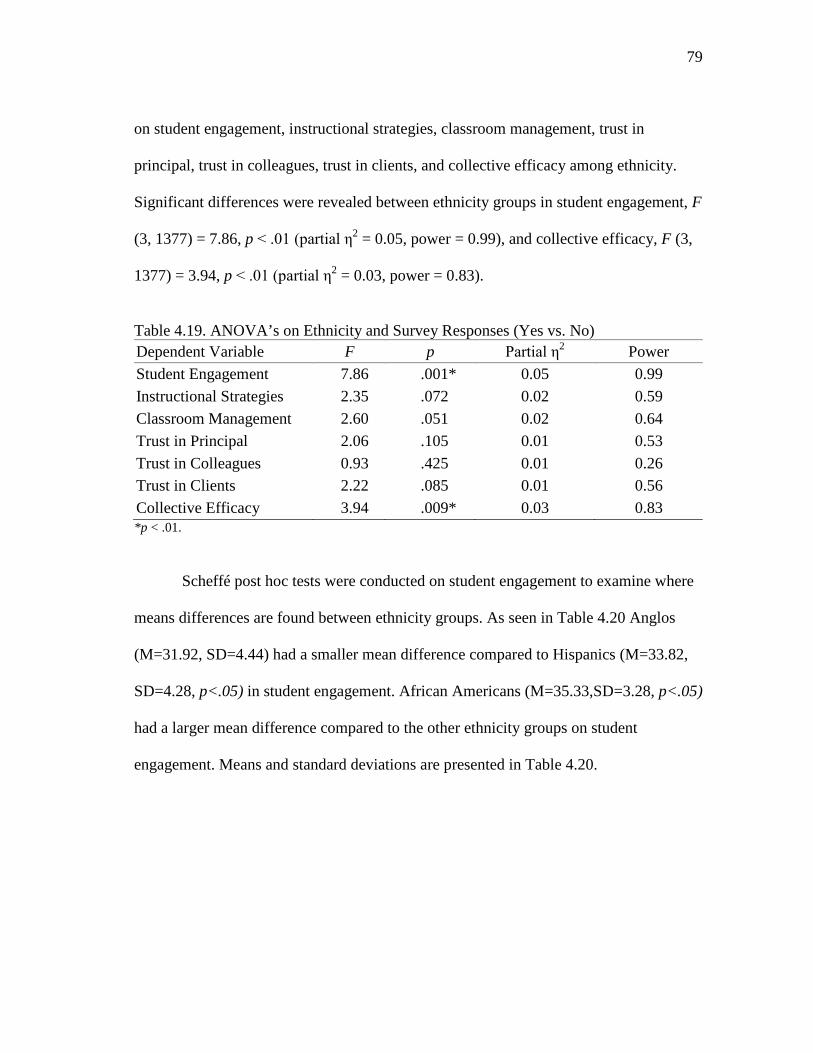
79
on student engagement, instructional strategies, classroom management, trust in
principal, trust in colleagues, trust in clients, and collective efficacy among ethnicity.
Significant differences were revealed between ethnicity groups in student engagement, F
(3, 1377) = 7.86, p < .01 (partial η2 = 0.05, power = 0.99), and collective efficacy, F (3,
1377) = 3.94, p < .01 (partial η2 = 0.03, power = 0.83).
Table 4.19. ANOVA’s on Ethnicity and Survey Responses (Yes vs. No)
Dependent Variable F p Partial η2 Power
Student Engagement 7.86 .001* 0.05 0.99
Instructional Strategies 2.35 .072 0.02 0.59
Classroom Management 2.60 .051 0.02 0.64
Trust in Principal 2.06 .105 0.01 0.53
Trust in Colleagues 0.93 .425 0.01 0.26
Trust in Clients 2.22 .085 0.01 0.56
Collective Efficacy 3.94 .009* 0.03 0.83*p < .01.
Scheffé post hoc tests were conducted on student engagement to examine where
means differences are found between ethnicity groups. As seen in Table 4.20 Anglos
(M=31.92, SD=4.44) had a smaller mean difference compared to Hispanics (M=33.82,
SD=4.28, p<.05) in student engagement. African Americans (M=35.33,SD=3.28, p<.05)
had a larger mean difference compared to the other ethnicity groups on student
engagement. Means and standard deviations are presented in Table 4.20.
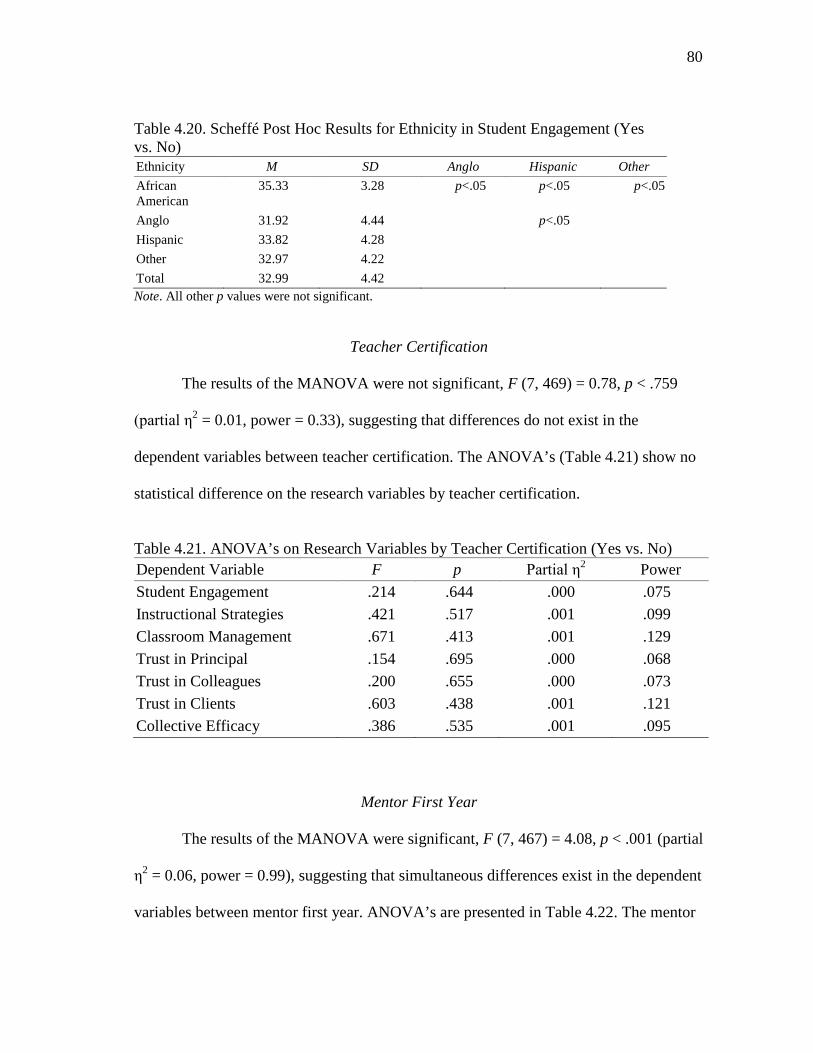
80
Table 4.20. Scheffé Post Hoc Results for Ethnicity in Student Engagement (Yesvs. No)Ethnicity M SD Anglo Hispanic Other
AfricanAmerican
35.33 3.28 p<.05 p<.05 p<.05
Anglo 31.92 4.44 p<.05
Hispanic 33.82 4.28
Other 32.97 4.22
Total 32.99 4.42
Note. All other p values were not significant.
Teacher Certification
The results of the MANOVA were not significant, F (7, 469) = 0.78, p < .759
(partial η2 = 0.01, power = 0.33), suggesting that differences do not exist in the
dependent variables between teacher certification. The ANOVA’s (Table 4.21) show no
statistical difference on the research variables by teacher certification.
Table 4.21. ANOVA’s on Research Variables by Teacher Certification (Yes vs. No)
Dependent Variable F p Partial η2 Power
Student Engagement .214 .644 .000 .075
Instructional Strategies .421 .517 .001 .099
Classroom Management .671 .413 .001 .129
Trust in Principal .154 .695 .000 .068
Trust in Colleagues .200 .655 .000 .073
Trust in Clients .603 .438 .001 .121
Collective Efficacy .386 .535 .001 .095
Mentor First Year
The results of the MANOVA were significant, F (7, 467) = 4.08, p < .001 (partial
η2 = 0.06, power = 0.99), suggesting that simultaneous differences exist in the dependent
variables between mentor first year. ANOVA’s are presented in Table 4.22. The mentor
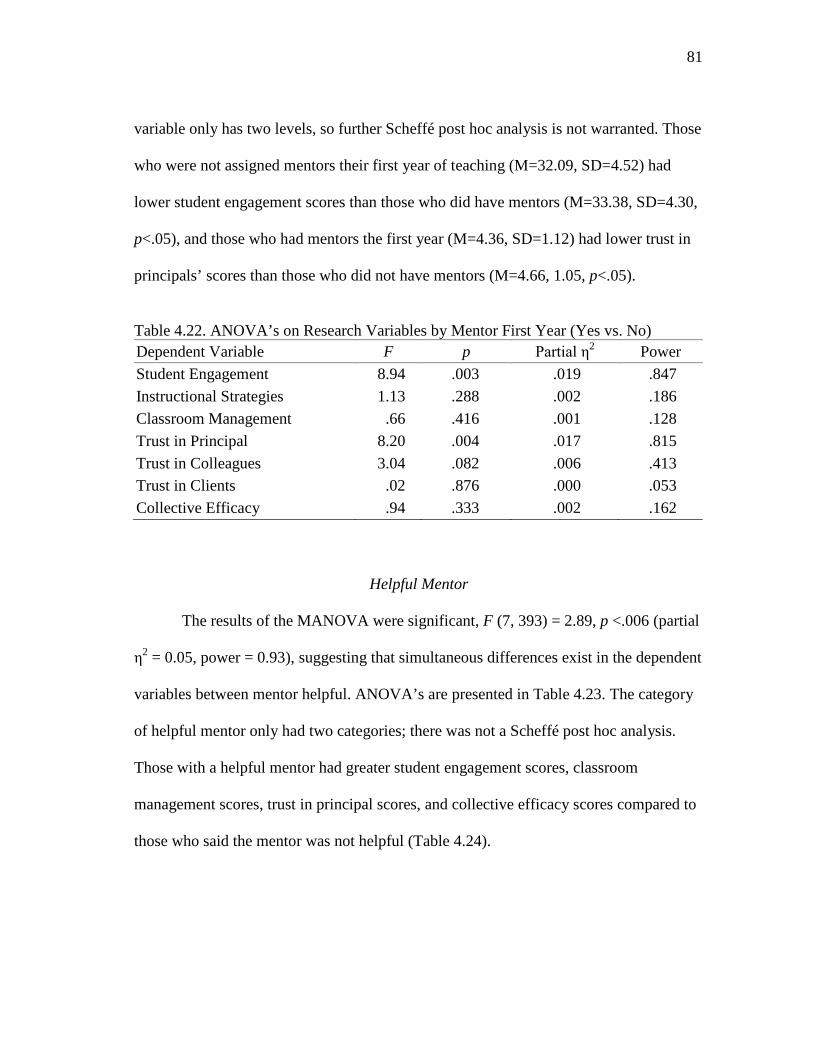
81
variable only has two levels, so further Scheffé post hoc analysis is not warranted. Those
who were not assigned mentors their first year of teaching (M=32.09, SD=4.52) had
lower student engagement scores than those who did have mentors (M=33.38, SD=4.30,
p<.05), and those who had mentors the first year (M=4.36, SD=1.12) had lower trust in
principals’ scores than those who did not have mentors (M=4.66, 1.05, p<.05).
Table 4.22. ANOVA’s on Research Variables by Mentor First Year (Yes vs. No)
Dependent Variable F p Partial η2 Power
Student Engagement 8.94 .003 .019 .847
Instructional Strategies 1.13 .288 .002 .186
Classroom Management .66 .416 .001 .128
Trust in Principal 8.20 .004 .017 .815
Trust in Colleagues 3.04 .082 .006 .413
Trust in Clients .02 .876 .000 .053
Collective Efficacy .94 .333 .002 .162
Helpful Mentor
The results of the MANOVA were significant, F (7, 393) = 2.89, p <.006 (partial
η2 = 0.05, power = 0.93), suggesting that simultaneous differences exist in the dependent
variables between mentor helpful. ANOVA’s are presented in Table 4.23. The category
of helpful mentor only had two categories; there was not a Scheffé post hoc analysis.
Those with a helpful mentor had greater student engagement scores, classroom
management scores, trust in principal scores, and collective efficacy scores compared to
those who said the mentor was not helpful (Table 4.24).
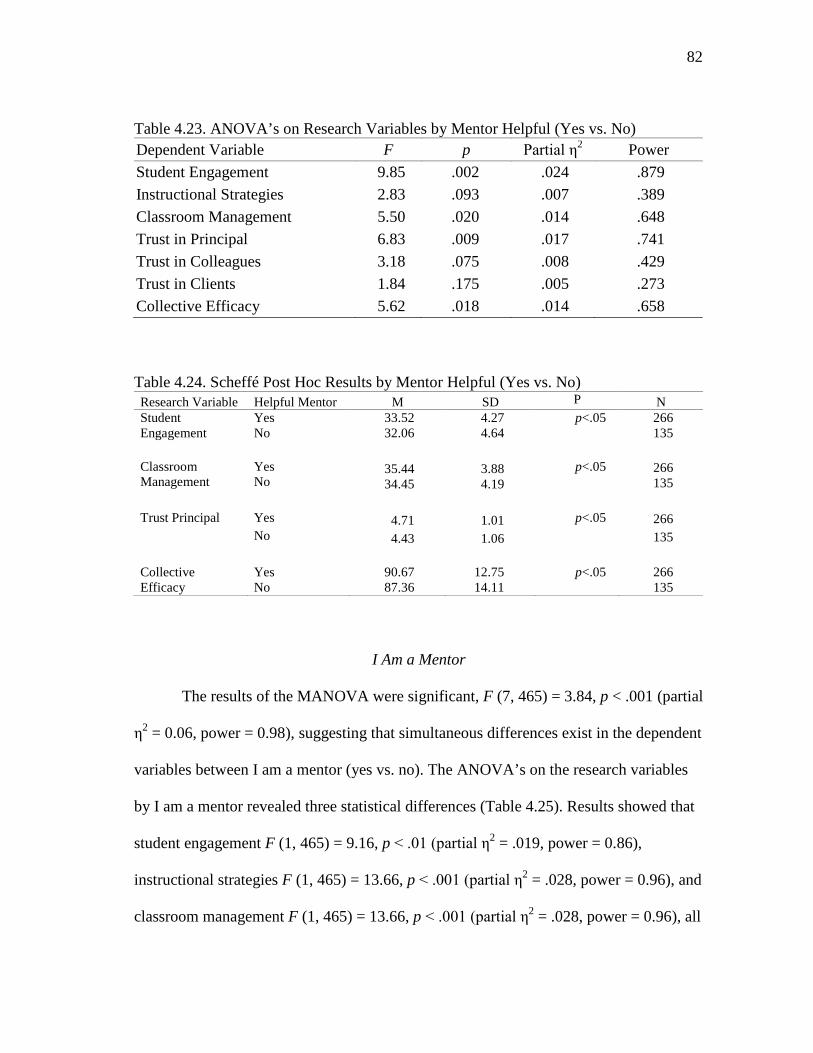
82
Table 4.23. ANOVA’s on Research Variables by Mentor Helpful (Yes vs. No)
Dependent Variable F p Partial η2 Power
Student Engagement 9.85 .002 .024 .879
Instructional Strategies 2.83 .093 .007 .389
Classroom Management 5.50 .020 .014 .648
Trust in Principal 6.83 .009 .017 .741
Trust in Colleagues 3.18 .075 .008 .429
Trust in Clients 1.84 .175 .005 .273
Collective Efficacy 5.62 .018 .014 .658
Table 4.24. Scheffé Post Hoc Results by Mentor Helpful (Yes vs. No)Research Variable Helpful Mentor M SD P NStudentEngagement
YesNo
33.5232.06
4.274.64
p<.05 266135
ClassroomManagement
YesNo
35.4434.45
3.884.19
p<.05 266135
Trust Principal Yes 4.71 1.01 p<.05 266
No 4.43 1.06 135
CollectiveEfficacy
YesNo
90.6787.36
12.7514.11
p<.05 266135
I Am a Mentor
The results of the MANOVA were significant, F (7, 465) = 3.84, p < .001 (partial
η2 = 0.06, power = 0.98), suggesting that simultaneous differences exist in the dependent
variables between I am a mentor (yes vs. no). The ANOVA’s on the research variables
by I am a mentor revealed three statistical differences (Table 4.25). Results showed that
student engagement F (1, 465) = 9.16, p < .01 (partial η2 = .019, power = 0.86),
instructional strategies F (1, 465) = 13.66, p < .001 (partial η2 = .028, power = 0.96), and
classroom management F (1, 465) = 13.66, p < .001 (partial η2 = .028, power = 0.96), all
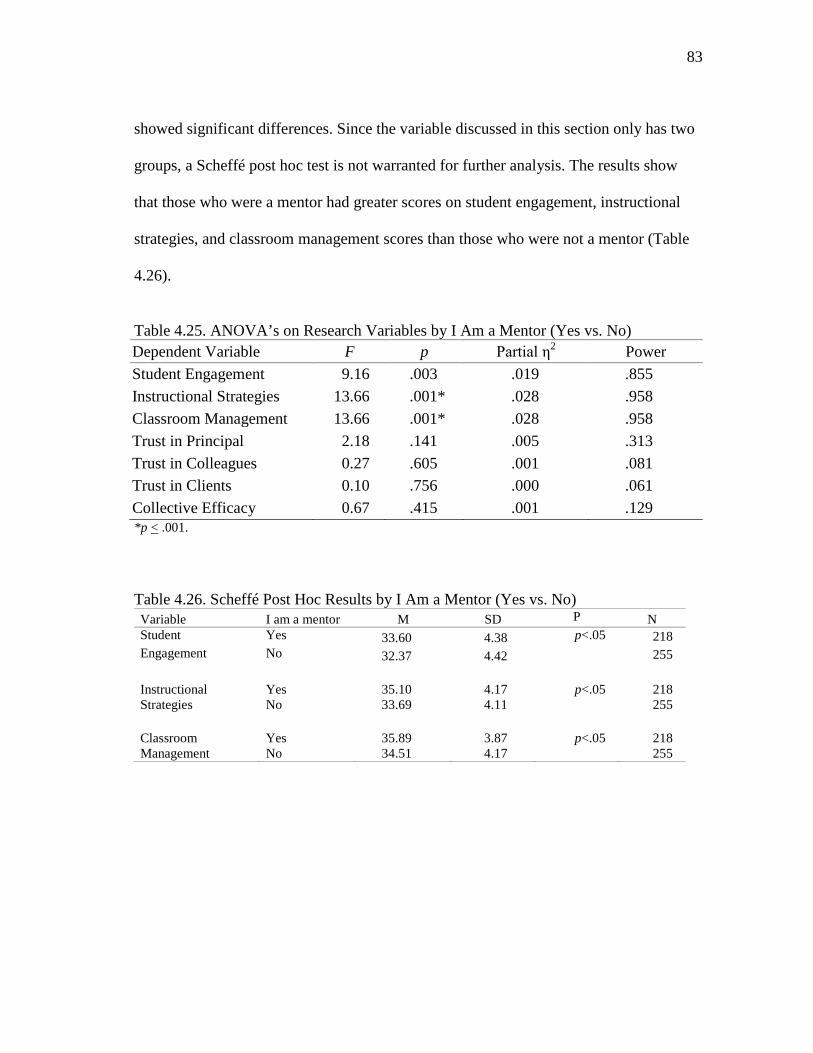
83
showed significant differences. Since the variable discussed in this section only has two
groups, a Scheffé post hoc test is not warranted for further analysis. The results show
that those who were a mentor had greater scores on student engagement, instructional
strategies, and classroom management scores than those who were not a mentor (Table
4.26).
Table 4.25. ANOVA’s on Research Variables by I Am a Mentor (Yes vs. No)
Dependent Variable F p Partial η2 Power
Student Engagement 9.16 .003 .019 .855
Instructional Strategies 13.66 .001* .028 .958
Classroom Management 13.66 .001* .028 .958
Trust in Principal 2.18 .141 .005 .313
Trust in Colleagues 0.27 .605 .001 .081
Trust in Clients 0.10 .756 .000 .061
Collective Efficacy 0.67 .415 .001 .129*p < .001.
Table 4.26. Scheffé Post Hoc Results by I Am a Mentor (Yes vs. No)Variable I am a mentor M SD P NStudent Yes 33.60 4.38 p<.05 218
Engagement No 32.37 4.42 255
InstructionalStrategies
YesNo
35.1033.69
4.174.11
p<.05 218255
ClassroomManagement
YesNo
35.8934.51
3.874.17
p<.05 218255
84
Research Question 3
To answer research question 3, an analysis was done for each survey. The
Teachers’ Sense of Efficacy Scale was tested for its reliability and validity to measure
teacher efficacy. The other two surveys that had also been combined into the instrument
for the study were scored and standardized scores for each campus were produced. With
these new scores, the responses were compared to normal scores on the surveys.
Teachers’ Sense of Efficacy Scale (TSES)
In accordance with previous research done in this field (Tschannen-Moran &
Woolfolk Hoy, 2001), the Teachers’ Sense of Efficacy Scale was adjusted to compare
them to average scores for the surveys. The unweighted means were determined for the
items that load on each factor, given a “unweighted mean score” (unWM). These mean
scores could then be compared to the surveys’ “standardized mean scores” (StandM) to
give a comparison between campuses and national averages.
In student engagement, overall campuses mean (umWM) were below the
standard mean (StanM) calculated by developers of the instrument, suggesting the
teachers from all schools had less confidence in their ability to engage students in
learning. The same was true for instructional strategies. Teachers had less confidence in
their instructional strategies at all schools compared to the standard mean (StanM). For
classroom management, campus teachers had an overall mean that was higher than the
standard mean calculated by developers of the instrument. This suggests the teachers
studied feel they have firm control of their classroom management (see Table 4.27).
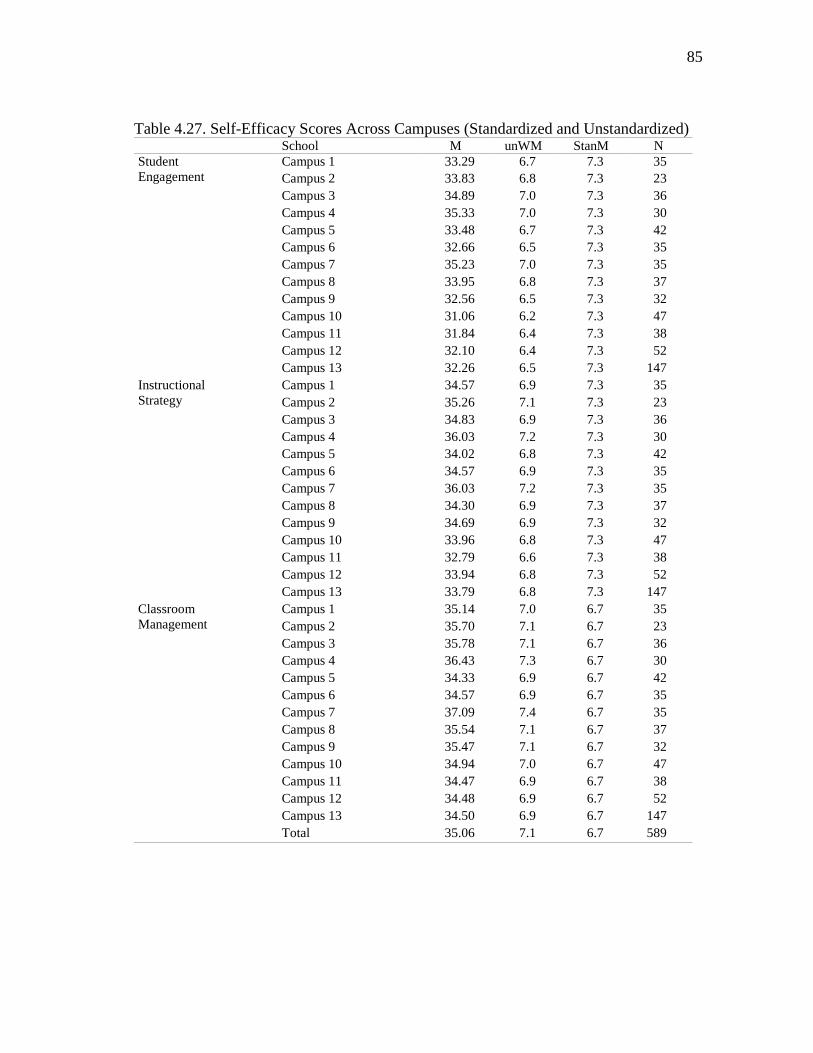
85
Table 4.27. Self-Efficacy Scores Across Campuses (Standardized and Unstandardized)School M unWM StanM N
StudentEngagement
Campus 1 33.29 6.7 7.3 35
Campus 2 33.83 6.8 7.3 23
Campus 3 34.89 7.0 7.3 36
Campus 4 35.33 7.0 7.3 30
Campus 5 33.48 6.7 7.3 42
Campus 6 32.66 6.5 7.3 35
Campus 7 35.23 7.0 7.3 35
Campus 8 33.95 6.8 7.3 37
Campus 9 32.56 6.5 7.3 32
Campus 10 31.06 6.2 7.3 47
Campus 11 31.84 6.4 7.3 38
Campus 12 32.10 6.4 7.3 52
Campus 13 32.26 6.5 7.3 147
InstructionalStrategy
Campus 1 34.57 6.9 7.3 35
Campus 2 35.26 7.1 7.3 23
Campus 3 34.83 6.9 7.3 36
Campus 4 36.03 7.2 7.3 30
Campus 5 34.02 6.8 7.3 42
Campus 6 34.57 6.9 7.3 35
Campus 7 36.03 7.2 7.3 35
Campus 8 34.30 6.9 7.3 37
Campus 9 34.69 6.9 7.3 32
Campus 10 33.96 6.8 7.3 47
Campus 11 32.79 6.6 7.3 38
Campus 12 33.94 6.8 7.3 52
Campus 13 33.79 6.8 7.3 147
ClassroomManagement
Campus 1 35.14 7.0 6.7 35
Campus 2 35.70 7.1 6.7 23
Campus 3 35.78 7.1 6.7 36
Campus 4 36.43 7.3 6.7 30
Campus 5 34.33 6.9 6.7 42
Campus 6 34.57 6.9 6.7 35
Campus 7 37.09 7.4 6.7 35
Campus 8 35.54 7.1 6.7 37
Campus 9 35.47 7.1 6.7 32
Campus 10 34.94 7.0 6.7 47
Campus 11 34.47 6.9 6.7 38
Campus 12 34.48 6.9 6.7 52
Campus 13 34.50 6.9 6.7 147
Total 35.06 7.1 6.7 589
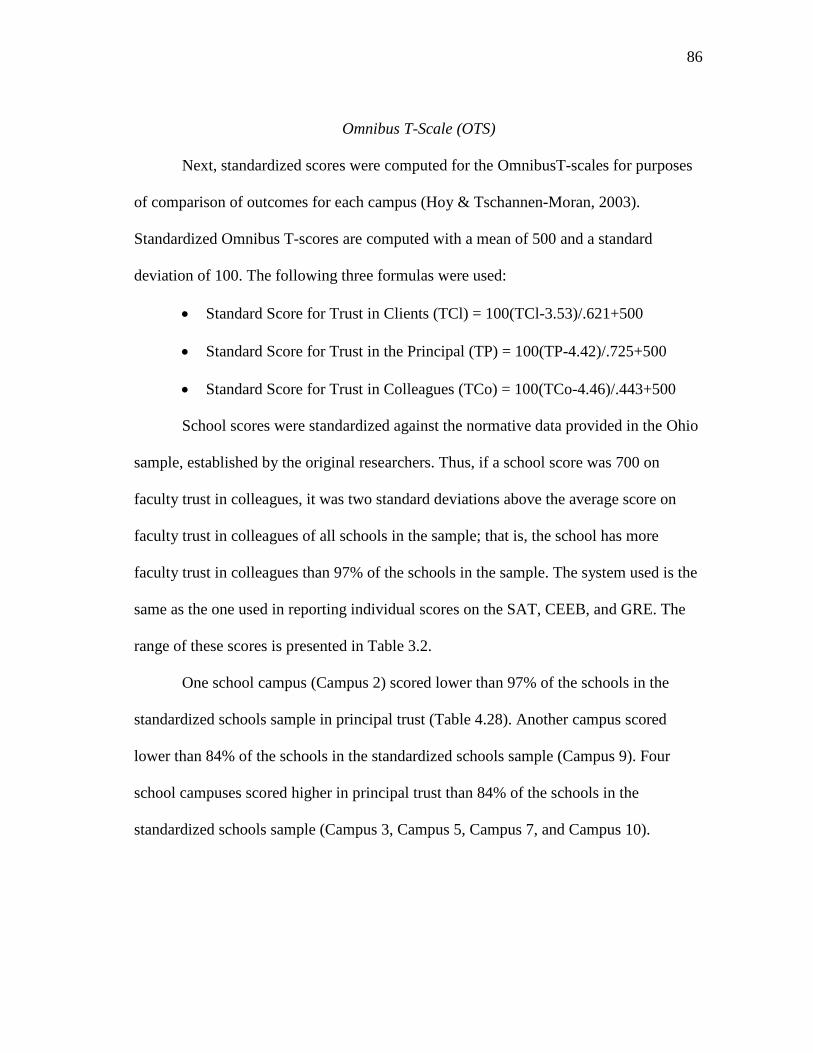
86
Omnibus T-Scale (OTS)
Next, standardized scores were computed for the OmnibusT-scales for purposes
of comparison of outcomes for each campus (Hoy & Tschannen-Moran, 2003).
Standardized Omnibus T-scores are computed with a mean of 500 and a standard
deviation of 100. The following three formulas were used:
Standard Score for Trust in Clients (TCl) = 100(TCl-3.53)/.621+500
Standard Score for Trust in the Principal (TP) = 100(TP-4.42)/.725+500
Standard Score for Trust in Colleagues (TCo) = 100(TCo-4.46)/.443+500
School scores were standardized against the normative data provided in the Ohio
sample, established by the original researchers. Thus, if a school score was 700 on
faculty trust in colleagues, it was two standard deviations above the average score on
faculty trust in colleagues of all schools in the sample; that is, the school has more
faculty trust in colleagues than 97% of the schools in the sample. The system used is the
same as the one used in reporting individual scores on the SAT, CEEB, and GRE. The
range of these scores is presented in Table 3.2.
One school campus (Campus 2) scored lower than 97% of the schools in the
standardized schools sample in principal trust (Table 4.28). Another campus scored
lower than 84% of the schools in the standardized schools sample (Campus 9). Four
school campuses scored higher in principal trust than 84% of the schools in the
standardized schools sample (Campus 3, Campus 5, Campus 7, and Campus 10).
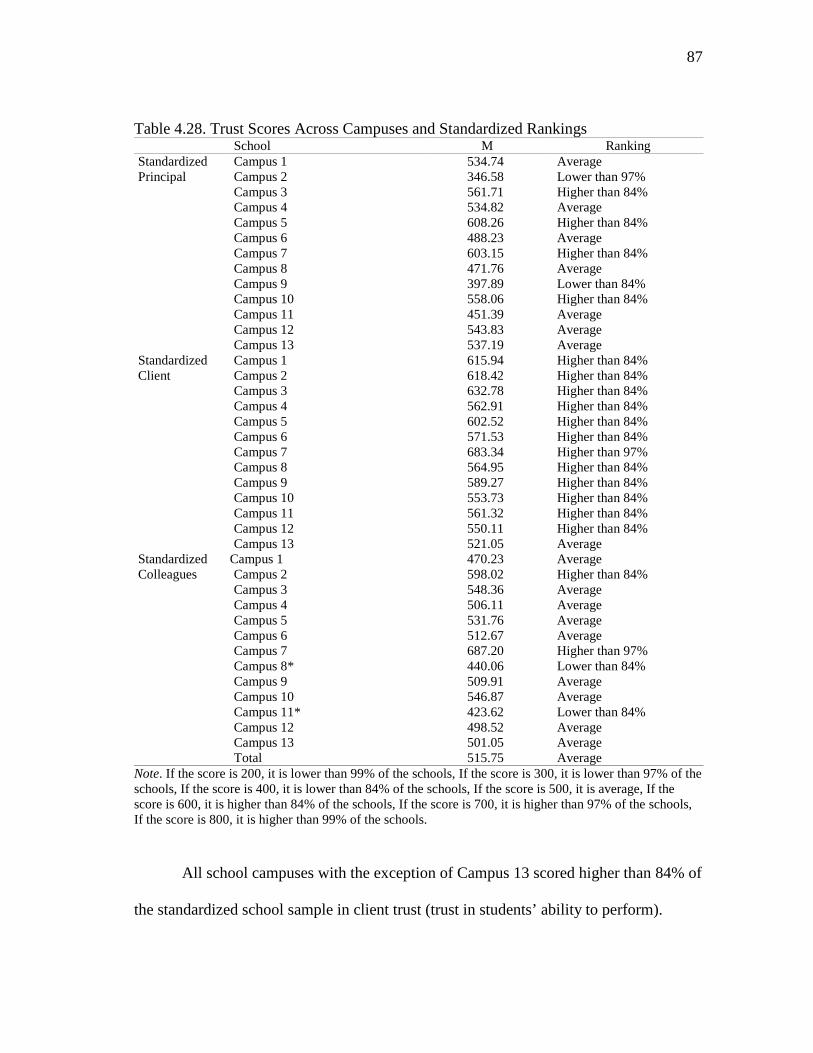
87
Table 4.28. Trust Scores Across Campuses and Standardized RankingsSchool M Ranking
StandardizedPrincipal
Campus 1 534.74 AverageCampus 2 346.58 Lower than 97%Campus 3 561.71 Higher than 84%Campus 4 534.82 AverageCampus 5 608.26 Higher than 84%Campus 6 488.23 AverageCampus 7 603.15 Higher than 84%Campus 8 471.76 AverageCampus 9 397.89 Lower than 84%Campus 10 558.06 Higher than 84%Campus 11 451.39 AverageCampus 12 543.83 AverageCampus 13 537.19 Average
StandardizedClient
Campus 1 615.94 Higher than 84%Campus 2 618.42 Higher than 84%Campus 3 632.78 Higher than 84%Campus 4 562.91 Higher than 84%Campus 5 602.52 Higher than 84%Campus 6 571.53 Higher than 84%Campus 7 683.34 Higher than 97%Campus 8 564.95 Higher than 84%Campus 9 589.27 Higher than 84%Campus 10 553.73 Higher than 84%Campus 11 561.32 Higher than 84%Campus 12 550.11 Higher than 84%Campus 13 521.05 Average
StandardizedColleagues
Campus 1 470.23 AverageCampus 2 598.02 Higher than 84%Campus 3 548.36 AverageCampus 4 506.11 AverageCampus 5 531.76 AverageCampus 6 512.67 AverageCampus 7 687.20 Higher than 97%Campus 8* 440.06 Lower than 84%Campus 9 509.91 AverageCampus 10 546.87 AverageCampus 11* 423.62 Lower than 84%Campus 12 498.52 AverageCampus 13 501.05 AverageTotal 515.75 Average
Note. If the score is 200, it is lower than 99% of the schools, If the score is 300, it is lower than 97% of theschools, If the score is 400, it is lower than 84% of the schools, If the score is 500, it is average, If thescore is 600, it is higher than 84% of the schools, If the score is 700, it is higher than 97% of the schools,If the score is 800, it is higher than 99% of the schools.
All school campuses with the exception of Campus 13 scored higher than 84% of
the standardized school sample in client trust (trust in students’ ability to perform).
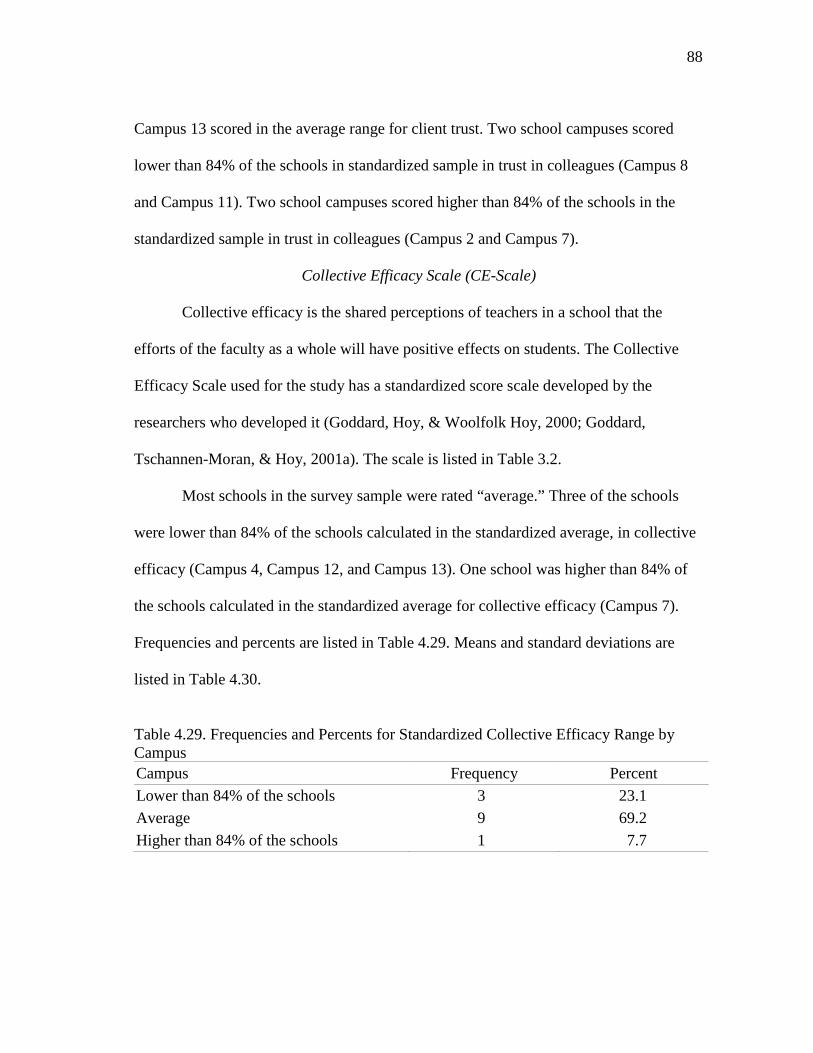
88
Campus 13 scored in the average range for client trust. Two school campuses scored
lower than 84% of the schools in standardized sample in trust in colleagues (Campus 8
and Campus 11). Two school campuses scored higher than 84% of the schools in the
standardized sample in trust in colleagues (Campus 2 and Campus 7).
Collective Efficacy Scale (CE-Scale)
Collective efficacy is the shared perceptions of teachers in a school that the
efforts of the faculty as a whole will have positive effects on students. The Collective
Efficacy Scale used for the study has a standardized score scale developed by the
researchers who developed it (Goddard, Hoy, & Woolfolk Hoy, 2000; Goddard,
Tschannen-Moran, & Hoy, 2001a). The scale is listed in Table 3.2.
Most schools in the survey sample were rated “average.” Three of the schools
were lower than 84% of the schools calculated in the standardized average, in collective
efficacy (Campus 4, Campus 12, and Campus 13). One school was higher than 84% of
the schools calculated in the standardized average for collective efficacy (Campus 7).
Frequencies and percents are listed in Table 4.29. Means and standard deviations are
listed in Table 4.30.
Table 4.29. Frequencies and Percents for Standardized Collective Efficacy Range byCampus
Campus Frequency Percent
Lower than 84% of the schools 3 23.1
Average 9 69.2
Higher than 84% of the schools 1 7.7
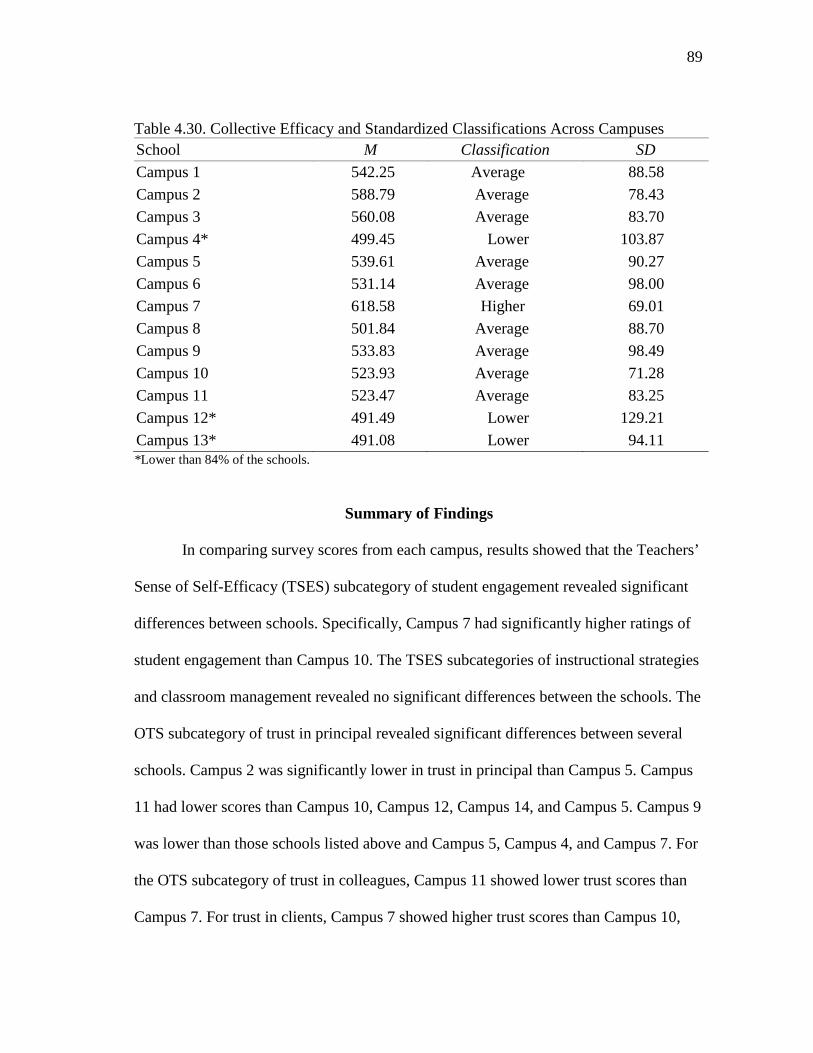
89
Table 4.30. Collective Efficacy and Standardized Classifications Across Campuses
School M Classification SD
Campus 1 542.25 Average 88.58
Campus 2 588.79 Average 78.43
Campus 3 560.08 Average 83.70
Campus 4* 499.45 Lower 103.87
Campus 5 539.61 Average 90.27
Campus 6 531.14 Average 98.00
Campus 7 618.58 Higher 69.01
Campus 8 501.84 Average 88.70
Campus 9 533.83 Average 98.49
Campus 10 523.93 Average 71.28
Campus 11 523.47 Average 83.25
Campus 12* 491.49 Lower 129.21
Campus 13* 491.08 Lower 94.11*Lower than 84% of the schools.
Summary of Findings
In comparing survey scores from each campus, results showed that the Teachers’
Sense of Self-Efficacy (TSES) subcategory of student engagement revealed significant
differences between schools. Specifically, Campus 7 had significantly higher ratings of
student engagement than Campus 10. The TSES subcategories of instructional strategies
and classroom management revealed no significant differences between the schools. The
OTS subcategory of trust in principal revealed significant differences between several
schools. Campus 2 was significantly lower in trust in principal than Campus 5. Campus
11 had lower scores than Campus 10, Campus 12, Campus 14, and Campus 5. Campus 9
was lower than those schools listed above and Campus 5, Campus 4, and Campus 7. For
the OTS subcategory of trust in colleagues, Campus 11 showed lower trust scores than
Campus 7. For trust in clients, Campus 7 showed higher trust scores than Campus 10,
90
Campus 12, Campus 11, and Campus 13. For collective efficacy, which had no
subcategories, the scores revealed that Campus 7 had higher collective efficacy than
Campus 4, Campus 8, Campus 12, and Campus 13.
In comparing survey responses across teacher demographics, results showed
gender differences in trust in principal, trust in clients, and collective efficacy. In all
three areas, females reported significantly higher trust and efficacy than males.
Differences in years of experience revealed significant differences in the respondents’
trust of colleagues. Teachers with 1-3 years of experience reported less trust of
colleagues than those with less than 1 year of experience and those with 3-6 years of
experience. Ethnic differences where found in respondent’s student engagement, with
African American respondents reporting significantly higher student engagement than
Anglos. For teacher certification, no differences where found between certified and
uncertified teachers. When comparing respondents who did or did not have a mentor
their first year, those without mentors reported lower student engagement but higher
trust in principals compared to those with mentors.
In the category of mentor helpfulness, survey respondents who stated that they
had a helpful mentor reported higher student engagement, classroom management, trust
in principal, and collective efficacy than those who did not report a helpful mentor. With
personal mentor experience, respondents who reported at least one year of mentoring,
another teacher showed higher student engagement, instructional strategies, and
classroom management than those who have not mentored another teacher.
91
In the final analysis, the three categories of Teacher’ Sense of Self-Efficacy
Scale, Collective Efficacy Scale, and Omnibus T-Scale were all compared to the
“standard” national averages. The pattern of results show that schools were generally
below average in the TSES subcategories of student engagement and instructional
strategies. At the same time, the schools were generally above average in the
subcategory of classroom management. Regarding the OTS subcategories, the responses
showed a normal distribution of scores for trust of principal and trust of colleagues. The
respondents were generally above the national average in the subcategory of trust of
clients. Regarding collective efficacy ratings, most of the schools were average, but there
were more below-average schools and less above-average schools than the national
average.
The findings from the study indicate that there were 13 areas that demonstrated
significant differences. In the first question, the analysis indicated that there were five
areas of significant differences: (a) student engagement, (b) trust in principal, (c) trust in
colleagues, (d) trust in clients, and (e) collective efficacy. In the second question, the
analysis indicated that there were six areas of significant differences: (a) gender, (b)
years of experience, (c) ethnicity, (d) having a mentor, (e) helpfulness of mentor, and (f)
being a mentor. In the final questions, the significant difference lies in the comparison of
survey responses to national averages in the area of trust and teacher self-efficacy.
In conclusion, the responses demonstrated that there are some differences
between campuses, but not dramatic differences between campuses. The teachers in this
southwest Texas school district do not experience much difference across demographic
92
groups such as ethnicity and gender. They do, however, show differences when it comes
to years of experience and mentorships. The responses suggest that a good way to
improve the teaching experience is through the mentorship program. This was evident in
the response that teachers who considered their mentor helpful showed higher levels of
self-efficacy, collective efficacy, and trust. The helpfulness of the mentor was more
significant in the positive responses than merely having a mentor.
The next chapter will address the findings and discuss how these relate to the
research in the field of self-efficacy, collective efficacy, and trust.
93
CHAPTER V
SUMMARY, CONCLUSIONS, AND RECOMMENDATIONS
Introduction
This chapter provides a summary of the results of the study of teacher efficacy,
the collective efficacy of school campuses, and the dimensions of trust among campuses.
Also included in this chapter are the implications and recommendations for practice
resulting from the study as well as recommendations for future research.
For this research, three established surveys were combined to create a single
survey of 81 questions. The three surveys were Teachers’ Sense of Efficacy Scale
(TSES) developed by Tschannen-Moran and Woolfolk Hoy (2001), the Collective
Efficacy Scale (CE-Scale) developed by Goddard, Hoy, and Woolfolk Hoy (2004), and
Omnibus T-Scale (OTS) developed by Hoy (2002). The pre-developed surveys were
grouped into three areas: (a) teacher efficacy, (b) trust, and (c) collective efficacy. The
teacher efficacy grouping included: (a) student engagement, (b) instructional strategies,
and (c) classroom management. The trust grouping included: (a) trust in principal, (b)
trust in colleagues, and (c) trust in clients. The last grouping consisted of collective
efficacy. The questions in each of these seven areas were the dependent variables studied
and their relationship to the demographic variables of: campuses in the district, gender,
years of experience, ethnicity, teacher certification, mentor first year, mentor teacher
helpful, and if the teacher at each campus was a mentor. The summary that follows will
reveal the significant findings from the data analysis of the three surveys and the
demographic variables used for the study.
94
The study was conducted in March of 2010. The study involved the
administration of the combined survey to 648 (87%) of the teachers working in the same
school district, composed of 13 school campuses (1 high school campus, 3 middle
schools, and 9 elementary schools). The survey was administered in a southwest Texas
school district (half urban and half rural) with an enrollment of 11, 333 (as of Fall 2009).
The student population consists of 85.4% Hispanic and 8.6% White, and 6.1% other.
The district is composed of 82% economically disadvantaged, 14.9% limited English
proficient, and 69.4% at-risk of not graduating. The special education population
consists of 11.5% of the total district population (Texas Education Agency, 2009).
Summary
The first question analyzed for the study was: “What are the scores across
campuses on the following surveys: Teachers’ Sense of Efficacy Scale (TSES),
Collective Efficacy Scale (CE-Scale), and Omnibus T-Scale (OTS)? The scores (means
and standard deviations) are presented in the following tables: Table 4.11, Table 4.12,
Table 4.13, Table 4.14, and Table 4.15.
A multivariate analysis of variance was used to analyze differences between
campuses on the survey responses, and the seven areas of dependent variables within the
survey. Differences were revealed on student engagement, trust in principal, trust in
colleagues, trust in clients, and collective efficacy between schools (see ANOVA Table
4.10).
The first finding is in the mean differences in student engagement scores between
campuses. Further analysis through the use of Scheffé post hoc revealed that one
95
elementary school in particular had a higher mean difference in student engagement, and
one of the middle schools had the lowest mean difference in student engagement.
Despite this difference, the pattern shows the 13 campuses are generally similar in the
teachers’ ratings of student engagement. These teachers can be considered generally
similar in their self-efficacy regarding students’ engagement. Research conducted by
Tschannen-Moran, Woolfolk Hoy, and Hoy’s (1998) emphasizes the task specific nature
of teacher self efficacy: “Teacher efficacy is the teacher’s belief in her and his ability to
organize and execute the courses of action required to successfully accomplish a specific
teaching task in a particular context” (p. 233). Student engagement is the key to student
learning in the education setting. If teachers’ perceptions are they cannot perform the
task of student engagement, then learning will be difficult to accomplish. According to
Hoy, Hoy, and Davis (2009),
Greater efficacy leads to greater effort and persistence, which leads to betterperformance, which, in turn, leads to greater efficacy. The reverse is also true.Lower efficacy leads to less effort and giving up easily, which leads to poorteaching outcomes, which then produce decreased efficacy. (p. 629)
According to the research, teacher efficacy ultimately has a direct effect on effort.
Research reveals teachers with a high sense of self-efficacy have fewer absences (Imants
& Van Zoelen, 1995), handle difficult students with greater success and refer them less
to special classes (Soodak & Podell, 1998), and are less likely to feel burnout and turn
away from the teaching profession (Brouwers & Tomic, 2000; Johnson & Birkeland,
2003). Persistence is a trademark of confident teachers with a high sense of self-efficacy.
Instead of feeling defeated by setbacks in student response or outcomes, persistent
teachers try new techniques and strategies until they are successful (Bandura, 1997).
96
The previous research generally shows that a teacher’s self-efficacy can have
influences on education ranging from student performance to absenteeism. The current
study found that self-efficacy scores of teachers were generally similar across all of the
campuses. This suggests that different campuses do not have different influences on
teachers’ self efficacy.
Another area of difference was in the area of trust. This would encompass the
trust in principal, trust in colleagues, and trust in clients. Several school campuses had
lower mean differences in trust in principal compared to other campuses. Also, several
schools showed lower mean differences in both trust of colleagues and trust of clients in
comparison to the school of Campus 7. This pattern of results could suggest that the
campuses can be used to compare low, average, and high trust in principal for its
influence on teachers. Further, Campus 7 appears to offer a special example of a campus
with more trusting relationships than the average for the district (see Tables 4.12, 4.13,
and 4.14).
The research suggests that trust is a lifeline between students, teachers,
principals, and successful outcomes in school settings. Friedman (2006) describes a “flat
world,” where very complex problems are solved by people who find horizontal
connections in a high-trust society and are used as an advantage that leads ultimately to
success. This can have a profound effect on not only teacher morale, but also on student
achievement. The principal is the pivotal leader of a school campus. Seidman (as cited in
Friedman, 2006) writes, “The more people trust each other or their leaders, the more
likely they are going to work well together” (p. 320). Thus, it would make sense in
97
schools relying on communication among staff, teamwork, creativity, planning, and
sharing of ideas, that trust is a very necessary component to success. In schools, just as
in society, if faculty can agree on rules and principles to create predictability,
confidence, and trust, then they can look to their leaders for consistency, predictability,
and follow through of agreements made and promises made, which create trust. Covey
(1991) says, “Trust is the foundation of all effective relationships and organizations” (p.
31). Trust is the ingredient to creating a learning community; and without the cohesion, a
learning community cannot function (Speck, as cited in Longley, 2006). Supporting this
proposition, an analysis of North Carolina Teacher Working Conditions Survey data
found establishing an atmosphere of trust and mutual respect was strongly correlated
with student achievement at elementary, middle, and high schools. In addition, trust in
the school environment was strongly correlated with teachers’ employment decisions as
well (Hirsch & Emerick, 2006). Lack of trust is a serious impediment to school reform
efforts across the United States (Tschannen-Moran & Hoy, 2000).
Among the campuses, Campus 7 was found to be significantly higher in trust
ratings than a few other schools such as Campus 12, Campus 11, and Campus 10. The
research suggests that Campus 7 could also be found to have better communication,
teamwork, planning, and sharing of ideas among staff since it had the higher trust levels.
Therefore, further research could determine if trust differences are a result of the better
communication, teamwork, planning, and sharing of ideas among staff.
The final area in question 1 with significant results was in the area of collective
efficacy between schools. The results showed that Campus 7 was significantly higher
98
than several other schools. The other schools represent a generally similar level of
collective efficacy. These results suggest that Campus 7 might have a strong level of
collective efficacy that the research indicates has a positive influence on student
achievement. It is possible that Campus 7 could be a mere anomaly. The other schools
could represent a healthy collective efficacy, and Campus 7 is a special example of
collective efficacy at work in the real world.
In turn, research shows that teachers who perceive low collective efficacy in their
schools have a negative effect on student achievement. Collective teacher efficacy is a
combination of individuals and their interactive production of academic success or as
Bandura (1997) states, “the group’s shared belief in its conjoint capabilities to organize
and execute courses of action required to produce given levels of attainments” (p. 16).
Peers can also influence teacher practice by suggesting specific strategies and by
working together to implement them. Collaboration among teachers promotes teacher
efficacy (Chester & Beaudin, 1996), especially when it leads to instructional
coordination within a school (Raudenbush, Rowan, & Cheong, 1992). Ultimately, as
Rosenholtz (1989) states,
Teachers, like members of most organizations, shape their beliefs and actionslargely in conformance with the structures, policies and traditions of the workdayworld around them and where teachers collectively perceive students as capablelearners, and themselves as capable teachers seem more likely to persevere andfoster students’ academic gains. (p. 2)
Thus, if teachers do not believe in their students’ (clients) ability to perform well on
learning tasks, academic gains may be beyond their means.
99
The second research question analyzed for the study was: “What are the
demographic differences of teachers’ sense of self-efficacy, collective efficacy, and trust
beliefs?” Each of the demographic variables (gender, years of experience, ethnicity,
teacher certification, mentor first year, mentor teacher helpful, have been or are a mentor
teacher) were analyzed for significant differences with the dependent variables (student
engagement, instructional strategies, classroom management, trust in principals, trust in
colleagues, trust in clients, and collective efficacy).
First a MANOVA was conducted on the seven dependent variables by gender,
and significant differences were found between males and females on trust in students,
trust in principal, collective efficacy, and student engagement. No significant difference
was found between male and female teachers in instructional strategies, classroom
management, and trust in colleagues. Females had statistically higher scores than males
in all four of these areas: trust in principal, trust in clients, collective efficacy, and
student engagement, possibly indicating greater trust in their students’ ability to learn
and in their principal and a more positive sense of collective efficacy.
The first significant finding for question 2 (by gender) that female teachers had
greater trust in the principals than male teachers could have several implications. One of
them could be if male teachers do not trust in the principal and that trust is broken, then
added negative stressors will become part of the system (Noonan et al., 2008). Another
implication is principals will need to make sure they build open and effective
communication in order to assure they are building trust with their faculties. Lastly,
according to research from Bryk and Schneider (2002), the lack of trust in the principal
100
can affect productivity. Furthermore, in regard to question 2 (by gender), female teachers
showed greater trust in their students’ ability to learn than male teachers. The fact female
teachers showed greater trust in their students and abilities to learn than their male
counterparts can have implications for the school organization as a whole. In the area of
organizational studies, trust is a much researched topic (Zand, 1972), but it is only in
recent years it has been examined in a more systemic way by educational researchers
(Bryk & Schneider, 2002; Goddard, Tschannen-Moran, & Hoy, 2001a; Hoy Tschannen-
Moran, 1999; Smith, Hoy, & Sweetland, 2001).
The determinants of teacher trust are very important to know since trust is related
to the successful functioning of a school (Brewster & Railsback, 2003). Teacher trust in
students not only influences students’ performance (Goddard, Tschannen-Moran, &
Hoy, 2001a), but also teachers’ performance as it affects their sense of efficacy (Hoy &
Tschannen-Moran, 1999). Fisler and Firestong (2006) revealed the importance of social
trust for teacher learning. Thus, understanding the impact of the school context on
teacher and student outcomes may contribute to greater staff awareness of pervasive
trends in teacher attitudes that require immediate and systematic interventions efforts
(Roach & Kratochwill, 2004). Previous research has illustrated that school context,
school composition, or teacher characteristics may result in a lack of trust in students.
The argument is teacher education could contribute to overcome certain stereotypes
among prospective teachers (Nieto, 2000; van Houtte, 2007). Teacher trust is viewed
from the relational trust prospective (Bryk & Schneider, 2002) indicating the importance
of normative role expectations in the school. According to previous research gathered,
101
gender, ethic, and socioeconomic composition of the school are related to teacher trust as
well (Goddard, Tschannen-Moran, & Hoy, 2001a; Van Houtte, 2007). School culture is
associated with normative expectations teachers hold (Thrupp, 1999), thus school culture
is formed by teachers’ level of trust (Van Maele & Van Houtte, 2008). At the teacher
trust level, attention is paid to the role the teacher’s perception of the pupil’s ability to
learn the curriculum presented them (Van Houtte, 2007). In this study, it could be
suggested that if male teachers have a lower level of trust in their students, then
according to the previous research, it could be said that they influence the overall school
culture and student performance.
Finally for question 2 (by gender), differences in collective efficacy were found
between males and females. The demographic frequency table on gender (Table 4.2)
reveals there are a greater number of female teachers (48%-100% among schools) in the
district than males. Therefore, female teachers may feel more collective efficacy among
their own gender group. Again, there is limited research in male versus female teacher
collective efficacy. Some studies have found female student teachers trust in their
facility to engage their future students more than their male counterparts do. Although
there is no consistent agreement between previous studies about the superiority of any
gender (Oguz & Topkaya, 2008), primary female in-service or pre-service teachers could
feel themselves more successful academically with their students because of certain
cultural beliefs advocating that teaching at primary school is a job fitted for female
teachers as it is more or less like mothering a child, which sometimes causes parents to
prefer female teachers. In terms of teacher beliefs, on the other hand, the gender variable
102
does not seem to be an all-encompassing factor, as both male and female participants
have both constructivist and traditional beliefs. Yet, the fact is that male participants
were found in a previous study to have more traditional approaches to teaching and
female student teachers were found more constructivists (Duru, 2006). Duru’s study may
suggest that there is an impetus to gravitate towards constructivism for females and for
males towards traditional teaching. The current study supports the conclusions of this
previous research in the area where female teachers have a higher level of collective
efficacy. This possibly suggests that some campuses are more accommodating to
females than males.
The next demographic variable analyzed was the difference in teachers’ years of
experience and the seven dependent variables. The results of the MANOVA showed
significant differences between trust in colleagues and years of experience. Teachers
with 1-3 years of experience and those with 7-12 years of experience had greater trust in
colleagues then those with 4-6 years of experience. It is difficult to ascertain exactly why
teachers in the 4-6 years of experience have less trust in their colleagues.
Another demographic variable (question 2) with significant findings was between
ethnicity and student engagement. Scheffé post hoc tests were conducted to examine
where mean differences lie. African Americans had a larger mean difference compared
to the other ethnicity groups on both student engagement and collective efficacy. This
finding could suggest African American teachers feel they have a more difficult time
engaging students in learning. This is associated with their level of collective efficacy
when compared to teachers of other ethnicities (Anglo, Hispanic, and other). Positive
103
student outcomes are dependent on engagement (Tschannen-Moran & Woolfolk Hoy,
2001). For many students, the norms and cultural practice exhibited in school (e.g.,
sitting quietly in their seat, raising their hand to ask a question) and varying dialogue
(e.g., “Students what is the objective of this experiment?”) many times are in stark
contrast with home, cultural, and linguistic practices. To ensure the success of their
students, teachers need to be able to bridge the cultural and language expectation of
students’ home lives and their lives at school (Allen & Boykin, 1992). If a teacher has
the tools of socially being able to bridge the instructional environment with a student’s
home experience, they ensure the student is not alienated from the new information and
can scaffold the new information to their personal experience (Heath, 1983; Ladson-
Billings, 1994).
Goddard, Hoy, and Woolfolk Hoy (2004) indicate that disadvantaged students,
such as the ones who attend school in the district being studied, are better off in school
where the culture is one in which there is a strong collective sense of the group’s ability
to perform well academically. The research also goes on to say, faculties in different
schools vary greatly in this collective sense of possibility of future success, and the
degree to which they possess this optimism is strongly linked to student achievement. If
the African American teachers have a significantly different level of confidence in their
ability to engage students in learning and do not feel a strong degree of collective
efficacy, it will be difficult for them to help students be successful. It is also noted, there
are fewer than 6% African American teachers in the district being studied (see Table
4.4).
104
For the next demographic variable (question 2), “teacher certification,” no
significant differences were found with the seven survey variable groupings.
The succeeding demographic variable (question 20, “mentor first year,” did have
significant differences in the dependent variables. Teachers who were not assigned
mentors their first year of teaching had lower student engagement scores than those who
did have mentors. Those who had mentors the first year had lower trust in principals’
scores than those who did not have mentors. The majority of teachers surveyed indicated
they did not have a mentor their first teach year (see Table 4.6).
The majority of the teachers taking the survey who had a mentor their first year
or so, indicated they did not find the mentor helpful (between 58.6%-86.7%). This
finding is not in isolation. According to Wood and Stanulis (2009), more empirical
studies are needed on the effects of induction on novice teacher performance and student
achievement and on subject-based and urban teacher induction. Effective teacher
induction programs thrive in school systems that respect novice teachers; there is a need
to continue to learn to teach while they teach (Alliance for Excellent Education (AEE),
2004; Bartell, 2005; Johnson & Kardos, 2004; Stanulis, Burrill, & Ames, 2007; Wood &
Waarich-Fischman, 2006).
Athanases and Achinstein (2003) indicate quality mentor programs have strong
mentor support systems and offer formative assessment systems in order for novice
teachers to monitor their progress toward developing their teaching practice. Research
supports the importance of the first three years of a teacher’s induction into the
profession and how critical they are. A high caliber induction program enhances teacher
105
learning through an intricate, multi-year system of carefully planned and structured
activities that support novice teachers’ development level of professional development in
their first through third year of teaching (Ingersoll & Smith, 2004; Stanulis et al., 2007).
Thus, the majority of teachers participating in this study felt they did not have a
helpful mentor. Thus, it can be inferred that they could have missed the opportunity of
receiving a quality induction program in the most critical years of their teaching
development. By indicating their mentor teacher was not helpful, teachers taking the
survey indicated they did not experience a quality induction program.
Teachers who had mentors the first year had lower trust in principal’s scores than
those who did not have mentors. These results could be the result of having a mentor
teacher who did not have trust in the principal. The mentor could have influenced their
novice teacher’s trust in their principal, if they did not trust the principal. Regardless,
through their individual research and joint research, Hoy and Tschannen-Moran (1999)
have presented multiple studies that demonstrate trusting relationships among teachers
and principals contribute to a positive school climate, productive communication,
increases in student learning, teachers’ collective sense of efficacy, and overall school
effectiveness (Hoy & Sweetland, 1999; Tschannen-Moran, 2000; Hoy and Tschannen-
Moran, 1999). Thus, this finding could have a profound effect on school climate,
productive communication, increases in student learning, teachers’ collective sense of
efficacy, and the overall effectiveness of the school.
Finally, the last demographic (question 2) “I am a mentor” (yes vs. no) resulted
in three statistically significant differences in student engagement, instructional
106
strategies, and classroom management. These elements of teacher self-efficacy (student
engagement, instructional strategies, and classroom management) have been proven to
increase student performance. Teacher efficacy influences goal setting and effort
expenditure. Teachers who anticipate that they will be successful, set higher goals for
themselves and their students. Teacher efficacy consistently predicts willingness to try
out new teaching ideas, particularly techniques that are difficult to implement and
involve sharing control with students (Ross, 1992). High expectations of causes
motivates classroom experimentation because teachers anticipate they will be able to
achieve the benefits of innovation and overcome obstacles that might arise. Teachers
with high expectations about their ability to teach produce high student achievement
(Goddard, Hoy, & Woolfolk Hoy, 2004). Teacher efficacy contributes to achievement
because high efficacy teachers try harder, use management strategies that stimulate
student autonomy, attend more closely to low ability student needs, and modify students’
ability perceptions (Ross, 1998). Studies have documented the positive effects of
mentoring on the mentors themselves (Ganser, 1997; Gordon & Maxey, 2000;
Holloway, 2001), thus having positive affects in teacher self-efficacy for both.
Question 3 was , “Do teachers’ self-efficacy, collective efficacy, and trust beliefs
remain constant for every campus?” To answer question 3, the survey instrument used
for this study was analyzed by comparing the standardized scores for each of the
combined survey instruments individually by school campus: Teacher Sense of Efficacy
Scale (TSES), Omnibus T-Scale (OTS), and Collective Efficacy Scale (CE-Scale).
107
First, the TSES was analyzed. In student engagement, overall campuses’ mean
(unWM) were below the standard mean (StanM) calculated by developers of the
instrument, suggesting the teachers from all schools had less confidence in their ability
to engage students in learning. The same was true for instructional strategies. Teachers
had less confidence in their instructional strategies at all schools compared to the
standard mean (StanM). Overall, campus teachers had an overall mean that was higher
than the standard mean calculated by developers of the instrument in classroom
management. This suggests teachers at the district being studied feel they have firm
control of their classroom management. Although it is necessary to have good classroom
management, it is disconcerting that teachers indicate they are less comfortable with
instruction and engaging students in their classrooms.
Next, the Omnibus T-Scale was analyzed comparing it to the standardized scores
developed by the original researchers (Hoy & Tschannen-Moran, 2003). One school
campus scored lower than 97% of the schools in the standardized schools sample in
principal trust (Campus 2). Another campus scored lower than 84% of the schools in the
standardized schools sample (Campus 9). Four school campuses scored higher in
principal trust than 84% of the schools in the standardized schools sample (Campus 3,
Campus 5, Campus 7, and Campus 10). All school campuses with the exception of
campus 13 scored higher than 84% of the standardized schools sample in client trust
(trust in students’ ability to perform). Campus 13 scored in the average range for client
trust. Two school campuses scored lower than 84% of the schools in standardized
sample in trust in colleagues (campus 8 and campus 11). Two school campuses scored
108
higher than 84% of the schools in the standardized sample in trust in colleagues
(Campus 2 and Campus 7). Although some schools scored higher or lower than the
national means found by the developers of this survey, the implications for these scores
cannot lead to any solid conclusions. These scores provoke questions, as to the level of
trust in various areas. Further study would be warranted so as to determine exactly what
the pertinent issues are and why participants have lower levels of trust.
Finally, the CE survey was analyzed. The Collective Efficacy Scale used for the
study has a standardized score scale developed by the researchers (Goddard, Hoy, &
Woolfolk Hoy, 2000; Goddard, Tschannen-Moran, & Hoy, 2001a). Most schools in the
survey sample were rated average. Three of the schools were lower than 84% of the
schools calculated in the standardized average in collective efficacy (Campus 4, Campus
12, and Campus 13). One school was higher than 84% of the schools calculated in the
standardized average for collective efficacy (Campus 7). As indicated earlier, collective
efficacy is the shared perception of teachers in a school where the efforts of the faculty
as a whole will have positive effects on students. Thus, schools would want a higher than
average CE score, ideally. This score could be a baseline for schools to try to improve
over time. Thus, it would be beneficial to use these results to measure improvement in
collective efficacy over time.
Conclusions
The overall findings of this study answer three questions. The first question,
“What are the scores for each campus and are there any differences among campus
scores?” showed a successful gathering of data for all 13 campuses. The differences
109
observed among schools were in the areas of student engagement, trust in principal, trust
in colleague, trust in client, and collective efficacy. In general, Campus 7 had much
higher scores than other campuses, but campuses were commonly similar to each other.
This could suggest that Campus 7 represents a positive example for other schools in
these areas. It also could suggest that there are no generally bad schools according to the
respondents.
The second question, “What are the demographic differences of teachers’ sense
of self-efficacy, collective efficacy, and trust beliefs?” showed results in many areas.
Gender differences were found in trust in principal, trust in clients, collective efficacy,
and student engagement, with females rating themselves higher than males in all areas.
This could lead to the conclusion that female teachers have a generally better experience
than their male counterpart teachers. A possible explanation could be that there is a
greater number of female teachers.
Teachers’ years of experience showed significant differences in trust in
colleagues, with young (1-3 years) and more experienced (7-12 years) teachers showing
more trust in colleagues, than those with a few years of experience (4-6 years). This
could lead to the conclusion that teachers lose trust in colleagues for the first few years,
but as they continue teaching, their trust in colleagues start to increase. Possible
explanations for this could be their increase in experience and familiarity with their
surrounding.
Questions related to teacher mentorship showed many significant results.
Teachers who had a mentor reported higher student engagement and trust in principal.
110
Those who stated their mentor was helpful furthered stated higher student engagement,
classroom management, trust in principal, and collective efficacy. Teachers who
reported being a mentor reported higher student engagement, instructional strategies, and
classroom management. In general, these results could suggest that mentor programs
have a positive impact on the teaching experience. Student engagement seems to be the
most generally improved area in relation to the mentor program. The results of being a
mentor strongly suggest that mentoring generally improves self-efficacy.
A number of studies have pointed to the influence of teachers’ self-efficacy
beliefs on academic achievement and success in their overall educational outcomes
(Moore & Esselman, 1992, 1994; Muijs & Reynolds, 2001; Ross, 1992, 1998). Teachers
with high self-efficacy beliefs are more likely than teachers with a low sense of self-
efficacy to possess sound pedagogy and create and implement innovative and effective
curriculum and instruction in the classroom and to use classroom management
approaches and sound teaching methods that encourage students’ independent study and
reduce custodial control (Cousins & Walker, 1995a, 1995b; Guskey, 1988), to take
responsibility for students with special learning needs (Allinder, 1994; Jordan, Krcaali-
Iftar, & Diamond, 1993), to manage classroom problems (Chacon, 2005; Korevaar,
1990), and to keep students on task (Podell & Soodak, 1993). In addition, teachers’ self-
reported self-efficacy as indicated in previous research, is associated with enhanced
student’s motivation (Ashton & Webb, 1986; Roeser, Arbreton, & Anderman, 1993),
higher self-esteem (Borton, 1991), ability to self-regulate (Rose & Medway, 1981), ease
in managing school transitions (Midgley, Feldlaufer, & Eccles, 1989), and more positive
111
attitudes toward school (Miskel, McDonald, & Bloom, 1983). Since teachers’ self-
efficacy may also contribute to students’ sense of efficacy, fostering their involvement in
class activities, and their efforts in facing difficulties (Ross, 1998; Ross, Hogaboam-
Gray, & Hannay, 2001), the results of this study could point to concerns for the domino
effect of low teacher self-efficacy traits and students absorbing negative teaching efforts.
The third question, “Do teachers’ self-efficacy, collective efficacy, and trust
beliefs remain constant for every campus?” was answered by comparing campus scores
to the standardized national scores provided for each of the survey scales. Student
engagement and instructional strategies were below the standardized means, and
classroom management was above the standardized mean. This suggests the district
studied varies compared to the average school. It could be that the district in this study
serves a high proportion of low socio-economic students and a high LEP population. But
there is no certainty to this, just predictions. The previous research has shown teachers of
high-performing and disciplined students are more likely to be successful in their
activities and tasks than teachers of students who have learning or disciplinary problems.
The goal would be repeated experiences of success with students in order to bring their
experience to higher levels of comprehension and contribute to their robust sense of
efficacy.
Ultimately, confidence in teachers’ self-efficacy promotes a dedication to the
profession and collaborative relationships with colleagues and parents (Coladarci, 1992;
Hoover-Dempsey, Bassler, & Brissie, 1992; Imants & Van Zoelen, 1995) contributing to
the positive and motivating and stimulating learning environment. The teachers with
112
higher self-efficacy are more likely to appreciate other school personnel’s contributions
to the functioning of the school, to view the principal, colleagues, staff, students, and
parents as fulfilling their obligations, and perceive the whole school as a fine-tuned
machine mastering its mission (Caprara, Barbaranelli, Borgogni, Petitta, & Rubinacci,
2003; Caprara, Barbaranelli, Borgogni, & Steca, 2003). The ultimate goal for the district
in this study would be higher self-efficacy and collective efficacy for the reasons listed
above. Thus, ongoing surveys each year to measure their trust would be beneficial to see
progress over time. In addition, studies including academic achievement for each
campus as it relates to teacher self-efficacy and collective efficacy would be key.
Recommendations
Further research is needed in the district being studied in order to understand the
influence of teacher demographics used in this study (school/campus; gender; years of
experience; ethnicity; teacher certification; mentor in first year of teaching; finding the
mentor teacher helpful; and being a mentor teacher) on teacher efficacy, trust, and
collective efficacy. Each school is a unique learning community and results of this study
show the impact of demographics on teacher efficacy, trust, and collective efficacy and
how results of the study vary for different campuses. For example, campus 7 was a
school where the respondents generally rated their teaching experience higher than other
schools. Also, schools like campus 11, campus 10, and campus 11 had generally lower
scores, particularly with trust ratings. Thus, further exploration of the significant
differences found in the study are warranted.
113
Various scholars involved in efficacy and trust research have realized the need
for longitudinal studies using quasi-experimental and experimental designs and
qualitative methods to document how change occurs within teacher efficacy and to better
understand the interdependent relationship between teacher efficacy and collective
efficacy (Fives, 2003; Henson, 2001a; Tschannen-Moran, Woolfolk Hoy, & Hoy, 1998;
Wheatley, 2005; Woolfolk & Hoy, 1990). With repetitions of this survey, such a
longitudinal study can be done to determine the effectiveness of staff development and
enhancements to improve teacher self-efficacy, collective efficacy, and trust.
Research should be done by university researchers partnered with teacher
researchers to have an outside entity participate in teacher self-efficacy evaluation,
mentoring programs, and campus needs assessments. University and school partnerships
benefit both entities. Universities can provide the researchers information schools do not
possess and campuses can provide universities with the teachers needed to establish a
research base. The resulting partnership would allow teacher educators to indicate the
teachers’ efficacy needs during pre-service and in-service years at the district and
campuses participating in the studies (Ebmeier, 2003; Hoy & Spero, 2005; Soodak &
Podell, 1996; Tschannen-Moran & Woolfolk Hoy, 2001; Wheatley, 2005).
It is hoped the school district participating in this study will continue the
longitudinal studies with a partnering university and follow the improvement in teacher
self-efficacy, trust, and collective efficacy over time. In turn, it is hoped student
academic gains will parallel improvement in teacher efficacy and trust.
114
This study is a step towards defining the relationship between demographic
variables, teacher efficacy, collective efficacy, and trust in a diverse southwest Texas
district. It is hoped the results of this study cannot only be used at the district
participating in the study but by other school districts in the state and nation to improve
teaching and learning for teacher leaders, teachers, and students and, of course, to guide
administrators trying to improve their campus academic outcomes.
115
REFERENCES
Adams, C. M. (2008). Building trust in schools: A review of empirical evidence. In W.
Hoy & M. DiPaola (Eds.), Improving schools: Studies in leadership and culture
(pp. 29-54). Charlotte, NC: Information Age.
Adams, G. J., & Dial, M. (1993). Teacher survival: A Cox Regression Model. Education
and Urban Society, 26(1), 90-99.
Ahuja, R. (2007). Towards an understanding of excellence in urban pedagogy: A portrait
of high school. The Qualitative Report, 12(1), 1-19.
Allen, B. A., & Boykin, A. W. (1992). African American children and the educational
process: Alleviating cultural discontinuity through prescriptive pedagogy. School
Psychology Review, 21(4), 586-596.
Alliance for Excellent Education (AEE). (2004). Tapping the potential: Retaining and
developing high-quality new teachers. Washington, DC: Author.
Allinder, R. (1994). The relationship between efficacy and the instructional practices of
special education teachers and consultants. Teacher Education and Special
Education, 17, 86-95.
Anderson, R., Green, M., & Loewen, P. (1988). Relationships among teachers’ and
students’ thinking skills, sense of efficacy, and student achievement. Alberta
Journal of Educational Research, 34(2), 148-165.
Armor, D., Conroy-Oseguera, P., Cox, M., King, N., McDonnel, L., Pascal, A. et al.
(1976). Analysis of the school preferred reading programs in selected Los
Angeles minority schools (Rep. No R -2007-LAUSD). Santa Monica, CA: Rand.
116
Ashton, P. T., & Webb, R. B. (1986). Making a difference: Teachers’ sense of efficacy
and student achievement. New York: Longman.
Athanases, S., & Achinstein, B. (2003). Focusing new teachers on individual and low
performing students: The centrality of formative assessment in the mentor’s
repertoire of practice. Teachers College Record, 105(8), 1486-1520.
Bandura, A. (1986). Social foundations of thought and action: A social cognitive theory.
Englewood Cliffs, NJ: Prentice-Hall.
Bandura, A. (1993). Perceived self-efficacy in cognition development and functioning.
Educational Psychologist, 28(2), 117-148.
Bandura, A. (1997). Self-efficacy: The exercise of control. New York: Freeman &
Company.
Bandura, A., & Cervone, D. (1983). Self-evaluative and self-efficacy mechanisms
governing the motivational effects of goal system. Journal of Personality and
Social Psychology, 45, 1017-1028.
Bartell, C. (2005). Cultivating high-quality teaching through induction and mentoring.
Thousand Oaks, CA: Corwin Press.
Bennis, W. (1997). Organizing genius: The secrets of creative collaboration. Reading,
MA: Addison-Wesley.
Boe, E. E., & Gilford, D. M. (1991). Teacher supply, demand and quality: Policy issues,
model and databases. Washington, DC: National Academy Press.
Borton, W. (1991, April). Empowering teachers and students in a restructuring school:
A teacher efficacy interaction model and the effect on reading outcomes. Paper
117
presented at the annual meeting of the American Educational Research
Association, Chicago.
Brewster, C., & Railsback, J. (2003). Building trusting relationships for school
improvement: Implications for principals and teachers. Portland, OR: Northwest
Regional Education Laboratory.
Brinson, D., & Steiner, L. (2007). Building collective efficacy: How leaders inspire
teachers to achieve (Issue Brief). Washington, DC: U.S. Department of
Education, Center for Comprehensive School Reform and Improvement.
Brouwers, A., & Tomic, W. (2000). A longitudinal study of teacher burnout and
perceived self-efficacy in classroom management. Teaching and Teacher
Education, 16, 239-253.
Bryk, T., & Schneider, B. (2002). Trust in schools: A core resource of improvement.
New York: Sage Foundation.
Bullough, R. V., Jr., & Baughman, K. (1997). “First-year teacher” eight years later: An
inquiry into teacher development. New York: Teacher’s College Press.
Burley, W. W., Hall, B. W., Villeme, M. G., & Brockmeier, L. L. (1991, April). A path
analysis of the mediating role of efficacy in first-year teachers’ experiences,
reaction, and plans. Paper presented at the annual meeting of the American
Education Research Association, Chicago.
Butler, J. K., Jr. (1991). Toward understanding and measuring conditions of trust:
Evolution of trust inventory. Journal of Management, 17(3), 643-663.
118
Caprara, G. V., Barbaranelli, C., Borgogni, L., Petitta, L., & Rubinacci, A. (2003).
Teachers’, school staff’s and parents’ efficacy beliefs as determinants of attitude
toward school. European Journal of Psychology of Education, 18, 15-31.
Caprara, G. V., Barbaranelli, C., Borgogni, L., & Steca, P. (2003). Efficacy beliefs as
determinants of teachers’ job satisfaction. Journal of Educational Psychology,
95, 821-832.
Carnegie Forum on Education and the Economy. (1986). A nation prepared: Teachers
for the 21st century. Washington, DC: Author.
Center for Comprehensive School Reform and Improvement. (2009, April). Developing
a positive school climate (Monthly Electronic Newsletter). Washington, DC:
Learning Point Associates. Retrieved January 12, 2010, from
http://www.centerforcsri.org/files/TheCenter_NL_Apr09.pdf.
Chacon, C. T. (2005). Teachers’ perceived efficacy among English as a foreign language
teachers in middle schools in Venezuela. Teaching and Teacher Education, 21,
257-272.
Cherubini, L. (2007). Speaking up and speaking freely: Beginning teachers’ critical
perceptions of their professional induction. Professional Educator, 29(1), 1-12.
Chester, M., & Beaudin, B. (1996). Efficacy beliefs of newly hired teachers in urban
schools. American Educational Research Journal, 33(1), 233-257.
Clewell, B. C., & Villegas, A. M. (1998). Increasing the number of teachers of color for
urban schools: Lessons from the pathways national evaluation. Education and
Urban Society, 31(1), 42-61.
119
Coladarci, T. (1992). Teachers’ sense of efficacy and commitment to teaching. Journal
of Experimental Education, 60, 323-337.
Coolidge, F. (2006). Statistics: A gentle introduction (2nd ed.). Thousand Oaks, CA:
Sage.
Cortez, A. (2001). Teacher shortages: Implications for reform and achievement for all
students. IDRA Newsletter, 289(7), 5-16.
Cousins, J., & Walker, C. (1995a, April). Personal teacher efficacy as a predictor of
teachers’ attitudes toward applied educational research. Paper presented at the
annual meeting of the Canadian Association for the Study of Educational
Administration, Montreal.
Cousins, J., & Walker, C. (1995b). Predictors of educators’ valuing of systemic inquiry
in schools. Canadian Journal of Program Evaluation, Special Issue, 25-35.
Covey, S. R. (1989). The seven habits of highly effective people. New York: Simon &
Schuster.
Covey, S. R. (1991). Principle-centered leadership. New York: Simon & Schuster.
Covey, S. R. (1992). Principle-centered leadership. New York: Simon & Schuster.
Cronbach, L. J., & Gleser, G. C. (1957). Psychological tests and personnel decisions.
Urbana, IL: University of Illinois Press.
Currall, S. C., & Judge, T. A. (1995). Measuring trust between organizational boundary
role persons. Organizational Behavior and Human Decision Processes, 64, 151-
170.
120
Da Costa, J. L., & Riordan, G. (1996, April). Teacher efficacy and the capacity to trust.
Paper presented at the annual meeting of the American Educational Research
Association, New York. (ERIC Document Reproduction Service No.
ED397010).
Darling-Hammond, L. (1986). A proposal for evaluation in the teaching profession. The
Elementary School Journal, 86(4), 531-551.
Deming, W. E. (1986). Out of crises. Cambridge, MA: Massachusetts Institute of
Technology, Center for Advanced Engineering Study.
Duru, S. (2006). Pre-service elementary education teachers’ beliefs about teaching and
learning in Turkey. Unpublished doctoral dissertation, Indiana University,
Bloomington.
Ebmeier, H. (2003). How supervision influences teacher efficacy and commitment: An
investigation of a path model. Journal of Curriculum and Supervision, 18(2),
110-141.
Ehrenberg, R. G., & Brewer, D. J. (1994). Do school and teacher characteristics matter?
Evidence from high school and beyond. Economics of Education Review, 13(1),
1-17.
Ehrenberg, R. G., Goldhaber, D. D., & Brewer, D. J. (1995). Do teachers’ race, gender
and ethnicity matter? Evidence from the National Educational Longitudinal
Study of 1988. Industrial and Labor Relations Review, 48(3), 547-561.
Enderlin-Lampe, S. (1997). Shared decision-making in schools: Effect on teacher
efficacy. Education, 118(1), 150-155.
121
Eubanks, S. (1996). The urban teacher challenge: A report on teacher recruitment and
demand in selected great city schools. Belmont, MA: Recruiting New Teachers.
Fideler, E., & Haselkorn, D. (1999). Learning the ropes: Urban teachers’ induction
programs and practices in the United States. Belmont, MA: Recruiting New
Teachers.
Fisler, J. L., & Firestone, W. A. (2006). Teacher learning in a school-university
partnership: Exploring the role of social trust and teaching efficacy beliefs.
Teachers College Record, 108(6), 1155-1185.
Fives, H. (2003, April). What is teacher efficacy and how does it relate to teacher
knowledge? A theoretical review. Paper presented at the American Educational
Research Association Annual Conference, Chicago.
Freudenberger, H. J. (1974). Staff burnout. Journal of Social Issues, 30(1), 159-165.
Friedman, T. (2006). The world is flat. New York: Farrar, Strauss, & Giroux.
Gabarro, J. (1987). The dynamics of taking charge. Boston: Harvard Business School
Press.
Ganser, T. (1997, April). Promises and pitfalls for mentors of beginning teachers. Paper
presented at the Conference on Diversity in Mentoring, Tempe, AZ. (ERIC
Document Reproduction Service No. ED407379).
Geist, J., & Hoy, W. K. (2004). Cultivating a culture of trust: Enabling school structure,
teacher professionalism, and academic press. Leading and Managing, 10, 1-18.
Gibson, S., & Dembo, M. (1984). Teacher efficacy: A construct validation. Journal of
Educational Psychology, 76, 569-582.
122
Gilford, D. M., & Tennenbaum, E. (Eds.). (1990). Pre-college science and mathematics
teachers: Monitoring supply demand, and quality. Panel on Statistics on Supply
and Demand for Pre-college Science and Mathematics Teachers (Committee on
National Statistics). Washington, DC: National Academy Press.
Gimbel, P. A. (2003). Solutions for promoting principal-teacher trust. Toronto:
Scarecrow.
Glickman, C., & Tamashiro, R. (1982). A comparison of first-year, fifth-year, and
former teachers on efficacy, ego development, and problem solving. Psychology
in Schools, 19, 558-562.
Goddard, R. D. (1998). The effects of collective teacher efficacy on student achievement
in urban public elementary schools. Unpublished doctoral dissertation, Ohio
State University, Columbus.
Goddard, R. D. (2000). The impact of schools on teacher beliefs, influence, and student
achievement: The role of collective efficacy. In J. Raths & A. C. McAninch
(Eds.), Teacher beliefs and classroom performance: The impact of teacher
education (Vol. 6, pp. 183-202). Ann Arbor, MI: University of Michigan.
Goddard, R. D. (2002). A theoretical and empirical analysis of the measurement of
collective efficacy: The development of a short form. Educational and
Psychological Measurement, 93, 467-476.
Goddard, R. D. (2003). The impact of schools on teacher beliefs, influence, and student
achievement: The role of collective efficacy. In J. Raths & A. McAninch (Eds.),
123
Advances in teacher education (Vol. 6, pp. 183-204). Westport, CT: Information
Age.
Goddard, R. D., & Goddard, Y. (2001a). A multilevel analysis of the relationship
between teacher and collective efficacy in urban schools. Teaching and Teacher
Education, 17(7), 807-818.
Goddard, R. D., & Goddard, Y. (2001b, April). An exploring of the relationship between
collective efficacy and teachers’ efficacy. Paper presented at annual meeting of
the American Education Research Association, Columbus, OH.
Goddard, R. D., Hoy, W. K., & Woolfolk Hoy, A. (2000). Collective teacher efficacy:
Its meaning, measure, and impact on student achievement. American Educational
Research Journal, 37(2), 479-507.
Goddard, R. D., Hoy, W. K., & Woolfolk Hoy, A. (2004). Collective efficacy beliefs:
Theoretical developments, empirical evidence, and future directions. Education
Research, 33(3), 3-13.
Goddard, R. D., Tschannen-Moran, M., & Hoy, W. K. (2001a). A multilevel
examination of the distribution and effects of teacher trust in students and parents
in urban elementary schools. Elementary School Journal, 102, 1, 3-17.
Goddard, R. D., Tschannen-Moran, M., & Hoy, W. K. (2001b). Teacher trust in students
and parents: A multilevel examination of the distribution and effects of teacher
trust in urban elementary schools. Elementary School Journal, 103, 3-17.
Gordon, S., & Maxey, S. (2000). How to help beginning teachers succeed (2nd ed.).
Alexandria, VA: Association for Supervision and Curriculum Development.
124
Govier, T. (1998). Dilemmas of trust. Montreal: McGill-Queen’s University Press.
Gregoire, M. (2003). Is it a challenge or a threat? A dual-process model of teachers’
cognition and appraisal process during conceptual change. Educational
Psychology Review, 15(2), 147-179.
Guskey, T. (1988). Teacher efficacy, self-concept, and attitudes toward the
implementation of instructional innovation. Teaching and Teacher Education, 4,
63-69.
Hall, B., Burley, W., Villeme, M., & Brockmeier, L. (1992, April). An attempt to
explicate teacher efficacy beliefs among first year teachers. Paper presented at
the annual meeting of the American Educational Research Association, San
Francisco.
Heath, S. B. (1983). Ways with words: Language, life, and work in communities and
classrooms. Cambridge, MA: Cambridge University Press.
Henson, R. (2001a, March). Relationships between preservice teachers’ self-efficacy,
task analysis, and classroom management beliefs. Paper presented at the annual
meeting of the Southwest Educational Research Association, New Orleans.
Henson, R. (2001b, November). The effect of participation in teacher research
professional development on teacher efficacy and empowerment. Paper presented
at the annual meeting of the Mid-South Educational Research Association, Little
Rock, AR.
125
Hirsch, E., & Emerick S. (2006). Teacher working conditions are student learning
conditions: A report on the 2006 North Carolina Teacher Working Conditions
Survey. Hillsborough, NC: Center for Teaching Quality.
Holloway, J. (2001). The benefits of mentoring. Educational Leadership, 58(8), 85-86.
Hoover-Dempsey, K. V., Bassler, O. C., & Brissie, J. S. (1987). Parent involvement:
Contributions of teacher efficacy, school socioeconomic status, and other school
characteristics. American Educational Research Journal, 24, 417-435.
Hoover-Dempsey, K. V., Bassler, O. C., & Brissie, J. S. (1992). Explorations in parent-
school relations. Alberta Journal of Educational Research, 85, 287-294.
Hoy, A. W. (2000, November). Changes in teacher efficacy during the early years of
teaching. Paper presented at the annual meeting of the American Educational
Research Association, New Orleans.
Hoy, A. W., & Spero, R. B. (2005). Changes in teacher efficacy during the early years of
teaching: A comparison of four measures. Teaching and Teacher Education,
21(4), 343-356.
Hoy, W. K. (2002). Faculty trust: A key to student achievement. Journal of School
Public Relations, 23(2), 88-103.
Hoy, W. K., Hoy, A. W., & Davis, H. (2009). Teachers’ self-efficacy beliefs. In K.
Wentzel & A. Wigfield (Eds.), Handbook of motivation at school (pp. 627-655).
New York: Routledge, Taylor, & Francis Group.
Hoy, W. K., & Kupersmith, W. J. (1985). The meaning and measure of faculty trust.
Educational and Psychological Research, 5(1), 1-10.
126
Hoy, W. K., & Miskel, C. G. (2001). Educational administration: Theory, research and
practice (6th ed.). Boston: McGraw-Hill.
Hoy, W. K., & Miskel, C. G. (2008). Educational administration: Theory, research, and
practice (8th ed.). New York: McGraw-Hill.
Hoy, W. K., & Sabo, D. J. (1998). Quality middle schools: Open and healthy. Thousand
Oaks, CA: Corwin Press.
Hoy, W. K., & Sweetland, S. R. (1999). School bureaucracies that work: Enabling not
coercive. Journal of School Leadership, 10(6), 525-541.
Hoy, W. K., Sweetland, S. R., & Smith, P. A. (2002). Toward an organizational model
of achievement in high schools: The significance of collective efficacy.
Educational Administration Quarterly, 38, 77-93.
Hoy, W. K., & Tschannen-Moran, M. (1999). Five faces of trust: An empirical
confirmation in urban elementary schools. Journal of School Leadership, 9, 184-
208.
Hoy, W. K., & Tschannen-Moran, M. (2003). The conceptualization and measurement
of faculty trust in schools: The Omnibus T-Scale. In W. K. Hoy & C. G. Miskel
(Eds.), Studies in leading and organizing schools (pp. 181-208). Greenwich, CT:
Information Age.
Hoy, W. K., & Woolfolk, A. E. (1993). Teachers’ sense of efficacy and the
organizational health of schools. The Elementary School Journal, 93, 356-372.
Hoyle, J. R. (2007). A preparation mystery: Why some succeed and others fail. Planning
and Changing, 38(3 & 4), 148-163.
127
Huling, L. (1998, November). Texas Board for Educator Certificates: Panel on novice
teacher induction support system: Final report. Austin, TX: Texas State Board
for Educator Certification.
Imants, J., & Van Zoelen, A. (1995). Teachers’ sickness absence in primary schools,
school climate and teachers’ sense of efficacy. School Organization, 15(1), 77-
86.
Ingersoll, R. (1999). Teacher turnover, teacher shortages, and the organization of
schools: A CTP working paper. Seattle: University of Washington, Center for the
Study of Teaching and Policy.
Ingersoll, R., & Bobbitt, S. (1995). Teacher supply, teacher qualifications, and teacher
turnover (1990-91). Washington, DC: National Center for Education Statistics.
Ingersoll, R. M., & Smith, T. M. (2004). Do teacher induction and mentoring matter?
NASSP Bulletin, 88(638), 28-40.
Jerald, C. (2007). Believing and achieving (Issue Brief). Center for Comprehensive
School Reform and Improvement. Retrieved January 4, 2010, from
http://www.eric.ed.gov/PDFS/ED495708.pdf.
Johnson, S., Berg, J., & Donaldson, M. (2005). Who stays in teaching and why: A review
of the literature on teacher retention. Cambridge, MA: Harvard Graduate School
of Education (The Project on the Next Generation of Teachers).
Johnson, S. M., & Birkeland, S. E. (2003). The schools that teachers choose.
Educational Leadership, 60(8), 20-24.
128
Johnson, S. M., & Kardos, S. M. (2004). Professional culture and the promise of
colleagues. In S. M. Johnson (Ed.), Finders and keepers: Helping new teachers
survive and thrive in our schools. San Francisco: Jossey-Bass.
Jones, D. L., & Sandidge, R. F. (1997). Recruiting and retaining teachers in urban
schools: Implications for policy and the law. Education and Urban Society,
29(2), 192-203.
Jordan, A., Krcaali-Iftar, G., & Diamond, P. (1993). Who has a problem, the student or
the teacher? Differences in teachers’ beliefs about their work with at-risk and
integrated exceptional students. International Journal of Disability, Development
and Education, 40, 45-62.
Korevaar, G. (1990, April). Secondary school teachers’ courses of action in relation to
experience and sense of self-efficacy. Paper presented at the annual meeting of
the American Educational Research Association, Boston.
Kurz, N., Woolfolk Hoy, A., & Hoy, W. K. (2007, April). Predictors of academic
optimism: Teachers’ instructional beliefs and professional commitment. Paper
presented at the annual meeting of the American Educational Research
Association, Chicago.
Ladson-Billings, G. (1994). The dreamkeepers: Successful teachers of African American
children. San Francisco: Jossey-Bass.
Levin, S. L. (1999). Development of an instrument to measure organizational trust.
(Doctoral dissertation, The George Washington University, 1999). Dissertation
Abstracts International, 60-02A, 481.
129
Lewicki, R. J., & Bunker, B. B. (1996). Developing and maintaining trust in work
relationships. In R. M. Kramer & T. R. Tyler (Eds.), Trust in organizations:
Frontiers of theory and research (pp. 114-139). Thousand Oaks, CA: Sage.
Locke, E. A., & Latham G. P. (1990). A theory of goal setting and task performance.
Englewood Cliffs, NJ: Prentice-Hall.
Longley, M. M. (2006). The principal’s trustworthiness: The impact on effective school
leadership as perceived by teachers on selected campuses in the North East
Independent School District. Unpublished doctoral dissertation, Texas A&M
University, College Station.
Losee, S. (2000). Caterpillars, clowns, and curry: School leaders and the ingredients for
self-efficacy. Retrieved January 5, 2010, from
http://www.eric.ed.gov/PDFS/ED439128.pdf.
Maslach, C., & Jackson, S. E. (1981). The measurement of experienced burnout. Journal
of Occupational Behavior, 2, 99-113.
Maslach, C., Jackson, S. E., & Leiter, M. P. (1996). Maslach Burnout Inventory manual
(3rd ed.). Palo Alto, CA: Consulting Psychologists Press.
Maslach, C., & Schaufeli, W. B. (1993). Historical and conceptual development of
burnout. In C. Maslach, W. B. Schaufeli, & T. Marek (Eds.), Professional
burnout: Recent developments in theory and research (pp. 1-16). Washington,
DC: Taylor & Francis.
130
Matheny, K. B., Gfroerer, C. A., & Harris, K. (2000). Work stress, burnout, and coping
at the turn of the century: An Adlerian perspective. Journal of Individual
Psychology, 56(1), 74-87.
Mayer, R. C., Davis, J. H., & Schoorman, F. D. (1995). An integrative model of
organizational trust. The Academy of Management Review, 20(3), 709-734.
Midgley, C., Feldlaufer, H., & Eccles, J. S. (1989). Change in teacher efficacy and
student self- and task-related beliefs in mathematics during the transition to
junior high school. Journal of Educational Psychology, 81, 247-258.
Miskel, C., McDonald, D., & Bloom, S. (1983). Structural and expectancy linkages
within schools and organizational effectiveness. Educational Administration
Quarterly, 19, 49-82.
Moore, W. P., & Esselman, M. E. (1992, April). Teacher efficacy, empowerment, and a
focused instructional climate: Does student achievement benefit? Paper
presented at the annual conference of the American Educational Research
Association, San Francisco.
Moore, W. P., & Esselman, M. E. (1994, April). Exploring the context of teacher
efficacy: The role of achievement and climate. Paper presented at the annual
meeting of the American Educational Research Association, New Orleans.
Muijs, R. D., & Reynolds, D. (2001). Teachers’ beliefs and behaviors: What really
matters. Journal of Classroom Interaction, 37, 3-15.
131
National Center for Education Statistics (NCES). (2003, August). National Education
Association’s estimates of school statistics, 1969-70 through 2002-03. Retrieved
January 5, 2010, from http://nces.ed.gov//programs/digest/d03/tables/dt078.asp.
Nieto, S. (2000). Placing equity front and center: Some thoughts on transforming teacher
education for a new century. Journal of Teacher Education, 51(3), 180-187.
Nieto, S. (2003). What keeps teachers going? New York: Teachers College Press.
Noonan, B., Walker, K., & Kutsyuruba, B. (2008, November 2). Trust in the
contemporary principalship. Canadian Journal of Educational Administration
and Policy (Issue #85). Retrieved April 17, 2010, from http://umanitoba.ca/
publications/cjeap/articles/noonan_et_al.html.
Oguz, A., & Topkaya, N. (2008). Secondary school non-thesis graduate program
students’ teaching self-efficacy beliefs and their attitudes toward teaching.
Akademik Bak, 14(4), 23-36. Retrieved April 5, 2010, from
http://www.akademikbakis.org/14/ozyeter.pdf.
Olson, L. (2000). Finding and keeping competent teachers. Education Week, 19(18), 12-
18.
Pajares, F. (1996). Self-efficacy beliefs in academic settings. Review of Educational
Research, 66, 543-578.
Pajares, F. (2002). Overview of social cognitive theory and of self-efficacy. Retrieved
January 3, 2010, from http://www.emory.edu/ EDUCATION/mfp/eff.html.
Podell, D., & Soodak, L. (1993). Teacher efficacy and bias in special education referrals.
Journal of Educational Research, 86, 247-253.
132
Prince, H. T. (1988). The leaders as stress manager. In J. Abrams, D. Puglis, & J. Balla
(Eds.), Leadership in organizations (pp. 323-340). New York: Avery.
Protheroe, N. (2008). Teacher efficacy: What is it and does it matter. Principal, 87(5),
42-45.
Raudenbush, S. W., Rowan, B., & Cheong, Y. (1992). Contextual effects on the self-
perceived efficacy of high school teachers. Sociology of Education, 65, 150-167.
Reeves, C., Emerick, S., & Hirsch E. (2007). Creating an atmosphere of trust: Lessons
from exemplary schools. Chapel Hill, NC: Center for Teaching Quality (CTO).
(ERIC Document Reproduction Service No ED498772).
Roach, A. T., & Kratochwill, T. R. (2004). Evaluating school climate and school culture,
Teaching Exceptional Children, 37, 10-17.
Roeser, R., Arbreton, A., & Anderman, E. (1993, February). Teacher characteristics and
their effects on student motivation across the school year. Paper presented at the
annual meeting of the American Educational Research Association, Atlanta.
Rollefson, M. R. (1992, July). Sources of newly hired teachers in the US: Results of the
1987-88 Schools and Staffing Survey. Paper presented at the NCES Annual Data
Conference, Washington, DC.
Rose, J. S., & Medway, F. J. (1981). Measurement of teachers’ beliefs in their control
over student outcome. Journal of Educational Research, 74, 185-190.
Rosenholtz, S. (1989). Teacher’s workplace: The social organization of schools. New
York: Longman.
133
Ross, J. A. (1992). Teacher efficacy and the effects of coaching on student achievement.
Canadian Journal of Education, 17(1), 51-65.
Ross, J. A. (1994). The impact of an in-service to promote cooperative learning on the
stability of teacher efficacy. Teaching and Teacher Education, 10, 381-394.
Ross, J. A. (1998). The antecedents and consequences of teacher efficacy. In J. Brophy
(Ed.), Advances in research on teaching (Vol. 7, pp. 49-74). Greenwich, CT: JAI
Press.
Ross, J. A., Hogaboam-Gray, A., & Gray, P. (2003). The contribution of prior student
achievement and school processes to collective teacher efficacy in elementary
schools. Retrieved January 5, 2010, http://www.eric.ed.gov/
PDFS/ED439128.pdf.
Ross, J. A., Hogaboam-Gray, A., & Hannay, L. (2001). Effects of teacher efficacy on
computer skills and computer cognitions of K-3 students. Elementary School
Journal, 102, 141-156.
Rotter, J. B. (1966). Generalized expectancies for internal versus external control of
reinforcement. Psychological Monographs, 80, 1-28.
Russell, T., & Spafford, C. (1986, April). Teachers as reflective practitioners in peer
clinical supervision. A paper presented at the annual meeting of the American
Educational Research Association, San Francisco.
Ryan, R. M., & Deci, E. L. (2000). Self-determination theory and the facilitation of
intrinsic motivation, social development, and well-being. American Psychologist,
55, 68-78.
134
Schmidt, P. (1992, February 12). Shortage of trained bilingual teachers is focus of both
concern and attention. Education Week, pp. 14-18.
Sergiovanni, T. J. (2000). The life world of leadership: Creating culture, community and
personal meaning in our schools. San Francisco: Jossey-Bass.
Shaughnessy, M. F. (2004, June). An interview with Anita Woolfolk: The educational
psychology of teacher efficacy. Educational Psychology Review, 16(2), 153-176.
Smith, P., Hoy, W. & Sweetland, S. (2001). Organizational health of high schools and
dimensions of faculty trust. Journal of School Leadership, 11(2), 135-151.
Soodak, L. C., & Podell, D. M. (1996). Teacher efficacy: Toward the understanding of a
multi-faceted construct. Teaching and Teacher Education, 12, 401-411.
Soodak, L. C., & Podell, D. M. (1998). Teacher efficacy and the vulnerability of the
difficult-to-teach student. In J. Brophy (Ed.), Advances in research on teaching,
Vol. 7: Expectations in the classroom (pp. 75-109). Stamford, CT: JAI Press.
Stanulis, R. N., Burrill, G., & Ames, K. (2007, June 22). Fitting in and learning to teach:
Tensions in developing a vision for a university-based induction program for
beginning teachers. Teacher Educator Quarterly. Retrieved April 13, 2010, from
http://www.accessmylibrary.com/article-1G1-195261842/intensive-mentoring-
way-help.html.
Stolp, S. W., & Smith, S. C. (1995). Transforming school culture: Stories, symbols,
values and the leader’s role. Retrieved April 13, 2010, from
http://scholarsbank.uoregon.edu/xmlui/handle/1794/3296.
135
Terry, B. D. (2007, October). Solving the math and science teacher shortage. Austin,
TX: Policy Perspective, Texas Public Policy Foundation.
Texas Education Agency. (2009, July). Academic Excellence Indicator System. Austin,
TX: Author.
Texas Higher Education Coordinating Board (THECB). (2000, October). Closing the
gaps by 2015 participation, success, excellence, research. Austin, TX: Author.
Texas State Board for Educator Certification (TSBEC). (2000). The cost of teacher
turnover. Austin, TX: Author.
Thrupp, M. (1999). Schools making a difference: Let’s be realistic. Philadelphia: Open
University Press.
Trentham, L., Silvern, S., & Brogdon, R. (1985). Teacher efficacy and teacher
competency ratings. Psychology in the Schools, 22, 343-352.
Tschannen-Moran, M. (2000). Ties that bind: The importance of trust in schools.
Essentially Yours: Coalition News for Ohio Schools. Retrieved January 4, 2010,
from http://www.ohioces.org/documents/newsletters/S2000.pdf.
Tschannen-Moran, M., & Hoy, W. K. (2000). A multidisciplinary analysis of the nature,
meaning, and measurement of trust. Review of Educational Research, 70, 547-
593.
Tschannen-Moran, M., & Woolfolk Hoy, A. (2001). Teacher efficacy: Capturing an
elusive construct. Teaching and Teacher Education, 17, 783-805.
Tschannen-Moran, M., Woolfolk Hoy, A. & Hoy, W. K. (1998). Teacher efficacy: Its
meaning and measure. Review of Education Research, 68, 202-248.
136
U.S. Department of Commerce. (1996). Current population reports: Population
projections of the United States by age, sex, race, and Hispanic origin: 1195 to
2050. Washington, DC: U.S. Government Printing Office.
U.S. Department of Education. (2002, May). Statistics Schools and Staffing Survey,
1999-2000 and 2000–01 Teacher Follow-up Survey. Washington, DC: National
Center for Education.
Van Houtte, M. (2007). In favour of a multi-method approach to differentiation-
polarization theory-building: A response to Abraham. Journal of Curriculum
Studies, 39(5), 603-607.
Van Maele, D., & Van Houtte, M. (2008, September 10-12). Faculty trust and school
characteristics: An exploration across secondary schools in Flanders. Presentation
at the European Conference on Educational Research: From Teaching to Learning?
Göteburg, Sweden.
Waddell, J. (2007). The time is now: The role of professional learning communities
strengthening the resiliency of teachers in urban schools. In D. Davis (Ed.),
Resiliency reconsidered (pp. 123-137). Charlotte, NC: Information Age.
Wheatley, K. (2005). The case for reconceptualizing teacher efficacy. Teaching and
Teacher Education, 21, 757-766.
Whitener, S. D., Gruber, K. J., Lynch, H., Tingos, K., Perona, M., & Fondelier, S.
(1997). Characteristics of stayers, movers, and leavers: Results from the Teacher
Follow-up Survey: 1994-95. Washington, DC: National Center for Education
Statistics.
137
Whitney, J. O. (1993). The trust factor. New York: McGraw-Hill.
Williams, S. (2001). A conceptualization of interpersonal trust in the workplace.
Proceedings of the Academy of Human Resource Development Conference,
Tulsa, OK.
Winer, B. J., Brown, R., & Michels, K. M. (1991). Statistical principles in experimental
design (3rd ed.). New York: McGraw-Hill.
Wong, H., & Wong, R. T. (1991). The first days of school: How to be an effective
teacher. Sunnyvale, CA: Harry K. Wong Publications.
Wood, A., & Stanulis, R. N. (2009). Quality induction: Fourth wave induction programs.
New Educator Journal, 5(1), 1-23.
Wood, A. L., & Waarich-Fischman, N. (2006). Two induction models in one urban
district: Transitioning to teaching credentialing. In J. Dangel (Ed.), Research on
teacher induction: Teacher education yearbook XIV (pp. 67-87). Lanham, MD:
Rowman & Littlefield Education.
Woolfolk, A. E., & Hoy, W. (1990). Prospective teachers’ sense of efficacy and beliefs
about control. Journal of Educational Psychology, 82(1), 81-91.
Yong, Z., & Yue, Y. (2007). Causes for burnout among secondary and elementary
school teachers and preventive strategies. Chinese Education and Society, 40(5),
78-85.
Zand, D. E. (1972). Trust and managerial problem solving. Administrative Science
Quarterly, 17(2), 229-239.
138
Zimpher, N. L. (1989, November, December). The RATE project: A profile of teacher
education students. Journal of Teacher Education, 82, 51-59.

139
APPENDIX A
INFORMATION SHEET
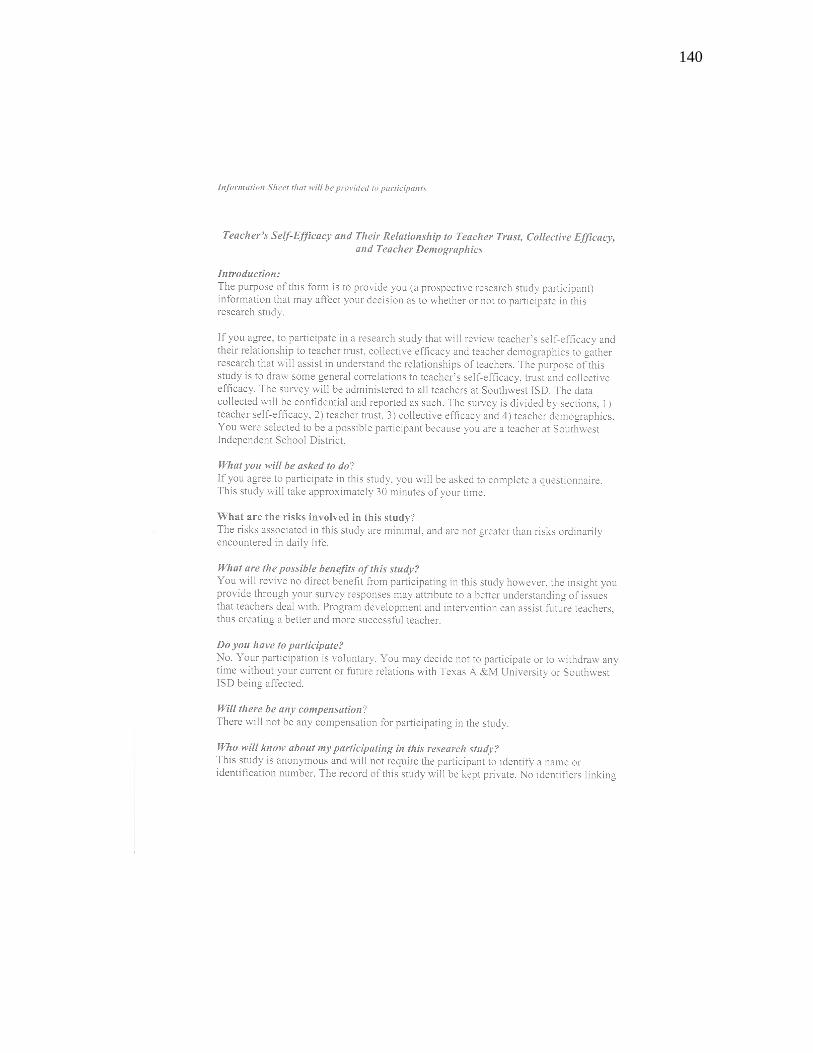
140
141
142
APPENDIX B
TEACHERS’ SENSE OF EFFICACY SHEET (LONG FORM)
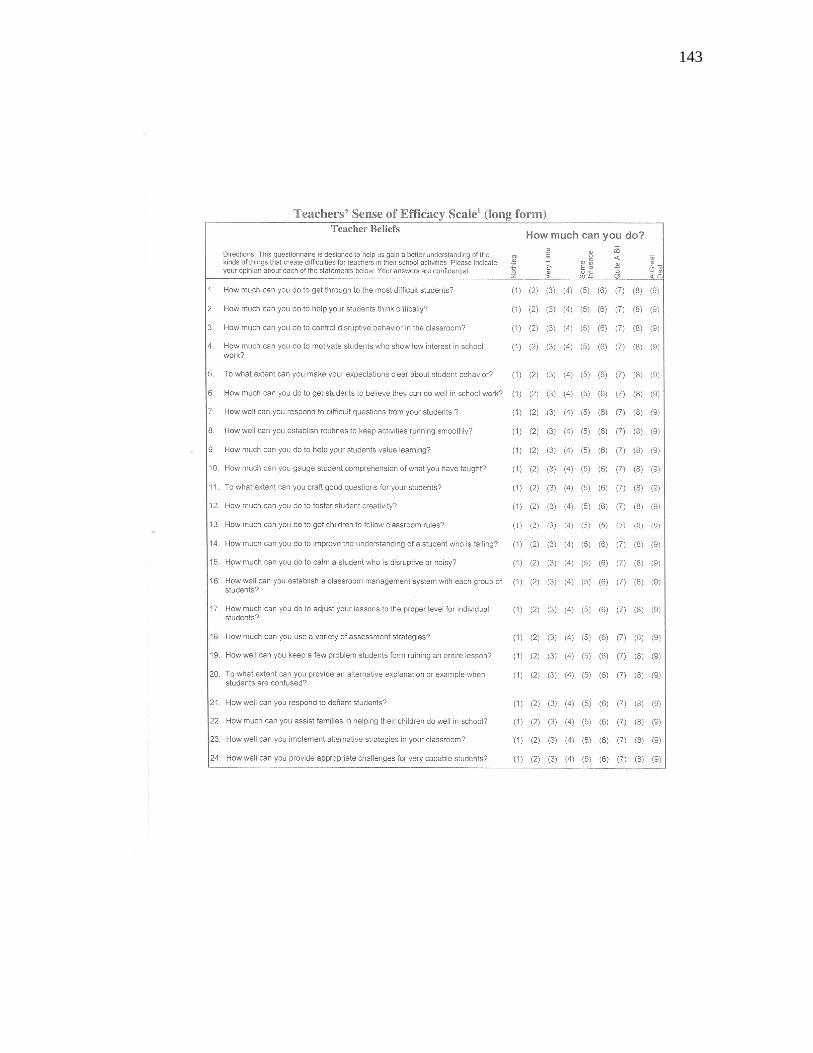
143
144
APPENDIX C
CE-SCALE
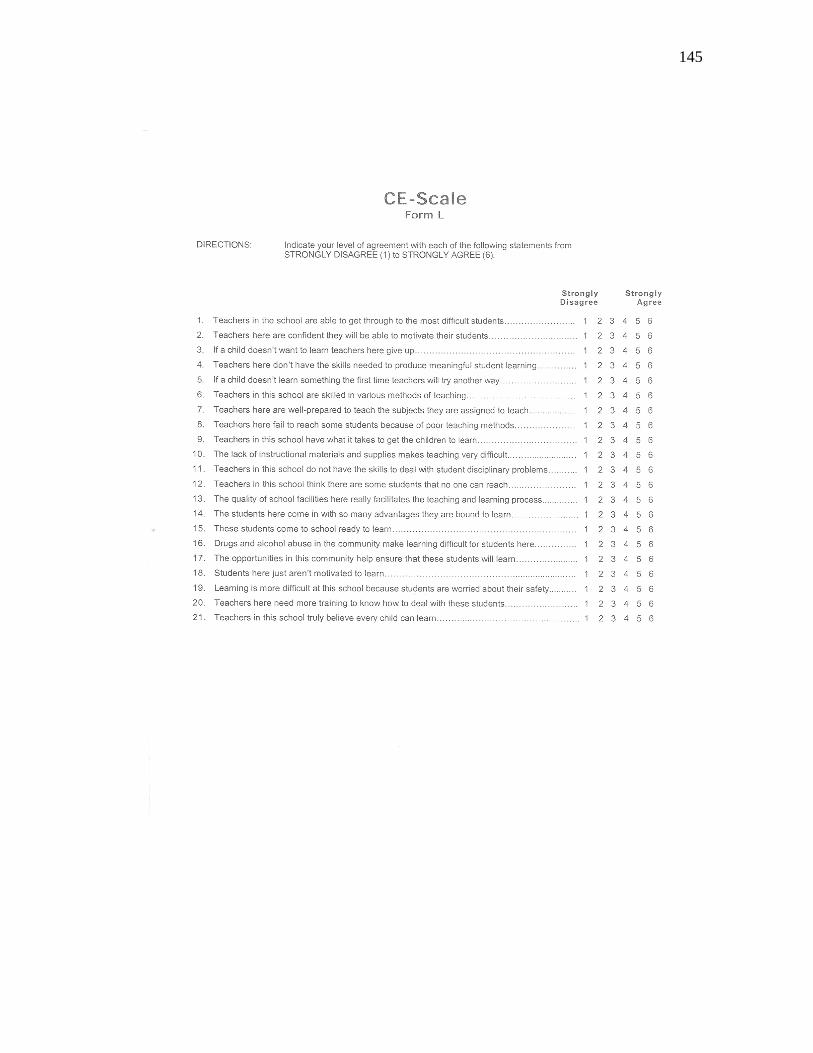
145

146
APPENDIX D
OMNIBUS T-SCALE
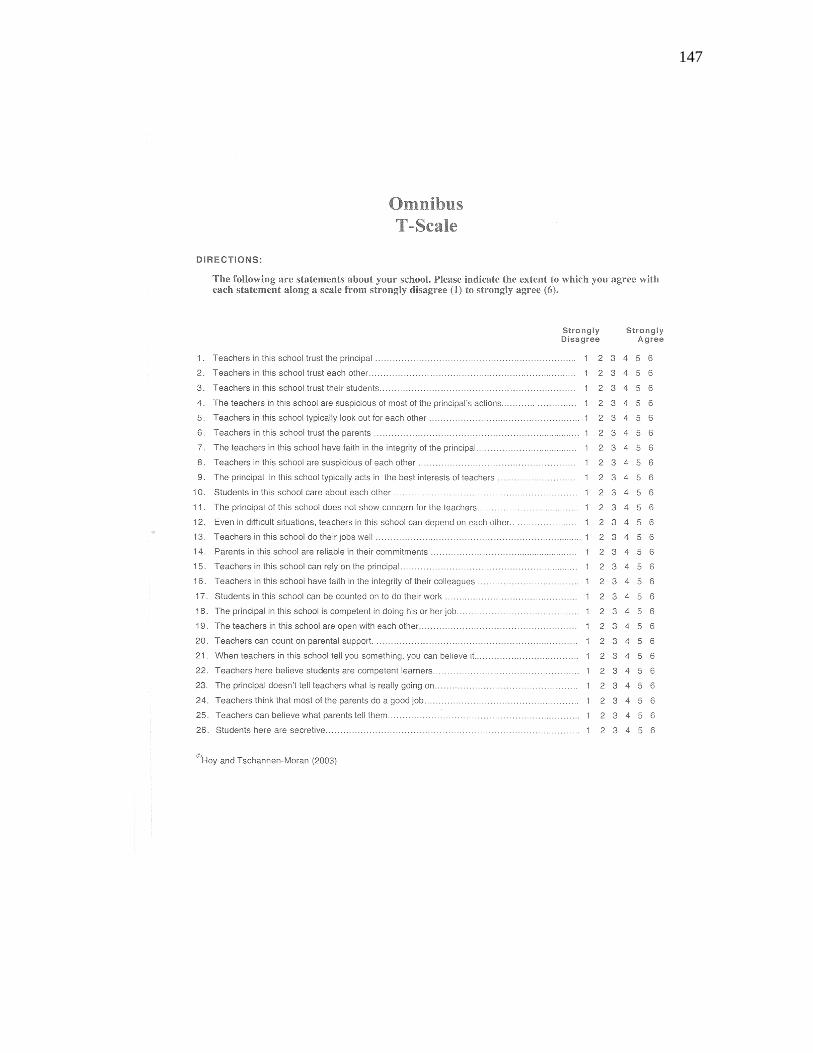
147
148
APPENDIX E
DEMOGRAPHICS
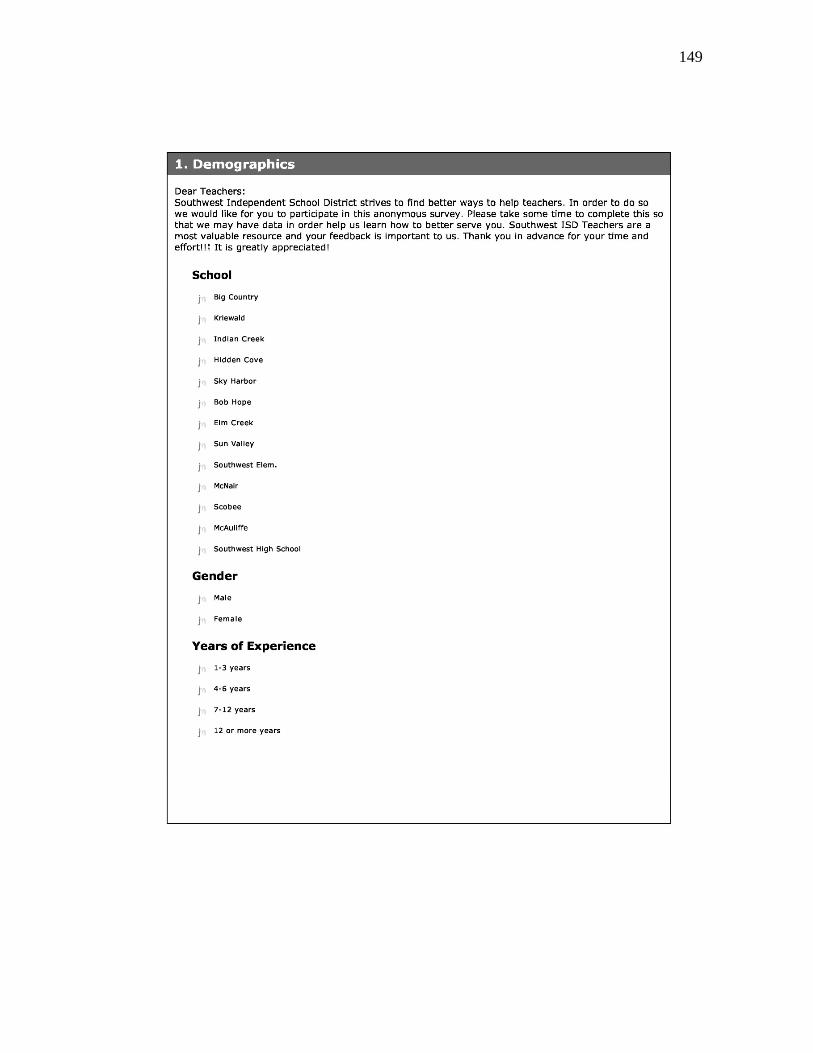
149
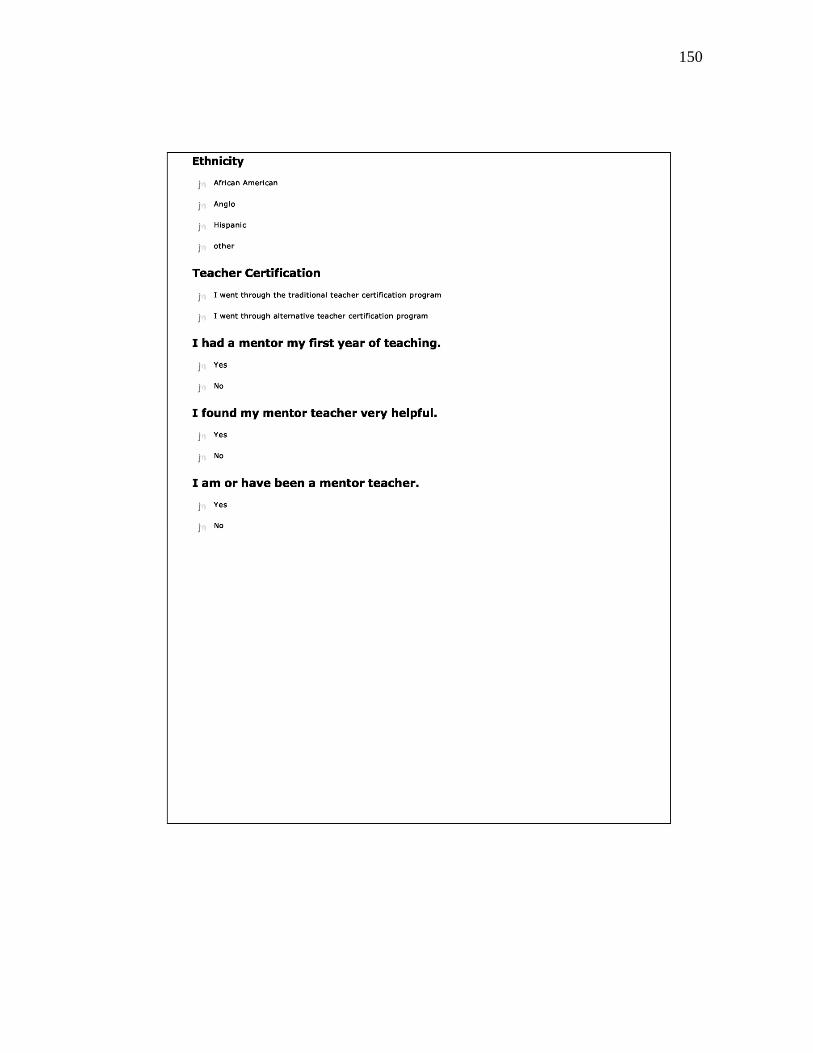
150
151
VITA
Jeanette Ball11914 Dragon Lane
San Antonio, Texas 78252
EDUCATION Doctor of Philosophy, 2010Major: Educational AdministrationTexas A&M UniversityCollege Station, Texas
Master of Arts, 1999Major: EducationThe University of Texas San AntonioSan Antonio, Texas
Bachelor of Arts, 1994Major: General StudiesSchreiner CollegeKerrville, Texas
CERTIFICATION Superintendent (Standard)Mid-Management Administrator (2012)Provisional Teaching (Life)
EXPERIENCE
1995-Present SOUTHWEST INDEPENDENT SCHOOL DISTRICTSan Antonio, Texas
Assistant Superintendent for Administration and HumanResources, 2010-Present
Executive Director of Employee and Student Services, 2007-2010
Director of Staff Development, 2005-2007
Principal, Big Country Elementary School, 2000-2005
Assistant Principal, Big Country Elementary School, 1998-2000
Teacher, McNair Middle School, 1995-1998
This dissertation was typed and edited by Marilyn M. Oliva at Action Ink, Inc.