an analysis of the costs, benefits, and implications of...
TRANSCRIPT

1
An Analysis of the Costs, Benefits, and Implications
of Different Approaches to Capturing the Value of Renewable Energy Tax Incentives
Mark Bolinger Lawrence Berkeley National Laboratory
May 2014
This work was co-funded by the U.S. Department of Energy’s Office of Energy Efficiency and Renewable Energy (Solar Energy Technologies Office and Wind and Water Power Technologies Office)
under Contract No. DE-AC02-05CH11231.

0%
2%
4%
6%
8%
10%
12%
Jan-05 Jan-06 Jan-07 Jan-08 Jan-09 Jan-10 Jan-11 Jan-12 Jan-13 Jan-14
Tax Equity Yield (after-tax)
15-Year Debt Interest Rate (after-tax)
15-Year Debt Interest Rate (pre-tax)
Purpose: Explore the impact of policy change on project finance and, in turn, LCOE
• A large portion of the utility-scale market relies on third-party tax equity to monetize federal tax benefits
• Tax equity is an expensive source of capital – twice as expensive as project-level term debt (see graph)
• Even so, the benefits of tax equity currently outweigh its incremental cost
2
• Looking ahead, however, there are plausible policy scenarios in which the relative benefit that tax equity provides could decrease and/or the relative cost of tax equity could increase
• These scenarios could potentially prompt shifts in how wind and solar projects are financed, leading to a lower cost of capital and a corresponding reduction in PPA prices (all else equal)
• The purpose of this work is to develop tools that allow for the exploration of these scenarios and their impact on the LCOE (or levelized PPA price) of wind and solar
Adapted from BNEF

Three ways that sponsors can extract value from excess depreciation deductions and tax credits
3
• Top graph shows the profile of tax benefits generated by a wind project over time
• Sponsors can realize this profile by (1) applying the “excess” tax benefits (i.e., those above the red line) against outside income or (2) monetizing the tax benefits via third-party tax equity (top graph)
• Otherwise, sponsors without tax appetite must (3) carry forward the tax benefits over time (bottom graph)
0%
2%
4%
6%
8%
10%
12%
14%
16%
1 2 3 4 5 6 7 8 9 10 11 12 13 14 15 16 17 18 19 20 21 22 23 24 25
Tax
Bene
fit a
s % o
f Cap
Ex
Year of Operation
PTCs (as generated)Depreciation (as generated)Present Value = 57% of CapEx (30% PTC and 27% depreciation)
0%
2%
4%
6%
8%
10%
12%
14%
16%
1 2 3 4 5 6 7 8 9 10 11 12 13 14 15 16 17 18 19 20 21 22 23 24 25
Tax
Bene
fit a
s % o
f Cap
Ex
Year of Operation
PTCs (as realized, if no outside tax appetite)Depreciation (as realized, if no outside tax appetite)Present Value = 31% of CapEx (10% PTC and 21% depreciation)

Three financial models to analyze tradeoffs between monetizing tax benefits or using them internally
1) Sponsor Equity/Debt model: No tax equity – project financed with mix of sponsor equity & term debt (or, perhaps in the future, MLPs/REITs). Tax benefits (NOL and PTC or ITC) carried forward as needed based on sponsor tax appetite. PPA price set to reach sponsor hurdle rate.
2) Sale-Leaseback model: Sponsor sells project to tax equity investor and leases it back. Tax equity (lessor) gets all tax benefits as well as ongoing lease payments sized to reach its hurdle rate. Sponsor (lessee) pays lease payments and O&M costs, but keeps PPA revenue, with PPA price set to reach its own hurdle rate.
3) Partnership Flip model: Used more for wind than solar, and involves sponsor and tax equity investor partnering together to share the costs, benefits, and risks of the project (see report for more details)
Each model solves for the minimum levelized PPA price needed to recoup all costs, allow each investor to reach target rates of return, and satisfy any other constraints (e.g., DSCR)
4
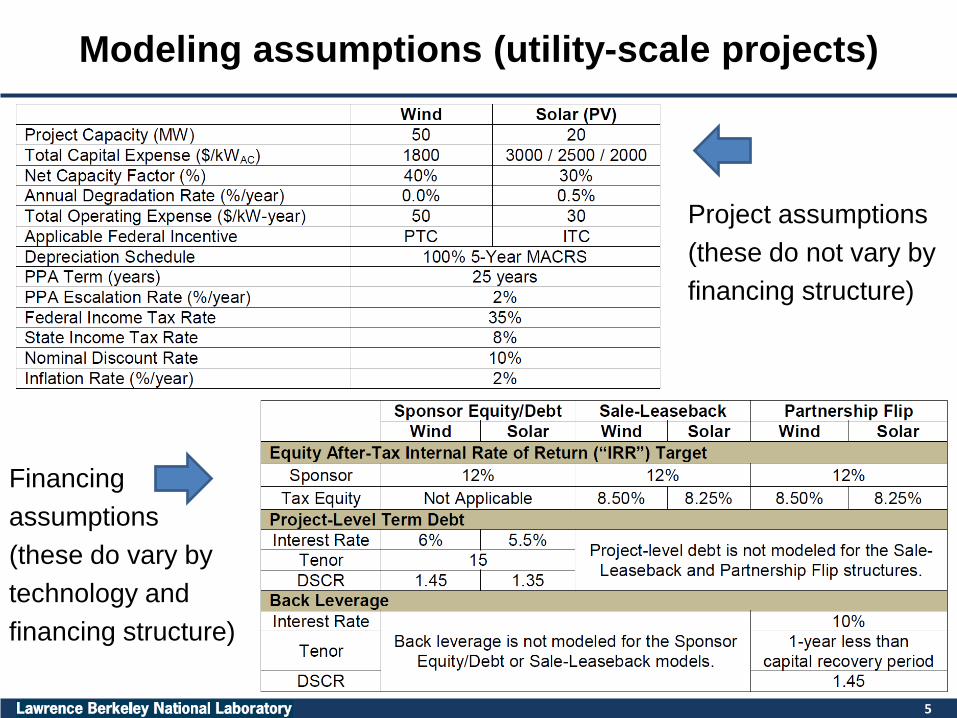
Modeling assumptions (utility-scale projects)
5
Project assumptions (these do not vary by financing structure)
Financing assumptions (these do vary by technology and financing structure)

Using these three models, the report analyzes four wind and five solar scenarios
4 Wind Scenarios: 1) Permanent PTC Expiration 2) PTC Made Refundable 3) Comprehensive Tax Reform 4) Changes in the Cost of Tax Equity (and Debt)
5 Solar Scenarios: 1) Scheduled Reversion of the Nonrefundable ITC from 30% to 10% 2) ITC Made Refundable (same as Section 1603 cash grant) 3) Solar Gets the PTC (Nonrefundable or Refundable) 4) Comprehensive Tax Reform 5) Changes in the Cost of Tax Equity (and Debt)
None of these scenarios are intended to be prescriptive. Rather, these are all scenarios that have been widely discussed in the market, and that serve as useful examples to demonstrate the tools and methodology developed here.
6
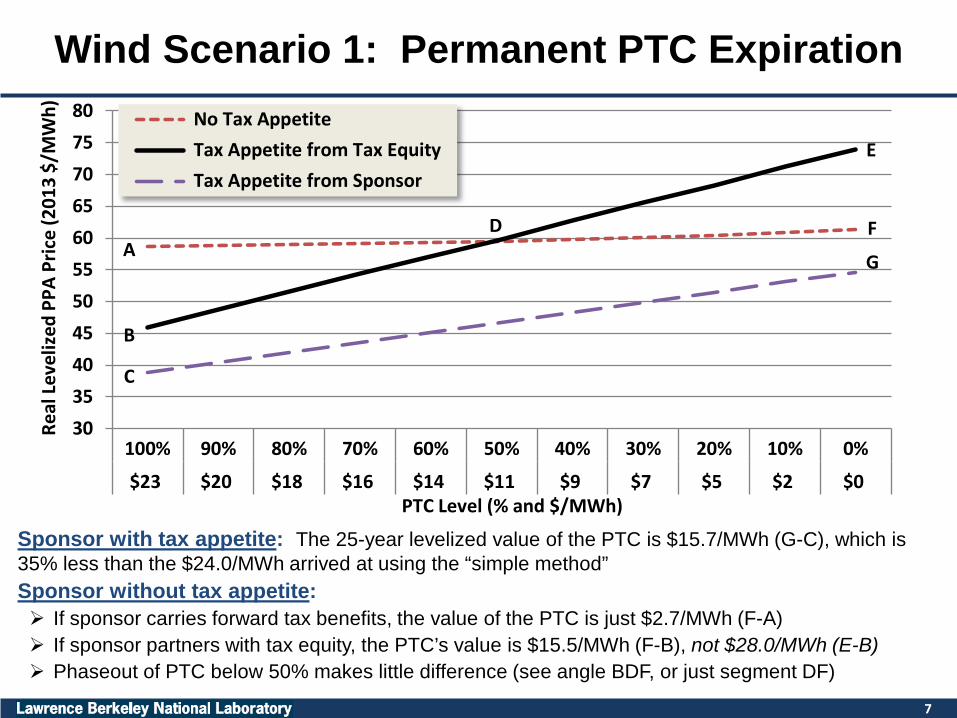
Wind Scenario 1: Permanent PTC Expiration
Sponsor with tax appetite: The 25-year levelized value of the PTC is $15.7/MWh (G-C), which is 35% less than the $24.0/MWh arrived at using the “simple method” Sponsor without tax appetite: If sponsor carries forward tax benefits, the value of the PTC is just $2.7/MWh (F-A) If sponsor partners with tax equity, the PTC’s value is $15.5/MWh (F-B), not $28.0/MWh (E-B) Phaseout of PTC below 50% makes little difference (see angle BDF, or just segment DF)
7
3035404550556065707580
100% 90% 80% 70% 60% 50% 40% 30% 20% 10% 0%
$23 $20 $18 $16 $14 $11 $9 $7 $5 $2 $0PTC Level (% and $/MWh)
No Tax Appetite Tax Appetite from Tax Equity Tax Appetite from Sponsor
Real
Lev
eliz
edPP
A Pr
ice
(201
3 $/
MW
h)
A
B
D F
G
C
E

3035404550556065707580
100% 90% 80% 70% 60% 50% 40% 30% 20% 10% 0%
$23 $20 $18 $16 $14 $11 $9 $7 $5 $2 $0PTC Level (% and $/MWh)
No Tax Appetite Tax Appetite from Tax Equity Tax Appetite from Sponsor
Real
Lev
eliz
edPP
A Pr
ice
(201
3 $/
MW
h)
A
B
D F
G
C
E
This same graph also illustrates how much of the tax benefits are “lost” to tax equity
• At 100% PTC, the maximum value of having tax appetite is $19.8/MWh (A-C) • Sponsors without tax appetite can capture 64% of this value ($12.8/MWh, A-B) by partnering
with third-party tax equity • The flip side is that 36% of this value ($7.1/MWh, B-C) is lost to the high cost of tax equity • This loss grows at lower PTC levels until reaching 100% at point D, after which tax equity no
longer makes sense (a sponsor without tax appetite is better off carrying tax benefits forward) 8
Below ~50% PTC, the cost of tax equity outweighs the benefits of monetization

Other estimates of loss range from 15%-50% (again, these apply only to sponsors without tax appetite)
October 2008: Two different estimates of 15% and 50% loss come out of AWEA’s annual finance forum.
January 2010: At the request of the Bipartisan Policy Center, Bloomberg New Energy Finance looked at this issue specifically, and also found that tax credits are only about 50% efficient.
May 2011: At WINDPOWER 2011, private equity firm Hudson Clean Energy Partners opined that the Federal subsidy provided to wind projects could be cut by 30% if awarded as cash rather than as tax benefits. On the same panel, wind sponsor Pattern Energy thought the reduction in the subsidy could be even greater – maybe 40-50% – if it were awarded as cash.
June 2011: One month later, a different Hudson CEP representative estimated in Congressional testimony a slightly larger loss of 35%-40%.
September 2012: The Climate Policy Initiative also found that “tax incentives leak money,” and that wind project sponsors lose roughly 33% of the value of the incentive, while solar project sponsors lose roughly 50%.
The scope of the analysis, as well as underlying market conditions, can have a significant impact on the result. For example, changing the wind CapEx from $1.8/W to $2.2/W (more representative of 2008/2009 conditions) increases the size of the loss to 54% (up from 36% today).
9

Wind Scenario 2: PTC Made Refundable
Refundable PTC only impacts the No Tax Appetite line (AF) • Point A (full PTC) drops by $11/MWh, and is nearly competitive with tax equity (point B) • Point F (no PTC) is unchanged (i.e., line AF steepens) • Crossover point D increases to 90% (from 50% under a nonrefundable PTC), which means that a
refundable PTC partially mitigates the impact of a phaseout for all PTC levels below 90% • These benefits come at no incremental cost to taxpayers (assuming no increase in deployment)
10
3035404550556065707580
100% 90% 80% 70% 60% 50% 40% 30% 20% 10% 0%
$23 $20 $18 $16 $14 $11 $9 $7 $5 $2 $0PTC Level (% and $/MWh)
No Tax Appetite Tax Appetite from Tax Equity Tax Appetite from Sponsor
Real
Lev
eliz
edPP
A Pr
ice
(201
3 $/
MW
h)
AB
D
F
G
C
E

Wind Scenario 3: Comprehensive Tax Reform
• Data points in the first column match points A, B, C from Scenario 1; columns 2 and 3 phase in tax reform (first the shift to slow depreciation, then to the lower tax rate)
• “No Tax Appetite” is barely impacted by tax reform, while the other two “tax-efficient” structures are hurt by the depreciation switch in particular
• Tax equity is barely competitive under tax reform, and becomes increasingly less so during the eventual PTC phaseout (shown in the last 4 columns)
• Advantage of tax appetite shrinks and eventually disappears during PTC phaseout, as slower depreciation can be readily absorbed, even by sponsors without tax appetite
11
Senate Finance Committee has proposed: (A) replacing 5-year MACRS
depreciation with a much slower schedule of 5%/year (100% declining balance);
(B) effectively maintaining the PTC for wind; and
(C) reducing the corporate tax rate (assumed here from 35% to 25%)
30
40
50
60
70
80
90
100% PTC Slow Dep 25% tax 75% PTC 50% PTC 25% PTC 0% PTC
BAU Tax Reform (100% PTC) Eventual Phaseout
No Tax Appetite Tax Appetite from Tax Equity Tax Appetite from Sponsor
Real
Lev
eliz
edPP
A Pr
ice
(201
3 $/
MW
h)

Wind Scenario 4: Changes in the Cost of Tax Equity (and Debt)
• A 300 basis point increase in the cost of tax equity adds just $5-$6/MWh to levelized PPA prices (see the positive error bars), while a 200 basis point decrease subtracts just $4-$5/MWh (see the negative error bars)
• The impact of increasing debt interest rates by 200 basis points is also rather muted: just $2-$3/MWh in the case of a sponsor with tax appetite, and $3-$4/MWh in the case of a sponsor without tax appetite
• These changes are not enough to shift the financing outcome in the BAU scenario, but are potentially enough to make No Tax Appetite competitive with Tax Equity under a refundable PTC or tax reform
12
Reasons why the cost of tax equity could increase: • Expiration of 1603 grant • No more DOE loan guarantee • Rise of solar (utility-scale and
third-party ownership) • Higher wind capacity factors • Falling wind/solar PPA prices • Tax equity already provides net
benefits (existing headroom) 35
40
45
50
55
60
65
70
BAU (100% PTC) Refundable (100% PTC) Tax Reform (100% PTC)
No Tax Appetite(debt interest rate 6-8%) Tax Appetite from Sponsor(debt interest rate 6-8%) Tax Appetite from Tax Equity(tax equity yield 6.5-11.5%)
Real
Lev
eliz
edPP
A Pr
ice
(201
3 $/
MW
h)

Solar Scenarios 1-3 (at both $3/W and $2/W): 10% ITC, PTC, and Refundable Credits
13
• BAU shows that sponsors without tax appetite forfeit >60% of tax benefits to tax equity • Although reverting to a 10% ITC hurts all structures (except “No Tax Appetite”), a 10% ITC at
$2/W still yields lower PPA prices than a 30% ITC at $3/W • PTC yields PPA prices in between a 30% and 10% ITC (and approaches 30% ITC at $2/W) • PPA price differences between structures and scenarios are smaller at $2/W than at $3/W • Tax equity is uncompetitive with a refundable 30% ITC, or even with a nonrefundable 10% ITC or
PTC (except at $2/W)
Refundable tax credits only impact sponsors without tax appetite (“No Tax Appetite”)
50
60
70
80
90
100
110
120
130
30% ITC (BAU) 10% ITC PTC 30% ITC (BAU) 10% ITC PTC
$3/W-AC $2/W-AC
Tax Appetite from Tax Equity
No Tax Appetite (nonrefundable credits)
No Tax Appetite (refundable credits)
Tax Appetite from Sponsor
Real
Lev
eliz
ed P
PA P
rice
(201
3 $/
MW
h)

Solar Scenario 4 (at $2.50/W): Comprehensive Tax Reform
14
• Only minor differences between 20% ITC and PTC:
Difference between sponsors with and without tax appetite is narrower under the PTC
Tax equity structure fares worse under the PTC than the 20% ITC
• Tax equity not competitive under tax reform assuming either a 20% ITC or a PTC
• Phaseout of the credit eliminates the difference between sponsors with and without tax appetite, as the slower depreciation schedule is readily absorbed by all sponsors (no need to carry forward smaller/slower deductions)
Proposed “Clean Energy Credit” taken as a 20% ITC in the top graph, and a PTC in the bottom graph
5060708090
100110120130140150
30% ITC Slow Dep 20% ITC 25% tax 15% ITC 10% ITC 5% ITC 0% ITC
BAU Tax Reform Eventual Phaseout
No Tax Appetite Tax Appetite from Tax Equity Tax Appetite from Sponsor
Real
Lev
eliz
edPP
A Pr
ice
(201
3 $/
MW
h)
5060708090
100110120130140150
30% ITC Slow Dep 100% PTC 25% tax 75% PTC 50% PTC 25% PTC 0% PTC
BAU Tax Reform Eventual Phaseout
No Tax Appetite Tax Appetite from Tax Equity Tax Appetite from Sponsor
Real
Lev
eliz
edPP
A Pr
ice
(201
3 $/
MW
h)

Installed cost reduction needed to leave PPA prices unchanged under tax reform
15
• The previous slide modeled tax reform at $2.50/WAC, but most of the changes under proposed tax reform will not happen for a few years (if at all), suggesting time for further reductions in installed costs Slow depreciation proposed to begin for assets placed in service in 2015 (looking unlikely)
Technology-neutral clean energy credit not implemented until 2017, which means that the absolute earliest that the phaseout could occur would be 2018-2021
• The table above shows the installed costs required (all else equal) to leave levelized PPA prices (for a sponsor with tax appetite) unchanged from the BAU scenario (i.e., 30% ITC at $2.50/W-AC) Not much difference between installed costs required under 20% ITC vs. PTC
$1.7/WAC to $1.8/WAC by 2017 seems feasible, given that some projects already at $2/WAC
~$1.4/WAC by 2021 (seven years from now) at the earliest

Solar Scenario 5: Changes in the Cost of Tax Equity (and Debt)
• Sponsor with tax appetite is indisputably the most competitive regardless of the cost of capital (at least within the ranges modeled here)
• Refundable credits (which only impact sponsors without tax appetite, and which are not applicable to the tax reform scenario) outcompete tax equity except for in the unlikely event that the cost of tax equity declines while the cost of debt increases
• The same generally holds true for nonrefundable credits under the 10% ITC, PTC, and tax reform scenarios: tax equity is generally not competitive with “No Tax Appetite” unless the cost of tax equity declines and/or the cost of debt increases
16
Reasons why the cost of tax equity could increase: • Expiration of 1603 grant • No more DOE loan guarantee • Rise of solar (utility-scale and
third-party ownership) • Higher wind capacity factors • Falling wind/solar PPA prices • Tax equity already provides net
benefits (existing headroom) 60
70
80
90
100
110
120
130
BAU (30% ITC) 10% ITC PTC Tax Reform (20% ITC)
No Tax Appetite (nonrefundable) No Tax Appetite (refundable) Tax Appetite from Sponsor Tax Appetite from Tax Equity
Real
Lev
eliz
edPP
A Pr
ice
(201
3 $/
MW
h) Ranges represent tax equity yields of 6.25-11.25% (8.25% base case) and debt interest rates of 5.5-7.5% (5.5% base)
17
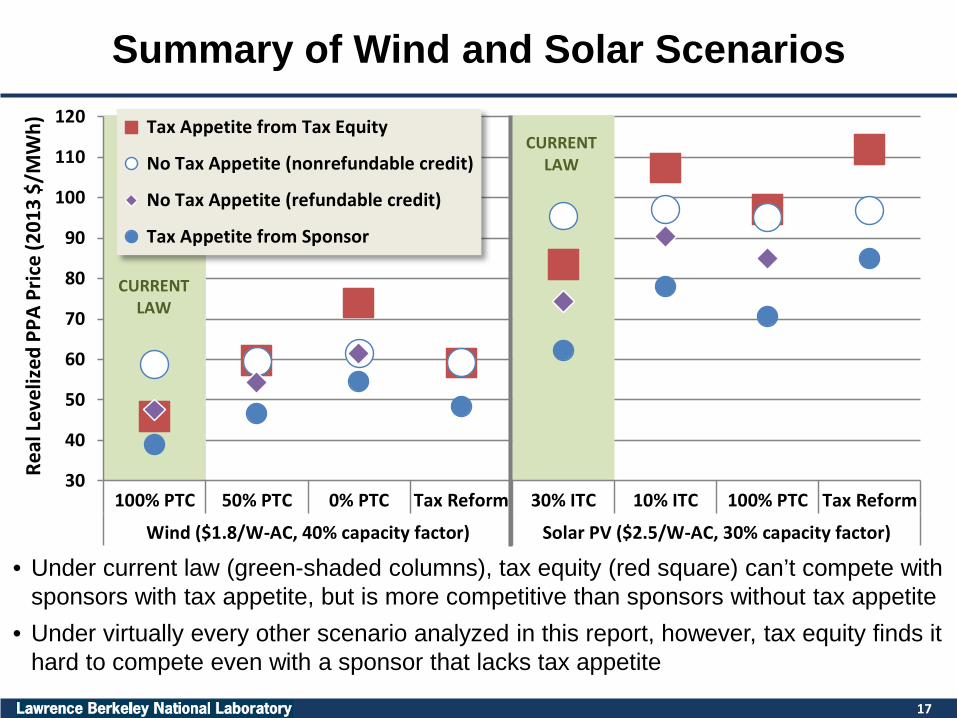
Summary of Wind and Solar Scenarios
30
40
50
60
70
80
90
100
110
120
100% PTC 50% PTC 0% PTC Tax Reform 30% ITC 10% ITC 100% PTC Tax Reform
Wind ($1.8/W-AC, 40% capacity factor) Solar PV ($2.5/W-AC, 30% capacity factor)
Tax Appetite from Tax Equity
No Tax Appetite (nonrefundable credit)
No Tax Appetite (refundable credit)
Tax Appetite from Sponsor
Real
Lev
eliz
ed P
PA P
rice
(201
3 $/
MW
h)
CURRENT LAW
CURRENT LAW
• Under current law (green-shaded columns), tax equity (red square) can’t compete with sponsors with tax appetite, but is more competitive than sponsors without tax appetite
• Under virtually every other scenario analyzed in this report, however, tax equity finds it hard to compete even with a sponsor that lacks tax appetite

Parting thoughts…
1) Report looks at a variety of plausible policy scenarios and finds that, in most cases, the importance of tax equity fades as even those sponsors without tax appetite are better off financing with debt and carrying forward unused tax benefits
2) This policy-induced financing shift leads to a lower cost of capital, which in turn partially mitigates the otherwise negative impact of the policy shift Notably, this reduction in the cost of capital does not require wind and solar having access to MLPs or
REITs (though these instruments could be useful, particularly if tax equity’s importance fades) Instead, liquid debt markets are readily available to finance (currently at low cost) utility-scale projects
3) Modeling is done on an “all else equal” basis (e.g., assuming no reduction in the cost of tax equity), but tax equity investors could always lower their target returns in order to remain competitive under these scenarios If they do, this would only impact findings about how projects are likely to be financed (e.g., whether
with tax equity or debt) The resulting levelized PPA prices – which are of most interest – would not change
4) This work highlights the importance of the debt market (coupled with a sponsor’s ability to carry forward unused tax benefits) as a backstop against which tax equity must compete in order to remain relevant, as well as the usefulness of this methodology as a way to place bounds on the likely range of market impacts stemming from future policy changes Developing this methodology and capability may be just as (or more) important than the findings
presented, given the considerable policy uncertainty going forward
18

19
Questions?
E-mail the author at [email protected]
Bolinger, Mark. 2014. An Analysis of the Costs, Benefits, and Implications of Different Approaches to Capturing the Value of Renewable Energy Tax Incentives. LBNL-6610E. Berkeley, California: Lawrence Berkeley National Laboratory
This work was co-funded by the U.S. Department of Energy’s Office of Energy Efficiency and Renewable Energy (Solar Energy Technologies Office and Wind and Water Power Technologies Office)
under Contract No. DE-AC02-05CH11231.