an analysis of the inmarsat data from mh370mh370.bookofresearch.com/documents/mh370 data analysis...
TRANSCRIPT

1
An Analysis of the Inmarsat Data from MH370
Dr Richard E Cole University College London
16/6/14 issue 1
Summary:
The detailed analysis of the Inmarsat communications data used in the search for Flight MH370 has not
been released to the Public. This paper describes a model for interpreting the Inmarsat Doppler or BFO
data which has been developed using the published ‘raw’ Inmarsat data and basic model plus other
information in the public domain. The model requires only minor adjustments for frequency drift to predict
final search areas consistent with those declared by the official investigation. Without access to the data
from other flights a full verification of this model is not possible. However, based on the information
available no major discrepancies in the BFO analysis performed by the official investigation have been
identified.
Contents
1 Introduction ............................................................................................................................................... 2
2 The Inmarsat Data ..................................................................................................................................... 2
3 The BTO (Ping‐Arc) Model ......................................................................................................................... 3
4 The BFO (Doppler) Model .......................................................................................................................... 5
5 Radar Data ............................................................................................................................................... 12
6 The Track Model ...................................................................................................................................... 13
7 Results of using the BTO and BFO data with the Track Model ................................................................ 14
8 Levels of statistical confidence ................................................................................................................ 26
9 Conclusions .............................................................................................................................................. 27
10 References ........................................................................................................................................... 27
List of Appendices:
A List of acronyms
B Ping Arcs distances derived from the BTO measurements
C Determination of the term D3satellite → ground
D Determination of the constant D5offset
E Description of the statistical tests used for BFO data
F Plots of the components of the Refined BFO Model
G Wind data

2
1 Introduction
Contact was lost with Malaysian Airlines flight MH370 at around 17:20UT on the 7th March 2014. Despite
extensive searches no trace has been found three months later. During March 2014 the Inmarsat company
released limited information regarding communications between MH370 and their satellite system [2]. It
was stated that the aircraft had remained airborne for many hours after radio contact was lost and had
travelled distances of thousands of kilometres. Later in March 2014 Inmarsat and others released the
conclusion that the aircraft had travelled South to a point in the Southern Ocean or South Indian Ocean.
The original Inmarsat communication log was released at the end of May 2014 [1]. However, the full
analysis has not been presented by the Malaysian authorities on the stated basis that the information is
confidential to the continuing investigation. This has resulted in speculation over the data analysis process
that has been followed.
The purpose of this paper is to present an independent analysis of the satellite communications data
(including the so‐called pings) to assist in understanding the process followed by the investigation in
reaching their published conclusions. The paper is not intended to criticise the investigation or to offer an
alternative solution for the final location of MH370.
The analysis is based on the Inmarsat data and the reported turn‐back point of MH370 at 17:21 on 7th
March 2014. No other position data reported at the time is used, but a comparison with the radar data on
unidentified targets near Malaysia is offered.
The information used is that released by Inmarsat and the Malaysian authorities together with other data
available in the public domain. No confidential information has been used.
In the text the original sources are referenced in square brackets and listed at the end of the paper. Text
quoted from original documents is shown in italics.
2 The Inmarsat Data
2.1 The Data
The Inmarsat raw data was released on 27th May together with limited explanatory notes [1]. This was
stated to be the logs from the ground station before any data processing specific to the MH370 situation –
it is the routine data stored for all communications in the Inmarsat system. The data includes the following
key parameters:
Burst Timing Offset (BTO): A measure of the total time for radio signals to travel from the Inmarsat
control centre via the satellite to the aircraft and back. The BTO is given in microseconds.
Burst Frequency Offset (BFO): A measure of the frequency offset of the radio signal received at the
Inmarsat ground station from the expected value. The BFO is given in Hertz (Hz).
These data are stated by Inmarsat to be adequate to derive the geographical position of the aircraft
between 17:21UT on the 7th March and 00:19UT on the 8th March.
The models used by Inmarsat and other agencies to analyse the data were not released, beyond the outline
published on 25/3/14 [2].

3
2.2 The Satellite System
This paper does not attempt to give an end‐to‐end description of the Inmarsat 3F1 satellite or its Inmarsat‐
C communications payload. Details of the latter are given in an application to the US FCC for the Inmarsat
3F3 satellite [3] which is believed to be very similar or identical to Inmarsat 3F1. Details of the Inmarsat
control system for the Inmarsat‐3 series were published some years ago [6].
The information that is relevant to this paper is as follows:
1. Inmarsat 3F1 satellite is in a near Geostationary Orbit with an inclination of 1.67degrees. The orbit
has a small eccentricity which affects its distance from the Earth by a few kilometres over each
orbit.
2. The Inmarsat‐C communications payload communicates with the Land, Maritime and Aeronautical
terminals at L‐band frequencies (1 to 2 GHz) and with the ground station at C‐band frequencies
(roughly 4–8 GHz). The payload acts as a ‘bent‐pipe’, receiving and re‐transmitting the signals
received without decoding them to digital form – it does not ‘read’ the data.
3. The precise communication frequency used for the return path from the satellite terminal on
MH370 and to the ground station at Perth were 1.6GHz and 3.6GHz respectively.
4. The communications data is transferred at C‐band to the Perth ground station at 31°48′21″S,
115°53′16″E. The satellite is controlled by the Fucino ground station at 41°58'44"N, 13°36'7"E.
Orbital elements for the Inmarsat 3F1 satellite for the period including 7th March 2014 were obtained from
public sources. The satellite’s position in space and its spatial relationships to the ground stations were
obtained using Orbitron, a simple orbital analysis tool with which the Author was familiar. Comparisons
with data published by others using the industry standard STK package did not reveal any discrepancies.
3 The BTO (Ping‐Arc) Model
The BTO values are related to the time taken for the radio signals to travel from the ground to the satellite,
then to the aircraft and then back again to the satellite and ground station. However, it is not that total
time for that trip (which would be much longer than the BTO numbers in the log) but some parameter
derived from it. The Inmarsat notes state:
The round trip time for a message is a combination of:
1. Time from the ground station → satellite → aircra → satellite ground sta on
2. Processing time within the ground station, satellite and aircraft terminal, which are constant
The BTO is a value (in microseconds) relative to a terminal at a nominal fixed location. Only R‐
Channel messages are used.
The nominal fixed terminal (hereafter the nominal terminal) is a ‘virtual’ terminal which exists only in the
Inmarsat processing system to allow them to log (in real‐time) some meaningful (and short) numbers. The
BTO is the time for signals to travel from the ground station to the aircraft via the satellite and back with
respect to the time taken to travel to the nominal terminal via the satellite, and back. This definition
removes the time taken for signals to travel from ground station to the satellite. A schematic of the
Nominal Terminal concept is shown in Figure 1. The simplest assumption is the Nominal Terminal is set at a
4
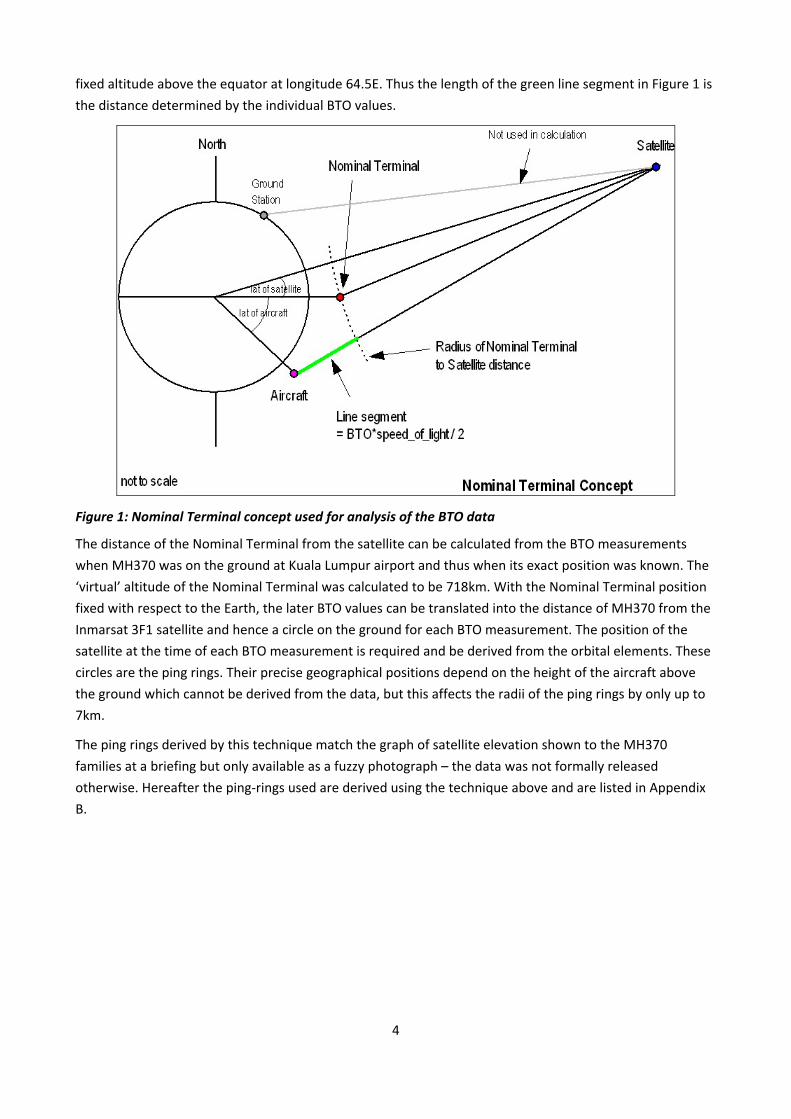
fixed altitude above the equator at longitude 64.5E. Thus the length of the green line segment in Figure 1 is
the distance determined by the individual BTO values.
Figure 1: Nominal Terminal concept used for analysis of the BTO data
The distance of the Nominal Terminal from the satellite can be calculated from the BTO measurements
when MH370 was on the ground at Kuala Lumpur airport and thus when its exact position was known. The
‘virtual’ altitude of the Nominal Terminal was calculated to be 718km. With the Nominal Terminal position
fixed with respect to the Earth, the later BTO values can be translated into the distance of MH370 from the
Inmarsat 3F1 satellite and hence a circle on the ground for each BTO measurement. The position of the
satellite at the time of each BTO measurement is required and be derived from the orbital elements. These
circles are the ping rings. Their precise geographical positions depend on the height of the aircraft above
the ground which cannot be derived from the data, but this affects the radii of the ping rings by only up to
7km.
The ping rings derived by this technique match the graph of satellite elevation shown to the MH370
families at a briefing but only available as a fuzzy photograph – the data was not formally released
otherwise. Hereafter the ping‐rings used are derived using the technique above and are listed in Appendix
B.
5
4 The BFO (Doppler) Model
4.1 Background
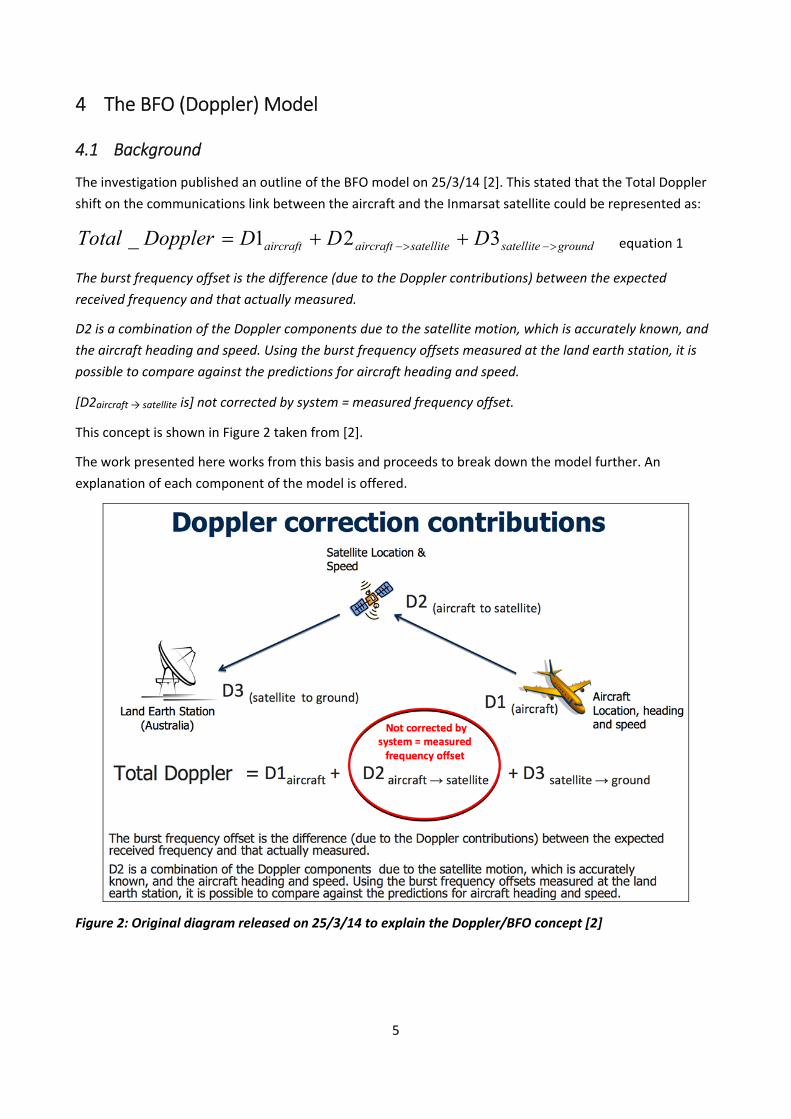
The investigation published an outline of the BFO model on 25/3/14 [2]. This stated that the Total Doppler
shift on the communications link between the aircraft and the Inmarsat satellite could be represented as:
groundsatellitesatelliteaircraftaircraft DDDDopplerTotal 321_ equation 1
The burst frequency offset is the difference (due to the Doppler contributions) between the expected
received frequency and that actually measured.
D2 is a combination of the Doppler components due to the satellite motion, which is accurately known, and
the aircraft heading and speed. Using the burst frequency offsets measured at the land earth station, it is
possible to compare against the predictions for aircraft heading and speed.
[D2aircraft → satellite is] not corrected by system = measured frequency offset.
This concept is shown in Figure 2 taken from [2].
The work presented here works from this basis and proceeds to break down the model further. An
explanation of each component of the model is offered.
Figure 2: Original diagram released on 25/3/14 to explain the Doppler/BFO concept [2]

6
4.2 The refined BFO Model
The BFO model discussed here can be stated as follows (equation 2):
offsetdriftgroundsatellitesatelliteaircraftaircraft DDDDDDBFO 543221 equation 2
The nomenclature of the original publication [2] is retained as far as possible, though a number of the
terms in the refined BFO model are not the result of the Doppler Effect (as might be implied by the letter
‘D’). The components are summarised in Table 1 and described in more detail in the following sections.
Element Summary
D1aircraft The correction applied to the return L‐band transmission frequency by the
satellite terminal in the aircraft. This is calculated inside the terminal in real‐
time.
D2aircraft The Doppler shift in the return L‐band transmission from the aircraft to the
satellite due to the velocity of the aircraft. It is a function of the aircraft’s speed,
course, rate of change of altitude and position, and the position of the satellite.
D2satellite The Doppler shift in the return L‐band transmission from the aircraft to the
satellite due to the velocity of the Inmarsat 3F1 satellite. It is a function of the
aircraft’s position and the known position and velocity of the satellite.
D3satellite→ground The Doppler shift in the transmissions between the satellite and the Inmarsat
ground stations due to the velocity of the Inmarsat 3F1 satellite. This includes
the C‐band downlink to the Perth ground station and an uplink transmission
from the Fucino ground station to the satellite. All the inputs to this element are
known.
D4drift The drift of radio frequency standards in the aircraft and satellite terminals
during the flight.
D5offset A constant offset (unchanging with time) between the model and the BFO
measurements due to various factors. The value of this constant can be derived
from the BFO data when the aircraft was on the ground.
Table 1: Description of BFO model components
4.3 Aircraft Terminal Correction ‐ D1aircraft
The Inmarsat notes [1] state:
Inmarsat Classic Aero mobile terminals are designed to correct for aircraft Doppler effects on their transmit
signals. The terminal type used on MH370 assumes a stationary satellite at a fixed orbital position
The type of terminal on MH370 is not published, but the manual for a typical Honeywell terminal (type
MCS‐4200/7200) [4] states (pages 1‐22 and A‐26):

7
The SDU can adjust the transmission frequency in one—Hertz increments to compensate for the Doppler
shift caused by the speed of the aircraft…
…If the aircraft does not have an IRS [Internal Reference System] that supplies this ARINC [Navigation] data,
the SCU [Signal Conditioning Unit] can be used to supply the data.
Thus the terminal receives position information either from the aircraft’s navigation system or from its own
GPS system and uses that to calculate the component of the aircraft’s velocity towards the satellite. It then
calculates the Doppler shift corresponding to that velocity and corrects the frequency of its L‐band uplink
so that the signal is received at the satellite at the correct frequency. However, the terminal uses a fixed
position for the Inmarsat 3F1 satellite in this calculation [1], that is, it is assumed to be in a ‘perfect’
geostationary orbit at the 64.5°E orbital station. In reality the satellite is not in a fully geostationary orbit
and drifts 1.6degrees North and South of the Equator (it also changes in distance from the Earth by +/‐
23km, but this is a minor effect). If the terminal used the full‐precision position of the satellite then
component D1aircraft would fully compensate for component D2aircraft. However, as a result of use of a fixed
satellite position in the calculation the two components are not of equal and opposite value and the
difference appears in the final measured BFO. This difference is most significant when the spacecraft is at
or close to its extreme North and South positions (which was the case for the early parts of the flight) and
very small when the spacecraft is close to the fixed position used in the calculation (which was the case at
the end of the flight). The difference is also a strong function of the heading of the aircraft, particularly
when the heading is roughly towards (or away from) the position 64.5E, 0N. This effect is one of the major
asymmetries between possible Northerly and Southerly tracks.
A predicted value of D1aircraft can be calculated for any modelled aircraft position, speed and course, for a
given time. The L‐band link frequency used is 1.6GHz (see section 2.2). Data from early parts of the flight
indicates that the terminal does not compensate for the vertical speed of the aircraft.
4.4 Aircraft Velocity Doppler – D2aircraft
This contribution is the simple Doppler frequency offset in the return L‐band link between the aircraft and
the satellite due to the velocity of aircraft. A predicted value of D2aircraft can be calculated for any modelled
aircraft position, speed, course and rate of climb/descent for a given time, using the known position of the
satellite for that time. The same L‐band link frequency is used as for D1aircraft.
4.5 Satellite Velocity Doppler – D2satellite
This contribution is the simple Doppler frequency offset in the return L‐band link between the aircraft and
the satellite due to the velocity of satellite. A predicted value of D2aircraft can be calculated for any modelled
aircraft position for a given time, using the known position of the satellite for that time. The same L‐band
link frequency is used as for D2aircraft.
4.6 Ground Station Contributions – D3satellite→ground
This contribution is related to the frequency shift in the return C‐band transmission from the satellite to the
Inmarsat Perth ground station due to the velocity of the Inmarsat 3F1 satellite. This has a large value and
8
has to be fully understood before the full BFO can be evaluated correctly. It is independent of any
parameter related to the aircraft, so should be completely determinable for any time since the satellite
position is known. It is certainly the case that it cannot be the full Doppler shift due to the velocity of the
satellite towards or away from the Perth ground station – the BFO data is just not consistent with that by
around 50Hz over the period of the flight, a very large difference.
The Inmarsat notes [1] do not give a full explanation for this component but include the cryptic comment:
The correction applied by the Automatic Frequency Control (AFC) system in the ground station partially
compensates for the satellite to ground station Doppler
It is believed that the AFC (Automatic Frequency Control) system used by the Inmarsat system is as
described in the MITEQ technical note 25T020 ‘Enhanced Automatic Frequency Control for Inmarsat Earth
Stations’ [5]. The description below is the best proposal for how this AFC system determines the D3
component and is consistent with the measured BFO data as is shown later.
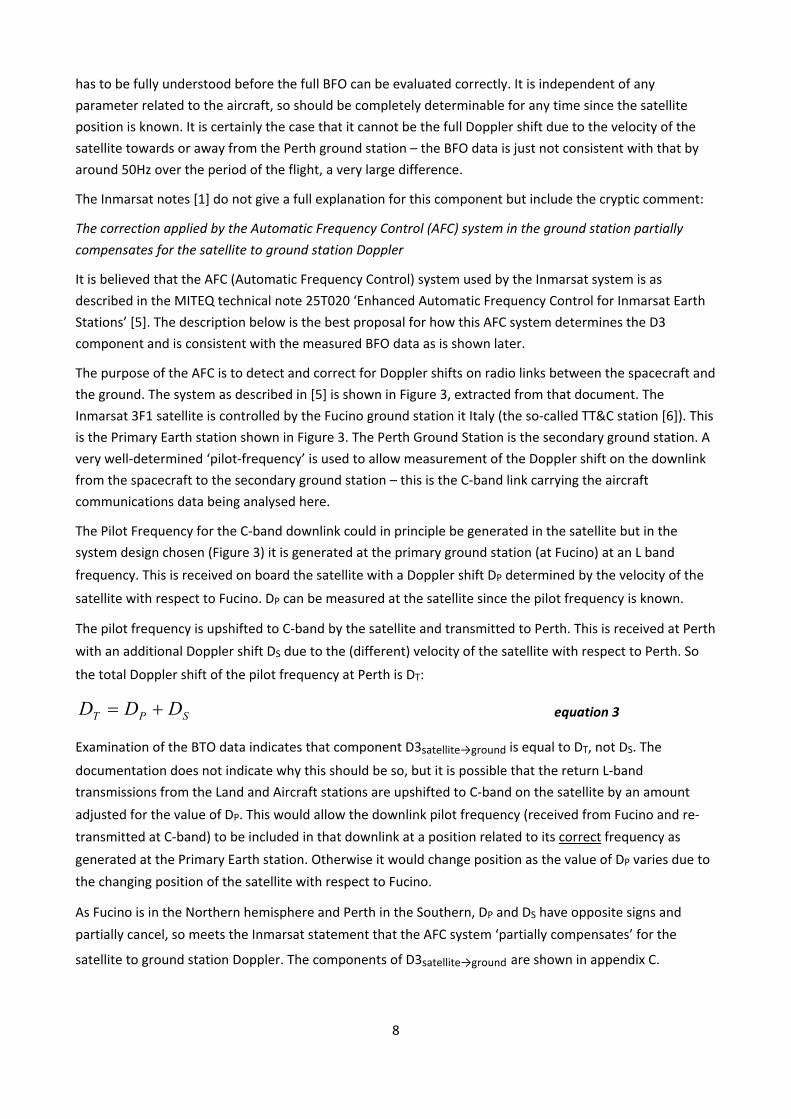
The purpose of the AFC is to detect and correct for Doppler shifts on radio links between the spacecraft and
the ground. The system as described in [5] is shown in Figure 3, extracted from that document. The
Inmarsat 3F1 satellite is controlled by the Fucino ground station it Italy (the so‐called TT&C station [6]). This
is the Primary Earth station shown in Figure 3. The Perth Ground Station is the secondary ground station. A
very well‐determined ‘pilot‐frequency’ is used to allow measurement of the Doppler shift on the downlink
from the spacecraft to the secondary ground station – this is the C‐band link carrying the aircraft
communications data being analysed here.
The Pilot Frequency for the C‐band downlink could in principle be generated in the satellite but in the
system design chosen (Figure 3) it is generated at the primary ground station (at Fucino) at an L band
frequency. This is received on board the satellite with a Doppler shift DP determined by the velocity of the
satellite with respect to Fucino. DP can be measured at the satellite since the pilot frequency is known.
The pilot frequency is upshifted to C‐band by the satellite and transmitted to Perth. This is received at Perth
with an additional Doppler shift DS due to the (different) velocity of the satellite with respect to Perth. So
the total Doppler shift of the pilot frequency at Perth is DT:
SPT DDD equation 3
Examination of the BTO data indicates that component D3satellite→ground is equal to DT, not DS. The
documentation does not indicate why this should be so, but it is possible that the return L‐band
transmissions from the Land and Aircraft stations are upshifted to C‐band on the satellite by an amount
adjusted for the value of DP. This would allow the downlink pilot frequency (received from Fucino and re‐
transmitted at C‐band) to be included in that downlink at a position related to its correct frequency as
generated at the Primary Earth station. Otherwise it would change position as the value of DP varies due to
the changing position of the satellite with respect to Fucino.
As Fucino is in the Northern hemisphere and Perth in the Southern, DP and DS have opposite signs and
partially cancel, so meets the Inmarsat statement that the AFC system ‘partially compensates’ for the
satellite to ground station Doppler. The components of D3satellite→ground are shown in appendix C.

9
This description of D3satellite→ground is used in the analysis presented in this paper. If it were incorrect no
match to the data would be found as the component is large (up to +/‐60Hz) and thus any error would also
be large. Resolving the nature of this component was vital to presenting any useful analysis.
(note: the L‐band link between the satellite and the aircraft uses the velocity correction system described in
section 4.3 as an alternative to AFC, so this system description is not relevant to that link)
Figure 3: AFC system believed to be used on Inmarsat 3F1, from [5]
4.7 Frequency Drift ‐ D4drift
The Inmarsat notes refer to ‘Satellite, terminal and ground station oscillator stability’. This contribution is
the collection of changes in oscillator frequencies over the time of flight. All these oscillators are designed
to have very high stability, so the expected changes over 6 hours should be small. However, the drifts
cannot be deduced from the BFO data and require calibration of some type. It has been stated that
Inmarsat had records of previous flights of the B777 9M‐MRO so the stability of that system could be
determined. The ground station and satellite systems are still available and calibrations were possible after
7th March.
A press report [7] indicated a concern that changes in the satellite temperature could influence the
onboard oscillator frequencies (the language in the article is rather confused). The satellite was in eclipse
(night) from 19:22 to 20:22UT a period which includes the 19:41UT ping. Onboard temperatures and supply
voltages would change during the eclipse and for a period thereafter. The analysis later in this paper
potentially indicates a larger error for the 19:41UT ping than the other pings which could indicate why the
Inmarsat analysis team were concerned with this effect.
Apart from this possible eclipse effect, the sum of the drift terms could be expected be small. However, the
value cannot be determined without the calibration data which has not been released. However, the
comparison with the BFO data and the final selected search areas based on the calibrated model (see later
sections) suggests D4drift is less than 3Hz at all times during the flight.
10
4.8 Constant Offset – D5offset
There are a number of constant terms, for example:
1. As stated in the Inmarsat notes ‘An individual aircraft terminal will have a fixed frequency bias’
2. A positive offset will have been added by the Inmarsat system to avoid logging negative numbers
(as in the case for the logged BTO numbers using the nominal terminal concept).
The sum of these constant terms can be calculated when the aircraft is stationary at KL airport at a
determined position. The BFO data points before 18:30UT were examined against the expected trends of
D2satellite and D3satellite→ground which are changing at this time, while D1aircraft and D2aircraft are both zero as
the aircraft is stationary. The data are shown plotted in Appendix D. A value for D5offset of 151.5Hz (+/‐
0.5Hz) was determined.
4.9 Analysis of the noise on the data
The logged values of the BFO will be not be perfect measurements, but will be subject to various sources of
noise. The first source is random noise due to small errors in the signal detection and measurement chain
from second to second. The logged BFO values before and after take‐off were examined to understand this
source of noise.
Before take‐off: After exclusion of the BFO values before 16.30UT that are changing significantly
(presumably due to activity in the terminal), there are periods of relative stability in the logged values.
Taking the standard deviation of the BFO values in each period and then averaging those ‘averages’ gives a
one sigma error of 1.6Hz.
After take‐off: There is short‐period at 17:07UT when the aircraft is reported in level flight. The standard
deviation of the eight R‐channel BFO data points at this time is 1.13Hz.
The worst of the two figures is taken for the random element of the BFO noise, so 1.6Hz.
There is also the possibility of systematic noise in the data during flight. Systematic noise is a major source
of potential bias. Potential sources of such noise are:
a. Rate of climb/descent: A rate of climb/descent rate of 50ft/min even for a very short period while
the ping was being sent could significantly perturb the BFO measurement.
b. Changes of course from those in the Track Model. A sinusoidal element to the heading of
+/‐7degrees could add 1Hz to individual BFO measurements.
c. Short‐term variations in RF oscillator frequency: Long‐term variations are included in the model but
short‐term variations are unknown.
Total noise: A full treatment of noise is not possible without a full system analysis, but the major
contributors may be a) the random element (1.6Hz) and b) the rate of climb/descent at the ping time. In
the absence of better information a contribution from climb/descent rates of 50ft/min is assumed, an error
of ~1.4Hz. These two errors are uncorrelated and therefore add in quadrature to give a value of 2.1Hz for
the total error.
11
This will not be the correct figure for the error ‐ a lot more work would be needed to give a full appreciation
of the BFO error – but is used for the analysis in this paper.
4.10 Aircraft Performance Issues
This paper does not attempt to derive constraints on the aircraft performance in which the author is not
competent. The obvious issues that will constrain the conclusions of the model are:
1. The minimum speed at which the aircraft could travel. A simple search of bulletin boards suggest a
B777 has a minimum clean speed of 270‐280KIAS at maximum take‐off weight (MTOW). The
aircraft was much below MTOW at the end of the flight, but the Track Model will assume constant
speed for a large part of the flight so the weight near the start of the flight would provide a
constraint. True airspeed (TAS) would be higher than that figure give altitude correction, but since
the altitude is not known, a TAS minimum figure of 280kt has been assumed. Clearly, the
investigators would have a much better idea from a detailed aircraft analysis.
2. The maximum TAS has been taken as 500kt. There have been statements from the investigators
that fuel burn rate at higher airspeeds would not allow an endurance to 00:18UT. This is discussed
later in the paper.
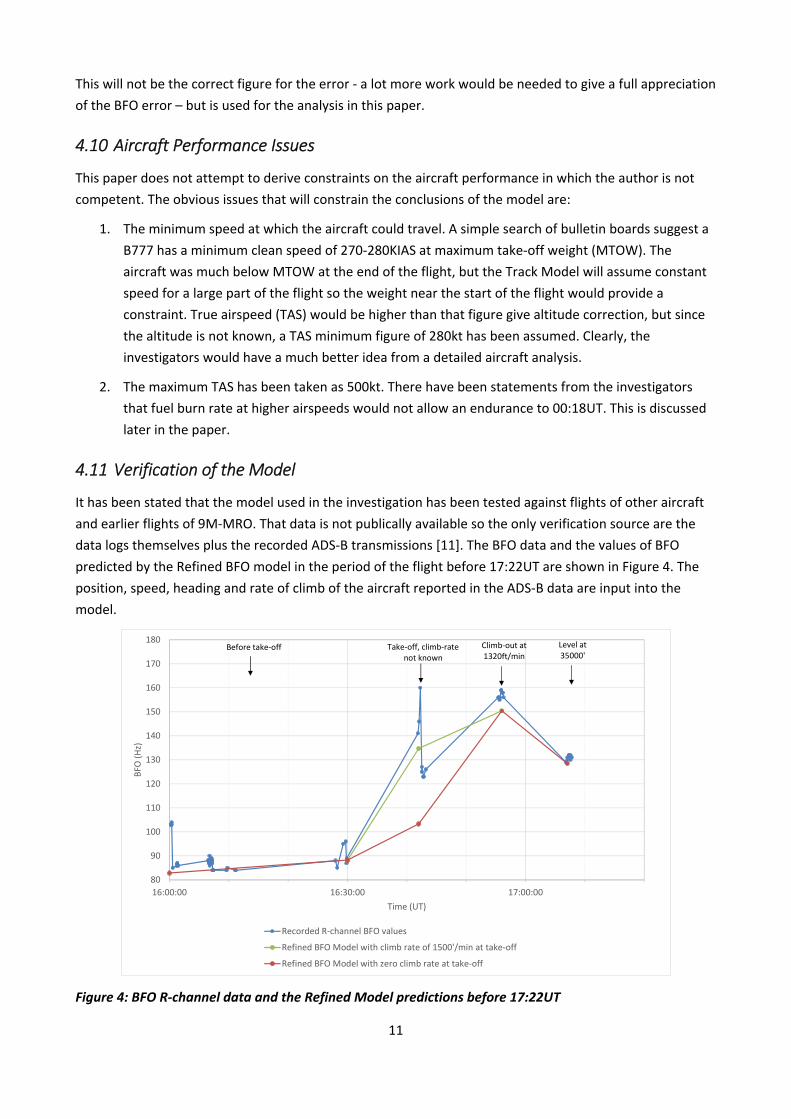
4.11 Verification of the Model
It has been stated that the model used in the investigation has been tested against flights of other aircraft
and earlier flights of 9M‐MRO. That data is not publically available so the only verification source are the
data logs themselves plus the recorded ADS‐B transmissions [11]. The BFO data and the values of BFO
predicted by the Refined BFO model in the period of the flight before 17:22UT are shown in Figure 4. The
position, speed, heading and rate of climb of the aircraft reported in the ADS‐B data are input into the
model.
80
90
100
110
120
130
140
150
160
170
180
16:00:00 16:30:00 17:00:00
BFO
(Hz)
Time (UT)
Recorded R‐channel BFO values
Refined BFO Model with climb rate of 1500'/min at take‐off
Refined BFO Model with zero climb rate at take‐off
Take‐off, climb‐ratenot known
Climb‐out at 1320ft/min
Level at 35000'
Before take‐off
Figure 4: BFO R‐channel data and the Refined Model predictions before 17:22UT
12
The aircraft is climbing between take‐off at 16:42UT and 17:02UT and the uncompensated vertical speed is
a strong influence on the data. The aircraft is reported level at 17:07UT so this is the only point after take‐
off useful for accurate comparison with the model. The model prediction is 2Hz lower than the average of
the BFO values at 17:07UT, so correspondence is not perfect. However, the difference can be accounted for
by a small rate of climb of 100ft/minute.
Clearly, use of data from other flights would allow a better verification (to prove or disprove the model)
than is possible here.
4.12 Model summary
In summary, the Refined BFO Model described here is composed of six components.
D3satellite→ground is fully determined by the known satellite motion
D1aircraft, D2aircraft and D2satellite are functions of the aircraft position, speed and course and thus
determined by the model.
The constant term D5offset, is determined with a small error by the BFO data before take‐off.
Only D4drift is a function of time and cannot be determined from the BFO data or the model. It can
be estimated from comparison with the published analysis.
The next step is to construct model tracks for the aircraft and then compare predicted BFO values for these
tracks with the BFO data. If no match between the model and the data can be found for any sensible
variation of the model, or only matches with a large assumed value of D4drift, then the model will have
failed.
If a match can be found, then this is an indication that the model corresponds to what actually happened,
or at least to what the full model under the control of the investigators shows. This is discussed after the
results of the track modelling below.
5 Radar Data
A turn‐back point of 103.57E, 6.92N at 17.21UT over the South China Sea has been assumed as determined
by ADS‐B data [1]. The precision of this point is not a critical value for the model.
None of the reported radar data has been used as a constraint on the model. If the radar targets,
particularly those over the Strait of Malacca, were correctly identified as MH370 then the reported radar
positions should be consistent with a possible fit to the BFO and BTO data.

13
6 The Track Model
This section describes the input model of the track for MH370 from the 17:21UT turn‐back point to the final
ping‐arc at 00:11UT. The stated variables are changed over their possible ranges and the predicted BFO and
BTO values compared to the data.
The assumptions of the model:
1. The course can be represented by a sequence of great circle courses between the measured ping‐
arcs starting at the turn‐back point.
2. The speed for the first leg, from 17:21 to 18:29UT is a variable in the model. The speeds used are
365kt to 555kt in 5kt steps.
3. A single speed is used for the rest of the legs from 18:29UT onwards (but different from the first
leg) and is a variable in the model. The speeds used are 267 to 564kt in 2kt steps
Logic for the model:
a. After a single great circle course, this is the simplest possible model. A single great circle course at
constant speed remains a potential solution, if allowed by the data.
b. It does not necessarily assume the aircraft maintained a single course between ping‐arcs, but that
the average course can be represented as a straight line, at a single speed. An exercise using a
more complex interpretation of a changing course between ping‐arcs did not give materially
different results.
c. The reported speed for MH370 at 17:21UT was 470kt. If the aircraft changed speed after that time
to a different, steady speed, the first leg must have a different average speed to later legs, so a
different average speed has to be modelled for the first leg.
d. It is consistent with an aircraft in a speed‐hold mode, though continuously turning courses may be
harder to understand in terms of autopilot modes.
Consequences of the model:
a. The heading at each ping‐arc is different.
b. There is a threshold where lower speeds are impossible because the ping‐arcs are too far apart for
the aircraft to travel in the time available. This is a speed of 365kt for the first leg and up to 275kt
for the later part of the course.
c. Because some of the BFO measurements are discarded for reasons explained later, the treatment
of positions at 18:29 and 19.41UT is more complex and is discussed later.
d. The first leg (17:21 to 18:29UT) as defined above does not seek to replicate possible complex tracks
in that period. A more complex course is equivalent to a shorter straight line course at lower speed,
as modelled.
This Track Model is similar to that used in the initial report by the Malaysian ICAO [8] with the main
difference in that case all tracks after 18:29UT were forced to start a point North of Sumatra. It is not
14
known what Track Model was used by the Inmarsat analysis and later by others, if it was different from the
model used to generate the ICAO report.
7 Results of using the BTO and BFO data with the Track Model
7.1 Use of the BTO data
The Track Model was run for a set of tracks with the speeds for the a) first and then b) subsequent legs
changing as shown in Table 2.
Leg Lowest Speed
(kt)
Highest Speed
(kt)
Step Size
(kt)
Number of
steps
First leg 365 555 5 39
Subsequent Legs 266 564 2 150
Table 2: Speeds used in Track Model
As has been much discussed, the ping‐arc data alone allows two sets of tracks, one to the South and
another to the North. The methods of discrimination between these two sets is discussed in a following
section.
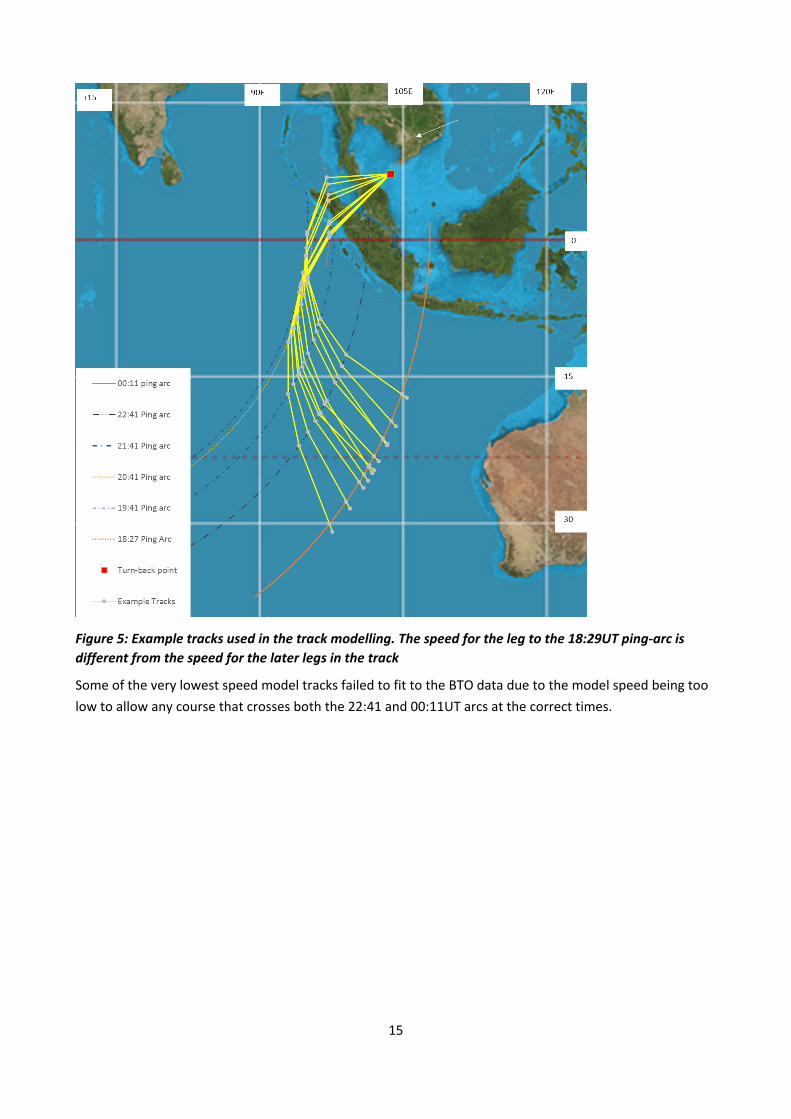
A collection of nearly 6000 Southern tracks (39x150) was generated (the Track model set), fitting the ends
of each leg to the turn‐back point and the ping‐arcs determined by the BTO data. Some example tracks
from the set are shown in Figure 5. A corresponding set was generated for Northern tracks.
15
Figure 5: Example tracks used in the track modelling. The speed for the leg to the 18:29UT ping‐arc is
different from the speed for the later legs in the track
Some of the very lowest speed model tracks failed to fit to the BTO data due to the model speed being too
low to allow any course that crosses both the 22:41 and 00:11UT arcs at the correct times.
16
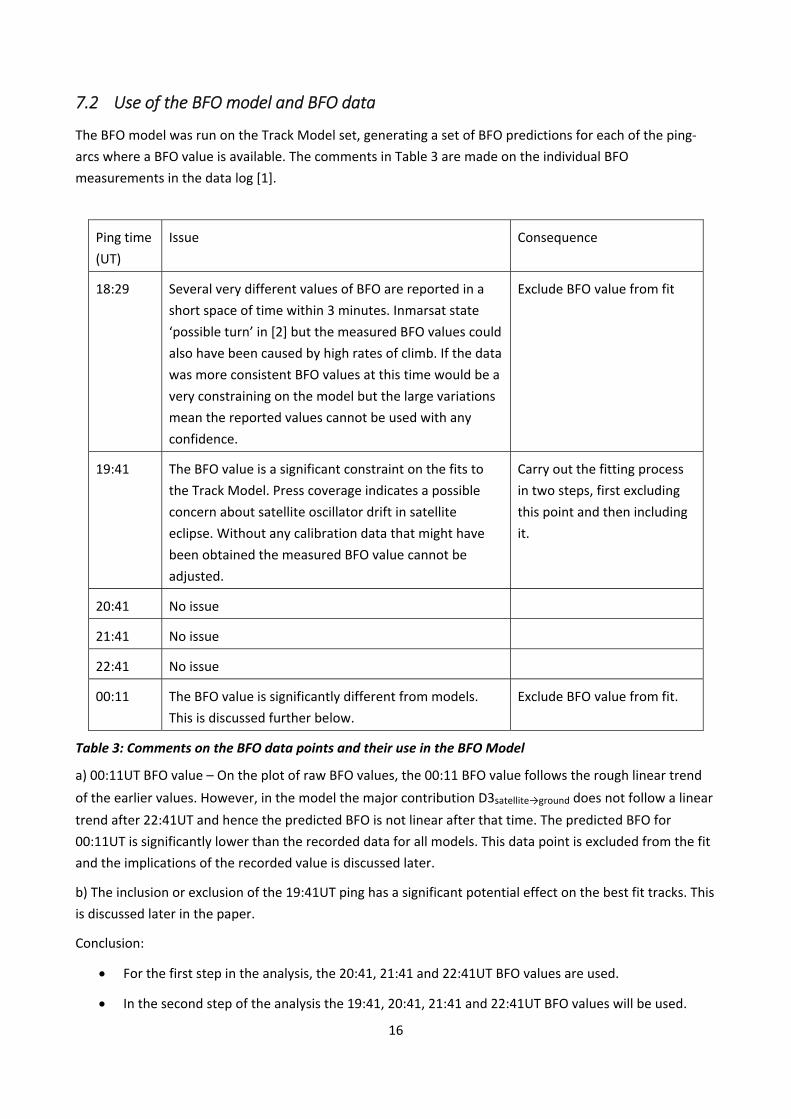
7.2 Use of the BFO model and BFO data
The BFO model was run on the Track Model set, generating a set of BFO predictions for each of the ping‐
arcs where a BFO value is available. The comments in Table 3 are made on the individual BFO
measurements in the data log [1].
Ping time
(UT)
Issue Consequence
18:29 Several very different values of BFO are reported in a
short space of time within 3 minutes. Inmarsat state
‘possible turn’ in [2] but the measured BFO values could
also have been caused by high rates of climb. If the data
was more consistent BFO values at this time would be a
very constraining on the model but the large variations
mean the reported values cannot be used with any
confidence.
Exclude BFO value from fit
19:41 The BFO value is a significant constraint on the fits to
the Track Model. Press coverage indicates a possible
concern about satellite oscillator drift in satellite
eclipse. Without any calibration data that might have
been obtained the measured BFO value cannot be
adjusted.
Carry out the fitting process
in two steps, first excluding
this point and then including
it.
20:41 No issue
21:41 No issue
22:41 No issue
00:11 The BFO value is significantly different from models.
This is discussed further below.
Exclude BFO value from fit.
Table 3: Comments on the BFO data points and their use in the BFO Model
a) 00:11UT BFO value – On the plot of raw BFO values, the 00:11 BFO value follows the rough linear trend
of the earlier values. However, in the model the major contribution D3satellite→ground does not follow a linear
trend after 22:41UT and hence the predicted BFO is not linear after that time. The predicted BFO for
00:11UT is significantly lower than the recorded data for all models. This data point is excluded from the fit
and the implications of the recorded value is discussed later.
b) The inclusion or exclusion of the 19:41UT ping has a significant potential effect on the best fit tracks. This
is discussed later in the paper.
Conclusion:
For the first step in the analysis, the 20:41, 21:41 and 22:41UT BFO values are used.
In the second step of the analysis the 19:41, 20:41, 21:41 and 22:41UT BFO values will be used.
17
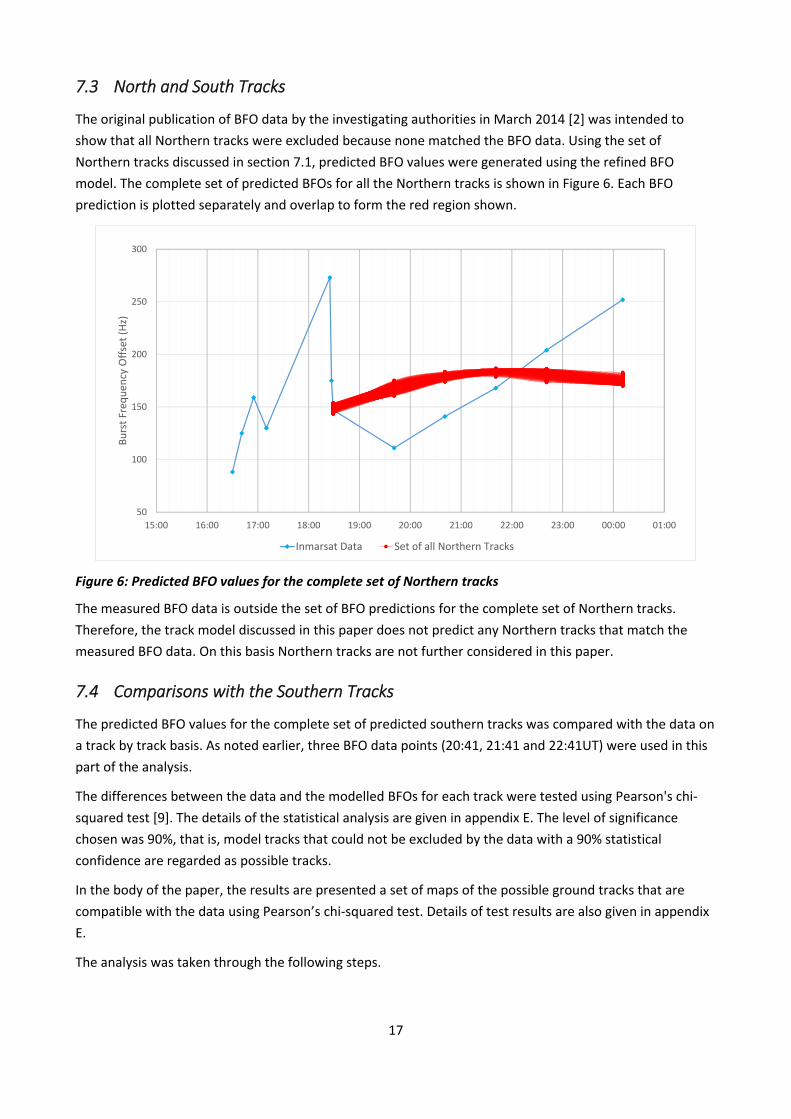
7.3 North and South Tracks
The original publication of BFO data by the investigating authorities in March 2014 [2] was intended to
show that all Northern tracks were excluded because none matched the BFO data. Using the set of
Northern tracks discussed in section 7.1, predicted BFO values were generated using the refined BFO
model. The complete set of predicted BFOs for all the Northern tracks is shown in Figure 6. Each BFO
prediction is plotted separately and overlap to form the red region shown.
50
100
150
200
250
300
15:00 16:00 17:00 18:00 19:00 20:00 21:00 22:00 23:00 00:00 01:00
Burst Freq
uen
cy Offset (Hz)
Inmarsat Data Set of all Northern Tracks
Figure 6: Predicted BFO values for the complete set of Northern tracks
The measured BFO data is outside the set of BFO predictions for the complete set of Northern tracks.
Therefore, the track model discussed in this paper does not predict any Northern tracks that match the
measured BFO data. On this basis Northern tracks are not further considered in this paper.
7.4 Comparisons with the Southern Tracks
The predicted BFO values for the complete set of predicted southern tracks was compared with the data on
a track by track basis. As noted earlier, three BFO data points (20:41, 21:41 and 22:41UT) were used in this
part of the analysis.
The differences between the data and the modelled BFOs for each track were tested using Pearson's chi‐
squared test [9]. The details of the statistical analysis are given in appendix E. The level of significance
chosen was 90%, that is, model tracks that could not be excluded by the data with a 90% statistical
confidence are regarded as possible tracks.
In the body of the paper, the results are presented a set of maps of the possible ground tracks that are
compatible with the data using Pearson’s chi‐squared test. Details of test results are also given in appendix
E.
The analysis was taken through the following steps.
18
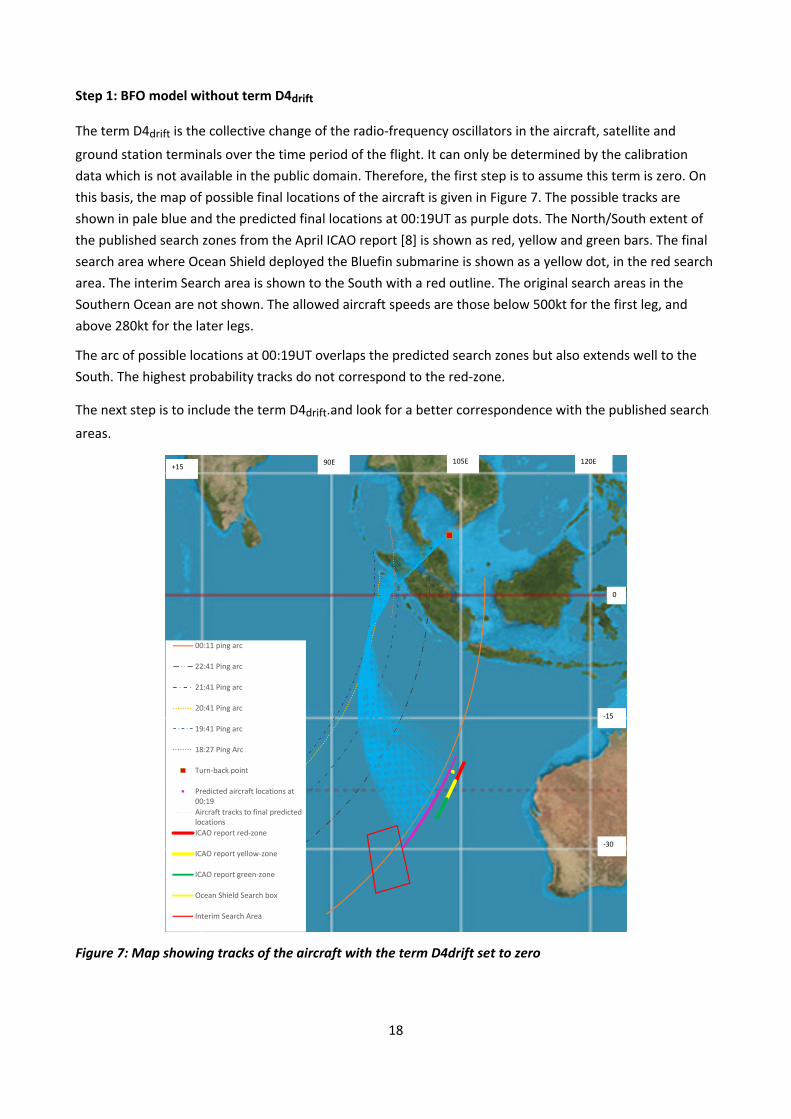
Step 1: BFO model without term D4drift
The term D4drift is the collective change of the radio‐frequency oscillators in the aircraft, satellite and
ground station terminals over the time period of the flight. It can only be determined by the calibration
data which is not available in the public domain. Therefore, the first step is to assume this term is zero. On
this basis, the map of possible final locations of the aircraft is given in Figure 7. The possible tracks are
shown in pale blue and the predicted final locations at 00:19UT as purple dots. The North/South extent of
the published search zones from the April ICAO report [8] is shown as red, yellow and green bars. The final
search area where Ocean Shield deployed the Bluefin submarine is shown as a yellow dot, in the red search
area. The interim Search area is shown to the South with a red outline. The original search areas in the
Southern Ocean are not shown. The allowed aircraft speeds are those below 500kt for the first leg, and
above 280kt for the later legs.
The arc of possible locations at 00:19UT overlaps the predicted search zones but also extends well to the
South. The highest probability tracks do not correspond to the red‐zone.
The next step is to include the term D4drift.and look for a better correspondence with the published search
areas.
00:11 ping arc
22:41 Ping arc
21:41 Ping arc
20:41 Ping arc
19:41 Ping arc
18:27 Ping Arc
Turn‐back point
Predicted aircraft locations at00:19
Aircraft tracks to final predictedlocations
ICAO report red‐zone
ICAO report yellow‐zone
ICAO report green‐zone
Ocean Shield Search box
Interim Search Area
‐30
‐15
0
+1590E 120E105E
Figure 7: Map showing tracks of the aircraft with the term D4drift set to zero
19
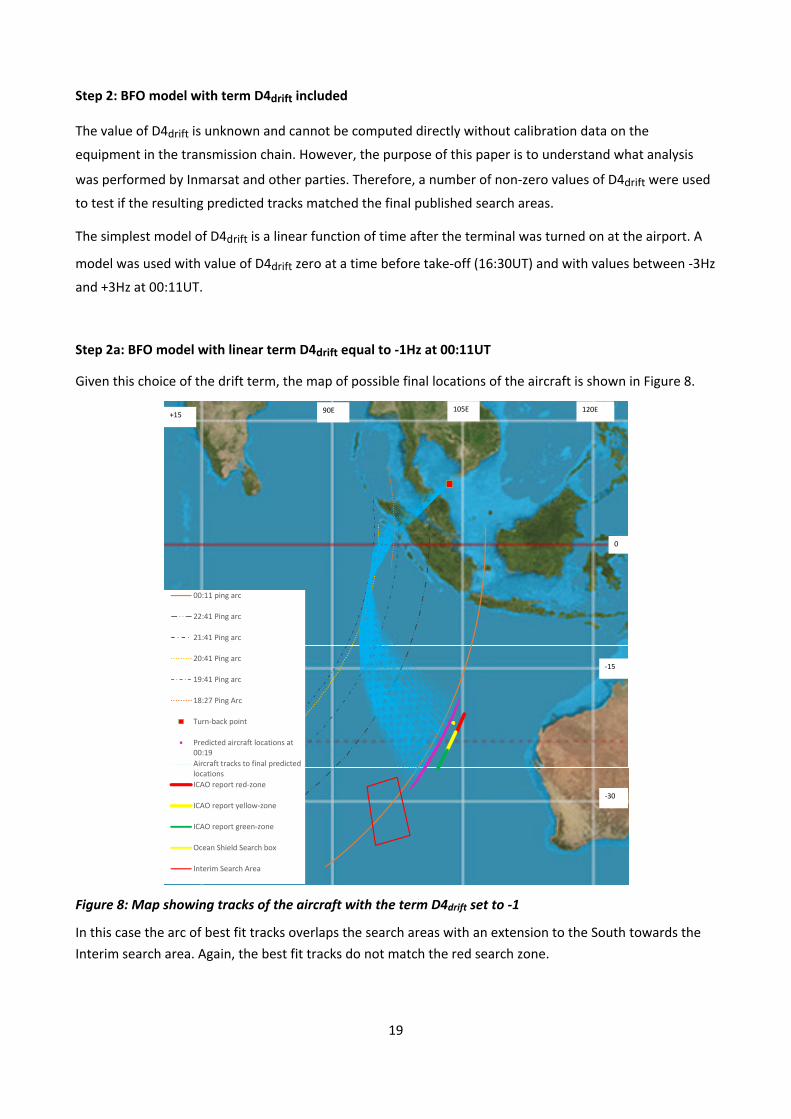
Step 2: BFO model with term D4drift included
The value of D4drift is unknown and cannot be computed directly without calibration data on the
equipment in the transmission chain. However, the purpose of this paper is to understand what analysis
was performed by Inmarsat and other parties. Therefore, a number of non‐zero values of D4drift were used
to test if the resulting predicted tracks matched the final published search areas.
The simplest model of D4drift is a linear function of time after the terminal was turned on at the airport. A
model was used with value of D4drift zero at a time before take‐off (16:30UT) and with values between ‐3Hz
and +3Hz at 00:11UT.
Step 2a: BFO model with linear term D4drift equal to ‐1Hz at 00:11UT
Given this choice of the drift term, the map of possible final locations of the aircraft is shown in Figure 8.
00:11 ping arc
22:41 Ping arc
21:41 Ping arc
20:41 Ping arc
19:41 Ping arc
18:27 Ping Arc
Turn‐back point
Predicted aircraft locations at00:19
Aircraft tracks to final predictedlocations
ICAO report red‐zone
ICAO report yellow‐zone
ICAO report green‐zone
Ocean Shield Search box
Interim Search Area
‐30
‐15
0
+1590E 120E105E
Figure 8: Map showing tracks of the aircraft with the term D4drift set to ‐1
In this case the arc of best fit tracks overlaps the search areas with an extension to the South towards the
Interim search area. Again, the best fit tracks do not match the red search zone.
20
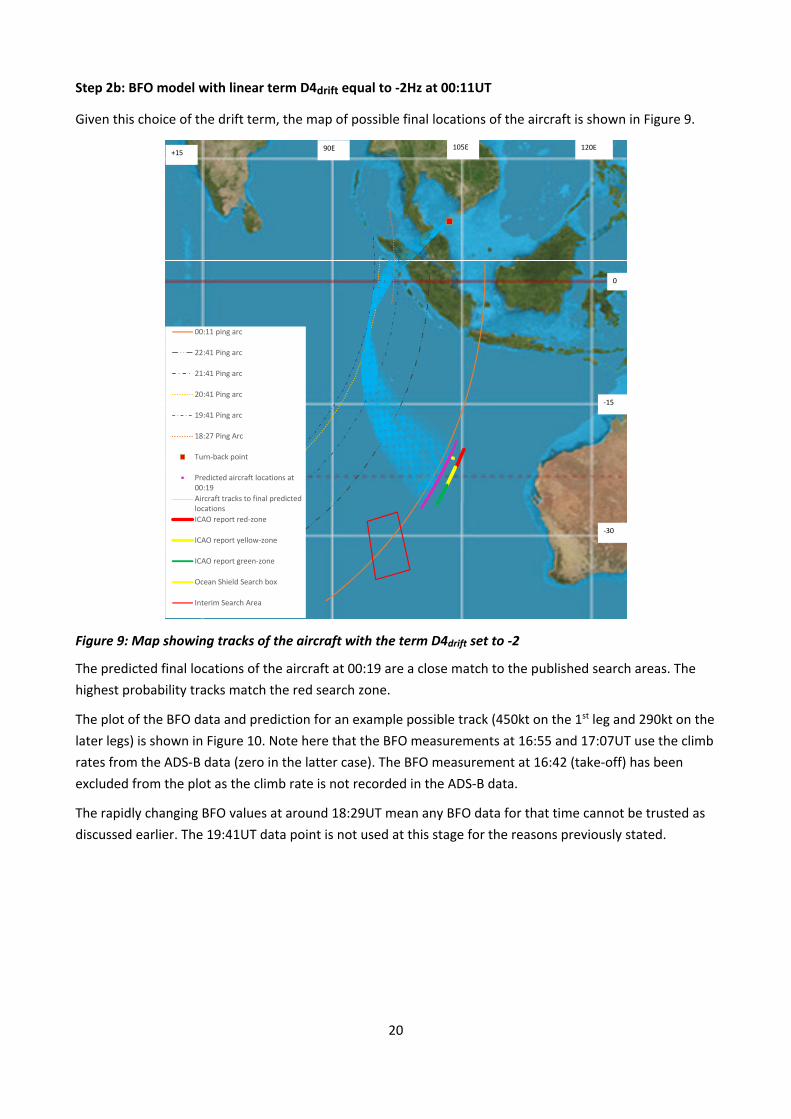
Step 2b: BFO model with linear term D4drift equal to ‐2Hz at 00:11UT
Given this choice of the drift term, the map of possible final locations of the aircraft is shown in Figure 9.
00:11 ping arc
22:41 Ping arc
21:41 Ping arc
20:41 Ping arc
19:41 Ping arc
18:27 Ping Arc
Turn‐back point
Predicted aircraft locations at00:19
Aircraft tracks to final predictedlocations
ICAO report red‐zone
ICAO report yellow‐zone
ICAO report green‐zone
Ocean Shield Search box
Interim Search Area
‐30
‐15
0
+1590E 120E105E
Figure 9: Map showing tracks of the aircraft with the term D4drift set to ‐2
The predicted final locations of the aircraft at 00:19 are a close match to the published search areas. The
highest probability tracks match the red search zone.
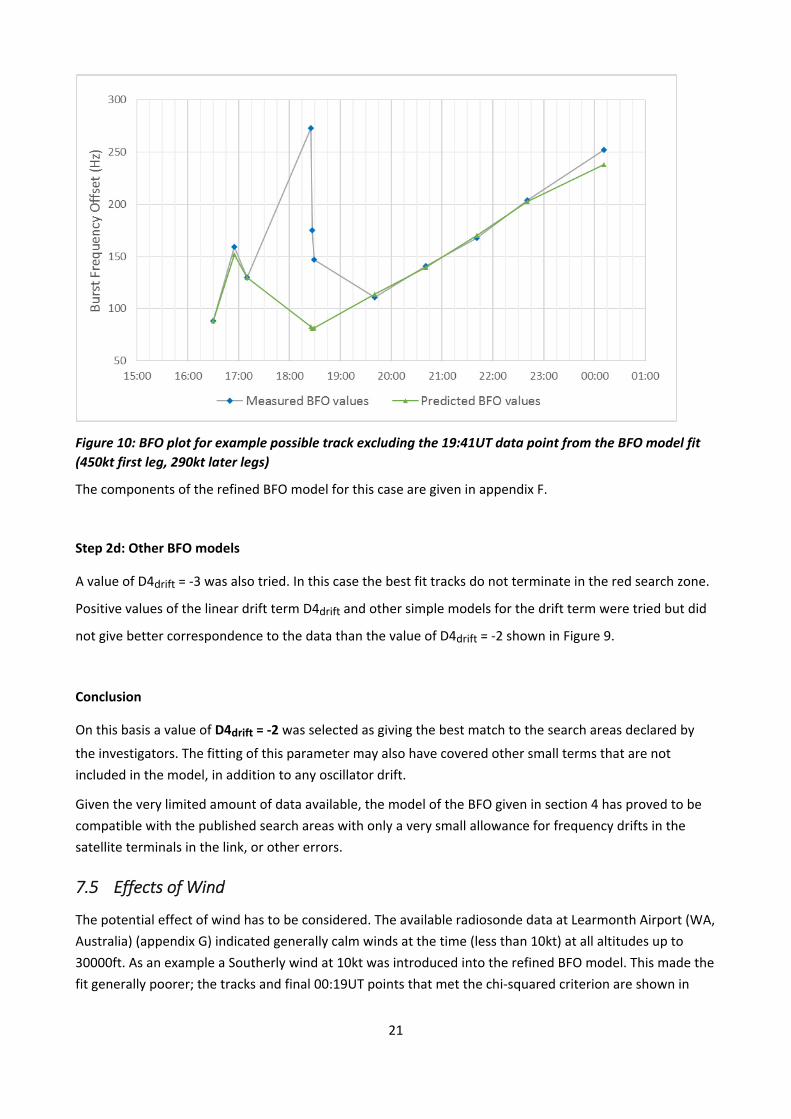
The plot of the BFO data and prediction for an example possible track (450kt on the 1st leg and 290kt on the
later legs) is shown in Figure 10. Note here that the BFO measurements at 16:55 and 17:07UT use the climb
rates from the ADS‐B data (zero in the latter case). The BFO measurement at 16:42 (take‐off) has been
excluded from the plot as the climb rate is not recorded in the ADS‐B data.
The rapidly changing BFO values at around 18:29UT mean any BFO data for that time cannot be trusted as
discussed earlier. The 19:41UT data point is not used at this stage for the reasons previously stated.
21
Figure 10: BFO plot for example possible track excluding the 19:41UT data point from the BFO model fit
(450kt first leg, 290kt later legs)
The components of the refined BFO model for this case are given in appendix F.
Step 2d: Other BFO models
A value of D4drift = ‐3 was also tried. In this case the best fit tracks do not terminate in the red search zone.
Positive values of the linear drift term D4drift and other simple models for the drift term were tried but did
not give better correspondence to the data than the value of D4drift = ‐2 shown in Figure 9.
Conclusion
On this basis a value of D4drift = ‐2 was selected as giving the best match to the search areas declared by
the investigators. The fitting of this parameter may also have covered other small terms that are not
included in the model, in addition to any oscillator drift.
Given the very limited amount of data available, the model of the BFO given in section 4 has proved to be
compatible with the published search areas with only a very small allowance for frequency drifts in the
satellite terminals in the link, or other errors.
7.5 Effects of Wind
The potential effect of wind has to be considered. The available radiosonde data at Learmonth Airport (WA,
Australia) (appendix G) indicated generally calm winds at the time (less than 10kt) at all altitudes up to
30000ft. As an example a Southerly wind at 10kt was introduced into the refined BFO model. This made the
fit generally poorer; the tracks and final 00:19UT points that met the chi‐squared criterion are shown in
22
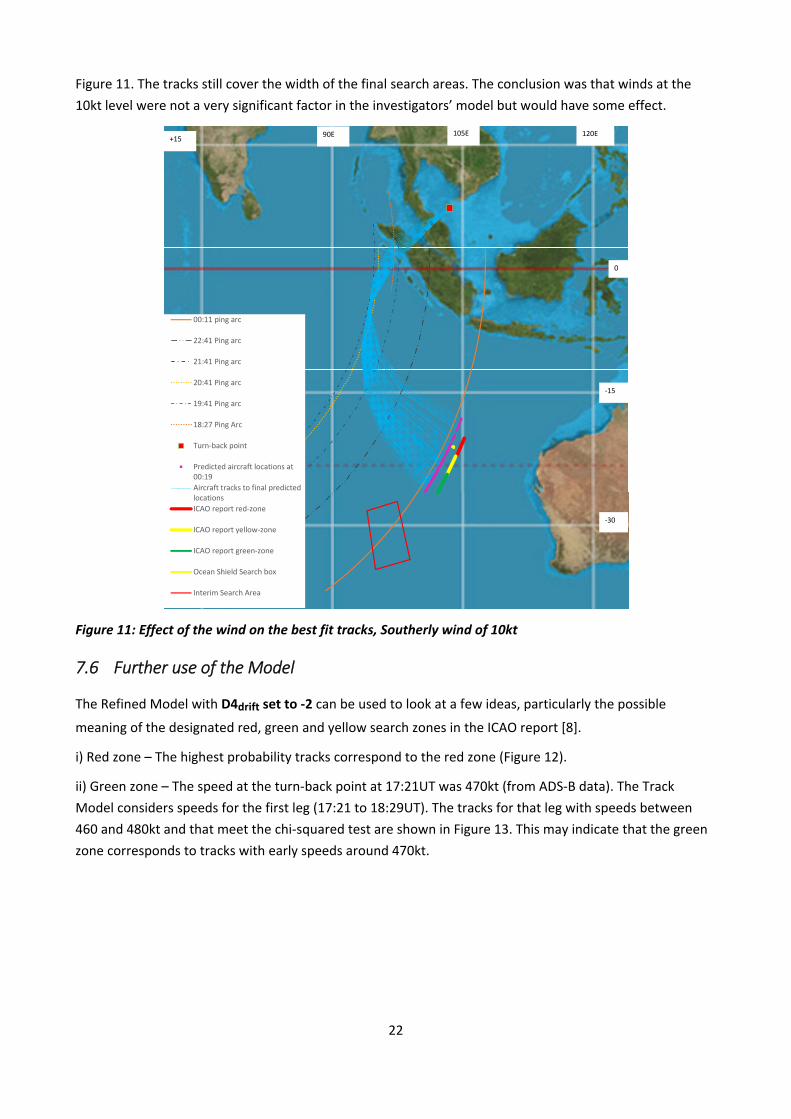
Figure 11. The tracks still cover the width of the final search areas. The conclusion was that winds at the
10kt level were not a very significant factor in the investigators’ model but would have some effect.
00:11 ping arc
22:41 Ping arc
21:41 Ping arc
20:41 Ping arc
19:41 Ping arc
18:27 Ping Arc
Turn‐back point
Predicted aircraft locations at00:19
Aircraft tracks to final predictedlocations
ICAO report red‐zone
ICAO report yellow‐zone
ICAO report green‐zone
Ocean Shield Search box
Interim Search Area
‐30
‐15
0
+1590E 120E105E
Figure 11: Effect of the wind on the best fit tracks, Southerly wind of 10kt
7.6 Further use of the Model
The Refined Model with D4drift set to ‐2 can be used to look at a few ideas, particularly the possible
meaning of the designated red, green and yellow search zones in the ICAO report [8].
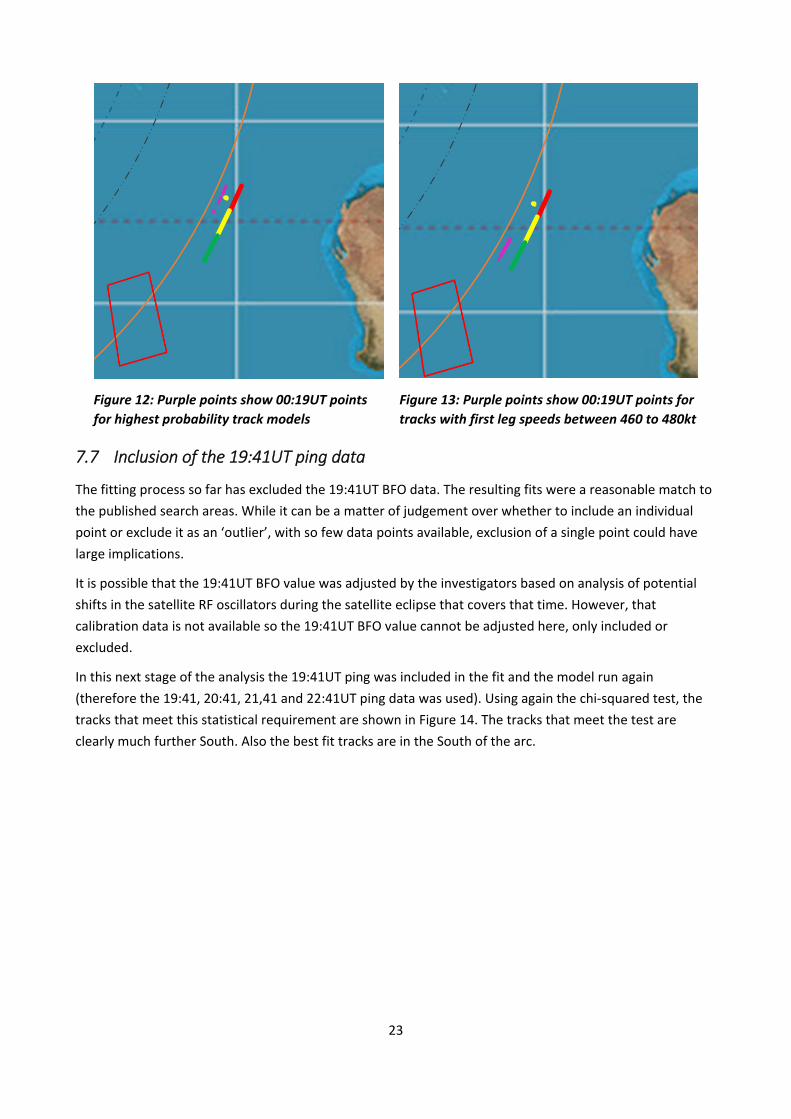
i) Red zone – The highest probability tracks correspond to the red zone (Figure 12).
ii) Green zone – The speed at the turn‐back point at 17:21UT was 470kt (from ADS‐B data). The Track
Model considers speeds for the first leg (17:21 to 18:29UT). The tracks for that leg with speeds between
460 and 480kt and that meet the chi‐squared test are shown in Figure 13. This may indicate that the green
zone corresponds to tracks with early speeds around 470kt.
23
Figure 12: Purple points show 00:19UT points
for highest probability track models
Figure 13: Purple points show 00:19UT points for
tracks with first leg speeds between 460 to 480kt
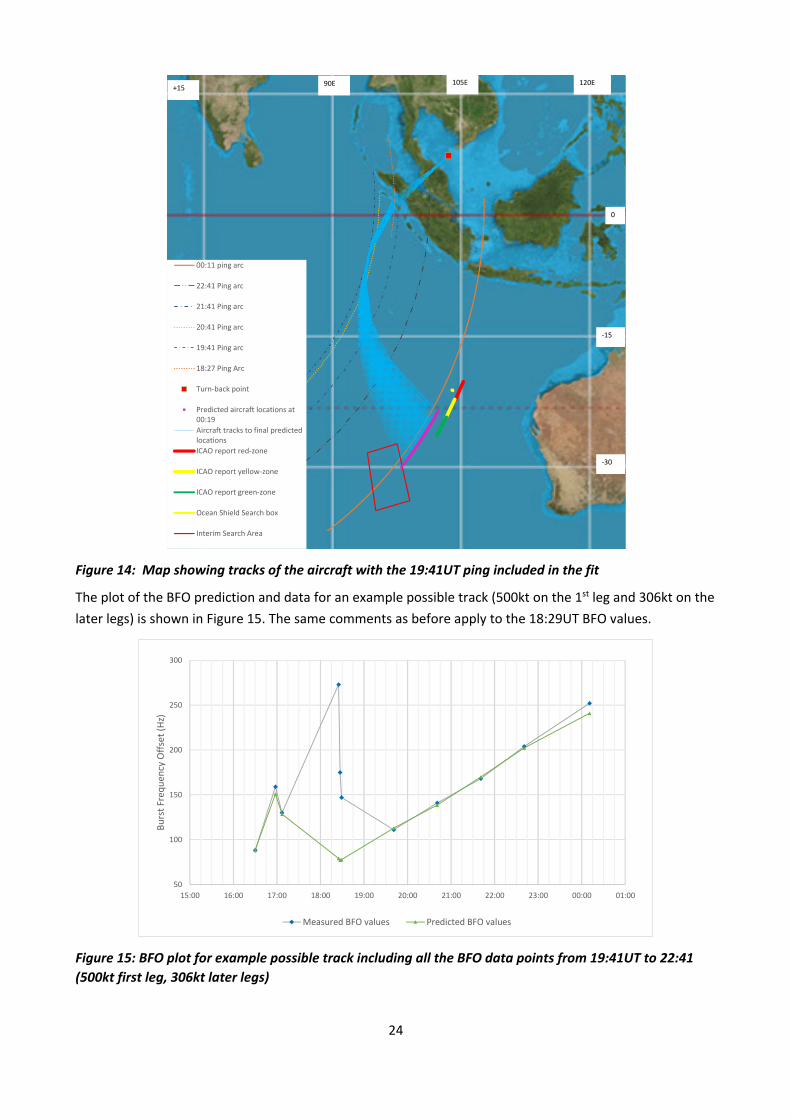
7.7 Inclusion of the 19:41UT ping data
The fitting process so far has excluded the 19:41UT BFO data. The resulting fits were a reasonable match to
the published search areas. While it can be a matter of judgement over whether to include an individual
point or exclude it as an ‘outlier’, with so few data points available, exclusion of a single point could have
large implications.
It is possible that the 19:41UT BFO value was adjusted by the investigators based on analysis of potential
shifts in the satellite RF oscillators during the satellite eclipse that covers that time. However, that
calibration data is not available so the 19:41UT BFO value cannot be adjusted here, only included or
excluded.
In this next stage of the analysis the 19:41UT ping was included in the fit and the model run again
(therefore the 19:41, 20:41, 21,41 and 22:41UT ping data was used). Using again the chi‐squared test, the
tracks that meet this statistical requirement are shown in Figure 14. The tracks that meet the test are
clearly much further South. Also the best fit tracks are in the South of the arc.
24
00:11 ping arc
22:41 Ping arc
21:41 Ping arc
20:41 Ping arc
19:41 Ping arc
18:27 Ping Arc
Turn‐back point
Predicted aircraft locations at00:19
Aircraft tracks to final predictedlocations
ICAO report red‐zone
ICAO report yellow‐zone
ICAO report green‐zone
Ocean Shield Search box
Interim Search Area
‐30
‐15
0
+1590E 120E105E
Figure 14: Map showing tracks of the aircraft with the 19:41UT ping included in the fit
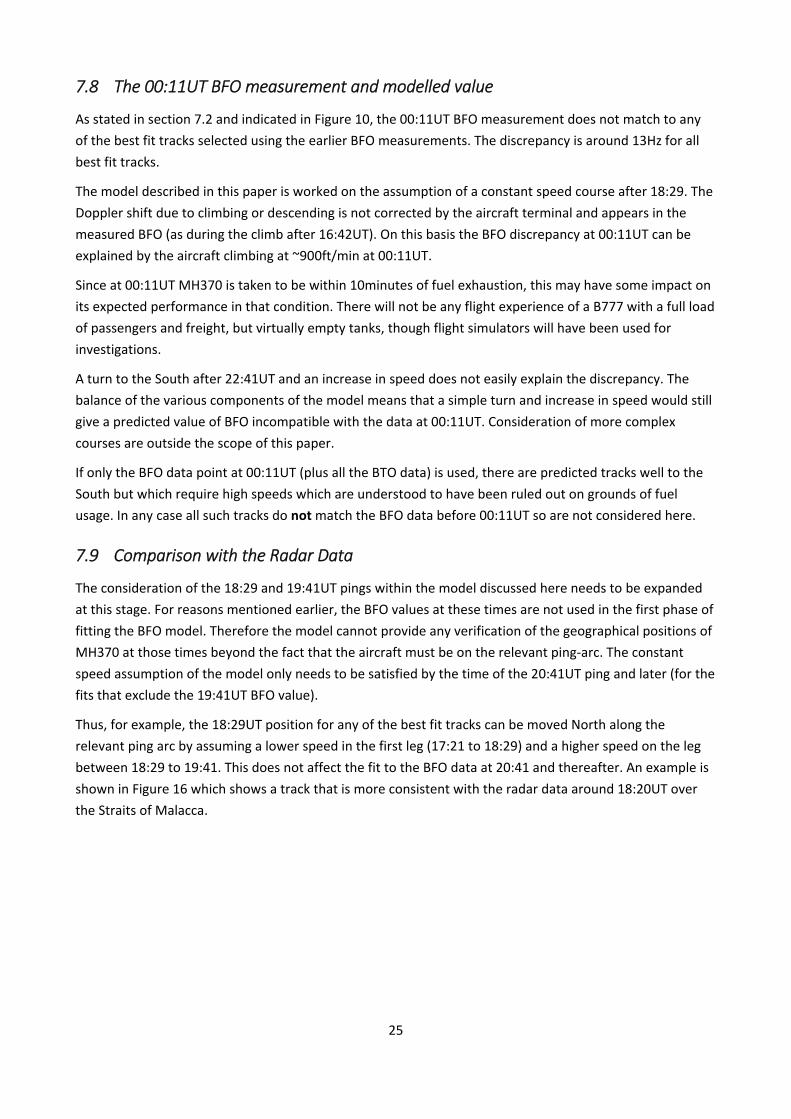
The plot of the BFO prediction and data for an example possible track (500kt on the 1st leg and 306kt on the
later legs) is shown in Figure 15. The same comments as before apply to the 18:29UT BFO values.
50
100
150
200
250
300
15:00 16:00 17:00 18:00 19:00 20:00 21:00 22:00 23:00 00:00 01:00
Burst Freq
uen
cy Offset (Hz)
Measured BFO values Predicted BFO values
Figure 15: BFO plot for example possible track including all the BFO data points from 19:41UT to 22:41
(500kt first leg, 306kt later legs)
25
7.8 The 00:11UT BFO measurement and modelled value
As stated in section 7.2 and indicated in Figure 10, the 00:11UT BFO measurement does not match to any
of the best fit tracks selected using the earlier BFO measurements. The discrepancy is around 13Hz for all
best fit tracks.
The model described in this paper is worked on the assumption of a constant speed course after 18:29. The
Doppler shift due to climbing or descending is not corrected by the aircraft terminal and appears in the
measured BFO (as during the climb after 16:42UT). On this basis the BFO discrepancy at 00:11UT can be
explained by the aircraft climbing at ~900ft/min at 00:11UT.
Since at 00:11UT MH370 is taken to be within 10minutes of fuel exhaustion, this may have some impact on
its expected performance in that condition. There will not be any flight experience of a B777 with a full load
of passengers and freight, but virtually empty tanks, though flight simulators will have been used for
investigations.
A turn to the South after 22:41UT and an increase in speed does not easily explain the discrepancy. The
balance of the various components of the model means that a simple turn and increase in speed would still
give a predicted value of BFO incompatible with the data at 00:11UT. Consideration of more complex
courses are outside the scope of this paper.
If only the BFO data point at 00:11UT (plus all the BTO data) is used, there are predicted tracks well to the
South but which require high speeds which are understood to have been ruled out on grounds of fuel
usage. In any case all such tracks do not match the BFO data before 00:11UT so are not considered here.
7.9 Comparison with the Radar Data
The consideration of the 18:29 and 19:41UT pings within the model discussed here needs to be expanded
at this stage. For reasons mentioned earlier, the BFO values at these times are not used in the first phase of
fitting the BFO model. Therefore the model cannot provide any verification of the geographical positions of
MH370 at those times beyond the fact that the aircraft must be on the relevant ping‐arc. The constant
speed assumption of the model only needs to be satisfied by the time of the 20:41UT ping and later (for the
fits that exclude the 19:41UT BFO value).
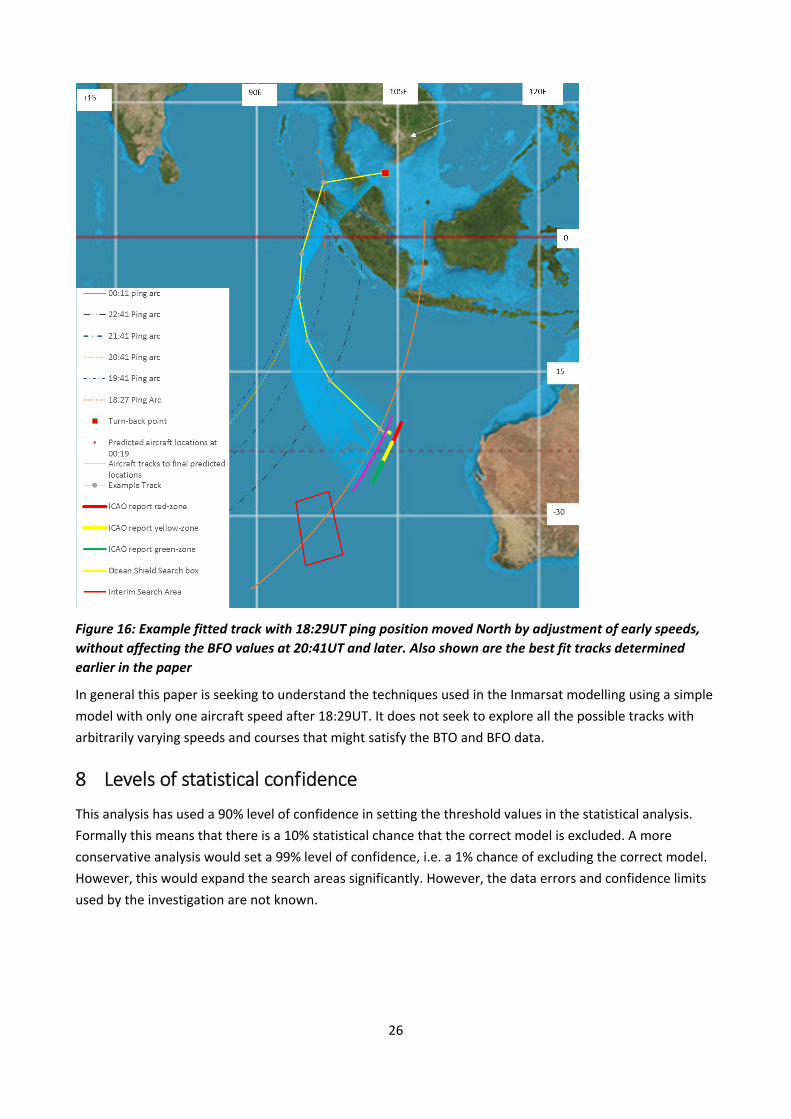
Thus, for example, the 18:29UT position for any of the best fit tracks can be moved North along the
relevant ping arc by assuming a lower speed in the first leg (17:21 to 18:29) and a higher speed on the leg
between 18:29 to 19:41. This does not affect the fit to the BFO data at 20:41 and thereafter. An example is
shown in Figure 16 which shows a track that is more consistent with the radar data around 18:20UT over
the Straits of Malacca.
26
Figure 16: Example fitted track with 18:29UT ping position moved North by adjustment of early speeds,
without affecting the BFO values at 20:41UT and later. Also shown are the best fit tracks determined
earlier in the paper
In general this paper is seeking to understand the techniques used in the Inmarsat modelling using a simple
model with only one aircraft speed after 18:29UT. It does not seek to explore all the possible tracks with
arbitrarily varying speeds and courses that might satisfy the BTO and BFO data.
8 Levels of statistical confidence
This analysis has used a 90% level of confidence in setting the threshold values in the statistical analysis.
Formally this means that there is a 10% statistical chance that the correct model is excluded. A more
conservative analysis would set a 99% level of confidence, i.e. a 1% chance of excluding the correct model.
However, this would expand the search areas significantly. However, the data errors and confidence limits
used by the investigation are not known.

27
9 Conclusions
This paper has sought to use public domain information to understand the modelling undertaken by
Inmarsat, AAIB and others of the satellite data from flight MH370 on March 7th and 8th, 2014. A set of
simple models have been constructed working from information published by the MH370 investigation.
These models are consistent with the declared search areas.
The paper has not found any major discrepancies between the released satellite data and the published
conclusions. It does not attempt to alter any conclusion about the crash‐site of MH370.
The Author offers his condolences to the families of the passengers and crew of MH370.
10 References
[1] Inmarsat raw data released 27th May 2014
http://www.dca.gov.my/mainpage/MH370%20Data%20Communication%20Logs.pdf
[2] Statement made by the MH370 Investigation on the Satellite data analysis 25/3/14.
https://www.facebook.com/permalink.php?story_fbid=740971779281171&id=178566888854999
[3] Description of the INMARSAT‐C service for INMARSAT‐3 F3 (178.1° E.L.) downloaded from FCC site
https://www.dropbox.com/s/5y500vugqgdumpf/3F3_spec.pdf
[4] System Description, Installation, and Maintenance Manual for Multi‐Channel SATCOM System Types
MCS‐4200 and MCS‐7200 http://www.slashdocs.com/nkzyzq/sdim‐msc7200‐23‐20‐35‐rev‐1.html
[5] MITEQ technical note 25T020 Enhanced Automatic Frequency Control for Inmarsat Earth Stations
https://www.miteq.com/docs/20TEC.PDF
[6] Paiusco, L., ‘Space Mission Operations and Ground Data Systems’ ‐ SpaceOps '96, Proceedings of the
Fourth International Symposium held 16‐20 September 1996 in Munich, Germany. Edited by T.‐D. Guyenne.
ESA SP‐394. Paris: European Space Agency, 1996., p.163 http://articles.adsabs.harvard.edu/cgi‐bin/nph‐
iarticle_query?1996ESASP.394..163P&defaultprint=YES&filetype=.pdf
[7] New Data, Analysis and Luck Help Narrow Flight 370 Search Zone, Officials Factored In Satellite
Temperature, Other Aircraft Speeds, Boeing Performance Calculations, April 16th 2014
http://online.wsj.com/news/articles/SB10001424052702303887804579504142188688308
[8] MH370 Preliminary Report and appendices by the Malaysian Ministry of Transport to the ICAO, 9th April
2014
https://www.documentcloud.org/documents/1151155‐mh370‐preliminary‐report.html
https://www.documentcloud.org/documents/1151152‐mh370‐actions‐taken‐between‐0138‐and‐
0614l.html
https://www.documentcloud.org/documents/1151153‐mh370‐cargo‐manifest‐and‐airway‐bill.html
https://www.documentcloud.org/documents/1151154‐mh370‐maps.html
[9] http://en.wikipedia.org/wiki/Pearson%27s_chi‐squared_test
[10] Recorded ADS‐B data for MH370 on 7/3/14:
http://uk.flightaware.com/live/flight/MAS370/history/20140307/1635Z/WMKK/ZBAA/tracklog

28
Statement on the Author:
The author is a space scientist working at University College London and holds a first degree in mathematics
and a doctorate in physics. He has 35 years’ experience of the science and engineering of space projects
and also holds a private pilot’s licence. As part of his professional work he has contacts with Inmarsat but
has received no payment or consideration.
The author acknowledges comments and suggestions made on a number of bulletin boards since 7th March
and the suggestions of colleagues. The opinions stated are those of the author only.
29
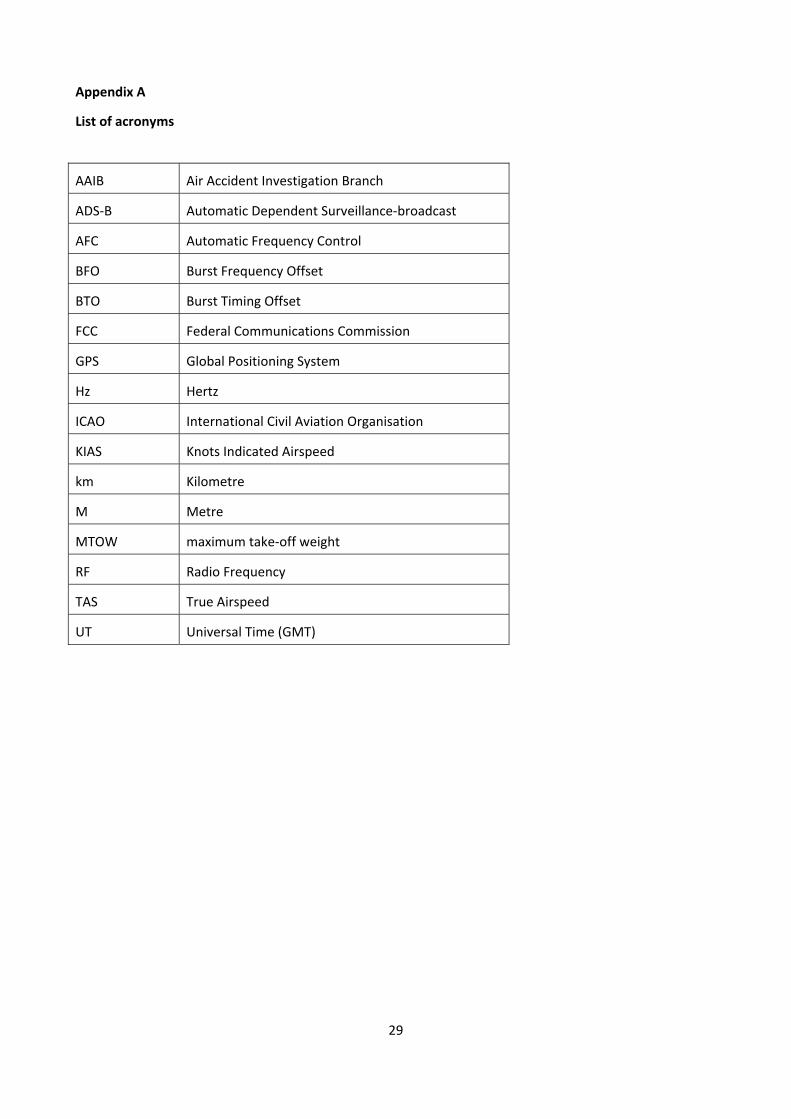
Appendix A
List of acronyms
AAIB Air Accident Investigation Branch
ADS‐B Automatic Dependent Surveillance‐broadcast
AFC Automatic Frequency Control
BFO Burst Frequency Offset
BTO Burst Timing Offset
FCC Federal Communications Commission
GPS Global Positioning System
Hz Hertz
ICAO International Civil Aviation Organisation
KIAS Knots Indicated Airspeed
km Kilometre
M Metre
MTOW maximum take‐off weight
RF Radio Frequency
TAS True Airspeed
UT Universal Time (GMT)

30
Appendix B
Ping Arcs distances derived from the BTO measurements
The key ping ring distances derived from the BTO data using the formulation of section 3 in the body of the
paper as shown in the table.
Time (UT) Great Circle Distance from sub‐
satellite point (km)
18:29 3630
19:41 3375
20:41 3436
21:41 3692
22:41 4096
00:11 4819
31
Appendix C
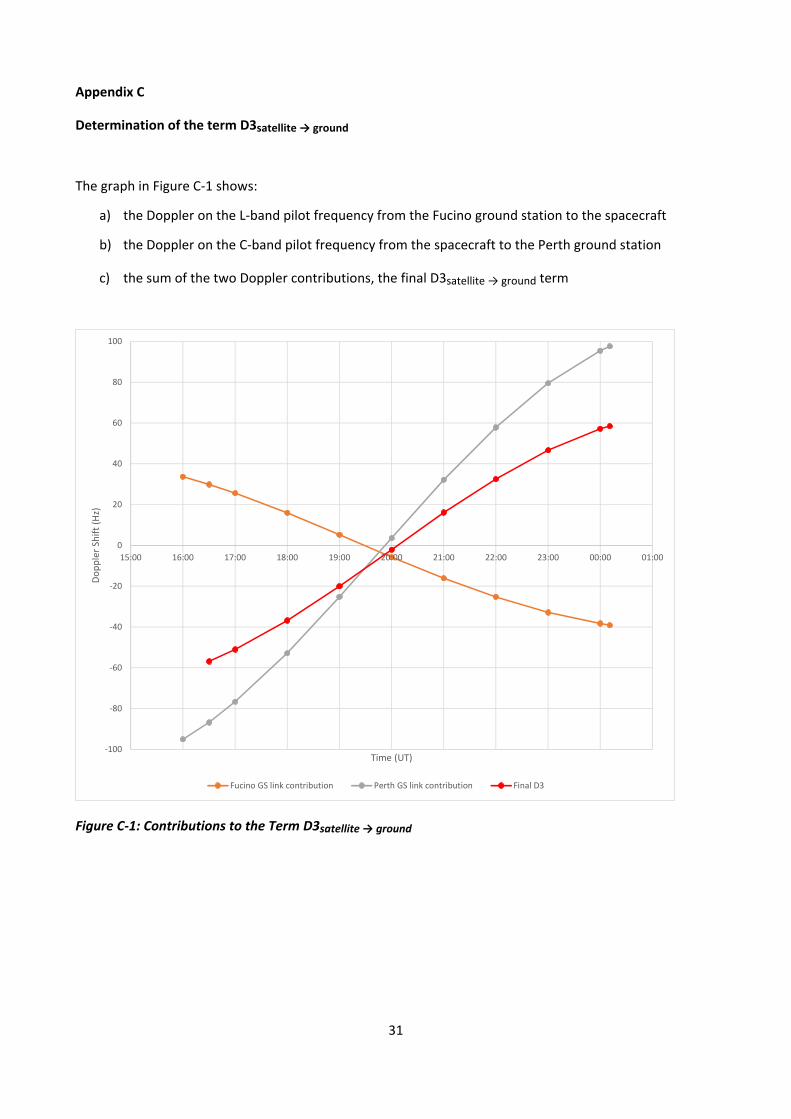
Determination of the term D3satellite → ground
The graph in Figure C‐1 shows:
a) the Doppler on the L‐band pilot frequency from the Fucino ground station to the spacecraft
b) the Doppler on the C‐band pilot frequency from the spacecraft to the Perth ground station
c) the sum of the two Doppler contributions, the final D3satellite → ground term
‐100
‐80
‐60
‐40
‐20
0
20
40
60
80
100
15:00 16:00 17:00 18:00 19:00 20:00 21:00 22:00 23:00 00:00 01:00
Doppler Shift (Hz)
Time (UT)
Fucino GS link contribution Perth GS link contribution Final D3
Figure C‐1: Contributions to the Term D3satellite → ground
32
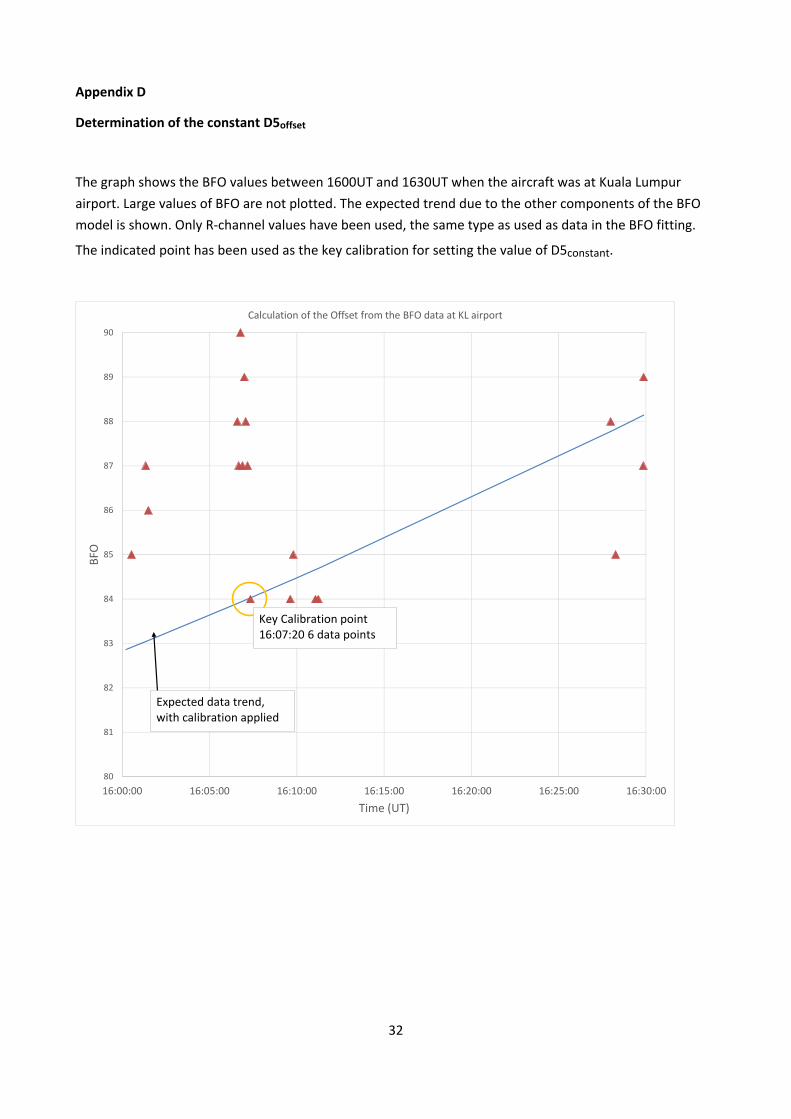
Appendix D
Determination of the constant D5offset
The graph shows the BFO values between 1600UT and 1630UT when the aircraft was at Kuala Lumpur
airport. Large values of BFO are not plotted. The expected trend due to the other components of the BFO
model is shown. Only R‐channel values have been used, the same type as used as data in the BFO fitting.
The indicated point has been used as the key calibration for setting the value of D5constant.
80
81
82
83
84
85
86
87
88
89
90
16:00:00 16:05:00 16:10:00 16:15:00 16:20:00 16:25:00 16:30:00
BFO
Time (UT)
Calculation of the Offset from the BFO data at KL airport
Key Calibration point16:07:20 6 data points
Expected data trend, with calibration applied
33
Appendix E
Description of the statistical tests used for BFO data
A. Pearson’s chi‐squared test
The purpose of Pearson’s chi‐squared test is to exclude hypotheses that are inconsistent with a set of data
after allowing for the statistical fluctuations that might have affected that data. In this case there are a
small number of data points each affected by errors, so the question is which potential routes of the
aircraft can be ruled out and which routes are statistically possible?
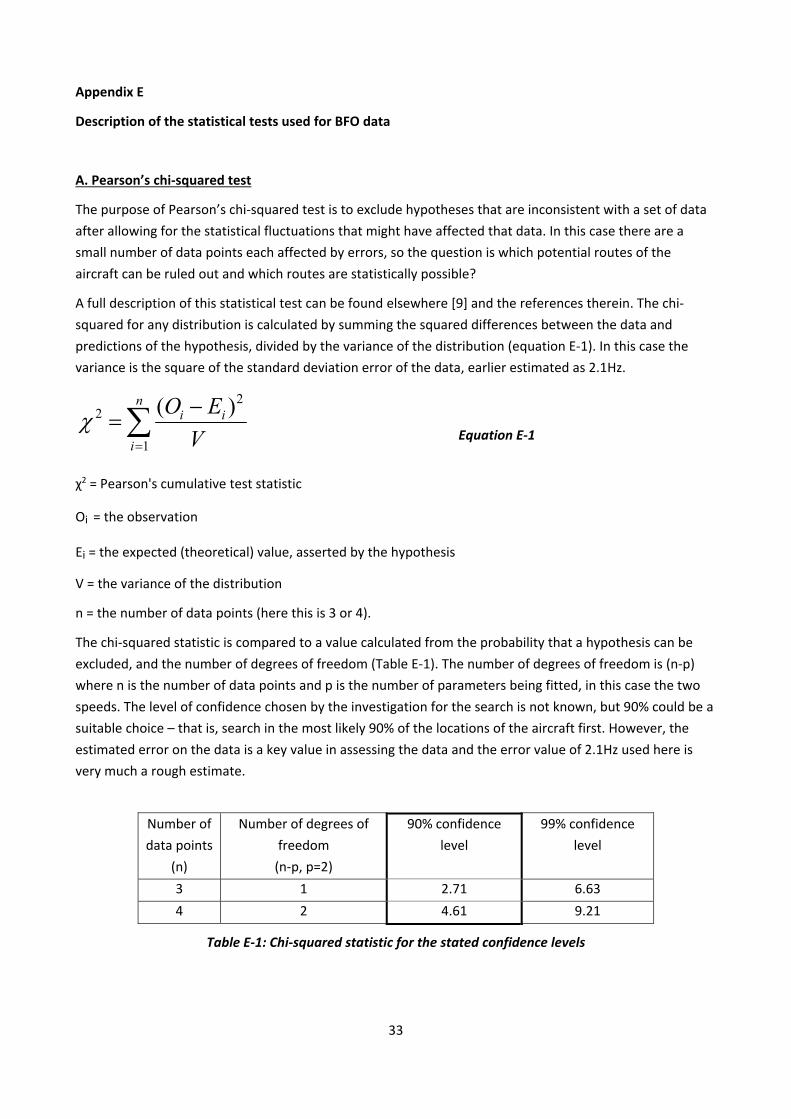
A full description of this statistical test can be found elsewhere [9] and the references therein. The chi‐
squared for any distribution is calculated by summing the squared differences between the data and
predictions of the hypothesis, divided by the variance of the distribution (equation E‐1). In this case the
variance is the square of the standard deviation error of the data, earlier estimated as 2.1Hz.
n
i
ii
V
EO
1
22 )(
Equation E‐1
χ2 = Pearson's cumulative test statistic
Oi = the observation
Ei = the expected (theoretical) value, asserted by the hypothesis
V = the variance of the distribution
n = the number of data points (here this is 3 or 4).
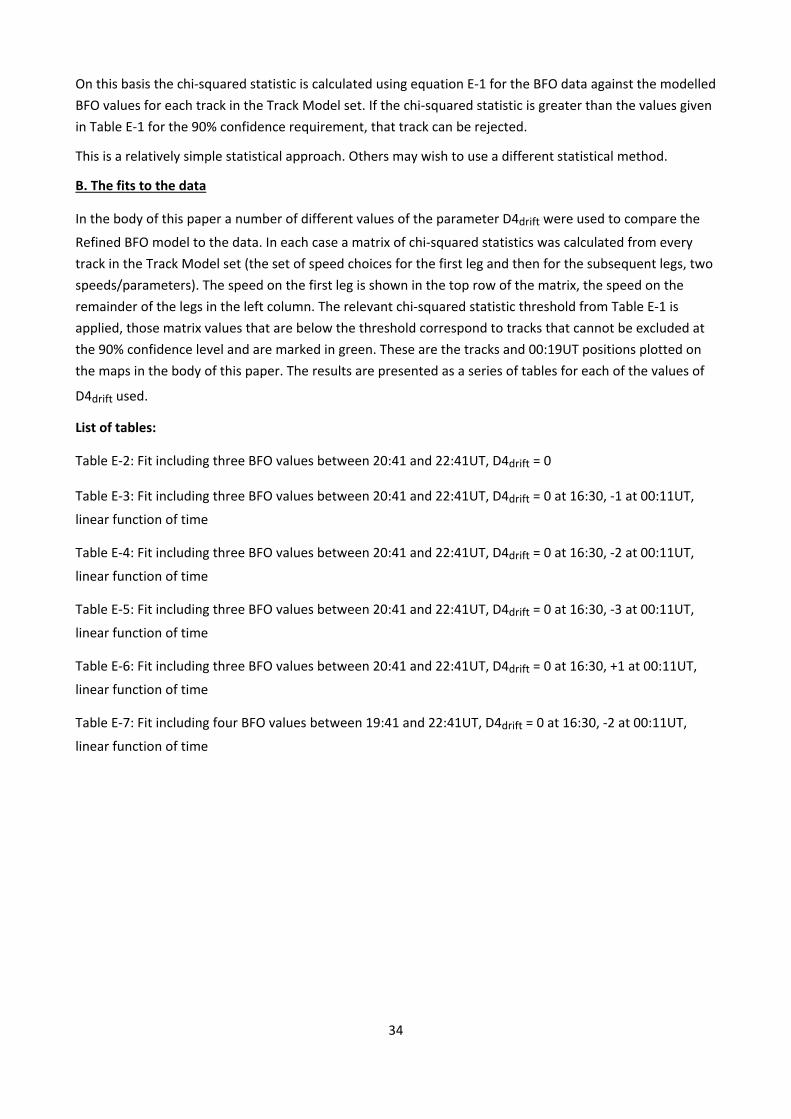
The chi‐squared statistic is compared to a value calculated from the probability that a hypothesis can be
excluded, and the number of degrees of freedom (Table E‐1). The number of degrees of freedom is (n‐p)
where n is the number of data points and p is the number of parameters being fitted, in this case the two
speeds. The level of confidence chosen by the investigation for the search is not known, but 90% could be a
suitable choice – that is, search in the most likely 90% of the locations of the aircraft first. However, the
estimated error on the data is a key value in assessing the data and the error value of 2.1Hz used here is
very much a rough estimate.
Number of
data points
(n)
Number of degrees of
freedom
(n‐p, p=2)
90% confidence
level
99% confidence
level
3 1 2.71 6.63
4 2 4.61 9.21
Table E‐1: Chi‐squared statistic for the stated confidence levels
34
On this basis the chi‐squared statistic is calculated using equation E‐1 for the BFO data against the modelled
BFO values for each track in the Track Model set. If the chi‐squared statistic is greater than the values given
in Table E‐1 for the 90% confidence requirement, that track can be rejected.
This is a relatively simple statistical approach. Others may wish to use a different statistical method.
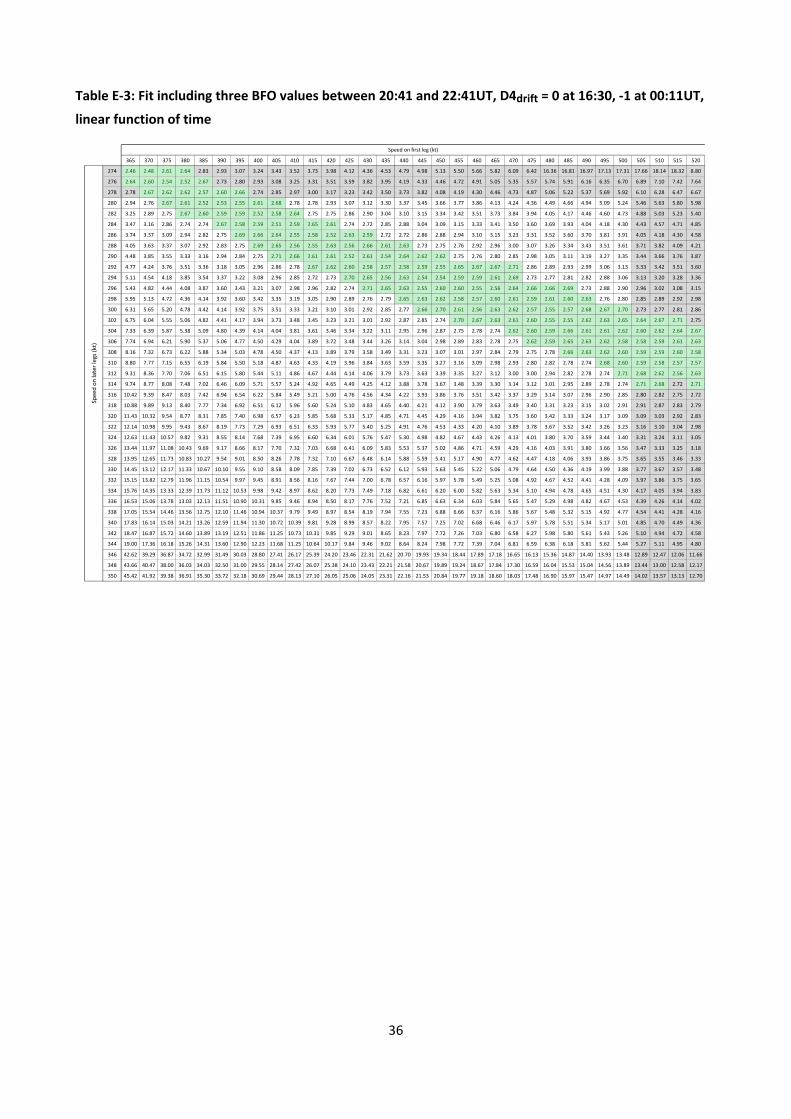
B. The fits to the data
In the body of this paper a number of different values of the parameter D4drift were used to compare the
Refined BFO model to the data. In each case a matrix of chi‐squared statistics was calculated from every
track in the Track Model set (the set of speed choices for the first leg and then for the subsequent legs, two
speeds/parameters). The speed on the first leg is shown in the top row of the matrix, the speed on the
remainder of the legs in the left column. The relevant chi‐squared statistic threshold from Table E‐1 is
applied, those matrix values that are below the threshold correspond to tracks that cannot be excluded at
the 90% confidence level and are marked in green. These are the tracks and 00:19UT positions plotted on
the maps in the body of this paper. The results are presented as a series of tables for each of the values of
D4drift used.
List of tables:
Table E‐2: Fit including three BFO values between 20:41 and 22:41UT, D4drift = 0
Table E‐3: Fit including three BFO values between 20:41 and 22:41UT, D4drift = 0 at 16:30, ‐1 at 00:11UT,
linear function of time
Table E‐4: Fit including three BFO values between 20:41 and 22:41UT, D4drift = 0 at 16:30, ‐2 at 00:11UT,
linear function of time
Table E‐5: Fit including three BFO values between 20:41 and 22:41UT, D4drift = 0 at 16:30, ‐3 at 00:11UT,
linear function of time
Table E‐6: Fit including three BFO values between 20:41 and 22:41UT, D4drift = 0 at 16:30, +1 at 00:11UT,
linear function of time
Table E‐7: Fit including four BFO values between 19:41 and 22:41UT, D4drift = 0 at 16:30, ‐2 at 00:11UT,
linear function of time

35
Table E‐2: Fit including three BFO values between 20:41 and 22:41UT, D4drift = 0
365 370 375 380 385 390 395 400 405 410 415 420 425 430 435 440 445 450 455 460 465 470 475 480 485 490 495 500 505 510 515 520
274 2.92 3.15 3.49 3.65 3.97 4.21 4.46 4.73 5.03 5.20 5.48 5.83 6.06 6.37 6.62 6.96 7.23 7.44 7.91 8.12 8.34 8.69 9.11 20.83 21.34 21.53 21.72 21.94 22.33 22.87 23.09 12.07
276 2.88 3.04 3.18 3.28 3.55 3.72 3.93 4.16 4.41 4.65 4.79 5.10 5.22 5.57 5.77 6.09 6.32 6.48 6.83 7.10 7.29 7.66 7.98 8.19 8.41 8.75 8.99 9.41 9.67 9.92 10.34 10.61
278 2.79 2.88 2.99 3.14 3.23 3.36 3.53 3.71 3.92 4.15 4.26 4.53 4.63 4.94 5.06 5.39 5.54 5.90 6.05 6.23 6.47 6.81 7.00 7.27 7.49 7.70 8.08 8.41 8.63 8.87 9.11 9.36
280 2.75 2.77 2.83 2.94 2.98 3.09 3.21 3.37 3.54 3.74 3.82 4.04 4.29 4.41 4.67 4.82 4.95 5.23 5.42 5.57 5.95 6.11 6.28 6.46 6.71 7.07 7.28 7.48 7.78 8.00 8.23 8.46
282 2.84 2.71 2.73 2.79 2.83 2.98 3.08 3.09 3.24 3.40 3.59 3.66 3.88 3.97 4.22 4.32 4.46 4.72 4.89 5.02 5.31 5.52 5.67 5.83 6.00 6.40 6.58 6.77 6.98 7.18 7.47 7.69
284 2.88 2.77 2.66 2.68 2.81 2.85 2.88 2.99 2.99 3.15 3.30 3.35 3.54 3.61 3.84 3.93 4.16 4.29 4.40 4.69 4.82 4.96 5.14 5.30 5.60 5.77 5.99 6.17 6.35 6.54 6.73 6.94
286 2.96 2.80 2.73 2.69 2.71 2.74 2.79 2.85 2.94 2.93 3.06 3.09 3.27 3.32 3.51 3.59 3.81 3.91 4.02 4.26 4.40 4.52 4.65 4.97 5.12 5.27 5.42 5.59 5.81 5.99 6.17 6.52
288 3.13 2.93 2.81 2.66 2.66 2.66 2.68 2.72 2.79 2.77 2.87 3.02 3.03 3.21 3.25 3.31 3.51 3.59 3.68 3.91 4.01 4.14 4.26 4.52 4.66 4.83 4.97 5.13 5.28 5.44 5.82 6.00
290 3.38 2.99 2.84 2.77 2.71 2.61 2.61 2.63 2.69 2.74 2.75 2.85 2.84 3.00 3.02 3.20 3.25 3.32 3.52 3.61 3.70 3.80 4.05 4.17 4.29 4.41 4.58 4.72 4.86 5.16 5.32 5.49
292 3.52 3.20 2.90 2.80 2.74 2.67 2.64 2.65 2.66 2.69 2.65 2.71 2.74 2.83 2.87 2.99 3.05 3.10 3.27 3.35 3.43 3.52 3.74 3.84 3.96 4.08 4.20 4.33 4.63 4.78 4.93 5.07
294 3.71 3.34 3.13 2.96 2.78 2.71 2.66 2.63 2.61 2.62 2.57 2.65 2.72 2.73 2.72 2.87 2.87 2.92 3.08 3.13 3.20 3.40 3.48 3.58 3.67 3.78 3.90 4.15 4.27 4.40 4.53 4.71
296 3.89 3.49 3.26 3.05 2.94 2.83 2.76 2.63 2.59 2.60 2.66 2.60 2.63 2.65 2.71 2.73 2.74 2.87 2.92 2.96 3.02 3.19 3.26 3.34 3.43 3.52 3.75 3.86 3.98 4.10 4.22 4.34
298 4.24 3.66 3.40 3.20 3.10 2.99 2.80 2.73 2.70 2.65 2.63 2.56 2.62 2.57 2.68 2.63 2.66 2.76 2.78 2.82 2.96 3.02 3.07 3.14 3.22 3.30 3.51 3.61 3.71 3.81 3.94 4.05
300 4.50 4.04 3.74 3.45 3.24 3.07 2.96 2.89 2.73 2.67 2.65 2.60 2.61 2.58 2.61 2.60 2.57 2.69 2.68 2.70 2.84 2.89 2.93 2.97 3.04 3.23 3.31 3.39 3.48 3.58 3.68 3.78
302 4.80 4.29 3.96 3.61 3.48 3.22 3.08 2.96 2.86 2.70 2.74 2.61 2.66 2.55 2.57 2.57 2.64 2.61 2.63 2.65 2.73 2.77 2.81 2.85 2.90 3.06 3.13 3.20 3.28 3.37 3.46 3.56
304 5.23 4.52 4.16 3.83 3.63 3.46 3.19 3.05 3.02 2.87 2.78 2.74 2.67 2.66 2.61 2.54 2.62 2.60 2.56 2.67 2.69 2.67 2.70 2.74 2.90 2.93 2.99 3.06 3.11 3.18 3.26 3.35
306 5.51 4.92 4.37 4.19 3.80 3.60 3.42 3.25 3.14 3.01 2.92 2.86 2.70 2.74 2.65 2.59 2.60 2.60 2.56 2.62 2.63 2.65 2.62 2.65 2.79 2.83 2.87 2.92 2.98 3.05 3.12 3.20
308 5.82 5.18 4.75 4.39 4.16 3.77 3.56 3.42 3.25 3.20 3.04 2.92 2.87 2.78 2.74 2.68 2.66 2.59 2.58 2.62 2.58 2.60 2.61 2.72 2.70 2.73 2.77 2.81 2.86 2.92 2.98 3.06
310 6.31 5.51 5.05 4.61 4.36 4.12 3.89 3.68 3.48 3.35 3.14 3.09 2.94 2.91 2.79 2.81 2.68 2.65 2.65 2.64 2.60 2.60 2.57 2.66 2.68 2.70 2.70 2.72 2.77 2.81 2.87 2.93
312 6.69 5.96 5.46 4.99 4.57 4.35 4.11 3.84 3.62 3.48 3.35 3.23 3.03 3.02 2.85 2.86 2.82 2.68 2.72 2.70 2.63 2.59 2.66 2.66 2.64 2.65 2.67 2.70 2.73 2.74 2.78 2.93
314 7.04 6.27 5.76 5.30 4.97 4.55 4.29 4.01 3.94 3.72 3.53 3.34 3.27 3.11 3.04 2.93 2.87 2.83 2.75 2.72 2.70 2.62 2.69 2.64 2.64 2.64 2.63 2.65 2.67 2.70 2.83 2.87
316 7.58 6.77 6.04 5.71 5.27 4.91 4.62 4.41 4.12 3.88 3.71 3.57 3.43 3.30 3.19 3.13 2.94 2.95 2.90 2.76 2.72 2.76 2.74 2.68 2.67 2.62 2.63 2.64 2.65 2.76 2.77 2.81
318 7.94 7.16 6.57 5.99 5.52 5.20 4.89 4.60 4.30 4.22 3.97 3.71 3.66 3.47 3.38 3.22 3.10 3.09 2.97 2.91 2.82 2.79 2.76 2.73 2.71 2.70 2.66 2.62 2.71 2.72 2.74 2.77
320 8.38 7.50 6.88 6.29 5.93 5.58 5.25 4.94 4.65 4.40 4.14 4.02 3.80 3.69 3.50 3.41 3.25 3.18 3.11 2.98 2.92 2.93 2.85 2.76 2.73 2.71 2.70 2.69 2.76 2.76 2.76 2.74
322 8.96 8.02 7.20 6.81 6.20 5.84 5.49 5.16 4.91 4.59 4.49 4.19 4.11 3.84 3.77 3.53 3.44 3.33 3.20 3.12 3.11 3.00 2.94 2.90 2.81 2.78 2.72 2.77 2.77 2.76 2.77 2.78
324 9.36 8.38 7.70 7.11 6.71 6.11 5.81 5.46 5.26 4.92 4.68 4.51 4.28 4.09 3.92 3.81 3.61 3.51 3.42 3.27 3.20 3.13 3.07 2.96 2.91 2.87 2.79 2.83 2.81 2.80 2.77 2.78
326 10.04 8.82 8.11 7.60 7.01 6.60 6.21 5.84 5.49 5.20 5.00 4.76 4.56 4.36 4.17 3.96 3.88 3.64 3.54 3.45 3.41 3.21 3.15 3.08 3.03 2.98 2.95 2.92 2.89 2.83 2.82 2.81
328 10.46 9.39 8.64 7.92 7.47 6.89 6.48 6.09 5.93 5.57 5.21 5.08 4.75 4.63 4.40 4.20 4.03 3.91 3.74 3.57 3.52 3.43 3.35 3.17 3.10 3.05 3.05 3.01 2.98 2.95 2.92 2.88
330 10.88 9.77 9.00 8.33 7.79 7.34 6.91 6.57 6.18 5.80 5.63 5.29 5.01 4.82 4.67 4.37 4.27 4.06 3.94 3.81 3.71 3.54 3.46 3.37 3.30 3.23 3.13 3.08 3.04 3.00 2.97 2.95
332 11.48 10.36 9.53 8.84 8.19 7.72 7.27 6.84 6.43 6.17 5.86 5.51 5.33 5.01 4.86 4.71 4.43 4.30 4.17 4.01 3.83 3.73 3.63 3.48 3.40 3.38 3.31 3.19 3.14 3.10 3.06 3.03
334 12.00 10.82 9.98 9.19 8.67 8.19 7.72 7.27 6.83 6.50 6.23 5.92 5.55 5.39 5.16 4.92 4.77 4.46 4.33 4.23 4.11 3.92 3.76 3.66 3.57 3.53 3.45 3.34 3.28 3.23 3.18 3.14
336 12.65 11.42 10.36 9.73 9.01 8.50 8.02 7.55 7.19 6.89 6.47 6.16 5.89 5.61 5.43 5.21 4.95 4.80 4.58 4.39 4.26 4.14 4.02 3.91 3.73 3.64 3.56 3.48 3.41 3.35 3.30 3.25
338 13.10 11.83 10.93 10.18 9.52 8.99 8.48 8.07 7.61 7.16 6.94 6.52 6.21 5.94 5.75 5.48 5.24 4.98 4.85 4.63 4.49 4.29 4.17 4.05 3.98 3.88 3.72 3.64 3.52 3.45 3.39 3.33
340 13.77 12.34 11.41 10.73 9.95 9.41 8.88 8.37 7.90 7.65 7.20 6.77 6.56 6.24 5.97 5.79 5.51 5.26 5.12 4.88 4.73 4.52 4.39 4.26 4.12 4.01 3.91 3.82 3.73 3.65 3.52 3.46
342 14.32 12.96 12.00 11.07 10.48 9.91 9.36 8.83 8.33 7.93 7.60 7.24 6.81 6.59 6.31 6.01 5.82 5.63 5.31 5.14 4.98 4.83 4.62 4.41 4.32 4.20 4.09 3.99 3.90 3.81 3.69 3.63
344 14.78 13.39 12.40 11.63 10.84 10.25 9.68 9.14 8.71 8.36 7.87 7.50 7.26 6.95 6.62 6.33 6.03 5.84 5.67 5.42 5.17 5.01 4.86 4.74 4.61 4.35 4.24 4.13 4.03 3.93 3.85 3.77
346 42.62 39.29 36.87 34.72 32.99 31.49 30.03 28.80 27.41 26.17 25.39 24.20 23.46 22.31 21.62 20.70 19.93 19.34 18.44 17.89 17.18 16.65 16.13 15.36 14.87 14.40 13.93 13.48 12.89 12.47 12.06 11.66
348 43.66 40.47 38.00 36.03 34.03 32.50 31.00 29.55 28.14 27.42 26.07 25.38 24.10 23.43 22.21 21.58 20.67 19.89 19.24 18.67 17.84 17.30 16.59 16.04 15.53 15.04 14.56 13.89 13.44 13.00 12.58 12.17
350 45.42 41.92 39.38 36.91 35.30 33.72 32.18 30.69 29.44 28.13 27.10 26.05 25.06 24.05 23.31 22.16 21.53 20.84 19.77 19.18 18.60 18.03 17.48 16.90 15.97 15.47 14.97 14.49 14.02 13.57 13.13 12.70
Speed
on later legs (kt)
Speed on first leg (kt)
36
Table E‐3: Fit including three BFO values between 20:41 and 22:41UT, D4drift = 0 at 16:30, ‐1 at 00:11UT,
linear function of time
365 370 375 380 385 390 395 400 405 410 415 420 425 430 435 440 445 450 455 460 465 470 475 480 485 490 495 500 505 510 515 520
274 2.46 2.48 2.61 2.64 2.83 2.93 3.07 3.24 3.43 3.52 3.73 3.98 4.12 4.36 4.53 4.79 4.98 5.13 5.50 5.66 5.82 6.09 6.42 16.36 16.81 16.97 17.13 17.31 17.66 18.14 18.32 8.80
276 2.64 2.60 2.54 2.52 2.67 2.73 2.80 2.93 3.08 3.25 3.31 3.51 3.59 3.82 3.95 4.19 4.33 4.46 4.72 4.91 5.05 5.35 5.57 5.74 5.91 6.16 6.35 6.70 6.89 7.10 7.42 7.64
278 2.78 2.67 2.62 2.62 2.57 2.60 2.66 2.74 2.85 2.97 3.00 3.17 3.23 3.42 3.50 3.73 3.82 4.08 4.19 4.30 4.46 4.73 4.87 5.06 5.22 5.37 5.69 5.92 6.10 6.28 6.47 6.67
280 2.94 2.76 2.67 2.61 2.52 2.53 2.55 2.61 2.68 2.78 2.78 2.93 3.07 3.12 3.30 3.37 3.45 3.66 3.77 3.86 4.13 4.24 4.36 4.49 4.66 4.94 5.09 5.24 5.46 5.63 5.80 5.98
282 3.25 2.89 2.75 2.67 2.60 2.59 2.59 2.52 2.58 2.64 2.75 2.75 2.86 2.90 3.04 3.10 3.15 3.34 3.42 3.51 3.73 3.84 3.94 4.05 4.17 4.46 4.60 4.73 4.88 5.03 5.23 5.40
284 3.47 3.16 2.86 2.74 2.74 2.67 2.58 2.59 2.51 2.59 2.65 2.61 2.74 2.72 2.85 2.88 3.04 3.09 3.15 3.33 3.41 3.50 3.60 3.69 3.93 4.04 4.18 4.30 4.43 4.57 4.71 4.85
286 3.74 3.37 3.09 2.94 2.82 2.75 2.69 2.66 2.64 2.55 2.58 2.52 2.63 2.59 2.72 2.72 2.86 2.88 2.94 3.10 3.15 3.23 3.31 3.52 3.60 3.70 3.81 3.91 4.05 4.18 4.30 4.58
288 4.05 3.63 3.37 3.07 2.92 2.83 2.75 2.69 2.65 2.56 2.55 2.63 2.56 2.66 2.61 2.63 2.73 2.75 2.76 2.92 2.96 3.00 3.07 3.26 3.34 3.43 3.51 3.61 3.71 3.82 4.09 4.21
290 4.48 3.85 3.55 3.33 3.16 2.94 2.84 2.75 2.71 2.66 2.61 2.61 2.52 2.61 2.54 2.64 2.62 2.62 2.75 2.76 2.80 2.85 2.98 3.05 3.11 3.19 3.27 3.35 3.44 3.66 3.76 3.87
292 4.77 4.24 3.76 3.51 3.36 3.18 3.05 2.96 2.86 2.78 2.67 2.62 2.60 2.58 2.57 2.58 2.59 2.55 2.65 2.67 2.67 2.71 2.86 2.89 2.93 2.99 3.06 3.13 3.33 3.42 3.51 3.60
294 5.11 4.54 4.18 3.85 3.54 3.37 3.22 3.08 2.96 2.85 2.72 2.73 2.70 2.65 2.56 2.63 2.54 2.54 2.59 2.59 2.61 2.69 2.73 2.77 2.81 2.82 2.88 3.06 3.13 3.20 3.28 3.36
296 5.43 4.82 4.44 4.08 3.87 3.60 3.43 3.21 3.07 2.98 2.96 2.82 2.74 2.71 2.65 2.63 2.55 2.60 2.60 2.55 2.56 2.64 2.66 2.66 2.69 2.73 2.88 2.90 2.96 3.02 3.08 3.15
298 5.95 5.13 4.72 4.36 4.14 3.92 3.60 3.42 3.35 3.19 3.05 2.90 2.89 2.76 2.79 2.65 2.63 2.62 2.58 2.57 2.60 2.61 2.59 2.61 2.60 2.63 2.76 2.80 2.85 2.89 2.92 2.98
300 6.31 5.65 5.20 4.78 4.42 4.14 3.92 3.75 3.51 3.33 3.21 3.10 3.01 2.92 2.85 2.77 2.66 2.70 2.61 2.56 2.63 2.62 2.57 2.55 2.57 2.68 2.67 2.70 2.73 2.77 2.81 2.86
302 6.75 6.04 5.55 5.06 4.82 4.41 4.17 3.94 3.73 3.48 3.45 3.23 3.21 3.01 2.92 2.87 2.85 2.74 2.70 2.67 2.63 2.61 2.60 2.55 2.55 2.62 2.63 2.65 2.64 2.67 2.71 2.75
304 7.33 6.39 5.87 5.38 5.09 4.80 4.39 4.14 4.04 3.81 3.61 3.46 3.34 3.22 3.11 2.95 2.96 2.87 2.75 2.78 2.74 2.62 2.60 2.59 2.66 2.61 2.61 2.62 2.60 2.62 2.64 2.67
306 7.74 6.94 6.21 5.90 5.37 5.06 4.77 4.50 4.29 4.04 3.89 3.72 3.48 3.44 3.26 3.14 3.04 2.98 2.89 2.83 2.78 2.75 2.62 2.59 2.65 2.63 2.62 2.58 2.58 2.59 2.61 2.63
308 8.16 7.32 6.73 6.22 5.88 5.34 5.03 4.78 4.50 4.37 4.13 3.89 3.79 3.58 3.49 3.31 3.23 3.07 3.01 2.97 2.84 2.79 2.75 2.78 2.66 2.63 2.62 2.60 2.59 2.59 2.60 2.58
310 8.80 7.77 7.15 6.55 6.19 5.84 5.50 5.18 4.87 4.63 4.33 4.19 3.96 3.84 3.63 3.59 3.35 3.27 3.16 3.09 2.98 2.93 2.80 2.82 2.78 2.74 2.68 2.60 2.59 2.58 2.57 2.57
312 9.31 8.36 7.70 7.06 6.51 6.15 5.80 5.44 5.11 4.86 4.67 4.44 4.14 4.06 3.79 3.73 3.63 3.39 3.35 3.27 3.12 3.00 3.00 2.94 2.82 2.78 2.74 2.71 2.68 2.62 2.56 2.63
314 9.74 8.77 8.08 7.48 7.02 6.46 6.09 5.71 5.57 5.24 4.92 4.65 4.49 4.25 4.12 3.88 3.78 3.67 3.48 3.39 3.30 3.14 3.12 3.01 2.95 2.89 2.78 2.74 2.71 2.68 2.72 2.71
316 10.42 9.39 8.47 8.03 7.42 6.94 6.54 6.22 5.84 5.49 5.21 5.00 4.76 4.56 4.34 4.22 3.93 3.86 3.76 3.51 3.42 3.37 3.29 3.14 3.07 2.96 2.90 2.85 2.80 2.82 2.75 2.72
318 10.88 9.89 9.13 8.40 7.77 7.34 6.92 6.51 6.12 5.96 5.60 5.24 5.10 4.83 4.65 4.40 4.21 4.12 3.90 3.79 3.63 3.49 3.40 3.31 3.23 3.15 3.02 2.91 2.91 2.87 2.83 2.79
320 11.43 10.32 9.54 8.77 8.31 7.85 7.40 6.98 6.57 6.23 5.85 5.68 5.33 5.17 4.85 4.71 4.45 4.29 4.16 3.94 3.82 3.75 3.60 3.42 3.33 3.24 3.17 3.09 3.09 3.03 2.92 2.83
322 12.14 10.98 9.95 9.43 8.67 8.19 7.73 7.29 6.93 6.51 6.33 5.93 5.77 5.40 5.25 4.91 4.76 4.53 4.33 4.20 4.10 3.89 3.78 3.67 3.52 3.42 3.26 3.23 3.16 3.10 3.04 2.98
324 12.63 11.43 10.57 9.82 9.31 8.55 8.14 7.68 7.39 6.95 6.60 6.34 6.01 5.76 5.47 5.30 4.98 4.82 4.67 4.43 4.26 4.13 4.01 3.80 3.70 3.59 3.44 3.40 3.31 3.24 3.11 3.05
326 13.44 11.97 11.08 10.43 9.69 9.17 8.66 8.17 7.70 7.32 7.03 6.68 6.41 6.09 5.83 5.53 5.37 5.02 4.86 4.71 4.59 4.29 4.16 4.03 3.91 3.80 3.66 3.56 3.47 3.33 3.25 3.18
328 13.95 12.65 11.73 10.83 10.27 9.54 9.01 8.50 8.26 7.78 7.32 7.10 6.67 6.48 6.14 5.88 5.59 5.41 5.17 4.90 4.77 4.62 4.47 4.18 4.06 3.93 3.86 3.75 3.65 3.55 3.46 3.33
330 14.45 13.12 12.17 11.33 10.67 10.10 9.55 9.10 8.58 8.09 7.85 7.39 7.02 6.73 6.52 6.12 5.93 5.63 5.45 5.22 5.06 4.79 4.64 4.50 4.36 4.19 3.99 3.88 3.77 3.67 3.57 3.48
332 15.15 13.82 12.79 11.96 11.15 10.54 9.97 9.45 8.91 8.56 8.16 7.67 7.44 7.00 6.78 6.57 6.16 5.97 5.78 5.49 5.25 5.08 4.92 4.67 4.52 4.41 4.28 4.09 3.97 3.86 3.75 3.65
334 15.76 14.35 13.33 12.39 11.73 11.12 10.53 9.98 9.42 8.97 8.62 8.20 7.73 7.49 7.18 6.82 6.61 6.20 6.00 5.82 5.63 5.34 5.10 4.94 4.78 4.65 4.51 4.30 4.17 4.05 3.94 3.83
336 16.53 15.06 13.78 13.03 12.13 11.51 10.90 10.31 9.85 9.46 8.94 8.50 8.17 7.76 7.52 7.21 6.85 6.63 6.34 6.03 5.84 5.65 5.47 5.29 4.98 4.82 4.67 4.53 4.39 4.26 4.14 4.02
338 17.05 15.54 14.46 13.56 12.75 12.10 11.46 10.94 10.37 9.79 9.49 8.97 8.54 8.19 7.94 7.55 7.23 6.88 6.66 6.37 6.16 5.86 5.67 5.48 5.32 5.15 4.92 4.77 4.54 4.41 4.28 4.16
340 17.83 16.14 15.03 14.21 13.26 12.59 11.94 11.30 10.72 10.39 9.81 9.28 8.99 8.57 8.22 7.95 7.57 7.25 7.02 6.68 6.46 6.17 5.97 5.78 5.51 5.34 5.17 5.01 4.85 4.70 4.49 4.36
342 18.47 16.87 15.72 14.60 13.89 13.19 12.51 11.86 11.25 10.73 10.31 9.85 9.29 9.01 8.65 8.23 7.97 7.72 7.26 7.03 6.80 6.58 6.27 5.98 5.80 5.61 5.43 5.26 5.10 4.94 4.72 4.58
344 19.00 17.36 16.18 15.26 14.31 13.60 12.90 12.23 11.68 11.25 10.64 10.17 9.84 9.46 9.02 8.64 8.24 7.98 7.72 7.39 7.04 6.81 6.59 6.38 6.18 5.81 5.62 5.44 5.27 5.11 4.95 4.80
346 42.62 39.29 36.87 34.72 32.99 31.49 30.03 28.80 27.41 26.17 25.39 24.20 23.46 22.31 21.62 20.70 19.93 19.34 18.44 17.89 17.18 16.65 16.13 15.36 14.87 14.40 13.93 13.48 12.89 12.47 12.06 11.66
348 43.66 40.47 38.00 36.03 34.03 32.50 31.00 29.55 28.14 27.42 26.07 25.38 24.10 23.43 22.21 21.58 20.67 19.89 19.24 18.67 17.84 17.30 16.59 16.04 15.53 15.04 14.56 13.89 13.44 13.00 12.58 12.17
350 45.42 41.92 39.38 36.91 35.30 33.72 32.18 30.69 29.44 28.13 27.10 26.05 25.06 24.05 23.31 22.16 21.53 20.84 19.77 19.18 18.60 18.03 17.48 16.90 15.97 15.47 14.97 14.49 14.02 13.57 13.13 12.70
Speed on later legs (kt)
Speed on first leg (kt)
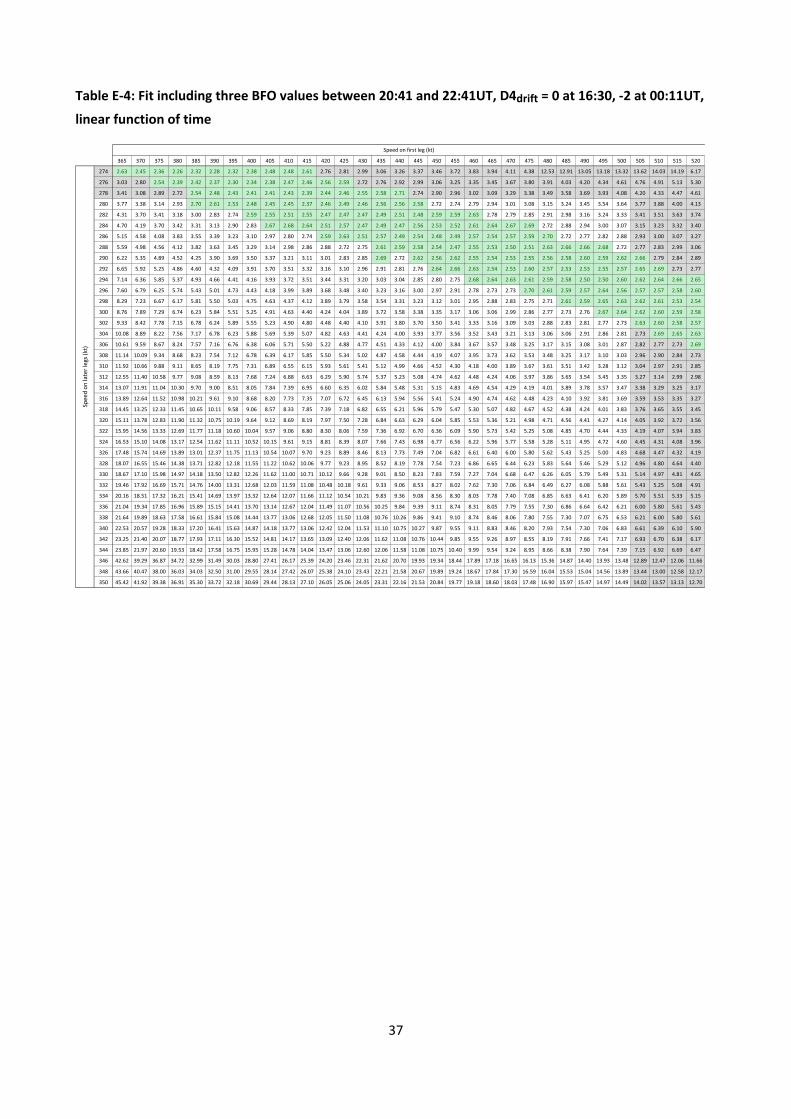
37
Table E‐4: Fit including three BFO values between 20:41 and 22:41UT, D4drift = 0 at 16:30, ‐2 at 00:11UT,
linear function of time
365 370 375 380 385 390 395 400 405 410 415 420 425 430 435 440 445 450 455 460 465 470 475 480 485 490 495 500 505 510 515 520
274 2.63 2.45 2.36 2.26 2.32 2.28 2.32 2.38 2.48 2.48 2.61 2.76 2.81 2.99 3.06 3.26 3.37 3.46 3.72 3.83 3.94 4.11 4.38 12.53 12.91 13.05 13.18 13.32 13.62 14.03 14.19 6.17
276 3.03 2.80 2.54 2.39 2.42 2.37 2.30 2.34 2.38 2.47 2.46 2.56 2.59 2.72 2.76 2.92 2.99 3.06 3.25 3.35 3.45 3.67 3.80 3.91 4.03 4.20 4.34 4.61 4.76 4.91 5.13 5.30
278 3.41 3.08 2.89 2.72 2.54 2.48 2.43 2.41 2.41 2.43 2.39 2.44 2.46 2.55 2.58 2.71 2.74 2.90 2.96 3.02 3.09 3.29 3.38 3.49 3.58 3.69 3.93 4.08 4.20 4.33 4.47 4.61
280 3.77 3.38 3.14 2.93 2.70 2.61 2.53 2.48 2.45 2.45 2.37 2.46 2.49 2.46 2.56 2.56 2.58 2.72 2.74 2.79 2.94 3.01 3.08 3.15 3.24 3.45 3.54 3.64 3.77 3.88 4.00 4.13
282 4.31 3.70 3.41 3.18 3.00 2.83 2.74 2.59 2.55 2.51 2.55 2.47 2.47 2.47 2.49 2.51 2.48 2.59 2.59 2.63 2.78 2.79 2.85 2.91 2.98 3.16 3.24 3.33 3.41 3.51 3.63 3.74
284 4.70 4.19 3.70 3.42 3.31 3.13 2.90 2.83 2.67 2.68 2.64 2.51 2.57 2.47 2.49 2.47 2.56 2.53 2.52 2.61 2.64 2.67 2.69 2.72 2.88 2.94 3.00 3.07 3.15 3.23 3.32 3.40
286 5.15 4.58 4.08 3.83 3.55 3.39 3.23 3.10 2.97 2.80 2.74 2.59 2.63 2.51 2.57 2.49 2.54 2.48 2.49 2.57 2.54 2.57 2.59 2.70 2.72 2.77 2.82 2.88 2.93 3.00 3.07 3.27
288 5.59 4.98 4.56 4.12 3.82 3.63 3.45 3.29 3.14 2.98 2.86 2.88 2.72 2.75 2.61 2.59 2.58 2.54 2.47 2.55 2.53 2.50 2.51 2.63 2.66 2.66 2.68 2.72 2.77 2.83 2.99 3.06
290 6.22 5.35 4.89 4.52 4.25 3.90 3.69 3.50 3.37 3.21 3.11 3.01 2.83 2.85 2.69 2.72 2.62 2.56 2.62 2.55 2.54 2.53 2.55 2.56 2.58 2.60 2.59 2.62 2.66 2.79 2.84 2.89
292 6.65 5.92 5.25 4.86 4.60 4.32 4.09 3.91 3.70 3.51 3.32 3.16 3.10 2.96 2.91 2.81 2.76 2.64 2.66 2.63 2.54 2.53 2.60 2.57 2.53 2.53 2.55 2.57 2.65 2.69 2.73 2.77
294 7.14 6.36 5.85 5.37 4.93 4.66 4.41 4.16 3.93 3.72 3.51 3.44 3.31 3.20 3.03 3.04 2.85 2.80 2.75 2.68 2.64 2.63 2.61 2.59 2.58 2.50 2.50 2.60 2.62 2.64 2.66 2.65
296 7.60 6.79 6.25 5.74 5.43 5.01 4.73 4.43 4.18 3.99 3.89 3.68 3.48 3.40 3.23 3.16 3.00 2.97 2.91 2.78 2.73 2.73 2.70 2.61 2.59 2.57 2.64 2.56 2.57 2.57 2.58 2.60
298 8.29 7.23 6.67 6.17 5.81 5.50 5.03 4.75 4.63 4.37 4.12 3.89 3.79 3.58 3.54 3.31 3.23 3.12 3.01 2.95 2.88 2.83 2.75 2.71 2.61 2.59 2.65 2.63 2.62 2.61 2.53 2.54
300 8.76 7.89 7.29 6.74 6.23 5.84 5.51 5.25 4.91 4.63 4.40 4.24 4.04 3.89 3.72 3.58 3.38 3.35 3.17 3.06 3.06 2.99 2.86 2.77 2.73 2.76 2.67 2.64 2.62 2.60 2.59 2.58
302 9.33 8.42 7.78 7.15 6.78 6.24 5.89 5.55 5.23 4.90 4.80 4.48 4.40 4.10 3.91 3.80 3.70 3.50 3.41 3.33 3.16 3.09 3.03 2.88 2.83 2.81 2.77 2.73 2.63 2.60 2.58 2.57
304 10.08 8.89 8.22 7.56 7.17 6.78 6.23 5.88 5.69 5.39 5.07 4.82 4.63 4.41 4.24 4.00 3.93 3.77 3.56 3.52 3.43 3.21 3.13 3.06 3.06 2.91 2.86 2.81 2.73 2.69 2.65 2.63
306 10.61 9.59 8.67 8.24 7.57 7.16 6.76 6.38 6.06 5.71 5.50 5.22 4.88 4.77 4.51 4.33 4.12 4.00 3.84 3.67 3.57 3.48 3.25 3.17 3.15 3.08 3.01 2.87 2.82 2.77 2.73 2.69
308 11.14 10.09 9.34 8.68 8.23 7.54 7.12 6.78 6.39 6.17 5.85 5.50 5.34 5.02 4.87 4.58 4.44 4.19 4.07 3.95 3.73 3.62 3.53 3.48 3.25 3.17 3.10 3.03 2.96 2.90 2.84 2.73
310 11.92 10.66 9.88 9.11 8.65 8.19 7.75 7.31 6.89 6.55 6.15 5.93 5.61 5.41 5.12 4.99 4.66 4.52 4.30 4.18 4.00 3.89 3.67 3.61 3.51 3.42 3.28 3.12 3.04 2.97 2.91 2.85
312 12.55 11.40 10.58 9.77 9.08 8.59 8.13 7.68 7.24 6.88 6.63 6.29 5.90 5.74 5.37 5.23 5.08 4.74 4.62 4.48 4.24 4.06 3.97 3.86 3.65 3.54 3.45 3.35 3.27 3.14 2.99 2.98
314 13.07 11.91 11.04 10.30 9.70 9.00 8.51 8.05 7.84 7.39 6.95 6.60 6.35 6.02 5.84 5.48 5.31 5.15 4.83 4.69 4.54 4.29 4.19 4.01 3.89 3.78 3.57 3.47 3.38 3.29 3.25 3.17
316 13.89 12.64 11.52 10.98 10.21 9.61 9.10 8.68 8.20 7.73 7.35 7.07 6.72 6.45 6.13 5.94 5.56 5.41 5.24 4.90 4.74 4.62 4.48 4.23 4.10 3.92 3.81 3.69 3.59 3.53 3.35 3.27
318 14.45 13.25 12.33 11.45 10.65 10.11 9.58 9.06 8.57 8.33 7.85 7.39 7.18 6.82 6.55 6.21 5.96 5.79 5.47 5.30 5.07 4.82 4.67 4.52 4.38 4.24 4.01 3.83 3.76 3.65 3.55 3.45
320 15.11 13.78 12.83 11.90 11.32 10.75 10.19 9.64 9.12 8.69 8.19 7.97 7.50 7.28 6.84 6.63 6.29 6.04 5.85 5.53 5.36 5.21 4.98 4.71 4.56 4.41 4.27 4.14 4.05 3.92 3.72 3.56
322 15.95 14.56 13.33 12.69 11.77 11.18 10.60 10.04 9.57 9.06 8.80 8.30 8.06 7.59 7.36 6.92 6.70 6.36 6.09 5.90 5.73 5.42 5.25 5.08 4.85 4.70 4.44 4.33 4.19 4.07 3.94 3.83
324 16.53 15.10 14.08 13.17 12.54 11.62 11.11 10.52 10.15 9.61 9.15 8.81 8.39 8.07 7.66 7.43 6.98 6.77 6.56 6.22 5.96 5.77 5.58 5.28 5.11 4.95 4.72 4.60 4.45 4.31 4.08 3.96
326 17.48 15.74 14.69 13.89 13.01 12.37 11.75 11.13 10.54 10.07 9.70 9.23 8.89 8.46 8.13 7.73 7.49 7.04 6.82 6.61 6.40 6.00 5.80 5.62 5.43 5.25 5.00 4.83 4.68 4.47 4.32 4.19
328 18.07 16.55 15.46 14.38 13.71 12.82 12.18 11.55 11.22 10.62 10.06 9.77 9.23 8.95 8.52 8.19 7.78 7.54 7.23 6.86 6.65 6.44 6.23 5.83 5.64 5.46 5.29 5.12 4.96 4.80 4.64 4.40
330 18.67 17.10 15.98 14.97 14.18 13.50 12.82 12.26 11.62 11.00 10.71 10.12 9.66 9.28 9.01 8.50 8.23 7.83 7.59 7.27 7.04 6.68 6.47 6.26 6.05 5.79 5.49 5.31 5.14 4.97 4.81 4.65
332 19.46 17.92 16.69 15.71 14.76 14.00 13.31 12.68 12.03 11.59 11.08 10.48 10.18 9.61 9.33 9.06 8.53 8.27 8.02 7.62 7.30 7.06 6.84 6.49 6.27 6.08 5.88 5.61 5.43 5.25 5.08 4.91
334 20.16 18.51 17.32 16.21 15.41 14.69 13.97 13.32 12.64 12.07 11.66 11.12 10.54 10.21 9.83 9.36 9.08 8.56 8.30 8.03 7.78 7.40 7.08 6.85 6.63 6.41 6.20 5.89 5.70 5.51 5.33 5.15
336 21.04 19.34 17.85 16.96 15.89 15.15 14.41 13.70 13.14 12.67 12.04 11.49 11.07 10.56 10.25 9.84 9.39 9.11 8.74 8.31 8.05 7.79 7.55 7.30 6.86 6.64 6.42 6.21 6.00 5.80 5.61 5.43
338 21.64 19.89 18.63 17.58 16.61 15.84 15.08 14.44 13.77 13.06 12.68 12.05 11.50 11.08 10.76 10.26 9.86 9.41 9.10 8.74 8.46 8.06 7.80 7.55 7.30 7.07 6.75 6.53 6.21 6.00 5.80 5.61
340 22.53 20.57 19.28 18.33 17.20 16.41 15.63 14.87 14.18 13.77 13.06 12.42 12.04 11.53 11.10 10.75 10.27 9.87 9.55 9.11 8.83 8.46 8.20 7.93 7.54 7.30 7.06 6.83 6.61 6.39 6.10 5.90
342 23.25 21.40 20.07 18.77 17.93 17.11 16.30 15.52 14.81 14.17 13.65 13.09 12.40 12.06 11.62 11.08 10.76 10.44 9.85 9.55 9.26 8.97 8.55 8.19 7.91 7.66 7.41 7.17 6.93 6.70 6.38 6.17
344 23.85 21.97 20.60 19.53 18.42 17.58 16.75 15.95 15.28 14.78 14.04 13.47 13.06 12.60 12.06 11.58 11.08 10.75 10.40 9.99 9.54 9.24 8.95 8.66 8.38 7.90 7.64 7.39 7.15 6.92 6.69 6.47
346 42.62 39.29 36.87 34.72 32.99 31.49 30.03 28.80 27.41 26.17 25.39 24.20 23.46 22.31 21.62 20.70 19.93 19.34 18.44 17.89 17.18 16.65 16.13 15.36 14.87 14.40 13.93 13.48 12.89 12.47 12.06 11.66
348 43.66 40.47 38.00 36.03 34.03 32.50 31.00 29.55 28.14 27.42 26.07 25.38 24.10 23.43 22.21 21.58 20.67 19.89 19.24 18.67 17.84 17.30 16.59 16.04 15.53 15.04 14.56 13.89 13.44 13.00 12.58 12.17
350 45.42 41.92 39.38 36.91 35.30 33.72 32.18 30.69 29.44 28.13 27.10 26.05 25.06 24.05 23.31 22.16 21.53 20.84 19.77 19.18 18.60 18.03 17.48 16.90 15.97 15.47 14.97 14.49 14.02 13.57 13.13 12.70
Speed on later legs (kt)
Speed on first leg (kt)

38
Table E‐5: Fit including three BFO values between 20:41 and 22:41UT, D4drift = 0 at 16:30, ‐3 at 00:11UT,
linear function of time
365 370 375 380 385 390 395 400 405 410 415 420 425 430 435 440 445 450 455 460 465 470 475 480 485 490 495 500 505 510 515 520
274 3.44 3.05 2.75 2.52 2.45 2.27 2.20 2.16 2.15 2.07 2.13 2.18 2.14 2.25 2.23 2.36 2.39 2.42 2.57 2.63 2.70 2.77 2.96 9.33 9.65 9.76 9.86 9.97 10.21 10.56 10.69 4.18
276 4.07 3.64 3.18 2.89 2.80 2.65 2.44 2.38 2.31 2.34 2.25 2.23 2.23 2.24 2.20 2.29 2.28 2.30 2.41 2.43 2.47 2.63 2.66 2.73 2.80 2.88 2.96 3.16 3.26 3.35 3.48 3.59
278 4.67 4.14 3.79 3.47 3.15 2.99 2.84 2.71 2.60 2.52 2.40 2.35 2.33 2.30 2.29 2.32 2.30 2.35 2.36 2.36 2.35 2.48 2.52 2.54 2.58 2.63 2.80 2.86 2.94 3.02 3.10 3.19
280 5.23 4.64 4.25 3.87 3.52 3.32 3.14 2.99 2.85 2.76 2.59 2.62 2.54 2.44 2.46 2.38 2.34 2.41 2.36 2.36 2.39 2.41 2.43 2.45 2.46 2.59 2.62 2.67 2.71 2.78 2.84 2.91
282 6.00 5.15 4.70 4.32 4.04 3.71 3.52 3.29 3.16 3.01 2.98 2.82 2.71 2.67 2.58 2.55 2.45 2.47 2.39 2.38 2.46 2.38 2.39 2.40 2.42 2.50 2.52 2.56 2.58 2.62 2.65 2.71
284 6.57 5.85 5.17 4.75 4.52 4.23 3.87 3.70 3.45 3.39 3.26 3.04 3.04 2.85 2.77 2.69 2.72 2.60 2.54 2.52 2.50 2.48 2.42 2.39 2.48 2.48 2.46 2.48 2.50 2.53 2.56 2.58
286 7.19 6.41 5.71 5.36 4.93 4.66 4.41 4.17 3.94 3.68 3.52 3.29 3.27 3.05 3.05 2.88 2.86 2.72 2.68 2.68 2.57 2.54 2.52 2.52 2.48 2.47 2.47 2.48 2.44 2.46 2.48 2.60
288 7.78 6.95 6.38 5.81 5.36 5.07 4.79 4.53 4.27 4.03 3.81 3.76 3.51 3.48 3.25 3.18 3.06 2.97 2.81 2.83 2.75 2.62 2.59 2.63 2.61 2.52 2.48 2.47 2.47 2.47 2.52 2.53
290 8.59 7.47 6.87 6.35 5.98 5.49 5.18 4.89 4.66 4.39 4.24 4.04 3.77 3.72 3.47 3.44 3.25 3.14 3.13 2.96 2.91 2.85 2.75 2.71 2.67 2.64 2.54 2.52 2.51 2.55 2.54 2.54
292 9.17 8.23 7.37 6.84 6.49 6.09 5.76 5.48 5.17 4.88 4.61 4.34 4.23 3.98 3.88 3.66 3.57 3.37 3.30 3.22 3.05 2.98 2.99 2.89 2.76 2.71 2.67 2.64 2.62 2.60 2.58 2.56
294 9.82 8.83 8.16 7.53 6.96 6.59 6.23 5.88 5.54 5.22 4.94 4.79 4.56 4.39 4.14 4.07 3.80 3.70 3.53 3.40 3.32 3.19 3.12 3.05 2.99 2.81 2.76 2.78 2.74 2.70 2.67 2.58
296 10.41 9.39 8.71 8.03 7.63 7.05 6.67 6.29 5.93 5.63 5.46 5.17 4.86 4.73 4.45 4.33 4.08 3.97 3.86 3.64 3.54 3.46 3.37 3.19 3.12 3.05 3.04 2.86 2.81 2.76 2.72 2.68
298 11.27 9.97 9.25 8.60 8.12 7.70 7.10 6.71 6.55 6.18 5.82 5.50 5.33 5.03 4.92 4.60 4.47 4.25 4.08 3.97 3.79 3.69 3.54 3.45 3.26 3.18 3.16 3.09 3.03 2.96 2.79 2.74
300 11.84 10.77 10.02 9.34 8.67 8.17 7.74 7.37 6.96 6.56 6.23 6.01 5.71 5.50 5.22 5.02 4.74 4.63 4.37 4.20 4.11 4.00 3.77 3.62 3.52 3.48 3.29 3.21 3.13 3.06 2.99 2.93
302 12.55 11.43 10.64 9.87 9.38 8.71 8.25 7.80 7.37 6.95 6.78 6.37 6.21 5.82 5.53 5.37 5.19 4.90 4.75 4.62 4.33 4.21 4.09 3.86 3.75 3.64 3.54 3.44 3.26 3.17 3.09 3.02
304 13.45 12.03 11.20 10.39 9.89 9.40 8.71 8.24 7.98 7.60 7.16 6.81 6.56 6.23 6.00 5.67 5.53 5.31 5.02 4.90 4.75 4.43 4.30 4.17 4.09 3.86 3.75 3.64 3.49 3.39 3.30 3.22
306 14.10 12.88 11.77 11.23 10.40 9.89 9.38 8.89 8.47 8.00 7.74 7.36 6.92 6.74 6.39 6.14 5.83 5.66 5.43 5.15 5.00 4.85 4.52 4.38 4.28 4.15 4.03 3.80 3.69 3.58 3.48 3.38
308 14.75 13.49 12.59 11.77 11.22 10.38 9.86 9.41 8.91 8.61 8.20 7.74 7.53 7.09 6.89 6.48 6.29 5.95 5.77 5.56 5.25 5.09 4.93 4.81 4.48 4.35 4.21 4.08 3.96 3.84 3.73 3.52
310 15.69 14.18 13.25 12.32 11.75 11.18 10.63 10.08 9.55 9.10 8.61 8.31 7.90 7.62 7.23 7.03 6.60 6.41 6.08 5.89 5.65 5.48 5.18 5.04 4.88 4.73 4.52 4.27 4.13 4.00 3.88 3.76
312 16.43 15.07 14.09 13.11 12.28 11.66 11.09 10.55 9.99 9.53 9.22 8.77 8.28 8.05 7.58 7.37 7.16 6.72 6.53 6.33 5.99 5.74 5.58 5.41 5.10 4.94 4.79 4.63 4.49 4.29 4.04 3.95
314 17.04 15.69 14.63 13.76 13.02 12.17 11.57 11.02 10.73 10.17 9.62 9.17 8.85 8.42 8.19 7.71 7.49 7.27 6.83 6.62 6.42 6.07 5.90 5.65 5.47 5.30 5.00 4.84 4.68 4.53 4.42 4.28
316 17.99 16.53 15.22 14.57 13.64 12.92 12.29 11.76 11.19 10.60 10.11 9.78 9.31 8.98 8.54 8.30 7.82 7.59 7.37 6.92 6.70 6.51 6.30 5.96 5.78 5.53 5.35 5.17 5.00 4.87 4.60 4.45
318 18.66 17.25 16.16 15.14 14.17 13.52 12.87 12.24 11.65 11.34 10.74 10.19 9.90 9.44 9.09 8.66 8.33 8.09 7.68 7.45 7.15 6.78 6.57 6.37 6.16 5.97 5.64 5.39 5.23 5.06 4.90 4.74
320 19.42 17.87 16.76 15.65 14.97 14.28 13.61 12.95 12.30 11.79 11.17 10.89 10.30 10.02 9.46 9.20 8.76 8.42 8.17 7.76 7.53 7.29 7.00 6.63 6.42 6.21 6.01 5.82 5.64 5.46 5.16 4.93
322 20.39 18.79 17.36 16.58 15.51 14.81 14.11 13.43 12.85 12.24 11.90 11.31 10.99 10.41 10.11 9.56 9.29 8.83 8.49 8.24 7.99 7.59 7.35 7.12 6.82 6.61 6.25 6.06 5.86 5.67 5.48 5.30
324 21.07 19.42 18.23 17.15 16.41 15.33 14.71 14.01 13.55 12.91 12.34 11.91 11.39 11.01 10.49 10.20 9.62 9.35 9.08 8.64 8.29 8.04 7.79 7.40 7.17 6.94 6.64 6.43 6.22 6.01 5.69 5.50
326 22.15 20.15 18.93 17.99 16.96 16.21 15.46 14.73 14.02 13.46 13.00 12.42 12.01 11.46 11.06 10.57 10.25 9.69 9.41 9.14 8.85 8.34 8.08 7.83 7.59 7.35 6.97 6.74 6.52 6.24 6.03 5.83
328 22.83 21.08 19.82 18.57 17.78 16.74 15.97 15.22 14.82 14.10 13.44 13.06 12.42 12.06 11.54 11.14 10.61 10.31 9.93 9.47 9.17 8.89 8.62 8.12 7.86 7.61 7.37 7.13 6.90 6.67 6.45 6.12
330 23.51 21.72 20.42 19.25 18.33 17.53 16.73 16.06 15.30 14.56 14.20 13.49 12.93 12.46 12.13 11.51 11.17 10.67 10.36 9.95 9.66 9.20 8.92 8.65 8.38 8.02 7.62 7.38 7.14 6.91 6.68 6.46
332 24.40 22.65 21.23 20.10 18.99 18.09 17.29 16.55 15.78 15.25 14.65 13.92 13.56 12.86 12.52 12.19 11.53 11.21 10.89 10.37 9.98 9.68 9.39 8.94 8.66 8.38 8.12 7.77 7.52 7.28 7.04 6.80
334 25.20 23.31 21.94 20.68 19.74 18.89 18.05 17.30 16.49 15.81 15.32 14.67 13.98 13.57 13.12 12.53 12.19 11.57 11.24 10.88 10.57 10.09 9.69 9.40 9.11 8.81 8.53 8.12 7.86 7.60 7.35 7.11
336 26.19 24.25 22.55 21.53 20.29 19.42 18.56 17.72 17.08 16.50 15.77 15.10 14.62 13.98 13.62 13.11 12.56 12.21 11.77 11.22 10.90 10.58 10.26 9.95 9.38 9.09 8.80 8.52 8.25 7.98 7.72 7.47
338 26.86 24.88 23.44 22.23 21.11 20.21 19.33 18.58 17.80 16.97 16.50 15.76 15.09 14.60 14.22 13.60 13.13 12.57 12.18 11.74 11.40 10.89 10.57 10.25 9.92 9.61 9.22 8.93 8.50 8.23 7.96 7.70
340 27.86 25.64 24.16 23.09 21.78 20.86 19.96 19.07 18.28 17.78 16.94 16.20 15.73 15.12 14.62 14.18 13.60 13.13 12.72 12.18 11.83 11.39 11.05 10.72 10.21 9.90 9.59 9.29 9.00 8.71 8.34 8.07
342 28.66 26.58 25.06 23.57 22.61 21.66 20.73 19.82 19.00 18.24 17.63 16.97 16.15 15.74 15.23 14.57 14.18 13.79 13.07 12.71 12.34 11.99 11.46 11.03 10.66 10.34 10.02 9.71 9.40 9.10 8.68 8.39
344 29.33 27.21 25.66 24.43 23.16 22.19 21.24 20.31 19.52 18.95 18.08 17.41 16.91 16.37 15.74 15.16 14.55 14.16 13.72 13.23 12.68 12.31 11.95 11.56 11.22 10.62 10.30 9.98 9.66 9.36 9.06 8.77
346 42.62 39.29 36.87 34.72 32.99 31.49 30.03 28.80 27.41 26.17 25.39 24.20 23.46 22.31 21.62 20.70 19.93 19.34 18.44 17.89 17.18 16.65 16.13 15.36 14.87 14.40 13.93 13.48 12.89 12.47 12.06 11.66
348 43.66 40.47 38.00 36.03 34.03 32.50 31.00 29.55 28.14 27.42 26.07 25.38 24.10 23.43 22.21 21.58 20.67 19.89 19.24 18.67 17.84 17.30 16.59 16.04 15.53 15.04 14.56 13.89 13.44 13.00 12.58 12.17
350 45.42 41.92 39.38 36.91 35.30 33.72 32.18 30.69 29.44 28.13 27.10 26.05 25.06 24.05 23.31 22.16 21.53 20.84 19.77 19.18 18.60 18.03 17.48 16.90 15.97 15.47 14.97 14.49 14.02 13.57 13.13 12.70
Speed on later legs (kt)
Speed on first leg (kt)
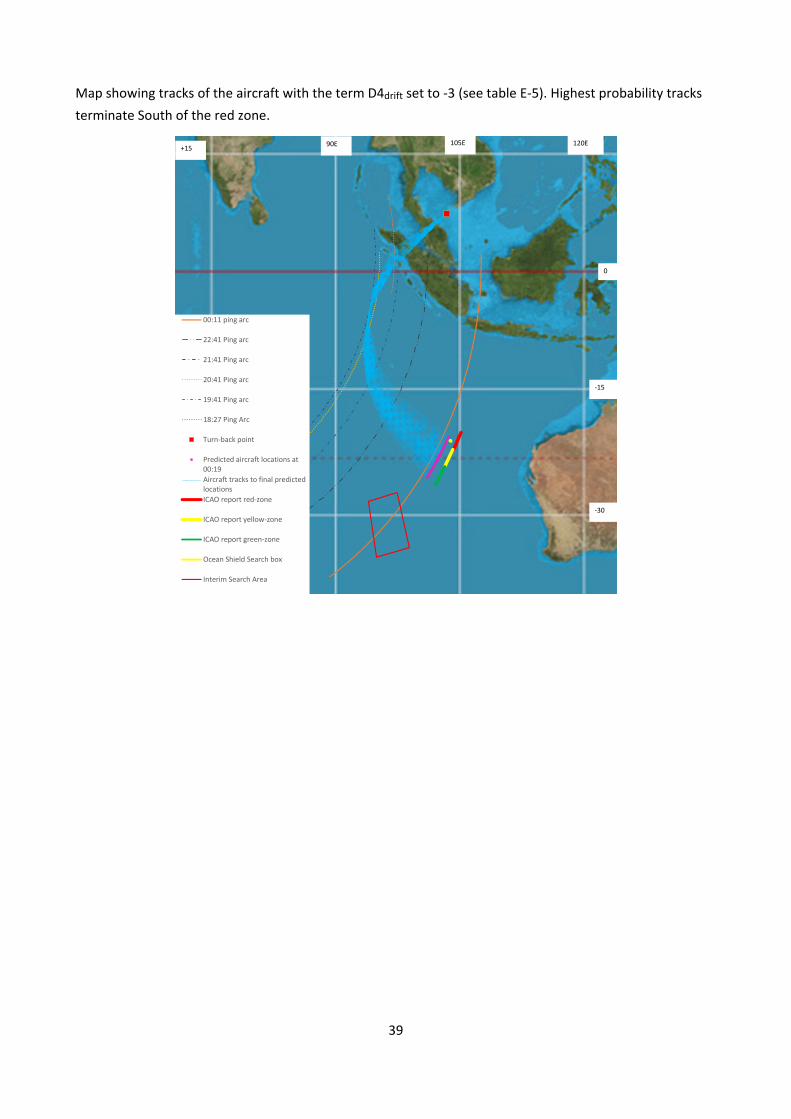
39
Map showing tracks of the aircraft with the term D4drift set to ‐3 (see table E‐5). Highest probability tracks
terminate South of the red zone.
00:11 ping arc
22:41 Ping arc
21:41 Ping arc
20:41 Ping arc
19:41 Ping arc
18:27 Ping Arc
Turn‐back point
Predicted aircraft locations at00:19
Aircraft tracks to final predictedlocations
ICAO report red‐zone
ICAO report yellow‐zone
ICAO report green‐zone
Ocean Shield Search box
Interim Search Area
‐30
‐15
0
+1590E 120E105E

40
Table E‐6: Fit including three BFO values between 20:41 and 22:41UT, D4drift = 0 at 16:30, +1 at 00:11UT,
linear function of time
365 370 375 380 385 390 395 400 405 410 415 420 425 430 435 440 445 450 455 460 465 470 475 480 485 490 495 500 505 510 515 520
274 4.01 4.45 5.01 5.30 5.75 6.12 6.48 6.86 7.26 7.52 7.87 8.32 8.63 9.01 9.36 9.76 10.12 10.38 10.96 11.22 11.49 11.94 12.42 25.94 26.51 26.72 26.94 27.20 27.64 28.25 28.49 15.96
276 3.75 4.11 4.45 4.68 5.06 5.35 5.70 6.03 6.38 6.69 6.91 7.33 7.49 7.95 8.23 8.62 8.93 9.15 9.58 9.93 10.17 10.60 11.02 11.28 11.56 11.98 12.27 12.77 13.07 13.38 13.89 14.22
278 3.44 3.73 3.99 4.30 4.52 4.76 5.02 5.31 5.62 5.96 6.14 6.52 6.67 7.08 7.25 7.68 7.89 8.35 8.55 8.79 9.11 9.52 9.76 10.12 10.39 10.65 11.11 11.52 11.80 12.09 12.39 12.69
280 3.19 3.42 3.63 3.89 4.07 4.28 4.51 4.76 5.04 5.33 5.50 5.78 6.14 6.34 6.67 6.91 7.09 7.44 7.71 7.91 8.40 8.61 8.83 9.06 9.40 9.83 10.10 10.36 10.74 11.01 11.29 11.58
282 3.05 3.17 3.33 3.55 3.70 4.00 4.21 4.29 4.54 4.81 5.06 5.21 5.54 5.67 6.03 6.18 6.40 6.74 6.99 7.17 7.53 7.83 8.03 8.25 8.47 8.97 9.21 9.45 9.72 9.97 10.35 10.62
284 2.91 3.02 3.09 3.26 3.51 3.66 3.83 4.03 4.11 4.34 4.59 4.72 4.98 5.14 5.46 5.61 5.91 6.12 6.29 6.69 6.87 7.05 7.32 7.53 7.91 8.13 8.44 8.67 8.91 9.15 9.39 9.66
286 2.82 2.87 3.00 3.06 3.24 3.37 3.52 3.68 3.87 3.95 4.18 4.29 4.53 4.67 4.94 5.10 5.39 5.58 5.73 6.05 6.28 6.45 6.63 7.06 7.27 7.47 7.68 7.89 8.20 8.43 8.67 9.09
288 2.86 2.85 2.89 2.87 3.02 3.13 3.25 3.39 3.56 3.62 3.83 4.04 4.14 4.38 4.51 4.63 4.93 5.06 5.24 5.54 5.70 5.92 6.09 6.42 6.61 6.87 7.07 7.28 7.49 7.70 8.19 8.43
290 2.91 2.76 2.77 2.84 2.89 2.92 3.03 3.15 3.30 3.46 3.52 3.72 3.80 4.03 4.14 4.38 4.52 4.65 4.92 5.09 5.24 5.39 5.75 5.92 6.10 6.27 6.53 6.72 6.92 7.30 7.52 7.74
292 2.90 2.79 2.68 2.73 2.76 2.80 2.88 2.98 3.09 3.23 3.27 3.44 3.51 3.71 3.80 4.04 4.14 4.28 4.53 4.66 4.83 4.97 5.26 5.42 5.63 5.80 5.98 6.16 6.58 6.77 6.98 7.18
294 2.94 2.78 2.72 2.71 2.66 2.69 2.74 2.81 2.91 3.02 3.04 3.21 3.38 3.44 3.52 3.73 3.83 3.93 4.19 4.31 4.43 4.74 4.87 5.02 5.17 5.38 5.54 5.87 6.05 6.24 6.42 6.69
296 2.98 2.79 2.71 2.66 2.65 2.69 2.73 2.68 2.75 2.86 2.99 3.01 3.16 3.22 3.39 3.47 3.56 3.77 3.87 4.00 4.11 4.36 4.49 4.66 4.80 4.95 5.25 5.47 5.64 5.81 5.98 6.17
298 3.17 2.83 2.72 2.66 2.70 2.69 2.64 2.67 2.69 2.75 2.83 2.84 2.98 3.02 3.20 3.24 3.32 3.53 3.61 3.71 3.96 4.07 4.18 4.31 4.47 4.61 4.90 5.05 5.21 5.37 5.59 5.76
300 3.32 3.07 2.92 2.75 2.70 2.65 2.63 2.66 2.60 2.64 2.72 2.73 2.84 2.87 3.01 3.06 3.11 3.30 3.39 3.46 3.68 3.79 3.91 4.02 4.14 4.41 4.58 4.72 4.87 5.02 5.18 5.34
302 3.48 3.18 3.00 2.79 2.79 2.66 2.63 2.61 2.62 2.55 2.66 2.62 2.75 2.73 2.86 2.91 3.06 3.11 3.19 3.26 3.46 3.55 3.65 3.78 3.89 4.14 4.26 4.39 4.56 4.70 4.85 5.01
304 3.75 3.29 3.08 2.91 2.82 2.74 2.62 2.58 2.63 2.57 2.59 2.65 2.65 2.74 2.75 2.77 2.92 2.96 3.01 3.20 3.28 3.35 3.44 3.54 3.77 3.90 4.01 4.13 4.25 4.38 4.52 4.66
306 3.92 3.53 3.18 3.11 2.87 2.78 2.70 2.65 2.64 2.62 2.59 2.63 2.57 2.68 2.67 2.68 2.80 2.85 2.88 3.04 3.11 3.18 3.25 3.34 3.56 3.65 3.76 3.89 4.01 4.14 4.27 4.41
308 4.11 3.68 3.41 3.20 3.07 2.83 2.74 2.70 2.64 2.66 2.59 2.59 2.59 2.61 2.63 2.69 2.72 2.74 2.78 2.91 2.97 3.03 3.11 3.30 3.37 3.46 3.56 3.66 3.77 3.88 4.00 4.17
310 4.45 3.89 3.58 3.31 3.16 3.03 2.91 2.81 2.73 2.70 2.59 2.62 2.56 2.61 2.57 2.68 2.64 2.67 2.78 2.83 2.85 2.91 2.97 3.14 3.22 3.30 3.36 3.48 3.58 3.69 3.80 3.92
312 4.72 4.20 3.86 3.55 3.28 3.18 3.05 2.87 2.77 2.73 2.66 2.65 2.54 2.62 2.54 2.63 2.64 2.60 2.72 2.76 2.78 2.81 2.96 3.01 3.08 3.15 3.23 3.32 3.41 3.49 3.62 3.85
314 4.98 4.40 4.07 3.75 3.56 3.28 3.13 2.94 2.95 2.85 2.76 2.67 2.68 2.61 2.60 2.60 2.61 2.62 2.66 2.69 2.72 2.74 2.88 2.91 2.96 3.03 3.11 3.18 3.27 3.36 3.57 3.68
316 5.38 4.78 4.26 4.03 3.74 3.51 3.33 3.22 3.03 2.91 2.85 2.77 2.74 2.68 2.68 2.67 2.59 2.67 2.68 2.64 2.66 2.78 2.82 2.85 2.90 2.93 2.99 3.06 3.13 3.32 3.43 3.53
318 5.64 5.06 4.64 4.21 3.90 3.69 3.50 3.33 3.12 3.11 2.99 2.82 2.84 2.75 2.75 2.68 2.63 2.70 2.66 2.67 2.64 2.73 2.76 2.79 2.83 2.88 2.93 2.96 3.13 3.21 3.29 3.38
320 5.97 5.31 4.85 4.43 4.19 3.95 3.74 3.54 3.37 3.21 3.07 3.01 2.90 2.85 2.78 2.75 2.68 2.70 2.69 2.65 2.66 2.75 2.73 2.74 2.78 2.81 2.86 2.91 3.07 3.13 3.22 3.28
322 6.42 5.71 5.08 4.82 4.37 4.12 3.89 3.68 3.54 3.31 3.29 3.09 3.09 2.92 2.93 2.79 2.76 2.76 2.70 2.69 2.76 2.73 2.74 2.76 2.75 2.78 2.81 2.95 3.00 3.06 3.13 3.20
324 6.73 5.97 5.46 5.04 4.75 4.30 4.11 3.88 3.76 3.52 3.40 3.32 3.17 3.06 3.00 2.95 2.87 2.84 2.81 2.75 2.77 2.76 2.76 2.75 2.76 2.79 2.78 2.90 2.95 3.00 3.07 3.14
326 7.27 6.32 5.77 5.40 4.96 4.67 4.40 4.14 3.91 3.72 3.61 3.48 3.35 3.26 3.14 3.02 3.03 2.89 2.85 2.82 2.86 2.78 2.77 2.77 2.78 2.79 2.88 2.92 2.95 2.96 3.01 3.07
328 7.60 6.76 6.18 5.64 5.31 4.88 4.59 4.32 4.23 4.00 3.74 3.69 3.46 3.43 3.29 3.16 3.10 3.05 2.95 2.87 2.90 2.88 2.86 2.79 2.79 2.79 2.89 2.91 2.94 2.97 3.02 3.08
330 7.94 7.06 6.46 5.96 5.54 5.21 4.90 4.67 4.40 4.15 4.04 3.82 3.65 3.54 3.46 3.26 3.24 3.12 3.07 3.03 2.99 2.93 2.90 2.89 2.87 2.90 2.90 2.91 2.94 2.97 3.00 3.05
332 8.44 7.53 6.90 6.36 5.86 5.53 5.20 4.87 4.59 4.42 4.20 3.97 3.86 3.67 3.57 3.48 3.34 3.26 3.20 3.15 3.06 3.02 2.98 2.93 2.92 2.98 2.98 2.94 2.95 2.97 3.00 3.04
334 8.87 7.92 7.26 6.63 6.25 5.89 5.54 5.19 4.88 4.67 4.46 4.28 4.01 3.94 3.77 3.65 3.56 3.37 3.30 3.28 3.23 3.14 3.05 3.01 2.99 3.04 3.03 3.02 3.02 3.04 3.06 3.09
336 9.41 8.41 7.56 7.06 6.52 6.13 5.77 5.43 5.16 4.96 4.64 4.45 4.25 4.08 3.97 3.84 3.68 3.59 3.45 3.38 3.32 3.26 3.21 3.17 3.12 3.09 3.08 3.07 3.07 3.07 3.09 3.11
338 9.78 8.75 8.03 7.43 6.92 6.52 6.13 5.84 5.48 5.16 5.02 4.71 4.52 4.32 4.20 4.04 3.88 3.72 3.67 3.53 3.46 3.36 3.30 3.25 3.27 3.24 3.16 3.14 3.12 3.12 3.13 3.15
340 10.34 9.18 8.43 7.88 7.28 6.86 6.45 6.07 5.70 5.54 5.22 4.90 4.78 4.56 4.36 4.26 4.08 3.91 3.85 3.71 3.63 3.50 3.43 3.37 3.35 3.32 3.28 3.26 3.25 3.24 3.18 3.19
342 10.81 9.70 8.91 8.17 7.71 7.26 6.84 6.43 6.05 5.76 5.53 5.26 4.96 4.81 4.60 4.42 4.30 4.18 3.99 3.89 3.80 3.72 3.61 3.48 3.48 3.43 3.39 3.36 3.33 3.31 3.30 3.31
344 11.20 10.06 9.25 8.63 8.00 7.54 7.10 6.68 6.37 6.10 5.74 5.47 5.32 5.08 4.85 4.66 4.46 4.34 4.26 4.08 3.93 3.84 3.76 3.74 3.67 3.53 3.48 3.45 3.42 3.40 3.38 3.38
346 42.62 39.29 36.87 34.72 32.99 31.49 30.03 28.80 27.41 26.17 25.39 24.20 23.46 22.31 21.62 20.70 19.93 19.34 18.44 17.89 17.18 16.65 16.13 15.36 14.87 14.40 13.93 13.48 12.89 12.47 12.06 11.66
348 43.66 40.47 38.00 36.03 34.03 32.50 31.00 29.55 28.14 27.42 26.07 25.38 24.10 23.43 22.21 21.58 20.67 19.89 19.24 18.67 17.84 17.30 16.59 16.04 15.53 15.04 14.56 13.89 13.44 13.00 12.58 12.17
350 45.42 41.92 39.38 36.91 35.30 33.72 32.18 30.69 29.44 28.13 27.10 26.05 25.06 24.05 23.31 22.16 21.53 20.84 19.77 19.18 18.60 18.03 17.48 16.90 15.97 15.47 14.97 14.49 14.02 13.57 13.13 12.70
Speed on later legs (kt)
Speed on first leg (kt)

41
Map showing tracks of the aircraft with the term D4drift set to +1 (see table E‐6). A poor match to the search
areas in indicated.
00:11 ping arc
22:41 Ping arc
21:41 Ping arc
20:41 Ping arc
19:41 Ping arc
18:27 Ping Arc
Turn‐back point
Predicted aircraft locations at00:19
Aircraft tracks to final predictedlocations
ICAO report red‐zone
ICAO report yellow‐zone
ICAO report green‐zone
Ocean Shield Search box
Interim Search Area
‐30
‐15
0
+1590E 120E105E
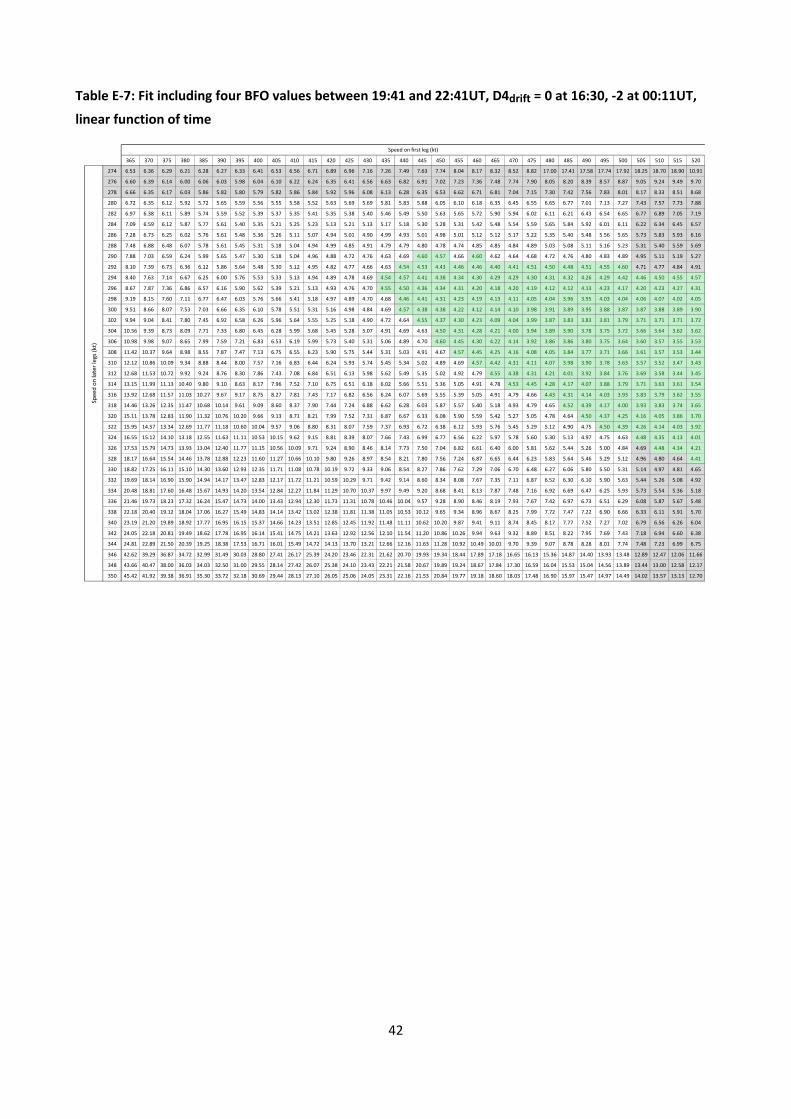
42
Table E‐7: Fit including four BFO values between 19:41 and 22:41UT, D4drift = 0 at 16:30, ‐2 at 00:11UT,
linear function of time
365 370 375 380 385 390 395 400 405 410 415 420 425 430 435 440 445 450 455 460 465 470 475 480 485 490 495 500 505 510 515 520
274 6.53 6.36 6.29 6.21 6.28 6.27 6.33 6.41 6.53 6.56 6.71 6.89 6.96 7.16 7.26 7.49 7.63 7.74 8.04 8.17 8.32 8.52 8.82 17.00 17.41 17.58 17.74 17.92 18.25 18.70 18.90 10.91
276 6.60 6.39 6.14 6.00 6.06 6.03 5.98 6.04 6.10 6.22 6.24 6.35 6.41 6.56 6.63 6.82 6.91 7.02 7.23 7.36 7.48 7.74 7.90 8.05 8.20 8.39 8.57 8.87 9.05 9.24 9.49 9.70
278 6.66 6.35 6.17 6.03 5.86 5.82 5.80 5.79 5.82 5.86 5.84 5.92 5.96 6.08 6.13 6.28 6.35 6.53 6.62 6.71 6.81 7.04 7.15 7.30 7.42 7.56 7.83 8.01 8.17 8.33 8.51 8.68
280 6.72 6.35 6.12 5.92 5.72 5.65 5.59 5.56 5.55 5.58 5.52 5.63 5.69 5.69 5.81 5.83 5.88 6.05 6.10 6.18 6.35 6.45 6.55 6.65 6.77 7.01 7.13 7.27 7.43 7.57 7.73 7.88
282 6.97 6.38 6.11 5.89 5.74 5.59 5.52 5.39 5.37 5.35 5.41 5.35 5.38 5.40 5.46 5.49 5.50 5.63 5.65 5.72 5.90 5.94 6.02 6.11 6.21 6.43 6.54 6.65 6.77 6.89 7.05 7.19
284 7.09 6.59 6.12 5.87 5.77 5.61 5.40 5.35 5.21 5.25 5.23 5.13 5.21 5.13 5.17 5.18 5.30 5.28 5.31 5.42 5.48 5.54 5.59 5.65 5.84 5.92 6.01 6.11 6.22 6.34 6.45 6.57
286 7.28 6.73 6.25 6.02 5.76 5.61 5.48 5.36 5.26 5.11 5.07 4.94 5.01 4.90 4.99 4.93 5.01 4.98 5.01 5.12 5.12 5.17 5.22 5.35 5.40 5.48 5.56 5.65 5.73 5.83 5.93 6.16
288 7.48 6.88 6.48 6.07 5.78 5.61 5.45 5.31 5.18 5.04 4.94 4.99 4.85 4.91 4.79 4.79 4.80 4.78 4.74 4.85 4.85 4.84 4.89 5.03 5.08 5.11 5.16 5.23 5.31 5.40 5.59 5.69
290 7.88 7.03 6.59 6.24 5.99 5.65 5.47 5.30 5.18 5.04 4.96 4.88 4.72 4.76 4.63 4.69 4.60 4.57 4.66 4.60 4.62 4.64 4.68 4.72 4.76 4.80 4.83 4.89 4.95 5.11 5.19 5.27
292 8.10 7.39 6.73 6.36 6.12 5.86 5.64 5.48 5.30 5.12 4.95 4.82 4.77 4.66 4.63 4.54 4.53 4.43 4.46 4.46 4.40 4.41 4.51 4.50 4.48 4.51 4.55 4.60 4.71 4.77 4.84 4.91
294 8.40 7.63 7.14 6.67 6.25 6.00 5.76 5.53 5.33 5.13 4.94 4.89 4.78 4.69 4.54 4.57 4.41 4.38 4.34 4.30 4.29 4.29 4.30 4.31 4.32 4.26 4.29 4.42 4.46 4.50 4.55 4.57
296 8.67 7.87 7.36 6.86 6.57 6.16 5.90 5.62 5.39 5.21 5.13 4.93 4.76 4.70 4.55 4.50 4.36 4.34 4.31 4.20 4.18 4.20 4.19 4.12 4.12 4.13 4.23 4.17 4.20 4.23 4.27 4.31
298 9.19 8.15 7.60 7.11 6.77 6.47 6.03 5.76 5.66 5.41 5.18 4.97 4.89 4.70 4.68 4.46 4.41 4.31 4.23 4.19 4.13 4.11 4.05 4.04 3.96 3.95 4.03 4.04 4.06 4.07 4.02 4.05
300 9.51 8.66 8.07 7.53 7.03 6.66 6.35 6.10 5.78 5.51 5.31 5.16 4.98 4.84 4.69 4.57 4.38 4.38 4.22 4.12 4.14 4.10 3.98 3.91 3.89 3.95 3.88 3.87 3.87 3.88 3.89 3.90
302 9.94 9.04 8.41 7.80 7.45 6.92 6.58 6.26 5.96 5.64 5.55 5.25 5.18 4.90 4.72 4.64 4.55 4.37 4.30 4.23 4.09 4.04 3.99 3.87 3.83 3.83 3.81 3.79 3.71 3.71 3.71 3.72
304 10.56 9.39 8.73 8.09 7.71 7.33 6.80 6.45 6.28 5.99 5.68 5.45 5.28 5.07 4.91 4.69 4.63 4.50 4.31 4.28 4.21 4.00 3.94 3.89 3.90 3.78 3.75 3.72 3.66 3.64 3.62 3.62
306 10.98 9.98 9.07 8.65 7.99 7.59 7.21 6.83 6.53 6.19 5.99 5.73 5.40 5.31 5.06 4.89 4.70 4.60 4.45 4.30 4.22 4.14 3.92 3.86 3.86 3.80 3.75 3.64 3.60 3.57 3.55 3.53
308 11.42 10.37 9.64 8.98 8.55 7.87 7.47 7.13 6.75 6.55 6.23 5.90 5.75 5.44 5.31 5.03 4.91 4.67 4.57 4.45 4.25 4.16 4.08 4.05 3.84 3.77 3.71 3.66 3.61 3.57 3.53 3.44
310 12.12 10.86 10.09 9.34 8.88 8.44 8.00 7.57 7.16 6.83 6.44 6.24 5.93 5.74 5.45 5.34 5.02 4.89 4.69 4.57 4.42 4.31 4.11 4.07 3.98 3.90 3.78 3.63 3.57 3.52 3.47 3.43
312 12.68 11.53 10.72 9.92 9.24 8.76 8.30 7.86 7.43 7.08 6.84 6.51 6.13 5.98 5.62 5.49 5.35 5.02 4.92 4.79 4.55 4.38 4.31 4.21 4.01 3.92 3.84 3.76 3.69 3.58 3.44 3.45
314 13.15 11.99 11.13 10.40 9.80 9.10 8.63 8.17 7.96 7.52 7.10 6.75 6.51 6.18 6.02 5.66 5.51 5.36 5.05 4.91 4.78 4.53 4.45 4.28 4.17 4.07 3.88 3.79 3.71 3.63 3.61 3.54
316 13.92 12.68 11.57 11.03 10.27 9.67 9.17 8.75 8.27 7.81 7.43 7.17 6.82 6.56 6.24 6.07 5.69 5.55 5.39 5.05 4.91 4.79 4.66 4.43 4.31 4.14 4.03 3.93 3.83 3.79 3.62 3.55
318 14.46 13.26 12.35 11.47 10.68 10.14 9.61 9.09 8.60 8.37 7.90 7.44 7.24 6.88 6.62 6.28 6.03 5.87 5.57 5.40 5.18 4.93 4.79 4.65 4.52 4.39 4.17 4.00 3.93 3.83 3.74 3.65
320 15.11 13.78 12.83 11.90 11.32 10.76 10.20 9.66 9.13 8.71 8.21 7.99 7.52 7.31 6.87 6.67 6.33 6.08 5.90 5.59 5.42 5.27 5.05 4.78 4.64 4.50 4.37 4.25 4.16 4.05 3.86 3.70
322 15.95 14.57 13.34 12.69 11.77 11.18 10.60 10.04 9.57 9.06 8.80 8.31 8.07 7.59 7.37 6.93 6.72 6.38 6.12 5.93 5.76 5.45 5.29 5.12 4.90 4.75 4.50 4.39 4.26 4.14 4.03 3.92
324 16.55 15.12 14.10 13.18 12.55 11.63 11.11 10.53 10.15 9.62 9.15 8.81 8.39 8.07 7.66 7.43 6.99 6.77 6.56 6.22 5.97 5.78 5.60 5.30 5.13 4.97 4.75 4.63 4.48 4.35 4.13 4.01
326 17.53 15.79 14.73 13.93 13.04 12.40 11.77 11.15 10.56 10.09 9.71 9.24 8.90 8.46 8.14 7.73 7.50 7.04 6.82 6.61 6.40 6.00 5.81 5.62 5.44 5.26 5.00 4.84 4.69 4.48 4.34 4.21
328 18.17 16.64 15.54 14.46 13.78 12.88 12.23 11.60 11.27 10.66 10.10 9.80 9.26 8.97 8.54 8.21 7.80 7.56 7.24 6.87 6.65 6.44 6.23 5.83 5.64 5.46 5.29 5.12 4.96 4.80 4.64 4.41
330 18.82 17.25 16.11 15.10 14.30 13.60 12.93 12.35 11.71 11.08 10.78 10.19 9.72 9.33 9.06 8.54 8.27 7.86 7.62 7.29 7.06 6.70 6.48 6.27 6.06 5.80 5.50 5.31 5.14 4.97 4.81 4.65
332 19.69 18.14 16.90 15.90 14.94 14.17 13.47 12.83 12.17 11.72 11.21 10.59 10.29 9.71 9.42 9.14 8.60 8.34 8.08 7.67 7.35 7.11 6.87 6.52 6.30 6.10 5.90 5.63 5.44 5.26 5.08 4.92
334 20.48 18.81 17.60 16.48 15.67 14.93 14.20 13.54 12.84 12.27 11.84 11.29 10.70 10.37 9.97 9.49 9.20 8.68 8.41 8.13 7.87 7.48 7.16 6.92 6.69 6.47 6.25 5.93 5.73 5.54 5.36 5.18
336 21.46 19.73 18.23 17.32 16.24 15.47 14.73 14.00 13.43 12.94 12.30 11.73 11.31 10.78 10.46 10.04 9.57 9.28 8.90 8.46 8.19 7.93 7.67 7.42 6.97 6.73 6.51 6.29 6.08 5.87 5.67 5.48
338 22.18 20.40 19.12 18.04 17.06 16.27 15.49 14.83 14.14 13.42 13.02 12.38 11.81 11.38 11.05 10.53 10.12 9.65 9.34 8.96 8.67 8.25 7.99 7.72 7.47 7.22 6.90 6.66 6.33 6.11 5.91 5.70
340 23.19 21.20 19.89 18.92 17.77 16.95 16.15 15.37 14.66 14.23 13.51 12.85 12.45 11.92 11.48 11.11 10.62 10.20 9.87 9.41 9.11 8.74 8.45 8.17 7.77 7.52 7.27 7.02 6.79 6.56 6.26 6.04
342 24.05 22.18 20.81 19.49 18.62 17.78 16.95 16.14 15.41 14.75 14.21 13.63 12.92 12.56 12.10 11.54 11.20 10.86 10.26 9.94 9.63 9.32 8.89 8.51 8.22 7.95 7.69 7.43 7.18 6.94 6.60 6.38
344 24.81 22.89 21.50 20.39 19.25 18.38 17.53 16.71 16.01 15.49 14.72 14.13 13.70 13.21 12.66 12.16 11.63 11.28 10.92 10.49 10.01 9.70 9.39 9.07 8.78 8.28 8.01 7.74 7.48 7.23 6.99 6.75
346 42.62 39.29 36.87 34.72 32.99 31.49 30.03 28.80 27.41 26.17 25.39 24.20 23.46 22.31 21.62 20.70 19.93 19.34 18.44 17.89 17.18 16.65 16.13 15.36 14.87 14.40 13.93 13.48 12.89 12.47 12.06 11.66
348 43.66 40.47 38.00 36.03 34.03 32.50 31.00 29.55 28.14 27.42 26.07 25.38 24.10 23.43 22.21 21.58 20.67 19.89 19.24 18.67 17.84 17.30 16.59 16.04 15.53 15.04 14.56 13.89 13.44 13.00 12.58 12.17
350 45.42 41.92 39.38 36.91 35.30 33.72 32.18 30.69 29.44 28.13 27.10 26.05 25.06 24.05 23.31 22.16 21.53 20.84 19.77 19.18 18.60 18.03 17.48 16.90 15.97 15.47 14.97 14.49 14.02 13.57 13.13 12.70
Speed on later legs (kt)
Speed on first leg (kt)
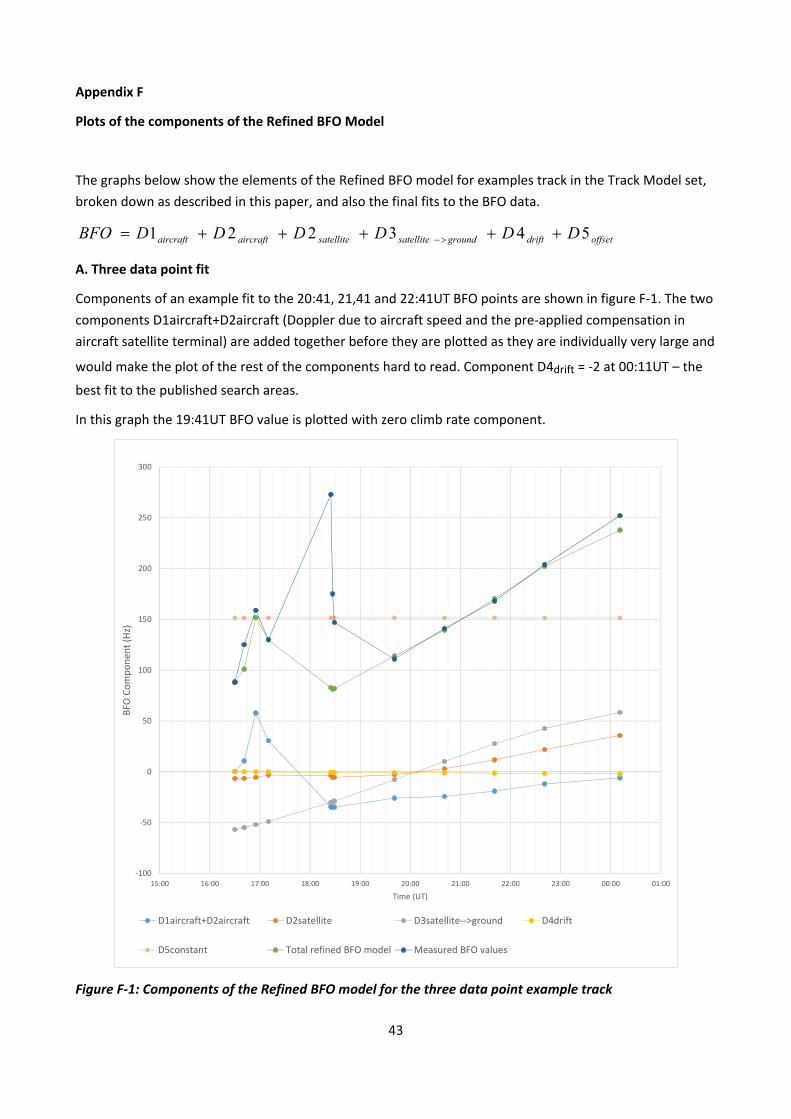
43
Appendix F
Plots of the components of the Refined BFO Model
The graphs below show the elements of the Refined BFO model for examples track in the Track Model set,
broken down as described in this paper, and also the final fits to the BFO data.
offsetdriftgroundsatellitesatelliteaircraftaircraft DDDDDDBFO 543221
A. Three data point fit
Components of an example fit to the 20:41, 21,41 and 22:41UT BFO points are shown in figure F‐1. The two
components D1aircraft+D2aircraft (Doppler due to aircraft speed and the pre‐applied compensation in
aircraft satellite terminal) are added together before they are plotted as they are individually very large and
would make the plot of the rest of the components hard to read. Component D4drift = ‐2 at 00:11UT – the
best fit to the published search areas.
In this graph the 19:41UT BFO value is plotted with zero climb rate component.
‐100
‐50
0
50
100
150
200
250
300
15:00 16:00 17:00 18:00 19:00 20:00 21:00 22:00 23:00 00:00 01:00
BFO
Component (Hz)
Time (UT)
D1aircraft+D2aircraft D2satellite D3satellite‐‐>ground D4drift
D5constant Total refined BFO model Measured BFO values
Figure F‐1: Components of the Refined BFO model for the three data point example track
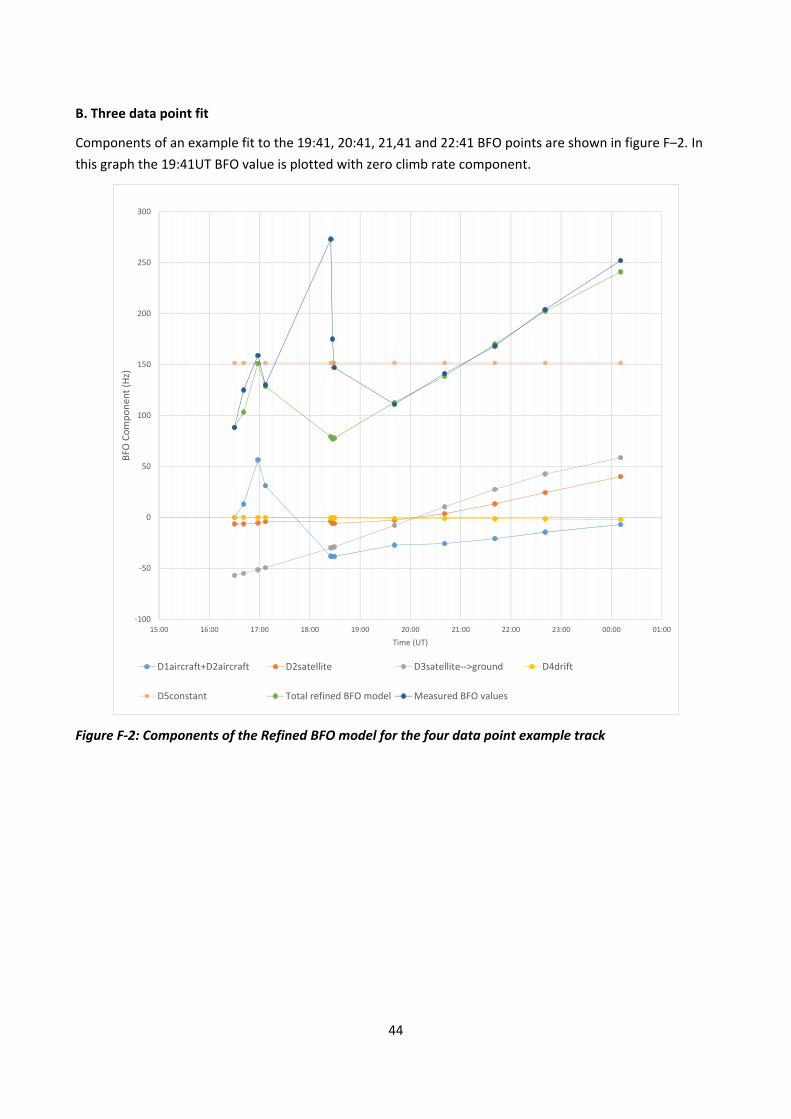
44
B. Three data point fit
Components of an example fit to the 19:41, 20:41, 21,41 and 22:41 BFO points are shown in figure F–2. In
this graph the 19:41UT BFO value is plotted with zero climb rate component.
‐100
‐50
0
50
100
150
200
250
300
15:00 16:00 17:00 18:00 19:00 20:00 21:00 22:00 23:00 00:00 01:00
BFO
Component (Hz)
Time (UT)
D1aircraft+D2aircraft D2satellite D3satellite‐‐>ground D4drift
D5constant Total refined BFO model Measured BFO values
Figure F‐2: Components of the Refined BFO model for the four data point example track
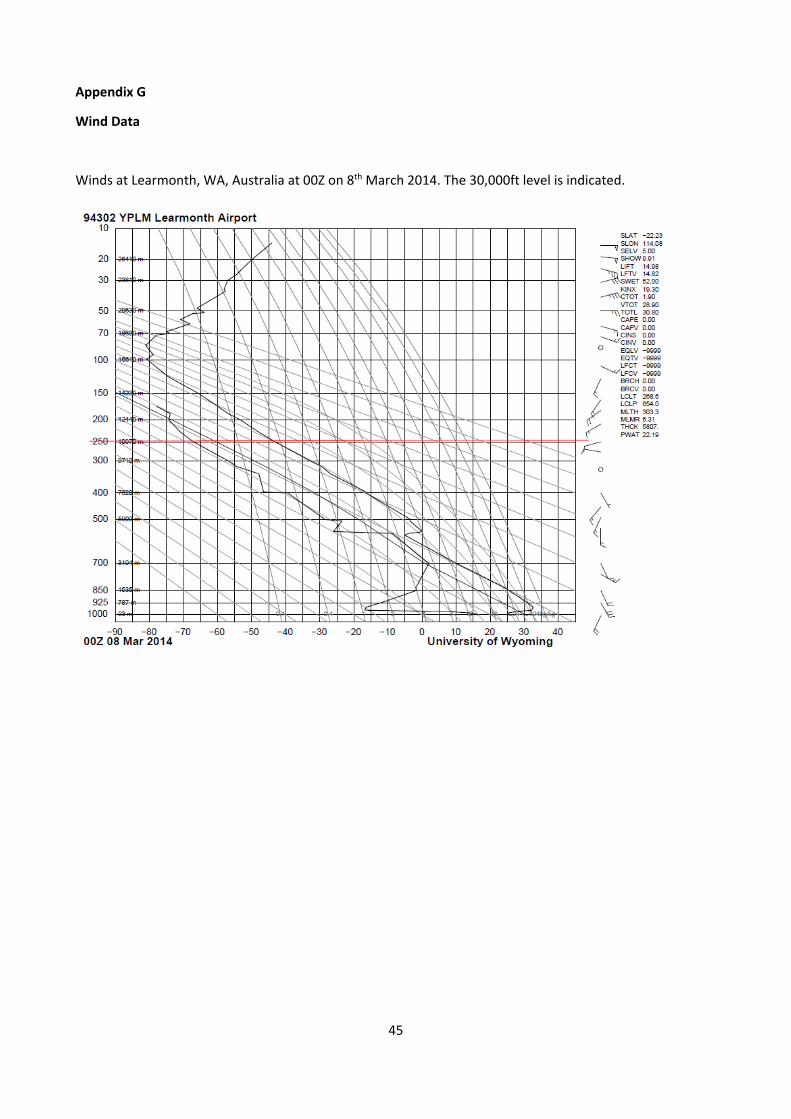
45
Appendix G
Wind Data
Winds at Learmonth, WA, Australia at 00Z on 8th March 2014. The 30,000ft level is indicated.

46
Change record
Issue Data Changes Notes
1 16/6/14 First issue