an analysis of the role of price promotions on the
TRANSCRIPT

1
An analysis of the role of price promotions on the household purchases of food and drinks high in sugar, and purchases of food and drinks for out of home consumption A research project for Public Health England conducted by Kantar Worldpanel UK
December 2020

An analysis of the role of price promotions on the household purchases of food and drinks high in sugar,
and purchases of food and drinks for out of home consumption
2
Contents
Executive summary ...................................................................................................................... 3
Abbreviations and glossary .......................................................................................................... 7
Introduction .................................................................................................................................. 8
Part 1: take home food and drink ................................................................................................. 9
Part 2: out of home food and drink ............................................................................................. 39
References ................................................................................................................................. 48
Appendices ................................................................................................................................ 49

An analysis of the role of price promotions on the household purchases of food and drinks high in sugar,
and purchases of food and drinks for out of home consumption
3
Executive summary
Public Health England commissioned Kantar Worldpanel to explore the role that price
promotions might play in stimulating changes in purchasing levels of high sugar take
home food and drinks amongst shoppers, repeating analysis undertaken in 2015. Sugar
in the context of this report is taken to be the total sugars contained within food and drink
items. Kantar Worldpanel were also asked to explore the use of price promotions in the
eating out of home sector.
Price promotions on take home food and drink
Kantar Worldpanel is a global market research company, which runs and analyses a
continuously reporting panel of 30,000 British shoppers. These panellists are asked to
record the details of all take home food and drink purchases made, including the
volumes bought and prices paid. The collected information is further enhanced by
Kantar Worldpanel through processes that flag price promotions and assign nutrition
information to all products. The nutrition information available for these products is
collected from product packaging.
The resulting dataset allows for extensive and objective analysis of shopper behaviour.
This analysis repeats work done in 2015, which also calculated the impact of promotions
on take home food and drink on shopper behaviour. The promotional landscape has
changed during this time, but the analysis shows that promotions influence shopper
behaviour and the volume of products purchased. Specific differences between the two
reports are highlighted where relevant.
Public Health England asked Kantar Worldpanel to analyse their datasets to provide
answers to the following research questions:
1. What is the scale and nature of promoting in the UK for take home food and drink
and how has this changed in recent years?
2. Who responds to promotions and how do promotions generally work?
3. How incremental are promotions to food and drink categories? Do promotions on
one category simply come at the expense of competitor foods in other
categories?
4. Are promotions on high sugar products more extensive and do shoppers react
differently to these compared to non-high sugar products?
All work was restricted to Great Britain and covered the purchasing of take-home food
and drink only. Analysis is based on 104 weeks of data ending 30 December 2018.

An analysis of the role of price promotions on the household purchases of food and drinks high in sugar,
and purchases of food and drinks for out of home consumption
4
The headline findings of the work were as follows:
• promotions in Britain have declined in the period from 2015 to 2018, as a %
of household expenditure. Promotions in 2017 and 2018 accounted for 34% of
food & drink take home expenditure. A similar analysis completed in 2015 showed
that promotions accounted for 40% of a household’s expenditure at that time. This
analysis reflects the fact that the grocery market in the UK has changed between
2015 and 2018; Aldi and Lidl, referred to as ‘discounters’, and who tend not to
promote extensively increased market share during this period, and other retailers
have adopted more Every Day Low Price Strategies. Despite this decline in the
amounts bought on promotion, Britain still has the largest amount of promotions in
major markets which are evaluated by Kantar Worldpanel
• whilst promotions make products cheaper, they also tend to encourage
people to buy more. Promotions in food and drink categories drive various short-
term behavioural changes, such as getting shoppers to choose a different brand
to normal. These promotions frequently lead people to buy more of the promoted
category than expected (based on modelling the purchasing behaviour of Kantar
Worldpanel’s panel to understand what would be bought without promotions). On
average, about 18% of promoted food and drink volumes bought is calculated as
additional to expected category purchasing levels
• promotions not only get people to buy more of a specific category, the
evidence shows that people will buy more overall. When people buy
promoted products from higher sugar categories, there is little evidence that
increased purchasing of one category leads buyers to make a significant
compensatory reduction in other higher sugar categories. This means promotions
increase the overall level of take-home food and drink being purchased
• in 2017-2018, promotions delivered a £72 saving for the average household
per year. Although a typical household would have to spend 11% more (or an
extra £372 in a year) if they wanted to buy their annual selection of promoted
items at full price, some of that selection is extra because of the promotion and so
this figure does not represent a true saving. When the extra purchasing is
accounted for, that true saving figure is £72
• price promotions are a common feature of grocery shopping and therefore
all shoppers are regularly exposed to promotions on products they want to
buy. Although differences are small, shoppers from lower socio-economic groups,
on lower incomes, and in the youngest and oldest age groups are slightly less
likely to buy into promotions
• higher sugar food and drink items are more likely to be promoted. The
depth of discount is also slightly higher on these items. Several of the higher
sugar food and drink categories represent more discretionary products and
promotions in these areas will more easily get shoppers to buy more than normal.
This means promotions in some higher sugar categories can more readily drive

An analysis of the role of price promotions on the household purchases of food and drinks high in sugar,
and purchases of food and drinks for out of home consumption
5
up take-home food and drink volume. This also explains why the high sugar
categories account for a bigger proportion of the extra sugar purchased
• promotions are more common on products where sugar is added
(particularly discretionary products such as carbonated drinks, biscuits and
cakes), than on table sugar and products where sugar is naturally present such
as milk and fruit and vegetables, with the exception of fruit juice
• it is calculated that 5.5% of all take home sugar is an incremental
consequence of promotions with 4.0% coming from the higher sugar
categories. In other words, a 4.0% saving in sugar volumes might be achieved if
the level of promotions in higher sugar categories was reduced to zero
Price promotions on out of home food and drink
Public Health England also commissioned Kantar Worldpanel to explore the use of price
promotions in the eating out of home sector. Kantar Worldpanel have an additional panel
which records consumers’ out of home food and non-alcoholic drink purchases
(including takeaways which are brought back into the home), behaviour which the main
panel does not capture. This panel is a subset of the main panel and is made up of 7500
individuals. The panel has been collecting data since June 2015; the analysis in this
report focuses on year on year trends for the 52 week ending periods 30 December
2018 and 31 December 2017.
Public Health England asked Kantar Worldpanel to analyse their datasets to provide
answers to the following research questions:
1. What is the scale of promotions in the out of home sector?
2. Who responds to promotions out of home?
3. Which food and drink categories do consumers buy on promotion out of home?
4. What are the promotional dynamics for grocery supermarkets in the out of home
sector?
The headline findings of the work were as follows:
• promotions are growing in the out of home sector. In 2018, 6.7% of out of
home trips featured a promotion (52 weeks ending 30 December 2018) compared
to 6.1% of trips the previous year (52 weeks ending 31 December 2017)
• over two thirds (69%) of consumers bought food or drink out of home on
promotion in 2018. There are differences in which demographics are engaged
with promotions, and these also vary by the type of outlet, food and drink items
bought, and who else is present
• there are differences in the channels where promotions are offered and
utilised by consumers. Supermarkets have the highest proportion of trips on
promotions - their meal deal offering will account for a high proportion of these
trips

An analysis of the role of price promotions on the household purchases of food and drinks high in sugar,
and purchases of food and drinks for out of home consumption
6
• in supermarkets, more affluent and working aged consumers are more
engaged with promotions and more likely to buy quick meals, suggesting
they are purchasing meal deals. Socio-economic group E consumers’ trips also
include a higher proportion of trips featuring a promotion; they are more likely to
buy sweet snacks on promotion
• full service restaurants, especially chain restaurants, are seeing a higher
proportion of trips featuring a promotion. Consumers in socio-economic
groups C2, D and E are more likely than other groups to use promotions when
they are in full service restaurants
An analysis of the role of price promotions on the household purchases of food and drinks high in sugar,
and purchases of food and drinks for out of home consumption
7
Abbreviations and glossary
Category – a group of food and drink products that have common features and are
grouped together to form a food and drink market
Discount – the reduction from full price offered by a promotion usually expressed as a
percentage
Every Day Low Price - a pricing strategy adopted by retailers in which goods are priced
continuously at a lower price point, rather than frequent price promotions from a higher
base price
FMCG – fast moving consumer goods
Higher sugar category – a selected list of food and drink categories containing >8%
average sugar by volume. Some categories with >8% average sugar such as ingredient
(home baking) sugar and some fruit are excluded. See the appendices for a full list of
included categories.
Multibuy – a promotion requiring the purchase of more than one pack eg “2 for £2” or
“Buy One Get One Free”
Out of home – analysis of promotions based on purchases on the Kantar ‘Out of home’
panel. This includes all purchases of food and drink to be consumed out of the home, as
well as takeaways which are brought back into the home
PHE – Public Health England
PL – private label (also known as retailer own brand)
Socio-economic group - the groups considered are (A) higher managerial,
administrative and professional workers; (B) intermediate managerial, administrative and
professional workers; (C1) supervisory, clerical and junior managerial, administrative
and professional workers; (C2) skilled manual workers; (D) semi-skilled and unskilled
manual workers; (E) people on long term state benefits, casual and lowest grade
workers, unemployed with state benefits only.
Sugar – in this report, this refers to the total sugars contained in food or drink items.
Packets of sugar (ie the product used for sweetening hot drinks or as a home baking
ingredient) are referred to as table sugar.
Take Home - analysis of promotions based on purchases on the Kantar ‘Take Home’
panel. This includes all scanned purchases which are brought into the home. It does not
include food or drink which is consumed out of home.
TPR – temporary price reduction (eg a product with a full price of £1.50 being promoted
at £1)
Uplift – the increase in purchasing a promotion generates above full price sales levels.

An analysis of the role of price promotions on the household purchases of food and drinks high in sugar,
and purchases of food and drinks for out of home consumption
8
Introduction
Reducing childhood obesity is a government priority. The Childhood Obesity Plan (1,2)
and the prevention green paper (3) set out an ambitious programme of work, including
continued action on the food environment to make the healthier choice the easier
choice.
Proposed actions include restricting the promotions of foods high in fat, sugar, and salt
(HFSS) by location and by price in the retail and out of home sectors. This report
focusses on the role of price promotions on household purchasing of take home food
and drink (Part 1), with some additional analysis on the role of price promotions on
purchasing of food and drink to be consumed out of home (Part 2).

An analysis of the role of price promotions on the household purchases of food and drinks high in sugar,
and purchases of food and drinks for out of home consumption
9
Part 1: take home food and drink
Price promotions are a significant feature of the British grocery landscape and are
employed to encourage shoppers to make certain buying choices. In understanding the
role of promotions, the analysis required evidence to better understand how these
influence shoppers, and specifically whether such events can lead to increased
purchasing of high sugar foods and drinks. These questions have been addressed by
the analysis of large datasets of shopper transactions.
To this end, Kantar Worldpanel were commissioned to undertake analysis of their
proprietary data to bring a better understanding of the role that price promotions play in
the purchasing of food and drink and, therefore, in the purchasing of sugar as an integral
component.
Kantar Worldpanel is an international company dealing in consumer knowledge and
insights based on consumer panel research. In the UK, Kantar Worldpanel runs and
analyses purchasing data collected by a continuously reporting panel of 30,000
demographically representative British households. These panellists are asked to record
the details of all take home food and drink purchases made, including the volumes
bought and prices paid. The collected information is further enhanced by Kantar
Worldpanel through processes that flag price promotions and assign nutritional values to
all products.
The resulting dataset allows for extensive and objective analysis of shopper behaviour.
Specifically, for this project, the dataset provided a means of understanding the extent to
which established shopping behaviour can be affected by promotional participation.
Four study areas were addressed:
1. What is the scale and nature of promoting in the UK and how has this changed in
recent years?
2. Who responds to promotions and how do promotions generally work?
3. How incremental are promotions to food and drink categories? Do promotions on
one category simply come at the expense of competitor foods in other
categories?
4. Are promotions on high sugar products more extensive and do shoppers react
differently to these compared to non-high sugar products?
All work was restricted to Great Britain and covered purchasing of take-home food and
drink groceries only, ie excluding food and drink purchased and consumed out of the
home. The data period was 104 weeks of data up to 30 December 2018.
This analysis repeats similar work undertaken in 2015 (4).

An analysis of the role of price promotions on the household purchases of food and drinks high in sugar,
and purchases of food and drinks for out of home consumption
10
An introduction to price promotions
The work detailed in this report is intended to analyse how shoppers react to promotions
and specifically how these reactions might change when people are faced with
promotions on items with high sugar content. To do this, the first element of the
analytical work was to identify and classify a large dataset of promotional events which
could then be examined in more detail.
Promotions in the context of this study basically mean special offers available in
supermarkets which are specifically characterised by there being a discount on the usual
selling price. These promotions are typically planned and agreed through negotiations
between individual supermarket chains and the manufacturers of the products involved.
Typically, a promotional event will be restricted to one brand and often to a pack format
or sub-brand (ie cola “brand X” 6 pack cans). It is also common to see - within the same
supermarket chain - similar promotions being run at the same time on different brands or
even for different brands owned by the same or different manufacturers to be bundled
up and promoted together.
For the purposes of this study, promotional “events” were identified at a level that was
based on combinations of sub-brand (ie diet cola “brand X”) and pack size (ie 6 x
330ml). Hence a deal offering a 50p reduction on any 6x330ml packs diet and regular
cola would be itemised as two events.
There are three major forms (or “mechanics”) of promotion that are commonly seen in
British supermarkets and these are referred to at various points in the study. Each of
these types of promotion was captured by the study dataset.
Temporary price reductions (TPR): these are short term reductions in the price of food
and drink products. Most retailers will run such offers on specific items for a typical
duration of 2-5 weeks before reverting to the full price.
Multibuy: these types of promotion require the shopper to buy one or more items to
benefit from the discounted price. These include well known mechanics such as “buy
one get one free” as well as types that state a fixed price or saving (ie “3 for £10” or “Buy
6 and save 25%”). Whilst many multibuy mechanics are short term, lasting only 2-4
weeks, there are also notable instances where promotions are longer term. Many chilled
or fresh food items for example, such as fruit juice, yoghurt drinks, ready meals and
meat, have seen ongoing multibuy offers which can continue for many months (eg an
ongoing multibuy on stickered meat items which allows shoppers to buy 3 for £10).
These types of promotion tend to become an established feature in certain categories
for extended periods of time.

An analysis of the role of price promotions on the household purchases of food and drinks high in sugar,
and purchases of food and drinks for out of home consumption
11
Extra free: These promotions occur when an enlarged pack size is created by the
manufacturer and where the pack label states that a proportion of the product is free.
For example, an extra-large packet stating 50% extra free. These types of promotions
are far less common than TPR and multibuy (they account for less than 1% of total
grocery spend), and therefore are not separated out as individual promotional
mechanics in this study.
Other forms of in store promotions do exist, for example deals that offer extra loyalty
card points or free gifts and coupons in the pack. These tend to either be infrequent or
difficult to measure accurately through a consumer panel approach and so are not
included in the consideration of this study. The analysis excludes ‘end of day’ discounts
for products which are due to go out of date.

An analysis of the role of price promotions on the household purchases of food and drinks high in sugar,
and purchases of food and drinks for out of home consumption
12
Methodology
Data for the study is entirely derived from Kantar Worldpanel’s representative sample of
30,000 British households. Purchases recorded by the panel are classified into category
(ie market) definitions and price promotions are identified through various
methodologies. Total sugar content (along with other nutrition information) is collected
by examining product packaging. The underlying data collection methodologies are
provided in the appendices at the end of this report; Appendix 1 describes the purchase
data collection method and Appendix 2 describes the process by which nutrition
attributes are assigned to grocery products. Appendix 3 details the list of take home food
and drink categories analysed in the study.
Following the production of the underlying data, a variety of analytical techniques can be
used to interrogate the data. Two of the main approaches used in this study are outlined
below.
Source of volume analysis
A key methodological component underpinning this report is the use of Kantar
Worldpanel’s “source of volume” methodology. This technique breaks down the volume
that forms a promotional uplift (the increase in sales generated), into a series of
classifications. The classifications seek to explain and quantify how the promotion
generated volume and consider various scenarios that could be responsible. This
approach has a key application for this analysis because it reveals the degree to which
promotions drive greater food and drink category volumes versus the extent to which
volumes are shifted between competing products within a food and drink category.
A source of volume dataset was produced that covered a period of 2 years to 30
December 2018, from which 64,000 food and drink promotions were identified and
analysed. The source of volume technique was used to break down each individual
promotional event, but these results were averaged to enable broad comparisons to be
made between categories and between various types of promotion. The 64,000
promotions did not include every promotion but represented those that could be robustly
analysed over the two-year period. Promotions were excluded if the exact type of
mechanic could not be determined. To help ensure robust sample sizes, the promotions
were restricted to those running in the four main food and drink retailers - Tesco, Asda,
Sainsbury’s and Morrisons. A limitation of the analysis is that people switching to
Aldi/Lidl where prices are generally cheaper will not be captured. The top 4 retailers still
account for over 60% of total food and drink bought in the UK, and for more than 70% of
the sales made on promotion. Nearly all shoppers (99%) buy at least one promotion
from one or more of the big 4 each year. Though the discounters consistently offer low
price items, these are not technically promotions and therefore are not part of our
analysis of promotion.

An analysis of the role of price promotions on the household purchases of food and drinks high in sugar,
and purchases of food and drinks for out of home consumption
13
To produce the source of volume analysis, the transaction history of individual
households was monitored over two years to observe how shoppers reacted to the
promotions they participated in. The model uses actual transaction data and is based
around who households are, what they buy, in what quantities and when. Figure 1 and
figure 2 show how the consumer panel data is used to create a data set which we can
profile to understand how promotions drive additional volume.
Firstly, levels of food and drink category participation over time were examined to see
how the presence of promotions changed the trend. A regression model was employed
to calculate the impact that removing a promotion would have on the total number of
category shopping trips being made. This indicated the degree to which promotions in a
category might drive extra trips as a form of increased purchasing volume. Then for
each household, the interval between purchases was measured to see how this rate
changed when a product was bought on promotion. This provided a perspective on
whether deals increased purchase rates from category trips that were expected to occur.
The intention was to understand the net impact of instances when households bought
more than usual amounts prompted by the promotion.
Figure 1: How the data is constructed

An analysis of the role of price promotions on the household purchases of food and drinks high in sugar,
and purchases of food and drinks for out of home consumption
14
Figure 2: Household purchasing data to feed into a promotions model
Figure 2 shows four examples. In the first two there is additional volume purchased due
to a promotion – the model must then calculate how to attribute this volume. In the third
example there is additional volume but a longer return time, meaning that only some of
that volume (a small proportion because the return time is almost the average) will be
calculated as extra. In the fourth example volume is subsidized as the cheaper price
does not mean additional volume.
Our analysis calculates all combinations for our 30,000-household panel. By observing
the history of store and brand purchase choices that each panellist had made over time,
the expected levels of buying for different products and retailers were set for each
household. From this, remaining non-incremental volumes could be assigned to the
appropriate mix of products sold in the category. This process allowed shopper
behaviours to be quantified that are referred to as displaced, cannibalised, stolen and
subsidised (Figure 3). Each of these describes different types of switching between
products sold in the same food and drink category. The full explanation and
interpretation of these is provided in the results and discussion section of this document.
Volume profiles (Figure 4) were converted to expenditure profiles by applying the
relevant mix of prices paid for the promoted products and competitor products and by
comparing observed spend levels to levels that would have been expected if the
promotion hadn’t occurred. The contributions from individual promotions were then
aggregated into overall category profiles – eg sugar sweetened soft drinks.

An analysis of the role of price promotions on the household purchases of food and drinks high in sugar,
and purchases of food and drinks for out of home consumption
15
Figure 3: From household data to source of volume output
Figure 4: Average of source of volume for a promotion
Cross-category correlation analysis
The other key analytical method used in this study was a correlational analysis to work
out if an increase in purchasing in one category led to a reduction in the purchasing of

An analysis of the role of price promotions on the household purchases of food and drinks high in sugar,
and purchases of food and drinks for out of home consumption
16
another, suggesting a substitution effect. To achieve this, the following method was
used:
• for each household within each category, a two-year purchase history was isolated
• a sequence of 24 rolling (ie overlapping),12-week volumes purchased were recorded
across the 2-year time frame and were expressed as an index against the average
12-week purchase volume to give a volume index, the average being calculated for
that household in that category
• to account for market seasonality, every household’s volume index was compared to
overall levels of category buying amongst the whole population. A new, corrected
volume index was created to reveal whether each household was buying quantities
which were greater than normal irrespective of wider seasonal explanations such as
Christmas. A further adjustment was then made to account for each household’s level
of total purchasing. This was to prevent situations where unusually low purchasing of
a food type could just be explained by a panellist being on holiday and so be buying
very little of anything at that time. This adjustment was achieved by weighting each
12-week index by the number of unique products the household purchased in that
period
• the outcome was that every household had a series of final indices calculated for
each category they bought for each of the rolling periods (these indices are referred to
in the next paragraphs as ‘household x period’ indices)
• for each category in turn, the final ‘household x period’ indices were grouped into
integer percentage bands. For example, all indices in chilled juice that represented a
1% increase beyond normal purchasing levels (ie 101) were grouped together and all
indices representing a 2% increase (102) were grouped and so forth. In turn these
bands were employed to determine the average final index for all other categories.
So, for ‘household x period’ indices in the 101 chilled juice group, the average index
scores for corresponding ‘household x period’ data points in ambient juice were
compared
• to remove extreme behaviour, only indices in the 50-200 range were included. This
was verified to ensure that most of the data was captured in this range
• finally, Pearson’s correlation coefficient was calculated for each combination of
categories to understand the relationship, and scatter plots were generated to verify
that a straight-line fit was appropriate to describe these relationships. Any relationship
with an absolute Pearson’s correlation value of above 0.6 was reported as being
significant enough to investigate further.

An analysis of the role of price promotions on the household purchases of food and drinks high in sugar,
and purchases of food and drinks for out of home consumption
17
Results and discussion
This section will consider in turn each of the four major research areas framed by the
questions from PHE.
1. What is the scale and nature of promoting in the UK and how has this changed in recent years?
Levels of price promotions on take home food and drink have declined since 2015. In
2015 the annual proportion of food and drink products bought on promotion was 40%
over the year, compared with 33% for the year ending December 2018 (as shown in
figure 5). In 2018 spend on price promotion (TPR) contributed 24% to overall spend, and
spoend on multibuys contributed 9% to spend. Over the two years of this analysis (2017-
2018) the proportion bought on promotion was 34%. The decline has largely been driven
by shoppers’ move to discounters (Aldi and Lidl), and other retailers adopting more
Every Day Low Price Strategies. The discounters grew in market share from 8% to 12%
between 2015 and 2018, and as they tend not to promote extensively, the move to
discounters means the proportion of products bought on promotion has reduced.
Figure 5: Levels of promotional spend in the UK 2015 to 2018
Though the percentage bought on promotion has decreased in the UK since 2015, it
was still higher in 2018 than in other major economies where comparable data is
available. Promotional levels for groceries in countries such as Germany, France and
Spain are in the order of 20% of shopper expenditure. Czechia and Italy are the markets
which have similar levels of promotion to the UK (data sourced from Europanel & IRI).
For the purpose of like-for-like comparison, countries where Kantar Worldpanel data
An analysis of the role of price promotions on the household purchases of food and drinks high in sugar,
and purchases of food and drinks for out of home consumption
18
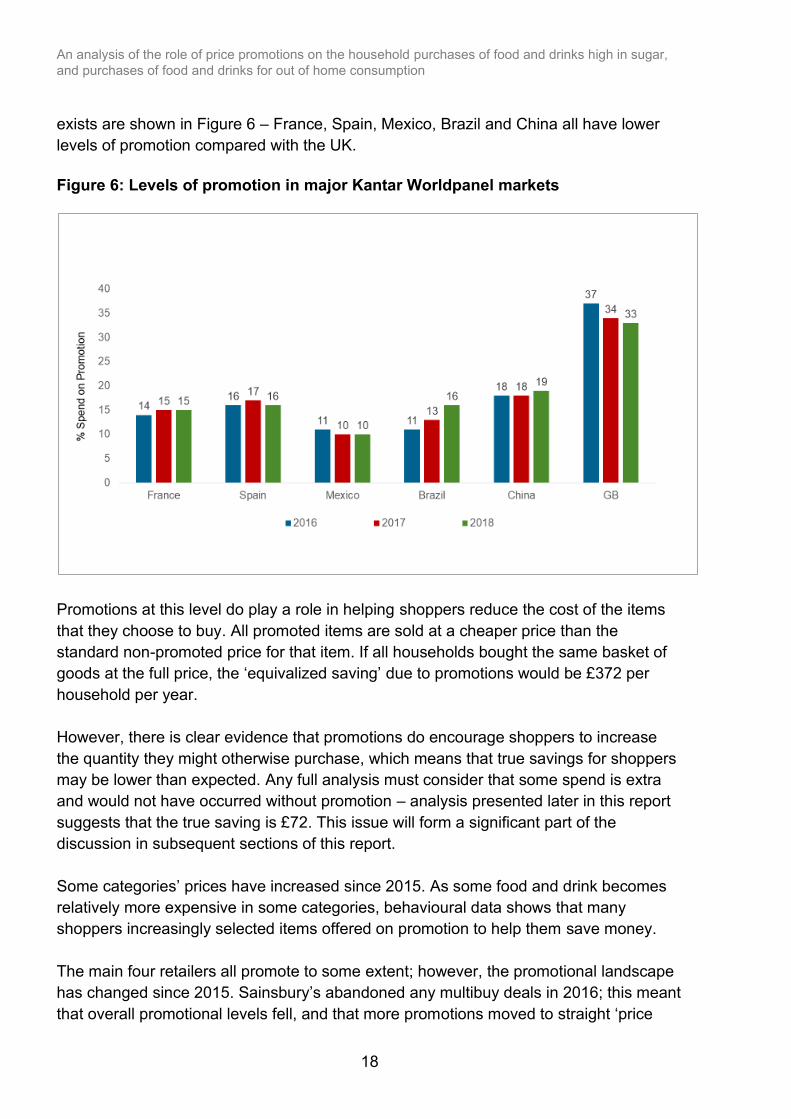
exists are shown in Figure 6 – France, Spain, Mexico, Brazil and China all have lower
levels of promotion compared with the UK.
Figure 6: Levels of promotion in major Kantar Worldpanel markets
Promotions at this level do play a role in helping shoppers reduce the cost of the items
that they choose to buy. All promoted items are sold at a cheaper price than the
standard non-promoted price for that item. If all households bought the same basket of
goods at the full price, the ‘equivalized saving’ due to promotions would be £372 per
household per year.
However, there is clear evidence that promotions do encourage shoppers to increase
the quantity they might otherwise purchase, which means that true savings for shoppers
may be lower than expected. Any full analysis must consider that some spend is extra
and would not have occurred without promotion – analysis presented later in this report
suggests that the true saving is £72. This issue will form a significant part of the
discussion in subsequent sections of this report.
Some categories’ prices have increased since 2015. As some food and drink becomes
relatively more expensive in some categories, behavioural data shows that many
shoppers increasingly selected items offered on promotion to help them save money.
The main four retailers all promote to some extent; however, the promotional landscape
has changed since 2015. Sainsbury’s abandoned any multibuy deals in 2016; this meant
that overall promotional levels fell, and that more promotions moved to straight ‘price
An analysis of the role of price promotions on the household purchases of food and drinks high in sugar,
and purchases of food and drinks for out of home consumption
19
cut’. Levels of multibuy declined in other retailers too in this period, though it is still a
mechanic used by Asda, Tesco and Morrisons. The discounters (Aldi and Lidl) tend not
to promote extensively.
Multibuys now account for less than 10% of shoppers’ overall grocery market spend.
Price cuts have been increasingly favoured by retailers as they are seen to help reduce
overall basket spend and hence increase the perception of price competitiveness. Such
deals are also more accessible to all shoppers as there tends to be a lower price and
quantity threshold to participation compared with multibuys (ie if shoppers choose to buy
one item, they can still take advantage of an offer). This in turn increases the potential
reach of these events, maximising the numbers of people that a retailer can reward to
attempt to help maintain their continued loyalty. In 2018 price cuts accounted for 24% of
annual food and drink spend and multibuys for 8%, compared with 25% for price cuts
and 14% for multibuys in 2015.
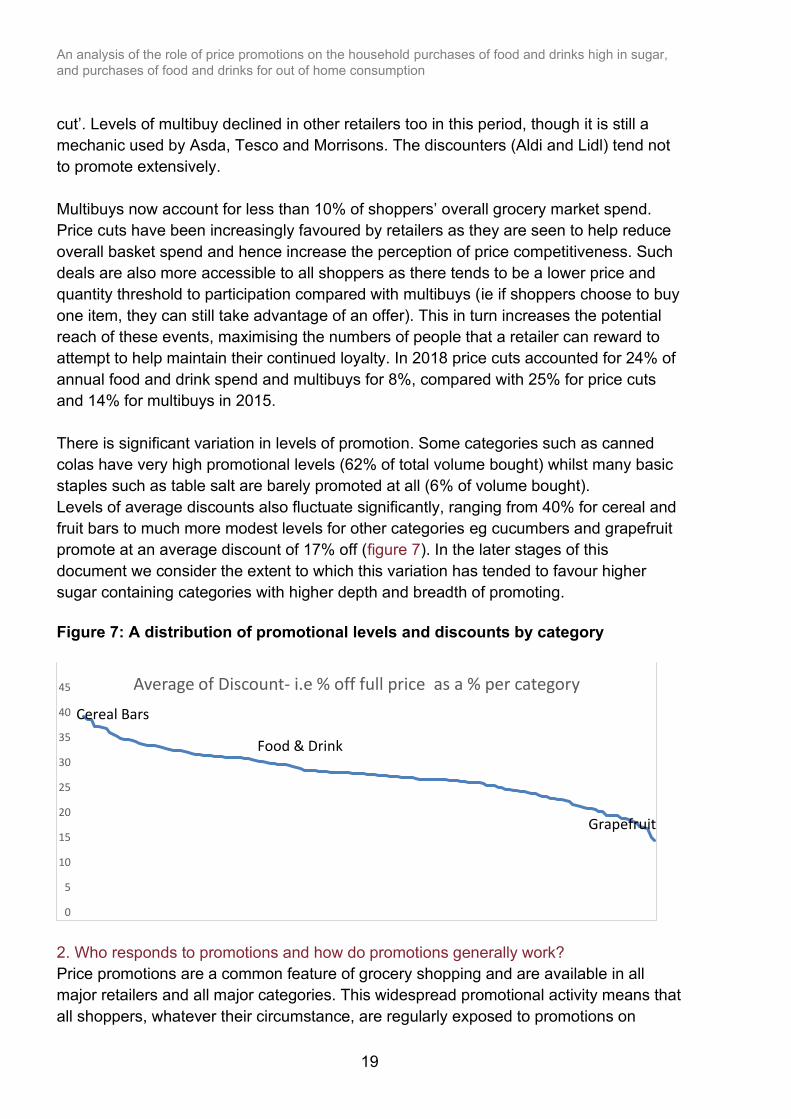
There is significant variation in levels of promotion. Some categories such as canned
colas have very high promotional levels (62% of total volume bought) whilst many basic
staples such as table salt are barely promoted at all (6% of volume bought).
Levels of average discounts also fluctuate significantly, ranging from 40% for cereal and
fruit bars to much more modest levels for other categories eg cucumbers and grapefruit
promote at an average discount of 17% off (figure 7). In the later stages of this
document we consider the extent to which this variation has tended to favour higher
sugar containing categories with higher depth and breadth of promoting.
Figure 7: A distribution of promotional levels and discounts by category
2. Who responds to promotions and how do promotions generally work?
Price promotions are a common feature of grocery shopping and are available in all
major retailers and all major categories. This widespread promotional activity means that
all shoppers, whatever their circumstance, are regularly exposed to promotions on
0
5
10
15
20
25
30
35
40
45 Average of Discount- i.e % off full price as a % per category
Cereal Bars
Food & Drink
Grapefruit

An analysis of the role of price promotions on the household purchases of food and drinks high in sugar,
and purchases of food and drinks for out of home consumption
20
products they want to buy. Consequently, the affluence and life-stage bias of shoppers
participating in food and drink promotions is very slight. In other words, everyone takes
advantage of price promotions, not just low-income consumers.
Kantar Worldpanel has analysed the demographic profile of promotional buyers to
understand how lifestage, socio-economic group, income and age affect whether
shoppers were more likely to buy into promotions. A demographic index was created
where an index of 104 means that spend on promotions is 4% higher than expected,
taking account of the categories being purchased.
Socio-economic group and lifestage
Figure 8 shows that shoppers in higher socio-economic groups (ABC1) are more likely
to buy into promotions than those in lower socio-economic groups (C2DE) at all
lifestages, but the differences are small.
Figure 8: Demographic socio-economic group and lifestage biases towards promotional purchasing for total food & drink
This interlaced demographic analysis was compared with previous work in 2015 which
had shown a stronger relationship with families buying into promotions (Figure 9). It is
noteworthy that there have been several changes in the UK grocery market over this
period, including an increased market share for the discounter stores (Aldi and Lidl),
especially among families.

An analysis of the role of price promotions on the household purchases of food and drinks high in sugar,
and purchases of food and drinks for out of home consumption
21
Figure 9: Demographic promotional buying index
Income
Less affluent shoppers are less likely to buy on promotion (Figure 10). Those in the
£30,001 to £60,000 income ranges are the highest promotional buyers.
Figure 10: Promotional buyers by income, for all promotions and for multibuys only
An analysis of the role of price promotions on the household purchases of food and drinks high in sugar,
and purchases of food and drinks for out of home consumption
22
Age
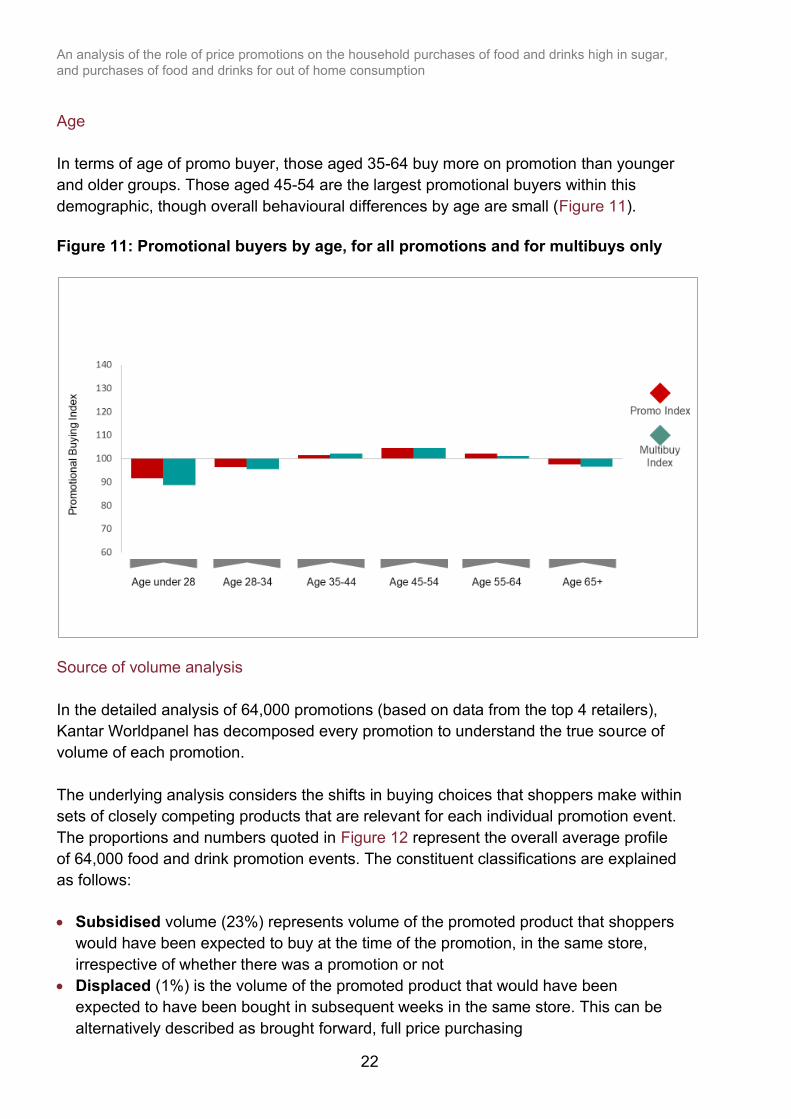
In terms of age of promo buyer, those aged 35-64 buy more on promotion than younger
and older groups. Those aged 45-54 are the largest promotional buyers within this
demographic, though overall behavioural differences by age are small (Figure 11).
Figure 11: Promotional buyers by age, for all promotions and for multibuys only
Source of volume analysis
In the detailed analysis of 64,000 promotions (based on data from the top 4 retailers),
Kantar Worldpanel has decomposed every promotion to understand the true source of
volume of each promotion.
The underlying analysis considers the shifts in buying choices that shoppers make within
sets of closely competing products that are relevant for each individual promotion event.
The proportions and numbers quoted in Figure 12 represent the overall average profile
of 64,000 food and drink promotion events. The constituent classifications are explained
as follows:
• Subsidised volume (23%) represents volume of the promoted product that shoppers
would have been expected to buy at the time of the promotion, in the same store,
irrespective of whether there was a promotion or not
• Displaced (1%) is the volume of the promoted product that would have been
expected to have been bought in subsequent weeks in the same store. This can be
alternatively described as brought forward, full price purchasing

An analysis of the role of price promotions on the household purchases of food and drinks high in sugar,
and purchases of food and drinks for out of home consumption
23
• Cannibalised volume (29%) is that which would have come from sister products
within the promoting manufacturers’ portfolio eg swapping between different flavours
within the same brand
• Stolen (29%) represents volume that is taken from competitor products eg cola brand
x stealing volume from cola brand y
• Extra trips (3% of volume) are those unexpected purchases that appear to have
been motivated by the promotion alone
• Expansion (15%) represents growth from faster than expected return times to the
category after a shopper participates in a promotion. This expansion effect is caused
by shoppers purchasing above average quantities of the category which is then not
fully offset by delayed repurchase. For example, consider a shopper who normally
buys one pack of a certain product every week with seven days between each
purchase. One week they see a buy one gets one free deal which causes them to
take two packs (double their normal quantity). We might expect that shopper to take
twice as long as usual and to return to the category two weeks later to buy again.
Instead shoppers often return to the category more quickly than expected (say after
twelve days). This means they have delayed their return time slightly, but not by quite
enough to account for all the extra volume purchased. As discussed later in this
report, some types of product categories seem to have inherently higher potential for
expansion, and these will be referred to as more expandable categories
“Expansion” and “extra trips” represent real growth in the overall category volume as a
direct result of the promotion.
Figure 12: The volume decomposition of deals

An analysis of the role of price promotions on the household purchases of food and drinks high in sugar,
and purchases of food and drinks for out of home consumption
24
The resulting volume breakdown shows that a majority of the volume under the sales
spike is a result of shoppers shifting purchasing from competing products whether
owned by the promoting manufacturer or otherwise. More than half (58%) of the volume
is accounted for by these switches in product selection. A further 24% of volume is
accounted for by subsidised or brought forward (ie ‘displaced’) purchasing of the
promoting product.
In the context of understanding the role that promotions might play in encouraging
consumers to purchase more food and drink (and potentially sugar), the key result is that
we typically see 18% of the average promotional volume being net growth (‘extra trips”
and ‘expansion’) in the purchase volumes of the parent category. By this we mean
volume that would not have been purchased if not for the promotion- and this takes into
account the fact that some shoppers might delay their repurchase of the category to use
up extra volume bought on a promotion. The volume growing effect occurs through a
combination of expansion and extra trips and reveals that promotions add to the overall
category volumes being purchased. As new promotions are continuously replacing old
ones, these volume building impacts will be occurring over time in nearly all categories.
These impacts don’t lead to endless accelerated performance for categories but instead
are more likely to be producing an additional layer of category volume that is continually
being generated and renewed as promotions come and go from one brand to the next.
In 2015, this net growth was estimated to be 22%.
It is important to point out that the “source of volume” technique is unable to directly
establish if this incremental volume is actually being consumed but in the case of food
and drink we assume that a significant proportion of this will be. Increased amounts of
product kept in stock in the home and higher food wastage (especially on short shelf life
items) are also further explanations to consider.
3. How incremental are promotions to food and drink categories? Do promotions on one category simply come at the expense of competitor foods in other categories?
Following the finding that on average just under a fifth (18%) of promoted volume bought
by shoppers is incremental to a food and drink category, the next stage of the work was
to test whether this increment inflates food or drink volumes at an overall level. It might
be expected that following increased purchasing in one food and drink category that
shoppers would reduce their purchasing in competitive categories to compensate.
To test this, two years’ worth of household level purchasing data was examined
amongst continuously reporting panellists (2 years to 30th December 2018). The
volumes bought by each household across blocks of 12 weeks were isolated for each
food and drink category. Each block was then compared to the average for that
household in that category to establish whether purchasing was high or low. Then the
purchasing levels in competing categories were examined for matching time periods to
establish whether above average purchasing in one category correlated with adjusted
An analysis of the role of price promotions on the household purchases of food and drinks high in sugar,
and purchases of food and drinks for out of home consumption
25
purchasing in another. The data was represented as a scatter plot of deviation from
average purchase volumes.
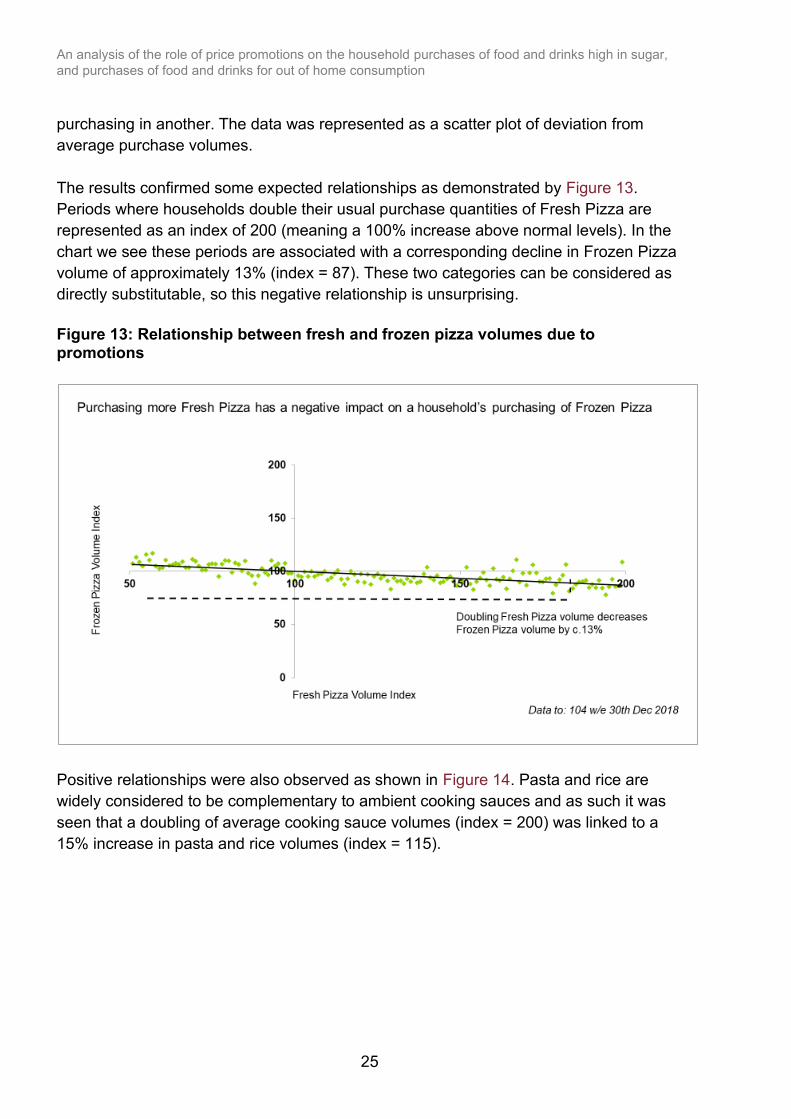
The results confirmed some expected relationships as demonstrated by Figure 13.
Periods where households double their usual purchase quantities of Fresh Pizza are
represented as an index of 200 (meaning a 100% increase above normal levels). In the
chart we see these periods are associated with a corresponding decline in Frozen Pizza
volume of approximately 13% (index = 87). These two categories can be considered as
directly substitutable, so this negative relationship is unsurprising.
Figure 13: Relationship between fresh and frozen pizza volumes due to promotions
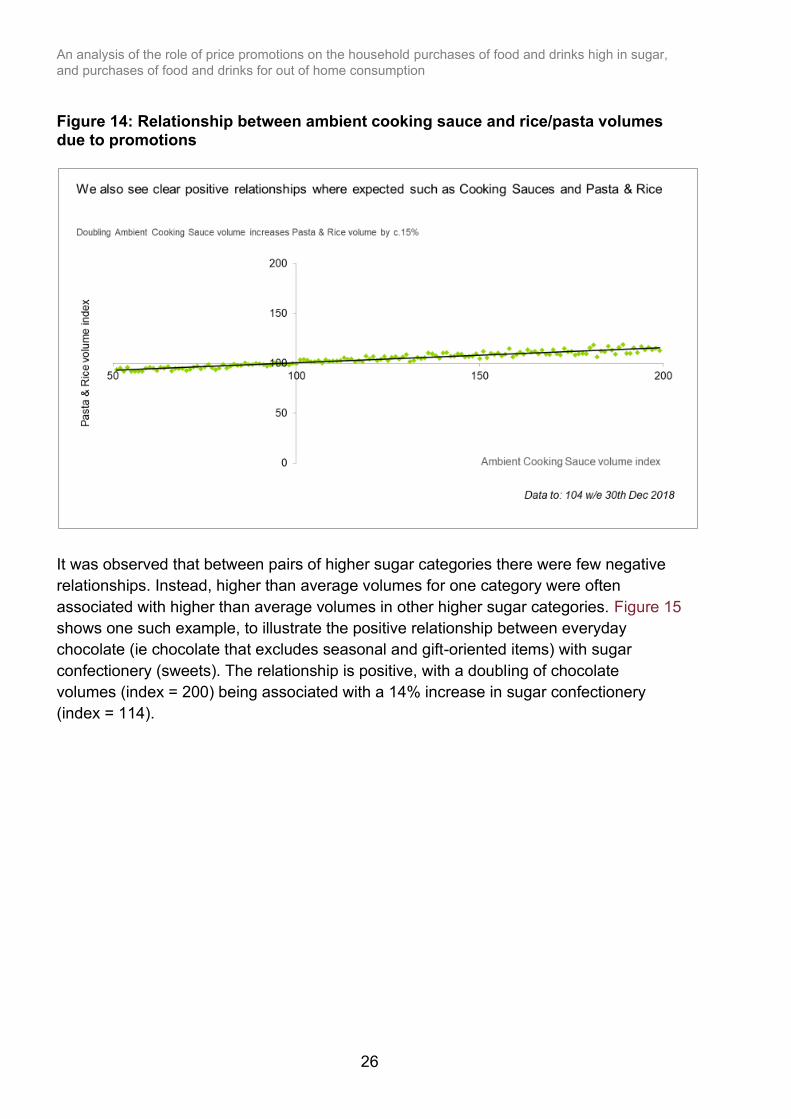
Positive relationships were also observed as shown in Figure 14. Pasta and rice are
widely considered to be complementary to ambient cooking sauces and as such it was
seen that a doubling of average cooking sauce volumes (index = 200) was linked to a
15% increase in pasta and rice volumes (index = 115).
An analysis of the role of price promotions on the household purchases of food and drinks high in sugar,
and purchases of food and drinks for out of home consumption
26
Figure 14: Relationship between ambient cooking sauce and rice/pasta volumes due to promotions
It was observed that between pairs of higher sugar categories there were few negative
relationships. Instead, higher than average volumes for one category were often
associated with higher than average volumes in other higher sugar categories. Figure 15
shows one such example, to illustrate the positive relationship between everyday
chocolate (ie chocolate that excludes seasonal and gift-oriented items) with sugar
confectionery (sweets). The relationship is positive, with a doubling of chocolate
volumes (index = 200) being associated with a 14% increase in sugar confectionery
(index = 114).

An analysis of the role of price promotions on the household purchases of food and drinks high in sugar,
and purchases of food and drinks for out of home consumption
27
Figure 15: Relationship between everyday chocolate and sugar confectionery volumes due to promotions
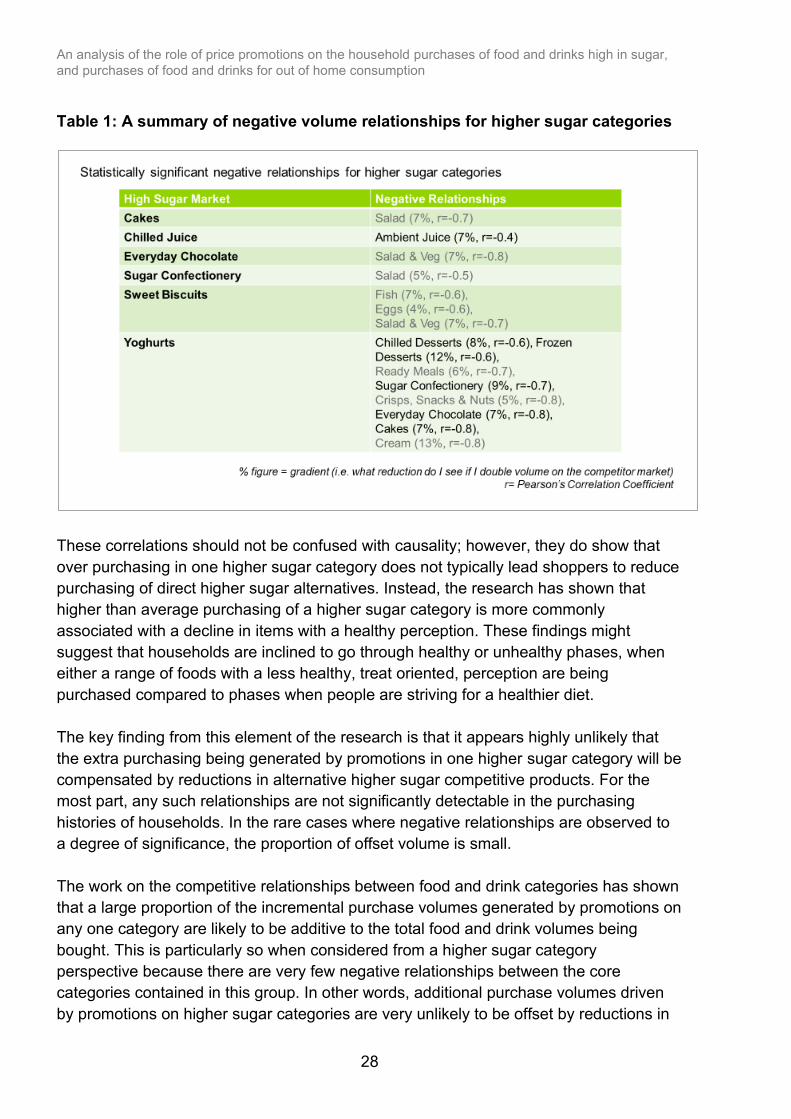
Further analysis of these higher sugar categories revealed relatively small relationships
between increased purchasing and reduced purchasing of other categories. The only
two notable instances where increased purchasing of a higher sugar category did result
in some degree of competition with another higher sugar category were chilled juices
(competing with ambient juice) and yoghurt (competing with chilled desserts, everyday
chocolate, frozen desserts, cakes and sugar confectionery). Table 1 below shows the
significant relationships (based on a Pearson’s correlation coefficient of -0.6% or
stronger) for the higher sugar categories. In all cases where a negative volume
relationship exists, the adjustment is small. The gradient reveals that a doubling of the
parent category volume leads to only a minor reduction in the competitor category in the
range of 4-10%.
An analysis of the role of price promotions on the household purchases of food and drinks high in sugar,
and purchases of food and drinks for out of home consumption
28
Table 1: A summary of negative volume relationships for higher sugar categories
These correlations should not be confused with causality; however, they do show that
over purchasing in one higher sugar category does not typically lead shoppers to reduce
purchasing of direct higher sugar alternatives. Instead, the research has shown that
higher than average purchasing of a higher sugar category is more commonly
associated with a decline in items with a healthy perception. These findings might
suggest that households are inclined to go through healthy or unhealthy phases, when
either a range of foods with a less healthy, treat oriented, perception are being
purchased compared to phases when people are striving for a healthier diet.
The key finding from this element of the research is that it appears highly unlikely that
the extra purchasing being generated by promotions in one higher sugar category will be
compensated by reductions in alternative higher sugar competitive products. For the
most part, any such relationships are not significantly detectable in the purchasing
histories of households. In the rare cases where negative relationships are observed to
a degree of significance, the proportion of offset volume is small.
The work on the competitive relationships between food and drink categories has shown
that a large proportion of the incremental purchase volumes generated by promotions on
any one category are likely to be additive to the total food and drink volumes being
bought. This is particularly so when considered from a higher sugar category
perspective because there are very few negative relationships between the core
categories contained in this group. In other words, additional purchase volumes driven
by promotions on higher sugar categories are very unlikely to be offset by reductions in

An analysis of the role of price promotions on the household purchases of food and drinks high in sugar,
and purchases of food and drinks for out of home consumption
29
similar high sugar foods. This means it is of importance in higher sugar categories to
understand the circumstances under which promotions generate the highest incremental
purchase volumes (category growth) as we would expect almost all of this to be
representing net increases to household sugar intake.
Within food and drink, promotions run as multibuys or promotions with higher discounts
tend to be the events that generate the greatest incremental category volumes (through
a mix of extra trips and expanded volumes). This is illustrated by the “source of volume”
profiles shown in Figure 16.
Figure 16: Promotional volume % decomposition by mechanic and discount bands
The mix of promotions being run (type of mechanic and depth of discount) and the
nature of the product type being promoted will also mean that profiles of promotions in
different categories or food and drink categories will exhibit variation. Figure 17 shows
how incremental volumes (extra trips and expansion) amongst higher sugar categories
tend to be proportionally greater where products are more discretionary or more treat
and special occasion oriented. Notable instances are confectionery, soft drinks and
bakery.

An analysis of the role of price promotions on the household purchases of food and drinks high in sugar,
and purchases of food and drinks for out of home consumption
30
Figure 17: Category incremental proportions for promotions
Such categories tend to have run promotions that have been more incremental as
drivers of extra volume. There are several exceptions, but overall more impulsive and
discretionary categories appear to hold more potential for shoppers to increase typical
take home volumes and use up this volume faster.
Whilst the focus during this research has been on effects of promoting on volume sales
it is also worth noting that promotions have significant financial impacts on
manufacturers, retailers and the category. From the shopper expenditure perspective,
promotions tend to generate additional sales value for manufacturers and retailers in the
clear majority of cases. The category incremental volume (driven by extra trips or
expansion) is a pure win for manufacturers and retailers in that category. Similarly,
stolen volume is also a clear win as it generates expenditure at the expense of
competitors. On the whole (but not always), these impacts outweigh the potential
expenditure reductions associated with cannibalised trading down and the instances
when expected full price purchases are discounted.
However, if we look at this equation from a broader category perspective (encompassing
all retailers and manufacturers operating in that food or drink market), the benefit that
any one manufacturer enjoys by stealing from competitor brands is unlikely to hold much
benefit. Movements from one brand to another (ie from full priced to discounted
alternatives) will tend to generate reductions in total category expenditure unless these
gains are offset by increased volume sales. Therefore, not all promotions will grow their
particular food or drink category in cash terms. High discounts on cheaper products and
in categories that show less potential for expansion, are far more likely to cause a
contraction in spend overall.
73 74 75 78 79 80 80 80 81 81 81 82 82 82 82 83 83 83 83 84 84 85 86 86 88
23 22 20 14 18 17 16 15 15 15 17 15 13 15 16 9 12 146
13 14 11 11 11 94 4 5 8 3 4 4 5 5 4 2 3 5 3 1 8 4 3 10 3 3 4 3 3 3
Extra Trips
Expansion
WithinCategory
An analysis of the role of price promotions on the household purchases of food and drinks high in sugar,
and purchases of food and drinks for out of home consumption
31
Promoting retailers tend to fall somewhere between the two extremes of manufacturer
and category. Whilst they will rarely see much benefit from switching between brands
(especially if this trades shoppers down to cheaper priced items), retailers do benefit
from some transferred spending from their retail competitors. Most shoppers now shop
in a rangeof different stores, so being tempted to spend on a promotion tends to
preclude a degree of purchasing in competitor outlets. Promotions hardly ever cause a
loss in sales value for manufacturers, but in a quarter of cases the promotion causes a
loss for the retailer.
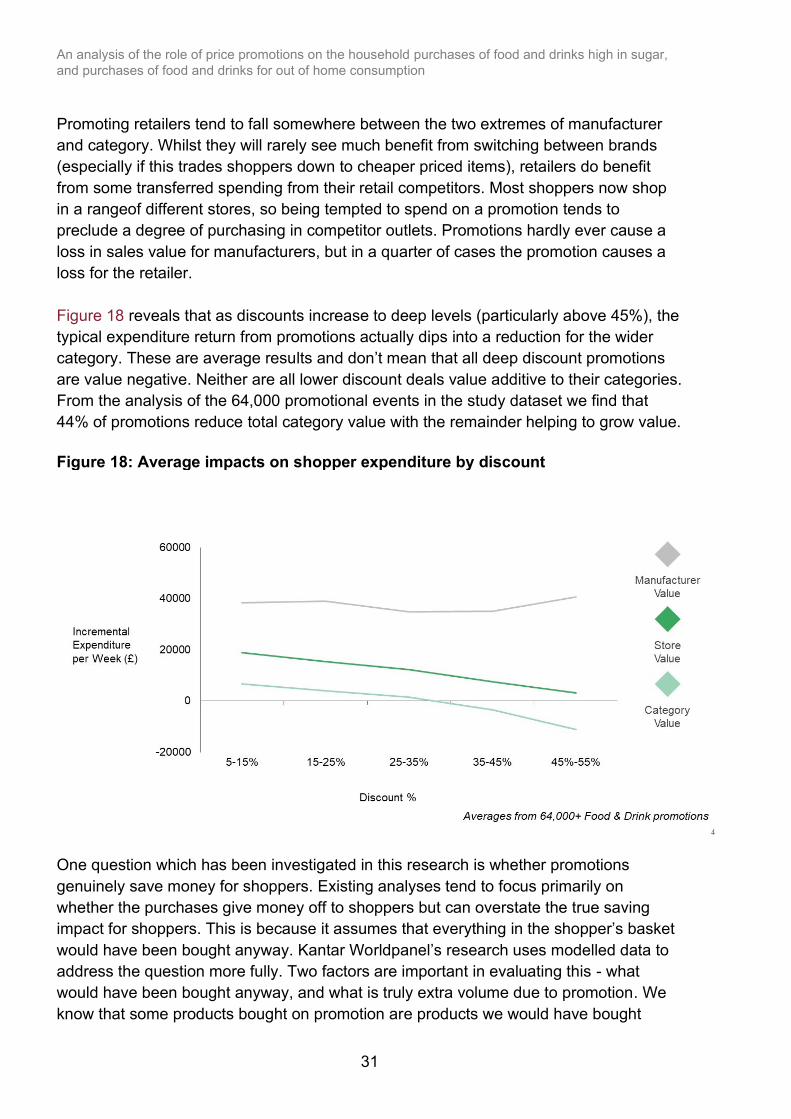
Figure 18 reveals that as discounts increase to deep levels (particularly above 45%), the
typical expenditure return from promotions actually dips into a reduction for the wider
category. These are average results and don’t mean that all deep discount promotions
are value negative. Neither are all lower discount deals value additive to their categories.
From the analysis of the 64,000 promotional events in the study dataset we find that
44% of promotions reduce total category value with the remainder helping to grow value.
Figure 18: Average impacts on shopper expenditure by discount
One question which has been investigated in this research is whether promotions
genuinely save money for shoppers. Existing analyses tend to focus primarily on
whether the purchases give money off to shoppers but can overstate the true saving
impact for shoppers. This is because it assumes that everything in the shopper’s basket
would have been bought anyway. Kantar Worldpanel’s research uses modelled data to
address the question more fully. Two factors are important in evaluating this - what
would have been bought anyway, and what is truly extra volume due to promotion. We
know that some products bought on promotion are products we would have bought

An analysis of the role of price promotions on the household purchases of food and drinks high in sugar,
and purchases of food and drinks for out of home consumption
32
anyway. In these cases, any form of deal to the shopper represents a saving. To
calculate a real saving to the shopper for those promotional sales, we use the value of
discounts to assess how much value has been saved as a result of buying on promotion.
Kantar Worldpanel also knows from our models that some purchases are extra as
shoppers would not have bought them without the promotions. Therefore, any accurate
calculation of whether shoppers save money due to promotions has to account for both
the extra spend due to promotions, which drive incremental value and the money saved
by products that shoppers would have bought anyway. The true saving takes account of
both of these factors.
To do this accurately, we need to apply a value to the savings on the items that would
have been bought anyway, as well as the spend on goods which are extra as a result of
the promotions. In the case of what would have been bought anyway, the amount of
saving is relevant eg if a shopper intended to buy goods to the value of £50, and they
were all sold at 30% discount, the saving would be £15. As we see a significant
difference in the effectiveness and the discount levels for TPRs and Multibuys, we have
separated those types of deal. The average TPR discount is 33% whereas the average
discount for a Multibuy is 26%. These values are applied to the non-incremental
purchasing (ie what would have been bought anyway) for both Multibuy and Price Cuts.
These represent a saving in the form of discount and will always reduce shopper spend.
The full value of extra spending must be also considered, as we calculate those
purchases that would not have been made without promotions, and therefore all spend
is additional. To calculate this fully Kantar Worldpanel has used the incremental
purchase measures that enables us to understand how much volume is incremental for
both MultiBuy and Price Cut. Effectively the ‘extra spend’ is offset by discounts on items
which would have been bought anyway.
Using these measures Kantar Worldpanel calculate that Multibuys encourage £75 of
additional spend for the average household. This is offset by a calculated saving of £61
on the non-incremental purchasing, due to the discounts on purchases that would have
been made anyway. Therefore, for Multibuys the total impact is an overall additional cost
of £14.
For Price Cuts the total impact is different. It is worth noting that the incremental volume
on a deal-by-deal basis is lower than for Multibuys, but there are considerably more
price cuts in the market. Using these measures Kantar Worldpanel calculate that
Temporary Price Reductions encourage £141 of extra spending through incremental
purchasing, but this is more than offset by £227 of savings from the price cuts on what
shoppers would have bought anyway.

An analysis of the role of price promotions on the household purchases of food and drinks high in sugar,
and purchases of food and drinks for out of home consumption
33
Overall, taking all of the factors of how Multibuys and Price Cuts work into consideration
we calculate the shopper saving to be £72 per year for an average shopper. This
number does not enable us to deduce how much up-trading takes place between
individual brands on specific deals, but accounts for the trading between brands at a
more aggregated level so the average figure is as accurate as it can reasonably be.
4. Are promotions on high sugar products more extensive and do shoppers react differently to these compared to non-high sugar products?
As was reported earlier, the degree of promoting that occurs by food and drink category
is highly variable. To analyse whether differences can be discerned for higher sugar
products we look at higher and lower sugar categories. It is possible to be a high sugar
product in a lower sugar category (ie the category overall is one of the lower sugar
categories, but the product within that is one of the higher sugar products). Even in lower
sugar categories, there are individual products which may be higher in sugar content. A
full analysis accounts for both elements.
Figure 19 shows how the contribution to overall take home sugar relates to the
distribution of promotional prevalence by category and by the type of product in that
category. High sugar products are more likely to be promoted in high sugar categories
than medium and low sugar products.
Figure 19: Level of promotion for high, medium and low sugar products

An analysis of the role of price promotions on the household purchases of food and drinks high in sugar,
and purchases of food and drinks for out of home consumption
34
Overall, we see that the spend on deal will be slightly higher for higher sugar products.
There are several clusters of categories that make a high contribution to sugar
purchasing. These include Canned Colas, Seasonal Biscuits and Yoghurt Drinks.
When considered as an aggregate statistic over the 2 years to 30 December 2018, the
defined group of higher sugar categories exhibit a greater proportion of spend going
through on promotion; 40% vs. 34% for food and drink as a whole (total products).
Furthermore, the average promotional discount is 30% for total food and drink, but a
marginally more generous 32% for higher sugar categories. Higher sugar categories are
therefore more broadly promoted and with very slightly deeper discounts.
When it is the dual effect of the high sugar products in the higher sugar categories, we
see that these are more likely to be bought on deal - a high sugar product in a high
sugar market is the most promoted combination (43% compared with 37% and 39% for
medium and low sugar products respectively), indicating clearly that there is greater
promotion on higher sugar products.
Figure 20 shows that high sugar categories are highly promoted (for example
carbonated soft drinks and chocolate at 50%), although the level of promotion fell across
all categories compared with the previous year.
Figure 20: Levels of promotion shown for higher sugar categories with year on year change in the level of promotion.
An analysis of the role of price promotions on the household purchases of food and drinks high in sugar,
and purchases of food and drinks for out of home consumption
35
One explanation for this promotional preference for the highest sugar categories is that
they contain more expensive items. Off promotion, higher sugar products are on
average 25% more expensive than a low sugar product. Promotions bring the price
premium down, and the discounts on these items are higher, though the net effect is still
that higher sugar items are more expensive even when on promotion. For this reason,
they may be more attractive for a retailer to promote as even a promoted high sugar
item contributes to a higher value shopping basket for the retailer.
Effect on sugar sales
Promotions account for a significant proportion of all food and drink purchases. This
means they also account for a significant quantity of all constituent sugar volume
purchased in Britain.
It has been shown that promotions generate incremental sales volume to their
categories. Furthermore, for many higher sugar categories this extra volume is also
seen to be largely incremental to wider food and drink volumes. This in turn means that
promotions will generate incremental take home sugar volume as a consequence of
driving unexpected trips and accelerating purchasing rates. Based on the observed
shopping behaviour in response to price promotions over the two years of analysis, data
from the panel (Figure 21) reveals that 29.5% of all take home sugar volumes are from
promoted purchases, with 5.5% of all take home sugar volumes being an incremental
consequence of promoted purchases. The large majority of this 5.5% is accounted for by
the higher sugar categories (4.0% of total take home sugar), almost three quarters of the
total incremental amount.
Four percent can be considered the notional saving in overall sugar volume if
promotions in these higher sugar categories had not occurred. This number also
represents an estimate of the maximum opportunity if future promotions were to cease.
Amongst the higher sugar categories, different individual categories will contribute
differing amounts to this total incremental 4.0% and hence will provide different degrees
of opportunity for any policies aimed at curtailing sugar purchased because of
promotion. The degree to which promotions in these categories generate incremental
behaviour, the sizes of the categories and the levels of sugar found in the products in
these categories will all play a role.

An analysis of the role of price promotions on the household purchases of food and drinks high in sugar,
and purchases of food and drinks for out of home consumption
36
Figure 21: Proportions of take-home sugar accounted for by promotions
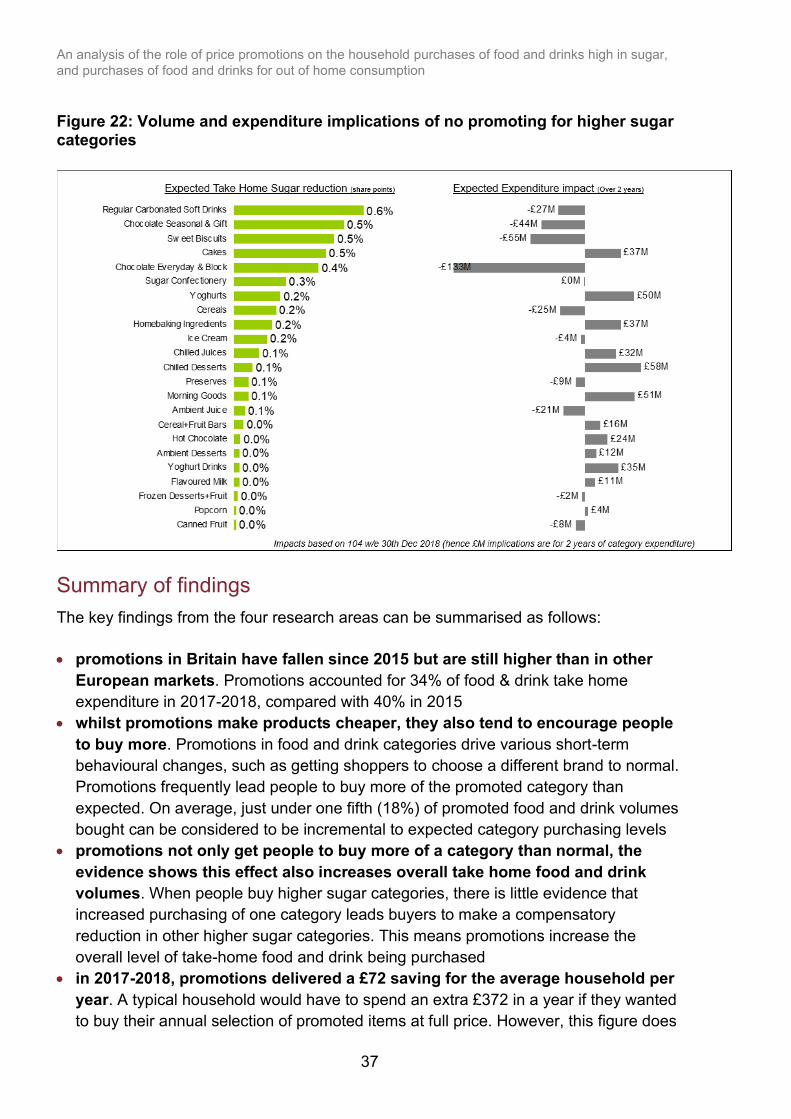
To summarise these impacts, Figure 22 shows the category contributions of how a
notional 4.0% saving in sugar volumes might be achieved through cessation of
promotions.
There is a relationship between sugar reduction and financial impact to the category,
though it is not a consistent relationship. For example, a cut in promotions on regular
carbonated soft drinks would reduce the value of the category, though this is not the
case in markets such as cakes. The expenditure impact is based not only on how much
more a category consumes when on promotion, but also the levels of discount and the
relative price differentials between the promoted prices paid. In a category where
shoppers are more likely to trade up to more expensive brands, a reduction in volume
would bring an even more significant reduction in expenditure. If, however, shoppers
trade down more frequently. a reduction in promotions would add value to the category.
The potential expenditure impacts of promoting are important to understand. Any policy
seeking to reduce take home sugar by limiting the volumetric impacts of promotions
would have a knock-on effect on industry sales values and by implication therefore
business profitability. How profitable price promotions really are is a source of much
industry discussion and is something that cannot be objectively examined without
analysis of manufacturers and retailers’ margin data. This lies outside the scope of
this study.
An analysis of the role of price promotions on the household purchases of food and drinks high in sugar,
and purchases of food and drinks for out of home consumption
37
Figure 22: Volume and expenditure implications of no promoting for higher sugar categories
Summary of findings
The key findings from the four research areas can be summarised as follows:
• promotions in Britain have fallen since 2015 but are still higher than in other
European markets. Promotions accounted for 34% of food & drink take home
expenditure in 2017-2018, compared with 40% in 2015
• whilst promotions make products cheaper, they also tend to encourage people
to buy more. Promotions in food and drink categories drive various short-term
behavioural changes, such as getting shoppers to choose a different brand to normal.
Promotions frequently lead people to buy more of the promoted category than
expected. On average, just under one fifth (18%) of promoted food and drink volumes
bought can be considered to be incremental to expected category purchasing levels
• promotions not only get people to buy more of a category than normal, the
evidence shows this effect also increases overall take home food and drink
volumes. When people buy higher sugar categories, there is little evidence that
increased purchasing of one category leads buyers to make a compensatory
reduction in other higher sugar categories. This means promotions increase the
overall level of take-home food and drink being purchased
• in 2017-2018, promotions delivered a £72 saving for the average household per
year. A typical household would have to spend an extra £372 in a year if they wanted
to buy their annual selection of promoted items at full price. However, this figure does
An analysis of the role of price promotions on the household purchases of food and drinks high in sugar,
and purchases of food and drinks for out of home consumption
38
not fully show how much they save or spend as a result of promotions. The true
saving is calculated by taking into account the additional purchasing due to
promotions, as well as the saving made where they would have bought the same
products
• price promotions are a common feature of grocery shopping and therefore all
shoppers are regularly exposed to promotions on products they want to buy.
Although differences are small, shoppers from lower socio-economic groups (C2DE
vs. ABC1), on lower incomes (<£30,000 vs £30,001+), and in the youngest (<34yrs)
and oldest (65yrs+) age groups are slightly less likely to buy into promotions
• higher sugar food and drink items are both more likely to be promoted and
promoted at a higher level of discount. For higher sugar products, 40% of spend
on purchasing was on promoted products in 2017-2018, compared with 34% overall,
and average promotional discount was 32% compared with 30% overall. Several of
the higher sugar food and drink categories represent more discretionary products and
promotions in these areas will more easily get shoppers to buy more than normal.
This means promotions in some higher sugar categories can more readily drive up
take-home food and drink volume. This also explains why the high sugar categories
account for a bigger proportion of the extra sugar purchased
• it is calculated that 5.5% of all take home sugar volume is an incremental
consequence of promotions with about 4.0% coming from the higher sugar
categories. In other words, a 4.0% saving in sugar volumes might be achieved if the
level of promotions in higher sugar categories was reduced to zero

An analysis of the role of price promotions on the household purchases of food and drinks high in sugar,
and purchases of food and drinks for out of home consumption
39
Part 2: out of home food and drink
Methodology
Kantar Worldpanel have an additional panel which records consumers’ out of home food
and non-alcoholic drink purchases, behaviour which the main panel does not capture.
This panel is a subset of the main panel and is made up of 7500 individuals who use a
purpose-built app to input all of their food and drink purchased to be consumed out of
the home (ie the products never make it into the home), as well as takeaways which are
brought back into the home. The panel has been collecting data since June 2015, so
includes 3 years of back data. This report focuses on year on year trends for the 52
week ending periods 30 December 2018 and 31 December 2017.
Panellists are asked to specify the following about their out of home food and drink
purchases:
• channel type (supermarket, restaurant etc.)
• specific outlet name
• number of people present at the occasion
• product purchased - the app collects barcoded items (using an in-app scanner) and
non-barcoded items (pre-defined options to guide panellist through items purchased)
• who the item was bought for
• whether a promotion was used - panellists have the option to select ‘meal deal or
multi buy’, ‘other promotion or voucher’ in retail channels or ‘voucher or coupon used’
in food service channels
• the out of home panel collects data from an exhaustive list of channels: grocery
supermarkets and convenience stores, cafes, coffee shops, workplace and education,
forecourts and garages, restaurants, fast food establishments, hotels, pubs and bars,
leisure venues. Appendix 4 includes the channels and outlet examples within each
channel
The panel collects information on food and non-alcoholic drinks consumed out of home.
For this piece of research, different sub-categories were grouped together to analyse 6
food and drink categories: hot drinks, cold drinks, main meals, quick meals, sweet
snacks and savoury snacks. Appendix 5 shows which sub-categories are included in
each category.
To collect pricing information, panellists are required to fill a self-fill box with the price per
unit of the product or meal purchase. If snacks or drinks are purchased the panellists
use a tick box to indicate if a “meal deal or multi-buy” or “other promotion or voucher”
was used. If a main meal is purchased the panellists use a tick box to indicate if a
“voucher or coupon” was used. For this analysis all promotion types have been grouped
together and will be referred to as “promotions”.
An analysis of the role of price promotions on the household purchases of food and drinks high in sugar,
and purchases of food and drinks for out of home consumption
40
The use of promotions is entirely consumer defined - panellists declare if they perceive
that they have used a promotion. However, Kantar understand that consumers perceive
promotions in different ways; where there is a regular discount for buying specific items
as a group, or a food service outlet is constantly offering a promotion or discount and the
discount is automatically applied, our understanding is that consumers are less likely to
acknowledge a promotion has been used Therefore, they are less likely to record it as
such and for this reason the total number of promotions in the out of home sector may
be under reported. This is challenging to corroborate as information with which we can
validate this is limited and fragmented. As such, the data and analysis in this report
provide a useful indicator of promotional use in the Out of Home sector.
For the out of home sector, five study areas were addressed:
1. What is the scale of promotions in the out of home sector?
2. Who responds to promotions out of home?
3. Which food and drink categories do consumers buy on promotion out of home?
4. What are the promotional dynamics for grocery supermarkets in the out of home
sector?
5. What are the promotional dynamics for full-service restaurants in the out of home
sector?
Results and discussion
1. What is the scale of promotions in the out of home sector?
The proportion of out of home trips featuring a promotion increased from 2017 to 2018.
In the 52 weeks ending 30 December 2018, 6.7% of out of home trips used a promotion,
increasing from 6.1% in the previous year. This equates to 829 million out of home trips
using a promotion, 94.9 million more than in the 52 weeks ending 31 December 2017.
Over two thirds of consumers (69.4%) used a promotion out of home in 2018, up by 1.3
percentage points compared with 2017. Overall, 98.5% of consumers bought into the
total out of home sector.
Some channels are more reliant on promotional usage than others. Figure 23 shows the
proportion of trips featuring a promotion for all out of home channels for 2017 and 2018.
Unsurprisingly, levels of promotions are highest in grocery supermarkets (13.4% of trips
in 2018) as meal deals and other promotions are widely available in this channel.
Workplace and education had the largest year-on-year increase in proportion of trips
featuring a promotion, but promotions offered are relatively low in this channel (3.3% of
trips in 2018). Food service led restaurants, particularly full and quick service restaurants
have more trips featuring a promotion (9.3% and 6.9% respectively) than average and
the proportion grew year-on-year by more than 1 percentage point for both channels.

An analysis of the role of price promotions on the household purchases of food and drinks high in sugar,
and purchases of food and drinks for out of home consumption
41
Figure 23. The proportion of trips featuring a promotion by channel
2: Who responds to promotions out of home?
Promotions are widely available in the out of home sector. As a consequence, the
differences in age and affluence of consumers who use promotions is slight. Figure 24
shows the proportion of out of home trips made by different age and affluence groups
which feature a promotion. Those aged 35-54 are most likely to use a promotion, with
8.1% of their trips in 2018 featuring a promotion, compared to 6.7% of trips overall.
Consumers in socio-economic groups AB (7.3% of trips) and E (7.6% of trips) are more
likely to use promotions out of home compared to other groups. However, AB group
shoppers tend to use promotions when in grocery supermarkets whilst group E shoppers
use promotions in quick and full-service restaurants.
Promotions are more likely to feature when an adult and a child are present - 11.2% of
these trips featured a promotion in 2018 compared to the average of 6.7% of trips. At
these occasions, main meals are commonly bought, and consumers are likely to go to
Full Service Restaurants. When a consumer is buying food or drink for themselves, they
are slightly less likely to use a promotion than average (6.4% of trips feature a
promotion).

An analysis of the role of price promotions on the household purchases of food and drinks high in sugar,
and purchases of food and drinks for out of home consumption
42
Figure 24: Demographics differences in trips featuring a promotion for total out of home trips
3: Which food and drink categories do consumers buy on promotion out of home?
With meal deals representing a large proportion of the promotions that are available in
the out of home sector it is unsurprising that consumers buy more individual items on
promoted trips compared to non-promoted trips. On average, consumers buy 2.5 items
per trip when using a promotion, 0.6 items more per trip than an average out of home
trip. Certain food and drink categories are more likely to be bought on promotion out of
home. Figure 25 shows the share of each of the out of home food and drink categories
that are purchased on promotion.
Meal deals also drive the types of products that are likely to be included in trips where
promotions are used out of home. A higher proportion of trips to buy savoury snacks (eg
crisps, nuts, cheese), cold drinks, and quick meals (eg sandwiches and salads) feature a
promotion compared to average. However, the standout category is savoury snacks,
with one in every five trips (19.6%) to buy savoury snacks featuring a promotion. Crisps
and starch-based snacks contribute over 50% of this category’s value and have the
highest proportion of trips featuring a promotion, 26.6% and 22.6% respectively.
Additionally, a slightly higher proportion of trips to buy main meals feature a promotion
(7.3%) than average. Consumers are more likely to use promotions to purchase a main
meal on trips to quick and full service restaurants, with 8.0% and 10.2% of trips to buy
main meals in these channels featuring a promotion in 2018. Therefore, the types of
main meal cuisine which are more likely to be purchased on promotion in the total out of

An analysis of the role of price promotions on the household purchases of food and drinks high in sugar,
and purchases of food and drinks for out of home consumption
43
home sector are pizza, burgers and Italian non-pizza (13.7%, 13.1% and 12.9% of trips
feature a promotion).
Figure 25: Promotional levels by food and drink categories out of home
4: What are the promotional dynamics for grocery supermarkets in the out of home sector?
Grocery supermarkets (offering food on the go) are the channel in the out of home
sector with the highest proportion of trips featuring a promotion. In the 52 weeks ending
30 December 2018, 13.4% of all supermarket out of home trips featured some sort of
promotion, compared to 6.7% of trips in the sector overall. In 2018, 9.2 million more
supermarket trips featured a promotion compared to the previous year (52 w/e 31 Dec
17) and these promotions helped drive the growth of this channel.
Figure 26 shows the proportion of trips featuring a promotion by retailer. Tesco have the
highest proportion of trips featuring a promotion (21.6% of trips) while Aldi and Lidl
(1.3% of trips), who have a limited food on the go offering, have the smallest proportion.
Whilst total supermarkets grew out of home sales at a rate of 6.5% (52 w/e 30 Dec 18 vs
52 w/e 31 Dec 17), promoted sales in this channel grew at 7.5%. This accelerated
growth came from promotions being effective in attracting new shoppers to buy
promoted items in the supermarkets.

An analysis of the role of price promotions on the household purchases of food and drinks high in sugar,
and purchases of food and drinks for out of home consumption
44
Figure 26: Proportion of trips featuring a promotion, by retailer
Meal deals are a feature in supermarket food-to-go, and this is emphasised by the
products which are bought on (and growing) through promotions. Within cold drinks,
juice, smoothies, and iced tea, dairy and dairy alternative drinks, and bottled water are
all seeing faster growth through promoted trips than their average growth rates – and
these products generally offer strong value when on promotion. For example, the
average price of a smoothie not on promotion is £1.51; therefore, buying a £3 meal deal
would make the price of the snack and sandwich only £1.49. Chilled prepared fruit is
another food category where promoted trips are growing at a much faster rate than non-
promoted trips, offering both health and good value. Other notable categories where
promoted trips are driving category growth in the supermarkets include crisps, salads,
savoury pastries, and sandwiches. We are unable to determine whether this profile is
due to the promotional strategy of the retailers or due to consumers specifically
searching out promotions for these products.
One-third (33%) of all out of home food and drink purchased from supermarkets (food-
to-go) is for consumption at lunch. Figure 27 shows the out of home occasions when
food and drink bought from supermarkets is consumed.

An analysis of the role of price promotions on the household purchases of food and drinks high in sugar,
and purchases of food and drinks for out of home consumption
45
Figure 27: Consumption occasions of all food and drink purchased in supermarkets
There are differences in demographics of those using promotions in grocery
supermarkets. Figure 28 shows the proportion of out of home supermarket trips made by
different age and affluence groups that feature a promotion Both socio-economic group
AB and E trips feature a higher proportion of promotions (17.8% and 16.5% respectively)
than average, however, what they are buying differs.
The key working age population (25-54 year olds) and socio-economic group AB
consumers are more likely to buy quick meals on promotion, suggesting they are taking
advantage of supermarkets’ meal deal offering for their lunch. Although meal deals are a
cheaper option than other alternatives, they are more expensive than a carried-out lunch
(average cost £1.88, 52 w/e 30 Dec 18) (6) so it is maybe unsurprising that people of a
higher affluence purchase these.
Socio-economic group E consumers are also more engaged with promotions in
supermarkets, but they are more likely to buy sweet snacks on promotions with 19% of
their sweet snack trips in supermarkets featuring a promotion compared to the average
of 10.8% of trips. The type of sweet snacks which make up their sweet snack trips also
differ from the average consumer – chocolate bars and cookies make up a higher share
of their promoted trips and fruit wins a smaller share.
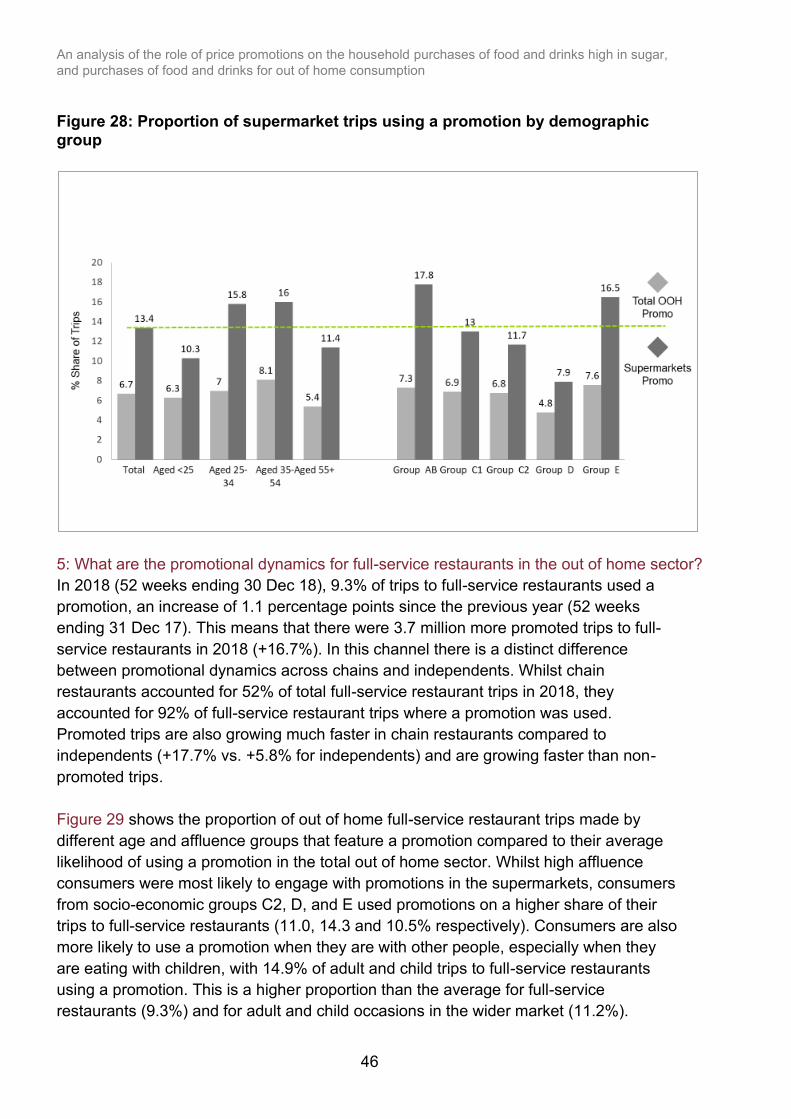
An analysis of the role of price promotions on the household purchases of food and drinks high in sugar,
and purchases of food and drinks for out of home consumption
46
Figure 28: Proportion of supermarket trips using a promotion by demographic group
5: What are the promotional dynamics for full-service restaurants in the out of home sector?
In 2018 (52 weeks ending 30 Dec 18), 9.3% of trips to full-service restaurants used a
promotion, an increase of 1.1 percentage points since the previous year (52 weeks
ending 31 Dec 17). This means that there were 3.7 million more promoted trips to full-
service restaurants in 2018 (+16.7%). In this channel there is a distinct difference
between promotional dynamics across chains and independents. Whilst chain
restaurants accounted for 52% of total full-service restaurant trips in 2018, they
accounted for 92% of full-service restaurant trips where a promotion was used.
Promoted trips are also growing much faster in chain restaurants compared to
independents (+17.7% vs. +5.8% for independents) and are growing faster than non-
promoted trips.
Figure 29 shows the proportion of out of home full-service restaurant trips made by
different age and affluence groups that feature a promotion compared to their average
likelihood of using a promotion in the total out of home sector. Whilst high affluence
consumers were most likely to engage with promotions in the supermarkets, consumers
from socio-economic groups C2, D, and E used promotions on a higher share of their
trips to full-service restaurants (11.0, 14.3 and 10.5% respectively). Consumers are also
more likely to use a promotion when they are with other people, especially when they
are eating with children, with 14.9% of adult and child trips to full-service restaurants
using a promotion. This is a higher proportion than the average for full-service
restaurants (9.3%) and for adult and child occasions in the wider market (11.2%).
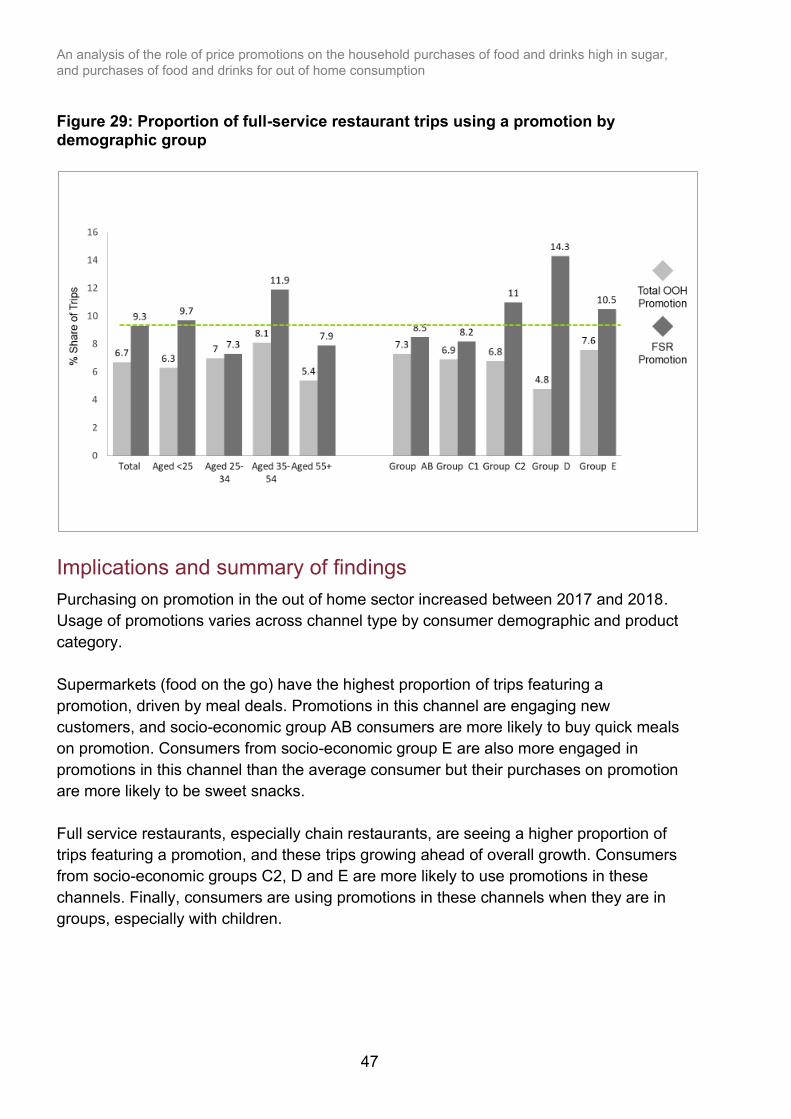
An analysis of the role of price promotions on the household purchases of food and drinks high in sugar,
and purchases of food and drinks for out of home consumption
47
Figure 29: Proportion of full-service restaurant trips using a promotion by demographic group
Implications and summary of findings
Purchasing on promotion in the out of home sector increased between 2017 and 2018.
Usage of promotions varies across channel type by consumer demographic and product
category.
Supermarkets (food on the go) have the highest proportion of trips featuring a
promotion, driven by meal deals. Promotions in this channel are engaging new
customers, and socio-economic group AB consumers are more likely to buy quick meals
on promotion. Consumers from socio-economic group E are also more engaged in
promotions in this channel than the average consumer but their purchases on promotion
are more likely to be sweet snacks.
Full service restaurants, especially chain restaurants, are seeing a higher proportion of
trips featuring a promotion, and these trips growing ahead of overall growth. Consumers
from socio-economic groups C2, D and E are more likely to use promotions in these
channels. Finally, consumers are using promotions in these channels when they are in
groups, especially with children.

An analysis of the role of price promotions on the household purchases of food and drinks high in sugar,
and purchases of food and drinks for out of home consumption
48
References
(1) HM Government. Childhood obesity: a plan for action (2016). Available from:
https://www.gov.uk/government/publications/childhood-obesity-a-plan-for-action
(2) HM Government. Childhood obesity: a plan for action, chapter 2 (2018). Available
from: https://www.gov.uk/government/publications/childhood-obesity-a-plan-for-action-
chapter-2
(3) HM Government. Advancing our health: prevention in the 2020s (2019). Available
from: https://www.gov.uk/government/consultations/advancing-our-health-prevention-in-
the-2020s
(4) Public Health England. Sugar Reduction: The evidence for action (2015). Annexe 4:
An analysis of the role of price promotions on the household purchases of food and
drinks high in sugar. Available from:
https://assets.publishing.service.gov.uk/government/uploads/system/uploads/attachment
_data/file/470175/Annexe_4._Analysis_of_price_promotions.pdf
(5) Finglas P.M., Roe M.A., Pinchen H.M., Berry R., Church S.M., Dodhia S.K., Farron-
Wilson M. & Swan G. (2015). McCance and Widdowson’s The Composition of Foods,
Seventh summary edition. Cambridge: Royal Society of Chemistry
(6) Kantar Worldpanel Carried Out Lunch, December 2018 (unpublished)

An analysis of the role of price promotions on the household purchases of food and drinks high in sugar,
and purchases of food and drinks for out of home consumption
49
Appendices
Appendix 1: Kantar Worldpanel GB purchasing data methodology
Sample structure and recruitment:
• 30,000 households chosen to reflect all GB Households by region and demographics.
• population targets are obtained from the results of the Broadcasters Audience
Research Board (BARB) Establishment Survey and the Office for National Statistics
(ONS).
• key sample controls include BARB region, household size, presence of children and
age of housewife. Socio-economic group is not included in the sample targets but is
part of the weightings applied to represent GB.
• recruitment to the panel occurs through postal and email communication.
• incentives are used to reward participation, typically as vouchers for high street
retailers. However, many panellists additionally have a genuine interest in taking part.
• there is a high level of panel continuity; 70% of the panel have been involved for 3 or
more years.
Data coverage:
• the methodology is set up with the aim of collecting all food and drink purchases
brought back into the home regardless of place of purchase eg corner shop,
supermarket, or department store
• products purchased and consumed out of the home are not included.
• once shopping is brought into the home, barcodes are scanned, prices are collected
and till receipts are sent by the panellist
• show cards with internal barcodes are used to collect data on non-barcoded products
like loose fruit and vegetables and in store bakery items
Panel monitoring and validation:
• household purchasing patterns are tracked over time and investigated if significant
changes occur
• eligibility for household purchasing to be included in the final data is assessed every 4
weeks. Panellist data will not be used if there are reasons to suspect poor
compliance. For example, there are minimal spend and volume limits with
assessment across peer groups to understand typical purchasing levels
• approximately 10-15% of the 30,000 GB household panel will not meet the eligibility
criteria in a typical 4 weekly period
• there is a mechanism to enable regular communication with panellists about their
scanning if changes are seen
• trends are constantly validated by food and drink manufacturers and retailers. These
organisations buy access to the aggregated data and will typically compare this to
third party, retailer sourced data sets to monitor accuracy
An analysis of the role of price promotions on the household purchases of food and drinks high in sugar,
and purchases of food and drinks for out of home consumption
50
Weighting:
• data from the sample households will be weighted up to reflect all GB households
with correct demographic representation
• further weighting corrections are made to the data to account for known issues such
as panellists being more likely to forget to scan small baskets
Identifying promotions:
• the study seeks to collect any promotional mechanic associated with any purchase
instance on any specific item
• panellists are asked to scan whether there was a multi-buy or price promotion
attached to the purchase as part of the scanning task as an initial flag for promotional
activity
• detail of the multi-buy is then established from the till receipts sent in by panellists,
with further verification by an in-house specialised coding team who engage in store
visits, direct contact with retailers and manufacturers and website trawls
• temporary Price Reductions (TPRs) are identified by an automated process looking
for changes in prices paid over time
Appendix 2: Kantar Worldpanel nutrition service methodology
Kantar Worldpanel have been collecting and coding nutrition information from food and
drink packaging since early 2005. The big eight nutrients are captured: calories,
carbohydrates, total sugar, total fat, saturated fat, fibre, protein and sodium. All
information is taken from product packaging and no laboratory analysis is undertaken.
The nutrient values are combined with the purchasing information to provide nutrient
volumes by product, food category and for the total take home food and drink
marketplace.
Data sources for nutrition content:
• nutrition information is taken directly from product packaging in all cases where
available
• where applicable, known values are used for the same product sold in different pack
sizes or formats (eg a fizzy drink brand sold in varying can and bottle sizes).
• for some fresh and non-barcoded products, nutrition information from McCance &
Widdowson’s - The Composition of Foods (5) is used
• where none of the above sources can be found, average nutritional values
corresponding to the appropriate market sector will be applied to any remaining
products.
Coding maintenance:
• the nutrition information ascribed to each product within the database is updated on a
four-monthly basis by Kantar fieldworkers
• fieldworkers visit a sample of multiple stores (Asda, Tesco, Morrison’s, Waitrose, Co-
op, Iceland, Farm Foods and M&S) and capture the barcode and on pack nutrition

An analysis of the role of price promotions on the household purchases of food and drinks high in sugar,
and purchases of food and drinks for out of home consumption
51
panel via a hand-held device. This will be done for all products on the shelf in the
target category
• this data collection is supplemented by product image data, available to Kantar
Worldpanel as part of a commercial agreement with Brandbank. Brandbank collect
product images and data from retailers and manufacturers for use on retailer websites
including Asda, Sainsbury, Waitrose and Tesco. This enables Kantar Worldpanel to
update product information between field collection in the event new nutrient values
lead to a new Brandbank image. Images of all new products are collected (either from
Brandbank images or via Kantar Worldpanel’s own fieldwork) once the panel have
purchased the product at least twenty times. This means that nutrient data is collected
on all new products as and when they are launched
Appendix 3: List of food and drink categories analysed in the study
Group Higher Sugar Categories
Ambient Condiments
Ambient Juice
Biscuits
Cakes
Canned Fruit
Carbonated Soft Drinks
Cereal+Fruit Bars
Cereals
Chilled Desserts
Chilled Juices
Chocolate Everyday & Block
Chocolate Seasonal & Gift
Desserts
Flavoured Milk
Food Drinks
Frozen Desserts
Frozen Fruit
Fruit Squash
Gum
Homebaking
Ice Cream
Morning Goods
Pickles Chutneys & Relish
Popcorn
Preserves
Sugar Confectionery
Table Sauces

An analysis of the role of price promotions on the household purchases of food and drinks high in sugar,
and purchases of food and drinks for out of home consumption
52
Yoghurt Drinks and Juices
Yoghurts
Higher raw or natural sugar categories
Ambient Milk + Cream
Apples & Pears
Banana
Berries
Coconut
Coffee
Dates
Easy Peelers
Exotic Fruit
Grapefruit
Grapes
Lemon+Lime
Melons
Milk
Orange
Pineapples
Pumpkin
Rhubarb
Soft Fruit
Sugar
Other Low Sugar Categories
Ambient Cooking Sauces
Ambient Dips
Ambient Gravy
Ambient Olives
Ambient Pizza Bases
Ambient vegetarian Products
Ambient Salad Accompaniment
Avocado
Bacon/Pork
Baked Bean
Beef
Beer & Cider
Bread
Breakfast Drinks
Canned & Packet Soup
Canned Fish & Meat
Canned Pasta Products

An analysis of the role of price promotions on the household purchases of food and drinks high in sugar,
and purchases of food and drinks for out of home consumption
53
Canned Vegetables
Carrots
Chapatis
Cheese
Chilled Cooking Sauces
Chilled Dips
Chilled Gravy+ Stock
Chilled Olives
Chilled Pate+ Paste +Spread
Chilled Prepared Salad
Chilled Rice
Chillies
Chilled Sandwich Fillers
Cold Pies
Cooked Poultry
Cooking Oils
Cream
Crisps & Snacks
Cucumbers
Curry Powder
Deli Meat
Eggs
Ethnic Ingredients
Fabs
Fish
Flour
Fresh Bacon Rashers
Fresh Other Meat & Offal
Fresh Pasta
Fresh Pastry
Fresh Pizza
Fresh Soup
Fresh Stuffing
Frozen Fish
Frozen Meat
Frozen Meat Products
Frozen Pastry
Frozen Pizzas
Frozen Potato Chips/Products
Frozen Poultry
Frozen Ready Meals
Frozen Savoury Bakery
Frozen Veg

An analysis of the role of price promotions on the household purchases of food and drinks high in sugar,
and purchases of food and drinks for out of home consumption
54
Frozen Vegetarian
Garlic
Ginger
Green Vegetables
Herbs
Hot Pies
Instant Hot Snacks
Instant Mashed Potato
Lamb
Lettuce
Meal Kits
Meat Extract
Mixers
Mushrooms
Mustard
Onions
Other Vinegar
Packet Stuffing
Pasta & Rice
Pickled Veg
Poppodoms
Potatoes
Poultry
Premium Salt
Pre-Packed Delicatessen Meat
Prepared Salad
Quiches
Ready Meals
Root Vegetables + Squashes
Salad Vegetables
Salt
Sausages
Savoury Biscuits
Savoury Preserves
Snacking Nuts
Sparkling Wine
Spices
Spirits
Standard Vinegar
Stock Cubes
Tea
Tomatoes
Tortilla Wraps

An analysis of the role of price promotions on the household purchases of food and drinks high in sugar,
and purchases of food and drinks for out of home consumption
55
Vegetable in Jar
Water
Wine
Yellow Fats

An analysis of the role of price promotions on the household purchases of food and drinks high in sugar, and purchases of food and drinks for out of home consumption
Appendix 4: Out of home channels and outlet options
Channel Types Outlets
Supermarkets (includes forecourts)
Tesco Asda Sainsburys Morrisons Co-op M&S Aldi Lidl Other supermarkets
Symbols and independents
Nisa Premium Stores
Costcutter One Stop Best One Spar RS McColls Budgens Other newsagents and independents
High Streets Boots B&M bargains Poundland Home Bargains
Off licence WHSmith Wilkinson’s 99p Store Other high street stores
Forecourts (Excluding multiples and travel)
Rail/station shops
Airport BP Connect Shell Esso Moto AppleGreen Jet Other forecourts and garages
Workplace and education
Workplace Canteen
School Canteen
Hospital Shop/Canteen
Tuck Shop University Canteen
Hospital Shop Staff/work Shop/ College/ Canteen
Vending Machine
Cafes Supermarket Café
Department store café
Garden Centres
Tourist attraction
Cinema Concert/Sports venue
Ice cream Parlour Shop
Bowling Alley
Other Leisure and cafes
Sandwich and Bakery Shops
Greggs Subway Pret A Manger
Krispy Kreme Eat Patisserie Valerie
Delicatessen Abokado Other sandwich and bakery stores
Coffee shops Costa Coffee Caffe Nero Starbucks Coffee #1 AMT Coffee Cafe2u Caffe Uno Caffe Ritazza
Other coffee shops
Quick Service Restaurant
McDonalds KFC Burger King Chinese Takeaway
Fish and Chip Shop
Domino’s Pizza
Indian Takeaway
Papa John's Pizza
Other Fast food/takeaway
Full Service Restaurants
Full Service independents
Pizza Hut Frankie & Benny's
Nando's Pizza Express Prezzo Bella Italia Wagamama Zizzi Ristorante
Café Rouge T.G.I Friday's Ask Chiquito Brasserie Gerard Browns Other Chain Restaurants

An analysis of the role of price promotions on the household purchases of food and drinks high in sugar, and purchases of food and drinks for out of home consumption
Channel Types Outlets
Pubs and Bars
Independents Pubs
Wetherspoons Toby Carvery Brewers Fayre
Harvester Beefeater Grill Chef & Brewer Hungry Horse
Sizzling Pub Co.
Embers Inns Marston's pubs
Miller & Carter All bar one Table Table Other Pubs Chains
Hotels Premier Inn Hilton Hotels Holiday Inn Best Western Ibis Hotels Marriott Hotels Old English Inns
Ramada Hotels
Other hotels

An analysis of the role of price promotions on the household purchases of food and drinks high in sugar, and purchases of food and drinks for out of home consumption
Appendix 5: The out of home food and drink categories analysed
Out of home categories
Sub-categories
Total Drinks
Hot Drinks Coffee Tea Hot Chocolate
Other hot drinks
Cold Drinks Carbonates Juice, Iced Tea and Smoothies
Yoghurt Drinks
Dairy Drinks and Cold Coffee
Water Energy and Sports Drinks
Shandies and Mixers
Fruit Squash
Total Snack
Sweet Snacks
Toastie Pastries
Yoghurt
Sugar confectionery
Ice Cream
Ready to Serve Desserts
Cereal Bars
Morning Goods Muffins Croissants Scones Tea Cakes Pain Au Chocolate
Fruit Iced Buns
Crumpets /Pikelets
Fruited Other Buns
Hot cross Buns
Pancakes /Griddle Scones
Unfruited Iced Buns
Unfruited other buns
Waffles
Cakes and Pastries
Cake Bars Doughnuts Cheesecake Small Cakes Small Pies Flapjack Large whole cakes
Slices
Mince Pies Small Tarts Small Swiss Rolls
Danish Pastries
Cake Portion Malt/Fruit Loaves
Other dessert /Meringue
Potato cakes
Other cakes
Cookie
Chewing Gum
Chocolate confectionery
Everyday Chocolate
Seasonal Chocolate
Fruit and Vegetables
Produce Chilled Prepared Fruit

An analysis of the role of price promotions on the household purchases of food and drinks high in sugar, and purchases of food and drinks for out of home consumption
Savoury Snacks
Veggie Snacking
Chilled Olives
Ambient Olives
Bhajis Falafel Meat Substitute Snacking
Pakoras Vegetarian Snacking
Meat Snacking NB Burger NB Hot Dogs
Cooked Poultry
NB Hot Deli Meat
Scotch Eggs Processed Meat Snacking
Cooked fish and meat snacking
Protein pot
Cured Meat snacking
Biltong + Jerky
Processed Fish Snacking
Sausage Wraps
Savoury Snacks Savoury Snacks
Savoury Crackers and Biscuits
Nuts Fruit + Nut Mixtures
Popcorn
Crisps
Savoury Biscuit Bread Substitutes
Savoury Biscuits
Bread
Dairy Cheese Milk Cream
Quick meals
Breakfast cereal and porridge
Salads
Sushi
Savoury Pastries
Hot and Pork Pies
Pastry Sausage Roll
Cheese Twists
Samosa Spring Rolls
Sandwiches
Hot meals and ready meals
Pizza slice Pasta bowl Fish Meal accomp
Meat and vegetarian meal accomp
Meat and vegetarian ready meals
Meat Sub Ready Meals
Noodle bowls Rice bowls
Poultry Burgers
Eggs
Baked Potato and Chips
Soup and Instant hot snacks

An analysis of the role of price promotions on the household purchases of food and drinks high in sugar, and purchases of food and drinks for out of home consumption
Main Meals
Breakfast English breakfast
Continental breakfast
Breakfast wrap
Breakfast McMuffin
Breakfast Bagel Breakfast Muffin
Breakfast Pancakes
Indian
Chinese
British
Sausages
Pizza
Italian (non Pizza)
Pasta Lasagne
Spaghetti Bolognese
Risotto Ravioli Carbonara Other pasta
Burger
Fish including fried
Chicken including fried
Chicken Meals
Fried chicken meals
Chicken Nuggets
Popcorn chicken
Chicken Wings
Kebab
Meat-based dish Meat Steak Beef Meal Lamb Meal Mixed Grill Meat - Beef Ribs Pork Ribs
Vegetarian based meals
Vegetarian based meal
Garlic Bread Mozzarella Dippers
Other meals Meal-Other Meal-side Buffet Curry- not Indian
Rice Other Mexican Other
Afternoon Tea Chilli Con Carne
Nacho
Tapas Macaroni Cheese

56
Published December 2020
PHE gateway number: GW-596
www.gov.uk/phe
Twitter: @PHE_uk
www.facebook.com/PublicHealthEngland
© Crown copyright 2020
Prepared by: Kantar Worldpanel UK: Russell Hill, James Kirk , Cathy Capelin
For queries relating to this document, please contact: [email protected]