an analysis of use of automated tools for improving the
TRANSCRIPT

University of Northern Iowa University of Northern Iowa
UNI ScholarWorks UNI ScholarWorks
Dissertations and Theses @ UNI Student Work
2014
An analysis of use of automated tools for improving the process An analysis of use of automated tools for improving the process
of software verification and validation in a Midwestern company of software verification and validation in a Midwestern company
Darshak Dodiya University of Northern Iowa
Let us know how access to this document benefits you
Copyright ©2014 Darshak Dodiya
Follow this and additional works at: https://scholarworks.uni.edu/etd
Part of the Computer Engineering Commons
Recommended Citation Recommended Citation Dodiya, Darshak, "An analysis of use of automated tools for improving the process of software verification and validation in a Midwestern company" (2014). Dissertations and Theses @ UNI. 30. https://scholarworks.uni.edu/etd/30
This Open Access Thesis is brought to you for free and open access by the Student Work at UNI ScholarWorks. It has been accepted for inclusion in Dissertations and Theses @ UNI by an authorized administrator of UNI ScholarWorks. For more information, please contact [email protected].

AN ANALYSIS OF USE OF AUTOMATED TOOLS FOR IMPROVING THE
PROCESS OF SOFTWARE VERIFICATION AND VALIDATION IN A
MIDWESTERN COMPANY
An Abstract of a Thesis
Submitted
In Partial Fulfillment
Of the Requirements for the Degree
Master of Science
Darshak Dodiya
University of Northern Iowa
May 2014

ABSTRACT
As the use of electronics and software in the modern off road vehicles
tend to increase, there is a huge challenge of getting the electronics and software
tested before making it available for customer use. There are a lot of interactions
between the hardware and software for the vehicle to function. And with the
amount of interactions in the hardware and software come a lot of problems in
verifying the functionality of the vehicle. If proper verification is neglected, the
customer might end up getting an unsafe vehicle which can lead to serious
consequences. To make these vehicles safe and more efficient, major
manufacturers are using vehicle simulators where the test engineers can perform
numerous automated and manual tests.
Once these tests are executed, the reports are gathered for further
analysis of the faults occurred at various stages of testing. The analysis is further
used to find the root cause of the failure to prevent it from reoccurring before the
new product is passed for production. This study investigates the amount of time
consumed on results reporting processes involved in the overall analysis of test
results in a heavy off road vehicle manufacturing company in Midwest. The
experiment and recommended improvements in this study will help make the
company’s process of results reporting more efficient and effective. In the end of
this study conclusion and some recommendations for further studies are
discussed to efficiently utilize resources in software verification and validation
process of this Midwestern Company.

AN ANALYSIS OF USE OF AUTOMATED TOOLS FOR IMPROVING THE
PROCESS OF SOFTWARE VERIFICATION AND VALIDATION IN A
MIDWESTERN COMPANY
A Thesis
Submitted
In Partial Fulfillment
Of the Requirements for the Degree
Master of Science
Darshak Dodiya
University of Northern Iowa
May 2014

ii
This Study by: Darshak Dodiya
Entitled: AN ANALYSIS OF USE OF AUTOMATED TOOLS FOR IMPROVING THE PROCESS OF SOFTWARE VERIFICATION AND VALIDATION IN A MIDWESTERN COMPANY
has been approved as meeting the thesis requirement for the
Degree of Master of Science - Industrial Technology
____________ ________________________________________________
Date Dr. Ali Kashef, Chair, Thesis Committee
____________ ________________________________________________
Date Dr. Julie Zhang, Thesis Committee Member
____________ ________________________________________________
Date Dr. Atul Mitra, Thesis Committee Member
____________ ________________________________________________
Date Dr. Michael J. Licari, Dean, Graduate College

iii
DEDICATION
I would like to dedicate this work to my mother Late Smt. Kundanben L.
Dodiya, who will be part of my life forever. Whatever I have achieved today is
because of her immovable faith in me. She always provided the best of
everything I asked for. Her great desire to provide her kids with the best possible
education is still one of the biggest driving factors of my career. Her positive
thinking, giving the best in whatever she did and always setting high standards
won her great respect among everyone who knew her.
She never sighed away from criticizing me and along the way also
encouraged me to take the right steps. She was also not afraid to take harshest
of decisions which she thought was right for family. She was by far the strongest
woman I have ever known. She came out of all hard times much stronger than
before and taught me the same. Being a school Principal, she always thought
about her students as if she would think about her kids and her school was like a
second family to her. She taught me to be patient and injected the belief of
choosing the right path no matter how hard it may look.
I will miss her throughout my life and firmly believe that she is feeling very
proud while watching me from the heavens……..

iv
ACKNOWLEDGEMENTS
I would like to thank all the people who helped me complete this thesis
directly or indirectly. First and foremost, I would like to thank Almighty for
providing me with the courage and determination to complete my higher
education.
Next, I would like to thank my family. Specially my wife Vandana, the
strongest pillar of my life without whom nothing would have been possible. Her
unconditional love, support and belief keeps me going through toughest phases.
Not to mention my two lovely daughters Vipsa and Diva who are responsible for
injecting fresh energy every time I am feeling tired. Also to my father
Lakshmanbhai Dodiya, who continues to be great support I can rely on. Big
thanks to my brother-in-law Dharmesh K. Makwana and sister-in-law Saritha D.
Makwana for being there through thick and thin.
I could not have been able to complete this thesis without the expert
advice and support from my thesis committee members Dr. Ali Kashef (also my
advisor), Dr. Atul Mitra and Dr. Julie Zhang. They have been there to help me on
short notices and always given their best advice to complete the study.
A special thank you to Mr. Mark J. Klocke, Manager- Electronics PV&V
and Mr. Albert R. Oberneder, Software Test Supervisor - PV&V for
understanding and supporting at work so that I can complete my studies. Also to

v
my colleague, Ryan Hanson for helping and guiding me in developing the
prototype tool used in this thesis.

vi
TABLE OF CONTENTS
PAGE
LIST OF TABLES ............................................................................................... viii
LIST OF FIGURES ............................................................................................... ix
CHAPTER I: INTRODUCTION ........................................................................... 1
Statement of the Problem ................................................................................ 3
Purpose of the Study ....................................................................................... 3
Need of the Study ............................................................................................ 4
Research Questions ........................................................................................ 5
Assumptions .................................................................................................... 5
Limitations ....................................................................................................... 6
Definition of Terms .......................................................................................... 6
Outline of Procedure ....................................................................................... 8
CHAPTER II: LITERATURE REVIEW .................................................................. 9
CHAPTER III: METHODOLOGY ........................................................................ 23
Electronics PV&V Process ....................................................................... … 23
Current Results Reporting Process ............................................................... 26
Hardware in Loop Simulaton ......................................................................... 28
Test Automation Language: TL ..................................................................... 30
TL Scripts ...................................................................................................... 32
TL Macros .................................................................................................... 33
Test Case Data Generation Tool ................................................................... 34
Folder Structure ............................................................................................. 36
The Experiment Setup .................................................................................. 39

vii
The Experimental Procedure ......................................................................... 41
CHAPTER IV: FINDINGS AND DISCUSSION ................................................... 43
Results and Discussion ................................................................................. 43
Before Implementation of Prototype Tool ...................................................... 44
After Implementation of Prototype Tool ......................................................... 47
Hypothesis Testing ........................................................................................ 53
CHAPTER V: SUMMARY, CONCLUSION AND RECOMMENDATIONS .......... 56
Summary ....................................................................................................... 56
Answers to Research Questions ................................................................... 58
Conclusion .................................................................................................... 60
Recommendations for Further Studies .......................................................... 61
REFERENCES ................................................................................................... 62

viii
LIST OF TABLES
TABLE PAGE
1 Time taken to search each report before Implementing the tool ................................................................ 44
2 Calculated Averages of current search method ......................... 46
3 Generalized numbers for the population .................................... 47
4 Time taken to search results after implementing the tool .......... 47
5 Calculated averages after implementing the tool ....................... 50
6 Generalized numbers after implementing the tool ..................... 51

ix
LIST OF FIGURES
FIGURE PAGE
1 A simple model of embedded system ........................................ 10
2 Embedded software size and deployment ................................. 11
3 Complexity growth of embedded systems ................................. 12
4 A typical software development process ................................... 13
5 A simple testing process ........................................................... 16
6 The cost of test maintenance is related to the cost of test implementation .......................................................................... 20
7 Electronics PV&V process ......................................................... 25
8 Test results reporting process ................................................... 27
9 HIL system under investigation .................................................. 29
10 A block diagram of test automation language ............................ 30
11 Sample TL Script ....................................................................... 33
12 Modified Excel file ...................................................................... 35
13 Test case generation tool .......................................................... 36
14 Sample auto generated test case Excel document .................... 36
15 Folder Structure on Simulator hard drive ................................... 37
16 A sample report generated at the end of script execution ......... 38
17 A screen shot of Reports folder ................................................. 39
18 Sample output generated after executing the prototype tool ..... 41
19 Chart displaying the trend in searching results before the implementation of automated results reporting tool
prototype ................................................................................... 45

x
20 Chart displaying the trend in searching results after the implementation of automated results
reporting tool.............................................................................. 49
21 A broken down view of time taken to search results before and after implementing reporting tool for each script ................ 52 .
22 Two sample t-test output from Minitab ....................................... 55

1
CHAPTER I
INTRODUCTION
Electronics and software has become an integral part of our everyday life.
Be it a laptop, a tiny music player or large vehicles. Whether one is aware of not,
software is controlling our life in one way or the other. Every vehicle today is
being controlled by some kind of software under the hood. More and more
manufacturers are relying on embedded software for either the basic functionality
or making thousands of decisions in a split second. Developing and relying on
these highly complex software systems to perform such tasks requires the
manufacturers to test these systems thoroughly.
In the process of developing such complex systems, lots of important
engineering and management challenges are raised. This complexity gives rise
to many problems to the manufacturers. One of them, developing and integrating
embedded software in large vehicles is an expensive venture. A lot of investment
is required to acquire technological and human resources. The other, which the
author considers the most important, is that many projects are completed with
defects to be fixed. Most of them are after the delivery and in the field, which
results in poor quality products further customer dissatisfaction. Organizations
are struggling for the challenge of integrating, verifying and managing a massive
array of test results from number of various sources. In case of short-term
difficulty, software managers attach more resources and engineers but at very

2
high cost and with limited effectiveness. Frequently they still cease delivering
releases of software with compromised quality and rather late.
The growing complicacy of embedded software development demanded a
new more scalable and reliable testing approach that is efficient and effective.
Companies developing embedded software for their products saw a need to
scrap slower testing practices and put into effect automated software verification
in order to detect and prevent more possible defects sooner and quicker.
The Electronics Product Verification and Validation (PV&V) department at
one off road vehicle manufacturing company develops and executes embedded
software test procedures for the entire fleet of large complex vehicle systems as
per the requirement specifications. Test Engineers create all the possible test
cases and execute those tests on the various types of simulators either manually
or utilizing automated scripts. The test results are stored in local hard drives of
the number of Model-in-loop (MIL), hardware-in-loop (HIL) and software-in-loop
(SIL) simulators. Further, the test results are collected from each simulator and
analyzed for defects. There are few HIL simulators, but the software and model
based simulators can be installed by every test engineer in the company. The
amount of test results generated in each simulator is enormous. To collect result
data from these SIL and MIL simulators becomes very difficult, especially when a
single test procedure is executed multiple times on the same computer for
multiple days. This in turn consumes large amount of precious engineering time

3
and resources. An improved process will improve the efficiency of engineers and
PV&V process as a whole.
Statement of The Problem
As the amount of test procedure results generated from various software-
in-loop, hardware-in-loop, model-in-loop and manual simulators increase, the
amount of time taken to perform product verification and validation process
increases. As a result there are cost overheads and delays in reporting issues
which further delay product development process.
Purpose of The Study
More and more manufacturers are using hardware, software and model
based simulators for testing their embedded software products before the final
production. With the increasing amount of testing performed on the simulators of
various types, a huge amount of test results is generated at the end of each
execution of test procedure. Collecting and organizing these test results data
creates some unwanted overhead for the companies in the form of engineering
costs. Although it seems to be a very small part of the complete PV&V process in
the company, its cost cannot be underestimated.
This study investigates the result reporting where the PV&V process can
be improved for efficiency so as to reduce engineering costs. This study also
investigates amount of time consumed and in the process by an engineer on
gathering test results, organize them and present them in a reportable format.
Various simulators were investigated to determine the amount of reports they

4
generate in a period of time. Many benefits will be earned from improving the
process of reviewing results. It will increase the efficiency of engineers by
reducing the amount of time they spend finding reports. Reducing the amount of
time taken just to collect and organize the results reports from the simulators will
make the PV&V process much leaner, efficient and save engineering costs.
Need of The Study
With the influx of automated and manual tests from various simulators, the
amount of test results increase manifold. Navigating to the destination folder
containing large numbers of subfolders is tedious and laborious. Finding the right
report from the folder becomes a challenge if the same tests are performed more
than once in a short amount of time. Once the report is displayed on the screen,
it becomes challenging to find the test parameter values from a stack of test case
results. Since each test case is executed by the same automated script for that
particular function, it again adds similar amount of test results to the storage
location. Printing that report is another problem all together. Since the amount of
pages in each report is very large, it ends up creating huge paper wastes once
they are used. The overall process thereby wastes a considerable amount of
engineering time and costs.
Executing tests on the same simulator machines, utilizes its storage disks
to its maximum capacity. Storing the reports ends up creating storage issues on
the local hard drive of the machines. Searching for reports in the simulator
machines can be performed either physically at the locations or by sharing the

5
root directory of the system. Sharing the storage disk drives makes critical and
confidential data open to other unwanted entities thereby compromising the
security of the company assets on the network.
Research Questions
In this thesis, we will discuss the following research questions related to
the process of Product Verification and Validation.
1. Will implementing the recommended reporting process changes improve
the complete process of PV&V?
2. How much average time does an engineer consumes on results reporting
process before and after the implementation of the proposed
improvement?
3. How do the recommended improvements improve the security of the
testing assets?
4. Finally, how much time and engineering costs the company would save if
the recommended improvements are implemented?
Assumptions
A central test reporting tool called ACRS (Automated Central Reporting
System) will be developed to be integrated into possibly HIL, SIL or MIL test
environments. The following assumptions are made:
1. Fatigue factor of Test Engineers is not affecting their ability of
searching results.
2. All the Engineers utilize similar search methods.

6
3. The location of test result storage is consistent across all the
simulators.
4. All the Engineers of similar grade level are paid equally.
5. All the Engineers utilize the test assets similarly.
Limitations
The following limitations are applied to the PV&V results reporting process
improvement and study:
1. Limited experience with C# or PERL scripting language might lead to
some bugs in the experimental tool.
2. Limited experience with National Instruments Labview and TestStand
tools.
3. The tool might not be able to execute outside of the organization’s
network.
4. Matlab to be linked with c# and PERL libraries is a limitation to perform
the experiment on model based simulators.
Definition of Terms
PV&V: Product Verification and Validation; process to verify and validate a
product before sent to production.
Verification: Is the product doing as per the specifications?
Validation: Is the product doing what users want it to do?
ECU: Microprocessor based Electronic Control Unit

7
Simulator: Portable hardware, software or model based system which mimics
the real product.
IT4: Interim Tier 4, an EPA emissions standard.
FT4: Final Tier 4, EPA emissions standard which should be implemented
by 2017
HIL: Hardware-in-Loop, a technique used for developing and testing
embedded software by electrically simulating components like
sensors and actuators.
SIL: Software-in-Loop, another technique for testing embedded software
by using software to simulate components of an electronic system.
MIL: Model-in-Loop, use of simulated product models to test.
NI: National Instruments, automated test equipment manufacturer.
Labview: NI programming environment used to develop measurement, test
and control systems.
Bug/Defect: A deficiency in the functioning of software
Stakeholders: A person or group that has interest in a project.
TL: Test language used to automate HIL and SIL tests.
I/O: Input and output to any system.
TLA: Three Letter Acronym to identity each application controller.
TestStand: Automation tool from National Instruments.

8
Outline of Procedure
The following procedure will be followed during the study:
1. Initial investigation into the current PV&V process and in particular test
results reporting process.
2. Identify and investigate simulators used by the engineers to perform
test.
3. Collect data for amount of time spent on reporting process.
4. Collect data for storage space used over a particular period of time.
5. Design, Develop and implement an automated tool prototype on
possibly one of the simulators.
6. Collect the new data for amount of time spent on reporting process
after the implementation of tool.
7. Perform Hypothesis testing on the pre and post experiment data to get
the conclusions.
8. Suggest future work.

9
CHAPTER II
LITERATURE REVIEW
In the last two to three decades, embedded software has infiltrated more
and more products, which are traditionally results of mechanical and electrical
disciplines. Be it a cell phone, home appliance or a satellite. They all are
functioning and in most cases relying heavily on the underlying software to keep
them going. There is hardly anything today which doesn’t have some piece of
software in it. Automotive industry has not been left behind as well. It has
innovated along with other products in leaps and bounds in terms of software and
electronics. So much is the increase in use of software and electronics in
automotive that today the manufacturers of automotive products or vehicles are
facing the challenge of finding a balance between production costs and
maintaining reliability, quality and safety or their products.
Noergaard explains embedded systems model as the one which has at
least one layer (hardware) or all layers(Application, system and hardware layers)
in to which all the components fall. The hardware layer contains all the major
physical components located on the embedded board whereas the system and
application layers contain all software located on and being processed by the
embedded system. (Noergaard, 2005, p.12). Figure 1 below represents a typical
embedded systems model.

10
Figure 1: A simple model of embedded system.(Noergaard, 2005)
Capers Jones, an American specialist in software engineering
methodologies and Christof Ebert, a German computer scientist and
entrepreneur point out some of the very interesting facts in their research paper
“Embedded Software: Facts and Figures.” In economic terms, the worldwide
market for embedded systems is about 160 billion euros, with an annual growth
of 9 percent. In terms of engineering, the volume of embedded software is
increasing at 10 to 20 percent depending on the domain and embedded
microprocessors account for more than 98 percent of all produced
microprocessors. Figure 2 below shows the amount of systems using embedded
software per year and the size of the deployed software programs for each of
such domains. It clearly shows the upward trend in terms of automotive software
which is the focus of this study. (Ebert & Jones, 2009)

11
Figure 2: Embedded software size and deployment (Ebert & Jones, 2009)
With the increase in amount of software in these systems its complexity
increases considerably. Graph presented in Figure 3, explains such facts about
the trend of the complexity of software in various domains. It’s the complexity of
the automotive software which creates the most fascinating scenario. The
increase of complexity further increases the amount of defects in each system.
Thereby a considerable increase in chance of having a vehicle with various
critical software defects on the field or on the road. Therefore, it becomes very
important to verify that systems are established properly to prevent any
catastrophic fatalities. Ebert and Jones observed that new cars for instance have
around 20 to 70 ECUs with close to 1 Giga Byte of software in a premium car.

12
Figure 3: Complexity growth of embedded systems (Ebert & Jones, 2009)
Although model based, Figure 4 shows a typical development process.
Dae-Hyun Kum, Joonwoo Son, Seon-bong Lee and Ivan Wilson describe this
complete process of developing software for automotive applications effectively.
According to their report published in 2006 titled “Automated Testing for
Automotive Embedded Systems”:
Development is started with requirement capturing and analysis. The success of any product development is depending on the creation of clear, complete and unambiguous requirements. Functional model should be created according to the requirement capturing document. The vehicle electronic system is too large to be addressed at a time. So it is often broken down according to the functional groups. Once the main sub-system has been identified, it is ensured that signals for input and output of the system are clearly defined.
Virtual prototype of functional model enables us to test and validate the software functionality without hardware in the early stage. When behavior model is released, ECU software development and network system development are started at the same time. Once the system

13
design and ECU design have been validated on virtual environment, the designs should be moved into the implementation phase.
Finally all source codes including generated application code, I/0 drivers, communication kernel and operating system code are integrated. After test execution, the test results should be analyzed to unveil the error that caused a test to fail and discovered errors are needed to be fixed. Test results and related information should be documented throughout all test processes. (Kum, Son, Lee & Wilson, 2006, p. 4415)
Figure 4: A typical software development process (Kum et al., 2006)
Failures and poor quality in embedded software can sometimes cause
death or serious injury. As a result, devices like passenger vehicles and medical
instruments have serious liability problems. Therefore highest quality control and
testing practices are required in basically all of the domains of software
development. NASA’s annual report on Independent Verification and Validation

14
in 2006 pointed out that today, the percentage of software rework can approach
50% for large software projects (NASA, 2006). This has led the manufacturers to
look at various practices which help improve quality and reduce costs. One such
process is Verification and Validation (V&V), which involves rigorous testing of
the product at various stages of its development.
“The correctness of embedded software functionality and performance
plays a decisive role in the software quality, software testing is an important
mean of software quality assurance.”(Qian & Zheng, 2009)
McDonald, Murray, Lindsay and Strooper developed a pilot project for
testing embedded software. Stessing on application that are very critical for
safety of humans, they suggest to follow a Systematic testing approach. They
decribe systematic testing as testing which is “planned, to permit design for
testability; documented, so that the test cases can be understood and the
adequacy of the test cases can be evaluated (for example, by external auditors
or by measuring coverage of the software tested); and repeatable, so that the
test cases can be re-executed after changes in the software.” (McDonald et al.,
2006),
Verification and validation are means by which the product is checked or
tested, and by which its performance is demonstrated and assured to be a
correct interpretation of the requirements. A continuous process of V&V must be
actively applied throughout the software development cycle. (International Atomic
Energy Agency, 1999)

15
“In general terms, verification is a quality control process that is used to
evaluate whether or not a product, service, or system complies with regulations,
specifications, or conditions imposed at the start of a development phase.
Validation, on the other hand, is a quality assurance process of establishing
evidence that provides a high degree of assurance that a product, service, or
system accomplishes its intended use requirements.” (Maropaulos & Ceglarek,
2010)
Thomas Berling, of Ericsson Microwave Systems AB in Sweden, points
out a different thought about verification and validation. According to him, there is
a lack, in industry and in the software research community, of efficient and
effective system performance validation methods. This is an important area since
the cost of system performance validation often is high. The currently used
methods in industry are of the engineering type, which means the engineers use
the methods they find most appropriate. (Berling, 2003)
Keränen and Räty discuss about Model Based testing in HIL prototoype in
their research paper “Model based testing of embedded systems in hardware in
the loop environment.” They found that “the enhancement of test automation in
HIL environments by using model-based test design and generation relieves
manual testing and debugging tasks, which also induces cost savings.” (Keränen
& Räty, 2012)
16
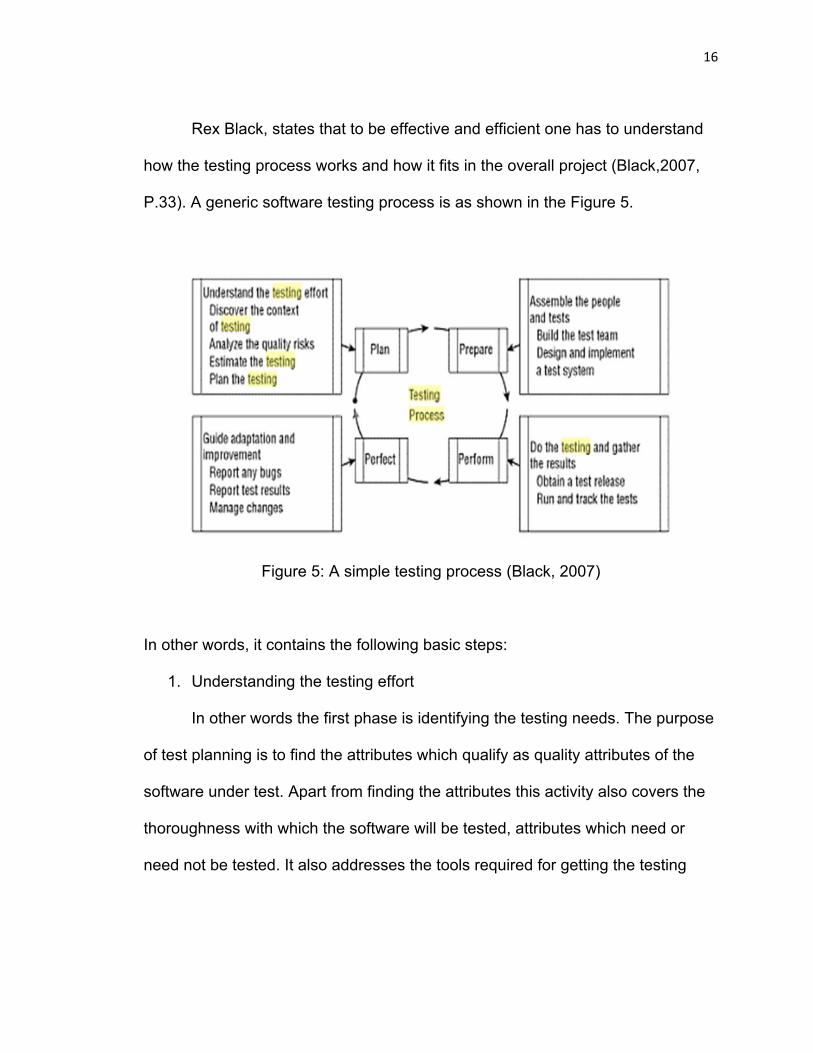
Rex Black, states that to be effective and efficient one has to understand
how the testing process works and how it fits in the overall project (Black,2007,
P.33). A generic software testing process is as shown in the Figure 5.
Figure 5: A simple testing process (Black, 2007)
In other words, it contains the following basic steps:
1. Understanding the testing effort
In other words the first phase is identifying the testing needs. The purpose
of test planning is to find the attributes which qualify as quality attributes of the
software under test. Apart from finding the attributes this activity also covers the
thoroughness with which the software will be tested, attributes which need or
need not be tested. It also addresses the tools required for getting the testing

17
done, manpower involved in testing and various techniques which will be applied
to get as much test coverage as possible.
2. Assemble the people and tests
After the identification of the tests to be performed, the techniques which
are selected under the first step are then applied to generate the test cases for
each attribute. This step basically translates the product design requirements into
a set of test cases after the identification of the test scenarios. This step also
involves identifying the resources required to run or execute tests and the order
in which they should be executed.
3. Testing and gathering results
Once the infrastructure and test cases are defined, the correct steps are
defined to execute each test case correctly. Each test case is finally executed
according to the defined procedure and tracked for its completion. After the
execution of test cases, the results (success or failure) are gathered from all the
resources where the tests were executed.
4. Guide adaptation and improvement
This is where the fate of the software product is decided if it is worthy of
release or needs further fixes. This step basically captures the test results which
are then communicated to the stakeholder with specific focus on the failures and
if they are termed as legitimate issues, they are tagged as defects or bugs. A
thorough analysis is performed on the performance of the software product under

18
test and decided if it can be release for customer use. Improvements are
recommended to the design and development team.
Rex Black, further provides a brief but very critical snap shot of importance
of testing. He emphasizes on testing as an investment in quality of the software
and uses Jim Campenella’s basic technique to analyze cost of quality:
Cquality = Cconformance + Cnon-conformance
Where ,
Cquality = Total cost of quality,
Cconformance = Total cost of quality assurance to build the software
Cnon-conformance= Total cost due to failure of quality assurance
He describes conformance costs as prevention which includes costs involved in
quality assurance tasks like code reviews or training for example. Planning test
activities, developing test cases and data, and executing the tests identified as
appraisal costs. Nonconformance costs are divided into two parts, one is internal
when the test failure is detected by the internal teams of either test engineers or
programmers themselves. There is always some cost associated with it. It then
enters into a find fix, and release software for further testing process.
The second nonconformance cost is external according to Rex Black. He
describes these costs as those incurred when, rather than being found internally,
the customer or the end product user finds the bug. These are the costs which

19
affect any organization the most. Apart from heavy costs involved in the fix and
release process, companies procure intangible costs like angry customer,
damage to company image, lost business and even lawsuits. (Black, 2007)
There is another aspect of testing, implementation of test automation tools
for performing efficient testing. Fewster’s article, “Common mistakes in test
automation,” highlights some of the common mistakes which organizations make
in a bid to automate testing. According to Fewster, the main disadvantage of
testing automation was costs, which include implementation costs, maintenance
costs, and training costs. Implementation costs included direct investment costs,
time, and human resources. Fewster found that if the maintenance of testing
automation is ignored, updating an entire automated test suite can cost as much,
or even more than the cost of performing all the tests manually. There is a
connection between implementation costs and maintenance costs. Figure below
implies that if the testing automation system is designed with the minimization of
maintenance costs in mind, the implementation costs increase, and vice versa.
(Fewster, 2001)
“If we are to minimize the growing test maintenance costs, it is necessary
to invest more effort up front implementing automated tests in a way that is
designed to avoid maintenance costs rather than avoid implementation
costs.”(Fewster, 2001, P.4)

20
Figure 6: The cost of test maintenance is related to the cost of test implementation (Fewster, 2001)
“Automated software testing may reduce costs and improve quality
because of more testing in less time, but it causes new costs in, for example,
implementation, maintenance, and training.” (Karhu, Repo & Smolander, 2009)
One of the other fields where reporting is considered even more critical is
the field of medical testing. Although used for different scopes, results reporting
in medical or electronics field cannot be ignored. Any error in either of the fields
can lead to potential danger to life.
“Improving newborn screening laboratory test ordering and result reporting
using health information exchange” by Downs et al., focuses on use of
electronics results reporting through health information exchange for newborn
screening. It highlights that “the problems that are seen with failure to manage
and follow-up on routine laboratory results are magnified in newborn screening
situation when negative outcomes could be triggered by incomplete reporting,

21
failure to recognize a critical result, and delays in completing the confirmatory or
referral process.” (Downs et al., 2010)
Further , the article states that “during the initial screening process
electronic data exchange helps to “close the orders loop” and make sure that all
infants are tested and that a responsible clinician has looked at the results of the
tests. For confirmatory testing, educational materials on the diagnosis and
management of rare disorders can be provided along with the results of the test.
The results of all hearing and metabolic testing can be brought together to
simplify decision-making.” (Downs et al., 2010)
Nguyen, Thorpe, Makki and Mostashari in their article “Benefits and
Barriers to Electronic Laboratory Results Reporting for Notifiable Diseases: The
New York City Department of Health and Mental Hygiene Experience” found that
electronic reporting of results and automatic uploading data improved timeliness
as well as eliminated substantial data entry needs. They found that 65% of the
43,568 hepatitis C cases and 52% of the 35,884 chlamydia cases were entered
into the health department through electronics reporting which was equal to
47,204 reports that would have been entered manually. Thereby they were able
to apply the staff resources in dedicated field work which was more important
than entering data. (Nguyen et al., 2007)
The current process seems to be implemented without thorough
investigation into the importance of results reporting of automated tests. This
study will focus on possible solution to results reporting which seems to be

22
causing the cost overruns in EL PV&V department of the organization under
study. This study will introduce few techniques for saving internal costs by
improving the process of one of the most neglected but very important area of
testing process, test results reporting.

23
CHAPTER III
METHODOLOGY
This chapter explains the methodology used for this study. The current
process of electronics PV&V is studied and a detailed observation of the process
from the time software is ready to be tested to being released for user trials is
explained. Next, the sub process of results reporting in the current PV&V process
is studied deeply and explained in detail with focus on areas which needs
improvement.
Further, the chapter discusses the basic structure of a HIL simulator under
study, Test Language (TL) which is a scripting language used for automated
testing on the HIL simulator. Test Case Data Generation tool which is used to
create possible test scenarios for a particular vehicle function is being briefly
discussed along with folder structure, sample reports generated at the end of test
execution, TL scripts and Macros. The chapter ends with a detailed explanation
of the experimental setup and procedure employed during this study.
Electronics PV&V process
Figure 7 below shows the observed process of Electronics PV&V at the
organization under study. Once the software is ready for verification and
validation, the testing activity is requested by the project expert. The activity
request is received by the PV&V assigner who further assigns the activity to
activity engineer responsible for the completion of the testing activity. Once the

24
request is received by the activity engineer, it is discussed with the requestor to
establish test requirements, formalize acceptance criteria based on the product
specification, product use database and organization information systems, and
activity deadline is confirmed.
Only when the test requirements, acceptance criteria and deadlines are
resolved and agreed upon, the next step is executed. If these items are not
resolved, further discussions are held to come to an agreeable resolution. Once
all the items are resolved, activity engineer starts developing test plan and
procedures or uses the standard template for developing plan. A test schedule
and estimation of cost is drawn for the testing activity before execution of tests
for the requested product. The complete test procedures are executed as per the
plan on various test infrastructures.

25
Figure 7: Electronics PV&V process.

26
The testing results are then compared with the acceptance criteria for
verification. If the test results meet the acceptance criteria, then the activity status
is updated with a “yes” else it is updated with a “no” and supporting results data
are attached. Once the supporting data is linked, the activity is forwarded to the
reviewer. After the reviewer has reviewed the status and supporting data, the
results are forwarded to the requester for their further action.
Current Results Reporting Process
Further focus on the test results reporting process at the organization
under study provided further insight into the problem being investigated. Figure 8
below shows the current process of results reporting before being approved or
disapproved for release. Once the test procedures are created by the developer
and test engineer, whether they will be tested manually or using automated
testing tools is decided.

27
Figure 8: Test results reporting process
Manual test procedures are either tested on the actual vehicle or on the
simulators and their results are manually updated in the results reporting Excel
file. Automated tests are divided further into two groups. The first group of tests is
the ones which can be tested using Matlab or MIL simulated models. The other
group utilizes the Test Language scripts for automating the execution which are
further executed on the HIL or SIL simulators on individual’s desk. Automated
tests executed on the HIL simulators generated reports in “.html” format and are
stored in the local hard drive of the simulator PC. The tests executed on the SIL
simulators generate reports in “.xls” format which are again stored in the local
hard drive. And since the SIL simulator is a portable software package which can

28
be installed on any individual PC, the amount of testing results generated is
exponential. Reports generated through these testing methods are further
manually searched and inserted into a common test results summary document
which is further used for making decision to either accept the features which
passed the tests or redevelop the failing features and retest the same.
This study discusses a possible solution called ACRS to organize, track
and streamline the current result reporting process. It focuses on providing a
solution to make the current process more efficient by saving engineering cost
and time. It also discusses some of the other issues related to the security of vital
information and the assets where the results are stored. It provides an
experimental tool to automate the current reporting process and analyzes the
outcome by performing hypothesis testing on the pre and post experiment data.
Hardware in Loop Simulation
The Hardware in Loop simulation system usually consists of the following
components:
A host PC (Operator Interface)
A mathematical plant model
Real time Processors and input / Outputs
Multiple Electronic Control Units (ECU)
A real time processor acts as the main component of the HIL system. It
executes most of the system components like logging of data, I/O communication

29
and model execution. This real time system is very important for a successful
testing system because it can provide accurate simulation of various pieces of
the actual system which are physically present. The Figure 9 below shows the
block diagram of a typical HIL system:
Figure 9. HIL system under investigation (Trimborn, 2005)
There are following main components which make up the HIL system:
HMI: This is the windows PC that runs either the Test System GUI or TL
Compiler/TestStand. This PC also processes and stores the result reports after
script execution.
Simulation Processing: Labview Real Time PC that runs simulations.
Control Unit: Labview Real Time PC that runs the Data Manager and controls
the I/O hardware. This is the main server that is the system backbone.

30
Test Automation Language: TL
The Figure 10 below is a block diagram of the Test Language under study
for automation of the manual tests. The intent of this language is to reduce
the amount of time taken to complete some of the laborious manual tests. It
has a set of instructions to create simulators and automation as well as
manual testing. The TL script will be compiled in a TL Compiler and compiler
will create a sequence in TestStand. Compiler used to compile this script
detects the errors of invalid commands and notifies the user after aborting the
script execution.
Figure 10. A block diagram of test automation language.
31
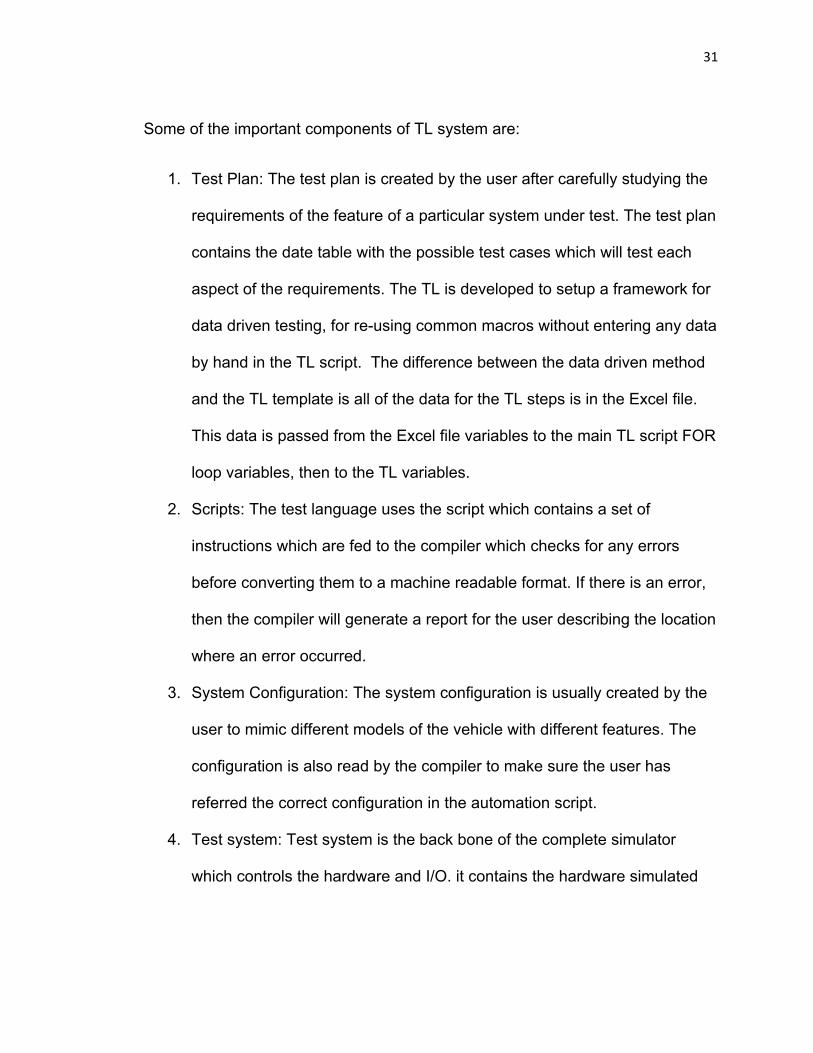
Some of the important components of TL system are:
1. Test Plan: The test plan is created by the user after carefully studying the
requirements of the feature of a particular system under test. The test plan
contains the date table with the possible test cases which will test each
aspect of the requirements. The TL is developed to setup a framework for
data driven testing, for re-using common macros without entering any data
by hand in the TL script. The difference between the data driven method
and the TL template is all of the data for the TL steps is in the Excel file.
This data is passed from the Excel file variables to the main TL script FOR
loop variables, then to the TL variables.
2. Scripts: The test language uses the script which contains a set of
instructions which are fed to the compiler which checks for any errors
before converting them to a machine readable format. If there is an error,
then the compiler will generate a report for the user describing the location
where an error occurred.
3. System Configuration: The system configuration is usually created by the
user to mimic different models of the vehicle with different features. The
configuration is also read by the compiler to make sure the user has
referred the correct configuration in the automation script.
4. Test system: Test system is the back bone of the complete simulator
which controls the hardware and I/O. it contains the hardware simulated

32
sensors and actuators. The compiled instructions are fed to this system for
execution.
5. A test report is generated in .html format at the end of each script
execution. The report contains the results as passed or failed for each
executed instruction. The test reports are stored in the local computer
running the user interface at a pre-defined location.
TL Scripts
In progress TL scripts can be located anywhere on the C:\ drive of the
windows PC. TL scripts that are working and that need to be archived need to
be placed in folder (C:\Testing\Test Scripts)
The Test_Data folder is dependencies for the archived scripts. This folder will
contain any tables that the scripts use and need to be placed in folder
(C:\Testing\Test Scripts\Test_Data).
Figure 11 below demonstrates a sample TL script used in the experiment.
It basically consists of three main components: command, operator control /
identifier and Value. Once compiled, Command instructs the real time machine to
perform a certain task on the Identifier specified in the syntax of the instruction.
Syntax format:
<Command> <IDENTIFIER> TO <VALUE> <Optional commands>
Identifier can be a “signal,” “CAN” message or any other operator control defined
by TL enterprise document.

33
Figure 11: Sample TL Script
TL Macros
Common functions which are used multiple times in a script or by different
scripts which utilize these functions are saved as Macros. These macros are
called during the main script execution to verify that certain functionality of the
software is still intact. TL macros can be placed in 3 locations:
1) C:\Projects\Lib\Macros – This location is for common macros for all

34
systems.
2) C:\Projects\Testing\Library\TL\Macros – This location is for system
specific and test macros.
3) The folder or any sub-folder of where the main TL script file is – This
location is for script specific macros.
The Teststand sequence file created from all of these macro locations will
be created the same way as the main script sequence. It is created in a sub-
folder of the sequences to be created by the compiler called Macros. The script
or macro filename should have the *.tl extension to be classified as TL script. The
name of the file could be anything unless the file is a macro file then the name
should match the macro name defined in the file.
MACRO SetTemp (tempValue)
END MACRO
For example, a file containing the above sequence of instructions must be
named “SetTemp.jdctl”
Test Case Data Generation Tool
The test case data generation tool uses the data driven testing approach.
This tool allows the user to automatically generate test cases of the requirement
from a modified Excel file. It creates the Excel file test cases automatically for
the user. With this tool the user still has to create the CTL script. The modified
Excel file in Figure 12 uses keywords (i.e. increment, formula, use all, etc.), input

35
data, and headers to generate the test cases. The input data is populated in
each column based on what the keyword is. The user interface used to run this
tool is shown in Figure 13. It allows the user to select a file path to load the
modified Excel file from and a path to save the new table to. When the tool is
executed, the output in Figure 14 will be generated.
Figure 12. Modified Excel file

36
Figure 13. Test case generation tool
Figure 14. A sample auto generated test case Excel document
Folder Structure
Figure 15 shows the folder structure which contains all of the test system
configuration files, support files, TL report files, TL library files, and TL macro
files.

37
Figure 15: Folder Structure on Simulator hard drive
The report folder is located under the “c:\Projects\Testing\.” Once the
execution of any TL script is completed, a results report is generated in “.html”
format. This report contains results (passed/fail) for each and every command in
every macro executed in the process of testing a feature. A sample report is
shown in Figure 16 below. The report is stored under the subsequence subfolder
of the main folder which contains the name of the “main” script. It can be a table
which contains a queue or list of all the feature scripts to be executed or it can be
a main script which performs subroutine calls to various macros.

38
Figure 16. A sample report generated at the end of script execution
Figure 17 below shows a snapshot of the “reports” folder containing
hundreds of reports generated after the automated script execution. The amount
of reports generated is visible in the snapshot, and since the naming conventions
are similar for most of the folders, searching a particular report becomes very
difficult. The Figure 17 shows a long list of folders with similar name but different
time stamps indicating the number of times a particular script is executed.

39
Figure 17: A screen shot of Reports folder
The Experiment Setup
An experiment was designed to test and prove the effectiveness of an
automated process for results reporting in a PV&V process. A study was
conducted to search all the software development teams. It was found that there
are 6 teams which utilize HIL simulators to test their software against limited
hardware for functional testing. One of the software development teams in the
organization which utilizes the HIL simulators for automated testing was
randomly selected. 10 automated tests were chosen randomly from the total of
approximately 151 automated TL scripts which were executed by the team for

40
testing various features of their subsystem. These automated tests were
executed by the team between the months of June 2012 to September 2013.
A simple prototype tool was designed and developed using the “PERL”
scripting language. “PERL” scripting language was used because of its following
features:
1. Perl is available for most of the platforms like Windows, UNIX, MS-DOS
and Macintosh.
2. There is no cost associated with it.
3. Perl can be acquired from many sources.
4. Easy to use instruction set compared to other programming languages.
The tool would search through a reports folder path where all the reports
generated at the end of automated script executions are stored. The tool would
look for all the files with “.html” extension under the “subsequence” subfolder of
“reports” folder. Once it finds a file with “.html” format, it further searches through
each line of the source code for that particular file and looks for all the TL
instructions. The tool then compares the results of each of the instructions found
with “Passed,” “Failed” and “Terminated” strings until it reaches the end of line. It
continues the search until it reaches end of the page. Once it reaches at the end
of page, the control exits out of that file and starts searching for next “.html” file. It
repeats the process until it is not able to find any further “.html” files.

41
Once done parsing the instructions and its associated results, the tool
would generate a spread sheet as shown in the Figure 18 below with either “.xls”
or “.csv” extension which can be further uploaded to the local company servers.
Figure 18: Sample output generated after executing the prototype tool.
Experimental Procedure
Ten automated test procedures scripted in TL were randomly selected
from a list of 151 automated test procedures used by a single team utilizing one

42
of the HIL simulators. One Engineer was selected randomly out of the six
available engineers from the selected team. The Engineer was requested to
search for exactly five reports generated for the selected automated tests from
the “Reports” folder which contained hundreds of folders and subfolders with
reports of various tests. Time taken by the engineer to search and manually
update results for each automated test was recorded from a digital stop watch.
An average of total time taken to search one report was calculated based on
calculated average time taken to search each report.
To limit human error of recording times taken for searching results, the
subject was requested to perform search at random work hours in the day like
early morning, before lunch break, after lunch break and just before end of the
working day. The different times of the day were chosen because the subject
might be in different state of mind at different times of the day to resemble
sometimes light and sometimes a little heavy work load. The number of searches
was limited to maximum of 5 searches at one time to reduce fatigue.
The prototype tool developed to automate the reporting process was then
executed on the same folder. Once the execution was complete, the excel file
generated as a result of the tool execution was provided to the Test Engineer
and requested to search for the result reports for the test procedures sample.
The time taken for the Engineer to search the results was then recorded and
average time was calculated. The calculated mean was then used to perform
Hypothesis testing to prove the effectiveness of new process.

43
CHAPTER IV
FINDINGS AND DISCUSSION
Results and Discussion
To validate the proposed automated results reporting in the process of
PV&V at the organization of study, two series of experiments were conducted on
10 randomly selected automated test scripts. The sample of 10 scripts was
collected using Random sampling method. All the scripts were numbered from 1
to 151. The “RANDBETWEEN” function of Excel spread sheet software was
used to determine 10 random numbers between 1 and 151. The 10 scripts
associated with the numbers were selected as sample.
In the first series of experiment, the Test Engineer was requested to
search for exactly five reports generated for the selected automated tests from
the “Reports” folder containing reports of various tests. The Engineer was asked
to search the results at random times of working hours like early in the morning
straight after the Engineer arrived at work, right before lunch, straight after lunch,
right before end of the working hours and randomly in the middle of other work.
Time taken by the engineer to search and manually update results for each
automated test was recorded. In the second series, the prototyped tool was
executed and the Test Engineer was requested to search for the same result
reports from the newly generated spread sheet.

44
Before Implementing the Prototype Tool
Table 1 below shows the amount of time in “seconds,” the Test Engineer
took to search five result reports for each of the script. For example, to search
five result reports for the “Reverser_Verification” script took 117, 81, 53, 110 and
91 seconds respectively. The average time calculated to search one result report
for this script came out to be 90.4 seconds.
Table 1: Time taken to search each report before implementing the tool.
Figure 19 below shows the data from Table 1 in graphical format. It
suggests that variation from the amount of time taken to search results is large,
the time taken is not consistent. There is no trend which can predict the amount
of time it will take to search the next result.

45
Figure 19: Chart displaying the trend in searching results before the
implementation of automated results reporting tool prototype
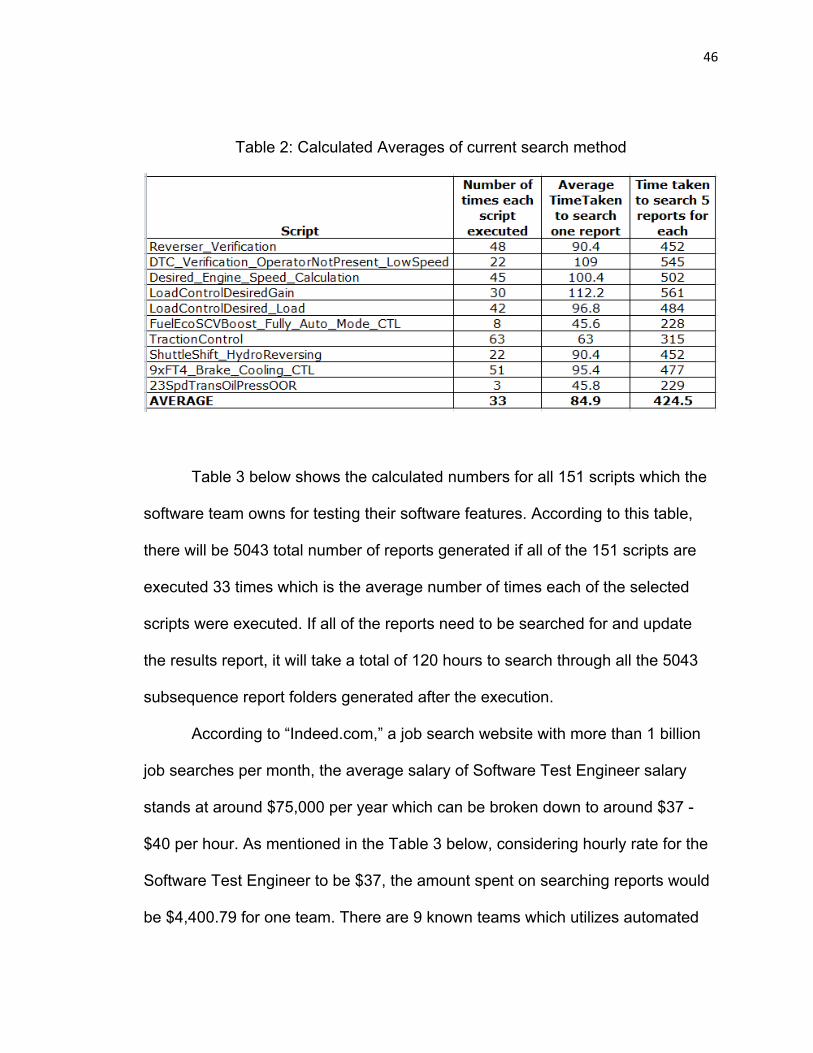
As shown in the Table 2 below, each test script was executed many times
at different dates between the month of February 2012 and December 2012 (10
months). Out of the total number of times the script was executed, the Test
Engineer was asked to search only five reports of each automated scripts. For
example, the “Reverser_Verification” script was executed 48 different times
during the period. Average number of times each script was executed is rounded
up to 33. Also, average time taken to search each report was calculated based
on the data from the Table for each script was 84.9 seconds.
46
Table 2: Calculated Averages of current search method
Table 3 below shows the calculated numbers for all 151 scripts which the
software team owns for testing their software features. According to this table,
there will be 5043 total number of reports generated if all of the 151 scripts are
executed 33 times which is the average number of times each of the selected
scripts were executed. If all of the reports need to be searched for and update
the results report, it will take a total of 120 hours to search through all the 5043
subsequence report folders generated after the execution.
According to “Indeed.com,” a job search website with more than 1 billion
job searches per month, the average salary of Software Test Engineer salary
stands at around $75,000 per year which can be broken down to around $37 -
$40 per hour. As mentioned in the Table 3 below, considering hourly rate for the
Software Test Engineer to be $37, the amount spent on searching reports would
be $4,400.79 for one team. There are 9 known teams which utilizes automated

47
test procedures to test their software. Thereby, the organization under study
ends up spending close to $39,607.08 in just searching and organizing the result
reports. (Software Test Engineer Salary, 2013)
Table 3: Generalized numbers for the population
After Implementing the Prototype Tool
Table 4 below shows the amount of time taken after implementing the
prototype tool for searching results. As displayed in the table, the amount of time
taken to search each report has dropped significantly.
Table 4: Time taken to search results after implementing the tool.

48
A line chart is developed in Figure 21 using the data from the Table 4 to
investigate a trend in the time taken for each search. As seen in Figure 18 below,
the amount of time taken to search the first result of each script is higher than the
time taken to search the next 4 results for the same script. This is because of the
initial time taken by the Engineer to filter the results by the name of the script.
Once the results are filtered, the time taken to search the next result for the same
script is very less because all the results for that script are populated in the
spreadsheet therefore there is no need to manually search the reports folder
again.

49
Figure 20: Chart displaying the trend in searching results after the
implementation of automated results reporting tool.
Table 5 below shows the calculated averages for time taken to search
results report for each script after the implementation the prototype tool. Out of
the total number of times the script was executed, the Engineer was again asked
to search only five results for sampled automated scripts. Taking the example of
“Reverser_Verification” script again, this was executed 48 different times in all.
Average number of times each script executed is same as before which is 33.
Also, average time taken to search each report was calculated based on the data
from the table 4 for each script is 11.64 seconds which is significantly less than
the average time before implementing the tool.

50
Table 5: Calculated averages after implementing the tool.
When generalizing the averages found in Table 5, there is a clear
difference in numbers when compared with the generalized numbers calculated
before the implementation of the tool. Table 6 below shows that the total time
taken in hours is reduced to 16 hours. Again, assuming $37 per hour as
minimum salary for a Test Engineer, amount spent for 16 hours would be
$583.66. For 9 teams utilizing automated scripts, the organization would end up
spending $5252.95, which is significantly less than amount spent before
implementing the tool.

51
Table 6: Generalized numbers after implementing the tool.
Figure 21 below paints a clear picture of the difference between the
amounts of time taken to search results for each sample TL script. The amount of
time taken to search results for each script is significantly lower after
implementing the reporting tool. Not only the amount of time taken is less
compared to current reporting process, it also has an expected consistency.

52
Figure 21: A broken down view of time taken to search results before and after implementing reporting tool for each script.

53
Hypothesis Testing
To prove that the results reporting process after the implementation of the
prototype tool takes less time than the calculated average time of the current
process, a hypothesis testing was performed. The mean time taken to search
results report for each script by current process is 84.90 seconds. The Null
Hypothesis was developed assuming that there is no difference in the mean time
before and after the implementation of new tool with a confidence level of 95%
and margin of error (α) of 0.05.
For this test, the Null Hypothesis: H0 is that there is no difference between
the mean time taken to search results report for a particular script before and
after the implementation of prototype tool.
µBefore = µAfter
The Alternate Hypothesis: HA is that the mean time taken to search results
report for a particular script after the implementation of the prototype tool is less
than the amount of time taken to search before the implementation of prototype
tool.
µBefore < µAfter
Figure 22 below shows the output generated from the student version of
Minitab 16.0 statistical software used to perform two sample T-test. Two sets of
data termed as “Before” which is the average time it took for the Test Engineer to
search result report for each script and “After” which is the average time it took

54
for the Test Engineer to search results for each script after the implementation of
the experimental tool, were entered in the data sheet. A two-sample T-test was
performed using the Minitab "2-Sample t…” function with Confidence Interval set
at 95% and assuming the two sets of data have equal variances.
Looking at the output of Minitab in the Figure 22 below, there is a mean
difference of 73.64 seconds is an estimate of difference between the population
means which is significantly large. The confidence interval for the difference is
based on this estimate and the variability within the samples. We can be 95%
sure that the difference between the mean time to search results is between
56.04 and 91.24 seconds higher before the implementation of the experimental
tool than after the proposed change. The t-value for the test is 9.46 and is
associated with a very low p-value rounded off by Minitab to 0.00. Since, the p-
value is very low, we can reject the Null Hypothesis at α = 0.05 and conclude that
there is a statistically significant difference between the two means. In fact, the
time taken to search the result report for each script is much larger than the time
taken after the implementation of the prototype tool.

55
Figure 22: Two sample t-test output from Minitab

56
CHAPTER V
SUMMARY, CONCLUSION AND RECOMMENDATIONS
Summary
The research presented in this thesis laid the foundation for implementing
Automated and Centralized Reporting System (ACRS) for the organization under
study. ACRS system used a small prototype of automation tool to effectively
report and manage large amount of reports generated at the end of embedded
software testing cycle in a large off-road vehicle manufacturing organization. The
current systems in place are laborious, less effective and utilize lot of resources
thereby costing the organization a lot of money and usually get unnoticed. As
further developments happen in the field of software testing using HIL, SIL and
MIL based tools, having a common automated reporting tool would help
organizing and reporting of test results more effective and efficient.
Chapter II described the extensive background on embedded software, its
development cycle and importance of testing. It also informed the importance of
thoroughly testing embedded software intended to be used in off road vehicles.
This chapter also detailed the observed process of testing and its results
reporting at the organization under study. Although most of the organization
under study had focus on thoroughly testing the software to be used on the
vehicles and defects resolution, there is not enough attention provided to the
area of implementing common reporting systems to streamline results generated
from various types of testing tools. There are tools available on every testing

57
platform to generate reports in one form or the other, but there is no option to
convert the reports of various formats into one common and easily available
report.
Chapter III introduced the Hardware-in-loop simulation platforms also
called as HIL system and their architecture under study. This chapter mainly
focused on the methodology of the experiment which included the test
automation language called TL. It explained the complete architecture, folder
structure used, basic syntax and highlighted on the test case generation tool
which is used for automatically generate possible test cases for a feature. It
explained the functioning of the TL scripts and macros which generate “.html”
type of files for the results reports.
This chapter concluded with explaining the experimental procedure which
was performed to conduct the research. In this experiment, the Test Engineers
were asked to search results of 5 randomly selected scripts out of a total of 151
scripts available in the folder containing large amounts of reports. Time taken to
search each report was recorded for analysis. Then, a prototype tool depicting as
a new step in the results reporting process was developed using PERL scripting
language and executed on the same folder containing large amounts of reports
and the data was recorded for further analysis.
Chapter IV was mainly focused on analysis of the data collected during
the experiment. Averages were calculated from the set of data collected before

58
and after the implementation of the tool for 5 scripts. After performing the data
analysis, it was revealed that the amount spent on just searching the results from
the reports generated before implementing the prototype tool is around
$175,000.00. The amount spent to perform the same action after implementing
automated tools can be reduced to around $16,760.00 which is almost 10 times
less than the current amount being spent.
Answers to Research Questions
This section will try to answer some of the research questions which were
provided earlier:
1. Will implementing the recommended reporting process changes improve
the complete process of PV&V?
As seen from the data analysis, there is a huge potential for the
organization under study to save a lot of precious Engineering time and
cost which eventually can be saved by utilizing automated tools to improve
on results reporting process which is a very important but neglected part
of the PV&V process. The experiment performed during the study certainly
revealed the area of results reporting which is not efficient currently and
improving the way results are stored and reported can make the process
more efficient.

59
2. How much average time does an engineer consumes on results reporting
process before and after the implementation of the proposed
improvement?
According to the data analysis performed in the study, on average a
Test Engineer will spend approximately 120 hours for just searching
results. If automated tools like the ACRS are implemented, the same
Engineer will spend around 16 hours on the process which is significantly
less than number of hours spent currently.
3. How do the recommended improvements improve the security of the
testing assets?
At this point of time, all the results are stored on the local hard drive
of the simulator machines. These hard drives also contain very critical
data like vehicle configurations, simulation models and various databases
used for the functioning of the simulator. To collect the results from remote
machines, the local hard drive is shared on the network thereby making it
available to non-users of the simulator who can potentially damage the
critical files and information knowingly or unknowingly. With the
implementation of the ACRS, the results can be directly exported to the
local servers which are more secure and have dedicated maintenance
resources. Hence, only the users with proper credentials can access the
data from any location without compromising the simulators security.

60
4. How much time and engineering costs the company would save if the
recommended improvements are implemented?
According to the study performed, the current process of results
reporting cost $39,607.08 to the organization. As per the data collected
after the experiment, the total cost of results reporting only came out to
$5252.95 which is significantly less than the current costs. If the company
decides to utilize automated tools like the prototype used in the study, it
can accomplish the task of results reporting for far less than current costs.
Conclusions
This study has introduced a simple but very powerful prototype tool called
ACRS (Automated Central Reporting System) which if implemented properly can
reduce the amount of time and money spent on usually unnoticed task of
searching results from a large pool of automated test results. The research
highlighted the unnoticed area of results reporting process in the organization
which if looked closely is still not efficient, thereby making the complete process
of PV&V in the organization less efficient. The study proved that there is a lot of
room for improvement in the current results reporting process if the organization
looks to implement automated tools for reporting results from automated tests.

61
Recommendations for Further Study
With the increase in competition and economic downturn, organizations
are looking for ways to save their operating costs in any possible way without
compromising the processes which are critical to quality of the final product.
PV&V is one of the most important processes which if not performed properly,
can lead to products with defects. Defective products lead to even higher costs
for the organization in terms of warranty or repairs. Therefore it is very important
for the companies to produce quality products but keeping their development
cost down to be competitive.
This study conducted for process improvement applied to the 9 teams
which operate from one of the engineering centers of the organization in Midwest
which are responsible for developing one product. The organization
manufactures various off-road, utility vehicles and other agricultural equipment at
various locations which are not included in this study. Further studies can be
performed to search for similar processes in other units of the organization which
develop other products.
Further studies can be conducted to find other processes in the
organization which have reporting process that are inefficient and which can be
automated to make them cost effective. Therefore the potential for the company
to improve processes across all units is wider than the current study.

62
REFERENCES
Berling, T. (2003). Increasing Product Quality by Verification and Validation Improvements in an Industrial Setting. Ericsson Microwave Systems AB, Molndal, Sweden. Retrieved from http://www.lucas.lth.se/events/doc2003/031205a.pdf
Black, R. (2007). Pragmatic Software Testing: Becoming an Effective and Efficient Test Professional. Indianapolis, IN: Wiley Publishing, Inc. Downs, S., van Dyck, P., Rinaldo, P., McDonald, C., Howell, R., Zuckerman, A. & Downing, G. (2010, January). Improving newborn screening laboratory test ordering and result reporting using health information exchange. Journal Of The American Medical Informatics, 17(1), 13-18. http://dx.doi.org/10.1197/jamia.M3295 Ebert, C. & Jones, C. (2009, April). Embedded Software: Facts and Figures Retrieved from http://ieeexplore.ieee.org/stamp/stamp.jsp?tp=&arnumber=5054871
Fewster, M (2001). Common Mistakes in Test Automation. Retrieved from http://www.sqetraining.com/sites/default/files/articles/XDD2901filelistfilena me1_0.pdf International Atomic Energy Agency. (1999). Verification and Validation of Software Related To Nuclear Power Plant Instrumentation and Control. Vienna, Austria. Technical Reports Series, 384.Retrieved from http://wwwpub.iaea.org/mtcd/publications/pdf/trs384_scr.pdf Karhu, K., Repo, T., Taipale, O. & Smolander, K. (2009). Empirical Obeservations on Software Testing Automation. International Conference on Software Testing Verification and Validation. Lapperanta, Finland. PP. 201-209. Retrieved from http://ieeexplore.ieee.org/xpls/abs_all.jsp?arnumber=4815352 Keränen, J. & Räty, T. (2012, August). Model-based testing of embedded systems in hardware in the loop environment, Software IET, 6(4), 364- 376, Retrieved from http://ieeexplore.ieee.org/stamp/stamp.jsp?tp=&arnumber=6322859&isnu mber=6322849

63
Kum, D., Son, J., Lee, S. & Wilson, I. (2006). Automated Testing for Automotive Embedded Systems, SICE-ICASE, 2006. International Joint Conference, 4414-4418, 18-21 Oct. 2006 Retrieved from http://ieeexplore.ieee.org/stamp/stamp.jsp?tp=&arnumber=4108293&isnu mber=4108014 Maropoulos, P. & Ceglarek, D. (2010). Design Verification and Validation in Product Lifecycle. CIRP Annals – Manufacturing Technology, 59(2), pp 740-759 http://dx.doi.org/10.1016/j.cirp.2010.05.005 McDonald, J., Murray, L., Lindsay, P. & Strooper, P. (2006) Module testing embedded software-an industrial pilot project, Engineering of Complex Computer Systems, 233-238, Retrieved from http://ieeexplore.ieee.org/stamp/stamp.jsp?tp=&arnumber=930182&isnum ber=20120 NASA Independent Verification and Validation (2006). National Aeronautics and Space Administration., p.6 Retrieved from http://www.nasa.gov/centers/ivv/pdf/174321main_Annual_Report_06_Fina l.pdf Nguyen, T., Thorpe, L., Makki, H. & Mostashari, F. (2007, April). Benefits and Barriers to Electronic Laboratory Results Reporting for Notifiable Diseases: The New York City Department of Health and Mental Hygiene Experience. American Journal of Public Health, 97(1), S142-S145. doi: http://dx.doi.org/10.2105/AJPH.2006.098996 Noergaard, T (2005). Embedded Systems Architecture: A Comprehensive Guide for Engineers and Programmers. Burlington, MA: Elsevier Inc. Qian, H. & Zheng, C. (2009, December), An Embedded Software Testing Process Model, Computational Intelligence and Software Engineering, pp.1-5, 11-13 Retrieved from http://ieeexplore.ieee.org/stamp/stamp.jsp?tp=&arnumber=5366362&isnu mber=5362501 Software Test Engineer Salary (2013). Retrieved from http://www.indeed.com/salary/Software-Test-Engineer.html Trimborn, M. (2005, June). Developing Embedded Systems and Sensor Simulations Using FPGAs and Graphical System Design Software. RTC Magazine. Retrieved from http://www.rtcmagazine.com/articles/view/100352