an analysis of wintertime winds in washington, d.c. · an analysis of wintertime winds in ... an...
TRANSCRIPT
PNNL-15799
An Analysis of Wintertime Winds in Washington, D.C. L.K. Berg K. J. Allwine June 2006 Prepared for the U.S. Department Homeland Security Science and Technology Directorate Office of Systems Engineering and Development Rapidly Deployable Chemical Defense System for Special Events Project under a Related Services Agreement with the U.S. Department of Energy under Contract DE-AC06-76RL01830


PNNL-15799
An Analysis of Wintertime Winds in Washington, D.C. L. K. Berg K. J. Allwine May 2006 Prepared for the U.S. Department of Homeland Security Science and Technology Directorate Office of Systems Engineering and Development Rapidly Deployable Chemical Defense System for Special Events Project under a Related Services Agreement with the U.S. Department of Energy under Contract DE-AC05-76RL01830 Pacific Northwest National Laboratory Richland, Washington 99352

iii
Executive Summary
This report describes the wintertime climatology of wind speed and wind direction around the National Mall in Washington, D.C. Meteorological data for this study were collected at Ronald Reagan Washington National Airport (Reagan National), Dulles International Airport (Dulles), and a set of surface meteorological stations located on several building tops around the National Mall. We present a 5-year wintertime climatology of wind speed and wind direction measured at Reagan National and Dulles. Also included is a more detailed analysis completed for the period December 2003 through February 2004 using data gathered from stations located around the National Mall, Reagan National, and Dulles. Key findings of our study include the following: • There are systematic differences between the wind speed and wind direction observed at Reagan
National and the wind speed and wind direction measured by building top weather stations located in the National Mall. Although Dulles is located much farther from the National Mall than Reagan National, there is better agreement between the wind speed and wind direction measured at Dulles and the weather stations on the National Mall.
• When the winds are light (less than 3 ms-1 or 7 mph), there are significant differences in the wind
directions reported at the various weather stations within the National Mall. • Although the mean characteristics of the wind are similar at the various locations, significant,
short-term differences are found when the time series are compared. These differences have important implications for the dispersion of airborne contaminants.
• In support of wintertime special events in the area of the National Mall, we recommend placing
three additional surface stations to give measurements of wind speed and direction. We recommend placing one of these stations on the east bank of the Potomac River, one south of the Reflecting Pool (to better define the flow within the Mall), and a surface station near the Herbert C. Hoover Building. In addition to these surface stations, we recommend placing a wind-profiling instrument along the southern edge of the National Mall to give measurements of the wind speed and direction as a function of height.

iv
Acknowledgments This research was supported by the U.S. Department of Homeland Security, through the Science and Technology Directorate, Office of Systems Engineering and Development, Rapidly Deployable Chemical Detection Network for Special Events Program under a Related Services Agreement with the U.S. Department of Energy (DOE) under Contract DE-AC05-76RL01830. Pacific Northwest National Laboratory is operated by Battelle for the U.S. Department of Energy.

v
Contents Executive Summary ...................................................................................................................................iii Acknowledgments...................................................................................................................................... iv 1.0 Introduction ..................................................................................................................................... 1.1 2.0 General Wintertime Climate of Washington, D.C. ......................................................................... 1.1 3.0 Comparisons of Observations from Stations Around the National Mall......................................... 3.1 4.0 Time Series Analysis....................................................................................................................... 4.1 5.0 Recommendations for Additional Meteorological Instruments ...................................................... 5.1 6.0 References ....................................................................................................................................... 6.1 Appendix A - Static Stability .................................................................................................................. A.1 Appendix B - Comparison of Long-Term and Short-Term Averages .................................................... B.1 Appendix C - Wind Speed and Wind Direction Measured at the National Mall.................................... C.1 Distribution ........................................................................................................................................ Distr.1

vi
Figures 2.1 Frequency Distribution of Wind Direction Measured at Reagan National
and Dulles for the Winters of 1999-2000 through 2003-2004 ...................................................... 2.3 3.1 Aerial Photo of Washington, D.C., with Approximate Locations Marked
for Meteorological Stations at the National Academy of Sciences Building, Herbert C. Hoover Building, Forrestal Building, Navy Annex, and Hart Senate Office Building ............................................................................................................................. 3.2
4.1 Time Series of Wind Speed, Wind Direction, and Sea Level Pressure
for January 15-20, 2004, Measured at Reagan National, Dulles, NAS, FOR, and HVR.............................................................................................................................. 4.2
5.1 Recommended Locations of Additional Weather Stations and Doppler Sodar ............................ 5.2 A.1 Fraction of Observations with Stability Classes A through F at All DCNet
Stations and HSO Computed for the Winter of 2003-2004 ......................................................... A.1 B.1 Frequency Distribution of Wind Direction at Reagan National and Dulles
for the Winters of 1999-2000 through 2003-2004 and 2003 through 2004 ................................. B.1 C.1 Frequency Distribution of Wind Direction Measured at Reagan National and
at NAS, HVR, FOR, and HSO for December 2003 through February 2004 ............................... C.2 C.2 Hourly Wind Direction Measured at Reagan National Versus Wind Direction
Measured at NAS, HVR, FOR, DCM, NOA, ARB, NVY, and HSO for December 2003 through February 2004 ...................................................................................... C.3
C.3 Hourly Wind Direction Measured at Dulles Versus Wind Direction
Measured at NAS, HVR, FOR, DCM, NOA, ARB, NVY, and HSO for December 2003 through February 2004 ...................................................................................... C.3
C.4 Hourly Wind Speed Measured at Reagan National Versus Wind Speed
Measured at NAS, HVR, FOR, DCM, NOA, ARB, NVY, and HSO for December 2003 through February 2004 ...................................................................................... C.3
C.5 Hourly Wind Speed Measured at Dulles Versus Wind Speed Measured at NAS
HVR, FOR, DCM, NOA, ARB, NVY, and HSO for December 2003 through February 2004 .............................................................................................................................. C.3
C.6 Scatter Plot of Wind Direction Measured at NAS Versus Wind Direction Measured
at HVR, FOR, and HSO for December 2003 through February 2004 ......................................... C.3

vii
Tables 2.1 Climatological Conditions at Reagan National and Dulles for the Period 1971
through 2000 ................................................................................................................................. 2.2 2.2 Frequency of Each Stability Class Observed at Reagan National and Dulles for
Winters of 1999-2000 through 2003-2004.................................................................................... 2.2 3.1 Stations Used in this Report, Their Abbreviation, Longitude, and Latitude................................. 3.1 C.1 Average Wind Direction Differences Between the DCNet Stations and Reagan
National and Dulles...................................................................................................................... C.1

1.1
1.0 Introduction
This report describes the wintertime climate of Washington, D.C., where wintertime is defined as the 3-month period of December through February. The focus of this report is to document the wind speed and wind direction in and around the area of the National Mall in case an airborne release of harmful material occurs during a special event. This work augments information included in other climate reports previously published (e.g., National Climatic Data Center 2003a, 2003b) by adding additional detail gleaned from a small network of eight weather stations mounted on building tops throughout Washington, D.C. Seven of these stations are part of DCNet, a National Oceanic and Atmospheric Administration (NOAA) Air Resources Laboratory urban meteorology network (http://dcnet.atdd.noaa.gov/), that has operated since late January 2003. The eighth rooftop station is part of the National Atmospheric Release Advisory Center (NARAC; http://narac.llnl.gov/) and is operated by Lawrence Livermore National Laboratory. This report has two intended uses: 1) to provide wintertime wind climatology for pre-event planning for large events in the vicinity of the National Mall in Washington, D.C., and 2) to provide a set of recommendations for the temporary placement of additional meteorological stations in the vicinity of the National Mall to better estimate atmospheric dispersion during special events. Specifically, this report • documents a 5-year wintertime wind climatology at two surface stations close to the National Mall • determines relationships between routine observing stations and weather stations situated around
the National Mall • describes some details of the flow in and around the National Mall • examines time series data from stations around the National Mall to identify periods in which there
are differences in the observed wind speed or direction at the various meteorological stations • provides recommendations for locating additional meteorological instruments in the National Mall.
2.1
2.0 General Wintertime Climate of Washington, D.C.
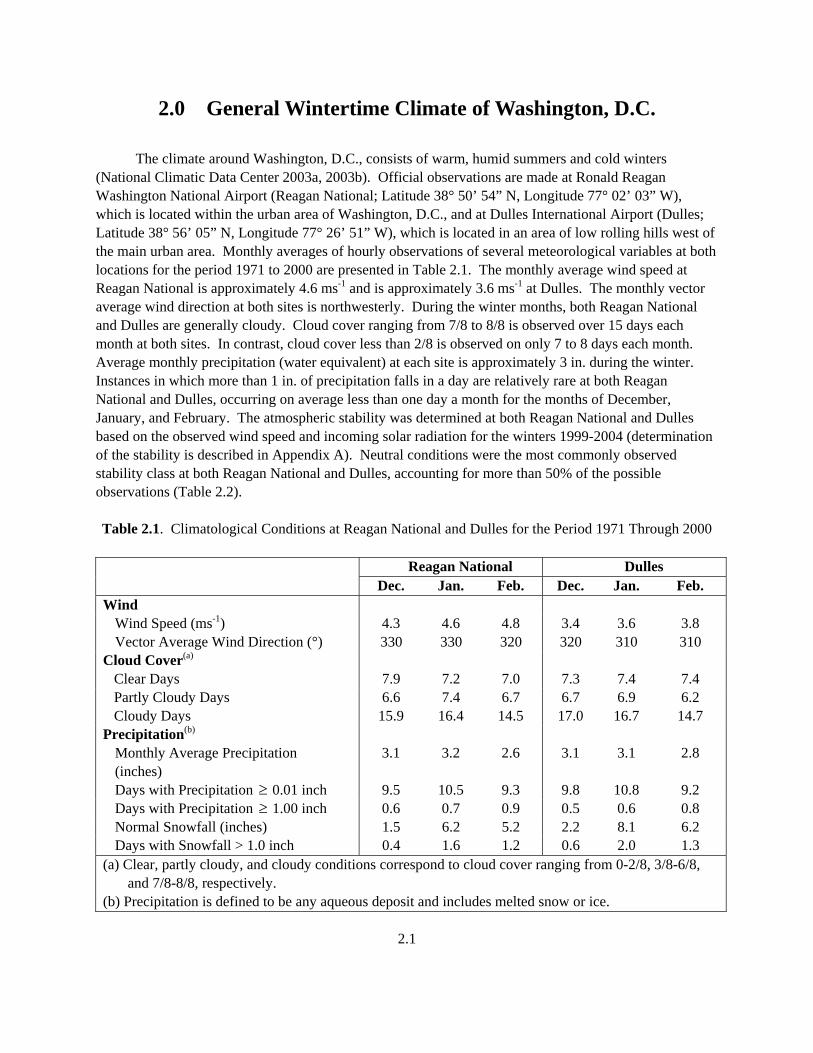
The climate around Washington, D.C., consists of warm, humid summers and cold winters (National Climatic Data Center 2003a, 2003b). Official observations are made at Ronald Reagan Washington National Airport (Reagan National; Latitude 38° 50’ 54” N, Longitude 77° 02’ 03” W), which is located within the urban area of Washington, D.C., and at Dulles International Airport (Dulles; Latitude 38° 56’ 05” N, Longitude 77° 26’ 51” W), which is located in an area of low rolling hills west of the main urban area. Monthly averages of hourly observations of several meteorological variables at both locations for the period 1971 to 2000 are presented in Table 2.1. The monthly average wind speed at Reagan National is approximately 4.6 ms-1 and is approximately 3.6 ms-1 at Dulles. The monthly vector average wind direction at both sites is northwesterly. During the winter months, both Reagan National and Dulles are generally cloudy. Cloud cover ranging from 7/8 to 8/8 is observed over 15 days each month at both sites. In contrast, cloud cover less than 2/8 is observed on only 7 to 8 days each month. Average monthly precipitation (water equivalent) at each site is approximately 3 in. during the winter. Instances in which more than 1 in. of precipitation falls in a day are relatively rare at both Reagan National and Dulles, occurring on average less than one day a month for the months of December, January, and February. The atmospheric stability was determined at both Reagan National and Dulles based on the observed wind speed and incoming solar radiation for the winters 1999-2004 (determination of the stability is described in Appendix A). Neutral conditions were the most commonly observed stability class at both Reagan National and Dulles, accounting for more than 50% of the possible observations (Table 2.2). Table 2.1. Climatological Conditions at Reagan National and Dulles for the Period 1971 Through 2000
Reagan National Dulles
Dec. Jan. Feb. Dec. Jan. Feb. Wind Wind Speed (ms-1) 4.3 4.6 4.8 3.4 3.6 3.8 Vector Average Wind Direction (°) 330 330 320 320 310 310 Cloud Cover(a) Clear Days 7.9 7.2 7.0 7.3 7.4 7.4 Partly Cloudy Days 6.6 7.4 6.7 6.7 6.9 6.2 Cloudy Days 15.9 16.4 14.5 17.0 16.7 14.7 Precipitation(b) Monthly Average Precipitation (inches)
3.1 3.2 2.6 3.1 3.1 2.8
Days with Precipitation ≥ 0.01 inch 9.5 10.5 9.3 9.8 10.8 9.2 Days with Precipitation ≥ 1.00 inch 0.6 0.7 0.9 0.5 0.6 0.8 Normal Snowfall (inches) 1.5 6.2 5.2 2.2 8.1 6.2 Days with Snowfall > 1.0 inch 0.4 1.6 1.2 0.6 2.0 1.3 (a) Clear, partly cloudy, and cloudy conditions correspond to cloud cover ranging from 0-2/8, 3/8-6/8,
and 7/8-8/8, respectively. (b) Precipitation is defined to be any aqueous deposit and includes melted snow or ice.
2.2
Table 2.2. Frequency of Each Stability Class Observed at Reagan National and Dulles for the Winters of 1999-2000 through 2003-2004
Stability(a) Reagan National
(% of observations) Dulles
(% of observations) Unstable 0 0 Moderately unstable 2 4 Weakly unstable 10 11 Neutral 67 54 Weakly stable 14 15 Strongly stable 7 13 (a) In this report, the stability classes suggested by Pasquill (1961) and Turner (1969) have
been used. A more detailed description of the stability classes can be found in Appendix A.
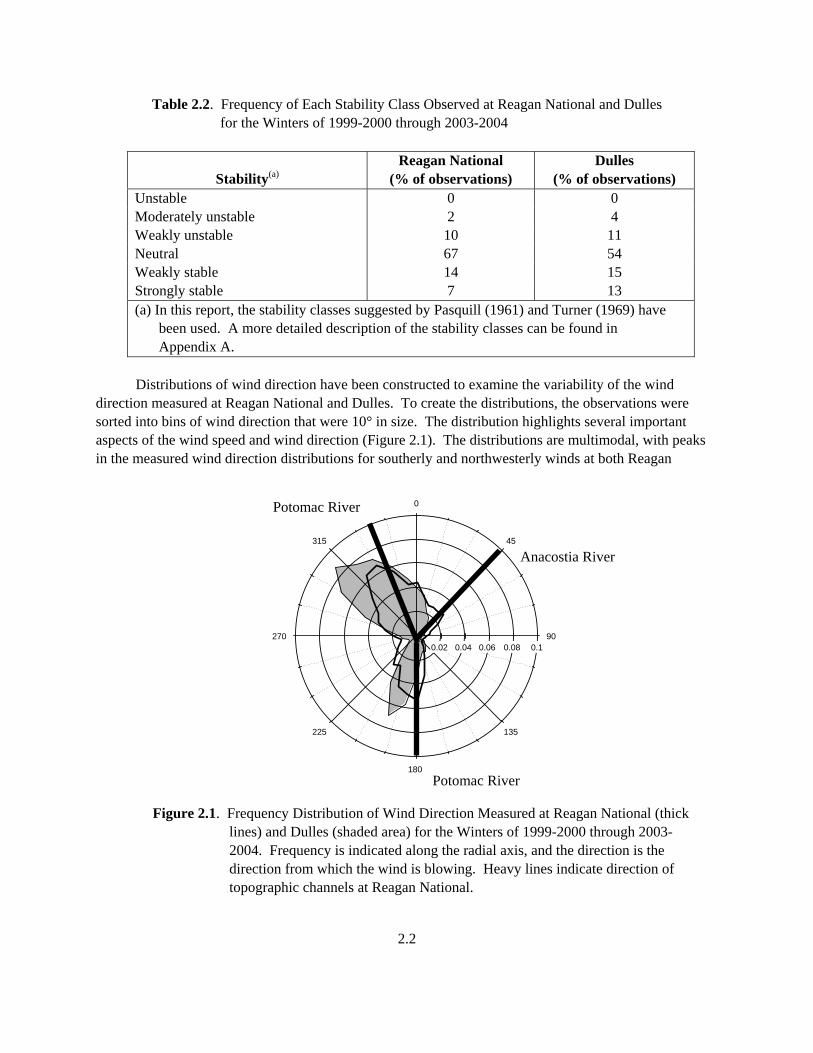
Distributions of wind direction have been constructed to examine the variability of the wind direction measured at Reagan National and Dulles. To create the distributions, the observations were sorted into bins of wind direction that were 10° in size. The distribution highlights several important aspects of the wind speed and wind direction (Figure 2.1). The distributions are multimodal, with peaks in the measured wind direction distributions for southerly and northwesterly winds at both Reagan
0.02 0.04 0.06 0.08 0.1
0
45
90
135
180
225
270
315
Figure 2.1. Frequency Distribution of Wind Direction Measured at Reagan National (thick lines) and Dulles (shaded area) for the Winters of 1999-2000 through 2003-2004. Frequency is indicated along the radial axis, and the direction is the direction from which the wind is blowing. Heavy lines indicate direction of topographic channels at Reagan National.
Potomac River
Potomac River
Anacostia River
2.3
National and Dulles. A small peak also occurs for a wind direction of 45° at Reagan National. Winds from the southeast are rare during the winter (occurring on less than 24 hourly observations in the 5 years of data). A detailed comparison of long-term and short-term averages can be found in Appendix B. Northeasterly winds are more common, and are frequently associated with rain or snow. Although the gross features of the distributions from Reagan National and Dulles are similar, there are some important differences. The southerly winds at Dulles are more westerly than at Reagan National, while the northwesterly winds at Dulles are more westerly than at Reagan National. Given the proximity of Reagan National and Dulles it is surprising to see the differences in the observed wind direction at the two locations. One reason for these differences could be channeling of the flow by the topography around the Potomac River (William Pendergrass, NOAA Atmospheric Turbulence and Diffusion Division, personal communication). Although the hills and ridges in the area are relatively small, they are apparently large enough to cause channeling. The directions of the Potomac and Anacostia Rivers relative to Reagan National are plotted in Figure 2.1. The local maximum for northeasterly winds at Reagan National could be related to flow along the Anacostia River, while the southerly winds could be channeled by the Potomac River south of Reagan National.

3.1
3.0 Comparisons of Observations from Stations around the National Mall
A new network of weather stations, called DCNet, has been installed at seven locations around Washington, D.C. DCNet is maintained by the NOAA Air Resources Laboratory (http://www.arl.noaa.gov/hls/). Three of these stations are located on the National Mall, while others are scattered throughout the suburban area around Washington, D.C. (Table 3.1). Each DCNet station consists of a sonic anemometer to measure the three-dimensional wind vector, a thermometer, and a hygrometer. Most of the stations are located on building tops. Because the DCNet did not become operational until the end of January 2003, only one full winter is available for analysis--December 2003, January 2004, and February 2004. A new DCNet station was installed at the Naval Research Laboratory in November 2004 and is not used in this report. One additional station that is operated by the National Atmospheric Release Advisory Center (NARAC), located at the Hart Senate Office Building, has also been included in this analysis. The locations of the stations are shown in Figure 3.1. The average bias between the hourly wind direction measured at Reagan National and the other surface stations on the National Mall is large, on the order of -35°. (In other words, winds measured at the stations on the National Mall are, on average, 35° more westerly than the winds measured at Reagan National, as shown in Figure 3.1.) A more detailed analysis of the wind direction bias is included in Appendix C. As described in the previous section, channeling of the wind at Reagan National by the Potomac and Anacostia Rivers is likely responsible for these observed differences. There is much better agreement between the wind direction measured at Dulles and at the other meteorological stations on the National Mall; in these cases, the average wind direction difference is only -9° (Appendix C). These results have an important implication for applications around Washington, D.C., namely that the winds measured at Dulles are more representative of the surrounding area.
Table 3.1. Stations Used in This Report, Their Abbreviation, Longitude, and Latitude. Boldface type indicates stations on the National Mall.
Station Name Abbreviation Long. (° W) Lat. (° N) Arboretum ARB 76.9688 38.9161 D.C. Municipal Building DCM 77.0325 38.9172 Forrestal Building FOR 77.0278 38.8883 Herbert C. Hoover Building HVR 77.0328 38.8935 National Academy of Sciences NAS 77.0473 38.8927 Navy Annex NVY 77.0679 38.8683 NOAA-Silver Spring NOA 77.0309 38.9924 Hart Senate Office Building HSO 77.0043 38.8929 Dulles IAD 77.4475 38.9347 Reagan National DCA 77.0342 38.8650

3.2
Figure 3.1. Aerial Photo of Washington, D.C., with Approximate Locations Marked for Meteorological Stations at the National Academy of Sciences Building (yellow), Herbert C. Hoover Building (orange), Forrestal Building (red), Navy Annex (white), and Hart Senate Office Building (blue). Mean wind vector computed for the winter of 2003-2004 at each location is indicated in the polar plot in the upper left-hand corner. The pink vectors indicate the mean wind vector at Reagan National (solid) and Dulles (broken).

4.1
4.0 Time Series Analysis A summary of the wind in and around Washington, D.C., has been presented in the preceding sections. It is desirable to determine if there is a time dependent nature to the observed winds over the National Mall, because changes in the winds can lead to shifts in the plume location. For example, is there a diurnal shift in the wind speed or direction that could be attributed to differences in surface heating or surface roughness? If such processes were important, they would be most evident during periods of relatively weak winds and quiet weather. Several periods during the winter of 2003-2004 have been identified. One example is the period from January 15-17, 2004. During this period, the surface pressure measured at Reagan National was slowly rising and winds measured at Reagan National, Dulles, National Academy of Sciences Building (NAS), Forrestal Building (FOR), and Herbert C. Hoover (HVR) were from the northwest (Figure 4.1). While there are variations in both the wind speed and wind direction
14
12
10
8
6
4
2
0
Win
d S
peed
(ms
-1)
201918171615
Win
d D
irect
ion
201918171615
Day of January 2004 (EST)
103
102
101
100
Sea
Lev
el P
ress
ure
(kP
a)
20.019.018.017.016.015.0
Reagan National Dulles NAS FOR HVR
A
B
C
E
S
W
N
E
Figure 4.1. Time Series of Wind Speed (A), Wind Direction (B), and Sea Level Pressure (C) for
January 15-20, 2004, Measured at Reagan National (red circles), Dulles (black circles), NAS (blue line), FOR (green line), and HVR (red line).
4.2
during this period, these changes do not appear to be related to the time of day. A large change does occur on January 17, but this change is associated with the passage of a warm front. Other cases were examined, but no cases during the winter of 2003-2004 were identified in which there were diurnal shifts in the wind speed or wind direction that might be associated with surface forcing. The importance of the temporal variability of the wind speed and wind direction for applications involving the dispersion of airborne pollutants is highlighted in Figure 4.1. Changes in the wind speed and/or wind direction can lead to significantly different plume locations. Shifting winds would indicate that a much larger area should be evacuated. If a release were to occur at 12:00 EST on January 17, the initial travel of the pollutants would be towards the southwest, if the winds at Reagan National or Dulles were used to predict the transport. However, if the winds at NAS, FOR, or HVR were used, the initial dispersion would be towards the southeast. If the release occurred earlier, at 12:00 EST January 16, the winds measured at Reagan National indicate the pollutant would move to the south, while the winds at Dulles, NAS, FOR, or HVR indicate that the pollutant would move to the southeast. Thus, while the mean statistics indicate that the winds measured at Dulles and the DCNet stations are similar, there are instances in which the measured wind directions and wind speeds are very different. These large differences could have critical implications for dispersion applications, including the areas that should be evacuated, and identifying areas that are likely safe.

5.1
5.0 Recommendations for Additional Meteorological Instruments We found the wind speed and wind direction measured at Dulles is more representative of the winds measured by building top stations located around the National Mall than the wind speed and direction measured at Reagan National. A dominant feature in the wind patterns documented in this report is the likely channeling of the flow along the Potomac and Anacostia Rivers. We feel that the wind direction differences measured between the station at Reagan National and the stations around the National Mall are real, given the relatively good agreement between wind direction measured at Reagan National and the DCNet station at the Navy Annex (NVY; Appendix C). Given the importance of the apparent channeling of the winds along the Potomac River, we feel that a surface weather station should be placed between the Lincoln Memorial and the Tidal Basin, with an additional station farther from the river, possibly in or near the maintenance yard near the Kutz Bridge (Figure 5.1) to document how far into the National Mall the flow is likely channeled. The uncertainty in the wind direction measured at the top of HVR suggests that an additional station be placed on a building top near the corner of 17th Street and Constitution Avenue or near the Washington Monument. At present, there are no instruments located in the National Mall that measure wind speed and wind direction as a function of height above the building tops. The Rapidly Deployable Chemical Defense System (RDCDS) Network is a detect-to-warn system operating in a limited spatial domain and will be deployed with a meteorological expert to aid in the interpretation of the measurements. In this situation,
Figure 5.1. Recommended Locations of Additional Weather Stations (three red dots) and Doppler Sodar (single yellow trapezoid)

5.2
detailed knowledge of the flow above the buildings can be valuable, and a wind-profiling instrument, like a Doppler sodar, is a useful observational tool. There is considerable flexibility in placing a sodar because the channeling of the winds along the Potomac River is expected to have limited vertical extent. We recommend placing the sodar at a location west of 17th Street and south of Constitution Ave. One possible location is a maintenance yard near the Kutz Bridge, which was also recommended for an additional surface station.

6.1
6.0 References Hanna, S. R., G. A. Briggs, and R. P. Hosker, Jr. 1982. Handbook on Atmospheric Diffusion. DOE/TIC-11223, U.S. Department of Energy. National Climatic Data Center. 2003a. Local Climatological Data. Ronald Reagan National Airport, Washington, D.C. National Climatic Data Center. 2003b. Local Climatological Data. Dulles International Airport, Washington, D.C. Pasquill, F. 1961. “The Estimation of the Dispersion of Windborne Material.” Meteorological Magazine 90(1063):33-49. Turner, D. B. 1969. Workbook of Atmospheric Dispersion Estimates. U. S. Department of Health, Education, and Welfare, Washington, D.C.
Appendix A
Static Stability
A.1
Appendix A
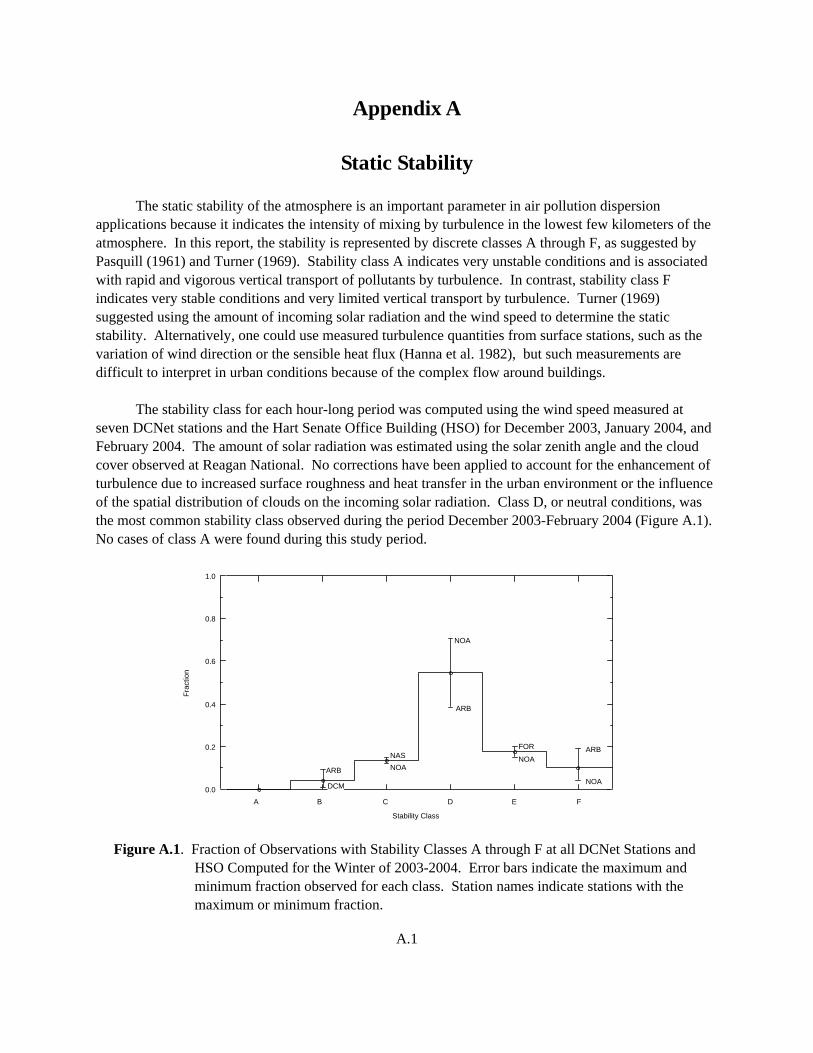
Static Stability The static stability of the atmosphere is an important parameter in air pollution dispersion applications because it indicates the intensity of mixing by turbulence in the lowest few kilometers of the atmosphere. In this report, the stability is represented by discrete classes A through F, as suggested by Pasquill (1961) and Turner (1969). Stability class A indicates very unstable conditions and is associated with rapid and vigorous vertical transport of pollutants by turbulence. In contrast, stability class F indicates very stable conditions and very limited vertical transport by turbulence. Turner (1969) suggested using the amount of incoming solar radiation and the wind speed to determine the static stability. Alternatively, one could use measured turbulence quantities from surface stations, such as the variation of wind direction or the sensible heat flux (Hanna et al. 1982), but such measurements are difficult to interpret in urban conditions because of the complex flow around buildings. The stability class for each hour-long period was computed using the wind speed measured at seven DCNet stations and the Hart Senate Office Building (HSO) for December 2003, January 2004, and February 2004. The amount of solar radiation was estimated using the solar zenith angle and the cloud cover observed at Reagan National. No corrections have been applied to account for the enhancement of turbulence due to increased surface roughness and heat transfer in the urban environment or the influence of the spatial distribution of clouds on the incoming solar radiation. Class D, or neutral conditions, was the most common stability class observed during the period December 2003-February 2004 (Figure A.1). No cases of class A were found during this study period.
1.0
0.8
0.6
0.4
0.2
0.0
Frac
tion
Stability Class
A B C D E F
DCM
ARB
NASNOA
NOA
ARB
FOR
NOAARB
NOA
Figure A.1. Fraction of Observations with Stability Classes A through F at all DCNet Stations and
HSO Computed for the Winter of 2003-2004. Error bars indicate the maximum and minimum fraction observed for each class. Station names indicate stations with the maximum or minimum fraction.

Appendix B
Comparison of Long-Term and Short-Term Averages
B.1
Appendix B
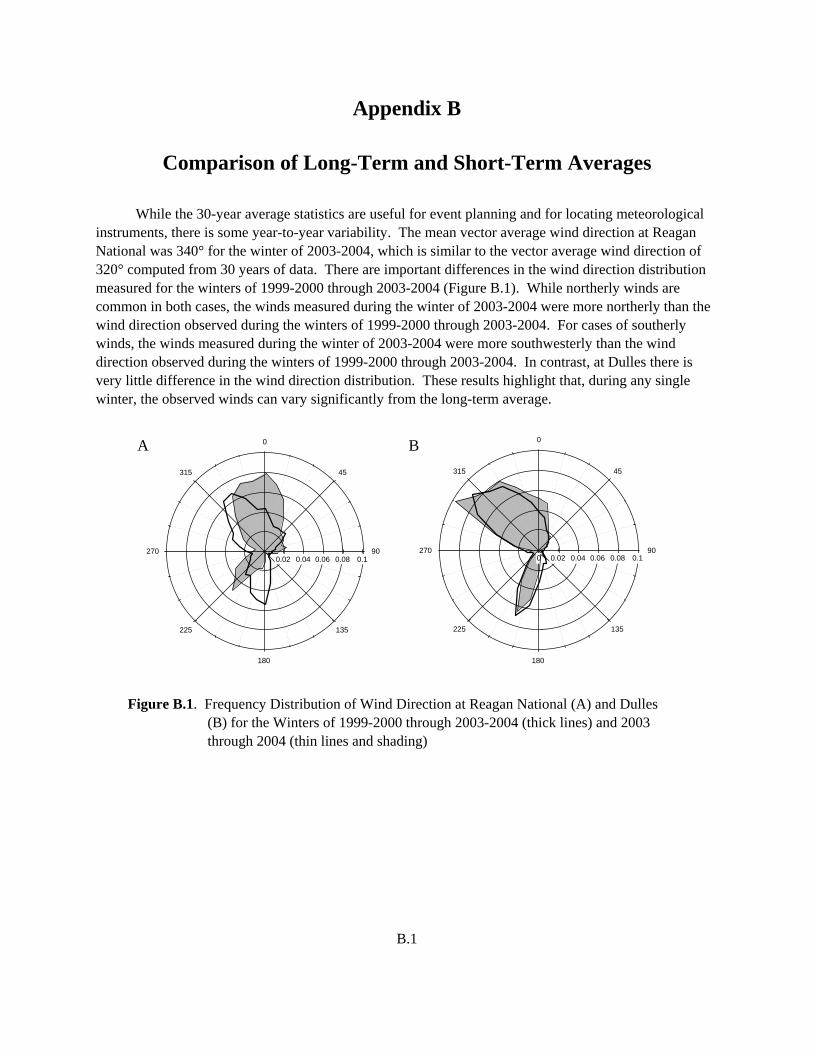
Comparison of Long-Term and Short-Term Averages While the 30-year average statistics are useful for event planning and for locating meteorological instruments, there is some year-to-year variability. The mean vector average wind direction at Reagan National was 340° for the winter of 2003-2004, which is similar to the vector average wind direction of 320° computed from 30 years of data. There are important differences in the wind direction distribution measured for the winters of 1999-2000 through 2003-2004 (Figure B.1). While northerly winds are common in both cases, the winds measured during the winter of 2003-2004 were more northerly than the wind direction observed during the winters of 1999-2000 through 2003-2004. For cases of southerly winds, the winds measured during the winter of 2003-2004 were more southwesterly than the wind direction observed during the winters of 1999-2000 through 2003-2004. In contrast, at Dulles there is very little difference in the wind direction distribution. These results highlight that, during any single winter, the observed winds can vary significantly from the long-term average.
0.02 0.04 0.06 0.08 0.1
0
45
90
135
180
225
270
315
0 0.02 0.04 0.06 0.08 0.1
0
45
90
135
180
225
270
315
Figure B.1. Frequency Distribution of Wind Direction at Reagan National (A) and Dulles
(B) for the Winters of 1999-2000 through 2003-2004 (thick lines) and 2003 through 2004 (thin lines and shading)
A B
Appendix C
Wind Speed and Wind Direction Measured at the National Mall

C.1
Appendix C
Wind Speed and Wind Direction Measured at the National Mall The surface meteorological stations located on top of the National Academy of Sciences Building (NAS), Forrestal Building (FOR), Herbert C. Hoover Building (HVR), and Hart Senate Office Building (HSO) provide insight into the flow around the National Mall during the winter of 2003-2004. The wind direction distributions measured at NAS, FOR, and HSO are similar, with winds from the northwest and southwest occurring most frequently (Figure C.1). The wind direction distribution computed from data gathered at HVR has some unique features compared to the other surface stations on the National Mall. There is not a dominant peak in the distribution for southwesterly winds, and there are more cases of southeasterly winds at HVR. These findings are surprising because HVR appears to be well exposed for periods with southwesterly flow. Without additional measurements, it is not clear if this feature is a general attribute of the wind direction at HVR, or if it is associated with a complicated local flow pattern around the building. The HVR is located along 15th Street and occupies the block between Constitution Avenue and Pennsylvania Avenue. The building includes six courtyards, some of which have openings at street level to allow traffic to pass through. There could be eddies created by these courtyards that lead to the observed differences. There are significant differences in the wind direction measured at Reagan National and the DCNet surface meteorological stations (including stations away from the National Mall; Figure C.2). The wind direction measured at most DCNet stations tends to be more easterly than the wind direction measured at Reagan National. In other words, there is a large negative bias in the wind direction measured at most of the DCNet stations compared to the wind direction measured at Reagan National. The bias between the wind direction measured at Dulles and the DCNet stations is much smaller (Figure C.3). To quantify the biases, the hour-by-hour wind direction differences between the surface stations and both Reagan National and Dulles have been averaged to yield an average wind direction difference. The average wind direction differences between Dulles and the DCNet stations are quite small (Table C.1). In contrast, the average wind direction difference between Reagan National and the stations on the National Mall is generally large, with the exception of the average wind direction differences between the Navy Annex (NVY) and Reagan National and the Arboretum (ARB) and Reagan National. The good agreement between NVY and Reagan National is expected given the proximity of both stations to the Potomac River. The agreement between Reagan National and ARB is more surprising, but several hills in the Arboretum might influence the measurements at ARB during stable conditions. There are large differences in the wind speed measured at Reagan National and Dulles and at the DCNet stations (Figures C.4 and C.5). The observed wind speed, measured at 10 m above the ground at Reagan National and Dulles is generally larger than the wind speed measured 10 m above the building top at NAS, HVR, FOR, and HSO. These findings are consistent with increased drag around these building-top stations. While there was good agreement between the wind direction measured at Reagan National and ARB, the wind speed measured at ARB is much less than that observed at Reagan National.

C.2
0.02 0.04 0.06 0.08 0.1 0.12 0.14 0.16
0
45
90
135
180
225
270
315
0.02 0.04 0.06 0.08 0.1 0.12 0.14 0.16
0
45
90
135
180
225
270
315
0.02 0.04 0.06 0.08 0.1 0.12 0.14 0.16
0
45
90
135
180
225
270
315
0.02 0.04 0.06 0.08 0.1 0.12 0.14 0.16
0
45
90
135
180
225
270
315
Figure C.1. Frequency Distributions of Wind Direction Measured at Reagan National (heavy
black lines) and at NAS (A; thin black line with shading), HVR (B; thin black line with shading), FOR (C; thin black line with shading), and HSO (D; thin black line with shading) for December 2003 through February 2004. Note radial scale is different from that used in Figures 2.1 and 2.2.
A B
C D

C.3
360
315
270
225
180
135
90
45
036031527022518013590450
Wind Direction at DCA (°)360
315
270
225
180
135
90
45
0
Win
d D
irect
ion
(°)
36031527022518013590450Wind Direction at DCA (°)
360
315
270
225
180
135
90
45
0
Win
d D
irect
ion
(°)
36031527022518013590450
360
315
270
225
180
135
90
45
036031527022518013590450
360
315
270
225
180
135
90
45
036031527022518013590450
360
315
270
225
180
135
90
45
0
Win
d D
irect
ion
(°)
36031527022518013590450
360
315
270
225
180
135
90
45
036031527022518013590450
Wind Direction at DCA (°)
360
315
270
225
180
135
90
45
036031527022518013590450
121086420
Wind Speed at DCA (ms -1)
A, NAS B, HVR C, FOR
D, DCM E, NOA F, ARB
G, NVY H, HSO
Figure C.2. Hourly Wind Direction Measured at Reagan National (DCA) Versus Wind Direction
Measured at NAS (A), HVR (B), FOR (C), DCM (D), NOA (E), ARB (F), NVY (G), and HSO (H) for December 2003 through February 2004. Colors indicate wind speed at Reagan National. The thin black line is the 1:1 line, and the thick blue line is the mean direction difference.

C.4
360
315
270
225
180
135
90
45
036031527022518013590450
Wind Direction at IAD (°)360
315
270
225
180
135
90
45
0
Win
d D
irect
ion
(°)
36031527022518013590450Wind Direction at IAD (°)
360
315
270
225
180
135
90
45
0
Win
d D
irect
ion
(°)
36031527022518013590450
360
315
270
225
180
135
90
45
036031527022518013590450
360
315
270
225
180
135
90
45
036031527022518013590450
360
315
270
225
180
135
90
45
0
Win
d D
irect
ion
(°)
36031527022518013590450
360
315
270
225
180
135
90
45
036031527022518013590450
Wind Direction at IAD (°)
360
315
270
225
180
135
90
45
036031527022518013590450
14121086420
Wind Speed at IAD (ms -1)
A, NAS B, HVR C, FOR
D, DCM E, NOA F, ARB
G, NVY H, HSO
Figure C.3. Hourly Wind Direction Measured at Dulles (IAD) Versus Wind Direction Measured
at NAS (A), HVR (B), FOR (C), DCM (D), NOA (E), ARB (F), NVY (G), and HSO (H) for December 2003 through February 2004. Colors indicate wind speed at Dulles. The thin black line is the 1:1 line, and the thick blue line is the mean direction difference.

C.5
Table C.1. Average Wind Direction Differences Between the DCNet Stations and Reagan National and Dulles
Station Name Reagan National
Wind Direction Difference (°) Dulles
Wind Direction Difference (°)NAS -38 -9 HVR -33 -8 FOR -31 -11 DCM -22 1 ARB -16 10 NVY -14 14 NOA -21 -4
We expect that the local effects on the wind measurements would be largest when the wind speed is small. That is indeed the case for stations within the National Mall, as shown in Figure C.6. When the wind direction observed at NAS is southerly to southwesterly, the wind direction measured at HVR ranges from southerly to northerly, but only for cases in which the wind speed is less than 3 ms-1. As the wind speed increases the agreement between the wind direction measured at NAS and HVR increases. There are also differences between the wind direction measured at NAS and FOR for cases in which light easterly winds are observed at NAS.

C.6
14
12
10
8
6
4
2
012840
Wind Speedection at DCA (°)14
12
10
8
6
4
2
0
Win
d Sp
eed
(ms
-1)
12840Wind Speedection at DCA (°)
14
12
10
8
6
4
2
0
Win
d Sp
eed
(ms
-1)
12840
14
12
10
8
6
4
2
012840
14
12
10
8
6
4
2
012840
14
12
10
8
6
4
2
0
Win
d Sp
eed
(ms
-1)
12840
14
12
10
8
6
4
2
012840
Wind Speedection at DCA (°)
14
12
10
8
6
4
2
012840
A, NAS B, HVR C, FOR
D, DCM E, NOA F, ARB
H, HSOG, NVY
Figure C.4. Hourly Wind Speed Measured at Reagan National (DCA) Versus Wind Speed
Measured at NAS (A), HVR (B), FOR (C), DCM (D), NOA (E), ARB (F), NVY (G), and HSO (H) for December 2003 through February 2004. The solid black line is the 1:1 line.

C.7
14
12
10
8
6
4
2
014121086420
Wind Speed at IAD (ms -1)
14
12
10
8
6
4
2
0
Win
d Sp
eed
(ms
-1)
14121086420Wind Speed at IAD (ms
-1)
14
12
10
8
6
4
2
0
Win
d S
peed
(ms
-1)
14121086420
14
12
10
8
6
4
2
014121086420
14
12
10
8
6
4
2
012840
14
12
10
8
6
4
2
0
Win
d Sp
eed
(ms
-1)
14121086420
14
12
10
8
6
4
2
012840
Wind Speed at IAD (ms-1
)
14
12
10
8
6
4
2
012840
A, NAS B, HVR C, FOR
D, DCM E, NOA F, ARB
G, NVY H, HSO
Figure C.5. Hourly Wind Speed Measured at Dulles (IAD) Versus Wind Speed Measured at NAS
(A), HVR (B), FOR (C), DCM (D), NOA (E), ARB (F), NVY (G), and HSO (H) for December 2003 through February 2004. The solid black line is the 1:1 line.

C.8
360
315
270
225
180
135
90
45
0
Win
d D
irect
ion
(°)
36031527022518013590450Wind Direction at NAS (°)
360
315
270
225
180
135
90
45
036031527022518013590450
Wind Direction at NAS (°)
360
315
270
225
180
135
90
45
036031527022518013590450
Wind Direction at NAS (°)
12840
Wind Speed at NAS (ms-1
)
A, HVR B, FORC, HSO
Figure C.6. Scatter Plot of Wind Direction Measured at NAS Versus Wind Direction Measured
at HVR (A), FOR (B), and HSO (C) for December 2003 through February 2004. The shading of the symbols indicates the wind speed measured at NAS, and the line is the 1:1 line.

Distr.1
Distribution
No. of Copies OFFSITE Dr. Lee Davisson University of California Lawrence Livermore National Laboratory P.O. Box 808 Livermore, CA 94551-0808 2 Mr. Richard Turville c/o Mr. Nick Mercury 675 North Washington Street, Ste. 220 Alexandria, VA 22314
No. of Copies Dr. Benjamin Wu Sandia National Laboratories, California Mailstop 9201 P.O. Box 969 Livermore, CA 94551-0969 ONSITE 12 Pacific Northwest National Laboratory K.J. Allwine L.K. Berg (10) Information Release