an analytic approach to selecting a nonprofit by
TRANSCRIPT

THE WILLIAM DAVIDSON INSTITUTE AT THE UNIVERSITY OF MICHIGAN
AN ANALYTIC APPROACH TO SELECTING
A NONPROFIT
By: Andrés Ramirez and Hakan Saraoglu
William Davidson Institute Working Paper Number 951 January 2009

AN ANALYTIC APPROACH TO SELECTING A NONPROFIT
Andrés Ramírez Assistant Professor
Department of Finance Bryant University 1150 Douglas Pike
Smithfield, RI 02917-1284 Voice Mail: (401) 232-6599
Fax: (401) 232-6319 [email protected]
Hakan Saraoglu Professor
Department of Finance Bryant University 1150 Douglas Pike
Smithfield, RI 02917-1284 Voice Mail: (401) 232-6450
Fax: (401) 232-6319 [email protected]
January 2009

AN ANALYTIC APPROACH TO SELECTING A NONPROFIT
Abstract
Charity giving continues to be an important aspect of the economic and social fabric of
the United States. The number and total assets of nonprofits registered with the Internal
Revenue Service (IRS) under the section 501(c)(3) of the tax code have grown
significantly over the past decade. Given the significant share of donations in supporting
the activities of nonprofits, it is important for donors to have a better understanding of
their operations and governance. As the number of nonprofits with similar objectives
increases, it becomes overly complicated for donors to make a choice that is consistent
with their own purpose for giving. The goal of this paper is to develop an analytic
framework for selecting a nonprofit from among competing alternatives. Specifically, we
propose a process in which consultants or financial advisors help donors evaluate
nonprofits using a set of financial and governance criteria to generate a ranked short list
of alternatives for further evaluation. Donors differ in their criteria for evaluating the
performance of nonprofits. The methodology we use allows donors to incorporate their
preferences for specific criteria to the selection of a nonprofit in a consistent manner.

3
AN ANALYTIC APPROACH TO SELECTING A NONPROFIT 1. Introduction
The dollar value of donations in the United States have increased significantly in
recent years and the number of nonprofit organizations (NPOs) is growing at a rapid
pace. As the number and variety of NPOs increase, donors face a growing problem when
selecting specific nonprofits to allocate their donations. In this study, we provide a
framework for evaluating nonprofits based on a given set of financial and governance
criteria. Our framework is based on the Analytic Hierarchy Process (AHP), which is a
widely used tool for solving multi-attribute decision problems. Given that the evaluation
of the financial and operating performance of a nonprofit involves measurements based
on multiple criteria, it can be difficult for a donor to decide which nonprofit attains the
most desirable performance characteristics. By using the AHP framework, donors can
rank nonprofits based on the relative importance they assign to each financial and
governance quality criterion. An important contribution of the AHP methodology is that
it ensures consistency in the determination of the relative importance of the criteria.
In the following section, we review the current developments in the nonprofit
sector and discuss the different stages of donor engagement in the giving process. In
sections 3 and 4, we explain the AHP and present an example in which our model
provides a hypothetical donor with a ranking of suitable nonprofits based on their
financial and governance characteristics. Section 5 concludes.

4
2. Nonprofits in the United States
Donations to nonprofits are breaking records in the United States. Giving USA
reported in June 2007 that Americans gave a total of $295 billion in 2006 up from $283
billion in 2005 (USA Today, 2007). From that total in 2006, $222.9 billion or 76 percent
were given by individual donors. Individual donations grew 1.2 percent between 2005
and 2006 on top of a 2.4 percent growth in the 2004-2005 period. The Foundation Center
(2007) shows that the number of grant making foundations has grown 64 percent from
41,000 in 1996 to 68,000 in 2005. More importantly, during the same period, foundation
giving rose 143 percent from $13.84 billion in 1996 to $33.6 billion in 2005.
Donors face a growing problem when deciding on how to allocate their donations
because the number of nonprofits is increasing significantly. In 1982 there were some
793 thousand NPOs, while currently the number is estimated to be over 1.4 million
(National Center for Charitable Statistics, 2007). As the number and size of the
nonprofits grow, the sector is becoming more important to society. Close to half a
million of all NPOs are filing Form 990 with the IRS in the United States, and the filing
NPOs hold close to $3 billion in assets and have annual revenues of over $1.3 billion.1
The nonprofit sector accounts for 5.2 percent of gross domestic product (GDP) and 8.3
percent of wages and salaries paid in the United States.
The combination of growth in donations and in donation options has given rise to
a new cottage industry of watchdog organizations and “consultants” whose jobs are to
help donors make a better decision and to provide oversight to the sector as a whole.
1 Nonprofit organizations with over $25,000 in annual gross receipts are required to file with the IRS.

5
Two popular organizations, Guidestar and Charity Navigator have dealt with this issue
using available financial information from IRS forms 990. For example, Charity
Navigator provides potential donors and the general public with a rating (not a ranking)
that measures nonprofits in two broad categories of financial health: organizational
efficiency and organizational capacity. This approach has been criticized because it
largely ignores any output measure that is not expressed in dollars. Practitioners claim
that any measure that does not directly account for output (lives changed, lunches served,
trees planted) will be meaningless both to donors and scholars. One particular problem in
the field is that mission statements for nonprofits could be vague and have no cross
sectional common denominator. For example while a children’s museum and a foster
care agency both have children at the center of their missions, they would have very
different metrics. Most NPOs generate their own metrics to convey their message to their
respective constituencies. However, the specificity of their metrics renders cross
sectional comparisons impossible.
According to Remmer (2000), there are three donor stages. In the first stage, the
donor is willing to make gifts if asked, but is basically passive; philanthropy is not a big
part of his/her life. They label this donor as “dormant”. Most new and emerging donors
or would-be-donors fall into this category. In the second stage, the donor is more
connected to giving and may have established a management vehicle, for example, a
donor advised fund or even a foundation. They label this donor as “engaged”. Most such
donors are not yet thinking strategically, and they are only beginning to be pro-active. In
the last stage, philanthropy has become a major part of this donor’s life and; he or she is

6
committed to making a difference. This donor is an active learner and her giving is the
closest analog to professional philanthropy. They label this donor as “committed”.
Regardless of their stage or level of engagement in the giving process, donors would
benefit from the help consultants can provide such as access to information or expertise
in due diligence. For example, a recent survey shows that clients expect financial
advisors to play an increasingly important role in their charitable planning and giving
(Penton Research, 2007).
As the growing number and variety of nonprofits make it difficult to select a
specific nonprofit from among competing alternatives, it would be beneficial for donors
to follow a process in which they first reduce the field of nonprofits by using comparable
financial and governance data, and then, they make a specific selection by evaluating the
impact of the nonprofits in the short list. We propose that consultants or financial
advisors can facilitate the initial phase of this process where they use publicly available
information derived from the tax filings to compare a group of nonprofits based on their
financial and governance characteristics.
3. The AHP
The AHP, which was developed by Saaty (1980), is a decision-making tool that
helps solve complex multi-attribute problems. It facilitates ranking a set of competing
alternatives based on specific evaluation criteria, and it has been applied to a variety of
problems in a diverse set of disciplines, such as selecting a project (Johnson and Hihn,
1980), selecting a microcomputer (Arbel and Seidmann, 1984), determining investor

7
suitability (Bolster, Janjigian, and Trahan, 1995), selecting mutual funds (Saraoglu and
Detzler, 2002), assigning sovereign debt ratings (Johnson, Srinivasan and Bolster, 1990),
selecting a life insurance contract (Puelz, 1991), selecting public relations firms (Hsu,
2006), deciding on library acquisitions (Uzoka and Ijatuyi, 2005), and selecting sites for
wildlife management (Thatcher, Van Manen, and Clark, 2006).
Comparison of financial and governance characteristics of nonprofits and making
a choice based on a set of performance criteria are typical multi-attribute decision-making
problems that can be solved using the AHP framework. In the following section, we
describe a process in which consultants or financial advisors help donors select a
nonprofit. We also provide an example that explains how the AHP can facilitate
generating a ranked short list of nonprofits based on their financial and governance
characteristics.
4. Evaluating Nonprofits Using the AHP
Selection of a specific nonprofit for giving is a complex process as it involves a
choice from a large number of alternatives and requires due diligence work based on a
wide variety of information. Given this complexity, donors and their consultants can
benefit from a framework that facilitates an efficient and effective evaluation process. In
fact, the study by Penton Research (2007), which concludes that financial advisors face
challenges in providing the level of charitable giving assistance that their clients expect,
supports further the potential benefits of such a framework. We propose a process in
which the nonprofit selection is implemented in three phases: (1) selecting a cause for

8
giving, (2) ranking nonprofits in the selected category, and (3) selecting a nonprofit from
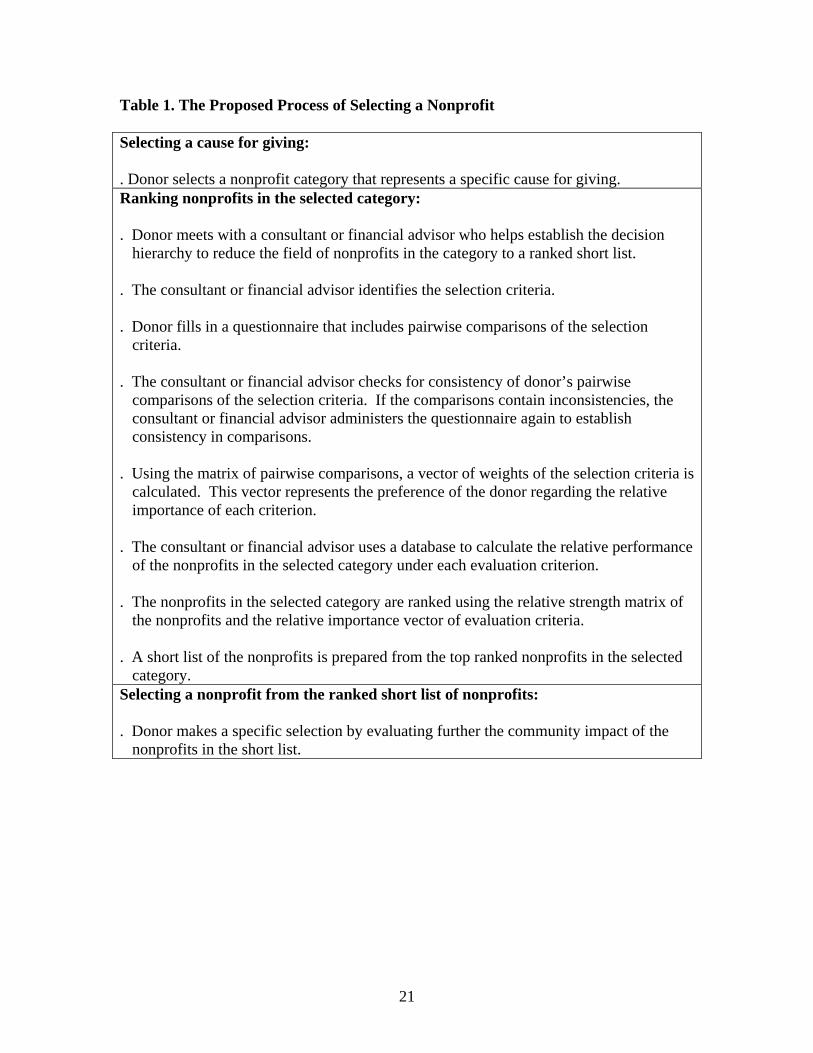
the ranked short list of nonprofits. Table 1 provides a detailed list of activities involved
in the proposed nonprofit selection process.
In the first phase donor selects a nonprofit category that reflects a specific cause
for giving. For the purposes of our example we assume that the hypothetical donor has
selected to give to temporary homeless shelters. The second phase involves using the
AHP to obtain a ranking of the nonprofits in the selected category based on publicly
available financial and governance information. The AHP represents a given decision
problem in a hierarchical structure, which typically includes three levels: the overall
objective of the decision, the assessment criteria, and the competing alternatives. Figure
1 illustrates the hierarchy of evaluating the financial and governance characteristics of
competing nonprofits for a hypothetical donor. In this case, the overall objective is to
provide a donor with a ranked list of suitable nonprofits whose performance
characteristics are in line with the donor’s preferences. The assessment criteria are the
different measures of operating and governance quality, and the set of nonprofits includes
the competing alternatives of temporary homeless shelters.
We propose commitment to mission, administrative efficiency, governance
quality, sustainability of activities, and sustainable community impact as the criteria to
evaluate nonprofits. As donors may assign different importance weights to each criterion
based on their preferences, it is important for them to determine the relative importance
of the evaluation criteria using pairwise comparisons. Table 2 illustrates a pairwise
comparison scale typically used in the AHP. A prospective donor can make the pairwise

9
comparisons by answering a questionnaire, which can be prepared for a specific nonprofit
category. Given that our example proposes five evaluation criteria, the donor must make
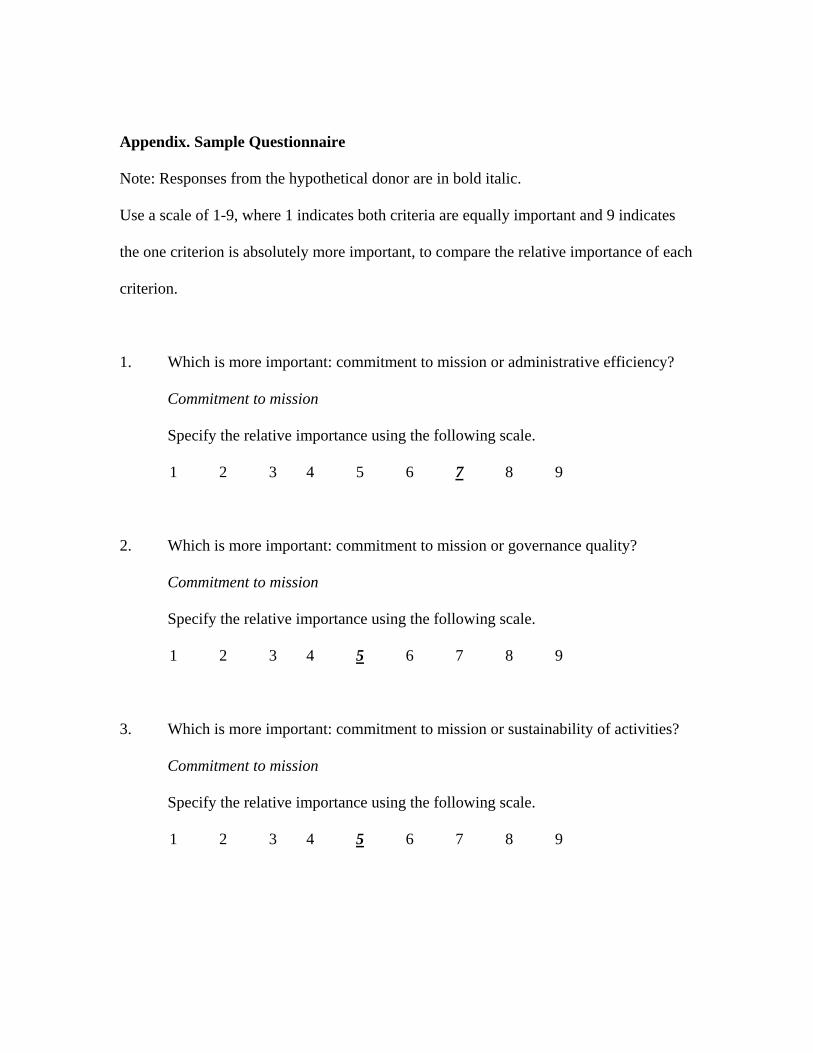
ten pairwise comparisons. The appendix includes a sample questionnaire and responses
from a hypothetical donor. We present the preferences of the hypothetical donor in a
matrix format in Table 3 Panel A. In this example, comparing commitment to mission to
administrative efficiency (row 1, column 2 of the matrix), the donor assigns a preference
score of 7, indicating that he or she places a higher importance on commitment to mission
as a criterion to evaluate a nonprofit. The donor also considers commitment to mission as
more important compared to governance quality, and assigns it a preference score of 5.
It is possible that a donor’s pairwise comparisons may contain inconsistencies.
For example, suppose the donor ranks commitment to mission as more important than
administrative efficiency. Suppose also that the donor also sees administrative efficiency
more important than governance quality. If the same donor then indicates that
governance quality is more important than commitment to mission, then he or she will
have made three statements about preferences that are inconsistent with each other. An
important contribution of the AHP is that the donor can identify such inconsistencies by
using an index developed by Saaty (1977, 1980). In this example, we first verify the
consistency of the donor’s pairwise comparisons by calculating the corresponding
consistency index. Then, we estimate the relative importance weights of the evaluation
criteria using the following equation:
max ,PW Wλ= Equation (1)

10
where P is the pairwise comparison matrix, W is the right eigenvector of P, and
λmax is the largest eigenvalue of P. For a detailed discussion of the eigenvalue method of
estimating relative importance weights, we refer the reader to Saaty (1977, 1980). Table
3 Panel B presents the relative importance weights of the criteria for evaluating
nonprofits as determined by the hypothetical donor. In this example, the donor considers
commitment to mission as the most important criterion for assessing the quality of a
nonprofit providing temporary shelter for the homeless with a weight of 46.28 percent.
This donor also sees sustainable community impact and administrative efficiency as the
next two important criteria with relative importance weights of 29.51 percent and 10.81
percent, respectively.
We use the data made available to the Internal Revenue Service (IRS) in Form
990 to evaluate the financial and governance characteristics of nonprofits. As the
hypothetical donor in our example focuses on nonprofits that provide temporary shelter
for the homeless, we include fourteen randomly selected homeless shelters in our
analysis.
Donors will prefer nonprofits with a high commitment to fulfill their mission.
Managers of nonprofits can show this commitment by allocating their revenues to
program services as opposed to administration, other expenses or building an
endowment. We believe that nonprofits will best exhibit their commitment to their
mission in the long run, thus we define the following proxy for a nonprofit’s commitment
to mission:

11
Program ServicesCM .Total Revenues
= Equation (2)
Nonprofits must recruit, develop and retain talent, but at the same time, maintain
their administration expenses low. Nonprofits with effective management will be able to
spend less money in administration expenses and thus more in the programs they support.
Donors should prefer nonprofits with low administration expenses as a percentage of
their total expenses. Empirically, Weisbrod and Dominguez (1986), Greenlee and Brown
(1999) and most recently Bowman (2006), Tinkelman and Mankaney (2007) provide
evidence that donors do respond to administrative expenses. 2 We use administration
expenses as a proportion of total expenses as a proxy for administrative efficiency:
Administration ExpensesAE .Total Expenses
= Equation (3)
As in the for profit sector, the board of directors of a nonprofit is the fiscally and legally
responsible body for the organization, and plays a pivotal role in steering management to
perform in line with the organizational mission and goals. One key factor for governance
quality is the board’s independence from management. Literature in finance and
economics has measured board independence by using the ratio of officers to outsiders in
the board. An independent board may be more likely to “fire” an inefficient CEO
(Hermalin and Weisbach, 1988) or to help the firm make better decisions in case of
merger and acquisitions, see for example Cotter, Shivdasani and Zenner (1997) and Byrd
and Hickman (1992). In the nonprofit sector, Callen, Klein and Tinkelman (2003) show
2 A word of caution is introduced here: very low spending in administration could also be an indication of poor management. For example, Hager (2001) shows that low administrative expenses can be a predictor of future failure.

12
a positive relationship between the presence of donors (outsiders) on the board and the
nonprofit’s performance. We expect that board members that are independent from the
management team will be preferred by a donor and we define the following proxy as a
measure of governance quality:3
Outsiders on BoardGQTotal Board Members
= . Equation (4)
Nonprofits depend on their revenue generation to continue providing services.
Given the current trend by government to decrease spending in social programs, donors
will be attracted to those nonprofits that can create income from internally generated
activities. This is attractive to them because it generates leverage. For every dollar
donated, the nonprofit generates an extra amount to increase social impact. Nonprofit
literature has acknowledged the increased pressure of nonprofits to compete and behave
more “business like” (see, for example, Dart, 2004 and Chetkovich and Frumkin, 2003).
We subtract revenues from donors and government grants from total revenues to obtain
internally generated revenues. We then define the following proxy as a measure of
sustainability of a nonprofit’s activities:4
Internally Generated RevenuesSA .Total Revenues
= Equation (5)
While we can not measure directly the impact a nonprofit has in society, we can
measure an array of variables that should be correlated with social impact. We believe
3 One issue with this measure is that it assumes that nonprofits have a mix of outsiders and insiders in their board. We have anecdotal evidence that small nonprofits have few if any officers in their boards. We do not imply that donors or outsiders will be better board members than insiders. We argue that, for governance’s sake what matters the most is the board member’s independence from the management team. 4 This measure assumes that internally generated revenues are the best vehicle for a nonprofit to achieve sustainability. However relying only on earned income could be in fact risky.

13
that a nonprofit that spends more of its revenue should have, ceteris paribus, a bigger
impact. We also acknowledge that by spending most of their revenues nonprofits may be
neglecting growth opportunities that could result in a greater future impact. For this
reason, we propose that the ratio of total expenses to total revenue multiplied by the asset
growth of a nonprofit as an indicator of its sustainable community impact:
Total ExpensesSCI Asset Growth.Total Revenues
⎡ ⎤= ⎢ ⎥⎣ ⎦ Equation (6)
We present the results of these calculations in Table 4. As is apparent in Panel A
of Table 4, homeless shelter Hopelink has a relatively high value of 0.9153 for the ratio
of program services to total revenues. It also has a strong value of 9.1648 for the ratio of
total expenses to total revenues times asset growth. Atlanta Union Mission Corp.,
however, demonstrates relatively low values of 0.5308 and 1.3604 for the ratio of
program services to total revenues and the ratio of total expenses to total revenues times
asset growth, respectively.
We transform the values of the proxies for evaluation criteria so that they fall into
the interval ranging from 1 to 9, where the minimum value and the maximum value are
transformed to 1 and 9, respectively. The proxies for which the donor requires smaller
values are transformed so that the maximum value corresponds to 1 and the minimum
value corresponds to 9. Next, we normalize the transformed values to obtain the relative
strength weights of homeless shelters, which are presented in Panel B of Table 4. We
refer the reader to Weck, et al. (1997) and Yu, et al. (2000) for further examples of
similar normalization methods in incorporating quantitative data to the AHP. As is
apparent in Panel B of Table 4, Hopelink has high relative strength weights of 8.75

14
percent and 21.84 percent for commitment to mission and sustainable community impact,
respectively, which are the two most important criteria for the hypothetical donor. Also,
the low values of the ratio of program services to total revenues and the ratio of total
expenses to total revenues times asset growth for Atlanta Union Mission Corp. translate
into low relative strength weights of 1.01 percent and 5.07 percent for commitment to
mission and sustainable community impact, respectively.
After the relative importance of evaluation criteria and the strength of the
homeless shelters under each criterion are determined, we combine them to determine the
relative suitability of homeless shelters for the hypothetical donor in our example. The
relative strength weights of homeless shelters under the evaluation criteria form a 14x5
matrix. Each row of the matrix represents a homeless shelter and each column represents
a criterion. The relative importance weights of the evaluation criteria for the donor form
a 5x1 vector. We multiply the relative strength matrix of homeless shelters by the
relative importance vector of evaluation criteria to obtain a 14x1 vector, which reflects
the relative suitability of homeless shelters for the donor. Table 5 shows the elements of
this vector as well as the suitability rankings of homeless shelters.
In our example, the most important criterion for the hypothetical donor, who
considers giving to a homeless shelter, is commitment to mission, followed by
sustainable community impact and administrative efficiency. Hopelink is ranked first
based on these criteria with a suitability weight of 11.51 percent. Sequola Community
Intiatives Inc. scores a suitability weight of 10.54 percent and ranks second among the
fourteen homeless shelters in our sample. Homeless shelters that rank very low in the list
15
all have very low relative strength weights for commitment to mission, sustainable
community impact, and administrative efficiency, which constitute the top three most
important criteria for the hypothetical donor in our example. An important implication of
the results is that the rankings we obtain reflect the relative importance of each evaluation
criterion for a donor.
It should be noted that the decision hierarchy used in this paper is provided as an
example to illustrate the AHP framework and it can be modified to fit a different
selection problem for a different donor. The hierarchy can easily be changed to include
more criteria for evaluating nonprofits as well as different measurement proxies. The
actual implementation of the proposed AHP methodology in selecting a nonprofit can be
accomplished by integrating it into an information repository on nonprofits. The
potential donors and their advisors can access the repository through a questionnaire
similar to the one in this paper, which is based on a set of evaluation criteria appropriate
for the type of nonprofit they are considering to help. Then, using the information in the
database, the AHP can rank the competing nonprofit alternatives based on their relative
strength under each criteria.
The third phase of the proposed selection process involves identifying a specific
nonprofit from the ranked short list of competing alternatives. At this phase, donors can
evaluate the top nonprofits in the list further by inquiring specific information regarding
their community impact. As they can now focus on a small number of alternatives that
have already been screened with objective and quantitative data, donors can also use
qualitative measures of community impact to make a final choice. For example, our
16
hypothetical donor can make a selection from among Hopelink and Sequola Community
Intiatives Inc., which are the top two ranked nonprofits in this case, using more direct
criteria.
5. Summary
This study provides an analytic framework for selecting a nonprofit from among
competing alternatives. Donors differ in their criteria for evaluating the performance of
nonprofits. The methodology we use allows donors to incorporate their specific criteria
to the selection of a nonprofit and ensures consistency in the selection process.
As the number of nonprofits and the amount of donations to them continue to
increase significantly, donors can benefit from the availability of decision-making tools
to help them in their evaluation of competing alternatives. The AHP methodology that
we propose in this paper can be integrated into a database that contains information on
various proxies for nonprofit performance measurement, and can serve as a decision aid
for potential donors. We believe that a methodology that allows donors to identify the
relative importance of performance criteria will stimulate further research on determining
templates of proxies that are appropriate to measure the performance of different types of
nonprofits.

17
References
Arbel, A. and A. Seidmann. 1984. “Selecting a Microcomputer for Process Control and Data Acquisition.” IIE Transactions, Vol. 16, No. 1, 73-80. Bolster, P.J., V. Janjigian, and E.A. Trahan. 1995. “Determining Investor Suitability Using the Analytic Hierarchy Process.” Financial Analysts Journal, Vol. 51, No. 4, 63-75. Bowman, Woods. 2006. “Should Donors Care About Overhead Costs? Do They Care?” Nonprofit and Voluntary Sector Quarterly, Vol. 35, No. 2, 288-310 Byrd, John W. and K.A. Hickman. 1992. “Do Outside Directors Monitor Managers? Evidence from Tender Offer Bids”. Journal of Financial Economics, Vol 32 No. 2, 195-221. Callen, Jeffrey, A. Klein, and D. Tinkelman. 2003. “Board Composition, Committees, and Organizational Efficiency: The Case of Nonprofits”. Nonprofit and Voluntary Sector Quarterly, Vol. 32, No. 4, 493-520 Chetkovich, C. and P. Frumkin. 2003 “Balancing Margin and Mission: Nonprofit Competition in Charitable versus Fee-Based Programs”. Administrative Science Quarterly, 35, 564-596. Cotter, James, A. Shivdasani, and M. Zenner. 1997 “Do Independent Directors Enhance Target Shareholder Wealth During Tender Offers?” Journal of Financial Economics, Vol. 43 No. 2, 195-218. Dart, Raymond. 2004. “Being "Business-Like" in a Nonprofit Organization: A Grounded and Inductive Typology”. Nonprofit and Voluntary Sector Quarterly, 33, 290-310 The Foundation Center. 2007. Foundation Growth and Giving Estimates: Current Outlook. Greenlee, J.S. and K. Brown. 1999 “The impact of Accounting Information on Contributions to Charitable Organizations”. Research in Accounting Regulation Hager, M. 2001. “Financial Vulnerability Among Arts Organizations: A Test of the Tuckman-Chang Measures.” Nonprofit and Voluntary Sector Quarterly. Vol. 30. No. 2, 376-92. Hermalin, Benjamin and M. Weisbach. 1988 “The Determinants of Board Composition”. The RAND Journal of Economics, Vol. 19, No. 4, 589-606.

18
Hsu, Pi-Fang. 2006. “Developing a New Model for Selecting Public Relations Firms in the High-Tech Industry.” Journal of Modeling in Management. Vol. 1, No. 2, 156-172. Johnson, C.R. and J.M. Hihn. 1980. “Prioritization of Research Projects.” In Energy Storage: The Transactions of the First International Assembly on Energy Storage. Edited by J. Silverman. Pergamon, New York, 562-566. Johnson, Ronald A., V. Srinivasan, and P.J. Bolster. 1990. “Sovereign Debt Ratings: A Judgmental Model Based on the Analytic Hierarchy Process.” Journal of International Business Studies, 95-117. National Center for Charitable Statistics. 2007. Nonprofit Almanac 2007. Penton Research. 2007. Opportunities and Obstacles: The Role of Financial Advisors in Charitable Planning and Decision Making. Puelz, Robert. 1991. “A Process for Selecting a Life Insurance Contract.” Journal of Risk and Insurance, Vol. 58, No. 1, 138-146. Remmer, Ellen. 2000. What’s a Donor to Do? The State of Donor Resources Today. The Philanthropic Initiative Inc. Saaty, T.L. 1977. “A Scaling Method for Priorities in Hierarchical Structures.” Journal of Mathematical Psychology, Vol. 15, No. 3, 234-281. Saaty, T.L. 1980. The Analytic Hierarchy Process, McGraw-Hill, New York. Saraoglu, Hakan and M. Detzler. 2002. “A Sensible Mutual Fund Selection Model.” Financial Analysts Journal, Vol. 58, No. 3, 60-72. Thatcher, Cindy A., F.T. Van Manen, and J.D. Clark. 2006. “Identifying Suitable Sites for Florida Panther Reintroduction.” Journal of Wildlife Management. Vol. 70, No. 3, 752-763. Tinkelman Daniel and K. Mankaney. 2007, “When is Administrative Efficiency Associated with Charitable Donations?” Nonprofit and Voluntary Sector Quarterly, Vol. 36, No. 1, 41-64. USA Today. 2007. June 25. p. 3A. Uzoka, F.M.E. and O.A. Ijatuyi. 2005. “Decision Support System for Library Acquisitions: A Framework.” The Electronic Library. Vol. 23, No. 4, 453-462.
19
Weck, M., F. Klocke, H. Schell, and E. Ruenauver. 1997. “Evaluating Alternative Production Cycles Using the Extended Fuzzy AHP Method.” European Journal of Operational Research. Vol. 100, No. 2, 351-366. Weisbrod, B. and N. Dominguez. 1986 “Demand for Collective Goods in Private Nonprofit Markets: Can Fundraising Expenditures Help Overcome Free Rider Behavior?”. Journal of Public Economics, Vol. 30, No. 1, 83-96. Yu, Y., K. Jin, H.C. Zhang, F.F. Ling, and D. Barnes. 2000. A Decision-Making Model for Materials Management of End-of-Life Electronic Products.” Journal of Manufacturing Systems. Vol. 19, No. 2, 94-107.

20
Figure 1. The Hierarchy for Evaluating Nonprofits
21
Table 1. The Proposed Process of Selecting a Nonprofit Selecting a cause for giving: . Donor selects a nonprofit category that represents a specific cause for giving. Ranking nonprofits in the selected category: . Donor meets with a consultant or financial advisor who helps establish the decision
hierarchy to reduce the field of nonprofits in the category to a ranked short list. . The consultant or financial advisor identifies the selection criteria. . Donor fills in a questionnaire that includes pairwise comparisons of the selection
criteria. . The consultant or financial advisor checks for consistency of donor’s pairwise
comparisons of the selection criteria. If the comparisons contain inconsistencies, the consultant or financial advisor administers the questionnaire again to establish consistency in comparisons.
. Using the matrix of pairwise comparisons, a vector of weights of the selection criteria is
calculated. This vector represents the preference of the donor regarding the relative importance of each criterion.
. The consultant or financial advisor uses a database to calculate the relative performance
of the nonprofits in the selected category under each evaluation criterion. . The nonprofits in the selected category are ranked using the relative strength matrix of
the nonprofits and the relative importance vector of evaluation criteria. . A short list of the nonprofits is prepared from the top ranked nonprofits in the selected
category. Selecting a nonprofit from the ranked short list of nonprofits: . Donor makes a specific selection by evaluating further the community impact of the
nonprofits in the short list.

22
Table 2. Pairwise Comparison Scale Level of Importance Definition Explanation 1 3 5 7 9 2, 4, 6, 8
Equal Importance Weak importance of one over another Essential or strong importance Very strong or demonstrated importance Absolute importance Intermediate values between adjacent scale values
Two attributes contribute equally to the objective Experience and judgment slightly favor one attribute over another Experience and judgment strongly favor one attribute over another An attribute is favored very strongly over another; its dominance demonstrated in practice The evidence favoring one attribute over another is of the highest possible order of affirmation When compromise is needed

Table 3. Analysis of the Criteria for Evaluating Nonprofits That Provide Temporary Shelter for the Homeless
Panel A: Donor’s Pairwise Comparisons of Evaluation Criteria
Panel B: Relative
Importance of
Evaluation Criteria
Evaluation Criteria
Commitment
to Mission
Administrative
Efficiency
Governance
Quality
Sustainability of Activities
Sustainable Community
Impact
Relative Importance Weights
Commitment to Mission
1 7 5 5 2 0.4628
Administrative Efficiency
1/7 1 3 2 1/5 0.1081
Governance Quality
1/5 1/3 1 2 1/3 0.0779
Sustainability of Activities
1/5 1/2 1/2 1 1/5 0.0561
Sustainable Community Impact
1/2 5 3 5 1 0.2951

Table 4. Analysis of the Relative Strength of Fourteen Randomly Selected Nonprofits That Provide Temporary Shelter for the Homeless
Panel A. Values of the Proxies for Evaluation Criteria
Nonprofit
Program Services /
Total Revenues
Administration
Expenses / Total Expenses
Outsiders on
Board / Total Board
Members
Internally Generated Revenues /
Total Revenues
(Total Expenses /
Total Revenues) × Asset Growth
Help USA Bowery Residents Committee Sequola Community Initiatives Inc. Under 21 Project Hospitality Inc. Center for Urban Community Services Inc Porter Ave Housing Development Fund Corporation Valley Youth House Committee Catholic Charities of the Archdiocese of Washington Inc Atlanta Union Mission Corp. Camilus House Inc. Catholic Charities of Southern Nevada Hopelink Community Action Organization
0.88310.85050.90880.72420.85800.84770.88970.87770.66970.53080.93180.93130.91530.8806
0.0908 0.0912 0.1182 0.0896 0.1232 0.0962 0.0612 0.0224 0.1194 0.0617 0.0926 0.0700 0.0393 0.1040
0.41180.75000.60000.85710.83330.50000.46150.83331.00000.83330.97060.43480.75000.8095
0.85590.30791.00000.01730.18560.03470.99100.94010.59610.17430.11760.29550.02890.0183
2.38181.33575.56881.00781.21121.38543.90732.20081.26411.36040.21031.42099.16480.1297

Table 4. Analysis of the Relative Strength of Fourteen Randomly Selected Nonprofits That Provide Temporary Shelter for the Homeless
Panel B. Relative Strength Weights of Nonprofits Under Each Evaluation Criterion
Nonprofit
Commitment
to Mission
Administrative
Efficiency
Governance
Quality
Sustainability of Activities
Sustainable Community
Impact Help USA Bowery Residents Committee Sequola Community Intiatives Inc. Under 21 Project Hospitality Inc. Center for Urban Community Services Inc Porter Ave Housing Development Fund Corporation Valley Youth House Committee Catholic Charities of the Archdiocese of Washington Inc Atlanta Union Mission Corp. Camilus House Inc. Catholic Charities of Southern Nevada Hopelink Community Action Organization
0.08100.07440.08620.04900.07590.07390.08230.07990.03800.01010.09080.09070.08750.0805
0.07770.07810.10400.07660.10880.08290.04930.01210.10510.04980.07940.05770.02820.0904
0.01380.07750.04930.09770.09320.03050.02320.09320.12460.09320.11910.01820.07750.0888
0.13650.05870.15700.01740.04140.01990.15570.14850.09970.03970.03170.05700.01910.0176
0.07270.05020.14110.04310.04750.05120.10540.06880.04860.05070.02600.05200.21840.0243
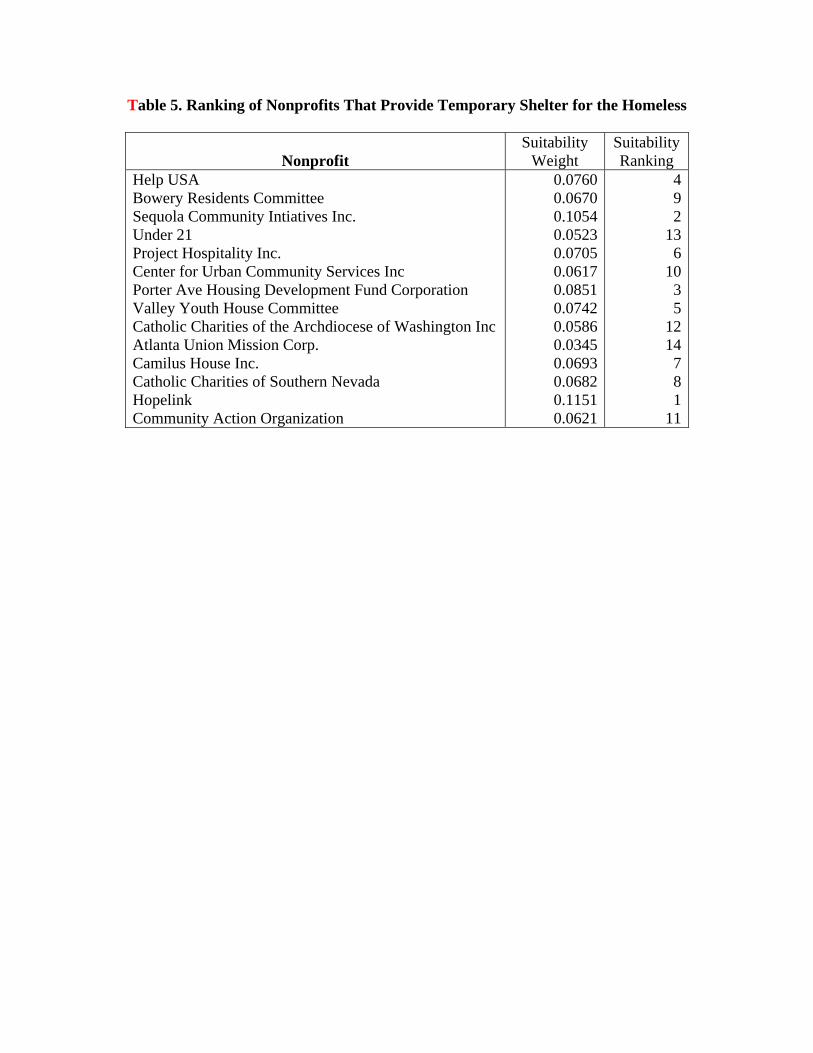
Table 5. Ranking of Nonprofits That Provide Temporary Shelter for the Homeless
Nonprofit
Suitability Weight
Suitability Ranking
Help USA Bowery Residents Committee Sequola Community Intiatives Inc. Under 21 Project Hospitality Inc. Center for Urban Community Services Inc Porter Ave Housing Development Fund Corporation Valley Youth House Committee Catholic Charities of the Archdiocese of Washington Inc Atlanta Union Mission Corp. Camilus House Inc. Catholic Charities of Southern Nevada Hopelink Community Action Organization
0.0760 0.0670 0.1054 0.0523 0.0705 0.0617 0.0851 0.0742 0.0586 0.0345 0.0693 0.0682 0.1151 0.0621
492
136
1035
1214781
11
Appendix. Sample Questionnaire
Note: Responses from the hypothetical donor are in bold italic.
Use a scale of 1-9, where 1 indicates both criteria are equally important and 9 indicates
the one criterion is absolutely more important, to compare the relative importance of each
criterion.
1. Which is more important: commitment to mission or administrative efficiency?
Commitment to mission
Specify the relative importance using the following scale.
1 2 3 4 5 6 7 8 9
2. Which is more important: commitment to mission or governance quality?
Commitment to mission
Specify the relative importance using the following scale.
1 2 3 4 5 6 7 8 9
3. Which is more important: commitment to mission or sustainability of activities?
Commitment to mission
Specify the relative importance using the following scale.
1 2 3 4 5 6 7 8 9

4. Which is more important: commitment to mission or sustainable community
impact?
Commitment to mission
Specify the relative importance using the following scale.
1 2 3 4 5 6 7 8 9
5. Which is more important: administrative efficiency or governance quality?
Administrative efficiency
Specify the relative importance using the following scale.
1 2 3 4 5 6 7 8 9
6. Which is more important: administrative efficiency or sustainability of activities?
Administrative efficiency
Specify the relative importance using the following scale.
1 2 3 4 5 6 7 8 9
7. Which is more important: administrative efficiency or sustainable community
impact?
Sustainable community impact
Specify the relative importance using the following scale.
1 2 3 4 5 6 7 8 9

8. Which is more important: governance quality or sustainability of activities?
Governance quality
Specify the relative importance using the following scale.
1 2 3 4 5 6 7 8 9
9. Which is more important: governance quality or sustainable community impact?
Sustainable community impact
Specify the relative importance using the following scale.
1 2 3 4 5 6 7 8 9
10. Which is more important: sustainability of activities or sustainable community
impact?
Sustainable community impact
Specify the relative importance using the following scale.
1 2 3 4 5 6 7 8 9
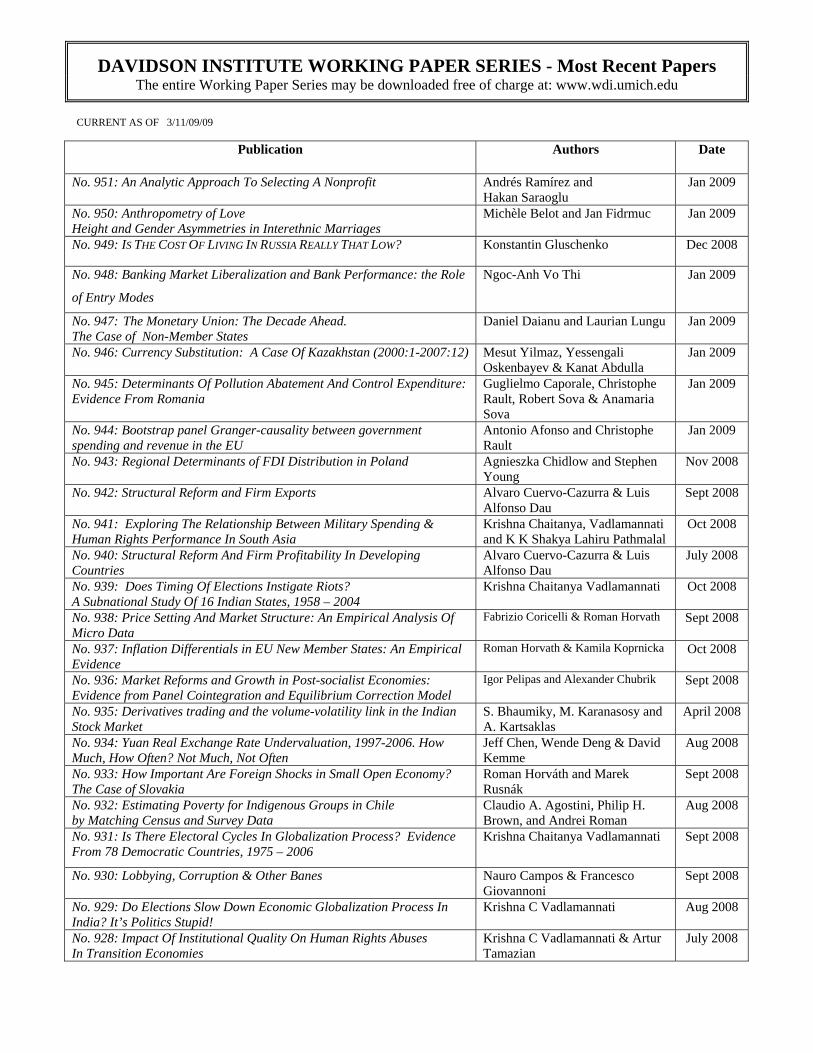
DAVIDSON INSTITUTE WORKING PAPER SERIES - Most Recent Papers The entire Working Paper Series may be downloaded free of charge at: www.wdi.umich.edu
CURRENT AS OF 3/11/09/09
Publication Authors Date
No. 951: An Analytic Approach To Selecting A Nonprofit Andrés Ramírez and Hakan Saraoglu
Jan 2009
No. 950: Anthropometry of Love Height and Gender Asymmetries in Interethnic Marriages
Michèle Belot and Jan Fidrmuc Jan 2009
No. 949: IS THE COST OF LIVING IN RUSSIA REALLY THAT LOW? Konstantin Gluschenko Dec 2008
No. 948: Banking Market Liberalization and Bank Performance: the Role
of Entry Modes Ngoc-Anh Vo Thi Jan 2009
No. 947: The Monetary Union: The Decade Ahead. The Case of Non-Member States
Daniel Daianu and Laurian Lungu Jan 2009
No. 946: Currency Substitution: A Case Of Kazakhstan (2000:1-2007:12) Mesut Yilmaz, Yessengali Oskenbayev & Kanat Abdulla
Jan 2009
No. 945: Determinants Of Pollution Abatement And Control Expenditure: Evidence From Romania
Guglielmo Caporale, Christophe Rault, Robert Sova & Anamaria Sova
Jan 2009
No. 944: Bootstrap panel Granger-causality between government spending and revenue in the EU
Antonio Afonso and Christophe Rault
Jan 2009
No. 943: Regional Determinants of FDI Distribution in Poland Agnieszka Chidlow and Stephen Young
Nov 2008
No. 942: Structural Reform and Firm Exports Alvaro Cuervo-Cazurra & Luis Alfonso Dau
Sept 2008
No. 941: Exploring The Relationship Between Military Spending & Human Rights Performance In South Asia
Krishna Chaitanya, Vadlamannati and K K Shakya Lahiru Pathmalal
Oct 2008
No. 940: Structural Reform And Firm Profitability In Developing Countries
Alvaro Cuervo-Cazurra & Luis Alfonso Dau
July 2008
No. 939: Does Timing Of Elections Instigate Riots? A Subnational Study Of 16 Indian States, 1958 – 2004
Krishna Chaitanya Vadlamannati Oct 2008
No. 938: Price Setting And Market Structure: An Empirical Analysis Of Micro Data
Fabrizio Coricelli & Roman Horvath Sept 2008
No. 937: Inflation Differentials in EU New Member States: An Empirical Evidence
Roman Horvath & Kamila Koprnicka Oct 2008
No. 936: Market Reforms and Growth in Post-socialist Economies: Evidence from Panel Cointegration and Equilibrium Correction Model
Igor Pelipas and Alexander Chubrik Sept 2008
No. 935: Derivatives trading and the volume-volatility link in the Indian Stock Market
S. Bhaumiky, M. Karanasosy and A. Kartsaklas
April 2008
No. 934: Yuan Real Exchange Rate Undervaluation, 1997-2006. How Much, How Often? Not Much, Not Often
Jeff Chen, Wende Deng & David Kemme
Aug 2008
No. 933: How Important Are Foreign Shocks in Small Open Economy? The Case of Slovakia
Roman Horváth and Marek Rusnák
Sept 2008
No. 932: Estimating Poverty for Indigenous Groups in Chile by Matching Census and Survey Data
Claudio A. Agostini, Philip H. Brown, and Andrei Roman
Aug 2008
No. 931: Is There Electoral Cycles In Globalization Process? Evidence From 78 Democratic Countries, 1975 – 2006
Krishna Chaitanya Vadlamannati Sept 2008
No. 930: Lobbying, Corruption & Other Banes Nauro Campos & Francesco Giovannoni
Sept 2008
No. 929: Do Elections Slow Down Economic Globalization Process In India? It’s Politics Stupid!
Krishna C Vadlamannati Aug 2008
No. 928: Impact Of Institutional Quality On Human Rights Abuses In Transition Economies
Krishna C Vadlamannati & Artur Tamazian
July 2008