an analytical model for frp debonding in strengthened … · an analytical model for frp debonding...
TRANSCRIPT

An Analytical Model for FRP Debonding in Strengthened RC Beamsunder Monotonic and Cyclic Loads
Reza Saeidi Moein, and Abbas Ali Tasnimi*
(Received December 1, 2015, Accepted September 28, 2016, Published online November 18, 2016)
Abstract: Reinforced concrete (RC) beams strengthened by externally bonded reinforcement often fail by debonding. This paper
presents an experimental and analytical study aimed at better understanding and modeling the fiber reinforced polymer (FRP)
debonding failures in strengthened RC beams under monotonic and cyclic loads. In order to investigate the flexural behavior and
failure modes of FRP-strengthened beams under monotonic and cyclic loadings, an experimental program was carried out. An
analytical study based on the energy balance of the system was also performed. It considers the dominant mechanisms of energy
dissipation during debonding and predicts the failure load of the strengthened beams. Validation of the model was carried out using
test data obtained from the own experimental investigation.
Keywords: analytical model, CFRP laminate, debonding, experimental study, RC beam, strengthening.
List of symbolsc Neutral axis depthc1 Neutral axis depth, before debonding failurec2 Neutral axis depth, after debonding failured Effective depth of beam sectionda;max Maximum aggregate sizef0c Compressive strength of concretefct Tensile strength of concretefy Yield strength of steel rebarla Bond length at interface between flexural FRP
laminate and end anchoragelc Length of constant moment regionlf Bonded length of flexural FRP laminatels Shear spanw/c Water/cement ratio of concretewa Width of wrapped FRP sheet (end anchorage)wc Width of concrete memberwf Bonded width of flexural FRP laminateAf Interfacial bond areaAs Total cross-sectional area of steel rebarD Irreversible energy dissipation of the systemDd
FRP Energy dissipation due to debonding of FRPlaminate
Dyst Energy dissipation due to yielding of steel rebar
E Elastic modulus of concreteGf Bond fracture energyGC;I Mode-I fracture energy of concrete
GC;II Mode-II fracture energy of concreteGCðhÞ Mixed-mode fracture energy of concreteGF;I Mode-I fracture energy of interfaceGF;II Mode-II fracture energy of interfaceGFðhÞ Mixed-mode fracture energy of interfaceIc Moment of inertia of transformed cross-section of
control beam in cracked conditionIs Moment of inertia of transformed cross-section of
strengthened beam in cracked conditionkb A geometric factor that considers the influence of
the laminate width relative to the width of theconcrete member
Kc Stiffness of control beam tested in four-pointbending
Ks Stiffness of strengthened beam tested in four-pointbending
L Span length of the beamPdc Load of control beam corresponding to the
deflection of Ddc
Pds Load of strengthened beam at the debonding failuredeflection of Dds
Pyc Load of control beam at rebar yieldingPddfs Failure load of strengthened beam at the debonding
displacement of ddPddfu Load of control beam corresponding to the
displacement of ddT Surface tractions acting at boundary of the systemWext Externally supplied work of the systemW Global free energy of the systema0 A constant valuedd Debonding failure displacement of strengthened
beamec Concrete strain at compressive extreme fiber
Department of Civil and Environmental Engineering,
Tarbiat Modares University, Tehran, Iran.
*Corresponding Author; E-mail: [email protected]
Copyright � The Author(s) 2016. This article is published
with open access at Springerlink.com
International Journal of Concrete Structures and MaterialsVol.10, No.4, pp.499–511, December 2016DOI 10.1007/s40069-016-0172-5ISSN 1976-0485 / eISSN 2234-1315
499
ec;1 Concrete strain at compressive extreme fiber,before debonding failure
ec;2 Concrete strain at compressive extreme fiber, afterdebonding failure
es Strain in tensile rebares;1 Strain in tensile rebar, before debonding failurees;2 Strain in tensile rebar, after debonding failuree0s;1 Strain in compressive rebar, before debonding
failuree0s;2 Strain in compressive rebar, after debonding failureey Yield strain of rebarep Plastic strain of rebarh Mode mixityn Displacementr Normal stressu Curvature of sectionu1 Curvature of section, before debonding failureu2 Curvature of section, after debonding failureDdc Deflection of strengthened beam at load points,
after debonding failureDds Deflection of strengthened beam at load points,
before debonding failureEpot Potential energy of the systemU(n) External work due to prescribed surface forcesU*(r) External work due to prescribed displacementsX Boundary of the systemqX System domain
1. Introduction
Use of fiber reinforced polymer (FRP) composites tostrengthen reinforced concrete (RC) elements has grown inpopularity and established itself as an acceptable techniquein repairing and rehabilitating the existing structures inrecent decades. The properties which make FRP ideal forstructural rehabilitation include their high strength to weightratio, corrosion resistance and the ease with which they canbe applied, especially when the structure is in use.Depending on the design objectives, bonding FRP laminatesand sheets to the external surfaces of structural membersmay lead to improvements in structural performance such asload carrying capacity, stiffness, durability and serviceabil-ity. The main applications of FRP on RC members arerelated to shear and flexural reinforcement of beams, andconfinement of columns and joints.RC elements generally fail by either crushing of com-
pressive concrete and/or yielding of internal steel rein-forcement. Although carbon fiber reinforced polymers(CFRPs) have high strength, they are brittle. When thesematerials are loaded in tension, they show a linear elasticstress–strain behavior followed by a brittle failure without ayielding plateau or any indication of an impending failure. Inflexural strengthening of beams, CFRP plates are bonded tothe tension side of beams. If the bond between concrete andadhesive remains intact, stresses can be transferred fromconcrete to CFRP, and vice versa, and full composite action
between the CFRP plate and RC beam will occur; otherwise,premature debonding occurs, the composite action is lost,and thus the beam cannot reach the theoretical ultimatecapacity of the composite beam. If an FRP-strengthenedbeam retains its composite action, there are two possiblefailure modes: (1) compressive concrete crushing prior to, orafter, tensile steel yielding, and (2) flexural failure due torupture of the FRP (Saxena et al. 2008). When debondingoccurs between FRP and concrete, the composite action ofthe beam is lost, which is characterized by the followingthree failure modes.
(1) Plate end (PE) debonding: This kind of debondinginitiates at the vicinity of the FRP end and propagatestowards the middle of the beam (Achintha andBurgoyne 2013). PE debonding is formed due to thehigh interface stresses near the ends of the bondedplate. When the stresses exceed the strength of theweakest element, failure occurs. Upon failure, the FRPwill debond from the concrete substrate, at one end ofthe beam leading to failure of the specimen.
(2) Concrete cover separation: This failure mode is formedby crack development at the plate end propagatingupwards to the level of the steel tensile reinforcementand horizontally along the reinforcement. The exten-sion of crack along the tensile reinforcement leads toconcrete cover separation and the failure of thespecimen. This type of failure typically occurs inmembers with relatively thin cover, large internalreinforcing bars and a strong FRP-concrete interface.
(3) Intermediate crack (IC) debonding: This kind ofdebonding initiates at a high-moment zone and prop-agates towards a low-moment zone (Achintha andBurgoyne 2013). When a major flexural or flexural-shear crack is formed in the concrete, the tensilestresses released by the cracked concrete are transferredto the FRP reinforcement. As a result, high localinterfacial stresses between FRP and concrete areinduced near the crack. As the applied loadingincreases further, the tensile stresses in FRP and hencethe interfacial stresses between FRP and concrete nearthe crack also increase. When these stresses reach theircritical values, debonding initiates at the crack, andthen propagates towards one of the FRP ends (Tenget al. 2002; Ceroni et al. 2008). IC debonding is acritical failure mode for relatively slender memberswith relatively thin FRP strips and is the primary focusof the recent researches (Teng et al. 2003).
Some disagreement in the literature exists regarding themost prominent failure mode of FRP-strengthened beams.Liu et al. (2007) believe the dominant failure mode to be ICdebonding, whereas Ceroni and Pecce (2010) claim thatfailure in many cases is caused by PE debonding and Saxenaet al. (2008) point at concrete cover separation as the mostcommon mode of failure. Location of failure along the beamand thickness of concrete cover detached depends on severalparameters such as cracking pattern, amount of steel rein-forcement, presence of steel stirrups, loading scheme and
500 | International Journal of Concrete Structures and Materials (Vol.10, No.4, December 2016)
interaction between shear and normal bond stresses along theinterfaces (Yao and Teng 2007; Seracino et al. 2007). It wasfound that the use of anchorage techniques, such asU-shaped and L-shaped jackets and steel bolts, could be veryuseful in avoiding or postponing the plate end interfacialdebonding and cover separation failure, and to achieve rel-evant increasing in strength and ductility, but IC debondingof FRP still occurred.Due to the premature and brittle nature of debonding
failures, properly understanding these failures and develop-ing design procedures that properly consider debondingproblems are needed to insure the safety and reliability ofFRP-strengthened members. This paper presents an experi-mental and analytical study aiming at better understandingthe debonding failures of RC beams externally strengthenedusing FRP composites, and finally proposes a predictivemodel for the FRP debonding failure load as a basis fordesign of these systems.
2. The Experimental Study
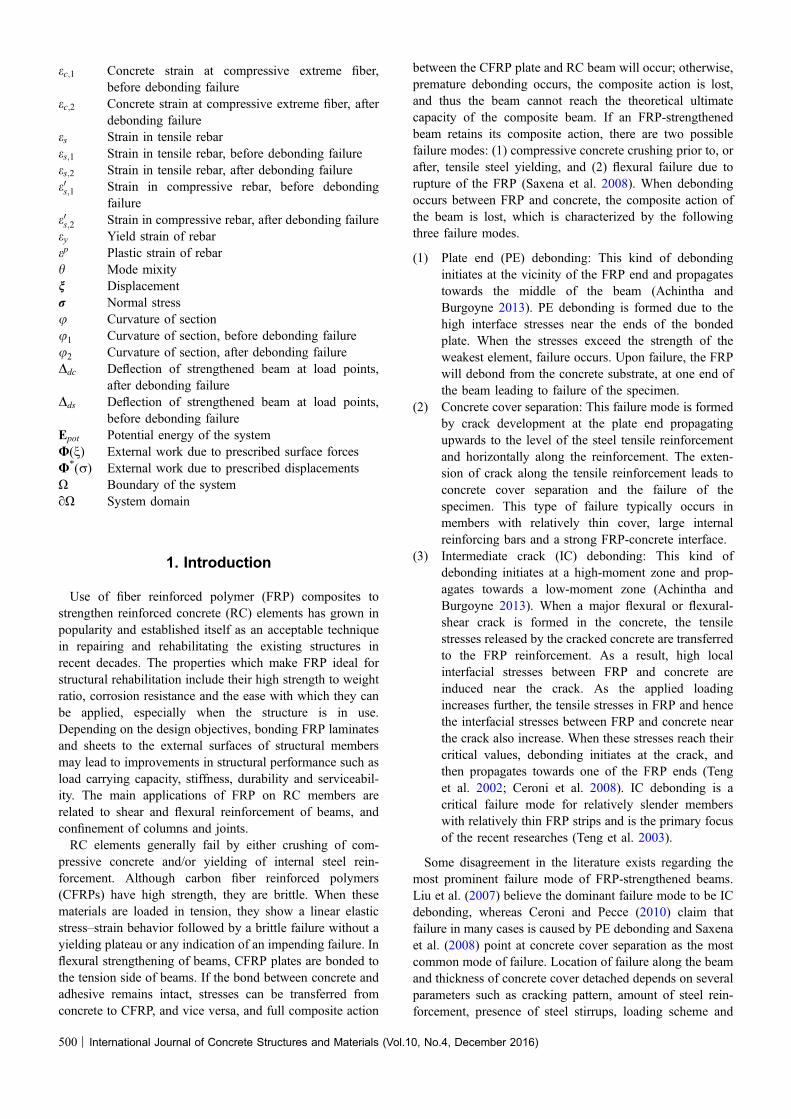
The experimental study presented herein is part of acomprehensive experimental research program carried out toinvestigate the flexural performance and failure modes ofFRP-strengthened RC beams under monotonic and reversecyclic loadings. A limited number of experimental resultsthat are used in the analytical study are provided in thispaper. This section presents the results of flexural tests car-ried out on nine RC beam specimens, with dimensions of150 mm width, 200 mm height and 1800 mm length. Fig-ure 1 illustrates the geometrical dimensions and reinforcingdetails for all specimens.Three of the nine specimens were control beams with no
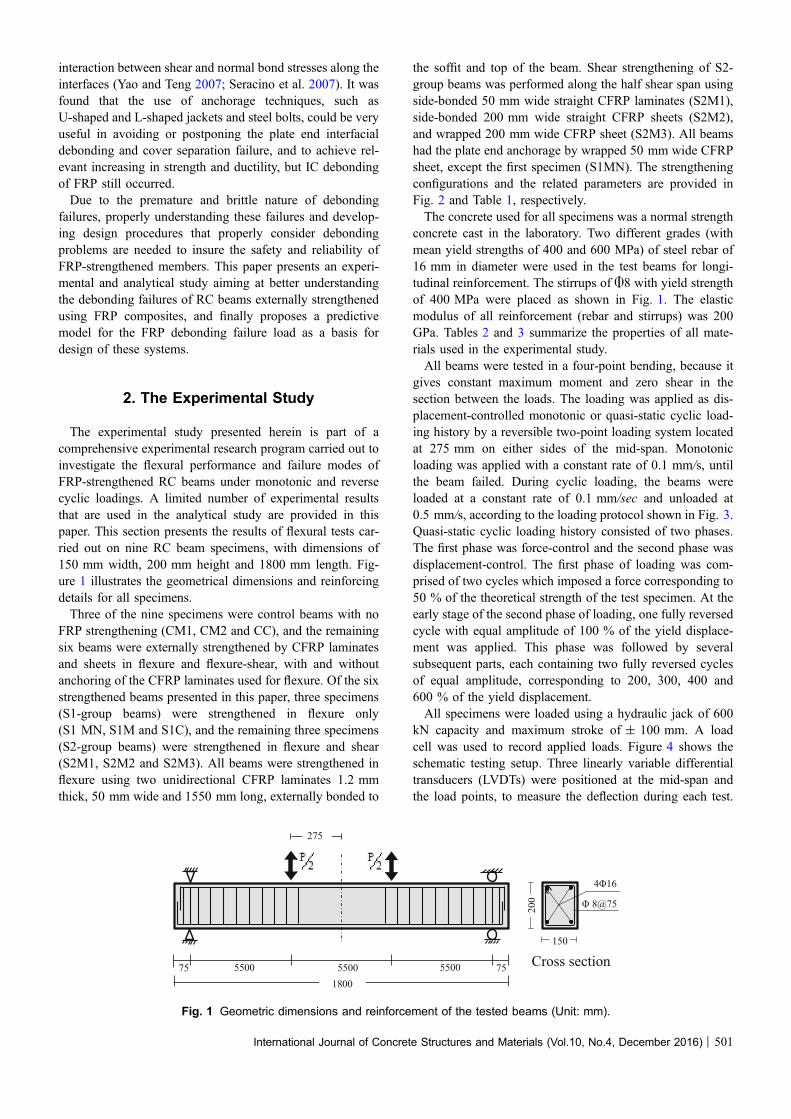
FRP strengthening (CM1, CM2 and CC), and the remainingsix beams were externally strengthened by CFRP laminatesand sheets in flexure and flexure-shear, with and withoutanchoring of the CFRP laminates used for flexure. Of the sixstrengthened beams presented in this paper, three specimens(S1-group beams) were strengthened in flexure only(S1 MN, S1M and S1C), and the remaining three specimens(S2-group beams) were strengthened in flexure and shear(S2M1, S2M2 and S2M3). All beams were strengthened inflexure using two unidirectional CFRP laminates 1.2 mmthick, 50 mm wide and 1550 mm long, externally bonded to
the soffit and top of the beam. Shear strengthening of S2-group beams was performed along the half shear span usingside-bonded 50 mm wide straight CFRP laminates (S2M1),side-bonded 200 mm wide straight CFRP sheets (S2M2),and wrapped 200 mm wide CFRP sheet (S2M3). All beamshad the plate end anchorage by wrapped 50 mm wide CFRPsheet, except the first specimen (S1MN). The strengtheningconfigurations and the related parameters are provided inFig. 2 and Table 1, respectively.The concrete used for all specimens was a normal strength
concrete cast in the laboratory. Two different grades (withmean yield strengths of 400 and 600 MPa) of steel rebar of16 mm in diameter were used in the test beams for longi-tudinal reinforcement. The stirrups of A8 with yield strengthof 400 MPa were placed as shown in Fig. 1. The elasticmodulus of all reinforcement (rebar and stirrups) was 200GPa. Tables 2 and 3 summarize the properties of all mate-rials used in the experimental study.All beams were tested in a four-point bending, because it
gives constant maximum moment and zero shear in thesection between the loads. The loading was applied as dis-placement-controlled monotonic or quasi-static cyclic load-ing history by a reversible two-point loading system locatedat 275 mm on either sides of the mid-span. Monotonicloading was applied with a constant rate of 0.1 mm/s, untilthe beam failed. During cyclic loading, the beams wereloaded at a constant rate of 0.1 mm/sec and unloaded at0.5 mm/s, according to the loading protocol shown in Fig. 3.Quasi-static cyclic loading history consisted of two phases.The first phase was force-control and the second phase wasdisplacement-control. The first phase of loading was com-prised of two cycles which imposed a force corresponding to50 % of the theoretical strength of the test specimen. At theearly stage of the second phase of loading, one fully reversedcycle with equal amplitude of 100 % of the yield displace-ment was applied. This phase was followed by severalsubsequent parts, each containing two fully reversed cyclesof equal amplitude, corresponding to 200, 300, 400 and600 % of the yield displacement.All specimens were loaded using a hydraulic jack of 600
kN capacity and maximum stroke of ± 100 mm. A loadcell was used to record applied loads. Figure 4 shows theschematic testing setup. Three linearly variable differentialtransducers (LVDTs) were positioned at the mid-span andthe load points, to measure the deflection during each test.
150
200
Cross section
8@75
5500 5500 75 75 5500 1800
275
Fig. 1 Geometric dimensions and reinforcement of the tested beams (Unit: mm).
International Journal of Concrete Structures and Materials (Vol.10, No.4, December 2016) | 501

(a) S1-group beams: Beams strengthened in flexure
(b) S2-group beams: Beams strengthened in flexure and shear
50CFRP Laminate
CFRP Laminate
50S1MN
50CFRP Laminate
CFRP sheet (end anchorage)
CFRP Laminate
50S1M
50CFRP Laminate
CFRP sheet (end anchorage)
CFRP Laminate
50
S1C
50CFRP laminate
CFRP sheet (end anchorage)
CFRP Laminate
50
S2M1CFRP laminate
(Shear strengthening)
50CFRP laminate
CFRP sheet (end anchorage)
CFRP laminate
50
S2M2CFRP sheet
(Shear strengthening)
50CFRP laminate
CFRP sheet (end anchorage)
CFRP laminate
50
S2M3Wrapped CFRP sheet(Shear strengthening)
Fig. 2 Strengthening configurations of specimens. a S1-group beams: Beams strengthened in flexure b S2-group beams: Beamsstrengthened in flexure and shear.
Table 2 Concrete and steel rebar properties (MPa).
Specimens Label Concrete compressive strength Steel yield strength
Number ofsamples
Mean l f 0c� �
Standarddeviation r f 0c
� � Number ofsamples
Mean l fy� �
Standarddeviation r fy
� �
Control beams CM1 6 30.2 2.7 3 400.1 1.9
CM2 6 38.7 2.1 3 598.9 2.4
CC 6 40.6 3.1
Strengthenedbeams
S1C 6 39.6 3.7 3 600.6 2.7
S1 M 6 40.7 1.5
S1MN 6 32.7 2.6 3 399.7 2.1
S2M1 6 40.5 3.1
S2M2 6 37.5 1.9
S2M3 6 33.8 1.0
Table 1 Strengthening parameters for specimens.
Specimens Label Loading history Flexural strengthening with CFRP laminate End anchorage Shear strengthening with CFRPlaminate/sheet
wf (mm) tf (mm) Lf (mm) wf (mm) Type (laminateor sheet)
Control beams CM1 Monotonic – – – – – –
CM2 Monotonic – – – – – –
CC Cyclic – – – – – –
Strengthenedbeams
S1-group S1 MN Monotonic 50 1.2 1550 No – –
S1M Monotonic 50 1.2 1550 Yes (EA) – –
S1C Cyclic 50 1.2 1550 Yes (EA) – –
S2-group S2M1 Monotonic 50 1.2 1550 Yes (EA) 50 Laminate(t = 1.2 mm)
S2M2 Monotonic 50 1.2 1550 Yes (EA) 200 Sheet
S2M3 Monotonic 50 1.2 1550 Yes (EA) 200 Wrapped Sheet
S1 Beams strengthened in flexure only; S2 Beams strengthened in flexure and shear; EA End anchorage by wrapped CFRP sheet of 50 mm wide.
502 | International Journal of Concrete Structures and Materials (Vol.10, No.4, December 2016)

The output data including applied load and deflectionswere recorded during the test by a computer data loggersystem.
Figure 5 shows load–deflection curve of control beamsCM1, CM2 and CC tested under monotonic, monotonic andcyclic loadings, respectively. The load carrying capacity ofmonotonic control beams CM1 and CM2 were 114 and 135kN, respectively. The difference in load capacity of thesebeams can be attributed to the change in rebar grade andproperties of concrete used (see Table 2). The load–deflec-tion curves of CC and CM2 specimens show the samebehavior, but a slight difference in load capacity and duc-tility are observed (Fig. 5b). The control beams failed bytypical steel yielding followed by concrete crushing, andshowed wide flexural cracks at mid-span that extended to thecompression area.The load–deflection response for the beams strengthened
with CFRP laminates and sheets, and tested under mono-tonic and cyclic loadings are shown in Fig. 6. The loadcarrying capacity of monotonic beams strengthened inflexure (S1 MN and S1 M) were 123 and 150 kN, respec-tively. S1 MN and S1 M specimens are the strengthenedbeams corresponding to the control beams CM1 and CM2,respectively. Therefore, behavior of S1 MN and S1 M wascompared with that of their respective control beams CM1and CM2. As shown in Figs. 6a and 6b, the load carryingcapacity of beams S1 MN and S1M was increased in com-parison with their respective control beams (CM1 and CM2),until the debonding failure occurred. After debonding fail-ure, beam S1M shows a behavior similar to CM2, and beamS1MN behaves as a beam with less strength than CM1. Aclose observation from Fig. 6 is that while the load carryingcapacity of beam S1M was increased by 12 % higher thanthat of the control beam CM2 (Fig. 6b), the load carrying
Table 3 Properties of materials used for strengthening (MPa).
Material Tensile strength Shear strength Elastic modulus
CFRP laminate 3420 – 171,600
Epoxy adhesive1 49.5 25 4500
CFRP Sheeta,b 4194 – 226,100
Resina 49.8 – 3200
a The properties were provided by the manufacturer.b The properties of CFRP sheet have been reported based on the net fiber area.
-1000-800-600-400-200
0200400600800
1000
0 2 4 6 8 10 12 14
%yi
eld
Cycle No.
Displacement Control Force
Control
Fig. 3 Cyclic loading protocol (Filiatrault et al. 2008).
Hinging support
Load cell
Reversible hydraulic jack
Reaction frame
Strong Floor
Reversible two-point loading system
: LVDT
Position of LVDTs on beam
Specime
Fig. 4 Schematic testing setup.
(a) (b)1MCmaeblortnoC Control beams CM2 and CC
0
20
40
60
80
100
120
140
0 10 20 30 40 50
App
lied
load
(kN
)
Deflection (mm)
CM1
-140-120-100
-80-60-40-20
020406080
100120140
-40 -30 -20 -10 0 10 20 30 40 50
App
lied
load
(kN
)
Deflection (mm)
CM2CC
Fig. 5 Load-deflection curve of control beams.
International Journal of Concrete Structures and Materials (Vol.10, No.4, December 2016) | 503

capacity of beam S1MN was increased by about 8 % higherthan that of the control beam CM1 (Fig. 6a). The lowerincrease in the load carrying capacity of beam S1MN is dueto the premature failure of this specimen through enddebonding of tensile CFRP laminate. The failure mode ofbeam S1MN was plate-end debonding that occurred at theright end of tensile laminate, followed by completedebonding of tensile CFRP laminate. Finally, this beam wasfailed because of the crushing of compressive concrete(flexural failure mode). The debonding failure mode of beamS1M was the interfacial debonding of tensile laminateinduced by flexural-shear cracks formed in the right shearspan of the beam, followed by the buckling of compressiveCFRP laminate, and finally, by the crushing of compressiveconcrete.S2M1, S2M2 and S2M3 specimens were strengthened in
both flexure and shear, and were tested under monotonicloading. The load capacity of strengthened beams S2M1,S2M2 and S2M3 were 127, 133 and 137 kN, respectively.Wrapping of the beam S2M3 by CFRP sheet resulted inmore increasing of load capacity in comparison with theother specimens of S2-group (S2M1 and S2M2). As shownin Fig. 6a, the load carrying capacity of beams S2M1, S2M2and S2M3 was increased 3, 8 and 11 % higher than that ofthe strengthened beam S1MN, until the debonding of tensilelaminate occurred. After that, a behavior similar to S1MNwas shown for beams S2M1 and S2M2; while the beamS2M3 behaved as a beam with more strength than S1MN,until the debonding of compressive laminate occurred, andthen showed a behavior similar to S1MN. Although S2M1and S2M2 specimens showed a significant load drop of 33and 43kN occurred in one step, the beam S2M3 showedsignificant load drops of 24 and 39 kN occurred in two steps.Then, as can be seen from Fig. 6a, wrapping of thestrengthened beams by CFRP sheet (S2M3) can result inbetter performance of specimen. The failure mode of beamS2M1 was interfacial debonding of tensile laminate inducedby flexural crack formed in the beam mid-span, followed bythe debonding and buckling of the bottom CFRP. The failuremode of beam S2M2 was interfacial debonding of tensilelaminate induced by flexural-shear crack formed in the left
shear span, followed by the partial debondings and finallythe buckling of compressive CFRP laminate. The beamS2M3 failed due to initiation and propagation of theinterfacial debonding of tensile laminate induced by flex-ural-shear crack formed in the right shear span (regionclose to the right load position). These cracks propagatedtowards the right end of tensile laminate, followed byrupture of end anchorage which occurred along the rightshear span of the beam, and resulted in completedebonding of tensile CFRP laminate and the buckling ofcompressive CFRP laminate.The load–deflection curve of the two identical FRP-
strengthened beams tested under monotonic (S1 M) andcyclic (S1C) loadings are shown in Fig. 6b. As shown in thisfigure, the behavior and characteristics of the two beams arenearly identical, as the backbone of load–deflection curve ofspecimen S1 M appears as the envelope curve for the load–deflection curve of specimen S1C. It should be noted that thebeam CC is the cyclic control beam corresponding to thecyclic strengthened beam S1C. The increase in load capacityof S1C, compared with that of the beam CC, was 15 %. Thefailure mode of beam S1C was the interfacial debonding ofCFRP laminates, followed by complete debonding of topand bottom CFRP laminates. For the cyclic strengthenedspecimen (S1C), the debonding of top and bottom laminatesoccurred in upward and downward 4th cycles of load,respectively. The debonding of top laminate initiated fromthe location of close to the left load position, and propagatedtowards the left end of the beam and the mid-span, while thatof the bottom laminate initiated at the mid-span, and prop-agated towards both ends of beam.
3. Analytical Model of FRP Debonding
Although the fracture process of the FRP-strengthenedbeams is gradual and stable in initial steps of loading, uponreaching a critical energy state, the debonding failure occurs;which results in the energy transformations in the system.‘‘In order to study the energy variation of a FRP strengthened
(a) S1MN, S2M1, S2M2 and S2M3 specimens in comparison with their relevant control beam CM1
(b) S1M and S1C specimens in comparison with their relevant control beam CM2
0
20
40
60
80
100
120
140
0 10 20 30 40 50 60
App
lied
load
(kN
)
Deflection (mm)
CM1S1MNS2M1S2M2S2M3
-160-140-120-100
-80-60-40-20
020406080
100120140160
-50 -40 -30 -20 -10 0 10 20 30 40 50
App
lied
load
(kN
)
Deflection (mm)
CM2S1MS1C
Fig. 6 Load-deflection curve of strengthened beams.
504 | International Journal of Concrete Structures and Materials (Vol.10, No.4, December 2016)

beam during loading steps, energy balance equation wasused.Considering the energy balance in FRP-strengthened
beam, the irreversible energy dissipation of the system, D,can be written as (Ulm and Coussy 2001):
dD ¼ dWext � dW ð1Þ
in which, Wext and W are the total external work and the freeenergy of the system, respectively. Equation (1) indicatesthat the amount of externally supplied work, not stored in thesystem as free energy, is dissipated in the system. In theabsence of inertia and body forces, the total external work,Wext, of the system with domain X and boundary qX can beobtained from the theorem of virtual work, as follows:
Wext ¼Z
oXT : n dA ð2Þ
where T denotes surface tractions acting at boundary of thesystem. The externally supplied work in Eq. (2) can beseparated into two parts as the external work due toprescribed surface forces, U(n), and the external work dueto prescribed displacements, U*(r), as follows:
Wext ¼ U nð Þ þ U�ðrÞ ð3Þ
Combining Eqs. (1) through (3), and introducing thepotential energy of the system, Epot, in the following form(Buyukozturk et al. 2002):
Epot ¼ W � U ð4Þ
the expression for total energy dissipation in Eq. (1) can berewritten, for constant prescribed surface forces anddisplacements, as follows: (dD & DD, dEpot & DEpot)
DD ¼ �DEpot ð5Þ
Thus, this equation gives the total energy dissipationduring debonding as the negative change in the potentialenergy of the system. In order to establish a criterion for FRPdebonding based on Eq. (5), it is necessary to determine theterms of the right and left hand sides of Eq. (5).The term of right hand side of Eq. (5), DEpot, states the
total change in the potential energy of the system duringdebonding, which equals to the difference between therecoverable energy stored in the beam before and afterdebonding. The potential energy difference betweenstrengthened and debonded states of FRP-strengthenedbeams is graphically shown in Fig. 7. Once debondingfailure occurs, the strengthened beam (shown with solid line)is assumed to behave as an un-strengthened beam (shownwith thick dashed line). According to Buyukozturk et al.(2002), the difference in the potential energy of the beam,before and after debonding is illustrated by the shaded area.As can be seen from Fig. 7, the change in potential energy
can be calculated through the load–deflection curves of thestrengthened and control (unstrengthened) beams. Theseload–deflection curves have been idealized based on the
bilinear load–displacement relationship, and the equal stiff-ness of unloading and pre-yielding stages. It should be notedthat Fig. 7 is based on assuming the beam deflection andcurvature stay constant upon debonding, which includes asignificant error in predicting the load of debonding failure.The results of the present tested specimens and other testresults (Ceroni and Pecce 2005; Esfahani et al. 2007; Ceroni2010; Obaidat et al. 2011; Spadea et al. 2015) indicate thatthe beam deflection and thus the curvature increases duringdebonding failure from Dds to Ddc. Detailed explanation isgiven in Sect. 3.1. Therefore, the difference in the potentialenergy of the beam, before and after debonding, can beindicated by the shaded area shown in Fig. 8.Considering the increase in beam deflection during
debonding failure, the change in the potential energy of thebeam, before and after debonding, (DEpot) is obtained asbelow (Fig. 8):
DEpot ¼P 2ds
2Ks� P 2
dc
2Kcþ dDd
2Pds þ Pdcð Þ ð6Þ
in which, dDd = Ddc—Dds; Dds and Ddc are the deflection ofthe strengthened beam at load points, before and afterdebonding failure, respectively; Pds = P(D = Dds) andPdc = P(D = Ddc) are the load values for before and afterdebonding failure, respectively; and Ks and Kc are thestiffness of the strengthened and control beams respectively,which in the case of a beam tested in four-point bending canbe expressed by (Gunes et al. 2006):
Ks ¼ 2EIs
�L
2l2s �
2
3l3s
� �; Kc ¼ 2EIc
�L
2l2s �
2
3l3s
� �
ð7Þ
where Is and Ic are the moments of inertia of the transformedsections in cracked condition, before and after debondingfailure, respectively. Having established the potential energydifference of the beam during debonding (DEpot), it requiresto determine the term of left hand side of Eq. (5), DD, whichstates the total energy dissipation of the beam duringdebonding failure.The total energy dissipation (DD) in FRP-strengthened
beams under loading occurs due to the various mechanisms
Fig. 7 Potential energy difference in the beam upon debond-ing failure (Buyukozturk et al. 2002).
International Journal of Concrete Structures and Materials (Vol.10, No.4, December 2016) | 505

such as concrete cracking, rebar yielding and FRP debond-ing. Considering the various experimental observations, theenergy dissipation within the system due to mechanism ofconcrete cracking is less significance compared to the otherterms, since much of the concrete cracking takes placebefore debonding. Assuming the energy dissipation due tothis mechanism to be insignificant, the dominant modes ofenergy dissipation are the debonding fracture process and thesteel rebar yielding. Thus, the total energy dissipated duringdebonding failure is equal to the interface fracture energyand a plastic energy term that accompanies the fractureprocess. Then, the expression for energy dissipation (DD)can be written in general terms as:
DD ¼ DdFRP þ Dy
st ð8Þ
in which, DdFRP is the energy dissipation due to debonding of
FRP laminate, and the term Dyst represents the energy dis-
sipation due to yielding of steel rebar. It is obvious that Dyst is
equal to zero when es B ey. Then, debonding failure is not apure fracture process in FRP-strengthened RC beams, and aterm of the energy dissipation due to rebar yielding isincluded in the expression of energy dissipation (DD). Thus,it is necessary to quantify these two mechanisms for mod-elling of debonding failure.
3.1 Energy Dissipated due to Rebar YieldingAs shown in Fig. 8, FRP debonding in the strengthened
beams may take place before or after rebar yielding, whichdepends on several parameters such as beam geometry,amount of steel reinforcement and strengthening configura-tion. To formulate a debonding failure criteria based onEq. (8), the term of energy dissipation due to yielding ofsteel rebar (Dy
st) should be characterized.Buyukozturk et al. (2002) considered the dissipated energy
due to yielding of rebar as a linear function of the failuredisplacement, and presented an approximate expression as:
Dyst � 3:0 Pdd
fs � Pddfu
� �ð9Þ
where Pddfs is the failure load of the strengthened beam at the
debonding displacement of dd, indicated as point B in Fig. 7,
and Pddfu is the load of control beam corresponding to the
displacement of dd, shown as point C in Fig. 7. Consideringthat this empirical expression is inadequate, an improvedestimation is required that also takes into account the beamgeometry and reinforcement. Gunes et al. (2006) assumedthat the displacement and thus the curvature of the beamstays constant upon debonding, and derived the term ofenergy dissipation due to rebar yielding, as follows:
Dyst ¼
Zr: depdX ¼fyecð1� c2=c1ÞAslc ð10Þ
in which, ep = es-ey[ 0, and lc is the length of the constantmoment region.Although the assumption of constant curvature at
debonding was also adopted in the theoretical analysis car-ried out by Bencardino and Condello (2016), experimentaldata sets produced by other researchers (Ceroni and Pecce2005; Esfahani et al. 2007; Ceroni 2010; Obaidat et al. 2011;Spadea et al. 2015), and also the tested beams herein showthat assuming the constant deflection and curvature duringdebonding is not valid and can be resulted in significant errorin predicting the load of debonding failure. In contrast withassuming the constant deflection during debonding, theabove mentioned results indicate that the deflection andcurvature of the beam increases by 7–15 %, duringdebonding failure. In this research, considering the increaseof 10 % in the deflection and thus curvature of the beamduring debonding failure (Fig. 8), the energy dissipationterm during debonding through yielding of the steel rein-forcement can be derived. Figure 9 shows the strain profilein the beam cross-section before and after debonding failure.Using the definition of curvature (u = ec/c), considering thestrain compatibility as es = u (d–c), and assuming theincrease of 10 % in the curvature during debonding failure(u2 = 1.1u1), the change in rebar strain upon debonding isgiven by:
Des ¼ es;2 � es;1 ¼ ecð1þ 0:1d=c1 � 1:1 c2=c1Þ ð11Þ
Using Eq. (11), the term of energy dissipation due to rebaryielding during debonding failure can be determined by:
(a) debonding failure before rebar yielding (b) debonding failure after rebar yielding
App
lied
load
, P
Beam deflection,
Pdc
Pys Control Beam
Strengthened Beam
ds dc
Pds
Kc
Ks
Pfs
1
1
App
lied
load
, P
Beam deflection, ds dc
Pdc
Pys Control beam
Strengthened beam Pds
Kc Kc
Ks Ks
Pfs
Fig. 8 Energy dissipation during debonding failure.
506 | International Journal of Concrete Structures and Materials (Vol.10, No.4, December 2016)

Dyst ¼
Zr: depdX ¼ rsDesAsls
¼ fyecð1þ 0:1d=c1 � 1:1c2=c1ÞAslc ð12Þ
where all notations are depicted in Fig. 9. Subscripts 1 and 2denote quantities for before and after debonding failure,respectively. This term of energy dissipation equals zerowhen es B ey.
3.2 Energy Dissipated due to FRP DebondingAs stated previously, the term of energy dissipation due to
FRP debonding (DdFRP) is an important part of Eq. (8) which
evaluated over the interface crack surface. This term ofenergy dissipation is defined by the energy per unit areanecessary for the crack formation, called the bond fractureenergy (Gf), and the interfacial bond area (Af), as follows:
DdFRP ¼
ZGf dAf ð13Þ
The portion of the energy of the system, which dissipatedat the FRP-concrete interface upon debonding, causes tocreate the new fracture surfaces along the bond area.Depending on the fracture properties of the materials, thedebonding may occur within or at the interfaces of thematerials.A crack in a material can propagate either by opening
(mode-I), shearing between the two crack faces (mode-II), orby a combination of both (mixed-mode). In different modesof fracture, different stress-displacement fields will developin the vicinity of the crack, so the fracture energy depends onwhich fracture mode occurs (Achintha and Burgoyne 2013).Although in the case of brittle, isotropic and homogeneoussolids, cracks propagate by maintaining pure mode-I con-dition at the crack tip, the stress field that triggers debondingat an interface can be very complex (Hutchinson and Suo1992). Various forms of stress concentrations develop due todifferent fracture energies of two joining materials and alsodue to the number of geometric constraints present in thevicinity. Thus, it would be expected that interface cracks aregoverned by mixed-mode effects. An interface crack undermixed-mode loading can experience either kinking orstraight-ahead propagation, depending on the relative frac-ture resistances associated with the competing possible
directions of advance (Hutchinson and Suo 1992). Instraight-ahead propagation case, the interface is relativelyweaker than the bordering materials, meaning that theinterface crack propagates along the least resistance path,interface. In the crack kinking case, the interface is relativelytougher than at least one of two adjoining materials (Li et al.1995).The mixed-mode fracture energy of interface depends on
the respective fracture energies of pure primary modes (GF,I
and GF,II) and also on the magnitude of the component ofeach primary mode of fracture involved during a unit totalextension of the crack (Hutchinson and Suo 1992). Therelative contributions of each primary mode is nominated‘‘mode mixity’’, h, which defined as the ratio of the com-ponents of mode-II to mode-I. The mixed-mode interfacefracture energy usually increases with the increase of h, sinceGF,II is often higher than GF,I. In linear elastic fracturemechanics, the mode mixity (h) is defined as:
tan h ¼ffiffiffiffiffiffiffiffiffiffiffiffiffiffiffiffiffiffiffiffiffiGF;II
GF;I
qð14Þ
So, the bond fracture energy Gf in Eq. (13) can beexpressed as:
Gf ¼ GFðhÞ ð15Þ
in which, the mixed-mode fracture energy of the interfaceGF(h), can be regarded as an effective surface energy thatdepends on the mode mixity h; where h = 0 and 90� cor-respond to pure mode-I and mode-II fractures, respectively.To accurately predict the debonding behavior of an exter-nally FRP-strengthened RC beam, the concrete substrate andboth concrete-adhesive and FRP-adhesive interfaces must beconsidered. Methods dealing with mixed-mode fracture oflayered materials can account for the fracture properties ofthe interfaces and substrate materials and can be used todetermine the debonding propagation path that may occuralong the FRP-concrete interface or within the concrete.Most researchers assumed that the debonding crack propa-gates only along the FRP-concrete interface or within theconcrete substrate. However, Hearing and Buyukozturk(1997) modeled the FRP debonding as a crack that initiateswithin the concrete-adhesive interface and then propagatesalong the interface or into each of the substrates. Gunes et al.(2006) considered the debonding as a crack that propagatesalong the concrete-adhesive interface and does not divergeinto the substrates. Also, they assumed that the mixed-modefracture energy converges rapidly to the mode-II value athigh phase angles due to friction and asperity effects such assurface roughness; and thus emphasized that the debondingcan be regarded as mode-II fracture of concrete-adhesiveinterface.Although most models of FRP debonding are based on
mode-II fracture energy of the bonded system which ismostly determined by simple shear tests, experimentalobservations and results confirm that the concrete substratejust above the interface is the most likely place for failure tooccur. Also, the experimental results confirm that concrete
=
> >
(b) (c)(a)
Fig. 9 Strain profile across beam section: a beam cross-section, b strain distribution before debonding, andc strain distribution after debonding.
International Journal of Concrete Structures and Materials (Vol.10, No.4, December 2016) | 507
cracking initiates as a mode-I fracture; especially whenadhesives recommended by FRP manufacturer are used withappropriate curing procedures. It is also considered in manyexperimental research that the debonding failure occurs inconcrete at a few millimeters from the FRP-concrete inter-face and is essentially parallel to the interface. This phe-nomenon is because of two reasons: first, the penetration ofadhesive into the concrete, and the increase in toughness andstrength of a thin layer of mortar just next to the interface;and second, the concrete substrate is the weakest componentin FRP-concrete interface which has a relatively small tensilestrength (Coronado and Lopez 2008). Thus, the debondingbehavior is mostly related to the concrete properties, andconcrete cracking initiates as a mode-I fracture.Briefly, studies of most researchers have shown that:
(1) Although the interface of a strengthened beam isprimarily carrying shear, it actually fails in tension.Thus, FRP debonding propagates locally as a mode-Ifracture in concrete (Achintha and Burgoyne2011, 2013).In both cases of PE and IC debondings, the debondingoccurs within the concrete substrate, adjacent to theinterface; and meanwhile, the effects of mode-I aredominant in the debonding propagation. The wholeconcrete cover of the beam usually separates during PEdebonding, whereas a concrete layer of only a fewmillimeters thick separates during IC debonding(Achintha and Burgoyne 2012).
(2) Because of the relatively high shear fracture resistanceof concrete, it has been widely assumed that a crackunder mixed-mode loadings propagates by opening ofthe crack tip, although the direction of propagationdepends on the mode mixity. It has been further derivedthat a crack starts to open when the maximum principaltensile stress (MPTS) at the crack tip reaches fct, andinstantaneous propagation will be in the directionperpendicular to that of the MPTS. Thus, it isappropriate to assume that the crack opening will beassociated with the same fracture energy as that underpure mode-I. This assumption has been widely vali-dated in the literature (Galvez et al. 1998).
(3) Single/double shear-lap experiments, which commonlyused in the literature to determine the parameters forthe analysis of FRP debonding, do not providemeaningful fracture parameters that can be used inthe analysis; because the tests provide an estimate ofmode-II fracture energy whereas a mode-I fracturetriggers debonding. Fracture energy values derivedfrom the tests (GC,II) were significantly higher than thatagainst FRP debonding (Achintha and Burgoyne2012, 2013).
(4) Some recent studies have experimentally investigatedthe mode-I fracture energy in the vicinity of concrete-FRP interface, and shown that the fracture energycalculated is of similar magnitude to that of pureconcrete. The results illustrated that if the failure takesplace within the concrete, the presence of nearby FRP
does not affect fracture energy GC,I (Achintha andBurgoyne 2013, Qiao and Xu 2004).
(5) Manufacturers have now developed sufficiently toughadhesives that, if used correctly, failure usually takesplace in the concrete just above the interface. Thus, it ispossible to assume that the interface fracture energy,GF, is the same as the fracture energy of concrete, GC
(Achintha and Burgoyne 2012, 2013).
Regarding the above discussions, in this research, the FRPdebonding is assumed to propagate as a mode-I fracture ofconcrete; thus, the fracture energy of the FRP-concreteinterface is equal to mode-I fracture energy of concrete.Experimental observations during tested beams have alsorevealed that debonding at the FRP–concrete interface gen-erally occurs within concrete, at a few millimeters from theFRP-concrete interface as parallel to the interface; whiledebonding of end anchorage takes place at the FRP–FRPinterface as a mode-II fracture. Thus, the associated fractureenergies can be considered as:
Gf ¼ GCðhÞ � GC;I
: flexural FRP laminate � concrete interface ð16Þ
Gf ¼ �GFðhÞ� �GF;II : flexural FRP laminate
� FRP end anchorage interface ð17Þ
in which, GC(h) and GC,I are the mixed-mode and mode-Ifracture energies of concrete; GF(h) and GF,II are the mixed-mode and mode-II fracture energy of the interface betweenthe flexural FRP laminate and wrapped FRP sheet (endanchorage). Now, by assuming that debonding occurs alongthe entire bond area between the flexural FRP reinforcementand concrete, the term of the debonding energy dissipation(Eq. (13)) can be rewritten as:
DdFRP ¼ GC;I ðlf :wf Þ þ �GF;IIðla:waÞ ð18Þ
where lf.wf is the bond area at interface between the flexuralFRP laminate and concrete, and la.wa is the bond areabetween the flexural FRP laminate and the wrapped FRPsheet (end anchorage). To determine the term of energydissipation due to FRP debonding process (Eq. (18)), itrequires the knowledge of the fracture energies of GC,I andGF,II .Achintha and Burgoyne (2013) tested and discussed the
performance of several models of mode-I fracture energy ofconcrete, including empirical or analytical models ofGustafsson and Hillerborg (1985), Reinhardt (1985), Guineaet al. (1994), CEB-FIP code (1991), and Bazant and Becq-Giraudon (2001). Achintha and Burgoyne (2013) showedthat the estimations from all models, but the CEB-FIP code(1991) which underestimates GC,I, give predictions thatmatch well with values to be expected from tests; and foundthat among these models, the empirical model of Bazant andBecq-Giraudon is the best that precisely estimates the mode-I fracture energy of concrete (GC,I). Thus, model of Bazantand Becq-Giraudon (2001) was used in this research as the
508 | International Journal of Concrete Structures and Materials (Vol.10, No.4, December 2016)

selected model, which considers the mode-I fracture energyof concrete, GC,I, as below:
GC;I ¼ 2:5a0 f 0c0:051
� �0:461þ da�max=11:27ð Þ0:22 w=cð Þ�0:30
ð19Þ
in which, a0 = 1 and 1.44 for rounded and crushed aggre-gates respectively. In this research, a0 = 1.44, w/c = 0.47,and da-max = 12.5 mm. So, the mode-I fracture energy ofconcrete is obtained based on the compressive strength ofcylindrical concrete samples.Knowledge of mode-II fracture energy of the interface
between the flexural FRP laminate and FRP end anchorage(GF,II) is virtually very limited at this time. Gunes et al.(2006) stated that the value of GF,II is higher than that ofGF,II, and assumed to be twice the Mode-II fracture energy ofthe FRP-concrete interface (GF,II). Due to lack of measuredvalues of GF,II, it is assumed to be the same as that used byGunes et al. (2006). Thus, GF,II was assumed to be twice thefracture energy GF,II until further research into this parameterreveals more reliable values.
�GF;II ¼ 2GF;II ð20Þ
in which, GF,II is determined as:
GF;II ¼ 0:122k2bffiffiffiffif 0c
pð21Þ
where kb is a geometric factor that considers the influence ofthe laminate width (wf) relative to the width of the concretemember (wc) according to the following expression:
kb ¼
ffiffiffiffiffiffiffiffiffiffiffiffiffiffiffiffiffiffiffiffiffiffiffiffiffiffiffiffiffiffiffiffiffiffiffi
1:1252� wf
wc
1þ wf
400
s
ð22Þ
3.3 Debonding Failure ModelUsing Eqs. (5), (6), (8), (12), and (18) through (22), an
improved debonding criterion can be developed, whichbased on bilinear assumption for the beam load–deflectioncurves, as follows:
P 2ds
2Ks� P 2
dc
2Kcþ dDd
2Pds þ Pdcð Þ
¼ ðGC;I lf wf þ �GF;II lawaÞ þ fyecð1þ 0:1d=c1� 1:1c2=c1ÞAslc ð23Þ
Equation (23) indicates that upon debonding failure, theportion of energy of the system dissipates through debond-ing fracture and yielding of the steel rebar. Furthermore, asshown in Fig. 8, in the case of debonding failure after rebaryielding, Pdc = Pyc, and thus, Eq. (23) can be simplified asbelow; where Pyc is the load capacity of the control beam atrebar yielding.
P 2ds
2Ks�
P 2yc
2Kcþ dDd
2Pds þ Pyc
� �
¼ ðGC;I lf wf þ �GF;II lawaÞ þ fyecð1þ 0:1d=c1� 1:1c2=c1ÞAslc ð24Þ
where the debonding failure load (Pds) can be determinedthrough iteration and trial and error.
4. Validation of the Model
In order to validate the developed model, the model wasimplemented to predict the load of FRP debonding for thebeam tests presented in the Sect. 2; then predictions of themodel were compared with the experimental results. Fig-ure 10 indicates the experimental results obtained from thetypical beam tests; and also the bilinear load–deflectioncurves for the strengthened and control beams, which shownwith the dashed lines in the figure. These idealized bilinearcurves were used as a basis for determination of the debondingfailure loads according to Eq. (24). In Fig. 10, the envelope ofthe load–deflection curve of the cyclic beam S1C has beenpresented along with the load–deflection curve of the mono-tonic beam S1 M. As indicated in Fig. 10, the debondingfailure in the beams S1MN, S2M1, S2M2 and S2M3 occurredafter rebar yielding (Fig. 10a), while the debonding failure inthe beams S1 M and S1C occurred before rebar yielding orsimultaneously with each other (Fig. 10b).Figure 11 compares the debonding model predictions with
the test results, which indicates that the model yields a satis-factory prediction of the loads of FRP debonding failure. Ascan be seen from Fig. 11, the proposed model is able to pre-cisely predict the loads of debonding failure in FRP-strengthened RC beams. In order to compare the precision ofthe proposed model with Gunes et al. (2006) model, the
(b) Results of the strengthened beams S1MN,S2M1, S2M2 and S2M3
(b) Results of the strengthened beams S1M and S1C
0
20
40
60
80
100
120
140
160
0 5 10 15 20 25
App
lied
load
(kN
)
Deflection (mm)
Idealized bilinear curve of load-deflection (Control Beam)Idealized bilinear curve of load-deflection (Strengthened Beam)
CM1
S1MN S2M1
S2M2 S2M3
0
20
40
60
80
100
120
140
160
180
0 5 10 15 20 25 30
App
lied
load
(kN
)
Deflection (mm)
Bilinear curve of load-deflection (Control beam)Bilinear curve of load-deflection (Strengthened beam)
CM2 S1MS1C
Fig. 10 Experimental results obtained from beam tests.
International Journal of Concrete Structures and Materials (Vol.10, No.4, December 2016) | 509

predictions of debonding load for the beams of this researchwhich obtained based on Gunes model, along with the pre-dictions of present model were also presented in Fig. 11. Ascan be found from the figure, Gunes model is less precise thanthe present one, and gives the predictions much more than theactual values of the test, which seems to be due to theassumptions of the model (stated in earlier sections); while thepresent model estimates the debonding loads with a goodprecision. In order to perform further validation of the pro-posed model, it was tested on a number of experimental datasets produced by various researchers. Implementation of themodel to these sets of independently reported data shows thatthe model can satisfactorily predict the debonding failureloads for various sizes of beams strengthened using FRPreinforcement, with or without bond anchorage (Fig. 12).
5. Conclusions
An analytical model has been developed through experi-mental study and analytical modeling for predicting the FRPdebonding failures. The following conclusions are drawnfrom the current research.
(1) Experimental results obtained from tested FRP-strengthened beams revealed that providing the end
anchorage for the flexural FRP reinforcement plays asignificant role in load performance and failure mech-anism. Reduction in the load capacity was observed forbeams without end anchorage (due to the prematurefailure through PE debonding of flexural FRP) com-pared to those with end anchorage. As a result ofexperimental tests, it is recommended that a minimumbond anchorage is provided at the end regions of theFRP flexural to ensure improved load performance.
(2) While the debonding mode of the strengthened beamthat have no end anchorage was PE debonding, that ofthe remaining strengthened specimens with endanchorages was IC debonding induced by flexural orflexural-shear cracks formed in mid-span or in shearspan of the beam.
(3) The proposed analytical model was developed forpredicting of the load of debonding failures in RCbeams externally strengthened in flexure or flexure/shear by FRP reinforcement.
(4) The model yields a satisfactory prediction of the loadsof FRP debonding failure in strengthened beams underboth monotonic and cyclic loadings.
(5) The proposed model is able to precisely predict bothPE and IC debondings in FRP-strengthened RC beams.
(6) Model was verified by comparing the results with aseries of experimental tests carried out by presentauthors and other researchers. The model showssatisfactory agreement with the experimental results.
(7) A remarkable feature of the model lies in the fact that theeffects of the member geometry, strengthening config-uration, and bond anchorage is included in the model.
(8) The proposed model does not address cover debondingfailures since this failure type appears to be mainlyinfluenced by the shear capacity of the beam. Also, theeffect of ‘‘bond anchorage’’ in this model does notinclude mechanical anchorages such as steel or fiberanchors.
Open Access
This article is distributed under the terms of the CreativeCommons Attribution 4.0 International License(http://creativecommons.org/licenses/by/4.0/), which per-mits unrestricted use, distribution, and reproduction in anymedium, provided you give appropriate credit to the originalauthor(s) and the source, provide a link to the CreativeCommons license, and indicate if changes were made.
References
Achintha, M., & Burgoyne, C. (2011). Fracture mechanics of
plate debonding: Validation against experiment. Construc-
tion and Building Materials, 25, 2961–2971.
100
110
120
130
140
150
160
170
180
190
200
100 120 140 160 180 200
Pred
icte
d de
bond
ing
load
(kN
)
Experimental debonding load (kN)
Proposed modelGunes model
Fig. 11 Comparison of the predictions of proposed modelwith those of Gunes model.
0
50
100
150
200
0 50 100 150 200
Pred
icte
d de
bond
ing
load
(kN
)
Experimental debonding load (kN)
Aram et al. 2008Gunes et al. 2006Ceroni 2010Gamata et al. 2007
Fig. 12 Model predictions for various sets of experimentaldata.
510 | International Journal of Concrete Structures and Materials (Vol.10, No.4, December 2016)

Achintha, M., & Burgoyne, C. (2012). Prediction of FRP
debonding using the global-energy-balance approach.
Magazine of Concrete Research, 64(11), 1033–1044.
Achintha, M., & Burgoyne, C. (2013). Fracture energy of the
concrete-FRP interface in strengthened beams. Journal of
Engineering Fracture Mechanics, 110, 38–51.
Bazant, Z. P., & Becq-Giraudon, E. (2001). Statistical prediction
of fracture parameters of concrete and implications for
choice of testing standard. Cement and Concrete Research,
32(4), 529–556.
Bencardino, F., & Condello, A. (2016). Eco-friendly external
strengthening system for existing reinforced concrete
beams. Journal of Composites-Part B: Engineering, 93,
163–173.
Buyukozturk, O., Gunes, O., & Karaca, E. (2002). Characteri-
zation and modeling of debonding in RC beams strength-
ened with FRP composites. In Proceedings of the 15th
ASCE conference on engineering mechanics. New York,
NY: Columbia University.
Ceroni, F. (2010). Experimental performances of RC beams
strengthened with FRP materials. Construction and Build-
ing Materials, 24, 1547–1559.
Ceroni, F., & Pecce, M. (2005). Strength and ductility of RC
beams strengthened with FRP materials under monotonic
and cyclic loads. The fib symposium on keep concrete
attractive, Budapest, Hungary.
Ceroni, F., & Pecce, M. (2010). Evaluation of bond strength in
concrete elements externally reinforced with CFRP sheets
and anchoring devices. Journal of Composites for Con-
struction, 14(5), 521–530.
Ceroni, F., Pecce, M., Matthys, S., & Taerwe, L. (2008). Bond
tests on concrete elements with CFRP and anchorage sys-
tems. Journal of Composites-Part B, 39, 429–441.
Comite Euro-International du Beton-Federation Internationale
de la Precontrainte. (1991). CEB–FIP Model Code. Lau-
sanne, Switzerland.
Coronado, C. A., & Lopez, M. M. (2008). Experimental char-
acterization of concrete-epoxy interfaces. Journal of
Materials in Civil Engineering ASCE, 20(4), 303–312.
Esfahani, M. R., Kianoush, M. R., & Tajari, A. R. (2007).
Flexural behavior of reinforced concrete beams strength-
ened by CFRP sheets. Engineering Structures, 29,
2428–2444.
Filiatrault, A., Wanitkorkul, A., & Constantinou, M. (2008).
Development and appraisal of a numerical cyclic loading
protocol for quantifying building system performance.
Report MCEER-08-0013, pp. 3–4.
Galvez, J. C., Elices, M., Guinea, G. V., & Planas, J. (1998).
Mixed mode fracture of concrete under proportional and
non-proportional loading. International Journal of Frac-
ture, 94(3), 267–284.
Gamata, G., Spacone, E., & Zarnic, R. (2007). Experimental
and nonlinear finite element studies of RC beams
strengthened with FRP plates. Journal of Composites-Part
B: Engineering, 38, 277–288.
Guinea, G. V., Planas, J., & Elices, M. (1994). A general
bilinear fit for the softening curve of concrete. Materials
and Structures, 27(2), 99–105.
Gunes, O., Karaca, E., & Gunes, B. (2006). Design of FRP
retrofitted flexural members against debonding failures. In
Proceedings of the 8th U.S. national conference on earth-
quake engineering, San Francisco, CA.
Gustafsson, P. J., & Hillerborg, A. (1985). Improvements in
concrete design achieved through the application of fracture
mechanics. In S. P. Shah (Ed.), Application of fracture
mechanics to cementitious composites (pp. 639–680).
Dordrecht, Netherlands: Springer, CE.
Hearing B., & Buyukozturk O. (1997). Failure behavior of pre-
cracked concrete retrofitted with fiber reinforced plastic
laminates. In Proceedings of the 7th international confer-
ence on structural faults and repair. Edinburgh, UK.
Hutchinson, J. W., & Suo, Z. (1992). Mixed mode cracking in
layered materials. Advances in Applied Mechanics, 191,
29–63.
Li, V. C., Lim, Y. M., & Foremsky, D. J. (1995). Interfacial
fracture toughness of concrete repair materials. In Pro-
ceedings of the 2nd conference on fracture mechanics of
concrete structures. Freiburg, Germany.
Liu, I. S. T., Oehlers, D. J., & Seracino, R. (2007). Study of
intermediate crack debonding in adhesively plated beams.
Journal of Composites for Construction, 11(2), 175–183.
Obaidat, Y., Heyden, S., Dahlblom, O., Abu-Farsakh, G., &
Abdel-Jawad, Y. (2011). Retrofitting of reinforced concrete
beams using composite laminates. Construction and
Building Materials, 25(2), 591–597.
Qiao, P., & Xu, Y. (2004). Evaluation of fracture energy of
composite–concrete bonded interfaces using three-point
bend tests. Journal of Composite Construction, 8(4),
352–359.
Reinhardt, H. W. (1985). Crack softening zone in plain concrete
under static loading. Cement and Concrete Research, 15(1),
42–52.
Saxena, P., Toutanji, H., & Noumowe, A. (2008). Failure
analysis of FRP-strengthened RC beams. Journal of
Composites for Construction, 12(1), 2–14.
Seracino, R., Saifulnaz, M. R. R., & Oehlers, D. J. (2007).
Generic debonding resistance of EB and NSM plate-to-
concrete joints. Journal of Composites for Construction,
ASCE, 11(1), 62–70.
Spadea, G., Bencardino, F., Sorrenti, F., & Swamy, R. N.
(2015). Structural effectiveness of FRP materials in
strengthening RC beams. Engineering Structures, 99,
631–641.
Teng, J. G., Chen, J. F., Smith, S. T., & Lam, L. (2002). FRP
strengthened RC structures. New York, NY: Wiley.
Teng, J. G., Smith, S. T., Yao, J., & Chen, J. F. (2003). Inter-
mediate crack-induced debonding in RC beams and slabs.
Journal of Construction and Building Materials, 17(6–7),
447–462.
Ulm, F. J., & Coussy, O. (2001). Mechanics and durability of
solids. Solid mechanics (Vol. I). Prentice Hall series on
civil, environmental and systems engineering, Cambridge,
MA.
Yao, J., & Teng, J. G. (2007). Plate end debonding in FRP-
plated RC beams—I: experiments. Engineering Structures,
29, 2457–2471.
International Journal of Concrete Structures and Materials (Vol.10, No.4, December 2016) | 511