an anti-distraction field operational test · in the eor project a camera was detecting whether the...
TRANSCRIPT

EyesOnRoad An anti-distraction Field Operational Test
Johan Karlsson, Camilla Apoy, Autoliv Henrik Lind, Sergejs Dombrovskis, Volvo Car Corporation, Micael Axestål, Markus Johansson, ÅF-Technology
2016-02-29
FFI-Vehicle and Traffic Safety Program
Contents
1. Summary ........................................................................................................... 3
2. Background ....................................................................................................... 3
3. Objectives .......................................................................................................... 5
4. Execution........................................................................................................... 5
Work package 1 – Framework and preparation ..................................................................... 6
Work package 2 – Distraction warning development ............................................................ 8
Work package 3 – FOT execution ....................................................................................... 12
Work package 4 – Benefit analysis and dissemination ........................................................ 13
5. Results ............................................................................................................. 16
Contributions to the FFI Aims and Goal .............................................................................. 16
6. Conclusions and continued research .............................................................. 17
7. Dissemination and publications ..................................................................... 18
8. Contributing partners and contact information ............................................ 19
9. References ....................................................................................................... 19
1. Summary Human errors due to distraction are a direct cause or a contributing factor in a majority of vehicle crashes and impacts. Visual-manual secondary tasks are critical according to naturalistic driving studies. NHTSA’s recently proposed Design Guidelines with purpose to limit potential driver distraction from secondary, non-driving-related, visual-manual tasks performed on integrated electronic devices.
With external cameras and radars, some of the crashes caused by distraction can be mitigated or even avoided thanks to active safety functions. An attention sensor could increase the effectiveness of such systems and generate positive side effects. Moreover, such a sensor will be useful in future cars with partially or fully automated driving.
For the Eyes-On-Road (EOR) project, a prototype system for real-time measurement of driver visual attention has been developed by Autoliv. The sensor was installed in 10 vehicles by ÅF-Technology (ÅF) and Volvo Car Corporation (Volvo Cars), and used in everyday traffic. Drivers/users were Volvo Cars employees with a company car leasing contract. A distraction warning was developed and implemented in the cars by Volvo Cars and ÅF. Vehicle data logging, remote monitoring, and system maintenance was carried out by ÅF. Cars were also equipped automatic emergency braking, adaptive cruise control and lane keep assist.
The overall aim of the project was to evaluate the possibility to influence the driver’s visual behavior toward a reduction of critically long glances away from the road. For this purpose a naturalistic driving study / Field operational test was carried out with an online warning alerting the driver if s/he was looking away from the roadway for too long. The experimental protocols used was within group ABA design, meaning data was collected in three phases, baseline, treatment and repeated baseline. This allows for testing the effect of warnings compared to no warnings, and also a possibility to see whether the effects of warnings persist after removal.
In addition to analysis of distraction warnings, uniquely broad naturalistic data about driver glance behavior has been collected. Data show great similarities to previous studies where video clips of driver collected in naturalistic settings have been manually annotated for eyes-off-road, indicating a basic level of validity.
It was shown that driver off road glance duration is dependent on among other things, driving speed, daylight, use of Adaptive Cruise Control (ACC), lead vehicle presence and weekend or weekday driving. There was also a tendency of reduced number of warnings when the distraction warning was active, compared to baseline performance. Finally, no connection between Lane Keeping Aid (LKA) and Forward Collision Warning (FCW) activations and visual distraction could be identified. Following project completion further data analysis beyond the original scope of the project will be carried out for risk analysis and behavioral studies.
2. Background Human errors such as distraction are a contributing factor in a majority of vehicle crashes and impacts. According to Lee, Young and Regan (2009) driver distraction “is
a diversion of attention away from activities critical for safe driving toward a
competing activity”. In a review article of naturalistic driving studies, Dingus et al (2011) discussed the risk of near crashes and driver tasks. All tasks with higher odds ratio than 2 were visual-manual. Furthermore most of the riskiest tasks required multiple steps to complete and required multiple glances away from the roadway.
Based on scientific evidence, NHTSA recently proposed a first phase voluntary Driver Distraction Guidelines to promote safety by discouraging the introduction of excessively distracting devices in vehicles. The NHTSA Guidelines recommend devices to be designed so that tasks can be completed by the driver while driving with glances away from the roadway of 2 seconds or less, and a cumulative time spent glancing away from the roadway of 12 seconds or less.
Active safety, enabled by forward looking cameras and radars (Coelingh et al 2007, Lind 2007), will play a crucial role in reducing serious and fatal injuries. Insurance Institute of Highway Safety concluded in their status report July 3, 2012 (IIHS 2012) that automatic braking already significantly reduce crash claims. According to Strandroth et al (2012) car occupant fatalities may be reduced by up to 50% from 2010 to 2020 given a high implementation of automatic braking, lane keep assist and electronic stability control (in combination with median barriers on rural roads etc).
Forward collision warning, automatic braking, lane departure warnings and lane keep assist address situations where the driver is inattentive to what’s happening in front of the car without actually knowing about the visual state of the driver. There are numerous reasons (e.g. adaptive settings, transitions to and from automated driving modes) to monitor not only the environment outside the car but also the driver. The driver can be monitored by information about braking or acceleration response or hands-on-steering wheel. The next step should be distraction sensors. Driver cameras in research vehicles have been used extensively in order to capture eye-blinking and gaze, [for example Sandberg et al 2011]. In 2006 the first driver camera in a production vehicle was introduced by Toyota in a Lexus model. The Human-Machine Interface (HMI) of that system does not include a specific distraction warning but is used to change the threshold of collision warning to reduce the frequency of nuisance alerts.
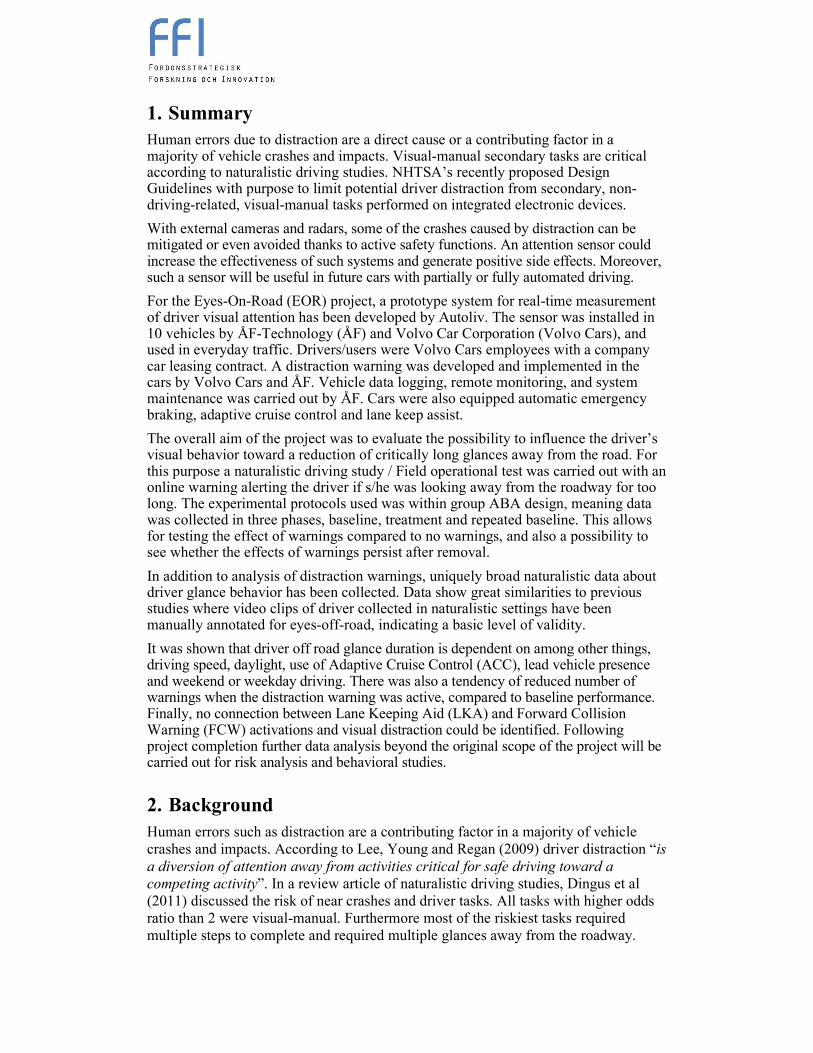
Figure 1 A driver with, a) eyes on the road and, b) without eyes on the road
In the EOR project a camera was detecting whether the driver’s eyes were on or off the road, see Figure 1. This information was assessed and used to trigger a warning after prolonged visual driver distraction. The main objective was to evaluate the feasibility of anti-distraction warnings, based on an Eyes-On-Road sensor, by comparing baseline visual distraction to treatment (with anti-distraction warning) visual distraction. As a remark, the Eyes-On-Road sensor is robust in nature and its output can also be used to change the performance of other active safety systems such as forward collision warnings, lane keep assistance, or automatic emergency braking systems. This was however not in the scope of the EOR project.

3. Objectives The overall aim of the project was to evaluate the possibility to influence the driver’s
visual behaviour toward a reduction of critically long glances away from the road. The aim was achieved by means of an FOT with ten cars equipped with a prototype sensor measuring whether or not there are eyes directed towards the road.
In addition to analysis of distraction warnings, the naturalistic data about driver glance collected was expected to extend the knowledge about driver distraction in relation to contextual parameters, such as, driving speed, daylight, use of ACC, LKA and FCW, lead vehicle presence, and weekend or weekday driving. Following project completion further data analysis beyond the original scope of the project will be carried out, such as risk analyses and behavioral studies.
4. Execution Ten vehicles in a Field Operational Test (FOT) fleet were equipped with the system described below. The system logged driver behavior data – particularly data about driver distraction. The FOT was designed to investigate whether driver distraction behavior can be affected by correcting long glancing drivers by applying a warning through a HMI.
Figure 2 Gantt chart for the original time plan.
Time Plan
The project was divided into four work packages, which are described in this report. The original time plan can be seen in Figure 2. There were two major delays

compared to this, firstly, the installation in the 10 fleet cars were delayed by some 1-2 months due to delayed production start of the intended vehicle configuration. Secondly, there was a 6 month delay in the data collection phases, since a major redesign of the Eyes-on-Road algorithm was needed due to computer/hardware performance limitations leading to EOR system instability. For this reason, baseline data collection started in December instead of August of 2014, and since the cars were still dismantled starting June of 2015, the data collection phases were slightly shorter than originally intended and only one treatment period was performed, hence there was no possibility to explore the effect of different HMI modalities.
Work package 1 – Framework and preparation
EOR – Functional Overview
The Driving monitoring system is intended to monitor the driver and broadcast a set of drive characteristic data over a vehicle network. The functionality is grouped into two main applications, Eyes-on-road and eyelid opening.
The purpose of the driver Eyes-on-road application is to monitor whether the drivers eyes are directed toward the road or not. The functionality is based on a frame-based eyes-on-road detection, and driver inattention is accumulated over time. Combined with vehicle data, a decision logic handles warning output to the vehicle. The eyelid data can be used to monitor the alertness and sleepiness of the driver, and is based on an eyelid opening detector, from which blink length, closing and opening parameters are extracted. These can be used as input to a decision logic to monitor the driver drowsiness. The sleepiness module was not tested in the FOT, and will thus not be described further here, although the eyelid opening parameter was calculated and logged along with other data.
EOR System description
The EOR system is a vision system, consisting of a computer, a camera unit with an interface box, and two separate IR illumination modules1, (IRM), connected with a synchronization unit. The camera provides images for further image analysis in the software. It consists of further sub-components, housing, lens, filters, and imager. There are also a number of support and communication systems, for e.g. synchronization of light sources with the exposure time in the imager.
The EOR software is developed as a concept demonstrator by Autoliv Research. The general idea is to detect drivers eyes with a high degree of reliability and robust-ness, and from there classify whether or not the eyes are directed towards the road. Drivers’ eyes are detected by a combination of detection algorithms and tracking. Once an eye has been detected, the following detections are more likely to occur in the area nearest the previous detection. The algorithm can detect and track two eyes independently. The location and size of each detected eye is logged along with other eye-related information.
1 Prototypes for the light sources were confirmed to comply with eye safety standard IEC-SS/EN62471 by laboratory tests per-formed at SP in Borås. SP report, MTk3P08460 issued 2014-01-07, (item Light source 4: Oslon 940 with 23°small reflectors 8 mm).

The road area for Eyes-on-road detection is defined as a rectangular2 area +/-10° to the left and right of a center line through the drivers’ seat, and +/-7° up and down from the horizon (Figure 4). If the driver is looking inside this area, the eyes are classified as Eyes-on-road, if looking outside the area, the eyes are classified as Eye-off-road, thus providing a Boolean signal.
Figure 4 Conceptual boundaries between 'Eyes-on-road' area (green), and 'Eyes-off-road' area (red)
The EOR Boolean signal is checked for quality/reliability, and thereafter passed into an integrator function which calculates the cumulative eyes-off-road duration – often referred to as the ‘Distraction buffer’, further described in the chapter about distraction warning development.
2 In practice, the detection area takes on a more oval shape
Figure 3 The Driver Monitoring System as installed in the FOT cars, with camera and light units
10° 10°
7°
7°

Study design
The study was designed as a within groups ABA comparison, i.e. it was divided into three periods- baseline, treatment and reset- of ten, eight and four weeks length respectively. Distraction warning algorithms were active during all three phases, but HMI was only active during the treatment phase. This way, data of drivers’ unaffected behavior could be collected during the first period, to serve as a baseline for comparison. A simple HMI was developed and activated when the test fleet entered the treatment phase. Its purpose was to draw drivers’ attention back to the road when the system detected inattention. The HMI is further described in the section on HMI design. Following the treatment period, a second baseline (sometimes referred to as ‘reset’), data collection served as basis for investigation of whether any effect on drivers would remain even after the treatment was deactivated. Data collected from the cars included normal kinematic parameters, (speed, acceleration, driver inputs etc.) as well as position and driver distraction state and eyelid opening from the EOR system.
Two driver surveys were conducted in total. The subjects were notified by email to fill in an online form. The first survey was sent out one week prior to installation and activation of the treatment system when drivers were expected to have familiarized themselves with the car. The second survey was sent out one week prior to treatment deactivation, when drivers were expected to have ample experience with the distraction warning. The survey show generally positive attitudes towards the system as implemented, but with some spread in opinions likely from drivers where the system performance was suboptimal.
The first survey focused on driver background and general attitude towards driving and driver support systems, while the second survey was focused on questions that related to drivers experience with the EOR system, e.g. self-assessed safety benefit.
As a complement to the surveys, and as a way to get some idea of drivers’ perception of the usefulness of the system as implemented in the car, all drivers were called to one hour debriefing sessions to discuss and share their experience with the Eyes-On-Road System. Five out of ten drivers were able to meet up in two separate sessions.
Work package 2 – Distraction warning development
Distraction Warning
Distraction warning algorithm development was primarily handled by Volvo Cars. The warning algorithm had to be ready for the treatment phase (February 2015) and relied on improvements in the EOR algorithms installed from December 2014.
Over the years many different distraction warning algorithms have been presented that usually were developed for a single hardware setup and tested only within a limited research project. Majority of published algorithms were never compared to alternative algorithms and are therefore of unknown value. Many algorithms rely on detailed information such as exact pitch/yaw gaze angle (and sometimes also head angle). In some cases a model of interior is used to assign different criteria based on what a driver could be looking at, for example “AttenD” algorithm (Kircher et al. 2009). These limitations significantly reduce the number of applicable warning

algorithms that were feasible to adopt for EOR study with a limited binary eye state signal as the only algorithm input.
Given the above mentioned limitations Victor and Larsson warning algorithm was one of the best candidates for implementation as:
● it can be implemented using only the signals available in the EOR system. ● it is very well documented and supported by several published papers ● it was used in more than one study ● at least 1 recent comparison study identified that it performed better than the 3
tested alternatives (Lee et al 2013).
The Victor and Larsson warning algorithm was demonstrated to work given a certain input data, but the data filtering for the EOR sensor had to be based on other techniques as EOR system has its own specific limitations. For the filtering the main consideration was the physiological limitations of eye movement. Specifically it is known that eye blinks have a duration of around 0.2 s. This value was the base for noise and other disturbance filtering threshold for input data filtering.
Warning strategy
There are 3 main components for an eye-tracker based warning strategy: 1. The data filtering algorithm - ensures that the data supplied to the warning
algorithm is of high confidence and removes various noise and artifacts from the source signals.
2. The warning algorithm itself - determines what combination of conditions (input data) is indicative of distraction and therefore when can a system warn the driver.
3. The inhibition logic - self diagnostics routines that block warning algorithm in case there is a high likelihood of false warning based on warning history and algorithm state changes.
Warning algorithm
The overall warning algorithm is the same as described by Victor (2010). The algor-ithm uses the large and small PRC windows for accumulating Percent Road Centre (PRC) statistics as well as has a threshold on the “single long glance”.The warning algorithm needed some additional tuning to produce warnings as originally intended. The changes in tuning can be attributed to the differences in the eye sensor data used, especially differences in the definition of “ON-road” glance area. It serves as a reminder that despite principal decoupling of data filtering from warning algorithm, there still may be a need to adjust warning algorithm due to changes in sensor data or filtering.
During development the Victor and Larsson warning algorithm proved to work at least as good as more simple algorithms but notably only a small fraction of warnings was triggered by the complex “Percent Road Center Distraction Alert” that utilizes PRC windows. This time sharing detection algorithm effectively reacts on long total gaze time on task (which is directly related to total task completion time). The majority of warnings come from the “single long glance” threshold which is very simple in implementation and was actually significantly upgraded compared to the published variant.

Inhibition logic
The inhibition logic was added in addition to the main warning code to avoid false warnings under conditions that were known to be outside design specifications and when input data is detected as unreliable. On a basic level it was decided to limit availability of the warning for straight road driving on speeds above 60 km/h. At lower speeds it was considered to be an increased risk that drivers’ gaze behavior would significantly differ from highway driving which was the reference environment by design. There was also a filtering for sharp turns at speed, such as for highway exits. Finally there were various inhibitions against repeated warnings.
HMI design
A warning HMI was developed to serve as a stimuli to encourage drivers to look back at the road. Thus reducing long glances away from the road ahead. The HMI was implemented in visual and auditory modalities, building on experience from FCW. FCW is a system aiming to mitigate driver distraction in rear end collision events, (Lee et al., 2004). FCW has been a major research topics since the nineties. In 1998 the first FCW system was introduced on the Mercedes S class with an HMI using an audible alert and a flashing tell-tale. In 2006 Volvo Cars introduced an FCW system including a visual alert using a light emitting diode type of Head Up Display (HUD) combined with audible warning.
The scope of the Eyes-On-Road study is to review the efficiency of introducing a distraction mitigation warning in prolonged driver distraction situations, i.e. independent of if the driver is in a high risk situation or not. Several methods of warning modalities was reviewed. Finally a combination of the current Volvo Cars FCW head up display available in the Eyes-On-Road vehicles was selected in combination with an auditory alert with medium intrusiveness.
Visual warning
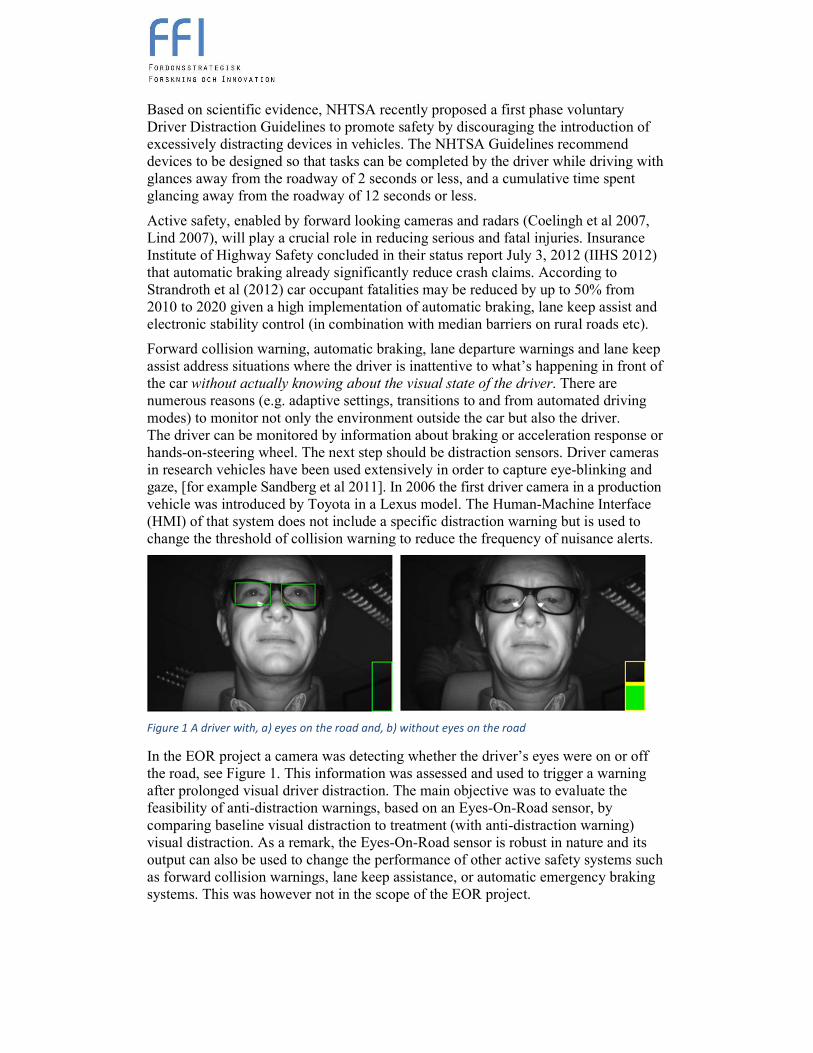
The HMI principles of the FCW systems involve interface modalities, as well as user acceptance and preference. Warning interface modalities utilize human channels of perception in rendering feedback or warning information to the driver. Among the five sensory perception channels, the visual and auditory channels are most often used in conveying information, including warning, to the driver. Regarding the visual modes, recent studies have shown the high potential of the HUD. The HUD has certain features advantageous for a warning system compared to other visual displays. Foremost among these is its location within the driver’s forward visual field or cone while driving, (Figure 5). However, the advantage of the HUD being located directly in driver’s field of view (see Figure 6) can easily become a disadvantage if the visual warnings introduce false alarms and even nuisance alarms. This is quite true and unavoidable since the system is required to provide warnings such that all drivers are able to avoid forward collision crashes in all possible situations. The resulting system would necessarily provide alerts to a large number of drivers in situations that they did not consider alarming.
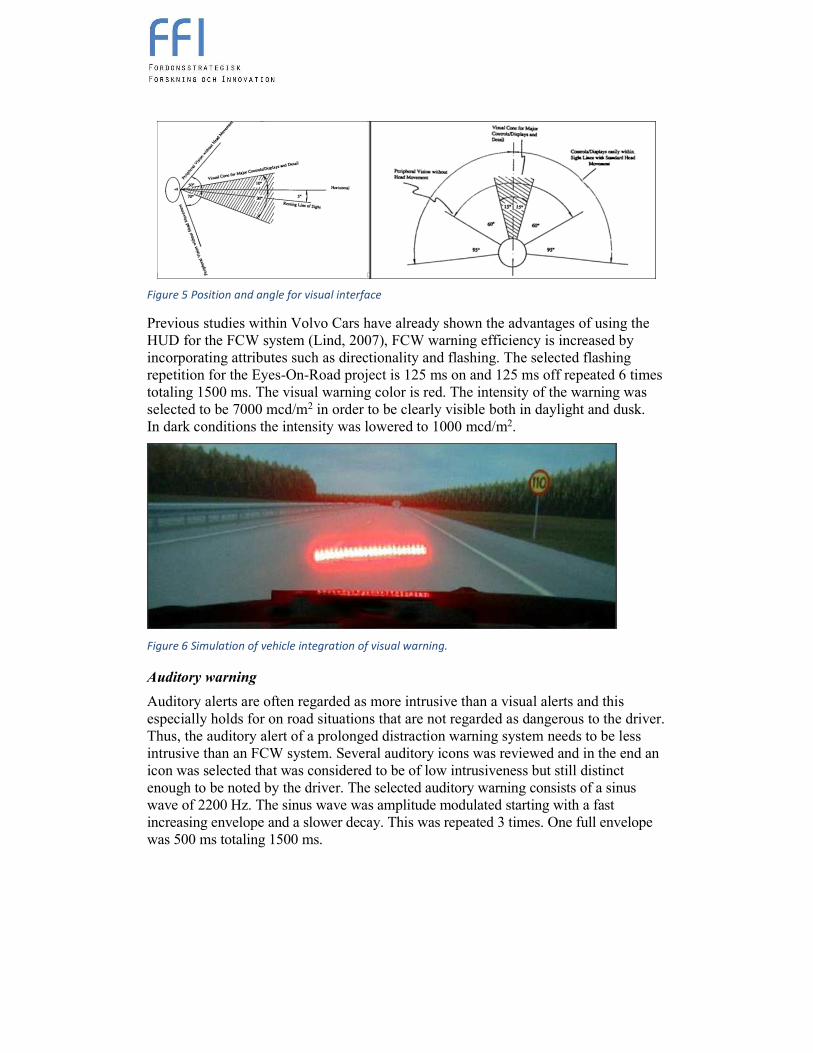
Figure 5 Position and angle for visual interface
Previous studies within Volvo Cars have already shown the advantages of using the HUD for the FCW system (Lind, 2007), FCW warning efficiency is increased by incorporating attributes such as directionality and flashing. The selected flashing repetition for the Eyes-On-Road project is 125 ms on and 125 ms off repeated 6 times totaling 1500 ms. The visual warning color is red. The intensity of the warning was selected to be 7000 mcd/m2 in order to be clearly visible both in daylight and dusk. In dark conditions the intensity was lowered to 1000 mcd/m2.
Figure 6 Simulation of vehicle integration of visual warning.
Auditory warning
Auditory alerts are often regarded as more intrusive than a visual alerts and this especially holds for on road situations that are not regarded as dangerous to the driver. Thus, the auditory alert of a prolonged distraction warning system needs to be less intrusive than an FCW system. Several auditory icons was reviewed and in the end an icon was selected that was considered to be of low intrusiveness but still distinct enough to be noted by the driver. The selected auditory warning consists of a sinus wave of 2200 Hz. The sinus wave was amplitude modulated starting with a fast increasing envelope and a slower decay. This was repeated 3 times. One full envelope was 500 ms totaling 1500 ms.
Work package 3 – FOT execution
Equipment
The cars were equipped with the EOR system, a logger system and an HMI. Each of these technical systems with their respective subsystems are described in the following chapter. The installation work was performed in cooperation between all partners, and was carried out at Volvo Cars workshops.
Logger system
The logger system was based on the setup used in the EuroFOT project but went through some minor modifications and additions.
The system contained a context logger computer (Nexcom VTC6100) where internal and external devices had been connected to collect video and several data streams such as CAN, accelerometer and GPS. The logger also collected data from the Eyes-On-Road computer (Arbor Rigid-770) and was responsible of keeping the two computers time synchronised.
The software for data acquisition was an improved version of the EuroFOT Logger software, extended with abilities to save signal output from the Eyes-On-Road computer such as distraction buffer, eye on road etc, which were transferred to the context logger via UDP, and saved along with all other captured data.
The algorithm for Eyes-On-Road was depending on vehicle data, such as speed, yaw rate and steering wheel angle. This information was available through the CAN-channels into the context logger. The receiving software was modified to extract correct signals and then transferred to the Eyes-On-Road computer via UDP-packets.
Only one external SSD was used to store all log files on during data capture which meant software had to be written to be able to transfer all generated files on the EOR-computer to the external disk connected to the context logger.
A lightbar (see HMI design) was used to indicate to the driver that the EOR-warning was active. Software was therefore written to control the lightbar. It could be set to two different brightness levels and also the blink rate.
Time synchronisation
The logged data in both computer had to be synchronized in time with a requirement of around 1ms time difference between the two. Windows Timestamp Project3 (was evaluated and chosen for the implementation as it could provide a lower resolution timestamping (down to 1µs as compared to Windows standard 5-15ms) as well as its ability to synchronize the clock with an NTP server better than a pure NTP implementation.
Over the course of data collection, the time synchronization proved to work in most cases, but there were several time synchronization failures and some principal drawbacks that were addressed.
3 http://www.windowstimestamp.com/)
Work package 4 – Benefit analysis and dissemination
Data quality
A crucial part of EOR sensor data analysis was data filtering and glance detection. On a sensor level, the output includes a binary On/Off-road signal for each eye as well as a number of signals that can be used for data quality estimates. The overall data filtering was very similar to the one used in the distraction warning
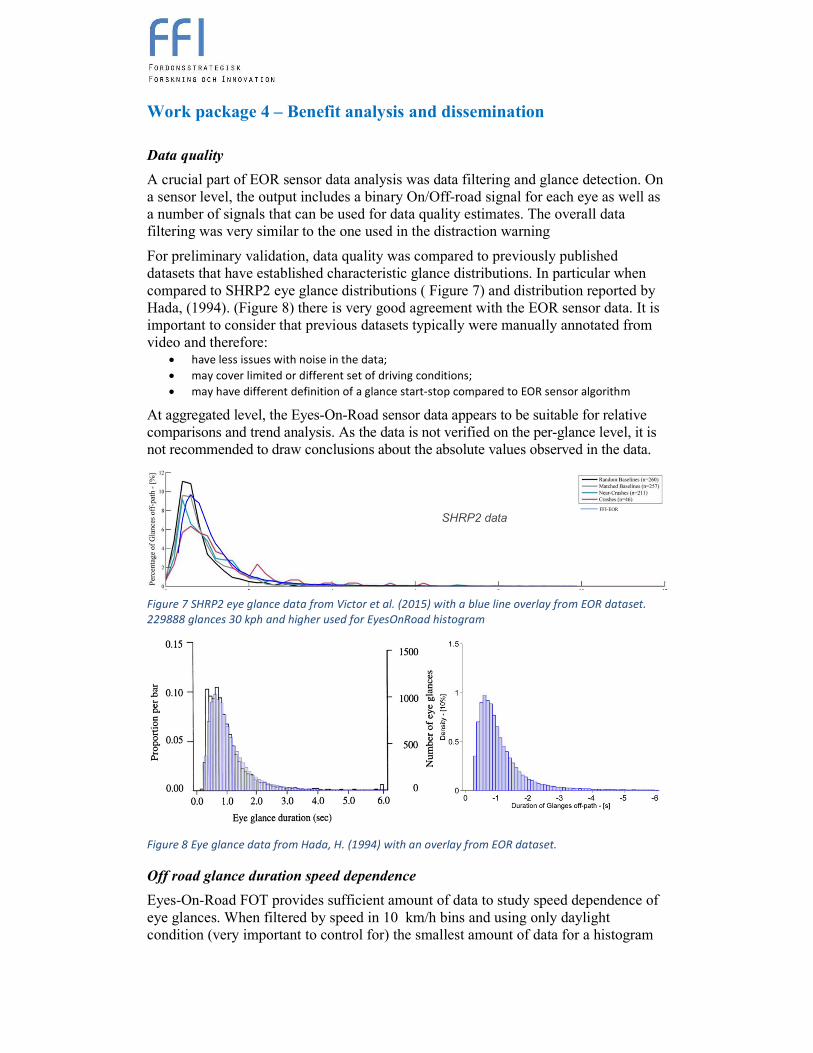
For preliminary validation, data quality was compared to previously published datasets that have established characteristic glance distributions. In particular when compared to SHRP2 eye glance distributions ( Figure 7) and distribution reported by Hada, (1994). (Figure 8) there is very good agreement with the EOR sensor data. It is important to consider that previous datasets typically were manually annotated from video and therefore:
• have less issues with noise in the data;
• may cover limited or different set of driving conditions;
• may have different definition of a glance start-stop compared to EOR sensor algorithm
At aggregated level, the Eyes-On-Road sensor data appears to be suitable for relative comparisons and trend analysis. As the data is not verified on the per-glance level, it is not recommended to draw conclusions about the absolute values observed in the data.
Figure 7 SHRP2 eye glance data from Victor et al. (2015) with a blue line overlay from EOR dataset.
229888 glances 30 kph and higher used for EyesOnRoad histogram
Figure 8 Eye glance data from Hada, H. (1994) with an overlay from EOR dataset.
Off road glance duration speed dependence
Eyes-On-Road FOT provides sufficient amount of data to study speed dependence of eye glances. When filtered by speed in 10 km/h bins and using only daylight condition (very important to control for) the smallest amount of data for a histogram
FFI-EOR

was always above 5000 glances and for speeds above 50km/h there are at least 15000 glances used for distribution fitting and mean values. Figure 9 shows a 3d histogram of normalized Eyes-off-road glance duration distributions for speed bins from 10-120+ km/h
Figure 10 shows how there is a clear trend for average off-road glance duration decrease as the speed increases. Notably at speeds under 20km/h drivers are about 2 times more likely to have glances longer than 3 seconds away from road than at speeds > 90km/h. Arguably, the speed 30 km/h is the lowest speed where glance durations are still comparable to durations of glances at high speeds. This observation is very important when glance behavior is compared without controlling for proportion of data at lower and higher speeds between conditions.
Figure 9 Example of 3D histogram of off-road glance durations [s] vs. speed [km/h] where each speed
bin has been normalized to 100%.
Figure 10 Mean off road glance duration per vehicle speed.
Effectiveness of warnings
To evaluate the possibility to influence the driver’s visual behaviour toward a
reduction of critically long glances away from the road the mean Eyes-off-road glance duration was observed. In the treatment condition a reduction of mean glance

duration was expected compared to the baseline conditions, but the results were quite the opposite with progressively longer off-road-glance durations as the study continued. This quite unexpected finding needs further investigation – is this representative for actual driver behavior or an artefact of unknown origin? Nevertheless, looking for the reduction of long glances off road to be visible on a global scale is probably to expect too much. Looking locally at data collected within the first minute following a warning event, having removed events with bad sensor diagnostics, the distributions are very similar.
Figure 11 Mean duration of glances off-road in different project phases and two speed ranges
(daylight only).
If instead considering the number of warnings obtained in the baseline versus treatment periods, there is a small, non-significant, difference. The extent of this change (over time) remains to be verified, but there was a change back to more distraction warnings per time as well as per distance driven in the second baseline.
Figure 12 Boxplot of warnings per kilometer in the three experimental conditions.
The combination of the gradually increasing mean eyes-off-road glance duration, whatever its’ origin, with the decrease in actually triggered warning events in the treatment condition leads us to conclude that there is merit to the distraction warning. The effect size and persistence over time remains to be explored further.
03_reset02_treatment01_baseline
5
4
3
2
1
0
Phase
Warn
Per1
0K
m
Boxplot of WarnPer10Km
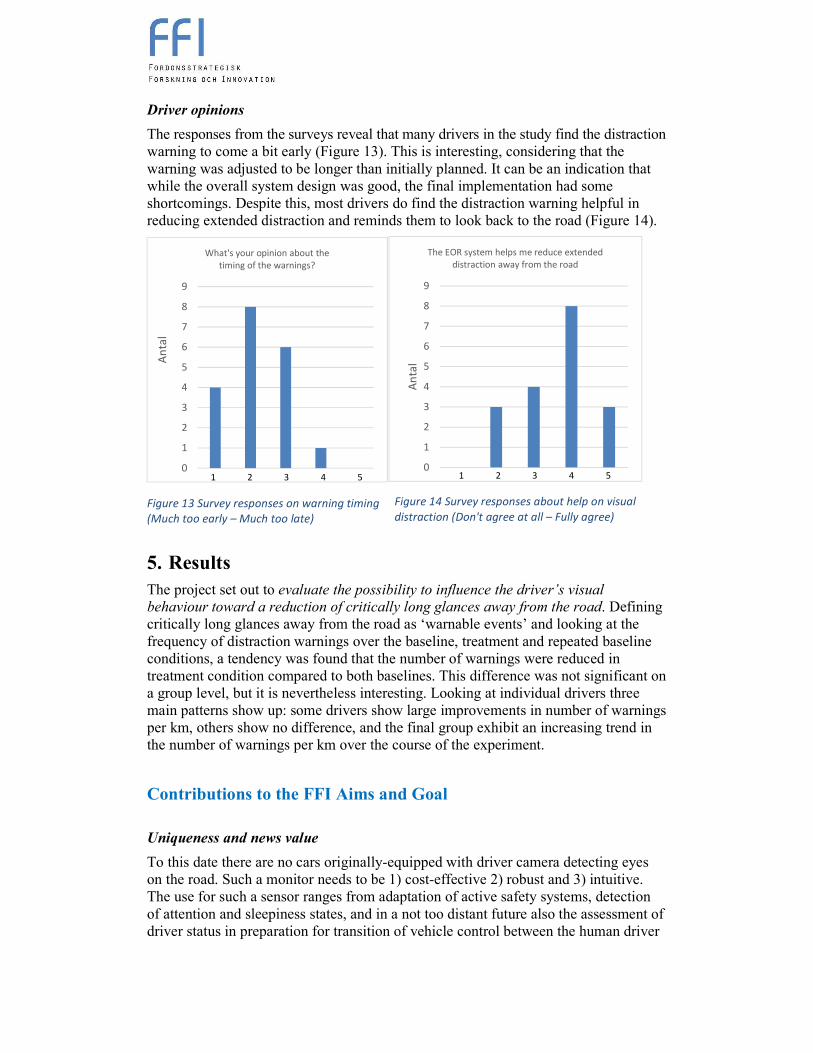
Driver opinions
The responses from the surveys reveal that many drivers in the study find the distraction warning to come a bit early (Figure 13). This is interesting, considering that the warning was adjusted to be longer than initially planned. It can be an indication that while the overall system design was good, the final implementation had some shortcomings. Despite this, most drivers do find the distraction warning helpful in reducing extended distraction and reminds them to look back to the road (Figure 14).
5. Results The project set out to evaluate the possibility to influence the driver’s visual
behaviour toward a reduction of critically long glances away from the road. Defining critically long glances away from the road as ‘warnable events’ and looking at the frequency of distraction warnings over the baseline, treatment and repeated baseline conditions, a tendency was found that the number of warnings were reduced in treatment condition compared to both baselines. This difference was not significant on a group level, but it is nevertheless interesting. Looking at individual drivers three main patterns show up: some drivers show large improvements in number of warnings per km, others show no difference, and the final group exhibit an increasing trend in the number of warnings per km over the course of the experiment.
Contributions to the FFI Aims and Goal
Uniqueness and news value
To this date there are no cars originally-equipped with driver camera detecting eyes on the road. Such a monitor needs to be 1) cost-effective 2) robust and 3) intuitive. The use for such a sensor ranges from adaptation of active safety systems, detection of attention and sleepiness states, and in a not too distant future also the assessment of driver status in preparation for transition of vehicle control between the human driver
0
1
2
3
4
5
6
7
8
9
An
tal
What's your opinion about the timing of the warnings?
Figure 13 Survey responses on warning timing
(Much too early – Much too late)
Figure 14 Survey responses about help on visual
distraction (Don't agree at all – Fully agree)
0
1
2
3
4
5
6
7
8
9
An
tal
The EOR system helps me reduce extended distraction away from the road
1 2 3 4 5 1 2 3 4 5

and driving automation. The project overall goal was to evaluate drivers’ visual
behavior towards a reduction of critically long off road glances. This is a way to address one of the most common cause of single car accidents, car to car crashes and car to VRU impacts, namely human error, specifically distraction. Lane keep assist, automatic braking and cruise control may create situations where a driver stays on the road while still not paying attention to the driving. Results from this project are important to understand how to design distraction warnings based on an EOR camera.
6. Conclusions and continued research The data collected during the project is to our knowledge unique in the world in terms of the amount of reasonably good quality eye glance data from naturalistic driving. In addition to EOR project, the data will be useful for continued traffic safety research.
The project has successfully shown that;
- a machine vision based sensor for driver visual (in-) attention can be deployed in a
vehicle and read driver attention status continuously in daily traffic situations
- the eyes off road glance distribution comparisons suggest very good match to
previously published eye-glance data that was collected in similar situations but
annotated manually.
- the number of warning events per distance and time travelled may be reduced when
introducing an audiovisual warning for Eyes-Off-Road time greater than 3 seconds
- The collected dataset provides unique insights into driver glance behavior which will
be presented in upcoming publications from the project partners.
Although there are some encouraging results regarding the effect of the distraction warning, the usefulness of a distraction alert is yet not conclusively determined. It may well be the case that the effect seen in this project wears off quickly, or over an extended time, when the novelty of the distraction warning has worn off. Still, the driver attention status information can be used also for contextual adjustment of other driver support features (for example FCW & LKA systems) as discussed in the FFI-HMI4AS-project, or even for intervening ADAS systems such as AEB.
Future extensions of the research on driver status monitoring also include applications in automation transitions (FFI application: A-Tran), where eyes-on-road status of the driver is of crucial importance. Other extensions may also include vital signs such as heart and respiratory rates (FFI-Application: Real-Life Vitals) which can be used to indicate driver status on a scale with its extreme points being excessive stress/workload or excessive sleepiness.
The project has gathered valuable experience which will be passed on to development projects within the contributing parties. This work focus on development of system specifications for a serial production version, which may become a world first automotive safety product developed and manufactured in Sweden, and may be crucial on the road to fulfilling Vision Zero.

7. Dissemination and publications The project and the driver monitoring system used for performing it has been shown at various events as well as in media during the course of the project. Further analyses with subsequent publications in scientific journals are planned for the acquired dataset.
Media coverage:
● Channel NewsAsia (TV) http://www.channelnewsasia.com/tv/tvshows/infocus/episodes/surviving-a-car-crash/2027906.html
Conference presentation
● The preliminary results of the Eyes-On-Road project have been presented at the fourth Driver Distraction and Inattention conference in Sydney, Australia, November 2015.
Demonstrations ● ASTA Zero Inaguration 2014, ● DriveME Project, demo ● Autoliv Capital Markets Day 2015

8. Contributing partners and contact information
Party Role and area of responsibility
Personnel and other resources
Project management incl. coordination of project report and papers.
Development and implementation of EOR sensor hardware and software
Data analysis
Autoliv Research:
Ola Boström, Research director Associate Professor Chalmers. Project manager, 2013
Johan Karlsson, Research engineer Cognitive Science. System integration
Benny Nilsson, Research Engineer Computer Science. EOR software development
Nicklas Gustafsson, Research Engineer, Project Manager 2014-2015
Camilla Apoy, Project Manager 2015-2016
Development of warning algorithm and HMI.
FOT execution incl. fleet management.
Physical equipment installation in cars.
Data management.
Data analysis.
Design of subjective questionnaires.
Volvo Car Group:
Henrik Lind, Senior Expert Sensors, PhD student Responsible for vehicle requirement and HMI,
Sergejs Dombrovskis, Responsible for complete FOT data processing, surveys & EOR warning algorithm development. Data analysis on Volvo Cars side.
Specification & development of DAS.
DAS support during data collection period.
ÅF-Technology
Jonas Kurol,
Micael Axestål,
Markus Johansson
9. References Lee, Young and Regan (editors), (2009) Driver Distraction - Theory, Effect and Mitigation CRC Press
Coelingh E, Jakobsson L, Lind H, Lindman M, (2007) Collision warning with auto brake – a real life safety perspective” ESV2007
Dingus T, Hanowski R, Klauer S, (2011) Estimating Crash risk, Ergonomics in Design: The Quarterly of Human Factors Applications 19: 8
Dingus. T., and Klauer, S., (2008) The relative risks of secondary task induced driver distraction (Paper No. 2008-21-0001). Warrendale, PA: Society of Automotive Engineers. Paper presented at Convergence 2008, Detroit, MI. October 20-22, 2008.
Hada, H. (1994). Drivers' Visual Attention to In-Vehicle Displays: Effects of Display Location and Road Type (technical report UMTRI 94-9), Ann Arbor, MI: University of Michigan Transportation Research Institute.
Kircher, K., Kircher, A. Ahlström, C. (2009), Results of a field study on a driver distraction warning system, VTI Rapport 639A 2006/0226-26, VTI Linköping, (http://www.vti.se/sv/publikationer/pdf/resultat-av-en-studie-av-distraktionsvarningssystems-paverkan-pa-forarnas-blickbeteende.pdf)

Klauer, S.G. Guo, F., Sudweeks, J. and Dingus, T.A. (2010) An Analysis of Driver Inattention Using a Case-Crossover Approach on 100-Car Data: Final Report DOT HS 811 334.
Lee, John, et al., (2013) Detection of driver distraction using vision-based algorithms. Proceedings of the 23rd International Technical Conference on the Enhanced Safety of Vehicles (ESV)
Lind, H., (2007). An efficient Visual Forward Collision Warning Display for Vehicles, SAE World Congress, 2007-01-1105, Detroit, USA
IIHS Status report July 3 (2012)
Strandroth J, Sternlund S, Tingvall C, Johansson R, Rizzi M, Kullgren A (2012) A new method to evaluate future impact of vehicle safety technology in Sweden, STAPP Car Crash Jornal Vol 56
Sandberg D, Anund A, Kecklund G, Karlsson J, Wahde M, Åkerstedt T, (2011) The Characteristics of Sleepiness During Real Driving at Night—A Study of Driving Performance, Physiology and Subjective Experience, SLEEP, Vol. 34, No. 10, 2011
Strategisk färdplan för området Fordons och trafiksäkerhet inom satsningen Fordonsstrategisk Forskning & Innovation
Victor et al. (2015). Analysis of Naturalistic Driving Study Data: Safer Glances, Driver Inattention, and Crash Risk (SHRP2 Report S2-S08A-RW-1), Gothenburg, Sweden: SAFER Vehicle and Traffic Safety Centre Chalmers University of Technology.
Victor, T.W. and Larsson, (2008) Method and arrangement for interpreting a subjects head and eye activity. US patent nr. US7460940 B2,
Victor T., (2010) “The Victor and Larsson Distraction Detection Algorithm and Warning Strategy,” Volvo Technology, 2010.
Adress: FFI/VINNOVA, 101 58 STOCKHOLM
Besöksadress: VINNOVA, Mäster Samuelsgatan 56, 101 58 STOCKHOLM
Telefon: 08 - 473 30 00
www.ivss.se