an architecture framework for enterprise it service
TRANSCRIPT

manuscript No.(will be inserted by the editor)
An architecture framework for enterprise IT serviceavailability analysis
Ulrik Franke · Pontus Johnson · Johan Konig
Abstract This paper presents an integrated enterprise
architecture framework for qualitative and quantitative
modeling and assessment of enterprise IT service avail-
ability. While most previous work has either focused on
formal availability methods such as fault trees or qual-
itative methods such as maturity models, this frame-
work offers a combination.
First, a modeling and assessment framework is de-
scribed. In addition to metamodel classes, relationships
and attributes suitable for availability modeling, the
framework also features a formal computational model
written in a probabilistic version of the Object Con-
straint Language. The model is based on 14 systemic
factors impacting service availability, and also accounts
for the structural features of the service architecture.
Second, the framework is empirically tested in 9 en-terprise information system case studies. Based on an
initial availability baseline and the annual evolution of
the 14 factors of the model, annual availability predic-
tions are made and compared to the actual outcomes
as reported in SLA reports and system logs.
The practical usefulness of the method is discussed
based on the outcomes of a workshop conducted with
the participating enterprises, and some directions for
future research are offered.
Keywords Systems availability, Service availability,
Downtime, Noisy-OR, System quality analysis,
Enterprise Architecture, ArchiMate, Metamodel, OCL
Ulrik Franke, Pontus Johnson & Johan Konig
Industrial Information and Control Systems
Royal Institute of Technology, Stockholm, SwedenE-mail: {ulrikf, pj101, johank}@ics.kth.se
1 Introduction
Today, high availability is a sine qua non for IT ser-
vice providers. For mission-critical applications, the de-
manded IT service availability levels continue to in-
crease [50] – an indication that both businesses and
customers increasingly expect availability all the time.
However, this is easier said than done in the enterprise
IT context. Enterprise systems – while critical to busi-
ness operations – are typically part of complex inte-
grated enterprise architectures tying together hundreds
of systems and processes. This makes them difficult
to maintain and the consequences of changes – e.g. in
terms of availability – are hard to predict.
At the same time, many enterprises show little un-
derstanding of how much downtime is acceptable – or
of the costs for such downtime [14]. An IBM study
from the nineties concludes that unavailable systems
cost American businesses $4.54 billion in 1996, due to
lost productivity and revenues [23]. The report lists av-
erage costs per hour of downtime ranging from airline
reservations at $89.5 thousand to brokerage operations
at $6.5 million. It is probably safe to say that downtime
costs have not decreased since.
A recent vivid reminder of the importance of high
availability is the failing data centers of the leading
European IT service provider Tieto in late November
2011. Sundkvist explains how a failed upgrade of stor-
age equipment from EMC Corporation caused IT ser-
vices of a great many seemingly unrelated Swedish en-
terprises to go down, including the national IT infras-
tructure enabling pharmacies to verify prescriptions,
the SBAB bank, the Motor Vehicle Inspection Com-
pany and several municipalities [52]. Other recent ex-
amples of high impact IT service outages include the
online banking operations of Bank of America in Jan-
uary 2011 as described by Charette [9] and the Nasdaq

2
OMX trading system for the Nordic and Baltic stock
markets in June 2008 described by Askaker and Kulle
[3].
The systems underpinning enterprise operations of-
ten live for many years [2], which has led to an increased
interest in information system lifecycles [25]. One lesson
to learn from incidents like the ones described above is
that enterprise information systems need to be moni-
tored and improved not only in the development phase,
but throughout the entire software lifecycle. Recent re-
search supports the importance of proper monitoring
and good processes for change management [17]. A key
aim of this paper is to offer a high level, portfolio-view
modeling framework that could support decision mak-
ers not only in the design phase, but also in the opera-
tions phase of complex IT services.
1.1 Scope of the paper
High availability is important to IT managers in a par-
ticular sense. A manager faced with poor availability
has two intertwined needs: (i) prediction with adequate
precision of future availability and (ii) action guidance.
She wants to be able to predict the future availability
of her services, so that the enterprise can make proper
decisions about business strategy, risk management, in-
surance etc. But she also wants the prediction to be
action guiding, in the sense that it helps her to system-
atically improve the future availability, beginning with
the actions that give the best return on investment.
These IT manager needs are the point of departure
for the present paper. However, as we shall see in Sec-
tion 3, they also highlight an existing blind spot in the
literature. There are a number of studies addressing
the reliability and availability of individual software
and hardware components and a wealth of papers on
architectures composed of such components. But this
does not help a manager trying to prevent any future
overnight ”routine systems change” mishaps. The IT
manager needs a method that considers the enterprise
architecture, including change management and main-
tenance processes, not just the systems architecture.
The fact that these processes are included is a key ele-
ment in the ability of the framework to lend decision-
support not only in the design phase, but also in the
operations phase of complex IT services.
By adopting the enterprise perspective, the proposed
framework aims for an ”all-in-one” modeling approach
to availability, spanning several levels of abstraction.
The rationale is that there are many non-trivial de-
pendencies between all the systems and processes in
an enterprise architecture. While more detailed models
are clearly desirable on each and every level of abstrac-
tion, such models need to be somehow interconnected
with each other to keep track of the bigger picture. It
is this interconnected level that is the proper domain
of the framework proposed in this article. Indeed, it
has been argued that enterprise IT differs from IT in
general precisely by considering systems that are some-
times studied in their own right to be mere components
of a larger architecture [26]. Some further pros and cons
of the chosen abstraction level will be discussed in Sec-
tion 8.
The genesis of the present paper is the Marcus and
Stern ”availability index” [37]. This index presents a
qualitative cost-benefit analysis of various availability-
increasing measures. A quantitative, expert-elicitation
based elaboration of the index was presented by Franke
et al. [17]. This paper extends the work in [17] by pre-
senting a framework for modeling and assessment of
IT service availability on the enterprise level that inte-
grates the availability index with architectural aspects,
that are also important for availability. The framework
is action guiding, in the sense that the user can tell
what needs to be done to improve availability (cf. the
discussion in section 8.1). The paper also contains a de-
scription of nine case studies, where the modeling prin-
ciples of the framework have been applied to various
enterprise IT services.
1.2 Outline
The remainder of the paper is structured as follows: Sec-
tion 2 defines the subject of the paper, viz. Enterprise
IT service availability. Section 3 contrasts the present
contribution with some related work. Section 4 intro-
duces the framework used in the metamodeling part of
the paper. Section 5 is the locus of the main contribu-
tion, presenting the framework for enterprise IT service
availability analysis. Section 6 presents nine cases stud-
ies on the usage of the framework. Some further exam-
ples of the possibilities of the framework are given in
Section 7. Section 8 offers a discussion of the strengths
and weaknesses of the contribution, its practitioner rel-
evance, and its software implementation in the EA2T
tool. Section 9 concludes this paper.
2 Enterprise IT service availability
We adopt the ITIL definition of IT service given by
Taylor et al. [53]:
”A Service provided to one or more Customers
by an IT Service Provider. An IT Service is based
3
on the use of Information Technology and sup-
ports the Customer’s Business Processes. An IT
Service is made up from a combination of people,
Processes, and technology and should be defined
in a Service Level Agreement.”
Following ITIL, an IT service (Application) has a lifecy-
cle that includes ”Requirements, Design, Build, Deploy,
Operate, Optimize” [53].
To understand the difference between IT in general
and enterprise IT, it is useful to consider the definition
made by Johnson [26]:
”An enterprise software system is the intercon-
nected set of systems that is owned and man-
aged by organizations whose primary interest is
to use rather than develop the systems. Typical
components in enterprise software systems are
thus considered as proper systems in most other
cases. They bear names such as process control
systems, billing systems, customer information
systems, and geographical information systems.”
(Emphasis in original.)
As for availability, the literature offers several defini-
tions. In this paper, we adopt the ITIL definition given
by Taylor et al. [53]:
”Ability of a Configuration Item or IT Service
to perform its agreed Function when required.”
Mathematically, availability is typically rendered in the
following fashion (cf. e.g. [40]):
A =MTTF
MTTF + MTTR(1)
where MTTF denotes ”Mean Time To Failure” and
MTTR ”Mean Time To Repair” or ”Mean Time To Re-
store”, respectively. The quotient is easy to interpret as
the time that a system is available as a fraction of all
time [47]. Sometimes, the term ”Mean Time Between
Failures” – MTBF – is used to emphasize that systems
are repairable, and thus capable of failing several times.
A more cautious availability estimate is found by in-
stead using the ”Maximum Time To Repair/Restore”,
corresponding to a worst-case scenario [37]. Since mean
times are used, Eq. 1 is actually a measure of long-term
performance of a system, i.e. a steady state system avail-
ability. Milanovic distinguishes the steady state avail-
ability from instantaneous availability, defined as ”the
probability that the system is operational (delivers the
satisfactory service) at a given time instant” [40]. In this
paper, the notion of availability always refers to steady
state availability, unless explicitly stated otherwise.
It is instructive to contrast availability with the re-
lated, but different, notion of reliability, defined in ISO
8402 as follows (quoted by Rausand and Høyland [47]):
”The ability of an item to perform a required
function, under given environmental and opera-
tional conditions and for a stated period of time.”
As noted by Milanovic, the main difference between
reliability and availability is that reliability refers to
failure-free operation up until a failure occurs [40]. Avail-
ability, on the other hand, focuses on the failure-free
operation over a longer period of time, allowing for sys-
tem failures and repairs during the interval considered
[40].
A related but wider concept is that of dependability.
Avizienis et al. offer two definitions [4]:
”The original definition of dependability is the
ability to deliver service that can justifiably be
trusted. This definition stresses the need for jus-
tification of trust. The alternate definition that
provides the criterion for deciding if the service
is dependable is the dependability of a system
is the ability to avoid service failures that are
more frequent and more severe than is accept-
able.” (Emphasis in original.)
The framework described in this article addresses the
steady state availability of enterprise IT services.
3 Related work
There are many frameworks, methods and tools for
modeling IT (service) availability. In the following re-
view, the most relevant to our work are described and
contrasted with our approach.
A Bayesian reliability prediction algorithm integrated
with UML, made to analyze reliability before system
implementation, is proposed in a series of papers by
Singh et al. [51, 11, 10]. The algorithm can be used
throughout the system life-cycle in the sense that the
reliability predictions generated in the design phase are
re-used as prior probabilities in the test phase. A model-
driven method for availability assessment of web ser-
vices is offered by Bocciarelli and D’Ambrogio [6]. The
availability assessment is part of a quality of service
prediction method based on the business process exe-
cution language (BPEL) [30]. The paper by Bocciarelli
and D’Ambrogio is similar to our contribution in the
sense that it defines a metamodel that enables avail-
ability calculations in an automated fashion, and that
it uses AND and OR gates to model architectural com-
ponent relationships. However, both Singh et al. and
Bocciarelli and D’Ambrogio differ from our approach
in that they do not address any governance aspects of
availability, such as IT service management process ma-
turities.
4
Zambon et al. [63] address availability risk manage-
ment by describing how the effects of incidents prop-
agate throughout an IT infrastructure. The model is
tested in a real-world case study. The paper is similar
to ours in the sense that it models how incidents affect-
ing availability spread throughout the architecture, but
different in its focus on risk analysis.
Leangsuksun et al. [33] present a Unified Modeling
Language (UML) tool for software reliability aiming to
bridge the gap between the design process and reliabil-
ity modeling. This is accomplished by a tool that fits
UML system models with failure/repair rate-attributes
and does reliability computations with the SHARPE
tool [49]. The main contribution of Leangsuksun et al.
is to integrate these tools with each other. However,
only hardware failures are taken into account, whereas
in our framework, both hardware and software failures
can be modeled.
In her PhD thesis, Rodrigues [48] addresses software
reliability prediction in the context of Model Driven Ar-
chitecture (MDA). The thesis offers a UML reliability
profile model which is used for scenario-based reliabil-
ity prediction. The calculations are based on (i) the
probabilities of component failures, and (ii) transition
probabilities between scenario.
Bernardi and Merseguer [5] propose a UML profile
for dependability analysis of real-time and embedded
systems, as a part of the ”Modeling and Analysis of
Real-Time and Embedded Systems” (MARTE) project
of the Object Management Group (OMG). Bernardi
and Merseguer apply their profile in a case study.
Majzik et al. [35] delineate a dependability modeling
approach based on UML. It aims to offer guidance in the
early phases of system design. Majzik et al. show how
structural UML diagrams can be processed to create a
system-wide dependability model based on Timed Petri
Nets (cf. e.g. [62] for more on this formalism).
Our work is different from that of Rodrigues, Bernardi
and Merseguer and Majzik et al. in the sense that our
framework also addresses IT service management pro-
cess maturities.
Immonen [24] offers a method for availability and re-
liability prediction of software architectures. Its scope is
similar to our approach, but it has only been validated
using simulations, and unlike our approach it does not
account for IT service management process maturities
affecting availability.
Zhang and Pham [64] present an effort to identify
factors affecting software reliability. Although the iden-
tified factors and their ranking are useful for guidance,
Zhang and Pham offer no method to predict the out-
comes of actions taken to improve system availability.
One important trend found in the literature is that
failures are increasingly due to software failures and
human error [18, 43, 45, 36], rather than hardware fail-
ures. This means that in order to meet the needs of IT
managers, both systems architecture and governance
(e.g. IT service management process maturities) must
be studied more closely in concert. Methods that con-
sider only a static environment where humans do not
intervene and do not change the software will be un-
able to capture a lot of important causes of unavailabil-
ity. Another important trend is the increasing service-
orientation. With a shift of focus from technical plat-
forms to business services, governance aspects and pro-
cess maturities become more important.
To summarize, the main differences between our
contribution and the related work is that (i) we con-
sider not only the software architecture, but a wider
enterprise architectural description that includes pro-
cesses and their maturities, and (ii) we have tested the
framework in nine case studies.
4 The P2AMF framework
This section introduces the architecture modeling for-
malisms needed for Section 5. The Predictive, Proba-
bilistic Architecture Modeling Framework (P2AMF for
short) is a framework for generic software system anal-
ysis [29]. P2AMF is based on the Object Constraint
Language (OCL), a formal language used to describe
expressions on models expressed in the Unified Mod-
eling Language (UML) [1]. These expressions typically
specify invariant conditions that must hold for the sys-
tem being modeled, pre- and post-conditions on oper-
ations and methods, or queries over objects described
in a model. One important difference between P2AMF
and OCL is the probabilistic nature of P2AMF, allow-
ing uncertainties in both attribute values and model
structure. P2AMF is fully implemented in the Enter-
prise Architecture Analysis Tool (EA2T) [27, 7].1
A typical usage of P2AMF is to create a model for
predicting, e.g., the availability of a certain type of ap-
plication. Assume the simple case where the availability
of the application is solely dependent on the availability
of the redundant servers executing the application. The
appropriate P2AMF expression then looks like this:
context Application:def: available : Boolean =self.server->exists(s:Server|s.available)
This example demonstrates the similarity between
P2AMF and OCL, since the expression is not only a
1 http://www.ics.kth.se/eaat
5
valid P2AMF expression, but also a valid OCL expres-
sion. The first line defines the context of the expression,
namely the application. In the second line, the attribute
available is defined as a function of the availability of
the servers that execute it. In the example, it is suffi-
cient that there exists one available server for the ap-
plication to be available.
However, not all valid P2AMF statements are valid
OCL statements. P2AMF introduces two kinds of un-
certainty that are not present in OCL:
Firstly, attributes may be stochastic. When at-
tributes are instantiated, their values are thus expressed
as probability distributions. For instance, the probabil-
ity distribution of the instance myServer.available
might be
P(myServer.available)=0.99
The probability that a myServer instance is avail-
able is thus 99%. For a normally distributed attribute
operatingCost of the type Real with a mean value of $
3 500 and a standard deviation of $ 200, the declaration
would look like this,
P(myServer.operatingCost)=Normal(3500,200)
Secondly, the existence of objects and relationships
may be uncertain. It may, for instance, be the case that
we no longer know whether a specific server is still in
service or whether it has been retired. This is a case of
object existence uncertainty. Such uncertainty is spec-
ified using an existence attribute E that is mandatory
for all classes,
context Server:def: E : Boolean
where the probability distribution of the instance
myServer.E might be
P(myServer.E)=0.8
This attribute requires a subtle change in model-
ing practice: the modeler must sometimes allow objects
such as the server above into the model, even though
it is not certain that they exist. In some scenarios the
server is still there, in others it has been retired – as
reflected in the value of the attribute E. Clearly, if po-
tentially non-existing objects were not allowed into the
model, such scenario diversity could not be appropri-
ately modeled. The metamodel, and ultimately the ob-
jective of the modeling as such, determines which po-
tentially non-existing objects that ought to be modeled.
We may also be uncertain of whether myServer is
actually still in the cluster that provides service to a
specific application, i.e. whether there is a connection
between the server and the application. Similarly, this
relationship uncertainty is specified with an existence
attribute E on the relationships. Thus, attributes on
relationships are employed in P2AMF:
context Uses:def: E : Boolean
The Uses relation is an association class (in the
OCL sense), as are all the relations in P2AMF. This is
required for use of the E attribute.
A full exposition of the P2AMF language is beyond
the scope of this paper, but some more details can be
found in the work of Ullberg et al. [59]. The proba-
bilistic aspects are implemented in a Monte Carlo fash-
ion [20]: In every iteration, the stochastic P2AMF vari-
ables are instantiated with instance values according
to their respective distribution. This includes the ex-
istence of classes and relationships, meaning that they
are sometimes instantiated, sometimes not, depending
on the distribution. Then, each P2AMF statement is
transformed into a proper OCL statement and evalu-
ated using the EMF-OCL interpreter. The final value
returned by the model when queried is a weighted mean
of all the iterations.
5 An integrated framework for availability
analysis
This section presents a framework for enterprise IT
service availability analysis. The first subsections in-
troduce two complementary approaches to availabil-
ity modeling. Subsequently, it is shown how these ap-
proaches can be integrated into a single framework, and
a metamodel with classes and attributes appropriate for
availability analysis is presented.
5.1 Modeling availability from components
One classical way of calculating the availability of a
complex system is to follow a bottom-up approach from
the availability of its components. Using the logic gates
AND and OR, the average availability of the system as a
whole can be inferred in a fault tree-like fashion (a more
extensive treatment of Fault Tree Analysis (FTA) can
be found in [16]). Such calculations assume indepen-
dent average component availabilities. This formalism
is illustrated in Fig. 1.
The AND case models non-redundant systems
where the failure of a single component is enough to
bring the system down.
The OR case models redundant systems where one
or more component can fail without bringing the system
down.
A simple example of how the building blocks and
their mathematical equivalents are put together recur-
sively is illustrated in Fig. 2.

6
AND
A1 . . . An
Atot =∏n
i=1 Ai
OR
A1 . . . An
Atot =∐n
i=1 Ai = 1−∏n
i=1(1−Ai)
Fig. 1 The basic cases for parallel and serial systems, respec-
tively.
AND
A3 A4 OR
A1 A2
Atot = A3A4(A1 tA2) = A3A4(1− (1−A1)(1−A2))
Fig. 2 A simple example of system availability calculations.
In the realm of enterprise IT services, Narman et al.
[41] have created a logic gate framework for availabil-
ity analysis. The framework uses ArchiMate [58] as a
graphical notation and has been tested for modeling
precision in 5 case studies. A main result was that ar-
chitectural models created using the proposed meta-
model give availability figures that differ from avail-
ability measured log values only in the first or second
decimal when expressed as percentages (e.g. an ATM
system was estimated to have an availability of 99.92%,
whereas logs for a 12 month period revealed an average
of 99.86%).
ArchiMate was selected because it is a framework
that keeps the number of entities down, yet captures
a substantial amount of the concepts that need to be
modeled. As described by Lankhorst et al. [32], the lan-
guage was created following an extensive collection of
requirements both from practitioners and from the lit-
erature. Furthermore, care has been taken to construct
the language in such a way that relations between con-
cepts are transitive [32, 60], which is very useful in the
context of fault tree analysis.
5.2 Modeling availability at the system-level
While the component model is conceptually simple and
mathematically precise, it also transfers the problem
of availability estimation one level down; from system
to components. Component availabilities are taken as
given – if they are not, then there is nothing to aggre-
gate.
An alternative line of reasoning, therefore, is to in-
quire about the causes of IT service unavailability. This
is a difficult question. As described in Section 3, the ex-
isting literature mostly addresses availability (and relia-
bility) in idealized cases, where IT systems and services
are considered in vitro, i.e. in laboratory settings where
software components are put together into architec-
tures, the properties of which can be inferred by various
models. However, in vivo, things are more complicated,
as the building blocks of the idealized architectures are
subject to a constant stream of functional upgrades, ex-
ternal service-provider downtime, inadequate monitor-
ing, poor change management, etc. Furthermore, many
of these failure factors are difficult to locate, architec-
turally.
Franke et al. [17] address this problem by using a
holistic approach. Rather than detailing the architec-
tural components of a service or system, 16 factors de-
termining availability are evaluated at the level of the
IT service as a whole. To quantify the factors, Franke
et al. did a survey among 50 experts on IT systems
availability, and thus created a Bayesian decision sup-
port model, designed to help enterprise IT system decision-
makers evaluate the consequences of various courses of
action ex ante. Cf. [17] for more details.
The mathematical model employed is a leaky Noisy-
OR model, typically used to describe the interaction of
n causes X1, . . . , Xn to an effect Y (cf. [42] or [19] for
more details). In this context, the effect Y is the un-
availability of enterprise IT systems. Two assumptions
are made, viz. (i) that each of the causes has a prob-
ability pi of being sufficient for producing Y , and (ii)
that the ability of each cause Xi, to bring about Y is
independent. Mathematically, the following holds:
pi = P (y|x1, x2, . . . , xi, . . . , xn) (2)
where xi designates that causal factor Xi is present and
xi that it is absent. In other words, pi is the probability
that the effect Y will occur when causal factor pi is
present, and all other causal factors modeled are absent.
It follows that the probability of y given that a sub-
set Xp ⊆ {X1, . . . , Xn} of antecedent causes are present
can be expressed as:
P (y|Xp) = 1− (1− p0)∏
i:Xi∈Xp
(1− pi)(1− p0)
(3)

7
The probability p0 is called the leak probability, and
reflects the probability that Y will occur spontaneously,
thus reflecting imperfections in the explicit model.
The probabilities pi obtained from the expert elic-
itation [17] are listed in Table 1. The one difference
between Table 1 and [17] is that two pairs of causal
factors have been merged together (1 + 9, 7 + 8), as in-
dicated. The motivation is detailed in Appendix A, as
are more precise definitions of each factor.
Table 1 Systemic causal factors with probabilities for refined
Noisy-OR model.
Causal factor Xi piLack of best practice . . .
1+9 . . . physical environment & infrastructure re-dundancy
10.0%
2 . . . requirements and procurement 25.2%
3 . . . operations 23.0%4 . . . change control 28.1%
5 . . . technical solution of backup 7.0%
6 . . . process solution of backup 3.6%7+8 . . . data & storage architecture redundancy 9.6%
10 . . . avoidance of internal application failures 16.9%
11 . . . avoidance of external services that fail 8.7%12 . . . network redundancy 7.6%
13 . . . avoidance of network failures 18.3%14 . . . physical location 3.3%
15 . . . resilient client/server solutions 3.6%
16 . . . monitoring of the relevant components 26.1%
This model thus offers a way to explain the un-
availability of enterprise IT systems in terms of lack of
best practice in 14 (originally 16) different areas. How-
ever, a more practical typical concern is the availabil-
ity of an entire park of systems, with a known prior
availability baseline, e.g. 99.5%. The Bayesian model
therefore needs to be rescaled to reflect this prior avail-
ability. Such a rescaled model can be used for reasoning
about which best practice solutions to apply in order
to further increase availability.
Franke et al. rescale the model with a rescaling fac-
tor α applied to all pi, including p0. It follows from
Equation (3) that
A(Xp) = 1−P (y|Xp) = (1−αp0)∏
i:Xi∈Xp
(1− αpi)(1− αp0)
(4)
whereA(Xp) is the availability of a given system lacking
the best practice factors listed in the vector Xp.
5.3 An integrated approach
Comparing component and system-level availability mod-
eling, we see that these approaches are complementary.
The strength of the component-based approach lies in
its focus on the interrelations between elements and ser-
vices, thus capturing redundancy and other important
notions of availability theory. This is an area where the
system-level approach has a blind spot. Conversely, the
system-level approach can incorporate important gov-
ernance aspects such as architectural change control,
requirements and procurement, and component moni-
toring – all factors impacting enterprise service avail-
ability, but non-localizable to any single component in
an architecture and thus absent in a purely component-
based framework.
Sections 5.4 and 5.5 introduce an integrated frame-
work, where the two complementary approaches are
reconciled and implemented together. This continues
and extends previous work by Franke et al. [17] and
Narman et al. [41], who have elaborated each approach
separately in the enterprise IT context. The exposition
revolves around the metamodel illustrated in Figure 3,
giving an overview of the proposed framework. How-
ever, the framework is more than just the set of classes
and attributes visible in the figure. As explained in Sec-
tion 4, the derived attributes for the availability anal-
ysis are formally defined using OCL code. Following
P2AMF practice, these OCL expressions are not pri-
marily used to impose model constraints, but rather as
the combined query language and mathematics engine
that implements the logic of the component-level and
system-level availability models employed.
The classes and attributes are detailed in the next
few subsections. Reading these descriptions, it is rec-
ommended to continuously refer back to Figure 3. Such
a parallel reading should aid in not losing sight of the
bigger picture. The OCL code corresponding to derived
metamodel attributes as well as some metamodel oper-
ations and invariants used in the implementation, are
provided in Appendices B, C, and D, respectively.
5.4 Metamodel classes
On the class level, the metamodel is quite similar to
the metamodel presented by Narman et al. [41]. It
is based on the ArchiMate metamodel, and contains
active structure elements, behavioral elements, busi-
ness processes, and the logic gates necessary for the
component-level availability modeling approach.
However, Narman et al. employ the component-
based approach only, employing the fault tree formal-
ism. As described in Sections 5.2 and 5.3, this ought to
be complemented by the system-level approach capa-
ble of taking governance aspects into account as well.
Therefore, the coherent combination of the two existing
techniques for service availability modeling and analysis
is the novel contribution of this new metamodel. The

8
Fig. 3 The integrated metamodel for availability analysis.
details are found in the OCL code of Appendices B, C,
and D, all of which was written for this metamodel.
More precisely, BehaviorElement is an abstract
superclass (as signified by the abstract stereo-
type) with three subclasses: ApplicationService,
ApplicationFunction, and InfrastructureService.
Following UML, the _ arrow signifies inher-
itance. Similarly, ActiveStructureElement
is an abstract superclass with three sub-
classes: Node, ApplicationComponent, and
CommunicationPath. These class concepts are
shared with [41]. A BehaviorElement is realized
by an ActiveStructureElement to which it is
assigned. Whenever the metamodel is instantiated,
every ActiveStructureElement generates at least
one BehaviorElement. This is important, because it
allows active structure elements of different types to
realize a behavior of the same class but with different
availabilities or other characteristics.
The Gate class has a Boolean attribute determining
whether it acts as an AND (encoded as false) or OR
(encoded as true) gate. In the EA2T tool, the class icons
(� , �) are changed accordingly, as seen in Fig. 4.
Furthermore, a BusinessProcess class has been in-
troduced, not present in [41]. The BusinessProcess
class has four subclasses, each corresponding to a pro-
cess relevant for IT service availability:
9
ProcessSolutionOfBackup The process solution of
backup regulates the use of the technical solution.
This includes routines such as whether backups are
themselves backed up, whether the technical equip-
ment is used in accordance with its specifications,
what security measures (logical and physical) are
used to guard backups etc.
ChangeControl Change control is the process of con-
trolling system changes. This applies to both hard-
ware and software, and includes documentation of
the actions taken.
Operations Operations is everyday system adminis-
tration. This includes removing single points of fail-
ure, maintaining separate environments for develop-
ment, testing and production, consolidating servers
etc.
RequirementsAndProcurement Requirements and
procurement reflect the early phases of system
development and administration. This includes
return on investment analyses, re-use of existing
concepts, procuring software designed for the task
at hand, negotiating service level agreements etc.
5.5 Metamodel attributes
All metamodel attributes will be given in the form
name:type, referring to the standard OCL types de-
fined in the OCL specification [1].
5.5.1 BehaviorElement
As BehaviorElements are the components connected
by logic gates, their attributes form the backbone of the
analysis. To reflect the system-level approach, some at-
tributes are visible only at the top of the architecture,
i.e. when they are attributes of instantiated class ele-
ments that do not contribute to the availability of other
elements. This reflects the properties that are only con-
sidered at the system-level.
ArchitecturalAvailability:Real This attribute
corresponds to standard notion of availability of the
component-based model described in Section 5.1.
Its value will be calculated differently depending
on the architecture:
1. If the BehaviorElement is connected to a
gate through the gateToService relation,
the ArchitecturalAvailability will take the
Availability value of the gate.
2. If the BehaviorElement is assigned to
a single ActiveStructureElement, the
ArchitecturalAvailability will take the
Availability value of the structure element.
3. If the BehaviorElement is neither connected
to a gate, nor to a structure element, its
ArchitecturalAvailability is taken from its
own EvidentialAvailability attribute.
EvidentialAvailability:Real This attribute is used
to allow the user to set a ”black box” architectural
availability figure of a behavior element that is not
modeled in detail.
AvoidedUnavailability:Real This attribute value is
calculated based on the Noisy-OR model from [17].
It denotes the fraction (0 − 100%) of architectural
un-availability that has been avoided by the best
practice factors of Table 1. This is calculated by
a call to the avoidedUnavailability() operation
described in Appendix C.
In the EA2T tool, this attribute is only visible
when the isTopService operation (described in Ap-
pendix C) is true.
AvoidedUnavailabilityBaseline:Real This at-
tribute is the baseline for avoided unavailability.
This brings about path-dependence, in the sense
that the model keeps track of a baseline starting
point. The user supplies the baseline. The recom-
mended way to do so is by modeling an architecture
as faithfully as possible both when it comes to ar-
chitectural availability and with respect to the best
practice factors of Table 1. Calculating the model
will then yield an initial AvoidedUnavailability
that can be entered as baseline.
In the EA2T tool, this attribute is only visible when
the isTopService operation is true.
HolisticAvailability:Real This attribute corre-
sponds to the richer – holistic – availability notion
that results from the combination of the component-
level and system-level approaches to availability.
As this notion of availability is only applicable
on the architecture as a whole, this attribute be-
longs only to the ”top” BehaviorElement, typ-
ically corresponding to an aggregate of several
other services. Formally, this ”top” property is de-
fined by the OCL operation isTopService de-
scribed in Appendix C. It combines component-level
availability with the system-level model by start-
ing out with the ArchitecturalAvailability,
and then adding or subtracting from it, depend-
ing on the level of AvoidedUnavailability rela-
tive to the AvoidedUnavailabilityBaseline. In
the case of an improvement over the baseline, the
HolisticAvailability is given by Eq. 5. In the
case of a deterioration, the HolisticAvailability
is given by Eq. 6.

10
AvoidedUnavailability ≥ AvoidedUnavailabilityBaseline:
HolisticAvailability = ArchitecturalAvailability+(1− ArchitecturalAvailability)·(AvoidedUnavailability−AvoidedUnavailabilityBaseline)/(1-AvoidedUnavailabilityBaseline)
(5)
AvoidedUnavailability < AvoidedUnavailabilityBaseline:
HolisticAvailability = ArchitecturalAvailability+ArchitecturalAvailability·(AvoidedUnavailability−AvoidedUnavailabilityBaseline)/AvoidedUnavailabilityBaseline
(6)
In words, the holistic availability starts from the
architectural availability found by aggregating the
components of the architecture in a fault tree-like
manner. In the case of an improvement it then adds
a fraction of the complementary unavailability, this
fraction being determined by the avoided unavail-
ability, relative to its baseline and the baseline dis-
tance to full (100%) availability. Symmetrically, in
the case of a deterioration it subtracts a fraction of
the architectural availability, this fraction being de-
termined by the avoided unavailability, relative to
its baseline and the baseline distance to no (0%)
availability.
In the EA2T tool, this attribute is only visible when
the isTopService operation is true.
5.5.2 Systemic causal factors
The systemic causal factors from [17] are all modeled
as attributes of type Real, as detailed in Table 2. Here,
they are listed in the same order as in Table 1. In Fig. 3,
they can be found located in the appropriate class.
One particular difficulty arises with the applica-
tion of the 14 attributes in an architectural con-
text: In the Noisy-OR model, each factor is a sin-
gleton. However, in any sufficiently complex enter-
prise architecture there will be features such as sev-
eral ChangeControl processes governing several ser-
vices, several CommunicationPaths with several rou-
tines for failure management, several Nodes being mon-
itored in several ways, etc. These several values need to
be aggregated before they are fed to the Noisy-OR cal-
culation of the AvoidedUnavailability attribute. In
the current implementation, this is accomplished by re-
turning the arithmetic mean of the best practice values
found throughout the architecture.
The aggregation is non-trivial and could be com-
puted in several ways. Varian [61] distinguishes three
prototypical cases in the context of system reliability:
Table 2 Systemic causal factors in the metamodel.
Factor Attribute name Class(es)1+9 bestPracticePhysical-
Environment-AndInfrastructureRedundancy
Node
2 bestPractice RequirementsAnd-Procurement
3 bestPractice Operations4 bestPractice ChangeControl5 bestPracticeTechnicalSolution-
OfBackupNode
6 bestPractice ProcessSolutionOf-Backup
7+8 bestPracticeDataAndStorage-ArchitectureRedundancy
InfrastructureService
10 bestPracticeAvoidanceOf-InternalApplicationFailures
Application-Component
11 bestPracticeAvoidanceOf-ExternalServicesFailures
ApplicationService
12 bestPracticeNetwork-Redundancy
CommunicationPath
13 bestPracticeAvoidanceOf-NetworkFailures
CommunicationPath
14 bestPracticePhysicalLocation Node,CommunicationPath
15 bestPracticeResilientClient-ServerSolutions
ApplicationService,InfrastructureService
16 bestPracticeComponent-Monitoring
ActiveStructure-Element
Total effort. Corresponds to a sum, or in our case an
arithmetic mean (normalized sum) of maturities.
Weakest link. Corresponds to the minimum matu-
rity.
Best shot. Corresponds to the maximum maturity.
There are reasonable cases of applicability for each of
the alternatives. As Varian notes, many systems exhibit
a mixture of the cases [61].
Having thus outlined the metamodel, we now turn
to its application. Section 6 details case studies where
real enterprise IT services from five companies have
been modeled using the framework described.
6 Case studies
This section describes the case studies carried out to
test the modeling capabilities of the framework pro-
posed in the previous section.
6.1 Case study process
To test the predictions of the model, case studies were
carried out at five enterprises from a number of dif-
ferent business areas. The case studies were executed
according to the following process.
6.1.1 Start-up meeting
Each case study was initiated with a start-up meeting,
where the researchers explained the scope of the case

11
Table 3 Overview of the participating companies.
Company Service Data set
Banking 1 ATM Availability data, 60 months
Banking 2 Banking operations, branch IT services Availability data, 57 monthsInternet bank Availability data, 57 months
Banking 3 Internet bank, other service Availability data, 36 months
Internet bank, log in service 1 Availability data, 36 monthsInternet bank, log in service 2 Availability data, 36 months
Company 1 Service 1 Availability data, 36 months
Service 2 Availability data, 36 monthsTravel 1 Internet timetable service Availability data, 37 months
study to the industry counterpart. The typical coun-
terpart representative was a middle manager with a re-
sponsibility for a portfolio of IT systems supporting the
business.
6.1.2 Service identification
After the start-up meeting, the next step was to find a
suitable service – supported by the IT systems within
the manager’s portfolio – for the study. There where
several requirements:
1. The service should have high availability require-
ments, and thus in this sense be important to the
participant enterprise.
2. There should be historical availability data available
for analysis.
3. There should be service experts available for inter-
views.
4. The service should have a history of less than perfect
availability, so as to make for more relevant analysis.
The data required was aggregated SLA reports, or
other similar documentation, on availability over time.
No details on individual outages were required. The in-
terviewees were required to be able to assess the evo-
lution of the maturity level of each of the factors in
Table 1.
6.1.3 Quantitative data collection
Following the identification of appropriate services, avail-
ability data on the selected services was collected. De-
pending on the routines of the enterprise, this data was
sometimes readily available in aggregated form as SLA
reports, sometimes had to be composed through archi-
tectural considerations and incident log analysis.
6.1.4 Interviews
Following service identification and collection of avail-
ability data, appropriate respondents where selected to
be interviewed on the evolution of the 14 factors of Ta-
ble 1 over time. Most interviews were conducted with
several respondents who were all involved in the man-
agement of the service. In some cases interviewees had
to find additional information which they supplied after
the interview session. For each year of historical data,
an assessment of each factor was documented. Thus a
typical interview dataset consists of 14 · n factor ma-
turity assessments, for n years studied. The methodol-
ogy for factor assessment is further elaborated in Ap-
pendix A.
6.2 Quantitative framework evaluation
The modeling framework described in the previous sec-
tion was evaluated for quantitative precision. Using the
first year of each time series as a base-line, an avail-
ability estimate was calculated for the following years
using the model. This model was compared to the ac-
tual availability figures as reported in the data made
available.
An overview of the participating companies is of-
fered in Table 3. Five enterprises participated, con-
tributing a total of nine services. Since availability is
a competitive edge to these companies, the companies
have been anonymized to the level required by them to
consent to publication. Figure 4 illustrates one of the
service architectures, modeled in the EA2T tool.
As is evident from Table 3, most of the companies
are from mature high availability businesses (banking),
where the cost of downtime is often a top-management
issue. Travel 1 is the exception. It can also be observed
that a lot of the services analyzed are similar – Inter-
net banks and Internet timetable services are relatively
similar services, all offered through a web front-end,
but typically being dependent upon middle-ware and
mainframes behind the scene. The ATM service and
banking branch IT service also share a lot of character-
istics, being distributed systems, where terminals are
geographically spread (to street corners and banking
branches). However, they are still fully within the en-
terprises’ domain of management, as opposed to the
Internet-distributed services where the user typically
uses a computer of her own.
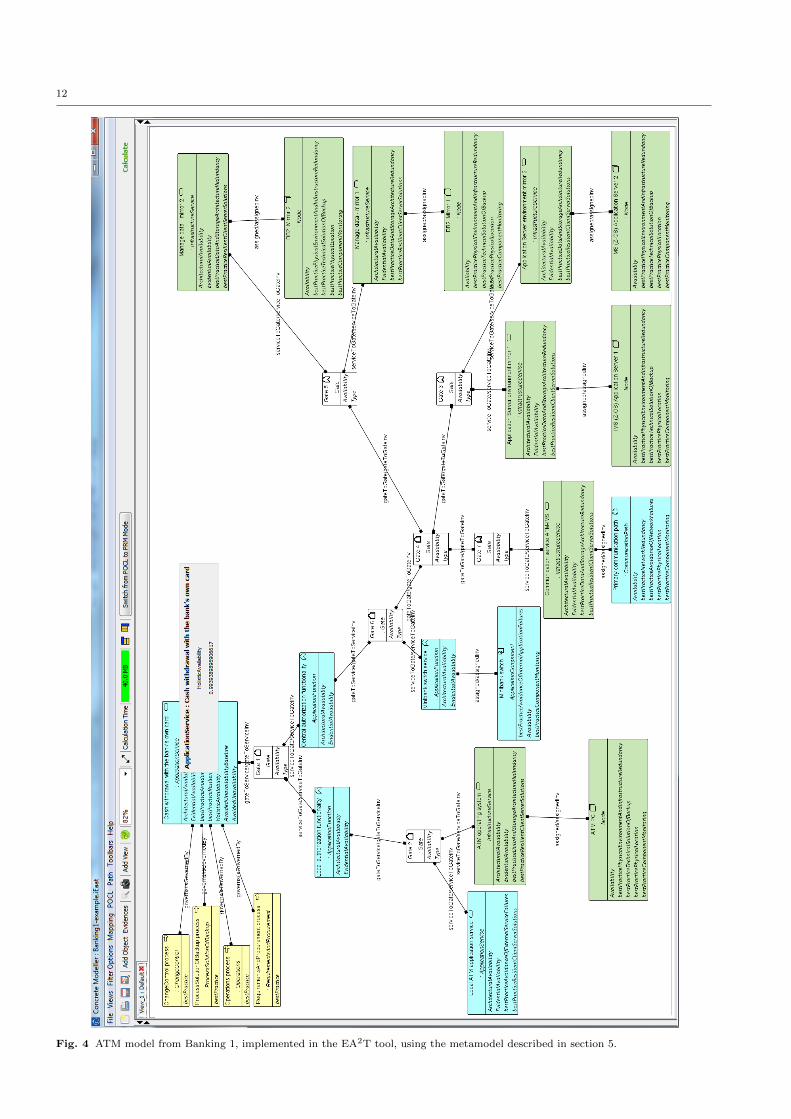
12
Fig. 4 ATM model from Banking 1, implemented in the EA2T tool, using the metamodel described in section 5.

13
Even though most of the enterprises belong to high-
availability businesses, their availability figures are markedly
different. This should however not be interpreted as a
sign of radically different service quality, but is mostly
an effect of different ways of measuring and defining
availability. In particular, Banking 2 had a very conser-
vative approach to assigning availability figures, often-
times considering services fully down even though only
a fraction of their total functionality was really unavail-
able. This scheme is intended to keep (mostly company
in-house) service-providers on their toes. However, it
also has the unfortunate side-effect of giving an overly
pessimistic appraisal of availability levels as compared
to other companies.
6.3 Numerical results
Figures 5– 7 contrast the modeling figures with the ac-
tual availability data collected from the SLA reports
and logs. The monthly availability data is shown along
with annual (i.e. 12 month) availability averages and
the corresponding annual predictions from the models.
It is evident that there is a lot of variability in the avail-
ability levels on a monthly basis. The model predictions
have only been created on an annual basis. The reasons
for this are two-fold: (i) Only annual data on the 14
factors was collected through the interviews. One rea-
son for this is the risk of interviewee fatigue, but it also
reflects the fact that many of the factors are process-
oriented and change gradually over time. It is more rea-
sonable to expect annual trends than monthly abrupt
changes in e.g. the change control. (ii) Many of the
monthly availability time series exhibit seasonality, of-
ten with an availability peak during summer vacations.
The seasonality, however, is not what the Bayesian de-
cision support model aims to describe. Rather, the long
term trend is the object of prediction, and this trend is
better described by annual averaging.
It should be pointed out that the predictions of Fig-
ures 5–7 are cumulative, i.e. the models evolve over time
after calibration at the start of the time series. For ex-
ample, the prediction for the ATM system of Bank-
ing 1 is based only on the initial availability in 2006
and the evolution of the 14 factors from there on. No
re-calibration has been carried out over the following
years.
As seen in Figures 5–7, the predictions sometimes
miss the mark by being too low, sometimes by being too
high. At other times, as in the prediction for the ATM
system of Banking 1, the prediction mimics the changes
of direction of the actual availability data, but is con-
sistently too low. This will be thoroughly discussed in
Section 8.
2006 2007 2008 2009 2010 2011
0.98
0.982
0.984
0.986
0.988
0.99
0.992
0.994
0.996
0.998
1
Year
Ava
ilabi
lity
Banking 1: ATM
Annual averageModelMonthly availability
2006 2007 2008 2009 2010 20110.91
0.92
0.93
0.94
0.95
0.96
0.97
0.98
0.99
1
Year
Ava
ilabi
lity
Banking 2: Banking operations
Annual averageModelMonthly availability
2006 2007 2008 2009 2010 2011
0.75
0.8
0.85
0.9
0.95
1
Year
Ava
ilabi
lity
Banking 2: Internet bank
Annual averageModelMonthly availability
Fig. 5 Comparison of (i) annual average availability data, (ii) thecorresponding model as offered by the framework, and (iii) the
underlying monthly availability figures.

14
2008 2009 2010 2011
0.99
0.992
0.994
0.996
0.998
1
Year
Ava
ilabi
lity
Banking 3: Other service
Annual averageModelMonthly availability
2008 2009 2010 2011
0.98
0.985
0.99
0.995
1
Year
Ava
ilabi
lity
Banking 3: Log in 1
Annual averageModelMonthly availability
2008 2009 2010 2011
0.975
0.98
0.985
0.99
0.995
1
Year
Ava
ilabi
lity
Banking 3: Log in 2
Annual averageModelMonthly availability
Fig. 6 Comparison of (i) annual average availability data, (ii) the
corresponding model as offered by the framework, and (iii) the
underlying monthly availability figures.
2008 2009 2010 2011 2012
0.98
0.982
0.984
0.986
0.988
0.99
0.992
0.994
0.996
0.998
1
Year
Ava
ilabi
lity
Company 1: Service 1
Annual averageModelMonthly availability
2008 2009 2010 2011 2012
0.98
0.985
0.99
0.995
1
Year
Ava
ilabi
lity
Company 1: Service 2
Annual averageModelMonthly availability
2008 2009 2010 2011 2012
0.75
0.8
0.85
0.9
0.95
1
Year
Ava
ilabi
lity
Travel 1: Internet timetable service
Annual averageModelMonthly availability
Fig. 7 Comparison of (i) annual average availability data, (ii) the
corresponding model as offered by the framework, and (iii) theunderlying monthly availability figures.

15
It should be noted that the 2011 annual average
figures for Company 1, Service 2 are based on January
and February only.
7 Further usage examples
The previous section does not make full use of the
framework expressiveness, but rather focuses on the
quantitative aspects of availability assessment in the
spirit of the system-level approach. However, expres-
siveness and conceptual modeling capability is equally
important. We now use the enterprise architecture illus-
trated in Figure 4 as a baseline for a few illustrations
of the possibilities of the integrated framework.
These examples can be studied in greater detail in
a screencast on the web page of the EA2T tool.2
Combined effects The most straight-forward appli-
cation of the holistic framework is to assess the effect
of changes affecting both the component make-up of
an architecture and its maturity in terms of the sys-
temic causal factors. What would happen to the ser-
vice availability of cash withdrawal if both (i) a re-
dundant communication service could be installed,
and (ii) the change management process could be
improved? These assessments can easily be made
using the framework implementation in the EA2T
tool.
Architectural modeling of processes Another ad-
vantage is the possibility to model how behavior el-
ements can be governed by multiple processes, and
how this impacts availability. What if there is not
just a single overarching change management pro-
cess for everything, but rather a multitude of such
processes, each governing a different part of the ar-
chitecture?
Uncertain architectures Sometimes, the enterprise
modeler will be uncertain about the state of archi-
tecture with regard to availability. In some cases,
this is due to ignorance on the part of the modeler:
it can be difficult to know whether a particular pro-
cess govern a particular service, or not. The people
involved in managing that particular service know
the answer. In other cases, the question is more fun-
damentally uncertain. If two servers are used for
load-balancing, one of them might be capable of
keeping the service running under low load condi-
tions. If so, the pair ought to be modeled using an
OR gate. However, under conditions of high load,
a single server might not be able to cope, in which
case the pair ought to be modeled using an AND
2 http://www.ics.kth.se/eaat
gate. In this case there is no simple right or wrong
answer, but a good architecture model ought to re-
flect this behavioral uncertainty. A more thorough
description of the role of uncertainty in enterprise
architecture can be found in the work of Johnson
et al. [28]. Some empirical reasons for uncertainty
in enterprise architectures can be found in the work
of Aier et al. [2].
8 Discussion
8.1 Quantitative evaluation
As seen in Section 3, the literature offers few compara-
ble alternatives with the same scope as the framework
proposed in Section 5. In this sense, it is difficult to
appraise the numerical results presented in Figures 5–
7. Nevertheless, the framework model can be compared
with a reference prediction where the availability is as-
sumed to remain constant, equal to the first year in the
time series. For lack of a better predictor, this is a rele-
vant baseline. Indeed, in the concluding workshop with
the participating companies, the practitioners stated
that re-using last year’s figure, sometimes with a tiny
inflation factor, is common practice in the industry.
A measure of the difference between the model and
the baseline can be found by comparing the root-mean-
square errors (RMSE), in percentage points, compared
to the actual annual availability averages obtained from
the companies, as illustrated in Table 4.
Table 4 reveals that the integrated framework model
of Section 5 is superior to the constant baseline in five
out of nine cases. In three of the remaining cases (Bank-
ing 3, Internet bank, other service, Banking 3, Internet
bank, login service 2 and Company 1, Service 2) the
differences are very small. In the last case (Travel 1, In-
ternet timetable service) both predictions are much off
the mark, though the framework model is a bit worse.
However, the monthly availability figures of Figure 7
tell a slightly different story. As can be seen in the plot,
the main reason for the declining average availability in
2010 of the Internet timetable service is the exception-
ally low values in April and May. Knowing that this
is an Internet timetable service at a travel company,
and knowing that the 2010 volcanic eruptions of Ey-
jafjallajokull on Iceland wreaked havoc with air travel
across western and northern Europe, it is not hard to
infer that the timetable service was put to severe stress
in these months – and did not fully cope.
It is instructive to consider the implications of this
carefully. An architecture-based model – using what-
ever mathematical formalism or guiding principle – can
only be expected to predict changes to availability that

16
Table 4 Mean RMSE (percentage points) for the models compared to a no-changes baseline.
Enterprise IT service Model RMSE Baseline RMSE(percentage points) (percentage points)
Banking 1, ATM 0.208% 0.254%
Banking 2, Banking operations, branch IT services 1.674% 2.903%
Banking 2, Internet bank 1.997% 3.339%Banking 3, Internet bank, other service 0.180% 0.173%
Banking 3, Internet bank, log in service 1 0.012% 0.258%
Banking 3, Internet bank, log in service 2 0.786% 0.714%Company 1, Service 1 0.125% 0.192%
Company 1, Service 2 0.090% 0.086%
Travel 1, Internet timetable service 2.744% 2.467%
Average 0.868% 1.154%
Error size compared to baseline (percent) 75% 100%
Improvement over baseline (percent) 25%
are in some sense internal. It is not reasonable to expect
a prediction of external factors such as the ash cloud
disruptions based on a description of ones own enter-
prise architecture. What the architecture based frame-
work can be expected to predict is the impact of long
term internal changes, whether they are for the better
(such as process improvements) or for the worse (such
as an increasingly complex web of software that can be
maintained and modified only at an ever larger cost).
Looking at the plots of Figures 5–7, other similar cases
can be observed. Large, unpredictable disruptions often
make annual averages go awry – but equally often the
model offered by the framework points in the general
direction of what to expect for any given month, includ-
ing the back-to-normal month after the large outage.
A more profound problem has to do with whether
valid predictions for different kinds of systems can be
made based on a single general model. However, while
every software system is unique, every software system
cannot have a unique model of its own. Constructing
such models is far too costly. Indeed, the very idea of
statistics is to look at sets exhibiting variation, inferring
general information from the particular samples. For
some applications, the precision of a given model will
not be sufficient. For others, it will. As discussed below,
practitioners in the industry do find the results of our
framework useful in several contexts.
Sudden outages can sometimes be better predicted
by more elaborate techniques such as the time series
analysis approach proposed by Liang [34]. However,
there is an important caveat: Such models typically of-
fer no guidance at all on cause and effect. A time-series
model can accurately model for instance seasonality.
However, an IT manager is not helped much by know-
ing e.g. that service availability is at its best in July (as
many practitioners maintain), because this knowledge
in no way contributes to improving availability in, say,
November. It is far better to know e.g. that the process
of requirements and procurement needs to be improved.
This is the kind of action guidance that is offered by the
integrated architecture framework of Section 5.
To summarize, it is reasonable to expect a model to
reflect long term availability changes, but unreasonable
to expect it to predict sudden outages.
8.2 Practitioner relevance
The considerations in the previous section naturally
lead to the issue of practitioner relevance. If quantita-
tive evaluation is difficult, it is even more important to
secure qualitative evaluation by involving practitioner
stakeholders in the development of new theories and
methods. Only through careful stakeholder interaction
can enterprise IT service modeling properly support
software systems throughout the entire life cycle.
In May 2011, a workshop was conducted with rep-
resentatives from the the participating companies. Five
representatives attended. The typical representative was
a middle manager, responsible for a portfolio of IT
systems that support the business. All of the repre-
sentatives had participated as respondents and data
providers throughout the study. The workshop lasted
for two hours, and was hosted by the researchers. The
workshop started with a presentation of the partici-
pants, followed by an introduction by the researchers
and a presentation of the results from the studies (i.e. the
results found in Section 6 and Table. 4). Following a
short break, the second half of the workshop was ded-
icated to a group discussion, where the practitioners
made a number of important remarks:
First of all, there is a gap between the desire to
model and predict availability and the actual state of
the practice. Most of the companies do not use any so-
phisticated means to predict future availability levels.
Rather, it is common practice to re-use last year’s fig-

17
ure, sometimes with a tiny inflation factor. However,
this is not to say that there is no interest in or de-
mand for more advanced modeling techniques. On the
contrary, the participants identified a number of im-
portant areas where the ability to model and predict
availability would be highly useful:
– When large changes are made in an architecture, it
is most often known – or assumed – that availability
will suffer. The ability to quantify this gut feeling
would improve risk management in projects.
– A prognosis, based on a credible method, of future
service availability carries weight in communications
with senior management. One of the workshop par-
ticipants gave an example of when such a progno-
sis convinced the business that the availability pre-
dicted was too poor, leading to allocation of a bud-
get for improving availability levels.
– Whenever check lists with bullet points for improv-
ing availability are proposed, it would be useful to
be able the predict the estimated result of each ac-
tion, so as to prioritize among them.
– The use of external services is on the rise, making
service provision much less transparent. In partic-
ular, this is the case when services are delivered
by sub-contractors to sub-contractors, i.e. when a
kind of layering of services occurs. Many companies
are immature when it comes to writing service level
agreements (SLAs), and this is made even worse by
opaque service layering. This is an area where ar-
chitectural modeling and availability prediction can
shed light on complicated phenomena.
– Compared to mechanical systems, the use of safety
margins is very immature in IT service architecture.
One workshop participant, with degrees in both con-
struction and computer engineering, pointed out that
whereas bridges are often built with four- or eight-
fold safety factors, IT systems are often just built to
cope precisely with the foreseen load. Better tech-
niques for modeling and prediction of availability
can help to make the IT service provision area more
mature in this respect. However, it should be noted
that the behavior of mechanical systems is often
more linear (or in some other sense regular) than
that of IT systems, making the latter more difficult
to analyze.
Furthermore, the importance of qualitative model-
ing should not be underestimated. Qualitative models
are useful to create a shared understanding of a prob-
lem, as well as for reasoning about system behavior and
component interactions and dependencies. As a result,
qualitative modeling often leads to insights about sys-
tem behavior that leads to better decision making [12].
To summarize, the practitioner community can use
the proposed integrated framework for rule-of-thumb
decision making when planning, budgeting and priori-
tizing future investments to improve availability. This
is illustrated by the Combined effects case in section 7.
Such decision-making does not only enable prognoses,
but also trade-offs based on the cost/benefit ratio of
different actions to improve IT service availability. The
workshop participants were not aware of any existing
method with similar characteristics.
8.3 Tool support
One important aspect of framework usability is tool
support. A tool can implement complicated theories
and models in a faithful way, yet not require the user
to fully grasp their minute detail. This enables the end
user to focus on his or her core competencies, while
still making use of for example the advanced availabil-
ity modeling and prediction offered by the framework
described in this paper.
The implementation of the metamodel in the EA2T
tool shown in the previous section has great potential
in terms of adoption and usability. The tool is being
used in a number of research projects on software qual-
ity attributes, including interoperability [59], maintain-
ability [15] and security [7]. It has also been used to
model large enterprise systems in a number of master
theses, e.g. [44].
Furthermore, to alleviate the workload when cre-
ating enterprise architecture models, data to populate
models with entities and relations can be collected auto-
matically [8]. This is a promising road ahead, in particu-
lar as one of the practitioner concerns listed above is the
increasing complexity and decreasing understandability
of enterprise architectures. Automatic data collection is
one way to keep up the pace.
8.4 Pros and cons of the integrated approach
The metamodel presented offers a high-level descrip-
tion language that includes many aspects relevant to
the availability of the services in an enterprise archi-
tecture. The idea is to capture dependencies between
different domains, even though these are often modeled
by themselves in greater detail. Lankhorst describes the
division of labor between enterprise architecture mod-
eling and other kinds of related modeling [31]:
”A main objective of enterprise architecture
is to reveal the relations between the different
domains, and to provide a high-level overview.

18
As such, you should always check the validity
of any existing models, and incorporate their
information on an appropriate level of abstrac-
tion; domain-specific models provide more de-
tails about parts of the enterprise than an enter-
prise architecture model. As such, an enterprise
architecture model should, for example, not be
considered a replacement for the existing infor-
mation models or business process models.”
In the context of availability modeling, Lankhorst’s
division of labor means that our metamodel is not in-
tended to replace but rather complement the existing
modeling practices or tools. There are a lot of compe-
tent vendors offering advanced tools for tasks relevant
to availability: picking the top three factors from Ta-
ble 1 we find change control addressed by products from
e.g. ERP vendor, HP, Aldon, Quest Software, Intel-
liCorp, Revelation Software, Phire, component monitor-
ing addressed by products from e.g. BMC Software, HP,
Quest Software, and IBM, and requirements and pro-
curement addressed by products from e.g. IBM-Telelogic,
iRise, all according to the Gartner consultancy [46].
Milanovic offers a good academic review of tools for
availability assessment [40].
To understand the intended division of labor, it is
useful to consider an analogy to Computer Aided De-
sign (CAD) and Engineering (CAE). It is certainly true
that buckling of columns and lighting of a room are
quite different, but it is also true that there is a need
for software tools that visualize their interdependencies
to architects, since columns both carry loads and block
windows. At some point, these concerns need to be de-
conflicted and resolved. However, such a resolution does
not necessarily need to be based on the most profound
theories available – if simplifications need to be intro-
duced to get diverse phenomena into the same model,
so be it.
Our metamodel is not intended to be the basis of
complete and very detailed architectural models of en-
terprises. Instead, it is meant to offer a way to cap-
ture and make explicit relations between processes and
services that are often lost when more detailed mod-
els are built. Such a bird’s-eye view is necessary to
avoid metaphorical stove-pipes and visualize the effects
of changes throughout the entire architecture. In this
respect, the fault-tree modeling formalism is very suit-
able. It allows some complex systems-of-systems to be
represented as a single component, exhibiting only an
average availability, while others can be modeled in
greater detail. This offers the flexibility necessary to tai-
lor models to practical needs, without being hampered
by arduous data collection costs. Similarly, the Noisy-
OR model is flexible in the sense that factors can be
left unspecified in architectural descriptions, in which
case the model simply assumes a default value.
If the metamodel is used in this way, to build rel-
atively light-weight models of enterprise architectures,
its use is relatively simple and not very time-consuming.
When models similar in scope and granularity were
built using the metamodel prescribed by Narman et al.,
no model required more than 20 man-hours of work, in-
cluding both modeling and data collection [41].
9 Summary and conclusions
This paper has demonstrated an integrated enterprise
architecture framework for quantitative availability mod-
eling and assessment of enterprise services. Specifically,
one component-based and one system-level method have
been integrated into a single metamodel. In addition
to entities, relationships and attributes, the framework
features a formal computational model, implemented in
P2AMF, that enables quantitative availability assess-
ment and prediction. The framework has been fully im-
plemented in the EA2T tool, and demonstrated using
nine case studies.
To summarize, there are three strong arguments
that speak in favor of the assessment and prediction
framework presented in this paper:
Precision The method delivers fair predictions, val-
idated by nine case studies. Compared to the no-
changes baseline, the root mean squared error (in
percentage points) is on average 25% smaller.
Uniqueness No comparable method capable of pre-
dicting availability on the level of enterprise services
and with proper empirical validation has been found
in the literature. Most other methods deal only with
the technical architecture, abstracting away impor-
tant issues such as change management processes
and governance. These are precisely the kind of in-
struments that are available to most IT managers.
Action guidance As opposed to most other methods,
our integrated framework offers concrete advise to a
decision-maker aiming to improve – not merely pre-
dict – availability of IT services. The combination of
the component-based and system-level approaches
offers a powerful tool to reason about improvements
and their effects.
9.1 Implications and future work
For the research community, this contribution offers an
empirical benchmark that can be used to assess the
strengths and weaknesses of other methods for avail-
ability assessment and prediction.

19
For the practitioner community, this contribution
can be used for rule-of-thumb decision making when
planning, budgeting and prioritizing future investments
in availability.
Another natural direction for future work is further
improvement of the prediction method. Such improve-
ment could take several forms such as (i) further case
studies for calibration, (ii) further refinements of the
factor operationalizations, or (iii) experiments to com-
plement the case study method used here.
Another, related direction for future work is to as-
sess the modeling effort using the framework. One di-
mension is the cost (time required) of data collection,
others include ease-of-use and usefulness [13].
Finally, automated data collection, in the spirit of
[8], is an interesting future direction. The difficulty of
obtaining and maintaining data is often highlighted as
a key difficulty with the enterprise architecture disci-
pline. Automatic tool-based data collection and subse-
quent analysis could make the framework described in
this article considerably more prone to be adopted by
practitioners.
Acknowledgements
The authors wish to thank Per Narman for valuable in-
put on metamodels for availability analysis, Johan Ull-
berg for help on the P2AMF language and for reviewing
the whole manuscript, Nicholas Honeth for reviewing
the whole manuscript, Khurram Shahzad whose con-
scientious and timely programming of the EA2T tool
was a prerequisite for this paper, Michael Mirbaha and
Jakob Raderius for their valuable input on the ITIL
operationalizations and the five enterprises who kindly
allowed us to conduct the case studies. In addition, the
comments of the three anonymous referees improved
the paper.
References
1. Object constraint language, version 2.2. Technical
report, Object Management Group, OMG, Febru-
ary 2010. URL http://www.omg.org/spec/OCL/
2.2. OMG Document Number: formal/2010-02-01.
2. S. Aier, S. Buckl, U. Franke, B. Gleichauf, P. John-
son, P. Narman, C.M. Schweda, and J. Ullberg. A
survival analysis of application life spans based on
enterprise architecture models. In 3rd International
Workshop on Enterprise Modelling and Informa-
tion Systems Architectures, pages 141–154, 2009.
3. Jenny Askaker and Mikael Kulle. Miljardaffarer
gick forlorade. Dagens Industri, June 4 2008. June
4, pp. 6-7, in Swedish.
4. A. Avizienis, J.C. Laprie, B. Randell, and
C. Landwehr. Basic concepts and taxonomy of de-
pendable and secure computing. Dependable and
Secure Computing, IEEE Transactions on, 1(1):11–
33, 2004.
5. S. Bernardi and J. Merseguer. A UML profile for
dependability analysis of real-time embedded sys-
tems. In Proceedings of the 6th international work-
shop on Software and performance, pages 115–124.
ACM, 2007.
6. Paolo Bocciarelli and Andrea D’Ambrogio. A
model-driven method for describing and predict-
ing the reliability of composite services. Software
and Systems Modeling, 10:265–280, 2011. ISSN
1619-1366. URL http://dx.doi.org/10.1007/
s10270-010-0150-3. 10.1007/s10270-010-0150-3.
7. Markus Buschle, Johan Ullberg, Ulrik Franke,
Robert Lagerstrom, and Teodor Sommestad. A tool
for enterprise architecture analysis using the PRM
formalism. In CAiSE2010 Forum PostProceedings,
October 2010.
8. Markus Buschle, Hannes Holm, Teodor Sommes-
tad, Mathias Ekstedt, and Khurram Shahzad. A
Tool for Automatic Enterprise Architecture Mod-
eling. In Proceedings of the CAiSE Forum 2011,
pages 25–32, 2011.
9. Robert Charette. Bank of America Suf-
fered Yet Another Online Banking Outage.
http://spectrum.ieee.org/riskfactor/
telecom/internet/
bank-of-america-suffered-yet-another-online
-banking-outage-, January 2011. IEEE Spectrum
”Risk factor” blog.
10. V. Cortellessa and A. Pompei. Towards a UML
profile for qos: a contribution in the reliability do-
main. In ACM SIGSOFT Software Engineering
Notes, volume 29, pages 197–206. ACM, 2004.
11. Vittorio Cortellessa, Harshinder Singh, and Bojan
Cukic. Early reliability assessment of UML based
software models. In Proceedings of the 3rd inter-
national workshop on Software and performance,
WOSP ’02, pages 302–309, New York, NY, USA,
2002. ACM. ISBN 1-58113-563-7. doi: http://
doi.acm.org/10.1145/584369.584415. URL http:
//doi.acm.org/10.1145/584369.584415.
12. Kenneth D. and Forbus. Chapter 9 qualita-
tive modeling. In Vladimir Lifschitz Frank van
Harmelen and Bruce Porter, editors, Handbook of
Knowledge Representation, volume 3 of Founda-
tions of Artificial Intelligence, pages 361 – 393. El-
20
sevier, 2008. doi: 10.1016/S1574-6526(07)03009-X.
URL http://www.sciencedirect.com/science/
article/pii/S157465260703009X.
13. Fred D. Davis. Perceived usefulness, perceived ease
of use, and user acceptance of information technol-
ogy. MIS quarterly, pages 319–340, 1989.
14. D. Durkee. Why cloud computing will never be
free. Queue, 8(4):20, 2010.
15. Mathias Ekstedt, Ulrik Franke, Pontus Johnson,
Robert Lagerstrom, Teodor Sommestad, Johan Ull-
berg, and Markus Buschle. A tool for enterprise ar-
chitecture analysis of maintainability. In Proc. 13th
European Conference on Software Maintenance and
Reengineering, March 2009.
16. C. Ericson. Fault tree analysis – a history. In 17th
International System Safety Conference, 1999.
17. Ulrik Franke, Pontus Johnson, Johan Konig, and
Liv Marcks von Wurtemberg. Availability of enter-
prise IT systems: an expert-based Bayesian frame-
work. Software Quality Journal, 20:369–394, 2011.
ISSN 0963-9314. DOI: 10.1007/s11219-011-9141-z.
18. Jim Gray. Why Do Computers Stop and What
Can Be Done About It? Technical report, Tandem
Computers Inc., June 1985.
19. Max Henrion. Some practical issues in construct-
ing belief networks. In L.N. Kanal, T.S. Levitt,
and J.F. Lemmer, editors, Uncertainty in Artificial
Intelligence 3, pages 161–173. Elsevier Science Pub-
lishers B.V., North Holland, 1989.
20. Frederick S. Hillier and Gerald J. Lieberman. Intro-
duction to operations research. McGraw-Hill New
York, NY, 2005. Eighth edition.
21. A. Hochstein, G. Tamm, and W. Brenner. Service-
oriented it management: Benefit, cost and success
factors. In Proceedings of the 13th European Con-
ference on Information Systems (ECIS), Regens-
burg, Germany, 2005.
22. Ed Holub. Embracing ITSM to Build a Customer
Service Provider Culture in IT I&O. Technical re-
port, Gartner, Inc., November 2009.
23. IBM Global Services. Improving systems availabil-
ity. Technical report, IBM Global Services, 1998.
24. Anne Immonen. A method for predicting reliabil-
ity and availability at the architecture level. In
Timo Kakola and Juan Carlos Duenas, editors,
Software Product Lines, pages 373–422. Springer
Berlin Heidelberg, 2006. ISBN 978-3-540-33253-4.
doi: 10.1007/978-3-540-33253-4\ 10.
25. Zahir Irani, Marinos Themistocleous, and Pe-
ter E.D. Love. The impact of enterprise application
integration on information system lifecycles. In-
formation & Management, 41(2):177 – 187, 2003.
ISSN 0378-7206. doi: 10.1016/S0378-7206(03)
00046-6. URL http://www.sciencedirect.com/
science/article/pii/S0378720603000466.
26. Pontus Johnson. Enterprise Software System Inte-
gration: An Architectural Perspective. PhD thesis,
Royal Institute of Technology (KTH), April 2002.
27. Pontus Johnson, Erik Johansson, Teodor Sommes-
tad, and Johan Ullberg. A tool for enterprise
architecture analysis. In Proceedings of the 11th
IEEE International Enterprise Computing Confer-
ence (EDOC 2007), October 2007.
28. Pontus Johnson, Robert Lagerstrom, Per Narman,
and Marten Simonsson. Enterprise architecture
analysis with extended influence diagrams. Infor-
mation Systems Frontiers, 9(2), May 2007.
29. Pontus Johnson, Johan Ullberg, Markus Buschle,
Khurram Shahzad, and Ulrik Franke. P2AMF:
Predictive, Probabilistic Architecture Modeling
Framework. 2012. Submitted manuscript.
30. D. Jordan, J. Evdemon, A. Alves, A. Arkin,
S. Askary, C. Barreto, B. Bloch, F. Curbera,
M. Ford, Y. Goland, et al. Web services business
process execution language version 2.0. Technical
report, OASIS, April .
31. M. Lankhorst. Enterprise architecture at work:
Modelling, communication and analysis. Springer-
Verlag New York Inc, 2009.
32. M.M. Lankhorst, H.A. Proper, and H. Jonkers. The
architecture of the archimate language. Enterprise,
Business-Process and Information Systems Model-
ing, pages 367–380, 2009.
33. C. Leangsuksun, H. Song, and L. Shen. Reliability
modeling using UML. In Proceeding of The 2003
International Conference on Software Engineering
Research and Practice, 2003.
34. Y.H. Liang. Analyzing and forecasting the relia-
bility for repairable systems using the time series
decomposition method. International Journal of
Quality & Reliability Management, 28(3):317–327,
2011. ISSN 0265-671X.
35. Istvan Majzik, Andras Pataricza, and Andrea Bon-
davalli. Stochastic dependability analysis of sys-
tem architecture based on UML models. In Ro-
grio de Lemos, Cristina Gacek, and Alexander Ro-
manovsky, editors, Architecting Dependable Sys-
tems, volume 2677 of Lecture Notes in Computer
Science, pages 219–244. Springer Berlin / Heidel-
berg, 2003. URL http://dx.doi.org/10.1007/
3-540-45177-3_10. 10.1007/3-540-45177-3 10.
36. Bill Malik and Donna Scott. How to Calculate the
Cost of Continuously Available IT Services. Tech-
nical report, Gartner, Inc., November 2010.
37. Evan Marcus and Hal Stern. Blueprints for high
availability, second edition. John Wiley & Sons,

21
Inc., Indianapolis, IN, USA, 2003.
38. M. Marrone, M. Kiessling, and L.M. Kolbe. Are
we really innovating? An exploratory study on In-
novation Management and Service Management.
In Management of Innovation and Technology
(ICMIT), 2010 IEEE International Conference on,
pages 378 –383, 2010. doi: 10.1109/ICMIT.2010.
5492719.
39. Mauricio Marrone and Lutz Kolbe. Uncovering
ITIL claims: IT executives perception on benefits
and Business-IT alignment. Information Systems
and E-Business Management, pages 1–18, 2010.
ISSN 1617-9846. doi: 10.1007/s10257-010-0131-7.
40. N. Milanovic. Models, Methods and Tools for
Availability Assessment of IT-Services and Busi-
ness Processes. Universitatsbibliothek, 2010.
Habilitationsschrift.
41. Per Narman, Ulrik Franke, Johan Konig, Markus
Buschle, and Mathias Ekstedt. Enterprise architec-
ture availability analysis using fault trees and stake-
holder interviews. Enterprise Information Systems,
2011. To appear.
42. Agnieszka Onisko, Marek J. Druzdzel, and Hanna
Wasyluk. Learning bayesian network parameters
from small data sets: application of noisy-or gates.
International Journal of Approximate Reasoning,
27(2):165 – 182, 2001. ISSN 0888-613X. doi: DOI:
10.1016/S0888-613X(01)00039-1.
43. David Oppenheimer. Why do internet services fail,
and what can be done about it? In Proceedings
of USITS 03: 4th USENIX Symposium on Internet
Technologies and Systems, March 2003.
44. Magnus Osterlind. Validering av verktyget ”Enter-
prise Architecture Analysis Tool”. Master’s thesis,
Royal Institute of Technology (KTH), May 2011.
45. S. Pertet and P. Narasimhan. Causes of fail-
ure in web applications. Technical report, Paral-
lel Data Laboratory, Carnegie Mellon University,
CMU-PDL-05-109, 2005.
46. Pat Phelan and Derek Prior. Additional Tools for a
World-Class ERP Infrastructure. Technical report,
Gartner, Inc., October 2011.
47. Marvin Rausand and Arnljot Høyland. System Re-
liability Theory: Models, Statistical Methods, and
Applications. John Wiley & Sons, Inc., Hobo-
ken, NJ, USA, 2nd edition, 2004. URL http:
//www.ntnu.no/ross/srt.
48. G.N. Rodrigues. A Model Driven Approach for
Software Reliability Prediction. PhD thesis, Uni-
versity College London, 2008.
49. R.A. Sahner and K.S. Trivedi. Reliability modeling
using sharpe. Reliability, IEEE Transactions on, 36
(2):186–193, 1987.
50. Donna Scott. Benchmarking Your IT Service Avail-
ability Levels. Technical report, Gartner, Inc., De-
cember 2011.
51. H. Singh, V. Cortellessa, B. Cukic, E. Gunel, and
V. Bharadwaj. A bayesian approach to reliabil-
ity prediction and assessment of component based
systems. In Software Reliability Engineering, 2001.
ISSRE 2001. Proceedings. 12th International Sym-
posium on, pages 12 – 21, nov. 2001. doi: 10.1109/
ISSRE.2001.989454.
52. Frida Sundkvist. Efter haveriet: Tieto granskas.
Computer Sweden, January 3 2012. in Swedish.
53. Sharon Taylor, David Cannon, and David Wheel-
don. Service Operation (ITIL). The Stationery Of-
fice, TSO, 2007. ISBN 9780113310463.
54. Sharon Taylor, Gary Case, and George Spalding.
Continual Service Improvement (ITIL). The Sta-
tionery Office, TSO, 2007. ISBN 9780113310494.
55. Sharon Taylor, Majid Iqbal, and Michael Nieves.
Service Strategy (ITIL). The Stationery Office,
TSO, 2007. ISBN 9780113310456.
56. Sharon Taylor, Shirley Lacy, and Ivor Macfarlane.
Service Transition (ITIL). The Stationery Office,
TSO, 2007. ISBN 9780113310487.
57. Sharon Taylor, Vernon Lloyd, and Colin Rudd. Ser-
vice Design (ITIL). The Stationery Office, TSO,
2007. ISBN 978011310470.
58. The Open Group. Archimate 1.0 specifica-
tion. Available from http://www.opengroup.org/
archimate/doc/ts_archimate/, 2009.
59. Johan Ullberg, Ulrik Franke, Markus Buschle, and
Pontus Johnson. A tool for interoperability analy-
sis of enterprise architecture models using pi-OCL.
In Proceedings of The international conference on
Interoperability for Enterprise Software and Appli-
cations (I-ESA), April 2010.
60. R. Van Buuren, H. Jonkers, M.E. Iacob, and
P. Strating. Composition of relations in enterprise
architecture models. Graph Transformations, pages
183–186, 2004.
61. Hal Varian. System reliability and free riding. In
L. Camp and Stephen Lewis, editors, Economics of
Information Security, volume 12 of Advances in In-
formation Security, pages 1–15. Springer US, 2004.
ISBN 978-1-4020-8090-6. 10.1007/1-4020-8090-5 1.
62. J. Wang. Timed Petri nets: Theory and application,
volume 39. Kluwer Academic Publishers Norwell,
1998.
63. Emmanuele Zambon, Sandro Etalle, Roel
Wieringa, and Pieter Hartel. Model-based
qualitative risk assessment for availability of it
infrastructures. Software and Systems Modeling,
pages 1–28, 2010. ISSN 1619-1366. URL http:

22
//dx.doi.org/10.1007/s10270-010-0166-8.
10.1007/s10270-010-0166-8.
64. Xuemei Zhang and Hoang Pham. An analysis of
factors affecting software reliability. J. Syst. Softw.,
50(1):43–56, 2000. ISSN 0164-1212. doi: 10.1016/
S0164-1212(99)00075-8.
A Appendix: ITIL operationalization of the
Bayesian expert model
A major challenge in the use of the system-level model [17]
is the operationalization of the 16 factors. In the expert
survey, the factor descriptions were – deliberately – kept
short and general. As the survey respondents were all
selected based on academic publications, detailed spec-
ifications in terms of enterprise operating procedures,
processes and activities were not deemed appropriate.
However, as we now turn to practical use, there is a
need to offer unambiguous operationalizations of the
factors. This is a prerequisite for being able to assess
whether a company meets the ”best practice” level or
not.
Making ”best practice” an unambiguous notion might
seem futile. However, in the area of IT Service Man-
agement (ITSM), the IT Infrastructure Library (ITIL)
[55, 57, 56, 53, 54] has become the de facto ITSM frame-
work [39, 38, 21]. ITIL adoption is also a prescription
offered to enterprises by influential consultancies such
as Gartner [22].
To make the factors understandable and applica-
ble to practitioners, they were translated into the ITIL
language. This appendix explains the meaning of the
causal factors, using ITIL as a frame of reference. Dur-
ing the case studies, the texts offered in this appendix
were used to explain to practitioners how to think about
the factors, in order to be able to assess their level of
best practice.
To cast the factors into the ITIL language, the five
ITIL volumes were studied, and the ITIL recommenda-
tions, processes, activities and examples were mapped
to the factors in Table 1. In so doing, care was taken
to retain the original meaning of the factors, as first
articulated in the expert survey. In order to make sure
that the interpretation of ITIL was correct, two certified
ITIL experts were – independently – asked to offer in-
put and feedback. As a result, a number of changes were
made so as to better express the factors in ITIL termi-
nology. The biggest change made during this feedback
phase was the merging of factors physical environment
with infrastructure redundancy into one single factor,
and data redundancy with storage architecture redun-
dancy into another single factor. Each pair of factors
was deemed close to indistinguishable in ITIL wording.
Thus, following the expert validation of the ITIL op-
erationalization, the 16 survey factors were converted
into 14, as illustrated in Table 1.If two causal factors i and j in the leaky Noisy-OR
model described by Eq. (3) are to be merged into asingle factor k, it is reasonable to require that the orig-inal model and the new, merged model are unanimousin their availability predictions when they are semanti-cally equivalent, i.e.:
P (y|x1, x2, . . . , xi, . . . , xj , . . . xn) = P (y|x1, x2, . . . , xk, . . . xn) (7)
P (y|x1, x2, . . . , xi, . . . , xj , . . . xn) = P (y|x1, x2, . . . , xk, . . . xn) (8)
It follows from Eq. (3) that such a model preserving
merger requires the following equality to hold:
pk =pi + pj − pipj − p0
1− p0(9)
This relation has been used when performing the merg-
ers recommended by the ITIL experts. In all reasonable
models, of course, p0 6= 1, so the divisor is non-zero.
A.1 Descriptions of the 14 ITIL factors
In the following section, each of the 14 factors are de-
scribed in more detail. The introductory italic text of
each factor presents the description used in the expert
survey, when the probability of the factor to cause sys-
tem unavailability was estimated. Then follows a de-
scription where each factor is presented in further detail
with reference to the appropriate ITIL documentation
[55, 57, 56, 53, 54]. Wordings are re-used from the ITIL
volumes and the certified ITIL experts to the largest
extent possible.
Physical environment and Infrastructure re-dundancyThe physical environment, including such things as elec-
tricity supply, cooling and cables handling, can affect
the availability of a system. Infrastructure redundancy
goes further than data and storage redundancy. Separate
racks and cabinets may not help if all electricity cables
follow the same path liable to be severed or if separate
cables end at the same power source.
Factors to be considered include the following:
– Building/site
– Major equipment room
– Major data centres
– Regional data centres and major equipment centres
– Server or network equipment rooms
– Office environments

23
For a more detailed description of each factor, cf. ITIL
Service Design [57] Appendix E, Table E.1-6.
Remark: Physical security/access control is part of
this category as well.
Requirements and procurementRequirements and procurement reflect the early phases
of system development and administration. This includes
return on investment analyses, re-use of existing con-
cepts, procuring software designed for the task at hand,
negotiating service level agreements etc.
This factor is about development of new systems
and services, not about those already taken into oper-
ation. Business requirements for IT availability should
at least contain (ITIL Service Design [57], p. 112):
– ”A definition of the VBFs [Vital Business Functions]
supported by the IT service
– A definition of IT service downtime, i.e. the con-
ditions under which the business considers the IT
service to be unavailable
– The business impact caused by loss of service, to-
gether with the associated risk
– Quantitative availability requirements, i.e. the ex-
tent to which the business tolerates IT service down-
time or degraded service
– The required service hours, i.e. when the service is
to be provided
– An assessment of the relative importance of different
working periods
– Specific security requirements
– The service backup and recovery capability.”
There should also be Service Level Requirements
(SLR).
Note that poor requirements management is often
a root cause behind other faults, covered by the other
factors.
OperationsOperations is everyday system administration. This in-
cludes removing single points of failure, maintaining
separate environments for development, testing and pro-
duction, consolidating servers etc.
”All IT components should be subject to a planned
maintenance strategy.” (ITIL Service Design [57], p. 120.)
”Once the requirements for managing scheduled main-
tenance have been defined and agreed, these should be
documented as a minimum in:
– SLAs [Service Level Agreements]
– OLAs [Operational Level Agreements]
– Underpinning Contracts
– Change Management schedules
– Release and Deployment Management schedules”
(ITIL Service Design [57], p. 120.)
”Availability Management should produce and main-
tain the Projected Service Outage (PSO) document.
This document consists of any variations from the ser-
vice availability agreed within SLAs.” (ITIL Service De-
sign [57], p. 121.)
Incident management aims to ”restore normal ser-
vice as quickly as possible and minimize the adverse im-
pact on business operations” (ITIL Service Operation
[53], p. 46.). Incidents are managed using an incident
model which should include:
– ”The steps that should be taken to handle the inci-
dent
– The chronological order these steps should be taken
in, with any dependences or co-processing defined
– Responsibilities - who should do what
– Timescales and thresholds for completion of the ac-
tions
– Escalation procedures; who should be contacted and
when
– Any necessary evidence-preservation activities” (ITIL
Service Operation [53], p. 47)
”Service Operation functions must be involved in
the following areas:
– Risk assessment, using its knowledge of the infras-
tructure and techniques such as Component Failure
Impact Analysis (CFIA) and access to information
in the Configuration Management System (CMS)
to identify single points of failure or other high-risk
situations
– Execution of any Risk Management measures that
are agreed, e.g. implementation of countermeasures,
or increased resilience to components of the infras-
tructures, etc.
– Assistance in writing the actual recovery plans for
systems and services under its control
– Participation in testing of the plans (such as involve-
ment in off-site testing, simulations etc) on an on-
going basis under the direction of the IT Service
Continuity Manager (ITSCM)
– Ongoing maintenance of the plans under the con-
trol of IT Service Continuity Manager ITSCM and
Change Management
– Participation in training and awareness campaigns
to ensure that they are able to execute the plans
and understand their roles in a disaster
– The Service Desk will play a key role in communi-
cating with the staff, customers and users during an
actual disaster” (ITIL Service Operation [53], p. 77)
24
The problem management process should contain
the following steps (ITIL Service Operation [53], p. 60):
– Problem detection
– Problem logging
– Categorization
– Prioritization
– Investigation and Diagnosis
– Create Known Error Record
– Resolution
– Closure
Change controlChange control is the process of controlling system changes.
This applies to both hardware and software, and in-
cludes documentation of the actions taken.
This factor is about systems and services already
taken into operation, not about those under develop-
ment. This is just a subset of the full ITIL Change
Management process.
The seven Rs of Change Management: ”The follow-
ing questions must be answered for all changes:
– Who RAISED the change?
– What is the REASON for the change?
– What is the RETURN required from the change?
– What are the RISKS involved in the change?
– What RESOURCES are required to deliver the change?
– Who is RESPONSIBLE for the build, test and im-
plementation of the change?
– What is the RELATIONSHIP between this change
and other changes?” (ITIL Service Transition [56],
p. 53)
The following is a list of activities from an example
process for a normal change (ITIL Service Transition
[56], p. 49):
– Record the Request for Change (RFC)
– Review Request for Change (RFC)
– Assess and evaluate change
– Authorize change
– Plan updates
– Co-ordinate change implementation
– Review and close change record
Questions to be addressed include: Is there unavail-
ability caused by standard changes that are pre-approved
and do not go through the cycle above? Is there unavail-
ability caused by unauthorized changes? Is there access
control, or can unauthorized people make changes? Is
there a Service Asset and Configuration Management
(SACM, described in ITIL Service Transition [56], p. 65
ff.) process?
Technical solution of backupThe technical solution of backup includes the choice of
back-up media, whether commercial or a proprietary
software is used, whether old media can still be read,
whether full, cumulative or differential backup is cho-
sen etc.
The technical aspects of a backup strategy should
cover:
– ”How many generations of data have to be retained
- thus may vary by the type of data being backed
up, or what type of file (e.g. data file or application
executable)
– The type of backup (full partial, incremental) and
checkpoints to be used
– The locations to be used for storage (likely to in-
clude disaster recovery sites) and rotation schedules
– Transportation methods (e.g. file transfer via the
network, physical transportation in magnetic me-
dia)
– Testing/checks to be performed, such as test-reads,
test restores, check-sums etc.” (ITIL Service Oper-
ation [53], p. 93)
Process solution of backupThe process solution of backup regulates the use of the
technical solution. This includes routines such as whether
backups are themselves backed up, whether the technical
equipment is used in accordance with its specifications,
what security measures (logical and physical) are used
to guard backups etc.
The business requirements for IT service continu-
ity must be properly determined to define the strategy.
The requirements elicitation has two steps: 1. Business
Impact Analysis and 2. Risk Analysis (ITIL Service De-
sign [57], p. 128 ff).
The process aspects of a backup strategy should
cover:
– ”What data has to be backed up and the frequency
and intervals to be used
[. . . ]
– Recovery Point Objective. This describes the point
to which data will be restored after recovery of an IT
Service. This may involve loss of data. For example,
a Recovery Point Objective of one day may be sup-
ported by daily backups, and up to 24 hours of data
may be lost. Recovery Point Objectives for each
IT service should be negotiated, agreed, and doc-
umented in OLAs [Operational Level Agreements],
SLAs [Service Level Agreements] and UCs [Under-
pinning Contracts].

25
– Recovery Time Objective. This describes the max-
imum time allowed for recovery of an IT service
following an interruption. The Service Level to be
provided may be less than normal Service Level Tar-
gets. Recovery Time Objectives for each IT ser-
vice should be negotiated, agreed, and documented
in OLAs, SLAs and UCs” (ITIL Service Operation
[53], p. 93-94, emphasis in original.)
The restore process must include these steps:
– ”Location of the appropriate data/media
– Transportation or transfer back to the physical re-
covery location
– Agreement on the checkpoint recovery point and the
specific location for the recovered data (disk, direc-
tory, folder etc)
– Actual restoration of the file/data (copy-back and
any roll-back/roll-forward needed to arrive at the
agreed checkpoint)
– Checking to ensure successful completion of the re-
store – with further recovery action if needed until
success has been achieved
– User/customer sign-off” (ITIL Service Operation [53],
p. 94)
Data and storage architecture redundancyData redundancy means that data stored on a disk re-
mains available even if a particular disk crashes. Such
data redundancy is often achieved through RAID. Stor-
age architecture redundancy refers to redundancy at the
level above disks: RAID may not help if all raided disks
are placed in a single cabinet or rack, or if disks are
connected through the same data paths and controller.
Is there a separate team or department to man-
age the organization’s data storage technology such as
(ITIL Service Operation [53], p. 97):
– Storage devices(disks, controllers, tapes etc.)
– Network Attached Storage (NAS), Storage Attached
Network (SAN), Direct Attached Storage (DAS) and
Content Addressable Storage (CAS)
Is there someone responsible for:
– ”Definition of data storage policies and procedures
– File storage naming conventions, hierarchy and place-
ment decisions
– Design, sizing, selection, procurement, configuration
and operation of all data storage infrastructure
– Maintenance and support for all utility and middle-
ware data-storage software
– Liaison with Information Lifecycle Management team(s)
or Governance teams to ensure compliance with free-
dom of information, data protection and IT gover-
nance regulations
– Involvement with definition and agreement of archiv-
ing policy
– Housekeeping of all data storage facilities
– Archiving data according to rules and schedules de-
fined during Service Design. The Storage teams or
departments will also provide input into the defini-
tion of these rules and will provide reports on their
effectiveness as input into future design
– Retrieval of archived data as needed (e.g. for audit
purposes, for forensic evidence, or to meet any other
business requirements)
– Third-line support for storage- and archive-related
incidents” (ITIL Service Operation [53], p. 97)
All redundancy decisions should have been through
an appropriate requirements engineering process (the
requirements engineering process is defined on ITIL Ser-
vice Design, pp. 167 ff.).
Avoidance of internal application failuresSystems can become unavailable because of internal ap-
plication failures, e.g. because of improper memory ac-
cess or hanging processes.
When new software is released and deployed, the
plans should define:
– ”Scope and content of the release
– Risk assessment and risk profile for the release
– Organizations and stakeholders affected by the re-
lease
– Stakeholders that approved the change request for
the release and/or deployment
– Team responsible for the release
– Approach to working with stakeholders and deploy-
ment groups to determine the:
– Delivery and deployment strategy
– Resources for the release and deployment
– Amount of change that can be absorbed” (ITIL
Service Transition [56], p. 91)
For software in operation, the following must be
in place or considered (ITIL Service Operations [53],
p. 133-134):
– Modeling, workload forecasting and workload test-
ing
– Testing by an independent tester
– Up to date design, management and user manuals
– Process of application bug tracking and patch man-
agement
– Error code design and error messaging
– Process for application sizing and performance
– Process for enhancement to existing software (func-
tionality and manageability)
– Documentation of type of brand of technology used
26
Avoidance of external services that failSystems can become unavailable because they depend on
external services that fail.
Service Level Management includes (ITIL Continual
Service Improvement [54]):
– ”Identifying existing contractual relationships with
external vendors. Verifying that these Underpinning
Contracts (UCs) meet the revised business require-
ments. Renegotiating them, if necessary.” (pp. 28-
29)
– ”Create a Service Improvement Plan (SIP) to con-
tinually monitor and improve the levels of services”
(p. 29)
– An implemented monitor and data collection proce-
dure (Service monitoring should also address both
internal and external suppliers since their perfor-
mance must be evaluated and managed as well (p. 46).)
– Service Level Management (SLM)
– ”Analyze the Service Level Achievements com-
pared to SLAs and service level targets that may
be associated with the Service Catalogue
– Document and review trends over a period of
time to identify any consistent patterns
– Identify the need for service improvement plans
– Identify the need to modify existing OLAs [Op-
erational Level Agreements] or UCs [Underpin-
ning Contracts]” (ITIL Continual Service Im-
provement [54] p. 59)
Key elements of successful supplier management:
– ”Clearly written, well-defined and well-managed con-
tract
[. . . ]
– Clearly defined (and communicated) roles and re-
sponsibilities on both sides
– Good interfaces and communications between the
parties
– Well-defined Service Management processes on both
sides
– Selecting suppliers who have achieved certification
against internationally recognized certifications, such
as ISO 9001, ISO/IEC 20000, etc.” (ITIL Service
Design [57], p. 164)
Network redundancyNetwork redundancy, e.g. by multiple connections, mul-
tiple live networks or multiple networks in an asymmet-
ric configuration, is often used to increase availability.
Important configurations for redundancy include:
– Diversity of channels: ”provide multiple types of ac-
cess channels so that demand goes though different
channels and is safe form a single cause of failure.”
(ITIL Service Strategy [55], p. 177)
– Density of network: ”add additional service access
points, nodes, or terminals of the same type to in-
crease the capacity of the network with density of
coverage.” (ITIL Service Strategy [55], p. 177)
– Loose coupling: ”design interfaces based on public
infrastructure, open source technologies and ubiqui-
tous access points such as mobile phones and browsers
so that the marginal cost of adding a user is low.”
(ITIL Service Strategy [55], p. 177)
Avoidance of network failuresNetwork failures include the simplest networking failure
modes, e.g. physical device failures, IP level failures and
congestion failures.
Important factors include:
– ”Third-level support for all network related activi-
ties, including investigation of network issues (e.g. ping-
ing or trace route and/or use of network manage-
ment software tools – although it should be noted
that pinging a server does not necessarily mean that
the service is available!) and liaison with third-parties
as necessary. This also includes the installation and
use of ’sniffer’ tools, which analyze network traffic,
to assist in incident and problem resolution.
– Maintenance and support of network operating sys-
tem and middleware software including patch man-
agement, upgrades, etc.
– Monitoring of network traffic to identify failures or
to spot potential performance or bottleneck issues.
– Reconfiguring or rerouting of traffic to achieve im-
proved throughput or batter balance – Definition of
rules for dynamic balancing/routing” (ITIL Service
Operation [53], p. 96)
Physical locationThe physical location of hardware components can af-
fect the recovery time of a malfunctioning system. This
is the case for instance when a system crashes and re-
quires technicians to travel to a remote data center to
get it up again.
Has physical location been taken into account when
fixing the Recovery Time Objective (RTO)? The overall
backup strategy must include:
– Recovery Time Objective. This describes the max-
imum time allowed for recovery of an IT service
following an interruption. The Service Level to be
provided may be less than normal Service Level Tar-
gets. Recovery Time Objectives for each IT ser-
vice should be negotiated, agreed, and documented

27
in OLAs, SLAs and UCs” (ITIL Service Operation
[53], p. 93-94, emphasis in original.)
Physical location is partly addressed in the detailed
description of Facility Management (ITIL Service Op-
eration [53], Appendix E: E2, E3, E4 and E6).
Resilient client/server solutionsIn some client/server solutions, a server failover results
in the clients crashing. In more resilient client/server
solutions, clients do not necessarily fail when the server
fails.
Typically, the following activities should be under-
taken:
– ”Third-level support for any mainframe-related in-
cidents/problems”
[. . . ]
– Interfacing to hardware (H/W) support; arranging
maintenance, agreeing slots, identifying H/W fail-
ure, liaison with H/W engineering.
– Provision of information and assistance to Capacity
Management to help achieve optimum throughput,
utilization and performance from the mainframe.”
(ITIL Service Operation [53], p. 95)
Other activities include:
– ”Providing transfer mechanisms for data from vari-
ous applications or data sources
– Sending work to another application or procedure
for processing
– Transmitting data or information to other systems,
such as sourcing data from publication on websites
– Releasing updated software modules across distributedenvironments
– Collation and distribution of system messages and
instructions, for example Events or operational scripts
that need to be run on remote devices
– Multicast setup with networks. Multicast is the de-
livery of information to a group of destination si-
multaneously using the most efficient delivery route
– Managing queue sizes.
– Working as part of Service Design and Transition
to ensure that the appropriate middleware solutions
are chosen and that they can perform optimally
when they are deployed
– Ensuring the correct operation of middleware through
monitoring and control
– Detecting and resolving incidents related to middle-
ware
– Maintaining and updating middleware, including li-
censing, and installing new versions
– Defining and maintaining information about how
applications are linked through Middleware. This
should be part of the CMS [Configuration Manage-
ment System]” (ITIL Service Operation [53], p. 99)
There should exist a transition strategy for how to
release client/server systems from testing into produc-
tion (ITIL Service Transition [56], p. 38 ff.). Do not
forget that requirements engineering and change con-
trol might be the root cause of failures in this domain!
Monitoring of the relevant componentsFailover is the capability to switch from a primary sys-
tem to a secondary in case of failure, thus limiting the
interruption of service to only the takeover time. A pre-
requisite for quick failover is monitoring of the relevant
components.
Instrumentation is about ”defining and designing
exactly how to monitor and control the IT Infrastruc-
ture and IT services” (ITIL Service Operation [53],
p. 45). The following needs to be answered:
– ”What needs to be monitored?
– What type of monitoring is required (e.g. active or
passive; performance or output)?
– When do we need to generate an event?
– What type of information needs to be communi-
cated in the event?
– Who are the messages intended for?” (ITIL Service
Operation [53], p. 45)
Examples of important monitoring needs include:
– ”CPU utilization (overall and broken down by sys-
tem/service usage)
– Memory utilization
– IO rates (physical and buffer) and device utilization
– Queue length (maximum and average)
– File storage utilization (disks, partition, segments)
– Applications (throughput rates, failure rates)
– Databases (utilization, record locks, indexing, con-
tention)
– Network transaction rates, error and retry rates
– Transaction response time
– Batch duration profiles
– Internet response times (external and internal to
firewalls)
– Number of system/application log-ons and concur-
rent users
– Number of network nodes in use, and utilization lev-
els.” (ITIL Service Operation [53], p. 74)
For each incident: Was it/could it reasonably have
been foreseen, or does lack of foresight indicate poor
monitoring? Is there end-to-end monitoring?

28
B Appendix: OCL code for derived metamodel
attributes
B.1 BehaviorElement
B.1.1 ArchitecturalAvailability:Real
if gateToServiceInv->notEmpty()then
gateToServiceInv.Availabilityelse
if assigned->notEmpty()then
assigned.Availability->sum()else
EvidentialAvailabilityendif
endif
B.1.2 AvoidedUnavailability:Real
if isTopService()=falsethen
nullelse
avoidedUnavailability()endif
B.1.3 HolisticAvailability:Real
if isTopService()=falsethen
nullelse
if (AvoidedUnavailability-AvoidedUnavailabilityBaseline) >= 0then
ArchitecturalAvailability+(1-ArchitecturalAvailability)*(AvoidedUnavailability-AvoidedUnavailabilityBaseline)/(1-AvoidedUnavailabilityBaseline)
elseArchitecturalAvailability+ArchitecturalAvailability*(AvoidedUnavailability-AvoidedUnavailabilityBaseline)/AvoidedUnavailabilityBaseline
endifendif
It should be noted that the final divi-
sor is zero (i.e. the expression is undefined) if
AvoidedUnavailabilityBaseline = 1. However,
as the leakage of the Noisy-OR model prevents
AvoidedUnavailability from ever reaching 1, a base-
line value of 1 is also impermissible. This is enforced
using the baselineCheck invariant.
C Appendix: OCL code for metamodel
operations
C.1 BehaviorElement
C.1.1 isTopService():Boolean
This operation checks whether the current
BehaviorElement is the top service, i.e. whether
it has no causal successors. The reason for doing this
is that the holistic availability ought only be evaluated
at a single point in the architecture, viz. at its ”top”.
This follows from the fact that holistic availability
accounts for non-localizable properties.
ifserviceToGate->isEmpty()
thentrue
elsefalse
endif
C.1.2 getBehaviorElements(BehaviorElement):BehaviorElement[*]
This operation returns the set of all BehaviorElements
causally prior to the one given as argument, including
itself. This is implemented in a recursive fashion.
getGates(curr.gateToServiceInv)->asSet()->excluding(null).serviceToGateInv->asSet()->collect(be:BehaviorElement | getBehaviorElements(be)->asSet()->excluding(null))->asSet()->union(getGates(curr.gateToServiceInv)->asSet()->excluding(null).serviceToGateInv->asSet())->asSet()->union(curr->asSet())
curr is the BehaviorElement given as argument.
C.1.3 getGates(Gate):Gate[*]
This operation returns the set of all gates connected
to the one given as argument through other gates (not
through BehaviorElements).
curr->excluding(null).gateToGateInv->collect(g:Gate | getGates(g))->asSet()->union(curr->excluding(null).gateToGateInv->asSet())->union(curr->asSet())
curr is the Gate given as argument.
C.1.4 getBestPracticeCausalFactor(BehaviorElement):Real
This set includes 14 operations, one for each of thebest practice attribute factors of Table 2. Whilesimilar, the 14 P2AMF implementations differ abit from each other. Each operation traverses thearchitectural model, using the getBehaviorElementsand getGates operations, to find all attributes of therelevant kind. The arithmetic mean of the attributevalues is returned. If no attributes of the relevantkind are found, the default value 0.5 is returned.getBestPracticeAvoidanceOfExternalService-Failures represents the basic case:
let current : Set(ApplicationService) =getBehaviorElements(top)->
select(oclIsTypeOf(ApplicationService))->asSet()->excluding(null).oclAsType(ApplicationService)->asSet() in
if current->size()=0 then--If no elements exist, we assume 50% best practice
0.5else
current.bestPracticeAvoidanceOfExternalServiceFailures->sum()/current->size()
endif

29
top is the BehaviorElement given as argument.If the attributes sought belong to more than one
class, these several class types must be found, as ingetBestPracticeResilientClientServerSolutions:
let current1 : Set(InfrastructureService) =getBehaviorElements(top)->select(oclIsTypeOf(InfrastructureService))->asSet()->excluding(null).oclAsType(InfrastructureService)->asSet() in
let current2 : Set(ApplicationService) =getBehaviorElements(top)->select(oclIsTypeOf(ApplicationService))->asSet()->excluding(null).oclAsType(ApplicationService)->asSet() in
if current1->size()+current2->size()=0 then--If no elements exist, we assume 50% best practice
0.5else
(current1.bestPracticeResilientClientServerSolutions->sum()+current2.bestPracticeResilientClientServerSolutions->sum())/(current1->size()+current2->size())
endif
Sometimes the attributes belong to aclass that has to be accessed through a re-lationship, e.g. isGovernedBy in getBest-PracticeChangeControl:
let current : Set(ChangeControl) =getBehaviorElements(top).isGovernedBy->select(oclIsTypeOf(ChangeControl))->asSet()->excluding(null).oclAsType(ChangeControl)->asSet() in
if current->size()=0 then--If no elements exist, we assume 50% best practice
0.5else
current.bestPractice->sum()/current->size()endif
C.1.5 avoidedUnavailability():Real
This operation calculates the avoided unavailability
based on the Noisy-OR model from [17]. The model
originally gives the avoided unavailability as
A(Xp) = 1− P (y|Xp) = (1− p0)∏
i:Xi∈Xp
(1− pi)(1− p0)
(10)
where A(Xp) is the avoided unavailability of an archi-
tecture lacking the best practice factors listed in the
vector Xp. The pi variables are the ones given in Ta-
ble 1. In this implementation, each factor to the right
of the product sign is calculated using the operation
noisyOrFactor.
--Leakage 1%let p0 : Real = 0.01 in--Grand unified Noisy-OR product(1-p0)*noisyOrFactor(0.0997315262,getBestPractice-
PhysicalEnvironmentAndInfrastructureRedundancy(self),p0)*noisyOrFactor(0.2524557957,getBestPractice-
RequirementsAndProcurement(self),p0)*noisyOrFactor(0.2299924070,getBestPractice-
Operations(self),p0)*noisyOrFactor(0.2807783956,getBestPractice-
ChangeControl(self),p0)*noisyOrFactor(0.0695945946,getBestPractice-
TechnicalSolutionOfBackup(self),p0)*noisyOrFactor(0.0357142857,getBestPractice-
ProcessSolutionOfBackup(self),p0)*noisyOrFactor(0.0955186161,getBestPractice-
DataAndStorageArchitectureRedundancy(self),p0)*noisyOrFactor(0.1685845800,getBestPractice-
AvoidanceOfInternalApplicationFailures(self),p0)*
noisyOrFactor(0.0865984930,getBestPractice-AvoidanceOfExternalServiceFailures(self),p0)*
noisyOrFactor(0.0760578279,getBestPractice-NetworkRedundancy(self),p0)*
noisyOrFactor(0.1828929068,getBestPractice-AvoidanceOfNetworkFailures(self),p0)*
noisyOrFactor(0.0334905660,getBestPractice-PhysicalLocation(self),p0)*
noisyOrFactor(0.0364864865,getBestPractice-ResilientClientServerSolutions(self),p0)*
noisyOrFactor(0.2614035088,getBestPractice-ComponentMonitoring(self),p0)
C.1.6 noisyOrFactor(Real,Real,Real):Real
This operation calculates factors for the
avoidedUnavailability operation. In the formu-
lation given in Eq. 10, each best practice factor is
either present or not (i.e. listed in the vector Xp,
or not). However, noisyOrFactor allows factors to
be present probabilistically, i.e. be present with a
probability q and absent with a probability 1 − q.
A causal factor being present means that it is not
listed in the index set Xp, which is equivalent to
noisyOrFactor returning 1, i.e. the multiplicative
identity. This consideration gives noisyOrFactor the
following form:
q*1+(1-q)*(1-p)/(1-p0)
noisyOrFactor takes three arguments; p, q, and
p0. p0 = 1% [17], p is the appropriate pi from Ta-
ble 1, and q is the value returned from the appropriate
getBestPracticeCausalFactor .
It is a feature of Noisy-OR models as such that the
impact of the systemic causal factors is multiplicatively
separable. This allows the probabilistic presence of each
factor to be treated independently from the rest, as in
noisyOrFactor.
D Appendix: OCL code for metamodel
invariants
A number of OCL invariants are included in the meta-
model, in order to express constraints that cannot be
expressed in a regular entity-relationship diagram.
D.1 BehaviorElement
D.1.1 baselineCheck
This invariant requires that the
AvoidedUnavailabilityBaseline ∈ [0, 1). It can-
not be unity, since the Noisy-OR model behind
AvoidedUnavailability has leakage and cannot be
unity.

30
if(AvoidedUnavailabilityBaseline >= 1or AvoidedUnavailabilityBaseline < 0)
then falseelse trueendif
D.1.2 mostOneType
This invariant requires that a BehaviorElement is at
most connected to one gate through the gateToService
relation or to one ActiveStructureElement through
the assigned relation, but not to both. Being con-
nected to both would lead to a conflict in the calculation
of architectural availability.
(gateToServiceInv->notEmpty() implies assigned->isEmpty())and (assigned->notEmpty() implies gateToServiceInv->isEmpty())
D.2 Node
D.2.1 onlyInfrastructureService
This invariant requires that only an
InfrastructureService, and no other type of
BehaviorElement can be assigned to a Node.
assignedInv->forAll(s: BehaviorElement |s.oclIsTypeOf(InfrastructureService))
D.3 ApplicationComponent
D.3.1 onlyFunction
This invariant requires that only an
ApplicationFunction, and no other type of
BehaviorElement can be assigned to an
ApplicationComponent.
assignedInv->forAll(s: BehaviorElement |s.oclIsTypeOf(ApplicationFunction))
D.4 CommunicationPath
D.4.1 onlyInfrastructureService
This invariant requires that only an
InfrastructureService, and no other type
of BehaviorElement can be assigned to a
CommunicationPath.
assignedInv->forAll(s: BehaviorElement |s.oclIsTypeOf(InfrastructureService))