an artificial recharge experiment in the san jacinto basin...
TRANSCRIPT

Journal of Hydrology, 140 (1992) 235-259 235 Elsevier Science Publishers B.V., Amsterdam
[2]
An artificial recharge experiment in the San Jacinto basin, Riverside, southern California
T i e n - C h a n g Lee" A l a n E. Wi l l i ams a a n d C h u c h i n g W a n g b
"Institute ~[ Geophysics and Planetary Physics, Department o[" Earth Sciences, University q/" California, Riverside, CA 92521, USA
bMetropolitan Water District qf Southern California, 1111 Sunset Blvd., Box 54153, Los Angeles, CA 90054, USA
(Received 25 March 1992; revision accepted 22 April 1992)
ABSTRACT
Lee, T-C., Williams, A.E. and Wang, C., 1992. An artificial recharge experiment in the San Jacinto basin, Riverside, southern California. J. Hydrol., 140: 235-259.
During a 3 month recharge experiment related to conjunctive use of water resources, 1.5 x 10⁶ T of imported water were percolated through a pond of 128 m by 128 m in the San Jacinto basin. The infiltration rates, which declined with time, averaged 1.9mday ~, equivalent to four times the lowest laboratory- measured hydraulic conductivity of the fluvial deposits. Ponding altered the unimodal grain-size distribu- tion at the ground surface to types without a dominant mode, but this redistribution did not always lead to reduction in conductivities, which varied over at least three orders of magnitude. The water table 80 m downstream from the ponding edge began to rise slowly 1 month after the start of ponding; it leveled off at 8 m above the pre-recharge water table depth of 75 m and did not recede 2 months after termination of ponding. Water levels in wells bottomed in the original vadose zone suggested that an inverted water table migrated downward to meet the rising water table. Minor, local perching occurred at 14m depth, as indicated by the presence of moist ground near one monitoring well and by hydraulic responses during a 20 day intermission in percolation. As it percolated through the sediments, the imported northern California water gained Ca but lost Mg, so that the Mg/Ca ratio resembled that of local ground water. Such cation exchange has also been demonstrated by leaching experiments in the laboratory. However, the characteristics of the original source waters appear to be retained by D/H isotope ratios and C1 concentra- tions, as well as cross-plots of SO 4 vs. C1 and B vs. C1. Such unreactive tracers could serve to monitor transport and mixing of the chemically diverse water used in future recharge programs in the'San Jacinto basin.
I N T R O D U C T I O N
Artificial recharge of ground water has been operated for about 30 years in southern California for various purposes (e.g. Madrid, 1988) - - t o replenish
Correspondence to: T-C. Lee, Institute of Geophysics and Planetary Physics, Depar tment of Earth Sciences, University of California, Riverside, CA 92521, USA.
0022-1694/92/$05.00 (t:~ 1992 Elsevier Science Publishers B.V. All rights reserved

236 T-C. LEE ET AL.
the overdrawn groundwater basins, store reclaimed water, repel seawater intrusion, retard ground subsidence, and increase gas/oil production. Because of increasing water consumption, potential decrease in allocation of surface water supplies, declining water levels in many groundwater basins, and concern about water-quality degradation, better management of water resources is highly desirable. To meet the challenge, the MWD (Metropolitan Water District of Southern California) as a water wholesaler in southern California has actively promoted the concept of conjunctive use of water resources - - integrated management of imported surface water supplies with existing groundwater reserves (Kendall and Sienkiewich, 1988). A feasibility study of groundwater recharge in the San Jacinto basin was conducted in cooperation with the M W D and the EMWD (Eastern Municipal Water District, a water wholesaler and retailer in western Riverside County). The immediate objectives of the feasibility study were to establish institutional coordination and structure, to determine the operational economic benefit, and to identify potential impacts of changes in groundwater level and quality. This paper deals with the last item. Specifically, we determined infiltration rate, examined quality changes during percolation, and assessed the feasibility of operating a long-term groundwater recharge and storage program.
The northwest-southeast elongated San Jacinto basin lies in a graben structurally bounded by two en echelon strands of the San Jacinto fault zone in Riverside County, southern California (Fig. 1). The graben started to develop about 1.5 ma as a pull-apart basin in the right-stepping right-lateral strike-slip fault zone (Morton and Matti, 1992). Since then, sediments in the developing and subsiding graben have accumulated up to 2.6 km in thickness, according to geophysical models based on seismic refraction (Fett, 1968) and gravity data (Lee and Biehler, 1991). The basin sediments, which shoal towards the NW and SE ends, consist mainly of silt and sand with occasional clay and gravel lenses (Bean, 1955). The basin is about 40km long and 4km wide. The present water levels average about 60 m below the ground surface. The vast volume of the unsaturated portion of the basin is thus very appealing for artificial recharge storage if other favorable conditions are met.
The ephemeral San Jacinto River provides most of the natural recharge water in the basin. Artesian pressure existed once in the central one-third of the basin (Waring, 1919), but disappeared as the water levels declined with increasing pumpage. Overdraft from the 1950s to late 1970s resulted in decline of water levels of up to 70 m (Schlehuber et al., 1989). Our demonstration site for artificial recharge spreading is located upstream from the area of most severe overdraft.
Several factors were considered in site selection: (1) The site should be upstream from the former artesian area, to minimize

ARTIFICIAL RECHARGE IN SAN JACINTO BASIN 237
3 3 o 4 5 .
Fig. I. Location of the San Jacinto Valley (from Schlehuber et al., 1989). The recharge site is located east of San Jacinto, at 'v' of 'River'. The upper insert depicts Riverside (solid dot) relative to Los Angeles; and the lower insert depicts the San Jacinto valley relative to Riverside~ the San Jacinto fault (S.J.F.) and the San Andreas fault (S.A.F.). Thin solid or dashed lines designate fault traces. Dotted enclosure shows artesian area of Waring (1919).
the probability of perching of the recharge water at shallow depth. Shallow water levels (depth less than 20 m) in the sandy layers can raise the liquefaction potential as a result of earthquake shaking in the San Jacinto fault zone, which is the most active fault zone in southern California in terms of recurrence rates of earthquakes of magnitude greater than five.
(2) The site should be located far enough downstream from the confluence of the San Jacinto River and Bautista Creek that the two chemically distinct, natural source waters mix sufficiently to provide a chemically homogeneous native (local) water (Schlehuber et al., 1989) for tracing recharge water of different chemistry.
Besides these two geologic conditions, we consider the economic and operational constraints.
(3) The site should be as close as possible to the existing water supply pipe lines to minimize the capital cost of bringing imported State Project water to the spreading ground.

238 T-C. LEE [ r AL.
(4) Production wells should be available for recovering the recharged water an essential aspect of the conjunctive-use concept.
We inspected potential sites for artificial recharge and guess-estimated that the fluvial sediments at the chosen site could sustain a long-term average infiltration rate of 0.6 m day ~ (2 ft day ~ ). Spreading ponds for a demonstra- tion project were then constructed to determine the variability of infiltration rates, to monitor the water mound under and around the recharge site, to document geochemical change as imported water percolates through the vadose zone, and to identify natural tracers for delineating the migration pattern of recharged water when an operational conjunctive-use program is installed in the future.
FACILITIES AT THE RECHARGE SITE
The EMWD and MWD envision an annual recharge of 2.47 x 10⁶m 3 (20 000 acre ft) for conjunctive use. The operation is to be conducted during a 3 month winter season when the State Project water imported from northern California through the California Aqueduct may have a 'surplus', when the spreading recharge under the present drought condition in southern California is politically less sensitive, when the evaporation rate is likely to be lower than at other times, and when insects are less likely to multiply to an unacceptable level. Our demonstration project is scaled to represent 10% of the anticipated volume of operational recharge.
Recharge ponds
Assuming a recharge rate of 0.6today ~ for 90 days, a 10 acre spreading basin was prepared on the flood plain of the San Jacinto River. To prevent accidental drowning, the spreading ground was divided into three ponds so that the ponding depth would not exceed 0.76 m (2.5 ft). High ponding depth does not necessarily result in greater infiltration rate because excessive algae growth, combined with increased precipitation of calcium and fine particles, may clog pores in the sediments to reduce the effective hydraulic conductivity (Bouer, 1989). The sand dikes enclosing the ponds were 0.6-1 m high; the pond floor followed the natural gradient of the river bed. Each pond was about 128 m by 128 m (420 ft x 420 ft). As described below, the mean infiltra- tion rate of 1.9 m day ~ (6.3 ft day ~ ) during the demonstration recharge was three times our guess-estimate, therefore only one pond was used. Figure 2 depicts the ponding edge when the ponding depth was 0.64 m (2.1 ft) at 13 days after the percolation began, as surveyed with an electronic distance meter. The berms for the ponds were destroyed, as anticipated in the project design, by a flood in March 1991.

ARTIFICIAL RE( HARGE IN SAN JACINTO BASIN 239
1
×
+
\ 7 4
P
g 5 3•
0 m 30 x [ I 1 I
2
Fig. 2. Ponding surface on day 13 since the beginning of percolation, when the ponding depth was 0.65 m at location P. O, Monitoring well locations; o , outlet of imported water; x , sampling sites for size analysis and measurement of hydraulic conductivity presented in Fig. 3.
Water supply
The artificial recharge water was supplied through a 12 inch pipe line which was connected over a flood-control levee to a 33 in feeder line. The flow rate, measured with a high-capacity flow meter, was manually adjusted to maintain the ponding depth as great as possible, but under the safety limit mentioned above. During the first week of percolation, the readings of flow rate ranged from 5400 to 8100 gallons min-I . Thereafter, the readings ranged between 5000 and 6000 gallons rain -~ . Partial diversion of water from the feeder pipe line also caused the instantaneous flow rates to fluctuate but such variations were not typically recorded. Because of the difficulty in keeping the flow rates and ponding depths at constant values, we use the cumulative flow rates to estimate mean daily infiltration rates.
Evaporation rates in the pond were estimated with two evaporation tubs, made of galvanized sheet metal. Each tub was shaped like an inverted frustum of a right circular cone with an upper inner diameter of 62.2 cm, a lower inner diameter of 53.3 cm, and a height of 28.2cm. Each tub was about two-thirds submerged in the pond water. The evaporation rates averaged 0.53 cm day-I , Which is less than 0.3% of the mean infiltration rate. During the 3 months of recharge experiment, there was only one measurable rainfall at the site, about

240 T-C. LEE ET AL.
0.3 cm. The infiltration rates as reported later were not corrected for evapora- tion or rainfall. Nor were the rates corrected for changes in ponding depth and ponding surface area.
The recharge experiment commenced on 8 October 1990, was interrupted on 23 November, resumed on 13 December 1990 and terminated on 7 January 1991. the first period of percolation lasted 46.1 days and the second period lasted 24.8 days, to give a total percolation period of 70.9 days with an intermission of 20.3 days.
Monitoring wells
Eight wells were rotary-drilled for water sampling and level monitoring. Each well was gravel-packed and screened along the bottom 6 m (20 ft), except Wells 7 and 8 which were perforated over the bottom 12 m. The remainder of each well was cased with 4 in, Schedule 40 polyvinyl chloride (PVC) casing and grouted with Portland cement. The wells were developed by surging and air-lifting with native ground water trucked from nearby production wells. The development ceased when the produced water was certified to be clear and the pH values and electrical conductivity appeared normal. Some wells were redeveloped after a few days had elapsed to ensure full development around the screened bottom sections. Well 7 was abandoned after a portable pump became stuck in the well.
Wells 1-4 were drilled to about 15 m depth (50 ft) to determine whether the percolating water might have been perched above an impermeable layer as identified offsite during two previous standard penetration tests for engineer- ing construction. Perching on a continuous impermeable layer at such shallow depth could raise liquefaction potential in the seismically active area and pose an unacceptable risk to the foundation of flood control levees and man-made structures further away. Wells 1 and 2 were for monitoring lateral flow and Wells 3 and 4 were for monitoring downstream flow. Wells 5 and 6, drilled to depths around 30 m (100 ft) were designed to define the water mound around the recharge site and to ascertain absence of perching above 30 m. Although perching at 30 m itself would not enhance the liquefaction potential, it is a serious concern from the viewpoint of a long-term operational recharge program because we prefer to preserve a 15m buffer zone of storage for natural recharge in case of unusual but possible wet seasons. Wells 7 and 8, which penetrated the pre-recharge water table, were to monitor aquifer responses to recharge.
PHYSICAL PROPERTIES OF SEDIMENTS
The Quaternary fluvial deposits in the basin consist mainly of clay and silt,

ARTIFICIAL RECHARGE 1N SAN JACINTO BASIN 241
with lesser amount of sand and gravel (Bean, 1955). At the recharge site, sand dominates the surficial sediments. Patches of silt and clay appear at some braided channels or local depressions, and gravel of clay ball or granitic rock occurs rarely.
Core samples
Fifteen core samples were taken from the four corners and central part of each of the three ponds before the onset of percolation. Ten additional samples were taken from similar locations during the intermission and post- ponding. The cores were taken by driving 60 cm clear plastic pipes (2.5 in o.d. and 2.35 in i.d.) into the ground. The recovered cores ranged from 20 to 50 cm in length.
A constant-head permeameter was used to determine the hydraulic conduc- tivities of the core samples, which ranged over three orders of magnitude, from 5.22 x 10⁻⁶ t o 3.46 x 10 3 m s t. The porosity values of those samples ranged from 36 to 55%. There was no apparent correlation between porosity and hydraulic conductivity. After the porosity and conductivity were measured, the samples were retrieved from the plastic tubes for size analysis. The grain sizes of all but one of the pre-ponding samples were unimodally distributed, with most of the modes occurring at a phi value of 0.5 (0.7 mm in diameter, coarse sand). The exceptional sample was dominated by grains finer than a phi value of 3.5 (0.09 mm in diameter) in the silt and clay range, and this sample had the lowest hydraulic conductivity. However, the correla- tion between effective grain sizes and hydraulic conductivities was generally poor. Hazen's empirical formula (Fetter, 1988) predicts a set of values one to two orders of magnitude greater than our measured values. Because the average infiltration rate, 2.2 x 10 5ms, was closer to the lower end of our laboratory-determined hydraulic conductivities, we believe that the measured values are preferable to values inferred from Hazen's formula.
The first-period ponding apparently modified the grain-size distribution from a unimodal one to the type without a dominant mode. Histograms of two sets of samples, one set nearest to and the other farthest from the water outlet, illustrate the change (Fig. 3). However, there were no significant changes in size distribution between the intermission and post-ponding samples. Part of the difference between effects of the two ponding periods could be attributable to the higher flow rate at the beginning of the first ponding period. Apparently, the first period of ponding caused greater distur- bance and stabilized the size distribution when the flow rate declined. After ponding, hydraulic conductivities typically increased or decreased by factors

242 T-C. LEE ETAL
LJJZ -
C 3 ~
CD 14J
0 j
o I ~ - ' o - ~ ~0 ~ .=
GRRIN 5~ZE [PHIl
Fig. 3. His tograms of grain-size distribution for pre-ponding sediments (solid lines) and post-ponding sediments (dashed bars). Grain size in units of phi (i.e. log2d, where d is the diameter of the grain size, in millimeters). The lower and upper figures represent, respectively, the sets nearest to and farthest from the
outlet (Fig. 2).
of two to five. Such changes are within the range of intrinsic spatial variability and therefore cannot be attributed to ponding alone.
Drill cuttings were grabbed from a mud-holding tank every 1.5 m (5 It) as the drill stem advanced. Size analysis indicates that a significant portion of fine-grained sediment is not recovered, as compared with the core samples. However, we cannot rule out the possibility that the deeper sediments are coarser than the surficial deposits. Because fine-grained sediment influences the infiltration rate to a far greater extent than its sheer volume implies, the drill cuttings from unconsolidated sediments do not provide adequate infor- mation for the evaluation of hydraulic conductivity. Split-spoon sampling was also attempted but the samples were too disturbed for hydraulic conductivity measurement.
Well logs
Some geophysical logs were taken before the installation of well casing. Gamma-ray logs, reflecting natural radioactivity, do not reveal any definable

A R T I F I C I A L R E C H A R G E IN S A N J A C 1 N T O B A S I N 243
/", / f ' ,
c3 >__ c3
U;
( 2 ) aJ ~ ~ Z c~ d ~ d
C2_ m ~ F3
U'J - - 1 I
iS 33 q5 60 75 90
OEPTd, m
Fig. 4. SP {mV) and resistivity (~m) logs at monitoring Well 8. SP voltages are relative values. Solid resistivity curve is 16 in short normal and the dashed curve is 64 in long normal. {See text for meaning of zones A-D.)
layering. Figure 4 depicts the resistivity and spontaneous potential (SP) logs at Well 8, which are the longest available logs. Logs at Well 7 show similar and correlatable patterns, but logs at other well sites are too short for meaningful comparison. The SP log does not appear to have a well-defined 'clay line' commonly observed in many water well logs. Above the water table (at 75 m), there are three major SP zones: one high-SP zone from 33 to 59 m (B) astride two low-SP zones (A and C). Resistivity logs show similar gross zoning pattern, i.e. a high-resistivity zone corresponding roughly to the high- SP zone (especially zone B). Neither SP nor resistivity logs clearly indicated crossing of the water table. The major transition in the electric logs occurs 15 m higher, between zones B and C.
The unsaturated sediments are highly resistive, with long-normal resistivity reaching 1300 f2m. The long-normal resistivity may surpass the short-normal resistivity by as much as 600 f2m in the upper two zones. The strong contrast probably reflects differences in lateral drilling-mud penetration combined with the difference in lateral sounding radii of the two resistivity sondes. We have tentatively related high resistivity and high contrast in resistivity to high clay or silt content in the unsaturated sediments. This tentative interpretation can be somewhat corroborated by comparison with the driller's logs, although the depth resolution of the driller's logs is not always reliable, particularly in areas

244 T-C. LEE ET AL.
dominated by monotonous sequences of unconsolidated sand, silt, and clay. Our views is also at odds with common log interpretations for the saturated sediments, e.g. those in the San Jacinto basin and Chino basins in southern California (T-C. Lee, unpublished data). In the saturated sediments, low resistivity and high SP are usually but not always indicative of a clay layer.
The transition between zones B and C is accompanied by a drop of 500 {)m in the long-normal log. The low apparent resistivity (between 100 and 200Om) in zone C suggests that this 16m zone is partially saturated, and perhaps represents a residue of the declining water table during the current drought in southern California. A declining water table will leave behind a zone in which the saturation increases with depth. If this explanation is acceptable, it can account for the observed trend of slightly decreasing resis- tivity with depth. This zone is also inferred to have higher silt and clay contents, which can retard gravity draining of the aquifer and account for the sharp transitional decline of 500 {)m.
Within 4 m below the water table, the apparent resistivity lies between 50 and 1000 Ore, in strong contrast to the range of 400-1300 Om in the top two zones of the unsaturated sediments. High resistivity below the water table indicates the presence of a gravel layer. The associated high SP is a conse- quence of that gravelly layer being more resistive than the drilling fluid.
INFILTRATION RATE AND WATER LEVEL
Figure 5 depicts ponding depth, cumulative flow, and water levels in the observation wells. The base of a graduated post for ponding depth measure- ment was taken as the zero depth. Also presented in Fig. 5 are infiltration rates shown as time derivatives of cumulative flow per unit area. The rates are not adjusted for rising or falling ponding depths because of the difficulty in estimating the rapidly enlarging (or shrinking) water coverage at the beginning (or end) of the percolation. Once the floor is completely flooded, the rise or fall o fponding depth by 2.5 cmday ~ would amount to only about 1% of the average infiltration rate for the entire experiment.
Infiltration rates
During the first period of percolation (46.1 days), the subtotal flow was 1.50 x 10⁶m 3 (1217 acre ft) for an average infiltration rate of 2 .00mday (6.55 ft day ~) over a ponding area of 16 262 m 2 (4.02 acres). The average rate was 1.75 m day t (5.74 ft day-~) during the second period (24.8 days) for a subtotal flow of 0.71 x 10⁶m 3 (572 acre ft). Together, the two periods yield an average rate of 1.91mday ~ (6.28ftday ~), about three times our initial

A R T I F I C I A L R E C H A R G E IN SAN J A C I N T O BASIN 245
00~ 0B 0 c 0h 08 0
--_ .x.
' i " f ' I,li " , ,
- I ,' i / '/ i \ I
o- h, v /'
-!
0 .50 I00 '.50 200 250
CUMULR]IVE FLOR, Tons ~[0 ~ i • ]
I!dF ]L ~BA] [@I( BFtI[], m,'da~,
• - ] Z, 0.0 0 0
PONOING, m
Fig. 5. Time variations of cumulative flow, infiltration rate, ponding depth, and water levels at monitoring
W e l l s 1, 2, 3, 5, a n d 8. T h e d e p t h s w e r e p l o t t e d w i t h r e f e r e n c e to p o n d f loor .
guess-estimate of 2 ft day-' assumed for planning of the recharge experiment. This rate is equivalent to 2.21 x 10 Sms-~, which is close to the lower end of the laboratory-determined hydraulic conductivity values, 5.22 x 10 -5 to 3.46 x 10⁻³ms -~ . Thus the low-conductivity silt or clay appears to play a dominant role in controlling the long-term infiltration rate.
During the first week of rapid increase in ponding depth, infiltration rate dropped rapidly. It reached a temporary minimum during the second week of percolation when the ponding level seemed unchanged. Starting from the third week, the infiltration rate declined gently, and was accompanied by a steady increase of ponding depth, except near the end of the first period of percolation when the ponding depth rose rapidly again. Between day 21 and day 46, the mean infiltration rate was 1.94 m day -~ . During the second per- colation period, the rate declined steadily while the ponding depth increased. The decline after day 80 was accompanied by falling ponding depth, so the actual infiltration rate was slightly higher than that depicted in Fig. 5.

246 T-C. LEE ET AL.
Adjustment for the declining ponding depth could account for only about 1% of the measured infiltration rate. We therefore believe that the decline in infiltration with time is real and that the infiltration rate would have continued to decline if the percolation had been continued. Infiltration rates for periods longer than our experiment will certainly be less than the average rate of 1.91 m day ' for the 91.2 days of experiment (including an intermission of 20.3 days).
Water levels
Water levels in the monitoring wells were measured with a sounder which has a depth resolution of 0.3cm (0.01 ft). Wells 4 and 6 remained dry throughout the 150 day monitoring period. Thus the two well depths provide only an upper bound of the recharge water mound. Because Wells 4 and 5 are at the same distance from the ponding edge, Well 4 bottoms approximately 13 m above the plume. Also, the plume does not extend much beyond Well 5 because the water level was at most 3 m above the bottom of Well 5 and the dry Well 6 bottoms at the same depth as Well 5.
Wells 1 and 2 are respectively 20 m and 17 m from their nearest corners of the percolation pond, and Well 3 is 8 m downstream from the water edge of the pond. Water levels in those three wells rose more than 6 m within the first 3 days of percolation. Their hydraulic responses to percolation are similar in general but there are some noteworthy differences. After the initial rises, water level at Well 2 remained steady but Wells 1 and 3 experienced a slight decline. Then, after 30 days, the water in Well 1 rose slowly until the end of the first percolation period. (Water levels at the three wells appeared to decline before the water supply was turned o f f - a computational artifact owing to lack of measurement shortly before and after shut-off and the linear interpolation between data sampled at large time interval.) Wells 1 and 3 remained wet during the 20.3 day intermission but Well 2 became dry about 1 week into the intermission. An apparent water rise at Well 3 during the intermission was due to a 50 gallon min I leakage from the supply pipe which flowed to the lowest part of the pond near Well 3. We conclude that the rise of water at Well 1 after day 30 and the disappearance of water at Well 2 during the intermission were respectively due to water perching around Well 1 and absence of perching around Well 2.
Twice-daily sampling around the on- and off-times of the second period of percolation clearly indicates that hydraulic responses at the three well sites were fairly sharp. For Wells 1 and 3, the time constants for wetting responses were shorter than for draining. Wetting response at Well 2 was sluggish, compared with that at Wells 1 and 3, probably because the sediments around

ARTIFICIAL RECHARGE IN SAN JACINTO BASIN 247
Well 2 became unsaturated during the intermission. It should be noted that the water in Well 1 continued to rise during the second period, again reflecting the perching effect. Perching also caused the ground northeast of the pond to appear damp during the second half of the second period.
The infiltrating water took 10 days to reach Well 5, about 27m from the ponding edge at a linearly averaged velocity of 3.1 m day- ~. It rose approxim- ately 1 m and stayed there until 4 days after the water supply was shut off. When the percolation resumed, it took 13 days for water to arrive at Well 5. Water disappeared 3 days after the end of the second period percolation.
Well 8 is 79 m from the ponding edge. In this well, which intersects the local water table, the water level began to rise slowly on day 32. It leveled off around day 132; by day 150 (i.e. 60 days after the ending of the second-period ponding) there was no sign of decline in water level. The influence of the intermission is apparently too subtle to see in the water-level curve. Studies of time derivative of the water levels may provide some indication of the inter- mission but we will leave such detailed interpretation to a follow-up numerical modeling study.
HYDROCHEMISTRY
There are four major chemical types of water in the San Jacinto basin (Schlehuber et al., 1989). Upstream from the recharge site, Bautista Creek ground water is dominated by calcium sulfate, whereas the water under the San Jacinto River is characterized by calcium bicarbonate. Natural recharge through the latter is far more voluminous, so after mixing of the two source waters, the ground water is still of calcium bicarbonate type. We determined geochemical changes of the infiltrating water and identified potential natural tracers for inference of mixing and water migration. Because of water swapping and mixing by the water operators, the feeder pipe lines for our recharge experiment may initially contain three source water end-members: State Project water, Colorado River water, and local ground water. They are all chemically distinctive, as represented by the Stiff diagrams in Fig. 6.
Except for the samples collected from the supply pipe lines and two production wells (Well 11 upstream and Well 14 downstream from the recharge site), all samples from monitoring wells were collected with a bailer. The samples were refrigerated in plastic bottles during transit and storage. No chemicals were added to preserve the samples. Analyses for cations were made at the University of California, Riverside (UCR), using the inductively coupled argon plasma (ICAP) technique, whereas anions (C1, HCO3, CO3, and SO4) were analyzed by molecular weight determination (MWD) by titration and colorimetry. A few samples were also analyzed by a commercial

248 T-C. LEE El AL.
5ILVEBNOO0 L. 9-20-88 NELL l l 5J 10/09/90 N e l l =3 5J 10/2[/90
.~ ~ s o s 5 o 5 s o s
L. HfqTHEN5 9-20-8a ~ NELL 14 SO 10/09/90 N e l l =2 SJ 10/2;./90
<, -- \ . /
_ ~ _
[ I I I [ I
~" 5 0 5 5 0 5 5 0 5
SJ TUNNEL 7-19-88 L. PERRfS 9-20-88 ~ N e l l ~-1 5J 10/21/90
5 0 5 5 0 5 5 0 5
5J TUNNEL 9-20-88 "~ L. PEBR[5 7-12-88 ~ INLET, SJ IO/[L~/90
° V# \ N \ /
@ I I I i I I
5 0 S S 0 5 S 0 S
L. HAVRSU 9-13-88 ~ L. ENSTAIC 9EP. aa INLET, SJ 10/09/90
Ca L L H C 0 3
I I I I i
5 0 5 5 0 5 S 0 5
Fig. 6. Stiff diagrams for Colorado River water (Lake Havasu, San Jacinto Tunnel, and Lake Mathews), State Project water (Silverwood Lake, Lake Castaic, and Lake Perris), local San Jacinto ground water (Wells 11 and 14), inlet water, and monitoring well water (Wells 1, 2, and 3). Locations of K, F, and N represent respectively concentrations of potassium fluoride, and nitrate.
laboratory for a consistency check. Because of the high sample throughput of the ICAP technique, we have made more sample analyses for cations than for anions. Leaching experiments using the San Jacinto sediment samples with distilled and State Project waters were performed in the laboratory to confirm trends of in situ water-sediment interaction. Additionally, deuterium/ hydrogen and oxygen stable isotope ratios were determined for a number of samples at UCR, for tracer analyses.
Major ions
Ground water in the San Jacinto basin contains less chloride than both the State Project and the Colorado River waters. Because chloride is generally an unreactive constituent in the waters of alluvial deposits, it could be a good tracer for the deduction of mixing relations. Figure 7 depicts its time variation.

3.5-
Well 1 '
3 ; * ~ ~ li~ Wel l2
2.5 A+ • - ÷ Well 3 ~. m -
cr ~ • 2 Well 5
E x
Well 8 b 1.5 • r.--
0 : Inlet
1
0.5 x x
x >,d x ">< x x >( x x
0 o 4'o do 8'o 160 120 Days (starting Oct. 8, 1990)
Fig. 7. Time variation of chloride concentrations in the inlet and monitoring well waters. (Note that a mixture of different source waters appeared at the start-up of percolation.) Well 8 water is of local source.
Except for early samples when mixing between local ground water and State Project water or Colorado River water occurred in the delivery pipe system, local water and State Project water are clearly distinctive.
Stiff diagrams in Fig. 6 and cross-plots in Figs. 8(a), 9, and 10(a) indicate that the supply inlet water on the first day (8 October 1990) of the experiment was a mixture of Colorado River, State Project, and local ground water. By the second day, inlet waters appeared chemically indistinguishable from State Project waters (see Stiff diagram for 14 October 1990 in Fig. 6) and remained so throughout the remainder of the experiment. By at least day 7 (15 October 1990), water samples from Wells 1, 2, and 3 looked similar to State Project water but were apparently modified by water-sediment interactions. The shape of the Stiff diagrams (see examples from Wells 1, 2, and 3 in Fig. 6) and data clusters on the cross-plots (Fig. 10(b)) suggest that the infiltrating water picks up calcium by ion exchange at the expense of magnesium. Data shown on the cross-plots (Fig. 10) indicate that this ion exchange dominates in all observation wells, except for Well 8 (local ground water) and a group of samples from Well 1 later in the experiment.
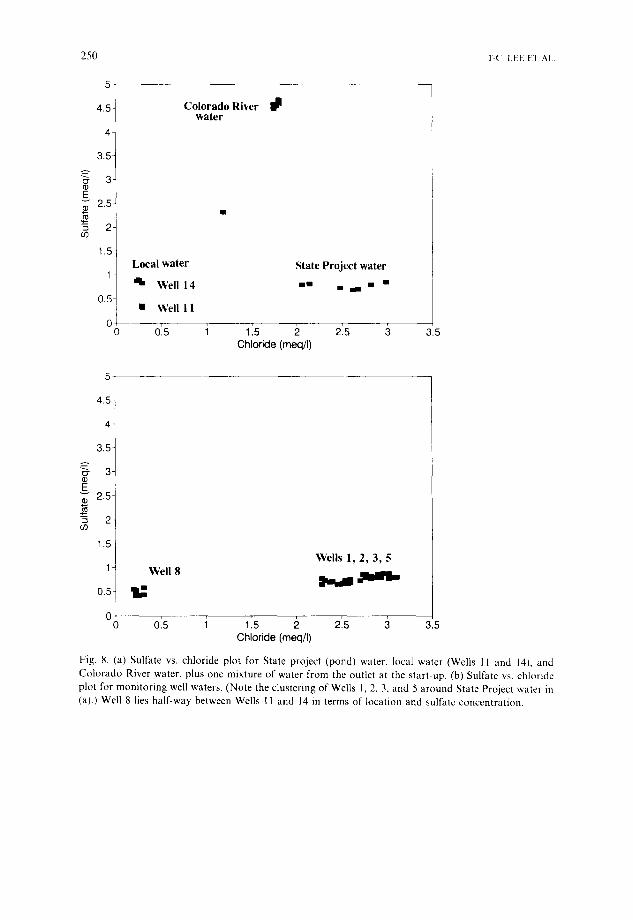
Figure 8(a) depicts a sulfate vs. chloride plot for the inlet water, local ground water, and published values for Colorado River water. The cross-plot clearly reveals these three distinctive end-members of source water and one mixed water (sampled from the inlet on 8 October 1990). Figure 8(b) shows
250 T-C LEE ETAL.
5
4.5- Colorado River i] II water
4-
3.5-
o- 3- E
2.5-
2- co
1.5 Local water State Project water
1 W e l l 14 • • • =,= • • /
0.5 • Well 1 1 1 o-I 0 0'.5 i 115 2 2'.5 3 3.5
Chloride (meq/I)
5
4 . 5 -
4 -
3 . 5 -
o" 3-
E v 2.5-
co
1.5-
Wel ls 1, 2,, 3, 5 1 Well 8
0.5 I ~ ~"~'~ " ~ "
0 0 015 i 1'.5 2 2'.s 3 3.5
Chloride (meq/I)
Fig. 8. (a) Sulfate vs. chloride plot for State project (pond) water, local water (Wells I1 and 14), and Colorado River water, plus one mixture of water from the outlet at the start-up. (b) Sulfate vs. chloride plot for monitoring well waters. (Note the clustering of Wells I, 2, 3, and 5 around State Project water in (a).) Well 8 lies half-way between Wells 11 and 14 in terms of location and sulfate concentration.
ARTIFICIAL RECHARGE IN SAN JACINTO BASIN 25l
0 '027 •
0.018 i 4,~ ~
0.016- "~ '~ ~ "
oo,°' 2 e° h" 0.014-
0,o12 eo- o .o l -
o 0.008
0.006
0.004-
0 0.5 1 115 2 215 3 3.5 Chloride (meq/I)
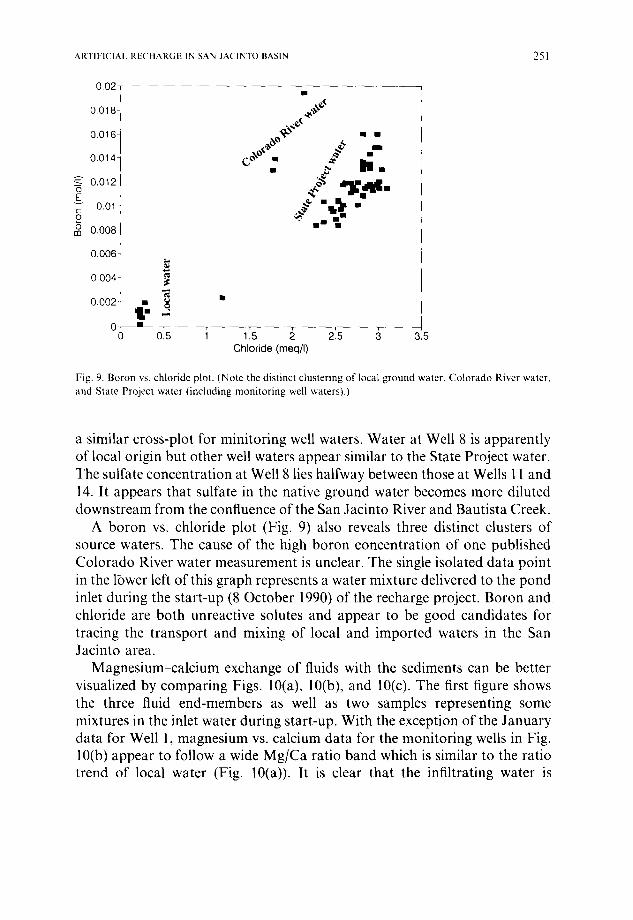
Fig. 9. Boron vs. chloride plot. (Note the distinct clustering of local ground water, Colorado River water, and State Project water (including monitoring well waters).)
a similar cross-plot for minitoring well waters. Water at Well 8 is apparently of local origin but other well waters appear similar to the State Project water. The sulfate concentration at Well 8 lies halfway between those at Wells 11 and 14. It appears that sulfate in the native ground water becomes more diluted downstream from the confluence of the San Jacinto River and Bautista Creek.
A boron vs. chloride plot (Fig. 9) also reveals three distinct clusters of source waters. The cause of the high boron concentration of one published Colorado River water measurement is unclear. The single isolated data point in the l~wer left of this graph represents a water mixture delivered to the pond inlet during the start-up (8 October 1990) of the recharge project. Boron and chloride are both unreactive solutes and appear to be good candidates for tracing the transport and mixing of local and imported waters in the San Jacinto area.
Magnesium-calcium exchange of fluids with the sediments can be better visualized by comparing Figs. 10(a), 10(b), and 10(c). The first figure shows the three fluid end-members as well as two samples representing some mixtures in the inlet water during start-up. With the exception of the January data for Well 1, magnesium vs. calcium data for the monitoring wells in Fig. 10(b) appear to follow a wide Mg/Ca ratio band which is similar to the ratio trend of local water (Fig. 10(a)). It is clear that the infiltrating water is

2 5 2 T-C. LEE ET AL.
2,5
Colorado River water q
2-
1,5- • • v A~ Jm
~ • c 1 t~
] boca~'~ater 0.54 minim
: • ram, mm ~.~\ \ .~a,
%%~eli l I
0 0 015 i 115 2 2L5 :3 3.5
Calcium (meq/I)
2.5-
2
(3" 1.5-
1 , , i • %
~ ,-,\\~ m,, . . -
m m • •
o 0 015 i 1'.s :~ 2'.5 :~ 3.5
Calcium (meq/I)
Fig. 10. (a) Magnesium vs. calcium plot of three end-member waters: local, Colorado River, and State Project waters. Two anomalous data points represent the composition of inlet water as the project start-up occurred. (b) Magnesium vs. chloride plot for waters from monitoring wells. (Note the gain of Ca and loss of Mg relative to the State Project water in (a). Also, note that the Well 1 data of January 1991 are similar to those for State Project water.) (c) Magnesium vs. calcium for waters from a sediment-leaching experiment. The State Project and Colorado River waters are also shown for reference. Cluster 1 used deionized water for leaching; cluster II used early State Project water; cluster III used late State Project water.

ARTIFICIAL RECHARGE IN SAN JACINTO BASIN 253
2.5-
Colorado River water Ill
2
E
m
~ m i l l
0.5 Experiment I i l l Experiment III
• • Experiment II 0
0 015 i 115 'P 215 ;3 &5 Calcium (meq/I)
Fig. 10. Continued.
transforming itself from the State Project water into water chemically similar to local water in terms of Mg/Ca ratio.
The cation exchange between water and sediments is confirmed by a leaching experiment in the laboratory (Fig. 10(c)). Fifteen sediment samples were collected from various sites within and outside the percolation pond and were soaked in three types of water for 1-2 days. The experiment with the deionized water indicates that the sediments can release measurable Ca and Mg into the water in a short contact time, and the experiment with the early and late State Project water samples shows that the State Project water evolves toward local ground water in terms of Mg/Ca ratio. The exchange capacity of the sediments, however, appeared limited because in January 1991, the water from Well 1 began to retain the Mg/Ca signatures of the State Project water (Fig. 10(b)).
H/D isotope chemistry
Deuterium/hydrogen isotope ratios were measured with a mass spectromet- er on aliquots of water samples using the standard zinc reduction technique (Kendall and Coplen, 1985) and were computed as part per thousand (%o) variations relative to Standard Mean Ocean Water (SMOW). A number of these water samples were also analyzed for 180/160 isotope ratios using equilibration with CO2 followed by mass spectrometry. Figure 11 (a) illustrates the time variations of D/H in the inlet water (State Project water) and local

254 T-C. LEE ET A L
-5O
4-
-55 Well 11
0 ~. Well 14 co > -60 + + +
-
=__ -65 £3
I1) 123 • •
-70 •
-75 0 2'0 4'0 e'o 80 160 ~ 20
Days (starting Oct. 8, 1990)
-40
-45
-50
-55~ L o c a l ~ • 0 w a t e r • • co i l l • x / • > -60- • ¢~,.,
• 6~,~; 2 n d
oc: _65 - ~ 0 ~ , ~ ~ P e r i o d
T - 7 0 - • / £3 = -75- 1st
P e r i o d E3 -80-
-85-
-90 -1 -1'1 -1'0 -~) -8 -~7 -6 -5
Delta 18-O (permil VSMOW)
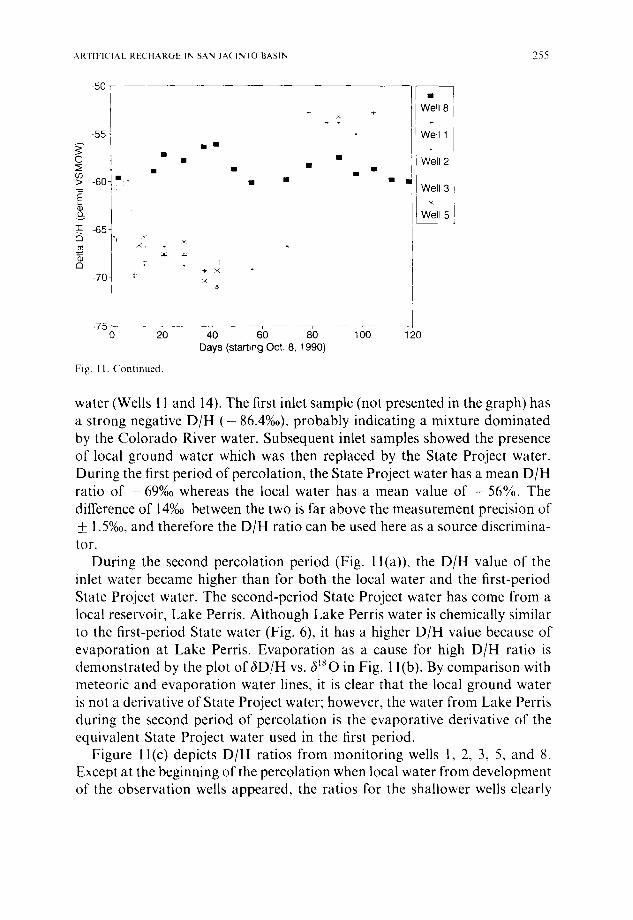
Fig. I I. (a) Time variation of 6D/H isotope ratio. (Note the variation of D/H at the start-up, as a result of mixing waters from different sources, and the shift of D/H to a high value during the second period of percolation, as a result of source-water change.) (b) 5D/H vs. 61~0/t60 (relative to Vienna SMOW). The regression line (diagonal solid line) for the meteoric water line is 6D = 86~sO + 10. (Note the evaporative trend between the two sources of State Project water used during the first and second periods of percola- tion.) (c) Time variations of 6D/H in waters from monitoring wells. (Note that Well 8 water is of local source, and that 6D/H of samples from Wells 1, 2 and 5 shifted upward in the second period of percolation, in response to the D/H shift in outlet water.)
ARTIFICIAL RECHARGE IN SAN JACINTO BASIN '955
-50
55 •
× ÷ Well 8
~ - W e l l 1
~0 • mm • • • W e l l 2
• • • •
U') • • > -60 ' • • •
Well 3
x o3
Well 5
T -65- % .< ×
~<,
(~ 4,- x - 7 0 t
x
-75 - - o 20 4'0 do 1 120
Days (start ing Oct. 8, 1990)
Fig. 1 I. Cont inued .
water (Wells 11 and 14). The first inlet sample (not presented in the graph) has a strong negative D/H ( - 86.4%o), probably indicating a mixture dominated by the Colorado River water. Subsequent inlet samples showed the presence of local ground water which was then replaced by the State Project water. During the first period of percolation, the State Project water has a mean D/H ratio of -69%0 whereas the local water has a mean value of - 5 6 % . The difference of 14%o between the two is far above the measurement precision of __ 1.5%o, and therefore the D/H ratio can be used here as a source discrimina- tor.
During the second percolation period (Fig. l l(a)), the D/H value of the inlet water became higher than for both the local water and the first-period State Project water. The second-period State Project water has come from a local reservoir, Lake Perris. Although Lake Perris water is chemically similar to the first-period State water (Fig. 6), it has a higher D/H value because of evaporation at Lake Perris. Evaporation as a cause for high D/H ratio is demonstrated by the plot o faD/H vs. al*o in Fig. 1 I(b). By comparison with meteoric and evaporation water lines, it is clear that the local ground water is not a derivative of State Project water; however, the water from Lake Perris during the second period of percolation is the evaporative derivative of the equivalent State Project water used in the first period.
Figure l l(c) depicts D/H ratios from monitoring wells 1, 2, 3, 5, and 8. Except at the beginning of the percolation when local water from development of the observation wells appeared, the ratios for the shallower wells clearly

256 T-C. LEE ET AL.
show isotopic signatures similar to those for the State Project water. High D/H at Wells 1, 2, and 5 during the second period reflects high D/H of the source water (Fig. 1 l(a)). Well 8 maintains a D/H consistent value, indicating continued dominance of local waters.
DISCUSSION
Around the site of the recharge experiment, the San Jacinto River deposits consist mainly of fine- to coarse-grained sand. Patches or zones of silt and clay are observed on the ground surface and are identified in the drilling cuttings or inferred from electrical logs. Resistivity logs indicate that the top 60 m of the deposits were fairly dry before the percolation began. The highest resistiv- ity recorded was 1300 ~2m in the clay zone, at depths of around 14 m. Resistiv- ity in the dry sand was presumably higher but the sandy layers above the water table were identified with low-resistivity zones by attributing the reduction of resistivity to intrusion of drilling fluid into the dry, permeable sandy layers. Although relatively less abundant, silty and clayey zones can significantly alter the flow pattern because their hydraulic conductivity could be several orders of magnitude smaller than that of the sandy layers. There are three lines of evidence to support the influence of less permeable layers. First, the 3 month mean infiltration rate of 1.91 m day I is numerically closer to the lower end of the laboratory-determined hydraulic conductivity for near-surface core samples. Second, the appearance of dampened ground on the northeast side of the pond during the second period of percolation reflects the perching effect. Third, Well 1 and possibly Well 3 did not completely drain during the intermission in percolation but Well 2 did, although the three bottomed at similar depths.
The infiltration rates appeared to decline with time. A similar trend has been observed in many operational spreading basins throughout the world. The causes of this decline are many. We have not examined the effect of algae growth, but we note that excessive algae growth could have led to increase of pH and hence deposition of calcium and magnesium. If that happened, filter cake might appear at the pond floor. We did not see such an occurrence. Also, because the percolated water had a higher concentration of calcium than the inlet or pond water, algae-caused deposition of calcium was probably insig- nificant.
We have analyzed the grain-size distribution and measured hydraulic con- ductivity of near-surface samples collected before and after the ponding. The first period of ponding locally flattened the unimodal distribution to a type without a dominant mode (Fig. 3) but the second period of ponding did not appear to cause any significant additional redistribution. Except for one
ARTIFICIAL RECHARGE IN SAN JACINTO BASIN 257
sample collected during the intermission in percolation, the changes in hydraulic conductivities between pre- and post-ponding samples from similar locations were similar to one another and the differences were certainly much less than the intrinsic spatial variability. In short, we cannot draw an unam- biguous conclusion about the silting effect on infiltration. Mg/Ca exchange observed between water and sediment should not change the porosity. Bulk dissolution and/or precipitation of minerals (carbonates and sulfates) appears minor and is presumed not to affect hydraulic properties significantly. As there is no detectable Ca/Na exchange, ion exchange involving clay minerals is also not a likely cause of declining infiltration rate.
Because of low moisture content in the sediments before percolation, a significant portion of the percolating water has occupied the pore space to account for the initial high rate of infiltration. Lateral spread is another cause of high infiltration rate. As the percolation continues, the saturated hydraulic conductivity will become the limiting factor. As layers of low permeability are not likely to be of large areal extent in the fluvial deposits, the terminal or steady infiltration rate should probably be greater than the equivalent of the lowest measured hydraulic conductivity (0.45malay L) but less than 1.91 m day ~, the average over the 3 month experiment. However, because the intended operational period for recharge is 3 months year ~, an infiltration of i.9 m day-t is an acceptable figure for the planning of conjunctive use.
The presence of water in the monitoring wells which bottomed initially in the vadose zone indicates that the saturated volume of sediments beneath the pond expands both downward and laterally. A cross-sectional view of the saturated and unsaturated partition would be very different from the view depicted in the laboratory simulation by Vauclin et al. (1979) and the numerical simulation by Gureghian (1983). Both simulations produced a water mound rising slowly above the pre-existing water table. Although we do not have measurements directly below the pond, the rapid appearance of a saturated zone in the shallow monitoring wells suggests that a perched water body descends toward a rising mound. The existence of a water table mound is inferred from the slowly rising water level at Well 8. Assuming a moisture- independent hydraulic conductivity, Morel-Seytoux et al. (1990) considered a rising water table mound below a circular spreading basin. Because our case involves a saturated volume which grows away from the pond, the recharge model of Morel-Seytoux et al. is not suitable for predicting the gross pattern of saturated and unsaturated flow. A more sophisticated numerical modeling (see, Yeh, 1987), incorporating moisture-dependent hydraulic conductivity and inhomogeneity, seems appropriate here but 3D modeling requires more spatial data to justify the effort.
We have demonstrated that D/H ratio variations, C1 concentration, and

258 T-('. LEE ET AL.
cross-plots of Ca vs. Mg, SO4 vs. C1, and B vs. CI can be used to discriminate potential source waters: the local ground water, the imported Colorado River water, and the State Project water imported from northern California. As the State Project water percolates through the sediments, it gains calcium by exchange at the expense of losing magnesium. Other constituents are not as clearly affected by the water-sediment interaction.
For the entire 150 days of monitoring, the water sampled from Well 8 is dominated by the local ground water, both chemically and isotopically, despite a water level rise of 8 m. Several explanations can be suggested for the absence of the State Project water at Well 8: (1) it sank below the local ground water table; (2) after mixing with the local water, it was too diluted to be identified; (3) the rise of water at Well 8 was a hydraulic response to water mounding rather than signifying the arrival of the recharging State Project water: (4) the worst case is that it had arrived but failed to enter the well bore because of poor perforation, or improper well completion and development.
CONCLUSION
The San Jacinto River deposits can sustain an average infiltration rate of 1.9mday ~ in an isolated pond of 128m by 128m for as long as 3 months. The effective rate would decline for longer ponding or for more ponds without sufficient separation between them to prevent overlapping of water mounds. Ponding at less than 1 m depth is probably insufficient to cause significant silting and reduction of infiltration rate. Silt and algae scraping is unnecessary because the pond floor will probably be renewed each year by natural floods. The floods could also restore to some extent the ion exchange capacity of the sediments which exchange Ca with the imported water for Mg. This Ca-Mg ion exchange appears to be the only significant water-sediment reaction that occurs during percolation of imported waters into the San Jacinto sediments. Such ion-for-ion exchange should not cause degradation of water quality during recharge and is not likely to influence hydraulic conductivity adversely. Some diagnostic, nonreactive ions and stable isotope ratios (D/H and ~80/t60) can be used to index water mixing and trace the imported water during the operational phase of conjunctive use.
ACKNOWLEDGM ENTS
This study is funded by the Eastern Municipal Water District and the Metropolitan Water District of South California. The authors appreciate the support of P. Ravishanker, William E. Plummer, Richard Morton, Christie Crother (EMWD), and Andrew Sienkiewich (MWD).

ARTIFICIAL RECHARGE IN SAN JACINTO BASIN 259
REFERENCES
Bean, R.T., 1955. Geology of San Jacinto and Elsinore units. Calif. Dep. Water Resour. Bull., 15, 88 pp.
Bouer, H., 1989. Estimating and enhancing groundwater recharge. In: M.L. Sharma (Editor), Groundwater Recharge, A.A. Balkema, Rotterdam, pp. I 10.
Fett, J.D., 1968. Geophysical investigation of the San Jacinto Valley, Riverside County, California. M.S. Thesis, University of California, Riverside, 87 pp.
Fetter, C.W., 1988. Applied Hydrogeology, MacMillan, New York, 592 pp. Gureghian, A.B., 1983. TRIPM: a two-dimensional finite-element model for the simultaneous
transport of water and reacting solutes through saturated and unsaturated porous media. Office of Nuclear Waste Isolation, Battelle Memorial Institute, Columbus, OH ONWI-465, 150 pp.
Kendall, C. and Coplen, T.B., 1985. Multisample conversion of water to hydrogen by zinc for stable isotope determination. Anal. Chem. 57: 1437-1440.
Kendall, D.R. and Sienkiewich, A., 1988. Conjunctive use opportunities in southern California. In: A.I. Johnson and D.J. Finlayson (Editors), Artificial Recharge of Ground Water, Am. Soc. Civil Engineers, New York, pp. 385-395.
Lee, T-C. and Biehler, S., 1991. Inversion modeling of gravity with prismatic mass bodies. Geophysics, 56: 1365-1376.
Madrid, C., 1988. Artificial ground water recharge in Southern California. In: A.I. Johnson and D.J. Finlayson (Editors), Artificial Recharge of Ground Water, Am. Soc. Civil Engineers, New York, pp. 378-384.
Morel-Seytoux, H.J., Miracapillo, C. and Abdulrazzak, M.J., 1990. A reductionist physical approach to unsaturated aquifer recharge from a circular spreading basin. Water Resour. Res., 26: 771-778.
Morton, D.M. and Matti, J.C., 1992. Tensional and compressional features produced within an evolving convergent strike-slip fault system: the San Andreas and San Jacinto fault zones at their convergence in southern California. Geol. Soc. Am. Mem. 138, in press.
Schlehuber, M.J., Lee, T-C. and Hall, B.S., 1989. Groundwater level and hydrochemistry in the San Jacinto Basin, Riverside County, California. J. Hydrol., 106: 79-89.
Vauclin, M., Khanji, D. and Vachaud, G., 1979. Experimental and numerical study of a transient, two-dimensional unsaturated-saturated water table recharge problem. Water Resour. Res., 15: 1089-1101.
Waring, G.A., 1919. Ground water in the San Jacinto and Temecula Basins, California. U.S. Geol. Surv. Water Supply Pap., 429:113 pp.
Yeh, G.T., 1987. 3DFEMWATER: a three-dimensional finite element model of water flow through saturated-unsaturated media. Oak Ridge National Laboratory, ORNL-6386, 313 pp.