an assessment of global and regional emissions of trace metals … · 2011-11-29 · 269 an...
TRANSCRIPT
269
An assessment of global andregional emissions of trace metals tothe atmosphere from anthropogenicsources worldwide
Jozef M. Pacyna and Elisabeth G. Pacyna
Abstract: An accurate and complete emission inventory for atmospheric trace metals on aglobal scale is needed for both modeler community and policy makers to assess the currentlevel of environmental contamination by these pollutants, major emission sources and sourceregions, and the contribution of the atmospheric pathway to the contamination of terrestrialand aquatic environments. Major progress has been made in assessing emissions of tracemetals in various countries and even regions, e.g., Europe, since the first global emissionestimate for these pollutants was made by Nriagu and Pacyna (1988). These improvednational and regional emission inventories have been used in this work to assess the globaltrace metal emissions from anthropogenic sources in the mid-1990s. The results of this workconclude that stationary fossil fuel combustion continues to be the major source of Cr, Hg,Mn, Sb, Se, Sn, and Tl with respect to the coal combustion and the major source of Ni andV with respect to oil combustion. Combustion of leaded, low-leaded, and unleaded gasolinecontinues to be the major source of atmospheric Pb emissions. The third major source oftrace metals is non-ferrous metal production, which is the largest source of atmospheric As,Cd, Cu, In, and Zn. The largest anthropogenic emissions of atmospheric trace metals wereestimated in Asia. This can be explained by growing demands for energy in the region andincreasing industrial production. As a result, the Asian emissions are not only larger than theemissions on other continents, but also show an increasing trend. Another factor contributingto high emissions in Asia is the efficiency of emission control, which is lower than in Europeand North America. Concerning the two latter continents, emissions of trace metals show adecreasing tendency over the last two decades.
Key words:anthropogenic sources, atmospheric emissions, trace metals, global emissioninventory.
Résumé: Pour les constructeurs de modèles de communaut és aussi bien que pour ceuxqui élaborent des politiques, il serait nécessaire de pouvoir disposer d’un inventaire completet pr écis des métaux traces atmosphériques, afin de pouvoir évaluer, le degré actuel decontamination environnementale par ces polluants, les principales sources d’émissionet les régions sources, ainsi que la contribution via l’atmosphère à la contamination del’environnement terrestre et aquatique. Il y a eu un progrès majeur dans l’évaluation desémissions de métaux traces dans divers pays et même régions, p. ex. en Europe, depuis lapremière évaluation globale de ces polluants effectuée par Nriagu et Pacyna en 1988. Ces
Received 1 September 2001. Accepted 17 October 2001. Published on the NRC Research Press Web site on18 January 2002.
J.M. Pacyna1 and E.G. Pacyna.Norwegian Institute for Air Research (NILU), Kjeller, Norway.
1 Corresponding author (e-mail: [email protected]).
Environ. Rev.9: 269–298 (2001) DOI: 10.1139/er-9-4-269 © 2001 NRC Canada

270 Environ. Rev. Vol. 9, 2001
inventaires nationaux et régionaux améliorés ont été utilisés dans ce travail afin d’évaluerles émissions globales anthropogènes de métaux traces, au milieu des années 1990. On peuten conclure que la combustion stationnaire de carburants fossiles continue d’être la sourceprincipale des Cr, Hg, Mn, Sb, Se, Sn et Ti reliée à la combustion du charbon et la principalesource des Ni et V reliée à la combustion du pétrole. La combustion de gazoline sans plomb,faible en plomb et avec plomb est toujours la principale source d’émissions atmosphériquesde plomb. La troisième source majeure de métaux traces est liée à la production des métauxnon-ferreux, qui constitue la source la plus importante des As, Cd, Cu, In et Zn. Lesémissions anthropogènes de métaux traces les plus importantes se retrouvent en Asie. Cecipeut s’expliquer par des demandes croissantes d’énergie dans la région et une productionindustrielle accrue. Il en résulte que les émissions asiatiques ne sont pas seulement plusimportantes que les émissions sur les autres continents, mais qu’elles tendent également às’accroître. Un autre facteur contribue aux fortes émissions en Asie ; il s’agit de l’efficacit éplus faible de la maîtrise des émissions qu’en Europe et en Amérique du Nord. Pour ce quiest de ces deux derniers continents, les émissions de métaux traces montrent une tendance àdécroître au cours des deux dernières décades.
Mots clés :sources anthropogènes, émissions atmosphériques, métaux traces, inventaire globaldes émissions.
[Traduit par la Rédaction]
Table of contents
Introduction 270Objectives 271Two decades of emmission inventorying for trace metals 272Assessment of global regional emission estimates for the year 1995 274
Assessment of anthropogenic trace metal emission data supplied by national experts 274Emission estimates for countries with no national data available 275Assessment of the 1995 global emissions from individual source categories 275
Emissions from the production of electricity and heat in the 1995 275Lead emissions from vehicular traffic 278Emissions from non-ferrous metal production 279Emissions from iron and steel industry and cement production 283Emissions from waste disposal 285Total worldwide emissions from anthropogenic sources 287
Quality of emission estimates 288Comparison of contributions of emissions from natural and anthropogenic sources to the total globalemission of trace metals 292Final remarks 293Acknowledgements 294References 294Appendix A: a list of reports with national emission data for trace metals 296
1. Introduction
Trace metals may create adverse effects on the environment and human health depending upon theirbioavailability and toxicity in various environmental compartments. During the last three decades anumber of studies have been carried out to assess the fate and behavior of these metals in the environment,as well as their environmental effects. The results of these studies have been reviewed during thepreparation of the substantiation documents for the United Nation (UN) Economic Commission forEurope (ECE) protocol on emission reductions of trace metals (e.g., UN ECE 1994). These results canbe summarized as follows.
©2001 NRC Canada
Pacyna and Pacyna 271
Many trace metals are ubiquitous in various raw materials, such as fossil fuels and metal ores, as wellas in industrial products. Some trace metals evaporate entirely or partially from raw materials duringthe high-temperature production of industrial goods, combustion of fuels, and incineration of municipaland industrial wastes, entering the ambient air with exhaust gases. Releases to other environmentalcompartments (e.g., spills to water bodies, landfills, sewage lagoons, and holding ponds) may alsoresult in volatilization and entrainment of several trace metals. After being emitted to the atmosphere,trace metals are subject to transport within air masses and migration through the ecosystem, whichcause perturbations of their geochemical cycles not only on a local scale but also on regional and evenglobal scale.
Concentrations of many metals measured at remote locations worldwide are often higher than theconcentrations expected from their natural occurrence in the terrestrial and aquatic environment (Nriaguand Davidson 1986). Emissions of trace metals during various human activities, mostly on fine particles,are assumed to be the major cause of this concentration increase. The increase in concentration of agiven metal in an air sample, measured in certain reference material such as crustal rocks or soils, inrelation to a certain reference metal such as Al, Ti, or Sc can be defined as an enrichment factor (EF) ofthis metal. Most metals can be locally enriched. Some of them also show enrichment on regional andglobal scales. Episodic long-range transport of pollutants within air masses result in the enrichment ofmetal concentrations far from source regions, e.g., in the Arctic.
Deposition of trace metals in areas surrounding emission sources, as well as “en route” depositionduring transport, has reached levels that in certain regions have exceeded the maximum permissiblevalues on soils and fresh water ecosystems.After entering the terrestrial and aquatic environments in theemission regions, as well as far away from them, trace metals can accumulate in soils. Uptake of tracemetals by terrestrial and aquatic organisms and their metabolism may also lead to bioaccumulation ofcertain trace metals in the environment, including Cd, Se, and Hg (AMAP 1999).
In general, the metal threat to the environment has been evaluated in terms of ecology, health,economics, and quality of life. It is beyond the scope of this paper to analyze these evaluation factorsin detail. However, a very brief summary can be offered.
Effects of trace metal exposure have been recorded in forest waters in the vicinity of strong pointsources, as well as at remote locations, due to long-range transport of these pollutants within air masses.The threats to the terrestrial environment, lake and sediments, fresh water and marine ecosystem, marinebirds and mammals, and human health in the Arctic have been assessed during the first phase of theArctic Monitoring and Assessment Programme (AMAP 1997). Major concern focused upon Hg andCd, while Pb was considered to pose less threat. The Hg and Cd levels were considered high enoughto raise public health concerns in the region (AMAP 1997). Studies carried out in the vicinity of largesources of trace metal emissions, e.g., in the Upper Silesia in Poland, concluded that high levels of Cdand Pb in the environment cause an increase of spontaneous abortion in women during the first 3 monthsof pregnancy (Krasnodebski 1998).2
Several studies pointed out the synergistic effect of various metals and acid deposition compounds(UN ECE 1994). Soil acidification may significantly enhance concentrations of various metals, includingCd and Zn, in soil solution leading to the increased availability of these pollutants to terrestrial and aquaticecosystems (Pacyna 1998; AMAP 1999).
2. Objectives
Accurate and complete information on sources and releases is of vital importance for modeling theatmospheric and riverine transport of contaminants at all distances (on local, regional, and global scale)
2 Krasnodebski, J. 1998. The impact of heavy metal contamination of the environment on the health of mothers and fetusesduring the first threemester of pregnancy, personal communication on unpublished data from Upper Silesia in Poland.
©2001 NRC Canada

272 Environ. Rev. Vol. 9, 2001
and for assessing the impact of these contaminants on the environment and human health. The overallgoal of this paper is to revise the information on global emissions of trace metals from anthropogenicsources, presented for the 1983 reference year by Nriagu and Pacyna (1988), and to propose a globalemission inventory for the present time (the mid-1990s).
The need for such a paper is substantiated by the following:
• accurate and complete as possible global and regional emission inventories for atmospheric tracemetals are urgently needed in view of the implementation of the recent international emission re-duction agreements for trace metals, particularly the UN ECE protocol on reduction of trace metalemissions and the AMAP agreement on reduction of the contamination of the Arctic environment
• since the first assessment of anthropogenic emissions by Nriagu and Pacyna (1988), major im-provement of emission control has recently been made in various industries and the consumptionof low-leaded and unleaded gasoline in many countries has increased
• an increase in demand for electricity and heat based on combustion of fossil fuels, particularlycoal, has been also observed in many countries during the last 15 years, particularly in Asia
• several measurements have been carried out during the last few years to assess the re-emissionrate of trace metals, particularly Hg, from terrestrial and aquatic ecosystem surfaces resulting inbetter and more accurate input data for the assessment of emissions of these pollutants
The 1983 emission data and presentation of the emission data for the 1990s have been revisedusing (1) the information on emissions received from national experts in a number of the Europeancountries and the United States, and (2) the estimates of emissions for the rest of the countries, carriedout within the reported project by the authors of the report. Such method of work required a numberof assumptions to be made and resulted in a degree of uncertainty of the presented emission estimates.These assumptions and uncertainty are discussed later in this paper.
Ideally, the assessment of trace metal emissions should be made on the basis of emission measure-ments, at least for major point sources of emissions, such as large power plants, smelters, and wasteincinerators. Unfortunately, these measurements are carried out sporadically and are limited mostly tothe measurements in non-ferrous metal smelters and large electric power plants. The results of thesemeasurements cannot be easily extended to cover the whole source category or transferred from onecountry to another. The vast majority of emissions data summarized and presented in this paper areestimates generated either by national experts or the authors of this report.
3. Two decades of emission inventorying for trace metals
During the last two decades there has been great progress in defining major anthropogenic sourcesof Cd, Pb, Hg, and other trace metals in Europe and in other parts of the world (Pacyna et al. 1995;Olendrzynski et al. 1996; Pirrrone et al. 1996; Pacyna and Pacyna 1999). It was concluded that high-temperature processes, such as coal and oil combustion in electric power stations and heat and industrialplants, gasoline combustion, roasting and smelting of ores in non-ferrous metal smelters, melting op-erations in ferrous foundries, refuse incineration, and kiln operations in cement plants emit varioustrace metals, which enter the atmosphere and the aquatic and terrestrial ecosystems. Practically everyindustry discharges one trace metal or another into these ecosystems.
The first quantitative worldwide estimate of the annual industrial input of 16 trace metals intothe air, soil, and water at the beginning of the 1980s was published by Nriagu and Pacyna (1988).Pyrometallurgical processes in the primary non-ferrous metal industries were found to be the majorsource of atmospheric As, Cd, Cu, In, Sb, and Zn, and an important source of Pb and Se. Combustion ofcoal in electric power plants and industrial, commercial, and residential burners was the major sourceof anthropogenic Hg, Mo, and Se and a significant source of As, Cr, Mn, Sb, and Tl. Combustion of
©2001 NRC Canada

Pacyna and Pacyna 273
oil for the same purpose was the most important source of V and Ni. Combustion of leaded gasolinewas estimated to be the major source of Pb. Atmospheric Cr and Mn were derived primarily from theiron and steel industry. The only updates of the above-mentioned global emission inventory have beenprepared for Pb (Pacyna et al. 1995) and Hg (Pacyna and Pacyna 1996), with emission data calculatedfor the conditions at the beginning of the 1990s.
There were several attempts to assess atmospheric emissions of trace metals from anthropogenicsources on a regional (continental) scale during the past two decades. One of the first attempts to es-timate atmospheric emissions of trace metals from anthropogenic sources in Europe was completed atthe beginning of the 1980s (Pacyna 1984). This work presented information on emissions of as manyas 16 trace metals, similar to those reviewed on a global scale by Nriagu and Pacyna (1988). Europeaninventories prepared before the work by Pacyna (1984), mostly within the European Commission pro-grams, have dealt with either a single metal (e.g., Cd or Pb) or a given source category (e.g., combustionof fossil fuels).
The above-mentioned European-wide emission survey was later updated, completed, gridded (Ax-enfeld et al. 1992), and applied in long-range transport models to study deposition of trace metals inEurope and at remote locations, such as the Arctic (a review by Pacyna (1994)).
In 1989 the UN ECE established a Task Force on Heavy Metals. One of the major objectives ofthe Task Force was to collect information on emissions. National response to the request for creating adatabase for emissions of trace metals in the UN ECE region was unsatisfactory at the beginning of the1990s. At the same time, an update of emission data for Pb, Cu, and Cd for 1989–1990 has been madein connection with the Dutch project on a European Soil and Sea Quality and Atmospheric Depositionof Selected Substances (ESQUAD) (Berdowski et al. 1994).
Recently, several European countries have prepared national emission inventories for trace metalsemitted from anthropogenic sources and have started to report them to the UN ECE European Monitoringand Evaluation Programme (EMEP) (UN ECE 1999a) in connection with the UN ECE Protocol onHeavy Metals, signed in June 1998. The objective of this protocol is to control emissions of trace metalscaused by anthropogenic activities that are subject to long-range transboundary atmospheric transportand are likely to have significant adverse effects on human health or the environment (UN ECE 1998).
The Oslo and Paris Commissions (OSPARCom) program, concerning the transport of pollutants tothe North Sea, has also collected information on atmospheric emissions of trace metals from anthro-pogenic sources in Europe since the beginning of the 1980s. In 1992 the Convention for the MarineEnvironment of the North-east Atlantic replaced the Paris Commission formed in 1974. In 1997 aninventory of the European emissions was prepared within the Convention for the reference year 1990on the basis of the work within the ESQUAD project (Berdowski et al. 1997).
A set of estimates of current, past, and future emissions of As, Cd, Pb, and Zn in Europe has beenprepared for the International Institute forApplied SystemsAnalysis (IIASA) with current data regardedas those at the beginning of the 1990s (Pacyna 1996). This work has been updated for Pb emissions in1995 for the German GKSS Research Centre (Pacyna and Pacyna 1999).
First estimates of atmospheric emissions of As, Cd, Cu, Cr, Mn, Ni, Pb, Sb, Se, V, and Zn from an-thropogenic sources in 12 major source regions in the former Soviet Union were prepared by Pacyna onthe basis of emission factors and statistical data for the reference year 1979–1980 (NILU 1984). Emis-sions from non-ferrous and ferrous metal production, fossil fuel combustion, and gasoline combustionwere estimated to dominate the total emissions in these regions. Only recently has this old emissioninventory been updated and improved by studies carried out by Tsibulski et al. (1996), Gromov (1996)and Boyd et al. (1998).
Emission data for trace metals (except for Pb) from anthropogenic sources in the United States aremuch less comprehensive than those for the criteria air pollutants, such as sulfur dioxide, nitrogen oxides,carbon monoxide, volatile organic compounds (excluding certain nonreactive organic compounds),particulate matter less than 10µm, lead, and total suspended particulate matter. There are two different
©2001 NRC Canada

274 Environ. Rev. Vol. 9, 2001
programs in the United States collecting information on emissions of toxics: Toxic Release Inventory(TRI) estimates (currently for over 300 chemicals in 20 chemical categories) submitted annually since1987 to EPA by certain manufacturing facilities and national inventories for specific pollutants preparedby EPA to support special studies called for by the 1990 Clean Air Act Amendment (CAAA).
The EPA inventories are more comprehensive than the TRI in that they attempt to identify and quan-tify all source categories and air emissions of toxics, whether from manufacturing facilities, commercialfacilities, mobile sources, or residential and consumer sources. These inventories also include emissionsfrom facilities with fewer than 10 employees and emissions from sources with very low concentrationsof toxics, which are exempted from the TRI reporting requirements.
Mercury and cadmium are the two trace metals for which national emissions have been prepared inthe United States, in addition to Pb, which is a criteria pollutant. Mercury is one of the seven pollutantsspecified in the section of the CleanAirAct (CAA) that requires the EPA to identify source categories andsub-categories of Hazardous Air Pollutants (HAPs) in urban areas that pose a threat to human health.Emission estimates for both Hg and Cd were prepared within the Locating and Estimating (L&E)document series (US EPA 1993a, 1993b for Hg and Cd, respectively). The L&E documents providea compilation of available information on the sources and emissions of specific toxic air pollutants,including the information on emission factors. There are also more recent studies on specific tracemetals, particularly Hg (Porcella et al. 1996).
Canadian emission data for trace metals have been published by Environment Canada starting withdata for 1982 (Jacques 1987). Almost no data exist on emissions of trace metals from anthropogenicsources in Mexico. Porcella et al. (1996) have extrapolated values from the U.S. emission survey toassess the Mexican emissions of Hg.
A few emission inventory programs have been carried out in Asia. Lead has been the most studiedmetal. Major revision of results from these programs has been made during the International Symposiumon Emission Inventory and Prevention Technology for Atmospheric Environment, held in Japan (ITIT1992). The emission estimates for Japan, Thailand, China, and India in the mid-1980s were presented.It is not clear whether any updates and modifications of these emission inventories have been maderecently.
Emission inventories for lead have been also carried out in some African and South Americancountries (a review by Pacyna et al. 1995; Nriagu et al. 1996). Releases of Hg during gold and silvermining were reviewed by Lacerda (1997).
Information presented in the above-mentioned inventories has been used in this work to update the1983 global emission estimates and to estimate and discuss global emissions of trace metals in themid-1990s presented in section 4 of the report.
4. Assessment of global regional emission estimates for the year 1995
Two approaches were undertaken for presentation of global anthropogenic emissions of trace metalsin the reference year 1995: (1) collection of emission data from countries where such data were estimatedby national emission experts and (2) estimates of emissions on the basis of emission factors and statisticaldata on the production of industrial goods and (or) the consumption of raw materials. These estimateswere carried out by the authors of this report for the countries with no national estimates.
4.1. Assessment of anthropogenic trace metal emission data supplied by national expertsIt is often perceived in international emission inventories that data estimated or measured by local–
national emission experts are more complete and accurate for a given region than the estimates byinternational emission experts. Local emission experts would be aware in more degree of details aboutraw materials used in their regions, the application of certain type of industrial–combustion technologies,and emission control equipment. Therefore, it is very important for experts assessing global emissionsto obtain as much available information from local–national experts.
©2001 NRC Canada

Pacyna and Pacyna 275
The following data were received from national emissions experts from 20 countries. Details onthese data are available from reports presented in Appendix A.
The emission data received from national authorities have then been checked for completeness andcomparability. The completeness of data regarded mainly the inclusion of all major source categoriesthat may emit trace metals to the atmosphere. No major omissions have been detected. All major sourcecategories in all countries reporting the emission data were included in this reporting.
It is very difficult to verify the data obtained from national authorities in various countries in Europe.The following approach has been taken. Information on emissions of trace metals from various sourceswas brought together with statistics on the production of industrial goods and (or) the consumptionof raw materials, and these two sets of data were used to calculate emission factors. Emission factorscalculated in this way were then compared with emission factors reported in the Joint EMEP/ CORINAIRAtmospheric Emission Inventory Guidebook (UN ECE 1999b). For the majority of cases, emissionfactors estimated on the basis of national emission data reported to the project were within the rangeof emission factors proposed in the Guidebook. This check was proof that the estimates from variouscountries are comparable and thus can be accepted for the reported project.
All data received from above-mentioned 20 countries were accepted in this work as representativefor national emission inventories for these countries.
4.2. Emission estimates for countries with no national data available
Emission estimates have been performed in this work for the countries where no national emissiondata were available.These estimates have been based on the statistical information on the consumption ofraw material and the production of industrial goods, available from international and national statisticalyearbooks and the emission factor data. The emission factors used in the estimates are discussed belowtogether with the emission estimate results for each source category, separately.
4.3. Assessment of the 1995 global emissions from individual source categories
4.3.1. Emissions from the production of electricity and heat in 1995
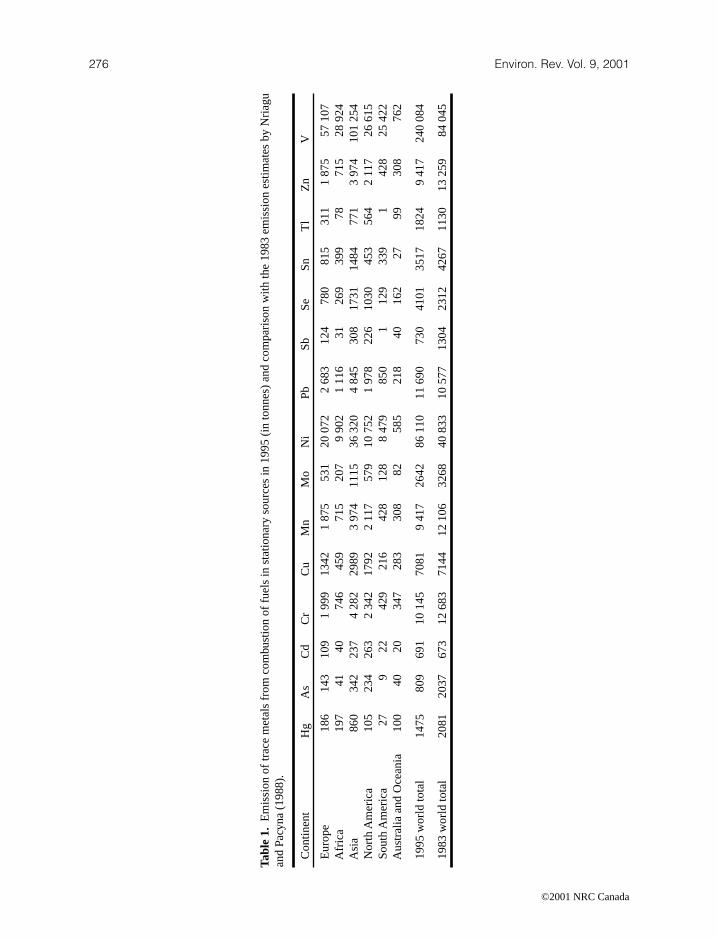
The emission estimates for various trace metals emitted during the production of electricity andheat in 1995 are presented in Table 1. These emission data consist of information received from variousnational authorities in Europe (as mentioned above) and the United States and Canada with regard toemissions of Hg and Pb. For the remaining countries, emission estimates were carried out on the basisof information on the energy production from the StatisticalYearbook (UN 1997) and emission factors.Average values of the 1995 emission factors used to estimate trace metal emissions from stationaryfossil fuel combustion in countries with no national emission estimates available for the authors arepresented in Table 2. These factors are in the lowest part of the range of emission factors suggestedby Nriagu and Pacyna (1988) for the 1983 emission estimates. The 1995 emission factors used in thereported work are within the range of emission factors suggested by the UN Economic Commissionfor Europe (ECE) Emission Inventory Task Force for use in the emission estimates within the UN ECEcountries. The UN ECE emission factors are available in the Joint EMEP/ CORINAIR AtmosphericEmission Inventory Guidebook (UN ECE 1999b). The emission factors in Table 2 are proposed in theGuidebook for use in the cases of power plants with standard emission control equipment.
The largest emissions of trace metals from stationary fossil fuel combustion have been estimatedfor Asia, accounting for 40 to 60% of the total emissions depending on the metal of concern. The onlyexception is the emission of Cd. The data provided by the US EPA indicate that the combustion of fuelsin the United States alone contributed as much as 241.6 t to the total global emissions in 1990 (US EPA1993b). It was assumed that similar emissions can be assigned as valid for the mid-1990s for the UnitedStates because of the similar amounts of coal and oil combustion in various years at the beginning of the1990s. No major improvement of emission control technology in the US power plants was also assumed
©2001 NRC Canada
276 Environ. Rev. Vol. 9, 2001
Tabl
e1.
Em
issi
onof
trac
em
etal
sfr
omco
mbu
stio
nof
fuel
sin
stat
iona
ryso
urce
sin
1995
(into
nnes
)an
dco
mpa
rison
with
the
1983
emis
sion
estim
ates
byN
riagu
and
Pac
yna
(198
8).
Con
tinen
tH
gA
sC
dC
rC
uM
nM
oN
iP
bS
bS
eS
nT
lZ
nV
Eur
ope
186
143
109
199
913
421
875
531
2007
22
683
124
780
815
311
187
557
107
Afr
ica
197
4140
746
459
715
207
990
21
116
3126
939
978
715
2892
4A
sia
860
342
237
428
229
893
974
1115
3632
04
845
308
1731
1484
771
397
410
125
4N
orth
Am
eric
a10
523
426
32
342
1792
211
757
910
752
197
822
610
3045
356
42
117
2661
5S
outh
Am
eric
a27
922
429
216
428
128
847
985
01
129
339
142
825
422
Aus
tral
iaan
dO
cean
ia10
040
2034
728
330
882
585
218
4016
227
9930
876
2
1995
wor
ldto
tal
1475
809
691
1014
570
819
417
2642
8611
011
690
730
4101
3517
1824
941
724
008
4
1983
wor
ldto
tal
2081
2037
673
1268
371
4412
106
3268
4083
310
577
1304
2312
4267
1130
1325
984
045
©2001 NRC Canada

Pacyna and Pacyna 277
Table 2. Average emission factors for trace metals used to estimate emissions fromthe stationary fossil fuel combustion, the cement production, and the pig iron and steelproduction.
Fossil fuel combustion
Trace metalCoal(g/t coal)
Oil(g/t oil)
Cement production(g/t cement)
Pig iron and steelproduction (g/t steel)
As 0.2 0.02 0.2 0.5Cd 0.1 0.05 0.01 0.1Cr 1.7 1.0 1.0 4.0Cu 1.4 0.5 — 0.2Hg 0.5 0.06 0.1 0.04Mn 1.5 1.0 — 1.5Mo 0.4 0.3 — —Ni 2.0 20.0 0.1 0.05Pb 1.0 2.0 0.2 1.5Sb 0.2 — — 0.01Se 0.8 0.3 0.002 0.01Sn 0.1 0.8 — —Tl 0.5 — — —V 1.0 60.0 — 0.1Zn 1.5 1.0 2.0 3.0
Table 3. The 10 largest emitter countriesfor Hg from stationary fossil fuel combus-tion in 1995 (emissions in tonnes).
No. Country Emission
1 China 4952 India 1173 Australia 974 Zaire 905 United States 776 South Africa 767 Russia 548 Japan 459 Korea (Rep. Dem.) 44
10 Kazakhstan 36
between 1990 and 1995. It should be noted that the emission of Cd in the United States reported by theUS EPA is unusually high, almost 2.5 times higher than in China, the second largest emitter country forthis metal from fossil fuel combustion in stationary sources.
Mercury is often considered as the most interesting trace metal emitted from combustion of fossilfuels in power plants and heat-producing units, particularly those burning coal. This is because a majorpart of Hg is emitted in a gaseous form, passing the control equipment and entering the atmosphere.Almost 1500 t of this element were emitted from fossil fuel combustion in stationary sources in 1995.The 10 largest emitter countries are presented in Table 3. China alone emits one third of the total globalemissions of Hg from this source, followed by India. The Asian countries emit almost 60% of the totalemissions.
Vanadium and nickel are the two trace metals emitted in large amounts during the combustion ofoil. The emission ratio between these two metals resembles the ratio of the concentrations in crude oil,
©2001 NRC Canada

278 Environ. Rev. Vol. 9, 2001
as well as in residual oil used in power plants and heat-producing units.An interesting comparison can be made between the 1995 emission data and the emission estimates
for the reference year 1983 (Table 1). For trace metals emitted mostly during coal combustion, namelyHg, As, Cd, Cr, Cu, Mn, Mo, Pb, Sb, Sn, and Zn, emissions in 1995 are either similar or lower than in1983. Detailed information on country by country emissions in 1983 is not available for all countries,therefore it is difficult to make direct comparison. The pattern of coal combustion indicates that whilethe consumption of coal in Europe and North America did not change substantially, the demand forcoal-based energy in the Asian countries rose quite significantly between the beginning of the 1980sand the mid-1990s. Major improvement of the efficiency of emission control for fine particles has beenobserved in Europe during the 1980s resulting in the decrease of emissions of trace metals in the periodof comparison. Another factor contributing to the decrease of trace metal emissions in Europe was achange from coal combustion to oil and natural gas combustion, as well as from fossil fuel combustionto nuclear energy and to larger use of hydro power in some countries. The detailed analysis of thesechanges is, however, beyond the scope of this paper.
The aforementioned pattern of trace metal emission decrease in Europe and NorthAmerica has beencompensated by the growing electricity demand in Asia. As a result, the emissions of Cd, Cr, Cu, Mn,Mo, Pb, and Sn from stationary fossil fuel combustion have not change significantly on a global basisbetween the beginning of the 1980s and the mid-1990s.
Estimates of lower emissions of Hg, As, and Zn in 1995 and higher emissions of Se and Tl areprobably due to more accurate and complete information on emission factors for these compounds usedto estimate the 1995 emissions. They do not follow the pattern of coal use and the emission controlimprovements.
An interesting comparison has been noted for the emissions of V and Ni, thus metals emitted mainlyduring oil combustion. The 1995 emissions are 2 to 3 times higher than the 1983 emissions, nicelyresembling the factor of 2.2 increase in oil combustion to meet electricity and heat demands betweenthe beginning of the 1980s and the mid-1990s. Indeed, the consumption of oil and the metal content of oilare the main factors affecting the amount of V and Ni emissions to the atmosphere from oil combustionin power plants. Most of the oil-firing power plants are not equipped with any dedusting installations. Itcan also be assumed that the content of Ni and V in crude oil has not changed significantly in the periodof comparison. Thus, the main explanation of the more than double increase of V and Ni emissionsfrom oil-firing power plants would be increased production of electricity and heat worldwide.
4.3.2. Lead emissions from vehicular traffic
Combustion of all kinds of gasoline results in emission of Pb to the atmosphere. There are alsoother trace metals that can be emitted from this source but these emissions are negligible. Obviously,the largest Pb emissions are from leaded gasoline combustion.
Accurate information on the amount of leaded, low-leaded, and unleaded gasoline used in a givencountry is of primary importance for the estimates of atmospheric emissions of the metal. This informa-tion, as well as the information on national emissions of Pb from vehicular traffic in 1995, was availablefrom national authorities in the European countries, the United States, and Canada. For other countries,emission estimates have been carried out by the authors. It should be noted that no information wasobtained on the consumption of leaded, low-leaded, and unleaded gasoline in these countries, nor onthe lead content of gasoline in 1995. In such circumstances an assumption has been made that for thecountries other than the European countries, the United States, and Canada, the Pb emission factors for1995 will be at a level of those estimated by Pacyna et al. (1995) for 1989. The results of these estimatesare presented in Table 4.
The largest contribution, 43–44% of the worldwide vehicular emissions of Pb, comes from thecombustion of gasoline inAsia. The largest contributions from individual countries come from EuropeanRussia, China, and Mexico, each emitting over 8500 t of Pb in 1995.
©2001 NRC Canada

Pacyna and Pacyna 279
Table 4. Worldwide emissions of Pb from mo-bile sources in 1995 (in tonnes).
Continent Minimum Maximum
Europe 19 507 19 507Africa 6 852 11 992Asia 32 996 44 293North America 10 414 15 780South America 4 866 7 270Australia 2 000 2 000
World total 76 635 100 842
The average worldwide Pb emission in 1995 was estimated at 88 700 t and can be compared withthe estimates of average emissions of 116 700 t in 1989 (Pacyna et al. 1995) and with the estimatesof average emissions of 248 000 t in 1983 (Nriagu and Pacyna 1988). This emission decrease in theperiod from the beginning of the 1980s to the mid-1990s corresponds well with the implementation ofenvironmental strategies of Pb emission reductions through the introduction of low-leaded and unleadedgasoline in Europe, the United States, and Canada.
4.3.3. Emissions from non-ferrous metal production
Emissions from non-ferrous metal industry contributed most to 1983 worldwide emissions of As,Cd, Cr, Cu, In, Mn, and Zn (Nriagu and Pacyna 1988). The estimates of emissions from this sourcecategory have also caused the largest controversy in the literature concerning the value of emissionfactors and then the amounts of emissions in various smelters, technologies, countries, etc. (Skeaff andDubreuil 1997). Indeed, the best solution for assessing the emission of trace metals from smelters is tomeasure these emissions, particularly the stack emissions. Such measurements have been carried out inthe European, Canadian, U.S., and Australian smelters, but they are largely lacking in other countries.In the latter case emission factors need to be used for the emission estimates.
Since the publication of the first global emission inventory for trace metals by Nriagu and Pacyna(1988) a number of improvements have been made in the non-ferrous metal industry, including theintroduction of very efficient control equipment to control both particulate and gaseous pollutants. Toreview the degree of these improvements, it was necessary to contact the non-ferrous metal industry.The following smelters submitted information to the authors: Cominco Ltd in Canada, Hudson BayMining and Smelting Co. Limited in Canada, Kennecott Utah Copper Corporation in the United States,Huttenwerke Kayser AG in Germany, Berzelius Metall GmbH in Germany, Norddeutsche Affinerie inGermany, and Metaleurop Weser Blei GmbH in Germany.
The information received from the above smelters, national environment protection authorities inthe European countries, Canada, and the United States, as well as the estimates by the authors for othercountries was brought together and presented in a form of trace metal emissions to the atmosphere fromnon-ferrous metal industry in the mid-1990s. The results are presented in Tables 5 through 7 for primaryand secondary copper and nickel production, primary and secondary lead production, and primary andsecondary zinc production, respectively. The copper – nickel industry emits larger quantities of tracemetals (except for Hg and Zn), compared to the lead and zinc industry. Obviously, primary productionprocesses emit most of the emissions from non-ferrous metal manufacturing.
Summary of emissions of trace metals from the non-ferrous metal industry is presented in Table 8.The largest emissions were estimated for the non-ferrous metal industry inAsia, followed by the smeltersin South America. The emissions for these two continents were estimated in the reported project on thebasis of emission factors and statistical data on the metal production. The average emission factors used
©2001 NRC Canada

280 Environ. Rev. Vol. 9, 2001
Tabl
e5.
Em
issi
ons
oftr
ace
met
als
from
the
copp
erpr
oduc
tion
in19
95:(
a)pr
imar
ypr
oduc
tion,
and
(b)se
cond
ary
prod
uctio
n(in
tonn
es).
Con
tinen
tA
sC
dC
uH
gIn
Mn
Ni
Pb
Sb
Se
Sn
Zn
V
(a)
Prim
ary
pro
du
ctio
nE
urop
e18
592
555
22
277
1919
1937
09
Afr
ica
260
104
156
25
25
781
521
2626
2626
05
Asi
a1
593
637
955
532
1332
4778
318
515
915
915
915
9332
Nor
thA
mer
ica
252
126
754
143
337
775
425
2525
503
13S
outh
Am
eric
a86
834
75
207
177
1726
041
736
8787
8786
817
Aus
tral
iaan
dO
cean
ia25
1375
137
753
33
501
Wor
ldto
tal
318
313
1917
708
6927
5988
546
271
319
319
319
3644
77
1983
emis
sion
(ave
rage
)10
625
2550
2252
512
221
2550
7650
1657
510
6385
410
6363
7564
(b)
Se
con
da
ryp
rod
uct
ion
Eur
ope
23
911
318
1A
fric
a1
11
Asi
a9
818
Nor
thA
mer
ica
12
551
492
109
Sou
thA
mer
ica
21
3A
ustr
alia
and
Oce
ania
22
5
Wor
ldto
tal
35
160
262
531
7
©2001 NRC Canada

Pacyna and Pacyna 281
Table 6. Emissions of trace metals from lead production in 1995: (a) primary production, and(b) secondary production (in tonnes).
Continent As Cd Cu Hg Ni Pb Sb Se Zn
(a) Primary productionEurope 2 8 4 2 4 3 341 15 8 15Africa 1 1 1 1 195 7 3 8Asia 12 17 12 3 12 2 298 86 40 92North America 2 7 4 2 4 137 14 7 14South America 1 2 1 1 203 8 4 8Australia and Oceania 1 2 1 1 1 41 4 2 4
World total 19 37 23 8 23 6 215 134 64 141
1983 emission (average) 1170 117 273 12 166 21 450 293 293 332
(b) Secondary productionEurope 2 1 17Africa 5 1Asia 1 20 4North America 1 3 1 110 22South America 5 1Australia and Oceania 3 1
World total 1 6 2 143 46
Table 7. Emissions of trace metals from the zinc production in 1995: primary production and secondary produc-tion (in tonnes).
Primary production Secondary production
Continent As Cd Cu Hg In Pb Sb Se Zn Zn
Europe 57 108 13 14 7 29 22 3 237 123Africa 6 25 6 3 61 2 2 1 228Asia 130 522 130 52 8 1304 39 39 26 082 3North America 31 58 7 9 4 448 15 12 1 727 35South America 19 77 19 8 1 191 6 6 3 827 2Australia andOceania
8 15 2 2 1 119 4 3 457 1
World total 251 805 177 88 21 2123 95 84 36 558 164
1983 emission(average)
460 2760 460 3 8510 69 161 64 400
in these estimates are presented in Table 9. The emission factors for smelters in Asia, South America,and Africa were those considered in the UN ECE Joint EMEP/ CORINAIR Atmospheric EmissionInventory Guidebook (1999b) as representative for smelters with a standard emission control system.Statistical information on the production of non-ferrous metals was obtained from the World Bureau ofMetal Statistics (WBMS 1999) and Industrial Commodity Statistics Yearbook 1996 (UN 1998).
Although most of the emission data for smelters in Europe, North America, and Australia werebased on the information received directly from them or from their country national environmentalprotection authorities, in some cases emissions were calculated in this work. The average emission
©2001 NRC Canada

282 Environ. Rev. Vol. 9, 2001
Tabl
e8.
Em
issi
ons
oftr
ace
met
als
from
non-
ferr
ous
met
als
prod
uctio
nin
1995
:(a)
prim
ary
prod
uctio
n,an
d(b)
seco
ndar
ypr
oduc
tion
(into
nnes
).
Con
tinen
tA
sC
dC
uH
gIn
Mn
Ni
Pb
Sb
Se
Sn
Zn
VC
r
(a)
Prim
ary
pro
du
ctio
nE
urop
e24
520
857
215
82
281
334
162
4819
362
29
Afr
ica
267
130
156
98
25
782
777
3531
261
496
5A
sia
173
511
769
697
8720
3247
896
787
285
239
159
2776
732
Nor
thA
mer
ica
284
191
765
256
338
11
340
5444
252
244
13S
outh
Am
eric
a88
842
55
228
258
1726
052
130
100
9687
470
317
Aus
tral
iaan
dO
cean
ia34
3078
41
3823
511
83
511
1
Wor
ldto
tal
345
321
6017
909
164
4559
8876
1461
054
746
631
940
343
77
1983
emis
sion
(ave
rage
)12
255
5427
2325
813
424
2550
7816
4653
514
2513
0810
6371
107
64
(b)
Se
con
da
ryp
rod
uct
ion
Eur
ope
25
921
332
1A
fric
a1
62
Asi
a1
928
25N
orth
Am
eric
a2
556
115
92
167
Sou
thA
mer
ica
27
7A
ustr
alia
and
Oce
ania
25
7
Wor
ldto
tal
411
162
220
55
529
1983
emis
sion
(ave
rage
)11
765
855
11
©2001 NRC Canada

Pacyna and Pacyna 283
factors applied for the calculation of smelter emissions in the European and North American countriesare also presented in Table 9. More advanced control equipment was considered for these countriescompared to the smelters in Asia, Africa, and South America. This consideration was given on the basisof comparisons between smelters described in a series of books on Non-Ferrous Metal Works of theWorld, published by Metal Bulletin Books.
The data in Table 8 also present a comparison with the 1983 emission estimates by Nriagu andPacyna (1988). The 1995 emissions are lower by a factor of 2 to 3, except for Hg, In, Mn, Ni, and V.The decrease of emissions during the period from the beginning of the 1980s to the mid-1990s can beexplained by a significant improvement of emission control efficiency for fine particles carrying tracemetals in the European, Canadian, and U.S. smelters. Another explanation could be that 1983 data areentirely estimates, while more accurate information through the emission measurements was availablefor the 1995 data, as mentioned above.
The Hg emissions in 1995 are somewhat higher that the 1983 data, mostly because the 1983 data donot contain the information on Hg emissions from zinc production. Concerning the data for In, Mn, Ni,and V, the differences between the 1995 and 1983 estimates are probably because the 1983 Mn emissionfactors were overestimated, while the 1983 emission factors for In, Ni, and V were underestimated.
It should also be added that Hg is emitted during gold production. An earlier estimate of the Hgglobal emissions in 1990 by Pacyna and Pacyna (1996) indicates that as much as 325 t of Hg can beemitted from this process annually. More than half of these emissions occur in Africa. As no betterestimates were available to the authors, the 1990 Hg emissions were accepted as valid also for themid-1990s.
The emission factors used in the reported work fit very well within the range of emission factorsproposed within the UN ECE Guidebook mentioned earlier in this report. The data from the Guidebookwere tested and approved for use by a great number of emission experts in Europe and also in the UnitedStates. Therefore, the estimates presented in this paper are claimed to be more accurate than those usedby Skeaff and Dubreuil (1997).
4.3.4. Emissions from iron and steel industry and cement production
Emissions of trace metals from the iron and steel manufacturing and cement production wereestimated for the year 1994. As in the case of other source categories presented in this work, a numberof European countries, the United States, and Canada provided their national emission values, whichwere used to prepare a global emission inventory reported here. Emissions for the remaining countrieswere estimated in this work. These estimates were performed on the basis of emission factors andstatistical information on the pig iron and steel production and cement production. The average valuesof these factors are presented in Table 2. The production statistics were obtained from the UN StatisticalYearbook (UN 1997).
The emission estimates for the pig iron and steel production are reported in Table 10, and thecement industry in Table 11. The largest emissions were estimated for Asia and Europe. Particularlyhigh emissions were estimated for Cr.
Comparison of the emission estimates in this work with the estimates for 1983 emissions indicateslarge differences. There are various reasons for these differences, which are very difficult to assessquantitatively. The first reason is the improvement of the emission control for fine particles during theperiod of comparison. Indeed, a major improvement of the ESP and multicyclone abatement efficiencieshas occurred in Europe in the mid-1980s and in Asia at the beginning of the 1990s. The second reasonis related to the quality of emission factors used in the 1983 estimates. The collection of informationon emission factors by the authors for the UN ECE Joint EMEP/ CORINAIR Atmospheric EmissionInventory Guidebook (1999b) has proved that the 1983 emission factors could have been too high.
Mercury was not taken into account when preparing the 1983 emission inventory for the iron andsteel industry and cement production. The same applies to Se from the cement production. Emissions
©2001 NRC Canada

284 Environ. Rev. Vol. 9, 2001
Tabl
e9.
Em
issi
onfa
ctor
sfo
rno
n-fe
rrou
sm
etal
sby
cont
inen
tin
1995
(gra
ms/
tonn
e).
Prim
ary
prod
uctC
uS
econ
dary
prod
uctC
uP
rimar
ypr
oduc
tPb
Sec
onda
rypr
oduc
tPb
Prim
ary
prod
uctZ
nS
econ
dary
prod
uctZ
n
Ele
men
t
Eur
ope,
N.A
.,A
ustr
alia
Afr
ica,
Asi
a,S
.A.
Eur
ope,
N.A
.,S
.A.,
Aus
tral
ia,A
fric
a,A
sia
Eur
ope,
N.A
.,A
ustr
alia
Afr
ica,
Asi
a,S
.A.
Eur
ope,
N.A
.,S
.A.,
Aus
tral
ia,A
fric
a,A
sia
Eur
ope,
N.A
.,A
ustr
alia
Afr
ica,
Asi
a,S
.A.
Eur
ope,
N.A
.,S
.A.,
Aus
tral
ia,A
fric
a,A
sia
As
100.
050
0.0
2.0
3.0
10.0
0.5
26.0
50.0
—C
d50
.020
0.0
3.0
10.0
15.0
2.5
49.0
200.
0—
Cu
300.
030
00.0
100.
05.
010
.01.
06.
050
.0—
Hg
5.6
10.0
—3.
03.
0—
7.6
20.0
—In
1.0
4.0
——
——
3.0
3.0
—M
n1.
010
.0—
——
——
——
Ni
150.
015
00.0
1.0
5.0
10.0
——
——
Pb
300.
010
00.0
90.0
200.
020
00.0
100.
038
0.0
500.
0—
Sb
10.0
50.0
3.0
20.0
75.0
—13
.015
.0—
Se
10.0
50.0
—10
.035
.0—
10.0
15.0
—S
n10
.050
.0—
——
——
——
Zn
200.
050
0.0
200.
020
.080
.020
.01
466.
010
000.
027
0.0
V5.
010
.0—
——
——
——
Not
e:N
.A.,
Nor
thA
mer
ica;
S.A
.,S
outh
Am
eric
a.
©2001 NRC Canada

Pacyna and Pacyna 285
Table 10. Emission of trace metals from pig iron and steel production in 1994 (in tonnes).
Continent Hg As Cd Cr Cu Mn Ni Pb Sb Se Zn V
Europe 10 130 26 1 037 52 389 13 2255 3 3 778 26Africa 1 6 1 49 2 18 1 18 36 1Asia 12 139 28 1 111 56 417 14 417 3 3 833 28N. America 5 57 4 456 23 171 6 171 1 1 342 11S. America 1 17 4 138 7 52 2 52 104 4Australia andOceania
4 1 34 2 13 13 25 1
World total 29 353 64 2 825 142 1 060 36 2926 7 7 2 118 71
1983emission(average)
1418 156 15 620 1491 14 733 3568 7633 5 2 19 525 746
Table 11. Emissions of trace metals from cement production in 1994 (in tonnes).
Continent Hg As Cd Cr Ni Pb Se Tl Zn
Europe 26 55 3 273 27 55 1 547Africa 5 10 1 52 5 10 104Asia 82 164 8 818 82 164 2 1635North America 13 26 4 128 13 26 257South America 6 11 1 56 6 11 111Australia and Oceania 1 2 8 1 2 16
World total 133 268 17 1335 134 268 3 2670
1983 emission (average) 534 271 1335 490 7129 4005 9790
of Hg from cement production proved to be rather high, particularly from cement kilns in the Asiancountries. In general, however, emissions of trace metals from the iron and steel industry and cementproduction are substantially lower than the emissions from non-ferrous metal industry and stationaryfossil fuel combustion. Therefore, somewhat lower quality of emission factors expected for the ironand steel industry and cement production as compared to other major source categories will not have asignificant impact on the quality of the estimates of total emissions of trace metals in the world.
4.3.5. Emissions from waste disposal
Emissions from the incineration of municipal wastes and sewage sludge are the most difficult toestimate because of a lack of information on the amounts of wastes incinerated in various countries andtheir composition. Thus, it is also difficult to assess the content of trace metals in the wastes.
The national emission estimates for the incineration of wastes have been available from only afew countries in Western Europe and the United States. These estimates were used directly in thiswork. Additionally, statistics on the amount of wastes incinerated were available for another smallgroup of countries. These statistics were used together with emission factor information to assess tracemetal emissions from waste incineration. The average emission factors are presented in Table 12. Theresults of emission estimates are given in Table 13. The statistical information was obtained fromthe UN Environment Programme, Environmental Data Report 1993–1994 (UNEP 1996), the OECDEnvironmental Data Compendium 1995 (OECD 1997), and the Statistical Compendium for the DobrisAssessment of Europe’s Environment (EEA 1995).
©2001 NRC Canada

286 Environ. Rev. Vol. 9, 2001
Table 12. Emissions factor for waste disposal, ingrams/tonne waste incinerated.
Elements Municipal waste Sewage sludge waste
As 1.1 5.0Cd 0.4 1.0Cr 0.7 50.0Cu 7.0 10.0Hg 1.0 5.0Mn 1.8 50.0Ni 0.7 10.0Pb 10.0 80.0Sb 3.0 5.0Se 0.2 1.0Sn 1.0 5.0Zn 20.0 50.0V 3.0
Table 13. Emissions of trace metals from (a) municipal waste, and (b) sewage sludge incineration in the mid-1990s(in tonnes/year).
Continent As Cd Cr Cu Hg Mn Ni Pb Sb Se Sn Zn V
(a) Municipal wasteEurope 29 10 18 182 10 47 18 250 78 5 26 520Asia 36 13 23 228 33 59 23 326 98 7 33 652N. America 21 8 14 136 64 35 14 194 58 4 19 388Australiaand Oceania
1 1 — 1 — — — 1 1 — — 3
World total 87 32 55 547 107 141 55 771 235 16 78 1563
(b) Sewage sludgeEurope 3 1 26 5 1a 26 5 1a 3 1 3 26 2AsiaN. America 34 7 344 69 2 344 69 50 34 7 34 344 21Australiaand Oceania
World total 37 8 370 74 2 370 74 50 37 8 37 370 23aEmissions of Hg and Pb from sewage sludge incineration in Europe are included in the emissions of these metals frommunicipal waste incineration.
In general, emission data in Table 13 are very much incomplete and therefore largely underestimate,probably by one order of magnitude, for As, Cd, Cr, Pb, Sn, and Zn release. The incompleteness of datahas been caused by a lack of information from most countries on emissions of trace metals during wasteincineration and (or) on the amount of wastes incinerated. Once more reliable data on the magnitudeof wastes incinerated and the content of trace metals in these wastes are obtained, additional focusshould be put in future emission inventorying activities. This will result in more accurate and completeemission estimates.
©2001 NRC Canada

Pacyna and Pacyna 287
4.3.6. Total worldwide emissions from anthropogenic sources
Results of estimates of worldwide emissions of trace metals from major anthropogenic sources tothe atmosphere in the mid-1990s are presented in Table 14. These results indicate that stationary fossilfuel combustion continues to be the major source of Cr (69%), Hg (66%), Mn (85%), Sb (47%), Se(89%), Sn (89%), and Tl (almost 100%) with respect to coal combustion and the major source of Ni(90%) and V (almost 100%) with respect to oil combustion.
Combustion of leaded, low-leaded, and unleaded gasoline continues to be the major source ofatmospheric Pb emissions, contributing about 74 % to the total anthropogenic emissions of this metalin 1995.
The third major source of trace metals is non-ferrous metal production, which is the largest sourceof atmospheric As (69%), Cd (73%), Cu (70%), In (100%), and Zn (72%).
It should be noted again that the information on the emissions of trace metals from waste incinerationis clearly incomplete with respect to the number of countries reporting their emissions from this sourceand inaccurate with respect to the emission factors used to calculate trace metal emissions from wasteincineration for countries not reporting their national emissions. In addition, statistical information onthe amounts of municipal and sewage sludge wastes is also incomplete. The above-mentioned problemsresult in underestimation of trace metal emissions from this source, particularly for As, Cd, Cr, Mn, Pb,Sb, Se, Sn, and Zn.
Emissions of trace metals released mostly during non-ferrous metal production have decreasedby a factor of 2 to 3 between the beginning of the 1980s and the mid-1990s, mostly because of theimprovement of emission control efficiency in major smelters in Europe and North America. Onecannot rule out another explanation for this change, that the emission factors used to estimate emissionsat the beginning of the 1980s were somewhat overestimated for some metals, as already discussed bySkeaff and Dubreuil (1997).
Emissions of trace metals emitted mostly from coal combustion are lower by a factor of 2 in the1990s compared to the emissions at the beginning of the 1980s, while emissions of V and Ni from oilcombustion are higher by a factor of 2 to 3. This trend was explained earlier in this work.
Results of worldwide emission estimates of anthropogenic trace metals for various continents arepresented in Table 15. Emissions from sources in Asia are clearly the largest for all metals estimated inthis work. This can be related to the increase of industrial production in this part of the world. However,progress in combating environmental pollution does not always follow industrial growth, particularlyin the Asian countries.
Concerning the contribution of individual countries to the total emissions of anthropogenic tracemetals, this information has been presented in this work for Hg from stationary fossil fuel. The Asianand South American countries are also the largest emitters of As and Cd from the non-ferrous metalindustry. High emissions are also estimated for the U.S. smelters. The above information is presented inTable 16. Unfortunately, no data exist on the emissions of trace metals from individual countries or evencontinents for the beginning of the 1980s. Therefore, the development of emission geography betweenthe beginning of the 1980s and the mid-1990s is impossible to review.
There are no other data in the literature on emissions of several trace metals that could be comparedwith the estimates presented in this work. The only estimates of global anthropogenic emissions werefound for Hg (Pirrone et al. 1996). A comparison of these estimates with the data presented in thiswork is shown in Table 17. Very good agreement was obtained for the total emissions and for Asia,the main region of anthropogenic Hg emissions to the atmosphere. Major differences were observedfor Europe and Africa. Because most of the European emissions presented in this work are based ondiscussions with national emission experts in various European countries, therefore it is claimed thatthe data presented herein are more reliable.
©2001 NRC Canada

288 Environ. Rev. Vol. 9, 2001
Table 14. Worldwide emissions of trace metals from major anthropogenic source categories to the
Source category As Cd Cr Cu Hg In
Stationary fossil fuel combustion 809 691 10 145 7 081 1 475Vehicular trafficNon-ferrous metal production 3 457 2 171 — 18 071 164 45Iron and steel production 353 64 2 825 142 29 —Cement production 268 17 1 335 — 133 —Waste disposal 124 40 425 621 109 —Other 325a
Total 5 011 2 983 14 730 25 915 2 235 45
1983 emissionb 18 820 7 570 30 480 35 370 3 560 25
aEmission of Hg from gold production.bNriagu and Pacyna (1988).
5. Quality of emission estimates
It is very difficult to assess the accuracy of currently available emission data for trace metals mostlybecause of limited information on the accuracy of emission factor estimates and specific statisticaldata in various countries. Ideally, emissions from at least major sources, such as large power plants,waste incinerators, smelter, steel and iron plants, and cement kilns should be measured. The emissionmeasurements would generate the most accurate data on emissions assuming that the proper samplingmethods and analytical techniques are applied and the samples are collected at representative sites alongthe path of flue gases in the stack. However, to measure emissions at so many point sources of emissionsis for many reasons impossible to accomplish in very many countries. Therefore, less accurate methodsbased on emission factors and material balances must be applied.
The information for Pb is claimed to be the most accurate, as most Pb emissions on a globalscale originate from combustion of leaded gasoline. Information on consumption of gasoline in variouscountries is quite accurate, as is information on the use of lead additives. A comparison of variousindependent estimates for Europe as a whole and for individual countries seems to indicate an accuracyof about 15%.
Cadmium and mercury emitted from anthropogenic sources have been the subject of several emissionestimates. Their major sources are fairly well defined and emission factors established. An emissionestimation accuracy of better than 50% can be assigned for these two trace metals in Europe, as provedby the comparison of air concentrations calculated by models using emission data and those measured.A very recent study carried out at the Meteorological Synthesizing Centre-East (MSC-E) of EMEP(EMEP MSC-E) concluded that an agreement between the model estimates based on the emission datafor Europe, used in this paper, and air measurements at various EMEP stations in Europe was as goodas 6% for Pb, 6% for Hg, and 14% for Cd (Ryaboshapko et al. 1999). No analysis was carried out forother trace metals. These results indirectly confirm very good accuracy of emission estimates presentedin this paper, at least for Europe. They also indicate a proper selection of emission factors for emissionestimates presented here.
Similar comparison made by other research groups (e.g., Olendrzynski et al. 1996) for Zn seemsto indicate an accuracy within a factor of 2. In general, the Zn data are often underestimated due toincomplete knowledge of emission sources. While emissions of Zn from zinc non-ferrous metal industryare quite accurate, there are many sources related to the Zn consumption, and the Zn emissions fromthese sources are often less accurately estimated.
In summary, only single estimates of emissions are presented in this work for the studied trace metals
©2001 NRC Canada

Pacyna and Pacyna 289
Table 14. atmosphere in the mid-1990s (in tonnes/year).
Mn Mo Ni Pb Sb Se Sn Tl V Zn
9 417 2 642 86 110 11 690 730 4 101 3 517 1 824 240 084 9 41788 739
59 — 8 878 14 815 552 466 319 — 77 40 8721 060 — 36 2 926 7 7 — — 71 2 118
— — 134 268 — 3 — — — 2 670511 — 129 821 272 24 115 — 23 1 933
11 047 2 642 95 287 119 259 1 561 4 601 3 951 1 824 240 255 57 010
38 270 3 270 55 650 332 350 3 510 3 510 3 790 5 140 86 000 131 880
and source categories. In the case that emissions were estimated using emission factors, these factorswere the ones selected as the most relevant for a given industrial technology, an industrial developmentin a given country or region, progress and improvements in application of advanced emission controlequipment, the content of trace metals in raw materials, etc. However, emission estimates for one cate-gory can be more accurate and complete than the estimates for another source category. It is concludedhere that the following accuracy of emission estimates can be assigned to the estimates for individualsource categories in this work: stationary fossil fuel combustion,±25%; combustion of gasoline,±15%;non-ferrous metal production,±20%; iron and steel production,±30%; cement production,±30%; andwaste disposal, a factor of up to 5.
The most accurate emission estimates are those calculated for gasoline combustion. Leaded, low-leaded, and unleaded gasoline consumption in various countries is known within 15%, and this can alsobe accepted for worldwide Pb emission estimates. Most of the emission factors used in the project forfossil fuel combustion, cement production, and pig iron and steel production (Table 2) are within theranges of emission factors presented in the UN ECE Guidebook (UN ECE 1999b) and differ from theemission factors defined in this guidebook as suggested for use within the above-mentioned percentage.The same applies to the emission factors for non-ferrous metal industry (Table 9).
Emission factors for waste disposal, available from the above-mentioned guidebook, differ by afactor of up to 5 compared to the data in Table 12. Clearly, the trace metal emission estimates for wastedisposal are the least accurate compared to estimates for other source categories considered in this work.
The above-mentioned values apply to global estimates. As the emission data for several countriesin Europe and North America have been evaluated by national emission experts, it can be suggestedthat the emission estimates for Europe and North America may be more accurate than the emissionestimates for other continents.
The strengths of current emission estimates are found in improved completeness of emission sourcecategories considered and in the transparency of emission data presentation. Whereas more accurateemission data for trace metals are becoming available for major source categories, including the com-bustion of fuels, the non-ferrous metal production, and the production of certain industrial goods, somefresh information on the amounts and emission factors now exists for other sources, including variousapplications of trace metals as additives, etc. Improvements with respect to the completeness of emissiondata for major source categories are due to emission measurements often carried out in connection withvarious environmental protection regulations being introduced more frequently at present, compared tothe past 10–20 years. These regulations can be national or international, e.g., the agreements on emission
©2001 NRC Canada

290 Environ. Rev. Vol. 9, 2001
Tabl
e15
.Wor
ldw
ide
emis
sion
sof
trac
em
etal
sfr
omm
ajor
anth
ropo
geni
cso
urce
cate
gorie
sto
the
atm
osph
ere
inth
em
id-1
990s
,on
the
cont
inen
tby
cont
inen
tbas
is(in
tonn
es/y
ear)
.
Con
tinen
tA
sC
dC
rC
uH
gIn
Mn
Mo
Ni
Pb
Sb
Se
Sn
Tl
VZ
n
Eur
ope
607
362
335
32
245
313
82
339
531
2041
728
091
273
838
863
311
5714
47
689
Afr
ica
324
172
847
203
138
92
738
207
1069
011
349
6630
042
578
2893
02
353
Asi
a24
1614
636
234
1297
911
2120
448
211
1541
228
5121
269
419
8216
7677
110
131
434
886
N.A
mer
ica
658
482
328
42
841
215
62
670
579
1123
617
015
375
1086
531
564
2666
05
859
S.A
mer
ica
925
452
623
545
384
849
712
811
092
911
810
122
542
61
2544
35
353
Aus
tral
iaan
dO
cean
ia81
5238
936
611
31
321
8262
42
474
5217
030
9976
487
0
Tota
l50
1129
8314
730
2591
522
3545
1104
726
4295
287
119
259
1561
4601
3951
1824
240
255
5701
0
©2001 NRC Canada

Pacyna and Pacyna 291
Table 16. The 10 largest emitter countries for As and Cd from non-ferrous metal industry in 1995 (emissions in tonnes).
As Cd
No. Country Emission Country Emission1 Chile 644 China 4402 China 600 Japan 3563 Japan 591 Chile 2584 United States 200 United States 1125 Zambia 157 Korea 1046 Peru 150 Peru 897 Kazakhstan 136 Kazakhstan 828 Korea 131 Brazil 719 Brazil 92 Zambia 63
10 Philippines 79 Canada 61
Table 17. Comparison of estimates of worldwide anthropogenic Hg emissions tothe atmosphere by region, reported for 1992 by Pirrone et al. (1996), and this workfor 1995 (in tonnes/year).
Continent Pirrone et al. (1996) for 1992 This work for 1995
Europe 634 313Africa 113 389Asia 1012 1121North America 332 215South America 73 84Australia and Oceania 35 113
Total 2199 2235
reductions for trace metals, recently established within the UN ECE. The European Union is also in theprocess of preparing directives aimed at the reduction of Hg and other trace metals in the EU region.
In connection with international agreements on the reduction of emissions of trace metals to the airand their loads to the marine and terrestrial ecosystems, countries in various regions, such as Europe areobligated to report their emission data to the international organizations responsible for the implemen-tation of the results of these agreements. This reporting is required in a very transparent manner, whichhas a direct impact on the improvement of transparency of emission estimates. Guidebooks and guide-lines are now becoming available within the international and national organizations, advising emissionexperts on how to estimate and report emissions of trace metals. An example could be a Joint EMEP/CORINAIR Atmospheric Emissions Inventory Guidebook (UN ECE 1999b). This Guidebook is quiteextensively used, which contribute to the improvement of completeness, accuracy, and transparency ofemission data for trace metals being generated at present, mostly in Europe and North America, but alsoin Asia, South America, and recently in Africa.
However, these positive developments in collating of accurate emission data for trace metals fromanthropogenic sources have not yet overcome the shortcomings in emission inventorying related mainlyto still weak communication links between emission experts preparing inventories at a national leveland industry and other environmental change drivers. The developments within this work have been animportant step towards the improvement of this communication.
©2001 NRC Canada

292 Environ. Rev. Vol. 9, 2001
Table 18. A comparison of estimated global anthropogenic emissions of trace met-als in the mid-1990s with emissions from natural sources (Nriagu 1989) (emissionsin 103 tonnes/year).
Trace metalAnthropogenicemissions
Natural emissions:median values
Anthropogenic/nationalemission ratios
As 5.0 12.0 0.42Cd 3.0 1.3 2.3Cr 14.7 44.0 0.33Cu 25.9 28.0 0.93Hg 2.2 2.5 0.88Mn 11.0 317.0 0.03Mo 2.6 3.0 0.87Ni 95.3 30.0 3.2Pb 119.3 12.0 9.9Sb 1.6 2.4 0.67Se 4.6 9.3 0.49V 240.0 28.0 8.6Zn 57.0 45.0 1.3
6. Comparison of contributions of emissions from natural andanthropogenic sources to the total global emission of trace metals
Estimation of trace metal emissions from natural sources was not within the scope of this work.A new study on the estimates of trace metal emissions from natural sources is now being carriedout at the Geological Survey of Canada.3 The results of this study are expected in the near future.However, at least some comparison of the estimates of trace metal emissions from anthropogenicsources, presented in this work with the older estimates for natural sources available from the literature,can be approached. An important contribution to describing the significance of natural sources of tracemetals in the environment is that by the Geological Survey of Canada (GSC 1995), but the widestquantitative assessment of emissions from these sources is still the one by Nriagu (1989). Obviously,there are also other emission estimates, but they are mainly limited to a certain trace metal or to a singleemission source category.
The GSC report discusses releases of trace metals from deflated soil and sediment, volcanic emis-sions, forest fire debris, biogenic emissions, and oceanic emissions. General conclusion has been reachedthat there are significant uncertainties in comparing natural and anthropogenic emissions of trace met-als, particularly on a global scale. Natural emission estimates vary widely, since they are extrapolatedfrom very sparse data sets. In such cases the estimated ratios of natural and anthropogenic emissionsare uncertain.
A comparison of global anthropogenic emission estimates in this work with the global natural emis-sion estimates by Nriagu (1989) is presented in Table 18. This comparison suggests that anthropogenicemissions of Pb and V are by one order of magnitude higher than the natural emissions of the thesemetals on a global scale. Anthropogenic emissions are a factor of 2 to 3 higher than the natural emis-sions for Cd and Ni, and they are comparable for Cu, Hg, Mo, Sb, and Zn. The comparison in Table 18also indicates that global natural emissions of As, Cr, and Se are larger than the global anthropogenicemissions of these elements by a factor of 2 to 3. Finally, the natural sources are by far more significantthan the anthropogenic sources for Mn.
3 Robert Garrett, personal communication
©2001 NRC Canada

Pacyna and Pacyna 293
There are a few interesting observations that can be made on the basis of the comparison in Table 18.In general, there are no major surprises in this comparison for the mid-1990s compared to our previousfindings with respect to the significance of anthropogenic sources of trace metals to the total budget ofthese contaminants. Perhaps the only exception is for As, often regarded as very much an anthropogenictrace metal. One should add that the As emission from natural sources considered in Table 18 is quitehigh and probably overestimated. For Hg, anthropogenic sources seem to be as important as naturalsources. It should be underlined that the suggestions presented above are valid when we discuss thesignificance of anthropogenic versus natural sources on a global scale. This significance can be entirelydifferent when discussing the situation on a local scale, e.g., around a waste incinerator or a volcanoand even on a regional scale, e.g., in Central Europe or in the Mediterranean Sea basin.
7. Final remarks
An accurate and complete emission inventory for atmospheric trace metals on a global scale isneeded for both modeler community and policy makers to assess the current level of environmentalcontamination by these pollutants, major emission sources and source regions, and the contribution ofatmospheric pathway to the contamination of terrestrial and aquatic environment. International policymakers would need the information on global emissions to properly analyze source contribution to thepollution of a certain region and then to propose proper abatement strategy. Modelers would need theemission survey to provide with the scientific substantiation material for these strategies through theapplication of global models of trace metal transport within air masses. Major progress has been madein assessing emissions of trace metals in various countries and even regions, e.g., Europe since the firstglobal emission estimate for these pollutants was made by Nriagu and Pacyna (1988). These improvednational and regional emission inventories have been used in this work to assess the global trace metalemissions from anthropogenic sources in the mid-1990s.
The results of this work conclude that stationary fossil fuel combustion continues to be the majorsource of Cr, Hg, Mn, Sb, Se, Sn, and Tl with respect to coal combustion and the major source of Ni andV with respect to oil combustion. Combustion of leaded, low-leaded, and unleaded gasoline continues tobe the major source of atmospheric Pb emissions. The third major source of trace metals is non-ferrousmetal production, which is the largest source of atmospheric As, Cd, Cu, In, and Zn.
The largest anthropogenic emissions of atmospheric trace metals were estimated inAsia. This can beexplained by growing demands for energy in the region and increasing industrial production.As a result,theAsian emissions are not only larger than the emissions on other continents, but also show an increasingtrend. Another factor contributing to high emissions in Asia is the efficiency of emission control, whichis lower than in Europe and North America. Concerning the two latter continents, emissions of tracemetals show a decreasing tendency over the last two decades.
The emission inventory presented in this work is based on emission estimates by both nationalexperts in several countries in Europe and North America and author estimates for the remainingcountries. National estimates are sometimes based on emission measurements (in non-ferrous metalsmelters) that are considered a reliable source of information when preparing emission inventories.Indeed, more emission measurements should be carried out to further improve emission inventories.Emission measurements should be suggested for at least major point sources of emissions, such aspower plants, smelters, waste incinerators, and cement kilns.
Most of the trace metals are emitted on fine particles, while a portion of Hg and Se is emittedin a gas phase. Entering the atmosphere on fine particles and in a gaseous form, trace metals can betransported with air masses on long distances, e.g., 2000 km. There is fairly solid scientific evidenceof such transport. It is very important to be able to conclude to what extent concentrations measuredin remote locations are of anthropogenic origin and what is the contribution of emissions from naturalsources. Such information is crucial for preparing proper strategies on emission reduction with respect to
©2001 NRC Canada

294 Environ. Rev. Vol. 9, 2001
emissions from anthropogenic sources. The quality of this information is directly related to the accuracyand completeness of emission inventories for both anthropogenic and natural sources.
Acknowledgements
The authors thank the International Lead and Zinc Research Organization (ILZRO), the InternationalCopper Association (ICA), and the Nickel Producers Environmental Research Association (NiPERA)for financial and technical support of this work through the Ecotoxicity Technical Advisory Panel(ETAP). Let us hope that this work will improve further partnership of research scientists developingemission inventories with industry in order to better understand the sources, fluxes, and biogeochemicalcycling of chemicals in the environment.
The authors would also like to thank Dr. Kate E. Reagan of NiPERA, Dr. Anne Fairbrother ofParametrix Inc., Dr. Andrew S. Green of ILZRO, and Dr. Robert Garrett and Dr. G. Mark Richardsonof the Geological Survey of Canada for comments and suggestions for improvements of the report.
References
Axenfeld, F., Munch, J., Pacyna, J.M., Duiser, J.A., and Veldt, C. 1992. Test-Emissionsdatenbasis derSpurenelemente As, Cd, Hg, Pb, Zn und der speziellen Organischen Verbindungen y-HCH (Lindan), HCB,PCB und PAK fur Modellrechnungen in Europa. Umweltforschunsplan des Bundesministers fur UmweltNaturschutz und Reaktorsicherheit, Luftreinhaltung, Forschungsbericht 104 02 588, Dornier GmbH Report,Friedrichshafen, Germany.
Arctic Monitoring and Assessment Programme (AMAP). 1997. AMAP assessment report: Arctic pollutionissues. Arctic Monitoring and Assessment Programme, Oslo, Norway.
Arctic Monitoring and Assessment Programme (AMAP). 1999. Heavy metals. Chapter 7. AMAP assessmentreport: Arctic pollution issues. Arctic Monitoring and Assessment Programme, Oslo, Norway.
Berdowski, J.J.M., Pacyna, J.M., and Veldt, C. 1994. Emissions.In The impact of atmospheric deposition ofnon-acidifying pollutants on the quality of European forest soils and the North Sea.Edited byK.D. vanden Hout, Air and Energy Directorate of the Dutch Ministry of Housing, Spatial Planning and theEnvironment (VROM), The Hague, The Netherlands.
Berdowski, J.J.M., Baas, J., Bloos, J.P.J., Visschedijk, A.J.H., and Zandveld, P.Y.J. 1997. The Europeanemission inventory of heavy metals and persistent organic pollutants. Umweltforschungsplan desBundesministers fur Umwelt, naturschutz und Reaktorsicherheit. Forschungsbericht 104 02 672/03,Apeldoorn, the Netherlands, June.
Boyd, R., Barnes, S.-J., De Caritat, P., Chekustin, V.A., Melezhik, V.A., Reimann, C., and Zientek, M.A.1998. Assessment of heavy metal emissions from the copper–nickel industry on the Kola Peninsula andother parts of Russia. NGU Report 98.138, Geological Survey of Norway, Trondheim, Norway, November.
European Environment Agency (EEA). 1995. Statistical compendium for the Dobris assessment of Europe’senvironment. European Environment Agency (EEA), Copenhagen, Denmark.
Gromov, S.A. 1996. An estimate of lead emissions from road transport at the USSR territory in 1990.InReport and Proceedings of the WMO Workshop on the Assessment of EMEP Activities Concerning HeavyMetals and Persistent Organic Pollutants and Their Further Development. EMEP/ MSC-E report 1/97,Moscow, Russia. pp. 120–124.
Geological Survey of Canada (GSC). 1995. The significance of natural sources of metals in the environment.Prepared bythe Geological Survey of Canada for the UN-ECE LRTAP (Heavy Metals) Convention,Natural Resources Canada, Ottawa, Ont.
ITIT. 1992. Proceedings of the ITIT International Symposium on Emission Inventory and PreventionTechnology for Atmospheric Environment, Tsukuba, Japan.
Jacques, A.P. 1987. Summary of emissions of antimony, arsenic, cadmium, copper, lead, manganese, mercury,and nickel in Canada. Environmental Analysis Branch, Conservation and Protection, Environment Canada,Ottawa, Ont.
Lacerda, L.D. 1997. Global mercury emissions from gold and silver mining. Water, Air, Soil Pollut.97:209–221.
©2001 NRC Canada

Pacyna and Pacyna 295
Norwegian Institute for Air Research (NILU). 1984. Emission sources in the Soviet Union. NILU TR 4/84Report. The Norwegian Institute for Air Research, Kjeller, Norway.
Nriagu, J.O. 1989. A global assessment of natural sources of atmospheric trace metals, Nature,338: 47–49.Nriagu, J.O., and Davidson, C.I. 1986. Toxic metals in the atmosphere. John Wiley and Sons, New York, N.Y.Nriagu, J.O., and Pacyna, J.M. 1988. Quantitative assessment of worldwide contamination of air, water and
soils with trace metals. Nature,333: 134–139.Nriagu, J.O., Blankson, M.L., and Ocran, K. 1996. Childhood lead poisoning in Africa: a growing public
health problem. Sci. Total Environ.181: 93–100.Organisation for Economic Co-operation and Development (OECD). 1997. Environmental data compendium
1995. Organization for Economic Co-operation and Development, Paris, France.Olendrzynski, K., Anderberg, S., Bartnicki, J., Pacyna, J.M., and Stigliani, W. 1996. Atmospheric emissions
and depositions of cadmium, lead and zinc in Europe during the period 1955–1987. Environ. Rev.4:300–320.
Pacyna, J.M. 1984. Estimation of the atmospheric emissions of trace elements from anthropogenic sources inEurope. Atmos. Environ.18: 41–50.
Pacyna, J.M. 1994. Long-range transport, atmospheric dispersion and deposition.In Heavy metals emissions,UN ECE Task Force on Heavy Metals Emissions State-of-the-Art Report, Prague, the Czech Republic.
Pacyna, J.M. 1996. Atmospheric emissions of heavy metals for Europe. Improvements, updates, historical dataand projections. A Report for the International Institute for Applied Systems Analysis (IIASA), Laxenburg,Austria, June.
Pacyna, J.M. 1998. An assessment of the applicability of the critical load concept as a basis for internationalprotocols on emission reductions for heavy metals and persistent organic compounds. Sources, transportand deposition.In Assessment of the applicability for pollution control authorities of the concept “criticalload” of long-range transported micropollutants in relation to aquatic and terrestrial ecosystems. Researchreport no. 32 of the Ministry of Environment, Oslo, Norway. pp. 31–40.
Pacyna, J.M., and Pacyna, E.G. 1999. Atmospheric emissions of anthropogenic lead in Europe: improvements,updates, historical data and projections. Technical Report for GKSS Research Center, Hagan, Norway,June.
Pacyna, J.M., and Pacyna, P.E. 1996. Global emissions of mercury to the atmosphere. Emissions fromanthropogenic sources.Prepared for Report for the Arctic Monitoring and Assessment Programme(AMAP), Oslo, Norway. June.
Pacyna, J.M., Scholtz, M.T., and Li, Y.-F. 1995. Global budget of metal sources. Environ. Rev.2: 145–159.Pirrone, N., Keeler, G.J., and Nriagu, J.O. 1996. Regional differences in worldwide emissions of mercury to
the atmosphere. Atmos. Environ.30: 2981–2987.Porcella, D.B., Chu, P., and Allan, M.A. 1996. Inventory of North American Hg emissions to the atmosphere.
In Global and regional mercury cycles: Sources, fluxes and mass balances.Edited byW. Baeyens,R. Ebinghaus, and O. Vasiliev. NATO ASI Series, Series 2: Environment — Vol. 21, Kluwer AcademicPublishers, Dordrecht, The Netherlands.
Ryaboshapko, A., Ilyin, I., Gusev, A., Berg, T., and Hjellbrekke, A.-G. 1999. Monitoring and modelling oflead, cadmium and mercury transboundary transport in the atmosphere of Europe. EMEP Report 3/99.The UN ECE Co-operative Programme for Monitoring and Evaluation of the Long-range Transmissionof Air Pollutants in Europe (EMEP). Meteorological Synthesizing Centre — East, Moscow and ChemicalCoordinating Centre, Kjeller, Norway.
Skeaff, J.M., and Dubreuil, A.A. 1997. Calculated 1993 emission factors of trace metals for Canadiannon-ferrous smelters. Atmos. Environ.31: 1449–1457.
Tsibulski, V., Yatsenko-Khemlevskaya, M., and Milyaev, V. 1996. Estimation of heavy metal emissions due toorganic fuel combustion in Russia in 1990 and 1993.In Report and Proceedings of the WMO Workshopon the Assessment of EMEP Activities Concerning Heavy Metals and Persistent Organic Pollutants andTheir Further Development. EMEP/MSC-E report 1/97, Moscow, Russia. pp. 115–119.
United Nations (UN). 1997. Statistical Yearbook, United Nations, New York, N.Y.United Nations (UN). 1998. Industrial Commodity Statistics Yearbook 1996. United Nations, New York, N.Y.United Nations Economic Commission for Europe (UN ECE). 1994. Heavy metals emissions, Task Force on
Heavy Metals Emissions State-of-the-Art Report, Prague, The Czech Republic.United Nations Economic Commission for Europe (UN ECE). 1998. Air pollution. The convention on
©2001 NRC Canada
296 Environ. Rev. Vol. 9, 2001
long-range transboundary air pollution. International cooperation in action. The United Nations EconomicCommission for Europe, Geneva, Switzerland.
United Nations Economic Commission for Europe (UN ECE). 1999a. EMEP emission data. EMEP/MSC-WReport 1/99. The UN ECE Co-operative Programme for Monitoring and Evaluation of the Long-rangeTransmission of Air Pollutants in Europe (EMEP). Meteorological Synthesizing Centre–West, Oslo,Norway.
United Nations Economic Commission for Europe (UN ECE). 1999b. Joint EMEP/CORINAIR AtmosphericEmission Inventory Guidebook. The United Nations Economic Commission for Europe, Geneva,Switzerland.
United Nations Environment Programme (UNEP). 1996. Environmental Data Report 1993–1994. UnitedNations Environment Programme, Nairobi, Kenya.
United States Environmental Protection Agency (US EPA). 1993a. Locating and estimating air emissionsfrom sources of mercury and mercury compounds. EPA Rept. 454/R-93–023, United States EnvironmentalProtection Agency, Research Triangle Park, N.C.
United States Environmental Protection Agency (US EPA). 1993b. Locating and estimating air emissionsfrom sources of cadmium and cadmium compounds. EPA Rept. 454/R-93–040, United StatesEnvironmental Protection Agency, Research Triangle Park, N.C.
World Bureau of Metal Statistics (WBMS). 1999. World metal statistics. World Bureau of Metal Statistics,May.
Appendix A. A list of reports with national emission data for tracemetals
1. Austria
Abschatzung der Schwermetallemissionen in Østerreich, Umweltbundesamt, UBE Rept.-95-108,Wien, 1995, and
Winiwarter, W. Emission of Cd. Hg and Pb in Austria in 1985, 1990, and 1995. Austrian ResearchCenters, Seibersdorf, December 10, 1998.
2. Belarus
Kakareka, S., Estimation of lead emissions for Belarus in SNAP – source category. BelarusianNational Academy of Sciences, Institute for Problems of Use of Natural Resources and Ecology,Minsk, December 30, 1998, and
Belarusian Contribution to EMEP,Annual Report, 1996. Belarusian NationalAcademy of Sciences,Meteorological Synthesizing Center – East, Minsk – Moscow, January 1997.
3. Bulgaria
Raykova, S. The Elbe catchment to Pb emission scenarios. Ministry of Environment and Water,Sofia, January 1, 1999, and
Syrakov, D. 1997 Annual Report on Bulgarian Contribution to EMEP. National Institute of Mete-orology and Hydrology, Sofia, January 30, 1998.
4. The Czech Republic
Data reported to the UN ECE Task Force on Heavy Metals,
Machalek, P. Emissions estimates data –HMs in Czech Republic (1990–1995). Czech Hydrom-eteorological Institute, Emission Inventory Section, Division of Air Quality Protection, Prague,January 28, 1999, and
CHI:Air Pollution in the Czech Republic in 1997. The Czech Hydrometeorological Institute (CHI),Air Quality Protection Department, Prague, 1998.
©2001 NRC Canada

Pacyna and Pacyna 297
5. Denmark
Data reported to the UN ECE Task Force on Heavy Metals, and to the PARCOM/ATMOS program,and
Winther, M. The Danish Pb air emissions from the Danish CORINAIR 1997 inventory. Ministryof Environment and Energy, National Environmental Research Institute. Department of PolicyAnalysis, Copenhagen, January 12, 1999 and January 28, 1999.
6. Finland
Data reported to the UN ECE Task Force on Heavy Metals, and
Mukherjee, A.B. Emissions of Pb in Finland. University of Helsinki, Department of Limnologyand Environmental Protection, Helsinki, December 1998.
Mukherjee, A.B. The occurrence of nickel in the Finnish environment. University of Helsinki,Department of Limnology and Environmental protection, Helsinki, 1998.
7. France
Fontelle, J.P. Heavy Metals emissions based on the 11 CORINAIR/MNECE/EMEP groups (takecare of version SNAP 1997). CITEPA (Centre Interprofessionnel Technique d’ÉTUDES de laPollution Atmospherique), Paris, February 2, 1999.
8. Germany
Schwermetallemissionen in die Atmosphare, TUV Rheinland, Koln, EP 10/93, 1993, and
Jockel, W., Hartje, J. Report on the Development of the Emissions of Heavy Metals in Germany1985–1995. Umweltforschungsplan Des Bundesministers für UMWELT, Naturschutz und Reak-torsicherheit, Köln, July 1997, letter of Jockel, W. Environmental Protection/Air Pollution Control,Köln, December 2, 1998.
9. Hungary
Kozak, K. Emissions of Pb in Hungary, 1980–1997. Ministry of Environment Republic of Hungary,Department of Environmental Development, Safety and Waste Management, Budapest, January 8,1999.
10. Italy
Costa, P. Emission of Pb. CNR-Istituto Sull’Inquinamento Atmosferico, IIA-CNR, Universita dellaCalabria, Rende, December 3, 1998.
11. Lithuania
Semlstoriute, D. Pb emissions in Lithuania. Ministry of the Environment, Environmental QualityDepartment, Air Division, Vilnius, December 16, 1998, and
Brazauskas, R. Pb emissions in Lithuania. Ministry of the Environment, Air Division of the Envi-ronmental Quality Department, Vilnius, January 19, 1999.
12. The Netherlands
Emission inventory in the Netherlands. Emissions to air and water in 1992.The Ministry of Housing,Spatial Planning and the Environment, Directorate-General for the Environment, Gravenhage, Publ.No. 22, December 1994, and
Berdowski, J.J.M. et al. Emissions to air for the Inventories of CORINAIR, EMEP and OSPARCOM1990–1996. Ministry of Housing, Spatial Planning and the Environment, January 1998.
©2001 NRC Canada

298 Environ. Rev. Vol. 9, 2001
13. Norway
Miljøgifter i Norge. Statensforurensningstilsyn (SFT), Rept. 92/103, Oslo, 1993,
14. Poland
Report on Heavy Metals Emissions in Poland for 1990. The Institute for Ecology of IndustrialAreas, Katowice, November 1993, and
Mitosek, G. National annual total antropogenic emissions of heavy metals 1990–1995. Institute ofEnvironmental Protection, Air Protection Division, Warsaw, October 1997, and
Hlawiczka, S. Report on heavy metals emission in Poland for the year 1996. Institute for Ecologyof Industrial Areas, Katowice, March 1998.
15. Slovenia
Rode, B. Heavy Metals emission estimations of Cd, Hg and Pb based on Technical Paper to theOSPARCOM-HELCOM UNECE Emission Inventory, 1990–1996. Ministry of the Environmentand Physical Planning Hydrometeorological Institute of Slovenia, Ljubljane, December 29, 1998.
16. Slovakia
Heavy Metals in Slovakia. Ministerstvo Zivotneho Prostredia Slovenskej Republiky, Bratislava,December 1994.
17. Sweden
Heavy Metal Emissions to Air in Sweden in 1992. Swedish Environmental Protection Agency,Industrial Department, Stockholm, December 1993.
18. Switzerland
Vom Menschen Verursachte Schadstoff-Emissionen in der Schweitz 1950–2010. Bundesamt furUmweltschutz, Schriftenreiche Umweltschutz No. 76, Bern, and
Saxer, H.P. “Schriftenreihe Umwelt Nr. 256” of BUWAL, Emissions of Lead in Switzerland. 1950–2010. Swiss Agency for the Environment, Forests and Landscape, Section Biotechnology and Fluxof Substances, Berne, January 5, 1999.
19. United Kingdom
The U.K. Atmospheric Emissions of Metals and Halides 1970–1991. National Atmospheric Emis-sions Inventory. Department of Environment, London, September 1993.
20. United States
National Air Pollutant Emission Trends 1900–1995. The U.S. Environmental Protection Agency,US EPA-454/R-96-007 Report, Research Triangle Park, N.C., 1996.
©2001 NRC Canada